2012 - Canadian Cancer Society
69
CANADIAN STATISTICS 2 b
Transcript of 2012 - Canadian Cancer Society
CANADIAN������STATISTICS���2
��������b�� ������� ����������������������� ���������������������������� ������������������������������������ ����� ��������
Members of the Steering Committee on Cancer StatisticsHeather Chappell, MSc, CHE (Co-Chair)
Cancer Control Policy, Canadian Cancer Society, Toronto, Ontario
Les Mery, MSc (Co-Chair)Centre for Chronic Disease Prevention and Control, Public Health Agency of Canada,Ottawa, Ontario
Prithwish De, PhDCancer Control Policy, Canadian Cancer Society, Toronto, Ontario
Dagny Dryer, MD, FRCPCPEI Cancer Treatment Centre and Cancer Registry, Charlottetown, Prince Edward Island
Larry Ellison, MScHealth Statistics Division, Statistics Canada, Ottawa, Ontario
Maureen MacIntyre, MHSASurveillance and Epidemiology Unit, Cancer Care Nova Scotia, Halifax, Nova Scotia
Loraine Marrett, PhDPrevention and Cancer Control, Cancer Care Ontario, Toronto, Ontario
Hannah K. Weir, PhDDivision of Cancer Prevention and Control, Centers for Disease Control and Prevention,Atlanta, Georgia
Analytic and statistical support
Robert Semenciw, MScCentre for Chronic Disease Prevention and Control, Public Health Agency of Canada,Ottawa, Ontario
Lin Xie, MSc (Statistics), MSc (MIS)Centre for Chronic Disease Prevention and Control, Public Health Agency of Canada,Ottawa, Ontario
Citation: Material appearing in this publication may be reproduced or copied withoutpermission; however, the following citation must be used to indicate the source: CanadianCancer Society’s Steering Committee on Cancer Statistics. Canadian Cancer Statistics 2012.Toronto, ON: Canadian Cancer Society; 2012.
May 2012ISSN 0835-2976
The development of this publication over the years has benefited considerably from thecomments and suggestions of readers. The Steering Committee appreciates and welcomes suchcomments. To be notified about next year’s publication or to offer ideas on how the publicationcan be improved, please complete the Evaluation form or e-mail [email protected].
Cette publication est disponible en Français.
1. Incidence and mortality by cancer type
� An estimated 186,400 new cases of cancer (excluding 81,300 non-melanoma skincancers) and 75,700 deaths from cancer will occur in Canada in 2012.
� Of the newly diagnosed cases, more than one-half will be lung, colorectal, prostateand breast cancers.
� Over one-quarter (27%) of all cancer deaths are attributed to lung cancer.
� Colorectal cancer has a significant impact on mortality for men and womencombined, with an estimated 9,200 deaths (12% of all cancer deaths).
2. Incidence and mortality by geographic region
� Generally, both incidence and mortality rates are higher in Atlantic Canada andQuebec. They are lowest in British Columbia.
� In both men and women, lung cancer incidence rates are highest in Quebec andlowest in British Columbia.
� The highest colorectal cancer incidence rates among men and women occur inNewfoundland and Labrador. For women, high rates also occur in Prince EdwardIsland and Nova Scotia. The lowest rates for both sexes are in British Columbia.
� The prostate cancer mortality rate is highest in Saskatchewan.
� Little variation is seen in breast cancer incidence and mortality rates across Canada.
3. Incidence and mortality by age and sex
� Age is a key factor in cancer burden, with 69% of new cases and 62% of cancerdeaths occurring among those 50 to 79 years of age.
� Incidence and mortality rates for males surpass those for females around age 55.
� Mortality is declining for males in most age groups and for females under 70.
4. Time trends in incidence and mortality
� Increases in the number of new cancer cases are due mainly to a growing and agingpopulation.
� Between 1998 and 2007 for males and between 2002 and 2007 for females, thyroidcancer incidence rates rose an average of almost 7% per year. Liver cancer ratesrose nearly 4% per year for males and more than 2% per year for females between1998 and 2007. Kidney cancer rates rose nearly 3% per year for males since 2003.
� Between 1998 and 2007, incidence rates declined, on average, by at least 2% peryear for stomach cancer in males and for larynx cancer in both sexes.
Canadian Cancer Society: Canadian Cancer Statistics 2012 1
HIGHLIGHTS

� Between 2001 and 2007 for males and between 1998 and 2007 for females, overallmortality rates declined significantly. The rates declined, on average, by at least 2%per year for the following cancers:
� prostate cancer (since 2001), lung cancer (since 1998), larynx (since 2001) andcolorectal cancer (since 2003) in males
� breast and cervical cancers (since 1998) in females
� stomach cancer (since 1998) and non-Hodgkin lymphoma (since 2000) in bothsexes
� Between 1998 and 2007, the liver cancer mortality rate increased more than 2% peryear in males.
2 Canadian Cancer Society: Canadian Cancer Statistics 2012
HIGHLIGHTS
Canadian Cancer Statistics is part of an annual series that began in 1987 and hasbeen developed by members of the Steering Committee on Cancer Statistics,
which is supported by the Canadian Cancer Society. The Steering Committee isresponsible for developing content, reviewing statistical information, interpreting dataand writing the text. The Steering Committee includes individuals from the CanadianCancer Society, the Public Health Agency of Canada (PHAC), Statistics Canada, theCanadian Council of Cancer Registries, US Centers for Disease Control andPrevention as well as researchers based in universities and provincial or territorialcancer agencies.
Purpose and intended audiencesThe aim of this annual publication is to provide health professionals, researchers andpolicy-makers with detailed information regarding incidence, mortality and othermeasures of cancer burden for the most common types of cancer, presented by age,sex, time period and province or territory. These data can help stimulate new researchas well as assist decision-making and priority-setting at the community, provincial/territorial and national levels. Educators, the media and members of the public whohave an interest in cancer may also find value in this report.
FormatThis publication has recently undergone an evaluation, and we extend our thanks to allour readers who participated in the evaluation process.
In 2013, we will launch a revised version of the publication based on the feedback wereceived through the evaluation and on current testing of a possible future format.To make this process possible, the 2012 edition has been shortened so that we maydedicate our resources to improving future editions. The 2012 publication thereforedoes not include the sections on five-year relative survival, prevalence, probability ofdeveloping or dying from cancer, cancer in children and youth, or a special topic.Similarly, we will not produce a printed (hard copy) edition for 2012. The publicationwill continue to be available at no charge through the Canadian Cancer Society’swebsite at www.cancer.ca/statistics.
Data sources (see Appendix II for detailed information)The Canadian Cancer Registry (CCR), National Cancer Incidence Reporting System(NCIRS), Canadian Vital Statistics – Death Database (CVS: D) and populationcensuses and forecasts are the main sources of data for this publication.
� Provincial and territorial cancer registries collect clinical and demographic data onnewly diagnosed cancer cases for people residing in the province or territory. Thesedata are reported annually to Statistics Canada and added to the CCR.
� Provincial and territorial registrars of vital statistics collect demographic and causeof death information for people residing in the province or territory at the time ofdeath. These data are reported annually to Statistics Canada and added to the CVS: D.
� Cancers included in this publication are defined according to the groupings listed inTable A1, unless otherwise noted.
� The following types of tumours are not included:
� non-melanoma skin cancers (basal and squamous): Most provincial andterritorial cancer registries do not collect non-melanoma skin cancer incidence
Canadian Cancer Society: Canadian Cancer Statistics 2012 3
ABOUT THIS PUBLICATION
data. Canada-wide non-melanoma skin cancer estimates are based on data fromthree provinces and are shown only in Tables 1.1 and 1.2.
� benign tumours and carcinomas in situ: The exception is in situ carcinomas ofthe bladder, which are included for provinces and territories other than Ontario.
Actual and estimated data (see Appendixes I and II for detailedinformation)� The information provided in this publication includes both actual and estimated data.
� Actual cancer incidence data used in this publication cover the period of 1983 to2009 (except for Quebec, for which data in the CCR were available to 2007 in timefor this publication).
� Actual mortality data used in this publication cover the period of 1983 to 2007 forall provinces and territories. However, at press time, data for 2008 becameavailable and can be obtained through Statistics Canada (see Appendix I).
� Incidence data for 2010 to 2012 and mortality data for 2008 to 2012 are estimated(see Appendix II).
Review and analysis� The Chronic Disease Surveillance and Monitoring Division of the Centre for
Chronic Disease Prevention and Control (CCDPC), part of the Public HealthAgency of Canada (PHAC), conducted the data analysis. The analysts weresupported by Ms. Brenda Branchard, who updated the tables and figures.
� Provincial and territorial cancer registries were consulted regarding the cancerincidence and mortality estimates for their own jurisdictions. The results of thisconsultation are noted in Tables A3 and A4.
� The French version of this publication was reviewed by Rabia Louchini of theMinistère de la Santé et Services sociaux and Jean-Marc Daigle of the Institutnational de santé publique du Québec.
Special topicFor a complete list of previously published special topics, see Appendix III. Specialtopics (1988–2011) are available online at www.cancer.ca/statistics or can be obtainedin hard copy by e-mailing [email protected].
Production and distributionThe Canadian Cancer Society supports the production of this publication withcharitable funds. Ms. Monika Dixon coordinated the production process and providedadministrative support from the initial planning through to distribution.
How to access the contents of this publicationAll figures from this publication and some additional tables and figures are availableon the Canadian Cancer Society’s website at www.cancer.ca/statistics. This materialmay be used without permission. Please refer to the front of this publication for propercitation information.
For additional resources related to cancer surveillance in Canada, please refer to thesection entitled For further information.
4 Canadian Cancer Society: Canadian Cancer Statistics 2012
ABOUT THIS PUBLICATION
Page
Highlights 1
About this publication 3
Table of contents 5
1. Incidence and mortality by cancer type 7
Table 1.1: Estimated New Cases and Age-Standardized Incidence Rates forCancers by Sex, Canada, 2012 8
Table 1.2: Estimated Deaths and Age-Standardized Mortality Rates forCancers by Sex, Canada, 2012 9
Figure 1.1: Percentage Distribution of Estimated New Cases and Deathsfor Selected Cancers, Males, Canada, 2012 10
Figure 1.2: Percentage Distribution of Estimated New Cases and Deathsfor Selected Cancers, Females, Canada, 2012 11
2. Incidence and mortality by geographic region 12
Table 2.1: Estimated Population, New Cases and Deaths for All Cancersby Sex and Geographic Region, Canada, 2012 15
Table 2.2: Estimated New Cases for Selected Cancers by Sex andProvince, Canada, 2012 16
Table 2.3: Estimated Age-Standardized Incidence Rates for SelectedCancers by Sex and Province, Canada, 2012 17
Table 2.4: Estimated Deaths for Selected Cancers by Sex and Province,Canada, 2012 18
Table 2.5: Estimated Age-Standardized Mortality Rates for SelectedCancers by Sex and Province, Canada, 2012 19
3. Incidence and mortality by age and sex 20
Table 3.1: Estimated New Cases and Deaths for All Cancers by Age Groupand Sex, Canada, 2012 21
Table 3.2: Estimated New Cases and Deaths for the Most Common Cancersby Age Group and Sex, Canada, 2012 22
Figure 3.1: Age-Specific Incidence and Mortality Rates for AllCancers by Sex, Canada, 2007 23
Figure 3.2: Age-Standardized Incidence and Mortality Rates for All Cancersby Age Group, Canada, 1983–2012 24
4. Time trends in incidence and mortality 26
Figure 4.1: New Cases and Age-Standardized Incidence Rates (ASIRs)for All Cancers, Canada, 1983–2012 32
Figure 4.2: Deaths and Age-Standardized Mortality Rates (ASMRs) forAll Cancers, Canada, 1983–2012 33
Canadian Cancer Society: Canadian Cancer Statistics 2012 5
TABLE OF CONTENTS
Figure 4.3: Trends in New Cases and Deaths for All Cancers and Ages,Attributed to Cancer Rate, Population Growth and Aging Population, Males,Canada, 1983–2012 34
Figure 4.4: Trends in New Cases and Deaths for All Cancers and Ages,Attributed to Cancer Rate, Population Growth and Aging Population, Females,Canada, 1983–2012 35
Figure 4.5: Age-Standardized Incidence Rates (ASIRs) for Selected Cancers,Males, Canada, 1983–2012 36
Figure 4.6: Age-Standardized Mortality Rates (ASMRs) for Selected Cancers,Males, Canada, 1983–2012 37
Figure 4.7: Age-Standardized Incidence Rates (ASIRs) for Selected Cancers,Females, Canada, 1983–2012 38
Figure 4.8: Age-Standardized Mortality Rates (ASMRs) for Selected Cancers,Females, Canada, 1983–2012 39
Table 4.1: Age-Standardized Incidence Rates for Selected Cancers, Males,Canada, 1983–2012 40
Table 4.2: Age-Standardized Mortality Rates for Selected Cancers, Males,Canada, 1983–2012 41
Table 4.3: Age-Standardized Incidence Rates for Selected Cancers, Females,Canada, 1983–2012 42
Table 4.4: Age-Standardized Mortality Rates for Selected Cancers, Females,Canada, 1983–2012 43
Table 4.5: Annual Percent Change (APC) in Age-Standardized Incidenceand Mortality Rates for Selected Cancers, Canada, 1998–2007 44
Appendix I: Actual data for new cases and deaths 45
Appendix II: Data sources and methods 46
Table A1: Cancer Definitions 53
Table A2: Recent Cancer Definition Changes 55
Table A3: Use of Five-Year Average Method for Incidence Projectionby Cancer Type and Province, 2012 56
Table A4: Use of Five-Year Average Method for Mortality Projectionby Cancer Type and Province, 2012 57
Appendix III: Previous special topics 58
Glossary 59
References 61
For further information 63
6 Canadian Cancer Society: Canadian Cancer Statistics 2012
TABLE OF CONTENTS
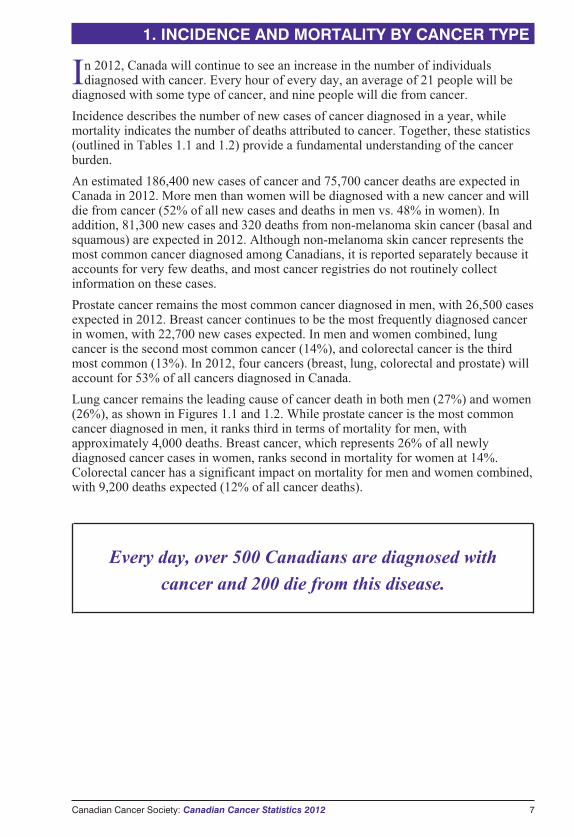
In 2012, Canada will continue to see an increase in the number of individualsdiagnosed with cancer. Every hour of every day, an average of 21 people will be
diagnosed with some type of cancer, and nine people will die from cancer.
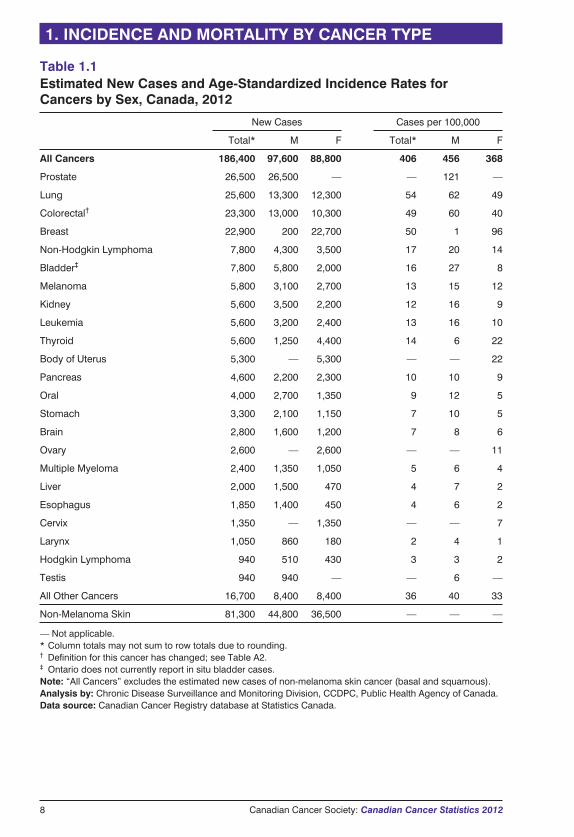
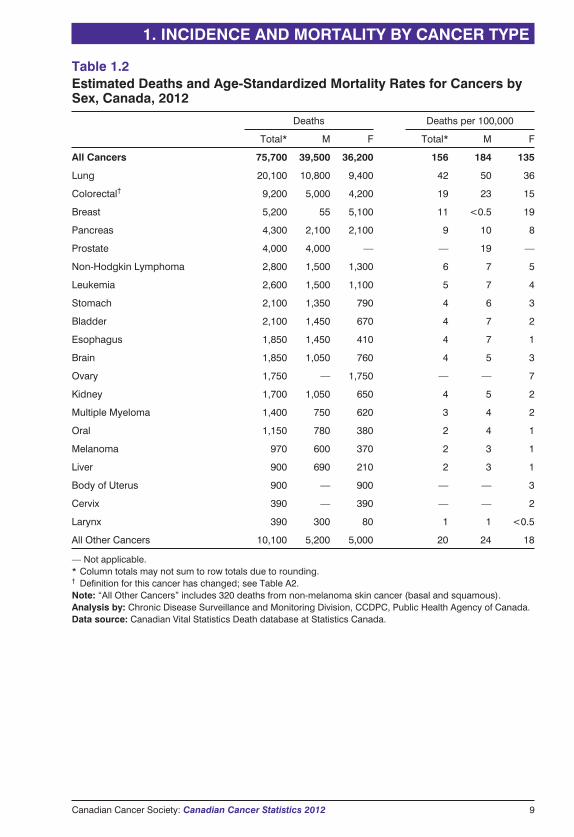
Incidence describes the number of new cases of cancer diagnosed in a year, whilemortality indicates the number of deaths attributed to cancer. Together, these statistics(outlined in Tables 1.1 and 1.2) provide a fundamental understanding of the cancerburden.
An estimated 186,400 new cases of cancer and 75,700 cancer deaths are expected inCanada in 2012. More men than women will be diagnosed with a new cancer and willdie from cancer (52% of all new cases and deaths in men vs. 48% in women). Inaddition, 81,300 new cases and 320 deaths from non-melanoma skin cancer (basal andsquamous) are expected in 2012. Although non-melanoma skin cancer represents themost common cancer diagnosed among Canadians, it is reported separately because itaccounts for very few deaths, and most cancer registries do not routinely collectinformation on these cases.
Prostate cancer remains the most common cancer diagnosed in men, with 26,500 casesexpected in 2012. Breast cancer continues to be the most frequently diagnosed cancerin women, with 22,700 new cases expected. In men and women combined, lungcancer is the second most common cancer (14%), and colorectal cancer is the thirdmost common (13%). In 2012, four cancers (breast, lung, colorectal and prostate) willaccount for 53% of all cancers diagnosed in Canada.
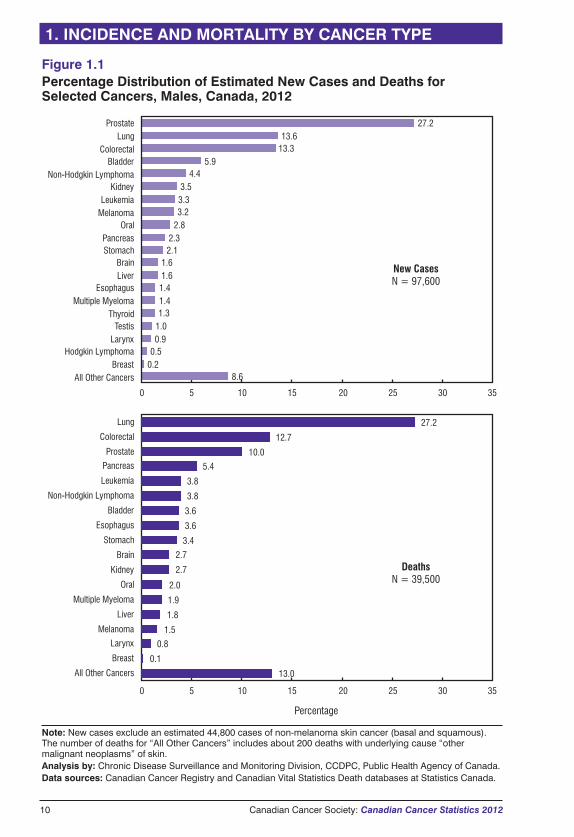
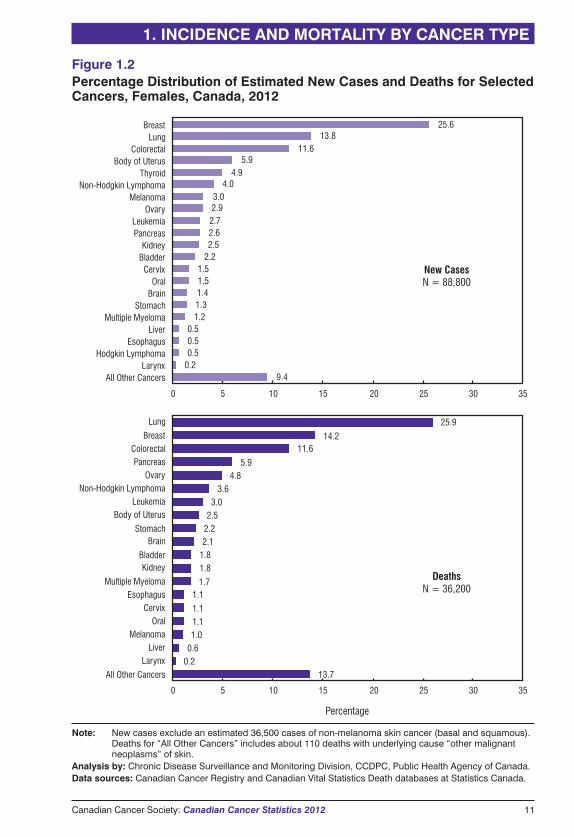
Lung cancer remains the leading cause of cancer death in both men (27%) and women(26%), as shown in Figures 1.1 and 1.2. While prostate cancer is the most commoncancer diagnosed in men, it ranks third in terms of mortality for men, withapproximately 4,000 deaths. Breast cancer, which represents 26% of all newlydiagnosed cancer cases in women, ranks second in mortality for women at 14%.Colorectal cancer has a significant impact on mortality for men and women combined,with 9,200 deaths expected (12% of all cancer deaths).
Every day, over 500 Canadians are diagnosed with
cancer and 200 die from this disease.
1. INCIDENCE AND MORTALITY BY CANCER TYPE
Canadian Cancer Society: Canadian Cancer Statistics 2012 7
8 Canadian Cancer Society: Canadian Cancer Statistics 2012
1. INCIDENCE AND MORTALITY BY CANCER TYPE
Table 1.1Estimated New Cases and Age-Standardized Incidence Rates forCancers by Sex, Canada, 2012
New Cases Cases per 100,000
Total* M F Total* M F
All Cancers 186,400 97,600 88,800 406 456 368
Prostate 26,500 26,500 — — 121 —
Lung 25,600 13,300 12,300 54 62 49
Colorectal† 23,300 13,000 10,300 49 60 40
Breast 22,900 200 22,700 50 1 96
Non-Hodgkin Lymphoma 7,800 4,300 3,500 17 20 14
Bladder‡ 7,800 5,800 2,000 16 27 8
Melanoma 5,800 3,100 2,700 13 15 12
Kidney 5,600 3,500 2,200 12 16 9
Leukemia 5,600 3,200 2,400 13 16 10
Thyroid 5,600 1,250 4,400 14 6 22
Body of Uterus 5,300 — 5,300 — — 22
Pancreas 4,600 2,200 2,300 10 10 9
Oral 4,000 2,700 1,350 9 12 5
Stomach 3,300 2,100 1,150 7 10 5
Brain 2,800 1,600 1,200 7 8 6
Ovary 2,600 — 2,600 — — 11
Multiple Myeloma 2,400 1,350 1,050 5 6 4
Liver 2,000 1,500 470 4 7 2
Esophagus 1,850 1,400 450 4 6 2
Cervix 1,350 — 1,350 — — 7
Larynx 1,050 860 180 2 4 1
Hodgkin Lymphoma 940 510 430 3 3 2
Testis 940 940 — — 6 —
All Other Cancers 16,700 8,400 8,400 36 40 33
Non-Melanoma Skin 81,300 44,800 36,500 — — —
— Not applicable.* Column totals may not sum to row totals due to rounding.† Definition for this cancer has changed; see Table A2.‡ Ontario does not currently report in situ bladder cases.Note: “All Cancers” excludes the estimated new cases of non-melanoma skin cancer (basal and squamous).Analysis by: Chronic Disease Surveillance and Monitoring Division, CCDPC, Public Health Agency of Canada.Data source: Canadian Cancer Registry database at Statistics Canada.
Canadian Cancer Society: Canadian Cancer Statistics 2012 9
1. INCIDENCE AND MORTALITY BY CANCER TYPE
Table 1.2Estimated Deaths and Age-Standardized Mortality Rates for Cancers bySex, Canada, 2012
Deaths Deaths per 100,000
Total* M F Total* M F
All Cancers 75,700 39,500 36,200 156 184 135
Lung 20,100 10,800 9,400 42 50 36
Colorectal† 9,200 5,000 4,200 19 23 15
Breast 5,200 55 5,100 11 <0.5 19
Pancreas 4,300 2,100 2,100 9 10 8
Prostate 4,000 4,000 — — 19 —
Non-Hodgkin Lymphoma 2,800 1,500 1,300 6 7 5
Leukemia 2,600 1,500 1,100 5 7 4
Stomach 2,100 1,350 790 4 6 3
Bladder 2,100 1,450 670 4 7 2
Esophagus 1,850 1,450 410 4 7 1
Brain 1,850 1,050 760 4 5 3
Ovary 1,750 — 1,750 — — 7
Kidney 1,700 1,050 650 4 5 2
Multiple Myeloma 1,400 750 620 3 4 2
Oral 1,150 780 380 2 4 1
Melanoma 970 600 370 2 3 1
Liver 900 690 210 2 3 1
Body of Uterus 900 — 900 — — 3
Cervix 390 — 390 — — 2
Larynx 390 300 80 1 1 <0.5
All Other Cancers 10,100 5,200 5,000 20 24 18
— Not applicable.* Column totals may not sum to row totals due to rounding.† Definition for this cancer has changed; see Table A2.Note: “All Other Cancers” includes 320 deaths from non-melanoma skin cancer (basal and squamous).Analysis by: Chronic Disease Surveillance and Monitoring Division, CCDPC, Public Health Agency of Canada.Data source: Canadian Vital Statistics Death database at Statistics Canada.
10 Canadian Cancer Society: Canadian Cancer Statistics 2012
1. INCIDENCE AND MORTALITY BY CANCER TYPE
0 5 10 15 20 25 30 35
Percentage
0 5 10 15 20 25 30 35
8.60.20.50.91.01.31.41.41.61.6
2.12.3
2.83.23.33.5
4.45.9
13.313.6
27.2
All Other CancersBreast
Hodgkin LymphomaLarynxTestis
ThyroidMultiple Myeloma
EsophagusLiverBrain
StomachPancreas
OralMelanomaLeukemia
KidneyNon-Hodgkin Lymphoma
BladderColorectal
LungProstate
New CasesN = 97,600
13.0
0.1
0.8
1.5
1.8
1.9
2.0
2.7
2.7
3.4
3.6
3.6
3.8
3.8
5.4
10.0
12.7
27.2
DeathsN = 39,500
All Other Cancers
Breast
Larynx
Melanoma
Liver
Multiple Myeloma
Oral
Kidney
Brain
Stomach
Esophagus
Bladder
Non-Hodgkin Lymphoma
Leukemia
Pancreas
Prostate
Colorectal
Lung
Figure 1.1Percentage Distribution of Estimated New Cases and Deaths forSelected Cancers, Males, Canada, 2012
Note: New cases exclude an estimated 44,800 cases of non-melanoma skin cancer (basal and squamous).The number of deaths for “All Other Cancers” includes about 200 deaths with underlying cause “othermalignant neoplasms” of skin.Analysis by: Chronic Disease Surveillance and Monitoring Division, CCDPC, Public Health Agency of Canada.Data sources: Canadian Cancer Registry and Canadian Vital Statistics Death databases at Statistics Canada.
Canadian Cancer Society: Canadian Cancer Statistics 2012 11
1. INCIDENCE AND MORTALITY BY CANCER TYPE
New CasesN = 88,800
0 5 10 15 20 25 30 35
0 5 10 15 20 25 30 35
Percentage
9.40.20.50.50.5
1.21.31.41.51.5
2.22.52.62.72.93.0
4.04.9
5.911.6
13.825.6
All Other CancersLarynx
Hodgkin LymphomaEsophagus
LiverMultiple Myeloma
StomachBrainOral
CervixBladderKidney
PancreasLeukemia
OvaryMelanoma
Non-Hodgkin LymphomaThyroid
Body of UterusColorectal
LungBreast
13.70.20.61.01.11.1
1.11.7
1.81.82.12.22.53.0
3.64.8
5.9
11.614.2
25.9
DeathsN = 36,200
All Other Cancers
LarynxLiver
MelanomaOral
CervixEsophagus
Multiple Myeloma
KidneyBladder
BrainStomach
Body of UterusLeukemia
Non-Hodgkin LymphomaOvary
PancreasColorectal
Breast
Lung
Figure 1.2Percentage Distribution of Estimated New Cases and Deaths for SelectedCancers, Females, Canada, 2012
Note: New cases exclude an estimated 36,500 cases of non-melanoma skin cancer (basal and squamous).Deaths for “All Other Cancers” includes about 110 deaths with underlying cause “other malignantneoplasms” of skin.
Analysis by: Chronic Disease Surveillance and Monitoring Division, CCDPC, Public Health Agency of Canada.Data sources: Canadian Cancer Registry and Canadian Vital Statistics Death databases at Statistics Canada.
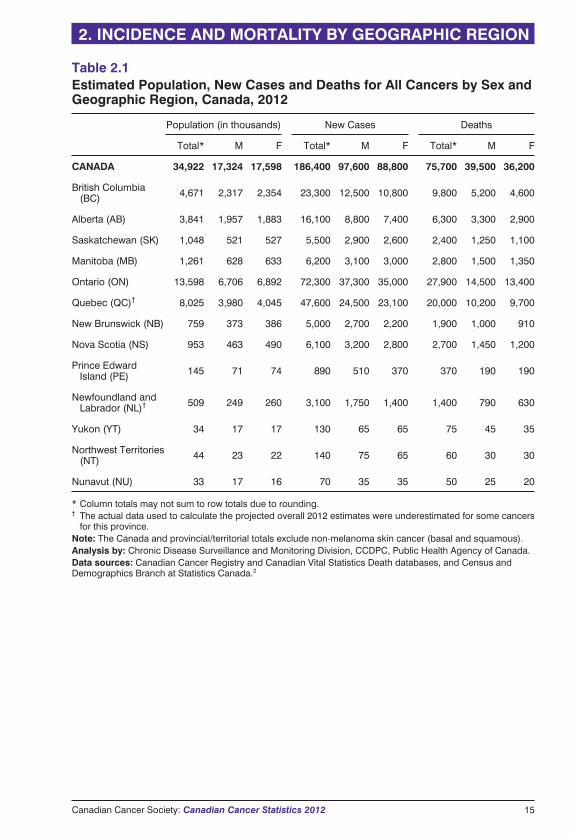
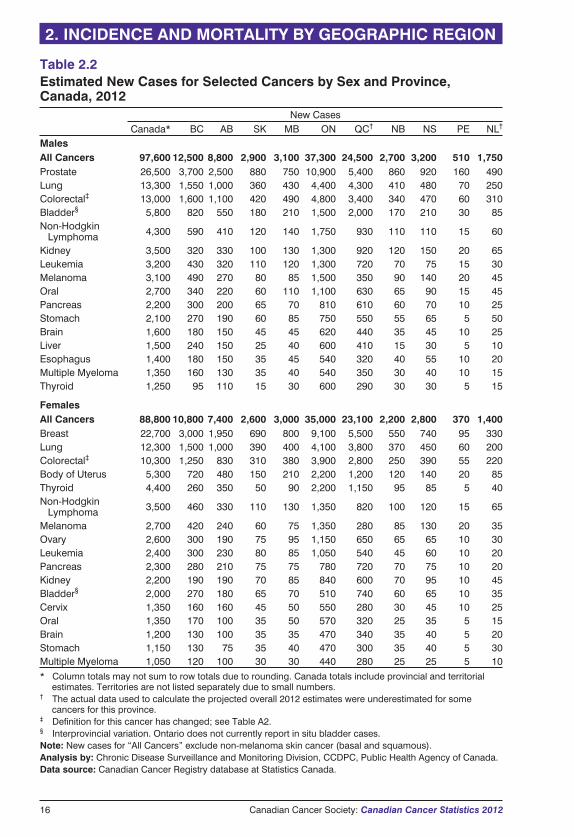
Table 2.1 presents population projections and estimates of new cases and deaths forall cancers combined, by sex and province/territory for 2012. Tables 2.2 and 2.3
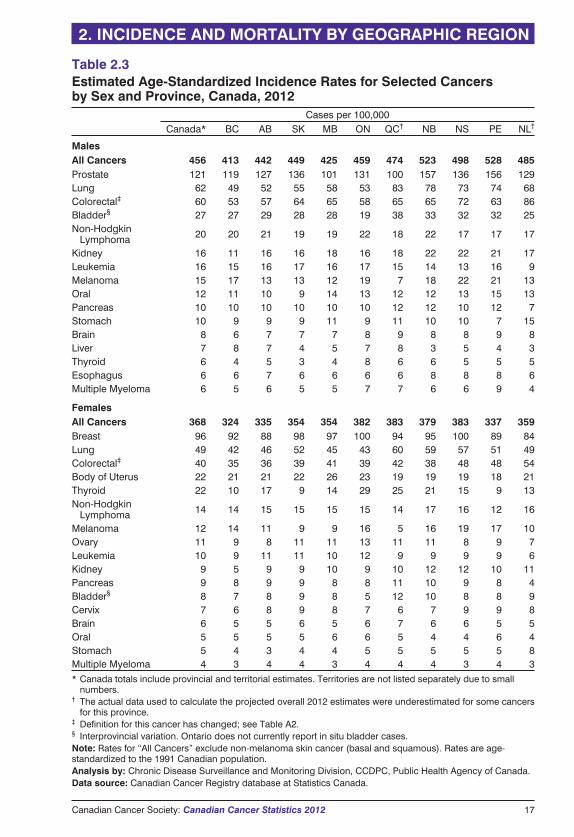
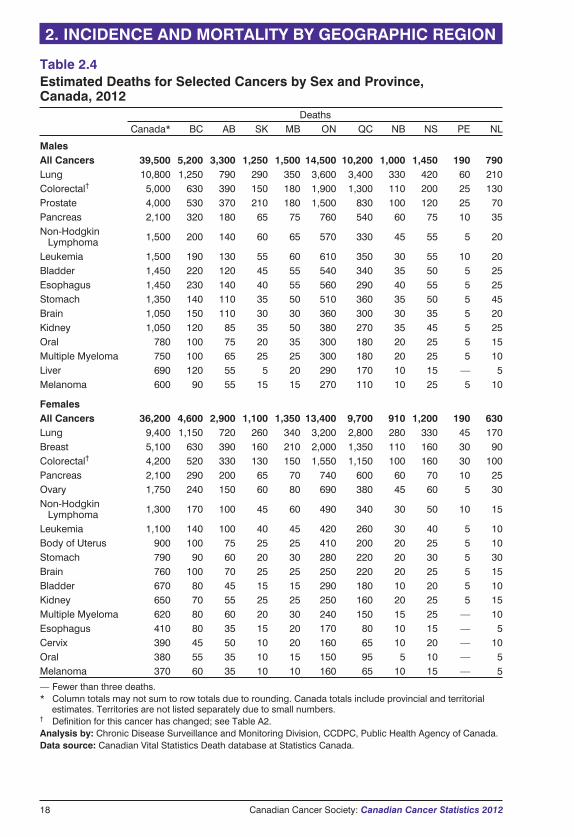
present estimates of the number of new cases and the age-standardized incidence ratesfor selected cancers by sex and province for 2012. The corresponding estimates of thenumber of cancer deaths and the age-standardized mortality rates are presented inTables 2.4 and 2.5. Appendix I provides references to the most recent actual numbersand rates.
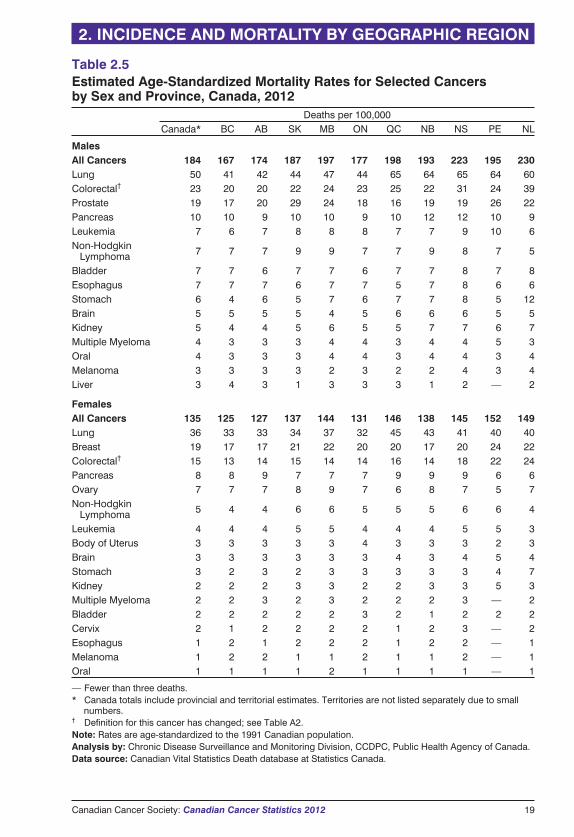
Since the risk of developing cancer increases with age, age standardization (also calledage adjustment) is used to adjust for differences in the age profiles of differentpopulations. This allows for better comparison among populations that are quitedifferent. Thus, cancer rates among the provinces and territories are compared usingage-standardized rates. The calculation of age-standardized rates, using the 1991Canadian population as the standard, is described in the Glossary and in more detail inAppendix II.
IncidenceThe estimated incidence rates for all cancers combined in males is highest in theAtlantic Provinces, Quebec and Ontario (Table 2.3). For females, highest rates occurin Quebec, Nova Scotia, Ontario and New Brunswick. Lowest rates for males andfemales are in British Columbia. It should be noted that rates in Newfoundland andLabrador are considered to be lower than actual figures due to missing data (seeAppendix II).
Prostate cancer incidence rates continue to show large provincial differences.Variation in the use of prostate-specific antigen (PSA) testing is generally believed toaccount for the difference in provincial prostate cancer incidence rates.
In both men and women, lung cancer incidence rates are highest in Quebec and lowestin British Columbia.
The highest colorectal cancer incidence rates among men and women are inNewfoundland and Labrador. For women, high rates also occur in Prince EdwardIsland and Nova Scotia. The lowest rates for both sexes are in British Columbia.
Female breast cancer incidence rates appear to be fairly consistent across the country,with no discernible geographic pattern.
MortalityFor males, the estimated mortality rates for all cancers combined continue to be higherin Atlantic Canada, Quebec and Manitoba, with lower rates in Western Canada(Table 2.5). The pattern is similar for females, although overall differences across thecountry are smaller than for males.
Among males, the lung cancer mortality rate is highest in Quebec and Nova Scotiaand lowest in British Columbia. Among females, the lung cancer mortality rate ishighest in Quebec and lowest in Ontario.
Colorectal cancer mortality rates for both sexes are highest in Newfoundland andLabrador, almost twice that in British Columbia.
The mortality rate for prostate cancer continues to be highest in Saskatchewan.
Female breast cancer mortality rates appear to be fairly consistent across the country,with no discernible geographic pattern.
12 Canadian Cancer Society: Canadian Cancer Statistics 2012
2. INCIDENCE AND MORTALITY BY GEOGRAPHIC REGION
InterpretationThe population-based provincial/territorial and national cancer registries serve asimportant resources that enable geographic comparisons of cancer trends. Interpretationof geographic differences should, however, be approached with caution since theremay be a number of explanations for the variation. True differences in incidence ormortality rates among provinces and territories may be due to the variation in any oneof several factors, including the following:
� the prevalence of cancer risk factors (e.g., higher historic smoking rates in Quebecand Atlantic Canada as the likely cause of higher rates of lung cancer)
� the early detection of cancer due to different rates of participation in formalscreening programs (e.g., mammographic screening for breast cancer) or otherscreening procedures (e.g., PSA testing for prostate cancer)
� the availability of diagnostic services
� access to and quality of health services, most notably treatment
� cancer registry practices
However, even if the above situations apply, it cannot be assumed that they are thecause of the variation in cancer rates across Canada. Such a determination can bemade only after conducting more detailed studies involving individual people. It isalso important to note that for many cancers the interval between exposure to a riskfactor and the occurrence of the disease is quite long, making it difficult to collectdetailed information on the prevalence of past exposure to risk factors. Where truedifferences in cancer risk exist and can be causally attributed to modifiable riskfactors, these findings can be used in planning cancer control programs that aim toreduce the burden of cancer.
When interpreting interprovincial variation, it should be kept in mind that the numberof cases and the annual rates in a given province or territory may be unreliable andvary considerably from year to year when a cancer is rare or the population is small.
While the completeness of registration of new cancer cases is generally very goodacross the country, there are exceptions. Death certificate information has not beenavailable for registry purposes in Newfoundland and Labrador until very recently andwas not available for this publication. This has led to an underestimation of the actualdata and therefore the projected number of newly diagnosed cases, mainly amongthose cancers with a poor prognosis, such as lung and pancreas (see Appendix II). Thedegree to which death certificate information is checked against hospital records alsovaries across provinces and territories, and this affects the accuracy of incidence data(e.g., year of diagnosis). In Quebec, because of the registry’s dependence on hospitaldata, the numbers of prostate, melanoma and bladder cases are believed to be under-reported.1
� The method of projection selected by the provincial registries for 2012 estimates(Nordpred Power5 regression model or a five-year averaging) varies acrossprovinces and cancer type (see Methods in Appendix II).
� The large interprovincial differences seen in bladder cancer incidence rates arelikely due to differences in reporting of in situ cases, particularly in Ontario, wheresuch cases were not collected until recently and were not available for thispublication.
2. INCIDENCE AND MORTALITY BY GEOGRAPHIC REGION
Canadian Cancer Society: Canadian Cancer Statistics 2012 13
There continues to be large variation in reported
incidence and mortality rates across Canada.
Canada is one of the few nations in the world with a
cancer registry system that allows cancer patterns to
be monitored and compared across the entire
population. Such comparisons can provide valuable
information for research, knowledge exchange,
planning and decision-making.
14 Canadian Cancer Society: Canadian Cancer Statistics 2012
2. INCIDENCE AND MORTALITY BY GEOGRAPHIC REGION
Canadian Cancer Society: Canadian Cancer Statistics 2012 15
2. INCIDENCE AND MORTALITY BY GEOGRAPHIC REGION
Table 2.1Estimated Population, New Cases and Deaths for All Cancers by Sex andGeographic Region, Canada, 2012
Population (in thousands) New Cases Deaths
Total* M F Total* M F Total* M F
CANADA 34,922 17,324 17,598 186,400 97,600 88,800 75,700 39,500 36,200
British Columbia(BC) 4,671 2,317 2,354 23,300 12,500 10,800 9,800 5,200 4,600
Alberta (AB) 3,841 1,957 1,883 16,100 8,800 7,400 6,300 3,300 2,900
Saskatchewan (SK) 1,048 521 527 5,500 2,900 2,600 2,400 1,250 1,100
Manitoba (MB) 1,261 628 633 6,200 3,100 3,000 2,800 1,500 1,350
Ontario (ON) 13,598 6,706 6,892 72,300 37,300 35,000 27,900 14,500 13,400
Quebec (QC)† 8,025 3,980 4,045 47,600 24,500 23,100 20,000 10,200 9,700
New Brunswick (NB) 759 373 386 5,000 2,700 2,200 1,900 1,000 910
Nova Scotia (NS) 953 463 490 6,100 3,200 2,800 2,700 1,450 1,200
Prince EdwardIsland (PE) 145 71 74 890 510 370 370 190 190
Newfoundland andLabrador (NL)† 509 249 260 3,100 1,750 1,400 1,400 790 630
Yukon (YT) 34 17 17 130 65 65 75 45 35
Northwest Territories(NT) 44 23 22 140 75 65 60 30 30
Nunavut (NU) 33 17 16 70 35 35 50 25 20
* Column totals may not sum to row totals due to rounding.† The actual data used to calculate the projected overall 2012 estimates were underestimated for some cancers
for this province.Note: The Canada and provincial/territorial totals exclude non-melanoma skin cancer (basal and squamous).Analysis by: Chronic Disease Surveillance and Monitoring Division, CCDPC, Public Health Agency of Canada.Data sources: Canadian Cancer Registry and Canadian Vital Statistics Death databases, and Census andDemographics Branch at Statistics Canada.2
16 Canadian Cancer Society: Canadian Cancer Statistics 2012
2. INCIDENCE AND MORTALITY BY GEOGRAPHIC REGION
Table 2.2Estimated New Cases for Selected Cancers by Sex and Province,Canada, 2012
New CasesCanada* BC AB SK MB ON QC† NB NS PE NL†
MalesAll Cancers 97,600 12,500 8,800 2,900 3,100 37,300 24,500 2,700 3,200 510 1,750Prostate 26,500 3,700 2,500 880 750 10,900 5,400 860 920 160 490Lung 13,300 1,550 1,000 360 430 4,400 4,300 410 480 70 250Colorectal‡ 13,000 1,600 1,100 420 490 4,800 3,400 340 470 60 310Bladder§ 5,800 820 550 180 210 1,500 2,000 170 210 30 85Non-Hodgkin
Lymphoma 4,300 590 410 120 140 1,750 930 110 110 15 60
Kidney 3,500 320 330 100 130 1,300 920 120 150 20 65Leukemia 3,200 430 320 110 120 1,300 720 70 75 15 30Melanoma 3,100 490 270 80 85 1,500 350 90 140 20 45Oral 2,700 340 220 60 110 1,100 630 65 90 15 45Pancreas 2,200 300 200 65 70 810 610 60 70 10 25Stomach 2,100 270 190 60 85 750 550 55 65 5 50Brain 1,600 180 150 45 45 620 440 35 45 10 25Liver 1,500 240 150 25 40 600 410 15 30 5 10Esophagus 1,400 180 150 35 45 540 320 40 55 10 20Multiple Myeloma 1,350 160 130 35 40 540 350 30 40 10 15Thyroid 1,250 95 110 15 30 600 290 30 30 5 15
FemalesAll Cancers 88,800 10,800 7,400 2,600 3,000 35,000 23,100 2,200 2,800 370 1,400Breast 22,700 3,000 1,950 690 800 9,100 5,500 550 740 95 330Lung 12,300 1,500 1,000 390 400 4,100 3,800 370 450 60 200Colorectal‡ 10,300 1,250 830 310 380 3,900 2,800 250 390 55 220Body of Uterus 5,300 720 480 150 210 2,200 1,200 120 140 20 85Thyroid 4,400 260 350 50 90 2,200 1,150 95 85 5 40Non-Hodgkin
Lymphoma 3,500 460 330 110 130 1,350 820 100 120 15 65
Melanoma 2,700 420 240 60 75 1,350 280 85 130 20 35Ovary 2,600 300 190 75 95 1,150 650 65 65 10 30Leukemia 2,400 300 230 80 85 1,050 540 45 60 10 20Pancreas 2,300 280 210 75 75 780 720 70 75 10 20Kidney 2,200 190 190 70 85 840 600 70 95 10 45Bladder§ 2,000 270 180 65 70 510 740 60 65 10 35Cervix 1,350 160 160 45 50 550 280 30 45 10 25Oral 1,350 170 100 35 50 570 320 25 35 5 15Brain 1,200 130 100 35 35 470 340 35 40 5 20Stomach 1,150 130 75 35 40 470 300 35 40 5 30Multiple Myeloma 1,050 120 100 30 30 440 280 25 25 5 10* Column totals may not sum to row totals due to rounding. Canada totals include provincial and territorial
estimates. Territories are not listed separately due to small numbers.† The actual data used to calculate the projected overall 2012 estimates were underestimated for some
cancers for this province.‡ Definition for this cancer has changed; see Table A2.§ Interprovincial variation. Ontario does not currently report in situ bladder cases.Note: New cases for “All Cancers” exclude non-melanoma skin cancer (basal and squamous).Analysis by: Chronic Disease Surveillance and Monitoring Division, CCDPC, Public Health Agency of Canada.Data source: Canadian Cancer Registry database at Statistics Canada.
Canadian Cancer Society: Canadian Cancer Statistics 2012 17
2. INCIDENCE AND MORTALITY BY GEOGRAPHIC REGION
Table 2.3Estimated Age-Standardized Incidence Rates for Selected Cancersby Sex and Province, Canada, 2012
Cases per 100,000Canada* BC AB SK MB ON QC† NB NS PE NL†
MalesAll Cancers 456 413 442 449 425 459 474 523 498 528 485Prostate 121 119 127 136 101 131 100 157 136 156 129Lung 62 49 52 55 58 53 83 78 73 74 68Colorectal‡ 60 53 57 64 65 58 65 65 72 63 86Bladder§ 27 27 29 28 28 19 38 33 32 32 25Non-Hodgkin
Lymphoma 20 20 21 19 19 22 18 22 17 17 17
Kidney 16 11 16 16 18 16 18 22 22 21 17Leukemia 16 15 16 17 16 17 15 14 13 16 9Melanoma 15 17 13 13 12 19 7 18 22 21 13Oral 12 11 10 9 14 13 12 12 13 15 13Pancreas 10 10 10 10 10 10 12 12 10 12 7Stomach 10 9 9 9 11 9 11 10 10 7 15Brain 8 6 7 7 7 8 9 8 8 9 8Liver 7 8 7 4 5 7 8 3 5 4 3Thyroid 6 4 5 3 4 8 6 6 5 5 5Esophagus 6 6 7 6 6 6 6 8 8 8 6Multiple Myeloma 6 5 6 5 5 7 7 6 6 9 4
FemalesAll Cancers 368 324 335 354 354 382 383 379 383 337 359Breast 96 92 88 98 97 100 94 95 100 89 84Lung 49 42 46 52 45 43 60 59 57 51 49Colorectal‡ 40 35 36 39 41 39 42 38 48 48 54Body of Uterus 22 21 21 22 26 23 19 19 19 18 21Thyroid 22 10 17 9 14 29 25 21 15 9 13Non-Hodgkin
Lymphoma 14 14 15 15 15 15 14 17 16 12 16
Melanoma 12 14 11 9 9 16 5 16 19 17 10Ovary 11 9 8 11 11 13 11 11 8 9 7Leukemia 10 9 11 11 10 12 9 9 9 9 6Kidney 9 5 9 9 10 9 10 12 12 10 11Pancreas 9 8 9 9 8 8 11 10 9 8 4Bladder§ 8 7 8 9 8 5 12 10 8 8 9Cervix 7 6 8 9 8 7 6 7 9 9 8Brain 6 5 5 6 5 6 7 6 6 5 5Oral 5 5 5 5 6 6 5 4 4 6 4Stomach 5 4 3 4 4 5 5 5 5 5 8Multiple Myeloma 4 3 4 4 3 4 4 4 3 4 3* Canada totals include provincial and territorial estimates. Territories are not listed separately due to small
numbers.† The actual data used to calculate the projected overall 2012 estimates were underestimated for some cancers
for this province.‡ Definition for this cancer has changed; see Table A2.§ Interprovincial variation. Ontario does not currently report in situ bladder cases.Note: Rates for “All Cancers” exclude non-melanoma skin cancer (basal and squamous). Rates are age-standardized to the 1991 Canadian population.Analysis by: Chronic Disease Surveillance and Monitoring Division, CCDPC, Public Health Agency of Canada.Data source: Canadian Cancer Registry database at Statistics Canada.
18 Canadian Cancer Society: Canadian Cancer Statistics 2012
2. INCIDENCE AND MORTALITY BY GEOGRAPHIC REGION
Table 2.4Estimated Deaths for Selected Cancers by Sex and Province,Canada, 2012
DeathsCanada* BC AB SK MB ON QC NB NS PE NL
MalesAll Cancers 39,500 5,200 3,300 1,250 1,500 14,500 10,200 1,000 1,450 190 790Lung 10,800 1,250 790 290 350 3,600 3,400 330 420 60 210Colorectal† 5,000 630 390 150 180 1,900 1,300 110 200 25 130Prostate 4,000 530 370 210 180 1,500 830 100 120 25 70Pancreas 2,100 320 180 65 75 760 540 60 75 10 35Non-Hodgkin
Lymphoma 1,500 200 140 60 65 570 330 45 55 5 20
Leukemia 1,500 190 130 55 60 610 350 30 55 10 20Bladder 1,450 220 120 45 55 540 340 35 50 5 25Esophagus 1,450 230 140 40 55 560 290 40 55 5 25Stomach 1,350 140 110 35 50 510 360 35 50 5 45Brain 1,050 150 110 30 30 360 300 30 35 5 20Kidney 1,050 120 85 35 50 380 270 35 45 5 25Oral 780 100 75 20 35 300 180 20 25 5 15Multiple Myeloma 750 100 65 25 25 300 180 20 25 5 10Liver 690 120 55 5 20 290 170 10 15 — 5Melanoma 600 90 55 15 15 270 110 10 25 5 10
FemalesAll Cancers 36,200 4,600 2,900 1,100 1,350 13,400 9,700 910 1,200 190 630Lung 9,400 1,150 720 260 340 3,200 2,800 280 330 45 170Breast 5,100 630 390 160 210 2,000 1,350 110 160 30 90Colorectal† 4,200 520 330 130 150 1,550 1,150 100 160 30 100Pancreas 2,100 290 200 65 70 740 600 60 70 10 25Ovary 1,750 240 150 60 80 690 380 45 60 5 30Non-Hodgkin
Lymphoma 1,300 170 100 45 60 490 340 30 50 10 15
Leukemia 1,100 140 100 40 45 420 260 30 40 5 10Body of Uterus 900 100 75 25 25 410 200 20 25 5 10Stomach 790 90 60 20 30 280 220 20 30 5 30Brain 760 100 70 25 25 250 220 20 25 5 15Bladder 670 80 45 15 15 290 180 10 20 5 10Kidney 650 70 55 25 25 250 160 20 25 5 15Multiple Myeloma 620 80 60 20 30 240 150 15 25 — 10Esophagus 410 80 35 15 20 170 80 10 15 — 5Cervix 390 45 50 10 20 160 65 10 20 — 10Oral 380 55 35 10 15 150 95 5 10 — 5Melanoma 370 60 35 10 10 160 65 10 15 — 5
— Fewer than three deaths.* Column totals may not sum to row totals due to rounding. Canada totals include provincial and territorial
estimates. Territories are not listed separately due to small numbers.† Definition for this cancer has changed; see Table A2.Analysis by: Chronic Disease Surveillance and Monitoring Division, CCDPC, Public Health Agency of Canada.Data source: Canadian Vital Statistics Death database at Statistics Canada.
Canadian Cancer Society: Canadian Cancer Statistics 2012 19
2. INCIDENCE AND MORTALITY BY GEOGRAPHIC REGION
Table 2.5Estimated Age-Standardized Mortality Rates for Selected Cancersby Sex and Province, Canada, 2012
Deaths per 100,000Canada* BC AB SK MB ON QC NB NS PE NL
MalesAll Cancers 184 167 174 187 197 177 198 193 223 195 230Lung 50 41 42 44 47 44 65 64 65 64 60Colorectal† 23 20 20 22 24 23 25 22 31 24 39Prostate 19 17 20 29 24 18 16 19 19 26 22Pancreas 10 10 9 10 10 9 10 12 12 10 9Leukemia 7 6 7 8 8 8 7 7 9 10 6Non-Hodgkin
Lymphoma 7 7 7 9 9 7 7 9 8 7 5
Bladder 7 7 6 7 7 6 7 7 8 7 8Esophagus 7 7 7 6 7 7 5 7 8 6 6Stomach 6 4 6 5 7 6 7 7 8 5 12Brain 5 5 5 5 4 5 6 6 6 5 5Kidney 5 4 4 5 6 5 5 7 7 6 7Multiple Myeloma 4 3 3 3 4 4 3 4 4 5 3Oral 4 3 3 3 4 4 3 4 4 3 4Melanoma 3 3 3 3 2 3 2 2 4 3 4Liver 3 4 3 1 3 3 3 1 2 — 2
FemalesAll Cancers 135 125 127 137 144 131 146 138 145 152 149Lung 36 33 33 34 37 32 45 43 41 40 40Breast 19 17 17 21 22 20 20 17 20 24 22Colorectal† 15 13 14 15 14 14 16 14 18 22 24Pancreas 8 8 9 7 7 7 9 9 9 6 6Ovary 7 7 7 8 9 7 6 8 7 5 7Non-Hodgkin
Lymphoma 5 4 4 6 6 5 5 5 6 6 4
Leukemia 4 4 4 5 5 4 4 4 5 5 3Body of Uterus 3 3 3 3 3 4 3 3 3 2 3Brain 3 3 3 3 3 3 4 3 4 5 4Stomach 3 2 3 2 3 3 3 3 3 4 7Kidney 2 2 2 3 3 2 2 3 3 5 3Multiple Myeloma 2 2 3 2 3 2 2 2 3 — 2Bladder 2 2 2 2 2 3 2 1 2 2 2Cervix 2 1 2 2 2 2 1 2 3 — 2Esophagus 1 2 1 2 2 2 1 2 2 — 1Melanoma 1 2 2 1 1 2 1 1 2 — 1Oral 1 1 1 1 2 1 1 1 1 — 1
— Fewer than three deaths.* Canada totals include provincial and territorial estimates. Territories are not listed separately due to small
numbers.† Definition for this cancer has changed; see Table A2.Note: Rates are age-standardized to the 1991 Canadian population.Analysis by: Chronic Disease Surveillance and Monitoring Division, CCDPC, Public Health Agency of Canada.Data source: Canadian Vital Statistics Death database at Statistics Canada.
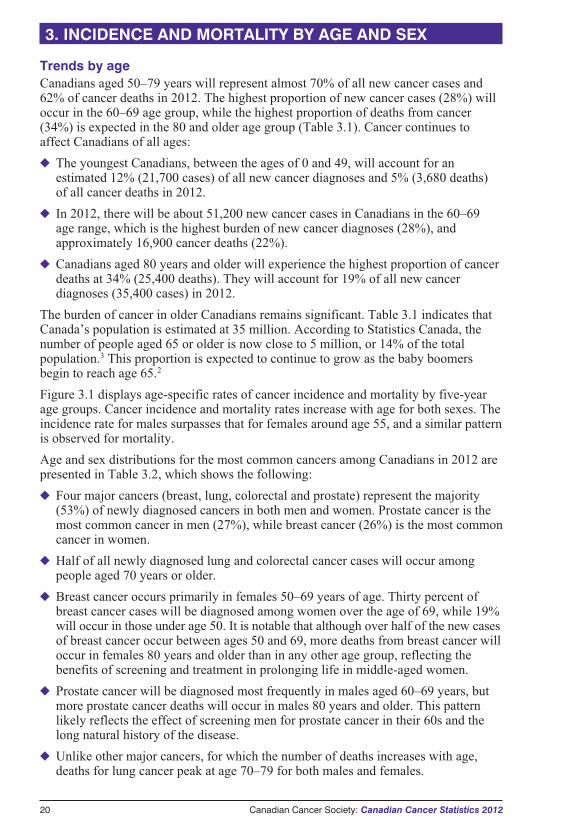
Trends by ageCanadians aged 50–79 years will represent almost 70% of all new cancer cases and62% of cancer deaths in 2012. The highest proportion of new cancer cases (28%) willoccur in the 60–69 age group, while the highest proportion of deaths from cancer(34%) is expected in the 80 and older age group (Table 3.1). Cancer continues toaffect Canadians of all ages:
� The youngest Canadians, between the ages of 0 and 49, will account for anestimated 12% (21,700 cases) of all new cancer diagnoses and 5% (3,680 deaths)of all cancer deaths in 2012.
� In 2012, there will be about 51,200 new cancer cases in Canadians in the 60–69age range, which is the highest burden of new cancer diagnoses (28%), andapproximately 16,900 cancer deaths (22%).
� Canadians aged 80 years and older will experience the highest proportion of cancerdeaths at 34% (25,400 deaths). They will account for 19% of all new cancerdiagnoses (35,400 cases) in 2012.
The burden of cancer in older Canadians remains significant. Table 3.1 indicates thatCanada’s population is estimated at 35 million. According to Statistics Canada, thenumber of people aged 65 or older is now close to 5 million, or 14% of the totalpopulation.3 This proportion is expected to continue to grow as the baby boomersbegin to reach age 65.2
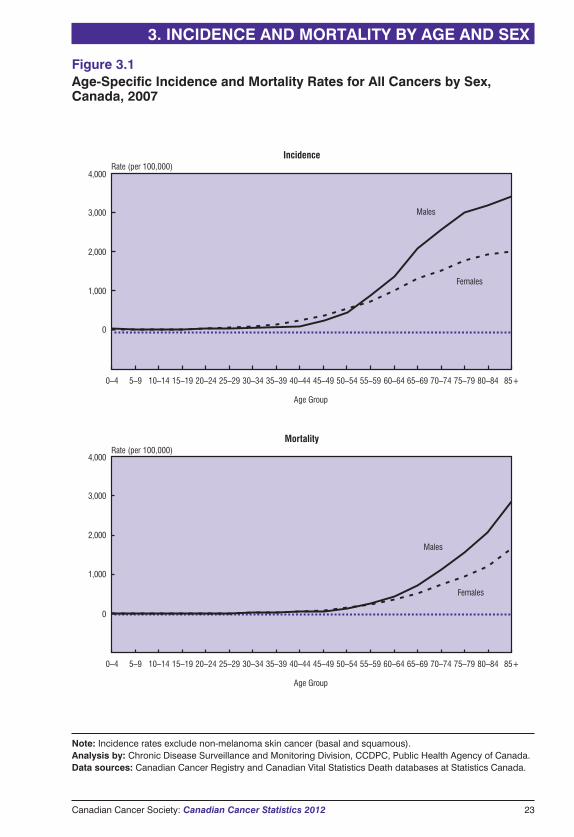
Figure 3.1 displays age-specific rates of cancer incidence and mortality by five-yearage groups. Cancer incidence and mortality rates increase with age for both sexes. Theincidence rate for males surpasses that for females around age 55, and a similar patternis observed for mortality.
Age and sex distributions for the most common cancers among Canadians in 2012 arepresented in Table 3.2, which shows the following:
� Four major cancers (breast, lung, colorectal and prostate) represent the majority(53%) of newly diagnosed cancers in both men and women. Prostate cancer is themost common cancer in men (27%), while breast cancer (26%) is the most commoncancer in women.
� Half of all newly diagnosed lung and colorectal cancer cases will occur amongpeople aged 70 years or older.
� Breast cancer occurs primarily in females 50–69 years of age. Thirty percent ofbreast cancer cases will be diagnosed among women over the age of 69, while 19%will occur in those under age 50. It is notable that although over half of the new casesof breast cancer occur between ages 50 and 69, more deaths from breast cancer willoccur in females 80 years and older than in any other age group, reflecting thebenefits of screening and treatment in prolonging life in middle-aged women.
� Prostate cancer will be diagnosed most frequently in males aged 60–69 years, butmore prostate cancer deaths will occur in males 80 years and older. This patternlikely reflects the effect of screening men for prostate cancer in their 60s and thelong natural history of the disease.
� Unlike other major cancers, for which the number of deaths increases with age,deaths for lung cancer peak at age 70–79 for both males and females.
20 Canadian Cancer Society: Canadian Cancer Statistics 2012
3. INCIDENCE AND MORTALITY BY AGE AND SEX
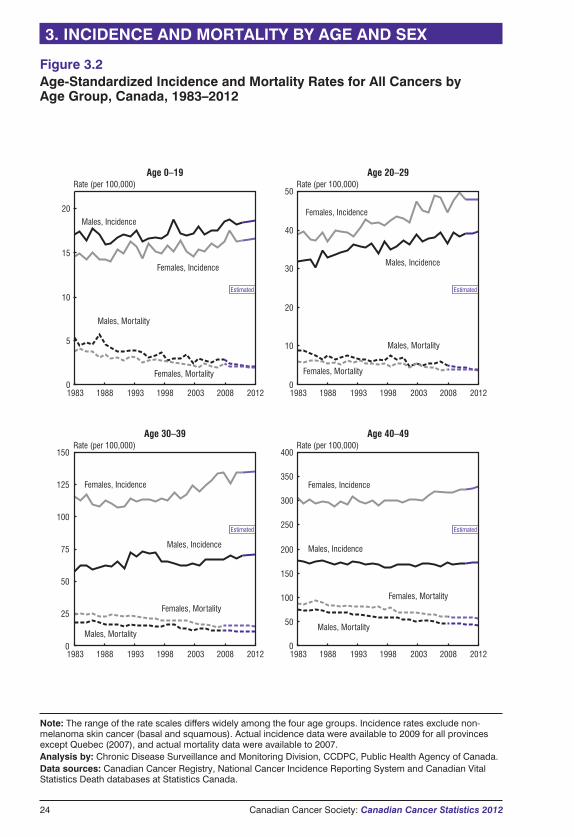
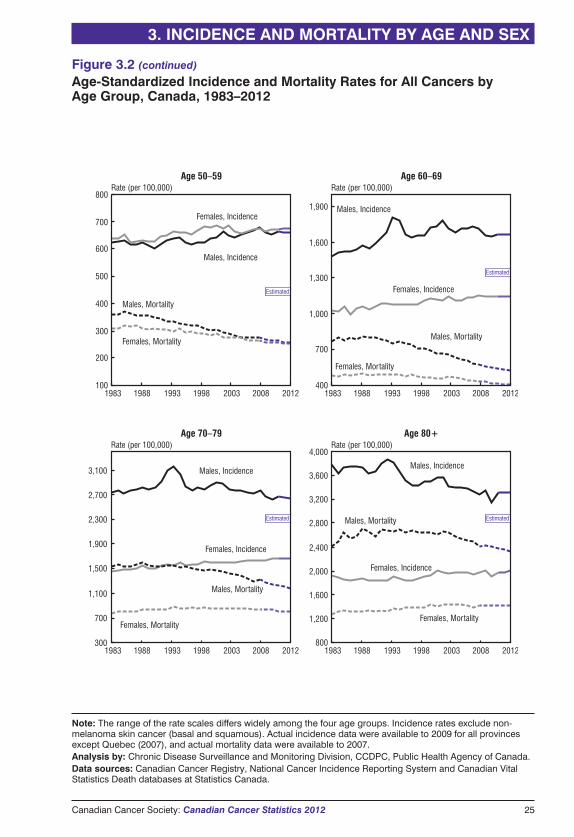
Trends by sexTrends in age-standardized incidence and mortality rates for all cancers combined formales and females are shown in Figure 3.2.
Cancer is more common in males than females among those 19 years and younger and60 years and older, but this trend reverses between ages 20 and 50, with a higherincidence in females. In the 50–59 age group, male and female rates are very similar.Sex-specific cancers (breast and cervical cancer in particular) as well as melanomaand thyroid cancer account for the higher cancer incidence in younger females.
Breast cancer is the most common cancer in females over the age of 20. Deaths frombreast cancer are more frequent than deaths from other common cancers only inwomen 30–39 years of age.
The overall cancer incidence rate in males over age 69 has been dropping, primarilydue to a declining rate of lung cancer from decreased tobacco use.4 The overallincidence rate in females has only recently begun to level off. Lung cancer remains themost common cause of cancer death in both sexes.
Since 1989, the mortality rate for all cancers combined has been dropping for malesup to age 79 and for females up to age 69. But for females, this rate begins to increasefrom age 70. Mortality rates for males and females in the youngest age groups (0–19,20–29) are very similar in recent years and show limited variation up to age 59, afterwhich male mortality rates are notably higher than those for females.
3. INCIDENCE AND MORTALITY BY AGE AND SEX
Canadian Cancer Society: Canadian Cancer Statistics 2012 21
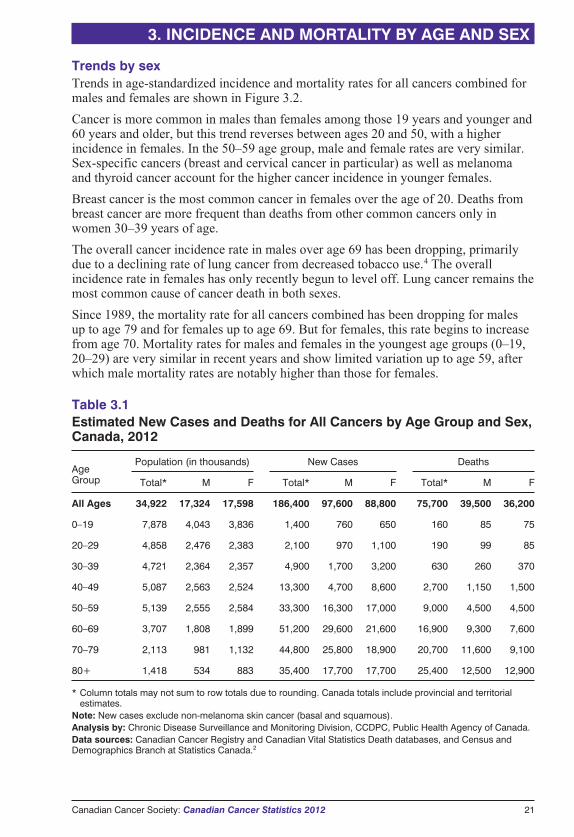
Table 3.1Estimated New Cases and Deaths for All Cancers by Age Group and Sex,Canada, 2012
AgeGroup
Population (in thousands) New Cases Deaths
Total* M F Total* M F Total* M F
All Ages 34,922 17,324 17,598 186,400 97,600 88,800 75,700 39,500 36,200
0–19 7,878 4,043 3,836 1,400 760 650 160 85 75
20–29 4,858 2,476 2,383 2,100 970 1,100 190 99 85
30–39 4,721 2,364 2,357 4,900 1,700 3,200 630 260 370
40–49 5,087 2,563 2,524 13,300 4,700 8,600 2,700 1,150 1,500
50–59 5,139 2,555 2,584 33,300 16,300 17,000 9,000 4,500 4,500
60–69 3,707 1,808 1,899 51,200 29,600 21,600 16,900 9,300 7,600
70–79 2,113 981 1,132 44,800 25,800 18,900 20,700 11,600 9,100
80+ 1,418 534 883 35,400 17,700 17,700 25,400 12,500 12,900
* Column totals may not sum to row totals due to rounding. Canada totals include provincial and territorialestimates.
Note: New cases exclude non-melanoma skin cancer (basal and squamous).Analysis by: Chronic Disease Surveillance and Monitoring Division, CCDPC, Public Health Agency of Canada.Data sources: Canadian Cancer Registry and Canadian Vital Statistics Death databases, and Census andDemographics Branch at Statistics Canada.2
Cancer risk increases with age, and the number of new
cancer diagnoses will continue to increase as the baby
boomer population begins to reach age 65. Notable
declines in mortality rates for all cancers combined have
occurred in both sexes and in most age groups.
22 Canadian Cancer Society: Canadian Cancer Statistics 2012
3. INCIDENCE AND MORTALITY BY AGE AND SEX
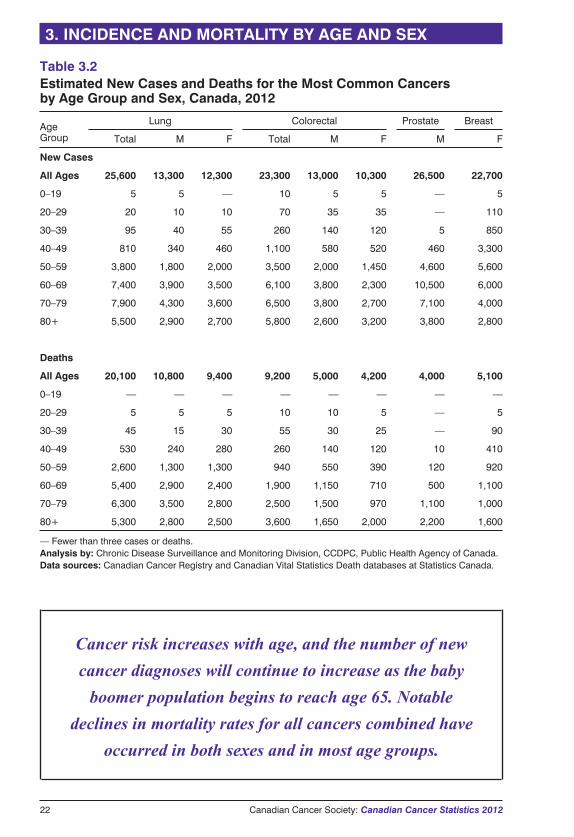
Table 3.2Estimated New Cases and Deaths for the Most Common Cancersby Age Group and Sex, Canada, 2012
AgeGroup
Lung Colorectal Prostate Breast
Total M F Total M F M F
New Cases
All Ages 25,600 13,300 12,300 23,300 13,000 10,300 26,500 22,700
0–19 5 5 — 10 5 5 — 5
20–29 20 10 10 70 35 35 — 110
30–39 95 40 55 260 140 120 5 850
40–49 810 340 460 1,100 580 520 460 3,300
50–59 3,800 1,800 2,000 3,500 2,000 1,450 4,600 5,600
60–69 7,400 3,900 3,500 6,100 3,800 2,300 10,500 6,000
70–79 7,900 4,300 3,600 6,500 3,800 2,700 7,100 4,000
80+ 5,500 2,900 2,700 5,800 2,600 3,200 3,800 2,800
Deaths
All Ages 20,100 10,800 9,400 9,200 5,000 4,200 4,000 5,100
0–19 — — — — — — — —
20–29 5 5 5 10 10 5 — 5
30–39 45 15 30 55 30 25 — 90
40–49 530 240 280 260 140 120 10 410
50–59 2,600 1,300 1,300 940 550 390 120 920
60–69 5,400 2,900 2,400 1,900 1,150 710 500 1,100
70–79 6,300 3,500 2,800 2,500 1,500 970 1,100 1,000
80+ 5,300 2,800 2,500 3,600 1,650 2,000 2,200 1,600
— Fewer than three cases or deaths.Analysis by: Chronic Disease Surveillance and Monitoring Division, CCDPC, Public Health Agency of Canada.Data sources: Canadian Cancer Registry and Canadian Vital Statistics Death databases at Statistics Canada.
Canadian Cancer Society: Canadian Cancer Statistics 2012 23
3. INCIDENCE AND MORTALITY BY AGE AND SEX
Rate (per 100,000)Incidence
4,000
3,000
2,000
1,000
0
Age Group
Rate (per 100,000)Mortality
4,000
3,000
2,000
1,000
0
Age Group
Males
Females
Males
Females
85+80–8475–7970–7465–6960–6455–5950–5445–4940–4435–3930–3425–2920–2415–1910–145–90–4
85+80–8475–7970–7465–6960–6455–5950–5445–4940–4435–3930–3425–2920–2415–1910–145–90–4
Figure 3.1Age-Specific Incidence and Mortality Rates for All Cancers by Sex,Canada, 2007
Note: Incidence rates exclude non-melanoma skin cancer (basal and squamous).Analysis by: Chronic Disease Surveillance and Monitoring Division, CCDPC, Public Health Agency of Canada.Data sources: Canadian Cancer Registry and Canadian Vital Statistics Death databases at Statistics Canada.
24 Canadian Cancer Society: Canadian Cancer Statistics 2012
3. INCIDENCE AND MORTALITY BY AGE AND SEX
Estimated
Estimated
0
10
15
20
Rate (per 100,000)Age 0–19
Males, Incidence
Females, Incidence
Males, Mortality
Females, Mortality
Estimated
Rate (per 100,000)Age 20–29
10
20
30
40
50
Females, Incidence
Males, Incidence
Males, Mortality
Females, Mortality
Estimated
Rate (per 100,000)Age 40–49
Females, Incidence
Males, Incidence
Females, Mortality
Males, Mortality
150
125
100
75
50
25
0
Rate (per 100,000)Age 30–39
0
100
150
200
250
300
400
350
Males, Incidence
Males, Mortality
Females, Mortality
50
0
Females, Incidence
1983 1988 1993 1998 2003 2008 2012 1983 1988 1993 1998 2003 2008 2012
1983 1988 1993 1998 2003 2008 2012 1983 1988 1993 1998 2003 2008 2012
5
Figure 3.2Age-Standardized Incidence and Mortality Rates for All Cancers byAge Group, Canada, 1983–2012
Note: The range of the rate scales differs widely among the four age groups. Incidence rates exclude non-melanoma skin cancer (basal and squamous). Actual incidence data were available to 2009 for all provincesexcept Quebec (2007), and actual mortality data were available to 2007.Analysis by: Chronic Disease Surveillance and Monitoring Division, CCDPC, Public Health Agency of Canada.Data sources: Canadian Cancer Registry, National Cancer Incidence Reporting System and Canadian VitalStatistics Death databases at Statistics Canada.
Canadian Cancer Society: Canadian Cancer Statistics 2012 25
3. INCIDENCE AND MORTALITY BY AGE AND SEX
100
200
400
600
700
800Rate (per 100,000)
Age 50–59
Males, Incidence
Females, Incidence
Males, Mortality
Females, Mortality
Rate (per 100,000)Age 60–69
Females, Incidence
Males, Incidence
Males, Mortality
Females, Mortality
Rate (per 100,000)Age 80+
Females, Incidence
Males, Incidence
Females, Mortality
Males, Mortality
Rate (per 100,000)Age 70–79
Males, Incidence
Males, Mortality
Females, Incidence
Females, Mortality
300
500
700
1,000
1,300
1,600
1,900
400
700
1,100
1,500
1,900
2,300
2,700
3,100
300 800
1,200
1,600
2,000
2,400
2,800
3,200
4,000
3,600
Estimated
Estimated
Estimated
Estimated
1983 1988 1993 1998 2003 2008 2012 1983 1988 1993 1998 2003 2008 2012
1983 1988 1993 1998 2003 2008 2012 1983 1988 1993 1998 2003 2008 2012
Figure 3.2 (continued)
Age-Standardized Incidence and Mortality Rates for All Cancers byAge Group, Canada, 1983–2012
Note: The range of the rate scales differs widely among the four age groups. Incidence rates exclude non-melanoma skin cancer (basal and squamous). Actual incidence data were available to 2009 for all provincesexcept Quebec (2007), and actual mortality data were available to 2007.Analysis by: Chronic Disease Surveillance and Monitoring Division, CCDPC, Public Health Agency of Canada.Data sources: Canadian Cancer Registry, National Cancer Incidence Reporting System and Canadian VitalStatistics Death databases at Statistics Canada.
26 Canadian Cancer Society: Canadian Cancer Statistics 2012
The numbers of new cases and deaths are important measures of cancer burden onthe Canadian population and healthcare system. Incidence trends generally signal
changes in population structure or the prevalence of risk factors, or they may indicatechanges in screening or diagnostic practices. Incidence trends are one statistic that canbe directly used to indicate how many new people may seek diagnosis, primarytreatment, potential further treatment or palliative care in the future. Trends inmortality rates reflect changes in disease incidence, survival or both. A decreasingtrend in mortality indicates progress in cancer control.
Trends in incidence and mortality are often assessed by comparing annual age-standardized rates. Age standardization results in more meaningful comparisons ofchanges in cancer risk or diagnostic practices over place and time because it adjustsfor variation in the age distribution and growth of populations. Unless otherwisespecified, this section reports average annual percent changes over 10 years.
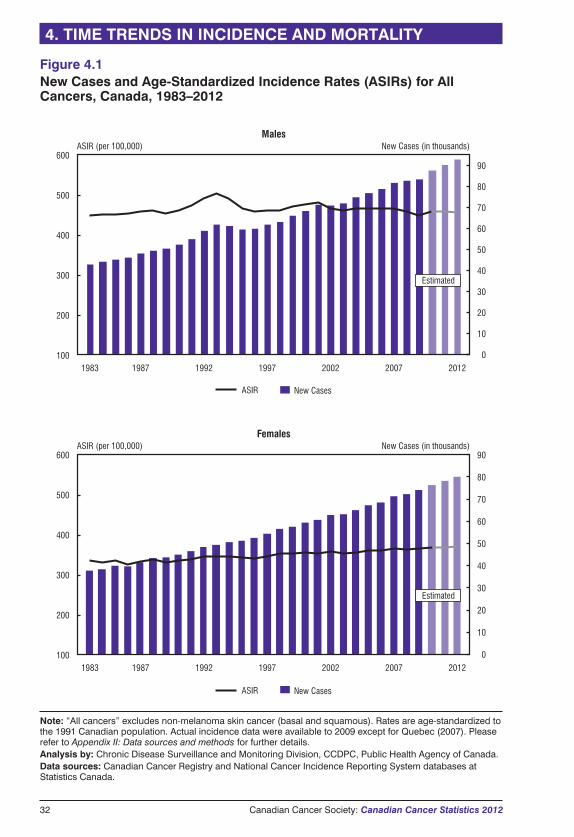
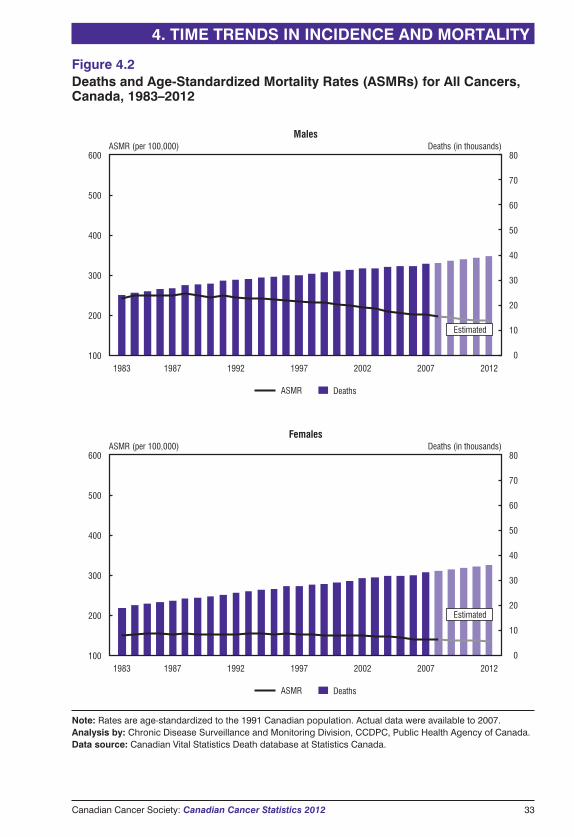
Trends for all cancers combinedFigure 4.1 presents the number of new cases for all cancers combined, together withthe corresponding age-standardized incidence rates for 1983 to 2009, with estimates tothe year 2012. Figure 4.2 presents the number of deaths and age-standardizedmortality rates for 1983 to 2007, with estimates to 2012. Despite the relative stabilityin age-standardized rates, the number of new cancer cases continues to rise steadily asthe Canadian population grows and ages. In 2012, the number of new cancer cases isestimated to be 186,400, and the number of cancer deaths is estimated to be 75,700.
Among males, the overall cancer incidence rate rose in the early 1990s and thendeclined sharply (Figure 4.1). This reflects a similar trend in the incidence of prostatecancer, the leading type of cancer in men, during the same period. Since 1993, therehas been a decline in the overall cancer incidence rate in males. In contrast, the cancermortality rate in males, after reaching a peak in 1988, has been declining steadilybecause of decreases in mortality rates for prostate, lung, colorectal and other cancers(Figure 4.2).
Among females, the overall cancer incidence rate has been increasing slowly since theearly 1990s (Figure 4.1), while the mortality rate has been declining slowly since themid-1990s (Figure 4.2).
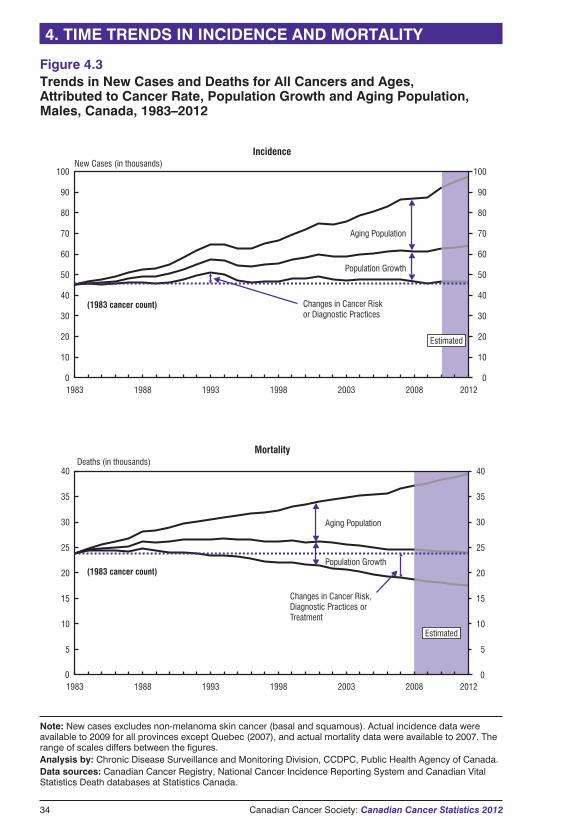
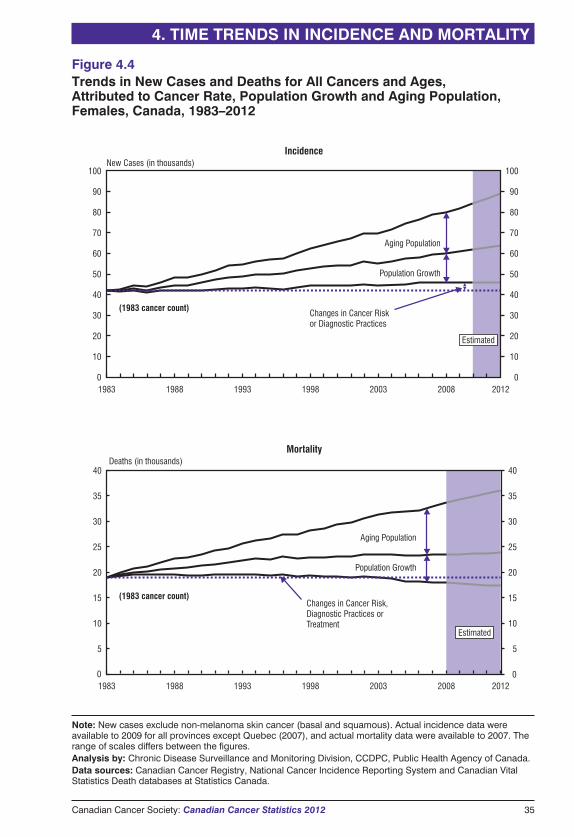
Figures 4.3 and 4.4 show the relative contributions to the changes in the total numberof new cases and deaths that can be attributed to changes in cancer risk or diagnosticpractices, population size and aging of the population. The major contributors to therising number of new cancer cases are population growth and the aging of thepopulation:
� The lowest solid line represents the total number of new cancer cases (or deaths)that would have occurred each year if the population size and age structure hadremained the same as they were in 1983. This line reflects the impact of changes incancer risk or diagnostic practices.
� The middle line represents the number of new cases (or deaths) that would haveoccurred if the age structure of the population had remained the same as it was in1983. This line reflects the impact of changes in cancer risk and population growth.
4. TIME TRENDS IN INCIDENCE AND MORTALITY
Canadian Cancer Society: Canadian Cancer Statistics 2012 27
� The top line represents the number of new cases (or deaths) that actually occurredand thus reflects the combined impact of changes in risk, population growth andaging of the population.
These figures indicate that the increase in the number of cancer cases and deaths thathas occurred over the last 30 years is primarily the result of an aging population and,to a lesser extent, an increase in population size. As long as current demographictrends continue, there will be a corresponding annual increase in the number of newcases and deaths from cancer.
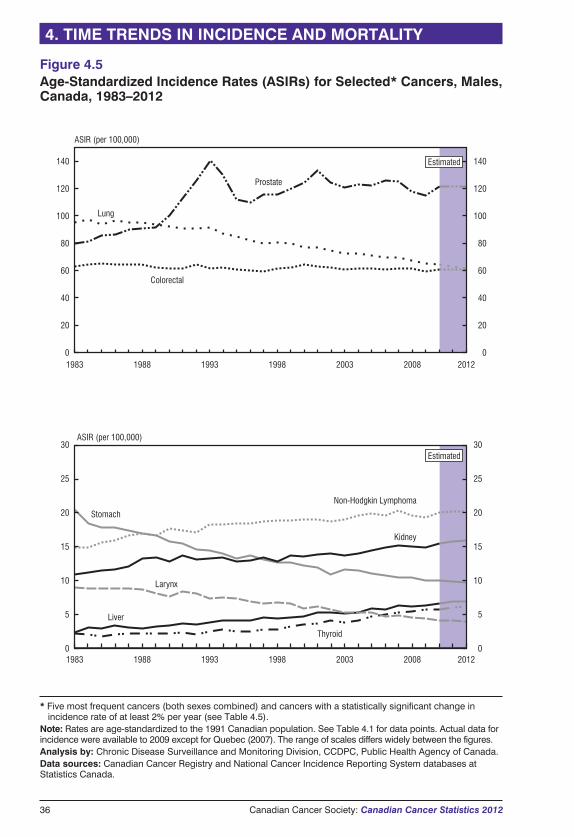
Trends for selected cancersTrends in annual rates for selected cancers over the past 30 years are presented inFigures 4.5 to 4.8, with the data provided in Tables 4.1 to 4.4.
The annual percent change (APC) in cancer-specific incidence rates and mortalityrates (1998–2007) is listed in Table 4.5. The overall incidence rate increasedsignificantly for females between 1998 and 2007 (0.3% per year). The overallmortality rate declined significantly between 1998 and 2007 for females (-0.8% peryear) and between 2001 and 2007 for males (-2.0% per year). It should be noted thatthese short-term trends do not necessarily reflect the longer term or earlier trendsevident in Tables 4.1 to 4.4 and Figures 4.5 to 4.8. The descriptions that follow shouldbe interpreted with this in mind.
For the cancers listed in Table 4.5, several statistically significant increases ordecreases of 2% or more per year are observed:
� increases in incidence rate
� liver cancer in both males (3.6%) and females (2.4%)
� thyroid cancer in both males (6.8%) and females (6.9%)
� kidney cancer in males (2.6%)
� decreases in incidence rate
� larynx cancer in both males (-3.8%) and females (-3.4%)
� stomach cancer in males (-2.0%)
� increases in mortality rate
� liver cancer in males (2.2%)
� decreases in mortality rate
� in males, deaths from all cancers combined (-2.0%), lung cancer (-2.3%),colorectal cancer (-2.6%), non-Hodgkin lymphoma (-2.6%), stomach cancer(-3.0%), prostate cancer (-4.3%) and larynx cancer (-6.2%)
� in females, breast cancer (-2.2%), non-Hodgkin lymphoma (-2.7%), stomachcancer (-2.9%) and cervical cancer (-2.9%)
4. TIME TRENDS IN INCIDENCE AND MORTALITY
Discussion of leading and selected cancers with significantly changingtrendsBreast cancer
Breast cancer incidence rates rose from 1983 through the early 1990s, in part becauseof increased mammography screening. Reasons for the pattern of modest declines andincreases observed since then are unclear but likely relate to factors such as thecontinuing rise in mammography screening throughout the 1990s, along with thefluctuating patterns of hormone replacement therapy use among post-menopausalwomen during this time.
Female breast cancer mortality rates have been declining since the mid-1980s. Themortality rate has fallen by almost 40% since peaking in 1986, from 32.0 to 19.5 per100,000 (Table 4.4). The downward trend has accelerated to 2.2% per year in recentyears. This is likely the result of a combination of increased mammography screeningand the use of more effective adjuvant therapies following breast cancer surgery. Thebreast cancer mortality rate is the lowest it has been since 1950. Similar declines havealso occurred in the United States, United Kingdom and Australia.5
Cervical cancer
Incidence and mortality rates have continued declining for cervical cancer, by 1.4%and 2.9% per year, respectively, since 1998 (Table 4.5). This is largely due towidespread, regular screening with the Papanicolaou (Pap) test, which detects pre-malignant and malignant lesions early so that they can be treated.
The immunization of school-aged children with the vaccine for human papillomavirus(HPV) is anticipated to further reduce incidence and mortality over the longer term butwill not eliminate cervical cancer. The continuation of Pap screening is still a necessaryand important part of preventive healthcare.
Colorectal cancer
Colorectal cancer incidence rates between 1983 and 2000 were relatively stable inmen and declined slightly in females. In both sexes, the incidence rate has declinedsignificantly (0.8% per year) since 2000 (Table 4.5).
Mortality rates continue to decline in both sexes—by 2.6% per year in males since2003 and 1.8% per year in females since 1998 (Table 4.5). This is likely the result ofimprovements in treatment, such as chemotherapy.
Screening for colorectal cancer can reduce both incidence (by identifying andremoving precancerous polyps) and mortality. Screening has already been occurring inseveral provinces, which may partly account for the decline in mortality, thoughscreening rates are low. All provinces have announced or have started implementingorganized screening programs.
Kidney cancer
Figure 4.5 indicates that incidence rates of kidney cancer in Canadian men increasedduring the 1980s, stabilized between 1988 and 1998 and rose again thereafter. Duringthe period from 2003 to 2007, kidney cancer incidence rates among males increasedsignificantly by 2.6% per year (Table 4.5). Between 1998 and 2007, the incidenceincreased significantly among women by 1.9% per year.
28 Canadian Cancer Society: Canadian Cancer Statistics 2012
4. TIME TRENDS IN INCIDENCE AND MORTALITY
The rising incidence of kidney cancer is consistent with trends observed in severaldeveloped countries.6–8 The upward trend in kidney cancer in Canada may be partlyexplained by the increasing use of high-tech diagnostic imaging, increase in cigarettesmoking (prior to its decline) and increased obesity over the past 25 years.9
Mortality rates for kidney cancer have decreased slightly by 0.8% per year for menand by 0.9% for women during the period of 1998 to 2007.
Larynx cancer
Incidence rates of larynx cancer (1998–2007) have decreased for both males(-3.8% per year) and females (-3.4% per year), while mortality rates for males showeda significant decline of 6.2% since 2001 (Table 4.5).
Cancer of the larynx is most strongly associated with smoking10 and alcohol use.11
Incidence and mortality rates reflect the decreasing trends in these risk factors.4,12
Liver cancer
In males, the incidence rate of liver cancer increased by 3.6% per year, and themortality rate increased by 2.2% per year (Table 4.5) between 1998 and 2007. Bothincreases were statistically significant. In females, the incidence rate increased by2.4% per year (Table 4.5).
Some of the observed increase may be explained by the rising immigration of peoplefrom world regions where risk factors for liver cancer, such as hepatitis B virusinfection and exposure to aflatoxins, are prevalent.13
Other factors include increased rates of hepatitis C infection and alcohol abuse, whichboth increase the risk of liver cirrhosis and therefore liver cancer.14
Lung cancer
In males, incidence and mortality rates for lung cancer began to level off in the mid-1980s and have been declining ever since (Tables 4.1 and 4.2). Rates have droppedsignificantly, by 1.8% per year for incidence and by 2.3% per year for mortality(Table 4.5).
In females, the incidence rate has been increasing since 1983, with a significantupward trend of 1.1% per year between 1998 and 2007. The mortality rate for femalesshows a slight (0.7%) but statistically significant increase.
Despite the diverging trends, males are projected to continue to have higher incidenceand mortality rates than females in 2012 (incidence: 62 vs. 49 per 100,000; mortality:50 vs. 36 per 100,000).
The differences between male and female lung cancer trends reflect past differences inthe patterns of tobacco use. In males, the drop in tobacco consumption began in themid-1960s, preceding the decline in lung cancer rates by approximately 20 years. Infemales, tobacco consumption began to decline in the mid-1980s.
Non-Hodgkin lymphoma
Incidence rates for non-Hodgkin lymphoma have increased modestly in males (0.8%)and stabilized in females since 1998.
The observed incidence patterns likely result from a combination of improveddetection and classification of this complex set of diseases, as well as changes in risk
Canadian Cancer Society: Canadian Cancer Statistics 2012 29
4. TIME TRENDS IN INCIDENCE AND MORTALITY
factors. The clearest risk factor for non-Hodgkin lymphoma is immunosuppression,which can result from immune disorders, immunosuppressive therapy or infectionwith human immunodeficiency virus (HIV). Other factors that increase risk are poorlyunderstood but may include occupational exposure to pesticides and organochlorines,such as phenoxy herbicides and dioxins.
Mortality rates have declined for males (-2.6% per year) and females (-2.7% per year)since 2000 (Table 4.5).
Declines in mortality may reflect recent improvements in treatment, such asimmunotherapy (e.g., rituximab). As well, the introduction of anti-retroviral treatmentfor HIV infection in the second half of the 1990s has resulted in a decline in theproportion of particularly aggressive forms of non-Hodgkin lymphoma attributable toHIV infection.
Oral cancer
This group of cancers includes cancers of the lip, tongue, salivary gland, mouth,nasopharynx and oropharynx. Slight declines have occurred in the incidence rate(-1.0% per year) and mortality rate (-1.8% per year) for males since 1998 (Table 4.5).
A decline in smoking, which is a major risk factor for most oral cancers in Canada,likely accounts for the downward trends in oral cancer incidence and mortality.
Decreases in heavy alcohol use may also be relevant. The contributions of other riskfactors, including HPV infection, diet and sun exposure (linked to lip cancer), areunclear.
Prostate cancer
The two peaks in the incidence of prostate cancer that occurred in 1993 and 2001,each followed by a decline (Figure 4.5), are compatible with two waves of intensifiedscreening activity with the PSA test for early prostate cancer detection. The first peakfollows the introduction of PSA as a screening test. The second may be explained bythe publicity around the 2001 prostate cancer diagnosis of the then federal minister ofhealth, as a result of serial PSA tests. The first decline was followed by resumption ofthe earlier, more gradual increase, whereas the second decline has been followed by astabilizing of the trend.
Although the long-term, ongoing increase in incidence may be due to gradual changesin early detection, changes in the prevalence of risk factors might also be partlyresponsible. However, little is known about what these factors are for prostate cancer.
In contrast to incidence, mortality rates for prostate cancer rose much more slowlyfrom 1980 and started to decline in the mid-1990s. Mortality declined significantly by4.3% per year between 2001 and 2007 (Table 4.5), which likely reflects improvedtreatment over time.
In 2009, two large randomized trials of PSA testing and its possible relation toreducing mortality in men over age 55 produced conflicting results.15,16 Ongoingfollow-up of men in these studies may help clarify the role of PSA testing in reducingdeaths from prostate cancer.
Stomach cancer
Incidence rates of stomach cancer are declining in both sexes by 2.0% per year inmales and 1.6% per year in females between 1998 and 2007 (Table 4.5). This decline
30 Canadian Cancer Society: Canadian Cancer Statistics 2012
4. TIME TRENDS IN INCIDENCE AND MORTALITY
may be due to changes in diet, decreases in smoking and heavy alcohol use (which canincrease the impact of smoking on stomach cancer risk) and increased recognition andtreatment of infection with the bacterium Helicobacter pylori, which is associated withstomach cancer.
Mortality rates from this cancer have also declined significantly, by 3.0% per year inmales and by 2.9% per year in females (Table 4.5).
Thyroid cancer
The incidence rate of thyroid cancer is the most rapidly increasing of all cancers (6.8%per year in males since 1998 and 6.9% per year in females since 2002; Table 4.5).Similar increases have been noted in Europe and the United States.
There are two proposed explanations for the rising rates of thyroid cancer. Morefrequent use of diagnostic testing (ultrasound, computed tomography [CT] andmagnetic resonance imaging) may be detecting earlier stage, asymptomatic thyroidcancers more frequently than was possible in the past.17 Alternatively, a true increasein the risk over time of this cancer could be possible as at least one US research studyhas found increases in thyroid tumours of all sizes and stages.18
Mortality rates have remained stable, most likely because modern treatment is highlyeffective in the management of early thyroid cancers.
ImplicationsThe strong declines in mortality rates for several cancers suggest that there has beenimportant progress in cancer control, specifically due to early detection and treatment,as seen in improved five-year relative survival in the most recent time period for theleading cancers.19 However, the increasing or stable trends in incidence rates for manycancers suggest a need for more primary prevention. Furthermore, Figure 4.1 andFigure 4.2 highlight the fact that the rise in new cases of cancer will place anincreasing burden on Canadian society, largely independent of the trend in incidenceand mortality rates. This vividly illustrates why cancer prevention and healthpromotion programs are so vital. There is a need to enhance capacity for primaryprevention, early detection and treatment to further reduce overall cancer incidenceand mortality.
Incidence and mortality are measures of disease burden, and their
trends can inform the need for clinical services. Overall, incidence
rates are stable (males) or show modest increases (females), but
mortality rates are declining, suggesting better survival for some
cancers. The trends call for an enhancement of primary prevention
efforts; a sustained focus on screening for breast, colorectal and
cervical cancers; more emphasis on early detection measures and
public education on the early signs of cancer; and improved
treatment options and health promotion.
Canadian Cancer Society: Canadian Cancer Statistics 2012 31
4. TIME TRENDS IN INCIDENCE AND MORTALITY
32 Canadian Cancer Society: Canadian Cancer Statistics 2012
4. TIME TRENDS IN INCIDENCE AND MORTALITY
ASIR (per 100,000) New Cases (in thousands)Males
90
60
50
40
30
20
10
0
70
1983 1987 1992 1997 2002 2007 2012
1983 1987 1992 1997 2002 2007 2012
600
500
400
300
200
100
ASIR (per 100,000)Females
600
500
400
300
200
100
90
60
50
40
30
20
10
0
70
80
80
New Cases (in thousands)
Estimated
Estimated
New CasesASIR
New CasesASIR
Figure 4.1New Cases and Age-Standardized Incidence Rates (ASIRs) for AllCancers, Canada, 1983–2012
Note: “All cancers” excludes non-melanoma skin cancer (basal and squamous). Rates are age-standardized tothe 1991 Canadian population. Actual incidence data were available to 2009 except for Quebec (2007). Pleaserefer to Appendix II: Data sources and methods for further details.Analysis by: Chronic Disease Surveillance and Monitoring Division, CCDPC, Public Health Agency of Canada.Data sources: Canadian Cancer Registry and National Cancer Incidence Reporting System databases atStatistics Canada.
Canadian Cancer Society: Canadian Cancer Statistics 2012 33
4. TIME TRENDS IN INCIDENCE AND MORTALITY
ASMR (per 100,000) Deaths (in thousands)
Deaths (in thousands)
Males
ASMR (per 100,000)Females
600
500
400
300
200
100
600
500
400
300
200
100
80
60
50
40
30
20
10
0
70
80
60
50
40
30
20
10
0
70
Estimated
Estimated
DeathsASMR
DeathsASMR
1983 1987 1992 1997 2002 2007 2012
1983 1987 1992 1997 2002 2007 2012
Figure 4.2Deaths and Age-Standardized Mortality Rates (ASMRs) for All Cancers,Canada, 1983–2012
Note: Rates are age-standardized to the 1991 Canadian population. Actual data were available to 2007.Analysis by: Chronic Disease Surveillance and Monitoring Division, CCDPC, Public Health Agency of Canada.Data source: Canadian Vital Statistics Death database at Statistics Canada.
34 Canadian Cancer Society: Canadian Cancer Statistics 2012
4. TIME TRENDS IN INCIDENCE AND MORTALITY
New Cases (in thousands)Incidence
Estimated
MortalityDeaths (in thousands)
35
40
30
25
20
15
10
5
35
40
30
25
20
15
10
5
0 0
Estimated
(1983 cancer count)
(1983 cancer count)
1983 1988 1993 1998 2003 2008 2012
1983 1988 1993 1998 2003 2008 2012
Aging Population
Population Growth
Aging Population
Population Growth
0
70
80
100
60
50
40
30
20
10
90
0
70
80
100
60
50
40
30
20
10
90
Changes in Cancer Risk,Diagnostic Practices orTreatment
Changes in Cancer Riskor Diagnostic Practices
Figure 4.3Trends in New Cases and Deaths for All Cancers and Ages,Attributed to Cancer Rate, Population Growth and Aging Population,Males, Canada, 1983–2012
Note: New cases excludes non-melanoma skin cancer (basal and squamous). Actual incidence data wereavailable to 2009 for all provinces except Quebec (2007), and actual mortality data were available to 2007. Therange of scales differs between the figures.Analysis by: Chronic Disease Surveillance and Monitoring Division, CCDPC, Public Health Agency of Canada.Data sources: Canadian Cancer Registry, National Cancer Incidence Reporting System and Canadian VitalStatistics Death databases at Statistics Canada.
Canadian Cancer Society: Canadian Cancer Statistics 2012 35
4. TIME TRENDS IN INCIDENCE AND MORTALITY
Estimated
Incidence
MortalityDeaths (in thousands)
35
40
30
25
20
15
10
5
35
40
30
25
20
15
10
5
0
Estimated
0
Aging Population
Population Growth
(1983 cancer count)
Aging Population
Population Growth
(1983 cancer count)
0
70
80
100
60
50
40
30
20
10
90
0
70
80
100
60
50
40
30
20
10
90
New Cases (in thousands)
Changes in Cancer Risk,Diagnostic Practices orTreatment
Changes in Cancer Riskor Diagnostic Practices
1983 1988 1993 1998 2003 2008 2012
1983 1988 1993 1998 2003 2008 2012
Figure 4.4Trends in New Cases and Deaths for All Cancers and Ages,Attributed to Cancer Rate, Population Growth and Aging Population,Females, Canada, 1983–2012
Note: New cases exclude non-melanoma skin cancer (basal and squamous). Actual incidence data wereavailable to 2009 for all provinces except Quebec (2007), and actual mortality data were available to 2007. Therange of scales differs between the figures.Analysis by: Chronic Disease Surveillance and Monitoring Division, CCDPC, Public Health Agency of Canada.Data sources: Canadian Cancer Registry, National Cancer Incidence Reporting System and Canadian VitalStatistics Death databases at Statistics Canada.
36 Canadian Cancer Society: Canadian Cancer Statistics 2012
4. TIME TRENDS IN INCIDENCE AND MORTALITY
Lung
Prostate
Colorectal
Thyroid
Stomach
Non-Hodgkin Lymphoma
Larynx
Liver
0
20
40
60
80
100
120
140
0
20
40
60
80
100
120
140
0
5
10
15
20
25
30
0
5
10
15
20
25
30
Estimated
Estimated
ASIR (per 100,000)
ASIR (per 100,000)
1983 1988 1993 1998 2003 2008 2012
1983 1988 1993 1998 2003 2008 2012
Kidney
Figure 4.5Age-Standardized Incidence Rates (ASIRs) for Selected* Cancers, Males,Canada, 1983–2012
* Five most frequent cancers (both sexes combined) and cancers with a statistically significant change inincidence rate of at least 2% per year (see Table 4.5).
Note: Rates are age-standardized to the 1991 Canadian population. See Table 4.1 for data points. Actual data forincidence were available to 2009 except for Quebec (2007). The range of scales differs widely between the figures.Analysis by: Chronic Disease Surveillance and Monitoring Division, CCDPC, Public Health Agency of Canada.Data sources: Canadian Cancer Registry and National Cancer Incidence Reporting System databases atStatistics Canada.
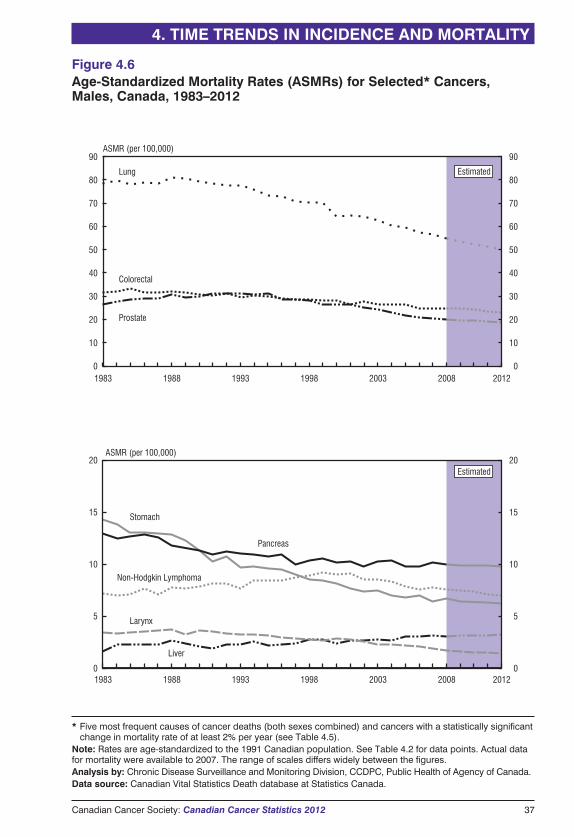
Canadian Cancer Society: Canadian Cancer Statistics 2012 37
4. TIME TRENDS IN INCIDENCE AND MORTALITY
Lung
Prostate
Colorectal
Liver
Stomach
Larynx
Non-Hodgkin Lymphoma
Estimated
Estimated
0
20
40
50
60
70
80
90
10
30
0
5
10
15
20
0
5
10
15
20
0
20
40
50
60
70
80
90
10
30
ASMR (per 100,000)
ASMR (per 100,000)
1983 1988 1993 1998 2003 2008 2012
1983 1988 1993 1998 2003 2008 2012
Pancreas
Figure 4.6Age-Standardized Mortality Rates (ASMRs) for Selected* Cancers,Males, Canada, 1983–2012
* Five most frequent causes of cancer deaths (both sexes combined) and cancers with a statistically significantchange in mortality rate of at least 2% per year (see Table 4.5).
Note: Rates are age-standardized to the 1991 Canadian population. See Table 4.2 for data points. Actual datafor mortality were available to 2007. The range of scales differs widely between the figures.Analysis by: Chronic Disease Surveillance and Monitoring Division, CCDPC, Public Health of Agency of Canada.Data source: Canadian Vital Statistics Death database at Statistics Canada.
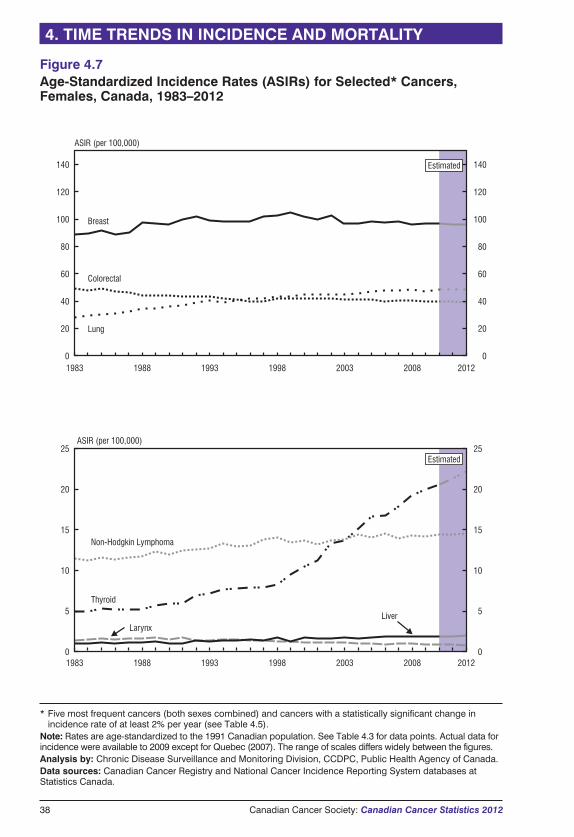
38 Canadian Cancer Society: Canadian Cancer Statistics 2012
4. TIME TRENDS IN INCIDENCE AND MORTALITY
0
20
40
60
80
100
120
140
0
20
40
60
80
100
120
140
0
5
10
15
20
25
0
5
10
15
20
25
Estimated
Estimated
Breast
Lung
Colorectal
Non-Hodgkin Lymphoma
Thyroid
Larynx
ASIR (per 100,000)
ASIR (per 100,000)
Liver
1983 1988 1993 1998 2003 2008 2012
1983 1988 1993 1998 2003 2008 2012
Figure 4.7Age-Standardized Incidence Rates (ASIRs) for Selected* Cancers,Females, Canada, 1983–2012
* Five most frequent cancers (both sexes combined) and cancers with a statistically significant change inincidence rate of at least 2% per year (see Table 4.5).
Note: Rates are age-standardized to the 1991 Canadian population. See Table 4.3 for data points. Actual data forincidence were available to 2009 except for Quebec (2007). The range of scales differs widely between the figures.Analysis by: Chronic Disease Surveillance and Monitoring Division, CCDPC, Public Health Agency of Canada.Data sources: Canadian Cancer Registry and National Cancer Incidence Reporting System databases atStatistics Canada.
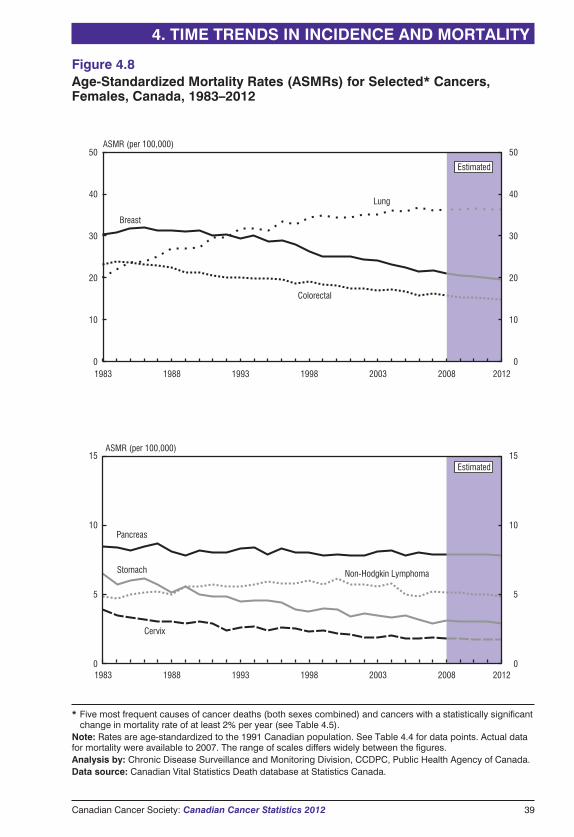
Canadian Cancer Society: Canadian Cancer Statistics 2012 39
4. TIME TRENDS IN INCIDENCE AND MORTALITY
Estimated
Estimated
0
20
40
50
10
30
0
20
40
50
10
30
0
5
10
15
0
5
10
15
Breast
Lung
Colorectal
Cervix
Stomach Non-Hodgkin Lymphoma
ASMR (per 100,000)
ASMR (per 100,000)
Pancreas
1983 1988 1993 1998 2003 2008 2012
1983 1988 1993 1998 2003 2008 2012
Figure 4.8Age-Standardized Mortality Rates (ASMRs) for Selected* Cancers,Females, Canada, 1983–2012
* Five most frequent causes of cancer deaths (both sexes combined) and cancers with a statistically significantchange in mortality rate of at least 2% per year (see Table 4.5).
Note: Rates are age-standardized to the 1991 Canadian population. See Table 4.4 for data points. Actual datafor mortality were available to 2007. The range of scales differs widely between the figures.Analysis by: Chronic Disease Surveillance and Monitoring Division, CCDPC, Public Health Agency of Canada.Data source: Canadian Vital Statistics Death database at Statistics Canada.
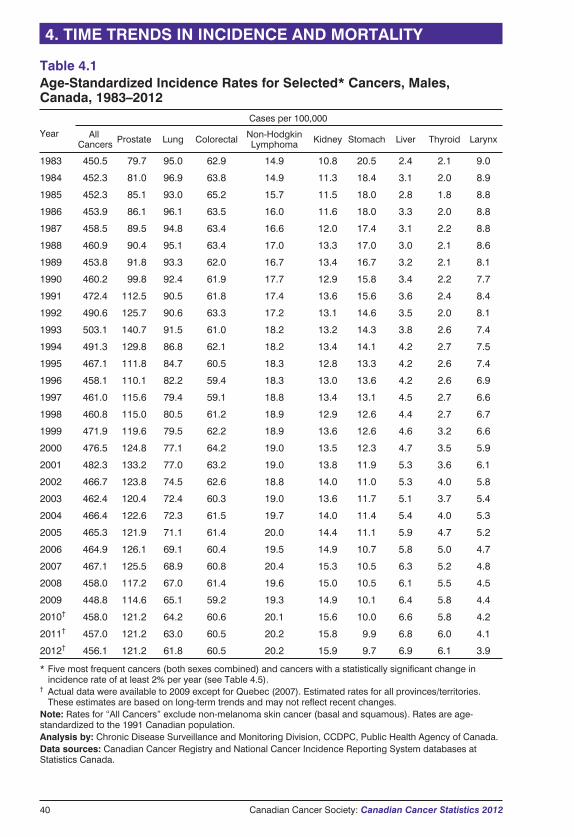
40 Canadian Cancer Society: Canadian Cancer Statistics 2012
4. TIME TRENDS IN INCIDENCE AND MORTALITY
Table 4.1Age-Standardized Incidence Rates for Selected* Cancers, Males,Canada, 1983–2012
Year
Cases per 100,000
AllCancers Prostate Lung Colorectal Non-Hodgkin
Lymphoma Kidney Stomach Liver Thyroid Larynx
1983 450.5 79.7 95.0 62.9 14.9 10.8 20.5 2.4 2.1 9.0
1984 452.3 81.0 96.9 63.8 14.9 11.3 18.4 3.1 2.0 8.9
1985 452.3 85.1 93.0 65.2 15.7 11.5 18.0 2.8 1.8 8.8
1986 453.9 86.1 96.1 63.5 16.0 11.6 18.0 3.3 2.0 8.8
1987 458.5 89.5 94.8 63.4 16.6 12.0 17.4 3.1 2.2 8.8
1988 460.9 90.4 95.1 63.4 17.0 13.3 17.0 3.0 2.1 8.6
1989 453.8 91.8 93.3 62.0 16.7 13.4 16.7 3.2 2.1 8.1
1990 460.2 99.8 92.4 61.9 17.7 12.9 15.8 3.4 2.2 7.7
1991 472.4 112.5 90.5 61.8 17.4 13.6 15.6 3.6 2.4 8.4
1992 490.6 125.7 90.6 63.3 17.2 13.1 14.6 3.5 2.0 8.1
1993 503.1 140.7 91.5 61.0 18.2 13.2 14.3 3.8 2.6 7.4
1994 491.3 129.8 86.8 62.1 18.2 13.4 14.1 4.2 2.7 7.5
1995 467.1 111.8 84.7 60.5 18.3 12.8 13.3 4.2 2.6 7.4
1996 458.1 110.1 82.2 59.4 18.3 13.0 13.6 4.2 2.6 6.9
1997 461.0 115.6 79.4 59.1 18.8 13.4 13.1 4.5 2.7 6.6
1998 460.8 115.0 80.5 61.2 18.9 12.9 12.6 4.4 2.7 6.7
1999 471.9 119.6 79.5 62.2 18.9 13.6 12.6 4.6 3.2 6.6
2000 476.5 124.8 77.1 64.2 19.0 13.5 12.3 4.7 3.5 5.9
2001 482.3 133.2 77.0 63.2 19.0 13.8 11.9 5.3 3.6 6.1
2002 466.7 123.8 74.5 62.6 18.8 14.0 11.0 5.3 4.0 5.8
2003 462.4 120.4 72.4 60.3 19.0 13.6 11.7 5.1 3.7 5.4
2004 466.4 122.6 72.3 61.5 19.7 14.0 11.4 5.4 4.0 5.3
2005 465.3 121.9 71.1 61.4 20.0 14.4 11.1 5.9 4.7 5.2
2006 464.9 126.1 69.1 60.4 19.5 14.9 10.7 5.8 5.0 4.7
2007 467.1 125.5 68.9 60.8 20.4 15.3 10.5 6.3 5.2 4.8
2008 458.0 117.2 67.0 61.4 19.6 15.0 10.5 6.1 5.5 4.5
2009 448.8 114.6 65.1 59.2 19.3 14.9 10.1 6.4 5.8 4.4
2010† 458.0 121.2 64.2 60.6 20.1 15.6 10.0 6.6 5.8 4.2
2011† 457.0 121.2 63.0 60.5 20.2 15.8 9.9 6.8 6.0 4.1
2012† 456.1 121.2 61.8 60.5 20.2 15.9 9.7 6.9 6.1 3.9
* Five most frequent cancers (both sexes combined) and cancers with a statistically significant change inincidence rate of at least 2% per year (see Table 4.5).
† Actual data were available to 2009 except for Quebec (2007). Estimated rates for all provinces/territories.These estimates are based on long-term trends and may not reflect recent changes.
Note: Rates for “All Cancers” exclude non-melanoma skin cancer (basal and squamous). Rates are age-standardized to the 1991 Canadian population.Analysis by: Chronic Disease Surveillance and Monitoring Division, CCDPC, Public Health Agency of Canada.Data sources: Canadian Cancer Registry and National Cancer Incidence Reporting System databases atStatistics Canada.
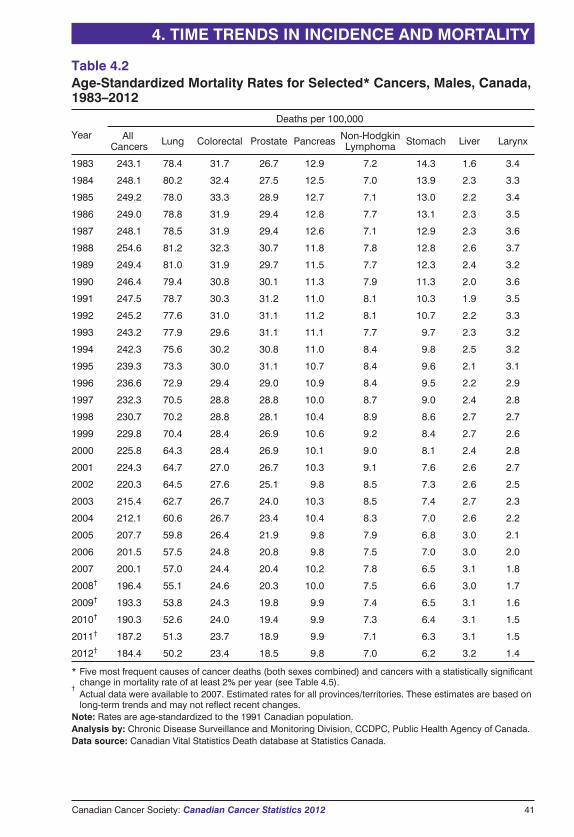
4. TIME TRENDS IN INCIDENCE AND MORTALITY
Canadian Cancer Society: Canadian Cancer Statistics 2012 41
Table 4.2Age-Standardized Mortality Rates for Selected* Cancers, Males, Canada,1983–2012
Year
Deaths per 100,000
AllCancers Lung Colorectal Prostate Pancreas Non-Hodgkin
Lymphoma Stomach Liver Larynx
1983 243.1 78.4 31.7 26.7 12.9 7.2 14.3 1.6 3.4
1984 248.1 80.2 32.4 27.5 12.5 7.0 13.9 2.3 3.3
1985 249.2 78.0 33.3 28.9 12.7 7.1 13.0 2.2 3.4
1986 249.0 78.8 31.9 29.4 12.8 7.7 13.1 2.3 3.5
1987 248.1 78.5 31.9 29.4 12.6 7.1 12.9 2.3 3.6
1988 254.6 81.2 32.3 30.7 11.8 7.8 12.8 2.6 3.7
1989 249.4 81.0 31.9 29.7 11.5 7.7 12.3 2.4 3.2
1990 246.4 79.4 30.8 30.1 11.3 7.9 11.3 2.0 3.6
1991 247.5 78.7 30.3 31.2 11.0 8.1 10.3 1.9 3.5
1992 245.2 77.6 31.0 31.1 11.2 8.1 10.7 2.2 3.3
1993 243.2 77.9 29.6 31.1 11.1 7.7 9.7 2.3 3.2
1994 242.3 75.6 30.2 30.8 11.0 8.4 9.8 2.5 3.2
1995 239.3 73.3 30.0 31.1 10.7 8.4 9.6 2.1 3.1
1996 236.6 72.9 29.4 29.0 10.9 8.4 9.5 2.2 2.9
1997 232.3 70.5 28.8 28.8 10.0 8.7 9.0 2.4 2.8
1998 230.7 70.2 28.8 28.1 10.4 8.9 8.6 2.7 2.7
1999 229.8 70.4 28.4 26.9 10.6 9.2 8.4 2.7 2.6
2000 225.8 64.3 28.4 26.9 10.1 9.0 8.1 2.4 2.8
2001 224.3 64.7 27.0 26.7 10.3 9.1 7.6 2.6 2.7
2002 220.3 64.5 27.6 25.1 9.8 8.5 7.3 2.6 2.5
2003 215.4 62.7 26.7 24.0 10.3 8.5 7.4 2.7 2.3
2004 212.1 60.6 26.7 23.4 10.4 8.3 7.0 2.6 2.2
2005 207.7 59.8 26.4 21.9 9.8 7.9 6.8 3.0 2.1
2006 201.5 57.5 24.8 20.8 9.8 7.5 7.0 3.0 2.0
2007 200.1 57.0 24.4 20.4 10.2 7.8 6.5 3.1 1.8
2008† 196.4 55.1 24.6 20.3 10.0 7.5 6.6 3.0 1.7
2009† 193.3 53.8 24.3 19.8 9.9 7.4 6.5 3.1 1.6
2010† 190.3 52.6 24.0 19.4 9.9 7.3 6.4 3.1 1.5
2011† 187.2 51.3 23.7 18.9 9.9 7.1 6.3 3.1 1.5
2012† 184.4 50.2 23.4 18.5 9.8 7.0 6.2 3.2 1.4
* Five most frequent causes of cancer deaths (both sexes combined) and cancers with a statistically significantchange in mortality rate of at least 2% per year (see Table 4.5).
†Actual data were available to 2007. Estimated rates for all provinces/territories. These estimates are based onlong-term trends and may not reflect recent changes.
Note: Rates are age-standardized to the 1991 Canadian population.Analysis by: Chronic Disease Surveillance and Monitoring Division, CCDPC, Public Health Agency of Canada.Data source: Canadian Vital Statistics Death database at Statistics Canada.
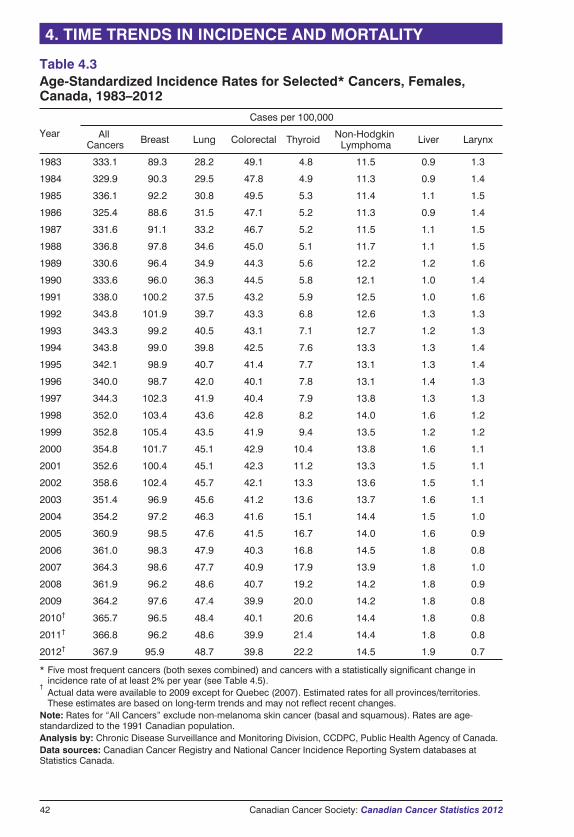
42 Canadian Cancer Society: Canadian Cancer Statistics 2012
4. TIME TRENDS IN INCIDENCE AND MORTALITY
Table 4.3Age-Standardized Incidence Rates for Selected* Cancers, Females,Canada, 1983–2012
Year
Cases per 100,000
AllCancers Breast Lung Colorectal Thyroid Non-Hodgkin
Lymphoma Liver Larynx
1983 333.1 89.3 28.2 49.1 4.8 11.5 0.9 1.3
1984 329.9 90.3 29.5 47.8 4.9 11.3 0.9 1.4
1985 336.1 92.2 30.8 49.5 5.3 11.4 1.1 1.5
1986 325.4 88.6 31.5 47.1 5.2 11.3 0.9 1.4
1987 331.6 91.1 33.2 46.7 5.2 11.5 1.1 1.5
1988 336.8 97.8 34.6 45.0 5.1 11.7 1.1 1.5
1989 330.6 96.4 34.9 44.3 5.6 12.2 1.2 1.6
1990 333.6 96.0 36.3 44.5 5.8 12.1 1.0 1.4
1991 338.0 100.2 37.5 43.2 5.9 12.5 1.0 1.6
1992 343.8 101.9 39.7 43.3 6.8 12.6 1.3 1.3
1993 343.3 99.2 40.5 43.1 7.1 12.7 1.2 1.3
1994 343.8 99.0 39.8 42.5 7.6 13.3 1.3 1.4
1995 342.1 98.9 40.7 41.4 7.7 13.1 1.3 1.4
1996 340.0 98.7 42.0 40.1 7.8 13.1 1.4 1.3
1997 344.3 102.3 41.9 40.4 7.9 13.8 1.3 1.3
1998 352.0 103.4 43.6 42.8 8.2 14.0 1.6 1.2
1999 352.8 105.4 43.5 41.9 9.4 13.5 1.2 1.2
2000 354.8 101.7 45.1 42.9 10.4 13.8 1.6 1.1
2001 352.6 100.4 45.1 42.3 11.2 13.3 1.5 1.1
2002 358.6 102.4 45.7 42.1 13.3 13.6 1.5 1.1
2003 351.4 96.9 45.6 41.2 13.6 13.7 1.6 1.1
2004 354.2 97.2 46.3 41.6 15.1 14.4 1.5 1.0
2005 360.9 98.5 47.6 41.5 16.7 14.0 1.6 0.9
2006 361.0 98.3 47.9 40.3 16.8 14.5 1.8 0.8
2007 364.3 98.6 47.7 40.9 17.9 13.9 1.8 1.0
2008 361.9 96.2 48.6 40.7 19.2 14.2 1.8 0.9
2009 364.2 97.6 47.4 39.9 20.0 14.2 1.8 0.8
2010† 365.7 96.5 48.4 40.1 20.6 14.4 1.8 0.8
2011† 366.8 96.2 48.6 39.9 21.4 14.4 1.8 0.8
2012† 367.9 95.9 48.7 39.8 22.2 14.5 1.9 0.7
* Five most frequent cancers (both sexes combined) and cancers with a statistically significant change inincidence rate of at least 2% per year (see Table 4.5).
†Actual data were available to 2009 except for Quebec (2007). Estimated rates for all provinces/territories.These estimates are based on long-term trends and may not reflect recent changes.
Note: Rates for “All Cancers” exclude non-melanoma skin cancer (basal and squamous). Rates are age-standardized to the 1991 Canadian population.Analysis by: Chronic Disease Surveillance and Monitoring Division, CCDPC, Public Health Agency of Canada.Data sources: Canadian Cancer Registry and National Cancer Incidence Reporting System databases atStatistics Canada.
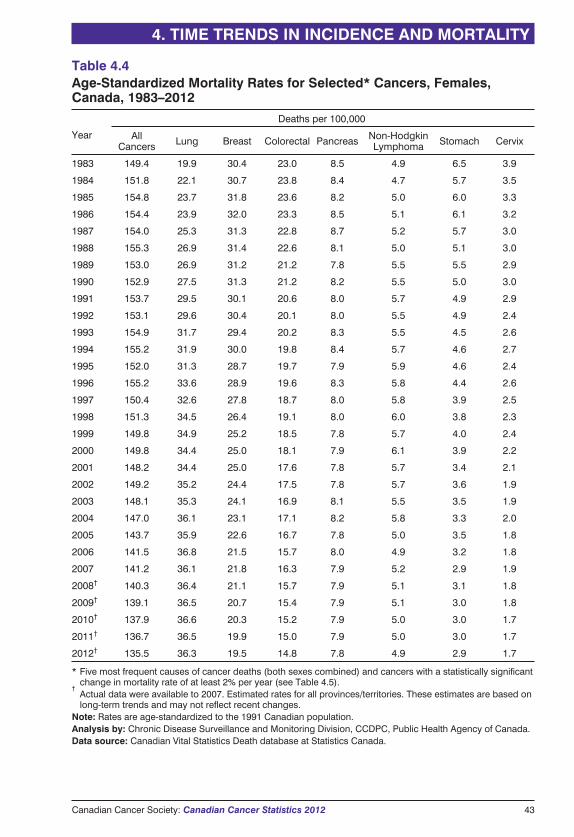
4. TIME TRENDS IN INCIDENCE AND MORTALITY
Canadian Cancer Society: Canadian Cancer Statistics 2012 43
Table 4.4Age-Standardized Mortality Rates for Selected* Cancers, Females,Canada, 1983–2012
Year
Deaths per 100,000
AllCancers Lung Breast Colorectal Pancreas Non-Hodgkin
Lymphoma Stomach Cervix
1983 149.4 19.9 30.4 23.0 8.5 4.9 6.5 3.9
1984 151.8 22.1 30.7 23.8 8.4 4.7 5.7 3.5
1985 154.8 23.7 31.8 23.6 8.2 5.0 6.0 3.3
1986 154.4 23.9 32.0 23.3 8.5 5.1 6.1 3.2
1987 154.0 25.3 31.3 22.8 8.7 5.2 5.7 3.0
1988 155.3 26.9 31.4 22.6 8.1 5.0 5.1 3.0
1989 153.0 26.9 31.2 21.2 7.8 5.5 5.5 2.9
1990 152.9 27.5 31.3 21.2 8.2 5.5 5.0 3.0
1991 153.7 29.5 30.1 20.6 8.0 5.7 4.9 2.9
1992 153.1 29.6 30.4 20.1 8.0 5.5 4.9 2.4
1993 154.9 31.7 29.4 20.2 8.3 5.5 4.5 2.6
1994 155.2 31.9 30.0 19.8 8.4 5.7 4.6 2.7
1995 152.0 31.3 28.7 19.7 7.9 5.9 4.6 2.4
1996 155.2 33.6 28.9 19.6 8.3 5.8 4.4 2.6
1997 150.4 32.6 27.8 18.7 8.0 5.8 3.9 2.5
1998 151.3 34.5 26.4 19.1 8.0 6.0 3.8 2.3
1999 149.8 34.9 25.2 18.5 7.8 5.7 4.0 2.4
2000 149.8 34.4 25.0 18.1 7.9 6.1 3.9 2.2
2001 148.2 34.4 25.0 17.6 7.8 5.7 3.4 2.1
2002 149.2 35.2 24.4 17.5 7.8 5.7 3.6 1.9
2003 148.1 35.3 24.1 16.9 8.1 5.5 3.5 1.9
2004 147.0 36.1 23.1 17.1 8.2 5.8 3.3 2.0
2005 143.7 35.9 22.6 16.7 7.8 5.0 3.5 1.8
2006 141.5 36.8 21.5 15.7 8.0 4.9 3.2 1.8
2007 141.2 36.1 21.8 16.3 7.9 5.2 2.9 1.9
2008† 140.3 36.4 21.1 15.7 7.9 5.1 3.1 1.8
2009† 139.1 36.5 20.7 15.4 7.9 5.1 3.0 1.8
2010† 137.9 36.6 20.3 15.2 7.9 5.0 3.0 1.7
2011† 136.7 36.5 19.9 15.0 7.9 5.0 3.0 1.7
2012† 135.5 36.3 19.5 14.8 7.8 4.9 2.9 1.7
* Five most frequent causes of cancer deaths (both sexes combined) and cancers with a statistically significantchange in mortality rate of at least 2% per year (see Table 4.5).
†Actual data were available to 2007. Estimated rates for all provinces/territories. These estimates are based onlong-term trends and may not reflect recent changes.
Note: Rates are age-standardized to the 1991 Canadian population.Analysis by: Chronic Disease Surveillance and Monitoring Division, CCDPC, Public Health Agency of Canada.Data source: Canadian Vital Statistics Death database at Statistics Canada.
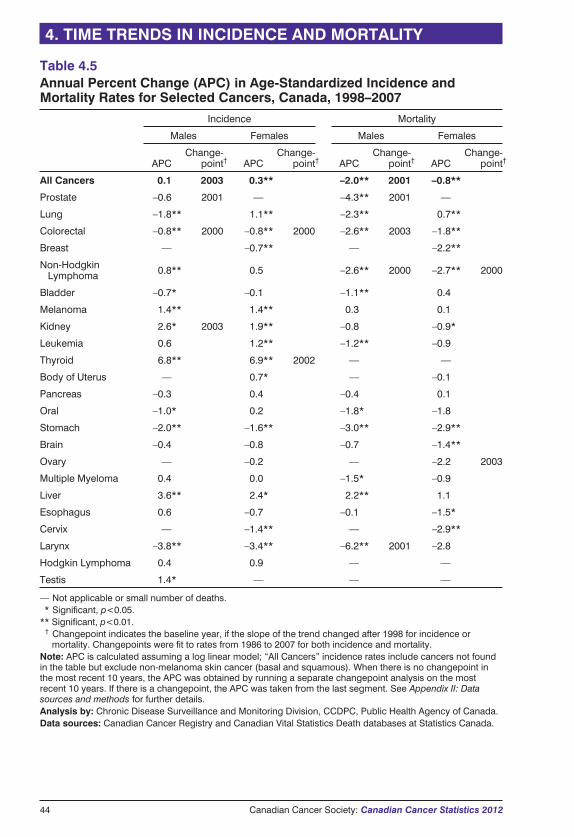
44 Canadian Cancer Society: Canadian Cancer Statistics 2012
4. TIME TRENDS IN INCIDENCE AND MORTALITY
Table 4.5Annual Percent Change (APC) in Age-Standardized Incidence andMortality Rates for Selected Cancers, Canada, 1998–2007
Incidence Mortality
Males Females Males Females
APCChange-
point† APCChange-
point† APCChange-
point† APCChange-
point†
All Cancers 0.1 2003 0.3** –2.0** 2001 –0.8**
Prostate –0.6 2001 — –4.3** 2001 —
Lung –1.8** 1.1** –2.3** 0.7**
Colorectal –0.8** 2000 –0.8** 2000 –2.6** 2003 –1.8**
Breast — –0.7** — –2.2**
Non-HodgkinLymphoma 0.8** 0.5 –2.6** 2000 –2.7** 2000
Bladder –0.7* –0.1 –1.1** 0.4
Melanoma 1.4** 1.4** 0.3 0.1
Kidney 2.6* 2003 1.9** –0.8 –0.9*
Leukemia 0.6 1.2** –1.2** –0.9
Thyroid 6.8** 6.9** 2002 — —
Body of Uterus — 0.7* — –0.1
Pancreas –0.3 0.4 –0.4 0.1
Oral –1.0* 0.2 –1.8* –1.8
Stomach –2.0** –1.6** –3.0** –2.9**
Brain –0.4 –0.8 –0.7 –1.4**
Ovary — –0.2 — –2.2 2003
Multiple Myeloma 0.4 0.0 –1.5* –0.9
Liver 3.6** 2.4* 2.2** 1.1
Esophagus 0.6 –0.7 –0.1 –1.5*
Cervix — –1.4** — –2.9**
Larynx –3.8** –3.4** –6.2** 2001 –2.8
Hodgkin Lymphoma 0.4 0.9 — —
Testis 1.4* — — —
— Not applicable or small number of deaths.** Significant, p<0.05.** Significant, p<0.01.*† Changepoint indicates the baseline year, if the slope of the trend changed after 1998 for incidence or
mortality. Changepoints were fit to rates from 1986 to 2007 for both incidence and mortality.Note: APC is calculated assuming a log linear model; “All Cancers” incidence rates include cancers not foundin the table but exclude non-melanoma skin cancer (basal and squamous). When there is no changepoint inthe most recent 10 years, the APC was obtained by running a separate changepoint analysis on the mostrecent 10 years. If there is a changepoint, the APC was taken from the last segment. See Appendix II: Datasources and methods for further details.Analysis by: Chronic Disease Surveillance and Monitoring Division, CCDPC, Public Health Agency of Canada.Data sources: Canadian Cancer Registry and Canadian Vital Statistics Death databases at Statistics Canada.
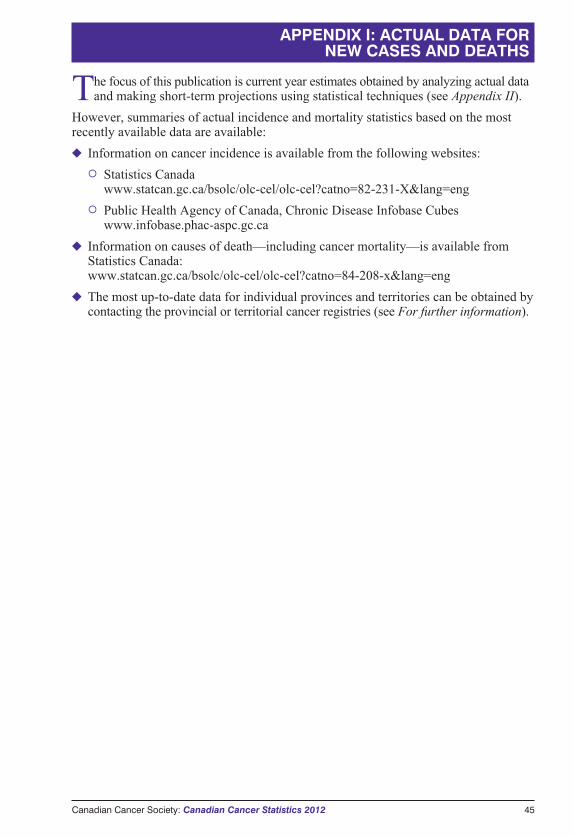
Canadian Cancer Society: Canadian Cancer Statistics 2012 45
The focus of this publication is current year estimates obtained by analyzing actual dataand making short-term projections using statistical techniques (see Appendix II).
However, summaries of actual incidence and mortality statistics based on the mostrecently available data are available:
� Information on cancer incidence is available from the following websites:
� Statistics Canadawww.statcan.gc.ca/bsolc/olc-cel/olc-cel?catno=82-231-X&lang=eng
� Public Health Agency of Canada, Chronic Disease Infobase Cubeswww.infobase.phac-aspc.gc.ca
� Information on causes of death—including cancer mortality—is available fromStatistics Canada:www.statcan.gc.ca/bsolc/olc-cel/olc-cel?catno=84-208-x&lang=eng
� The most up-to-date data for individual provinces and territories can be obtained bycontacting the provincial or territorial cancer registries (see For further information).
APPENDIX I: ACTUAL DATA FORNEW CASES AND DEATHS
46 Canadian Cancer Society: Canadian Cancer Statistics 2012
DATA SOURCES
Incidence data: The Canadian Cancer Registry (CCR)Actual cancer incidence data used in this publication cover the period of 1983 to 2009(except for Quebec, for which data in the CCR were available to 2007 in time for thispublication). Data for 1992 to 2009 were obtained from the CCR,20 while data forearlier years were retrieved from its predecessor, the National Cancer IncidenceReporting System (NCIRS). The NCIRS is a fixed, tumour-oriented databasecontaining cases diagnosed as far back as 1969.
� Incidence data originate with the provincial and territorial cancer registries, whichprovide data annually to Statistics Canada for inclusion in the CCR.
� The CCR is a person-oriented database that includes clinical and demographicinformation about residents of Canada newly diagnosed with cancer.
� The Health Statistics Division at Statistics Canada maintains the CCR, includinglinking data internally to track people with tumours diagnosed in more than oneprovince or territory and to identify duplicates. Incidence records are also linkedwith the mortality data (described below) for the purposes of survival andprevalence analyses.
� Cancer diagnoses are classified according to the International Classification ofDiseases for Oncology, Third Edition (ICD-O-3).21
Mortality data: the Canadian Vital Statistics – Death Database (CVS: D)� The actual cancer mortality data cover the period of 1983 to 2007 and were
obtained from the CVS: D.22
� Death records originate with the provincial and territorial registrars of vitalstatistics and are provided regularly to Statistics Canada for inclusion in the CVS: D.
� The CVS: D includes demographic and cause of death information for all deaths inCanada from 1921 onward.
� Data are also included for Canadian residents who died in some states of theUnited States. Canada currently receives abstracted death data from approximately10 states.
� The Health Statistics Division at Statistics Canada maintains the CVS: D.
� Cause of death is classified according to the International Statistical Classificationof Diseases and Related Health Problems, Tenth Revision (ICD-10).23
� Cancer deaths are those for which some form of cancer, as certified by a physician,is the underlying cause of death.
Population data: The Census of Canada� Population estimates for Canada and the provinces and territories are based on
censuses conducted every five years from 1981 through to 2006.
� Intercensal estimates prepared by Statistics Canada are used for the years betweenthese censuses, and postcensal estimates are used for 2006 to 2010.3
� Projected population estimates are used for 2011 and 2012, as prepared byStatistics Canada under assumptions of medium growth (scenario M1).2 The
APPENDIX II: DATA SOURCES AND METHODS
Canadian Cancer Society: Canadian Cancer Statistics 2012 47
scenario M1 incorporates medium-growth and historical trends (1981–2008) ofinterprovincial migration.
� All population estimates include non-permanent residents and are adjusted for netcensus under-coverage and Canadians returning from abroad.
Cancer definitions� Cancers are generally defined according to the groupings of ICD-O-3 for incidence
and ICD-10 for mortality, as indicated in Table A1.
� Some definitions have changed slightly over time; changes occurring since the2004 edition of this publication are outlined in Table A2.
METHODSIncidence and mortality ratesRecords from each province or territory were extracted from the relevant incidence ormortality files and then classified by year of diagnosis or death and by sex, five-yearage group (0–4, 5–9, …, 80–84 and 85+ years) and cancer type.
� Rates for each category were calculated by dividing the number of cases or deathsin each category (i.e., province/territory, year, sex, age group, cancer type) by thecorresponding provincial or territorial population figure. These formed the basis forcalculations of age-standardized rates and for estimates beyond the most recentyear of actual data.
� For the section Incidence and mortality by age and sex, age-specific rates werecomputed for broader age groups (0–19, 20–29, …, 70–79 and 80+ years) in thesame way.
� Age-standardized incidence rates (ASIRs) and mortality rates (ASMRs) werecalculated using the direct method, which involves weighting the age-specific ratesfor each five-year age group according to the age distribution of the 1991 Canadianpopulation (see Glossary).
Estimation of incidence (new cases) and mortality (deaths) for 2012Two methods were used to estimate incidence and mortality data: the NordpredPower5 regression model and five-year averaging.
Nordpred Power5 modellingThe Nordpred Power5 regression model was the primary method for estimating thenumber of new cases and deaths in 2012 for each cancer type by sex (except newcases of non-melanoma skin cancer; see Non-melanoma skin cancer incidence below)reported in Tables 1.1 and 1.2. Nordpred is based on an age-period-cohort Poissonregression model but has enhancements that overcome difficulties in the standardPoisson model and improve projection accuracy.24 Nordpred was developed into asoftware package25 and is now one of the most frequently used methods for cancerprojections worldwide.26–30
The Nordpred Power5 model was used when the average annual number of cases for asite for the most recent five years was greater than 50. The assumption underlying theNordpred Power5 regression model is that the annual number of new cases and deathsare independent Poisson random variables with mean values equal to the product ofthe population size for a particular year and the (true) annual rate.
APPENDIX II: DATA SOURCES AND METHODS
48 Canadian Cancer Society: Canadian Cancer Statistics 2012
� A separate Nordpred Power5 regression model was fit for each province, sex andtype of cancer for the period of 1985 to 2009 (1983–2007 for Quebec) forincidence and 1983 to 2007 for mortality.
� The Power5 model is Rap = (Aa + D·p + Pp + Cc)5 where a, p and c represent age,
period and cohort, respectively, in five-year groups. Input data were aggregatedinto five-year calendar periods and 18 five-year age groups (described above);cohorts were created synthetically by subtracting age from period. Rap is theincidence/mortality rate in age group a in calendar period p, Aa is the agecomponent for age group a, D is the common drift parameter that summarizes thelinear component of the trend that cannot be attributed to either period or cohort.31
Pp is the nonlinear period component of period p, and Cc is the nonlinear cohortcomponent of cohort c.
� Nordpred uses a goodness of fit test to choose the number of five-year periods to beincluded in the dataset used for calculating future values (projection base).
� The software determines whether the average trend across all observed values, orthe slope for the last 10 years of observed values is used for projection, based on asignificance, test for departure from linear trend. This approach serves as anapproximate way of looking for significant changes in the observed trend. You canalso choose between using the average trend or the trend for the last 10 years foryour projection by specifying the value for the “recent” option.
� For each age group, a minimum of five cases in each five-year period was required;for age groups below this limit, the average number of cases in the last two periodsis used to calculate future rates.
� To allow for a damping of the impact of current trends in the future time periods, a“cut-trend” option is used, which is a vector of proportions indicating how much tocut the trend estimate for each five-year projection period. A gradual reduction inthe drift parameter of 25% and 50% in the second and third five-year period,respectively, was used as the default in this publication.
� Age was included in all models as a factor. Age-specific incidence rate trends werethen extrapolated to 2012. The predicted numbers of cancer cases in 2012 werecalculated by multiplying these extrapolated incidence rates by the sex-, age- andprovince-specific population projections for the same year.
� The Nordpred “recent” and “cut-trend” options were modified from the defaultvalues for selected sites, including thyroid cancer incidence and prostate cancermortality, since recent trends are not expected to continue with as large an annualpercent change. The values were chosen so that estimates were consistent with themost recent data available to the provincial cancer registries.
Five-year averagingNew cases and deaths in 2012 for each type of cancer were also estimated based onthe average of the five most recent years of data. This method may be more realisticfor cancers for which there are recent changes in trend (the Nordpred Power5 modelresults in poor estimates for these cancers because it is based on a medium or longerterm trend) or when frequencies are low and result in unstable estimates using theNordpred model. The average of rates for the most recent five years was calculated foreach sex, five-year age group, cancer type and province. The predicted numbers were
APPENDIX II: DATA SOURCES AND METHODS

Canadian Cancer Society: Canadian Cancer Statistics 2012 49
then obtained by multiplying these rates by the corresponding projected populationsizes.
The five-year average was used for prostate cancer incidence because of recent age-specific changes in trend.
Selection of “best” estimatesEstimates from the two methods were compared for each sex, cancer type andgeographic region for all ages combined. The “best” estimate for each category wasselected in consultation with individual provincial or territorial cancer registries,according to the following guidelines:
� The Nordpred model was preferred except when frequencies were low.
� Five-year average estimates were used when the average annual number of casesduring the most recent five years was less than or equal to 50.
� Five-year average estimates were used for the territories and are reported only for“All Cancers” because of small sample sizes.
� The absolute value of the difference between the age-standardized rates estimatedby the two methods was calculated and expressed relative to the five-year averageestimate. For example, if the Nordpred Power5 model estimated a rate of 4.0 andthe five-year average estimated a rate of 4.5, the relative difference would be(4.0 – 4.5) ÷ 4.5, or 11.1%.
� Provinces closely examined estimates for cancers where the absolute value of therelative difference exceeded 15%. Such situations may be indicative of importantdeviations from the long-term trend.
� Provinces provided feedback based on the availability of in-house projections,knowledge of local trends or access to more current data, which permitted anassessment of the estimates produced by the two different estimation methods.
� Estimates for Canada as a whole were computed as the sum of the estimates for theindividual provinces and territories.
Tables A3 and A4 indicate the cancer types that were reported according to the five-year average method for 2012. In these situations, the age-standardized rates for 2012reported in this publication were calculated using the most recent five years of actualdata.
All cancers combinedProvincial estimates of incidence counts for “All Cancers” for males were computedas the sum of the “best” estimates for prostate cancer and all cancers excludingprostate, as estimated by Poisson modelling.
Non-melanoma skin cancer incidenceOnly a few provinces routinely collect data on the incidence of basal and squamouscell carcinoma of the skin (generally referred to as non-melanoma skin cancer, orNMSC). The numbers of NMSC in all of Canada, by sex, were estimated using thesedata.
� Pathology laboratories in British Columbia send all diagnostic reports of NMSC tothe provincial registry. The age- and sex-specific incidence rates in British
APPENDIX II: DATA SOURCES AND METHODS
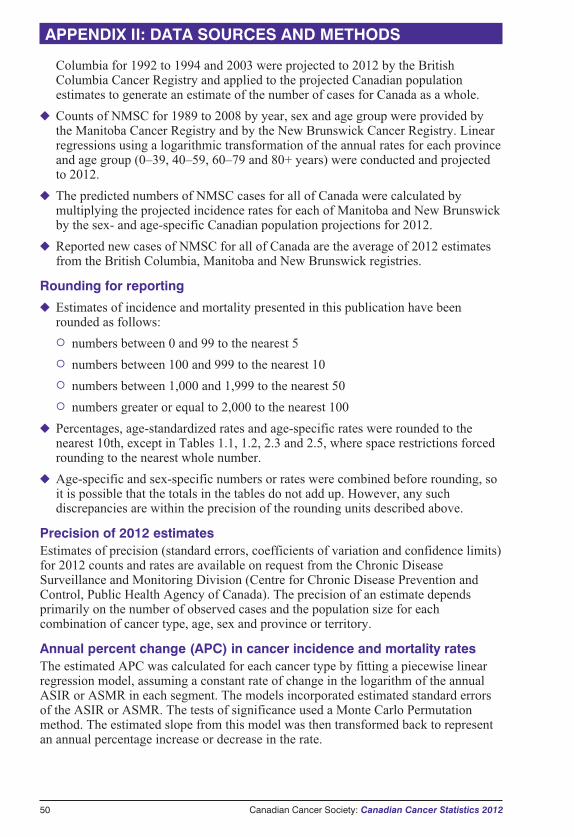
Columbia for 1992 to 1994 and 2003 were projected to 2012 by the BritishColumbia Cancer Registry and applied to the projected Canadian populationestimates to generate an estimate of the number of cases for Canada as a whole.
� Counts of NMSC for 1989 to 2008 by year, sex and age group were provided bythe Manitoba Cancer Registry and by the New Brunswick Cancer Registry. Linearregressions using a logarithmic transformation of the annual rates for each provinceand age group (0–39, 40–59, 60–79 and 80+ years) were conducted and projectedto 2012.
� The predicted numbers of NMSC cases for all of Canada were calculated bymultiplying the projected incidence rates for each of Manitoba and New Brunswickby the sex- and age-specific Canadian population projections for 2012.
� Reported new cases of NMSC for all of Canada are the average of 2012 estimatesfrom the British Columbia, Manitoba and New Brunswick registries.
Rounding for reporting� Estimates of incidence and mortality presented in this publication have been
rounded as follows:
� numbers between 0 and 99 to the nearest 5
� numbers between 100 and 999 to the nearest 10
� numbers between 1,000 and 1,999 to the nearest 50
� numbers greater or equal to 2,000 to the nearest 100
� Percentages, age-standardized rates and age-specific rates were rounded to thenearest 10th, except in Tables 1.1, 1.2, 2.3 and 2.5, where space restrictions forcedrounding to the nearest whole number.
� Age-specific and sex-specific numbers or rates were combined before rounding, soit is possible that the totals in the tables do not add up. However, any suchdiscrepancies are within the precision of the rounding units described above.
Precision of 2012 estimatesEstimates of precision (standard errors, coefficients of variation and confidence limits)for 2012 counts and rates are available on request from the Chronic DiseaseSurveillance and Monitoring Division (Centre for Chronic Disease Prevention andControl, Public Health Agency of Canada). The precision of an estimate dependsprimarily on the number of observed cases and the population size for eachcombination of cancer type, age, sex and province or territory.
Annual percent change (APC) in cancer incidence and mortality ratesThe estimated APC was calculated for each cancer type by fitting a piecewise linearregression model, assuming a constant rate of change in the logarithm of the annualASIR or ASMR in each segment. The models incorporated estimated standard errorsof the ASIR or ASMR. The tests of significance used a Monte Carlo Permutationmethod. The estimated slope from this model was then transformed back to representan annual percentage increase or decrease in the rate.
50 Canadian Cancer Society: Canadian Cancer Statistics 2012
APPENDIX II: DATA SOURCES AND METHODS
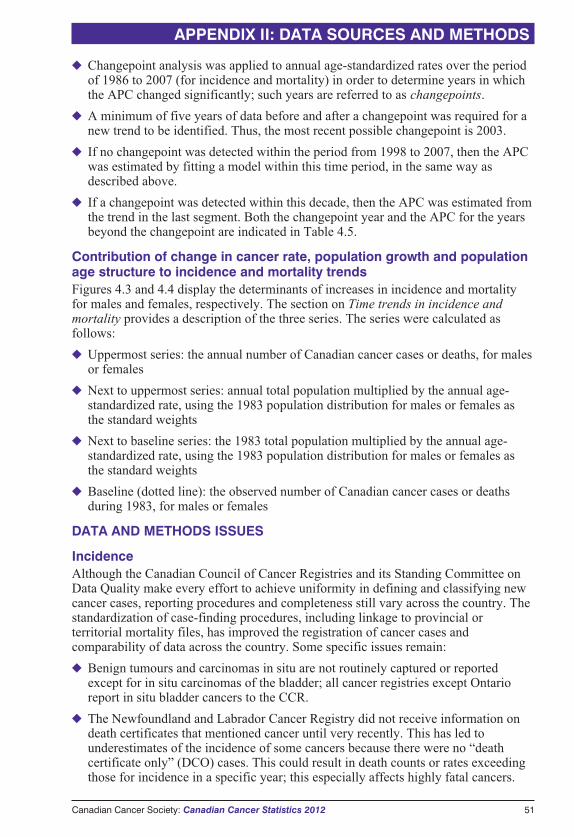
� Changepoint analysis was applied to annual age-standardized rates over the periodof 1986 to 2007 (for incidence and mortality) in order to determine years in whichthe APC changed significantly; such years are referred to as changepoints.
� A minimum of five years of data before and after a changepoint was required for anew trend to be identified. Thus, the most recent possible changepoint is 2003.
� If no changepoint was detected within the period from 1998 to 2007, then the APCwas estimated by fitting a model within this time period, in the same way asdescribed above.
� If a changepoint was detected within this decade, then the APC was estimated fromthe trend in the last segment. Both the changepoint year and the APC for the yearsbeyond the changepoint are indicated in Table 4.5.
Contribution of change in cancer rate, population growth and populationage structure to incidence and mortality trendsFigures 4.3 and 4.4 display the determinants of increases in incidence and mortalityfor males and females, respectively. The section on Time trends in incidence andmortality provides a description of the three series. The series were calculated asfollows:
� Uppermost series: the annual number of Canadian cancer cases or deaths, for malesor females
� Next to uppermost series: annual total population multiplied by the annual age-standardized rate, using the 1983 population distribution for males or females asthe standard weights
� Next to baseline series: the 1983 total population multiplied by the annual age-standardized rate, using the 1983 population distribution for males or females asthe standard weights
� Baseline (dotted line): the observed number of Canadian cancer cases or deathsduring 1983, for males or females
DATA AND METHODS ISSUES
IncidenceAlthough the Canadian Council of Cancer Registries and its Standing Committee onData Quality make every effort to achieve uniformity in defining and classifying newcancer cases, reporting procedures and completeness still vary across the country. Thestandardization of case-finding procedures, including linkage to provincial orterritorial mortality files, has improved the registration of cancer cases andcomparability of data across the country. Some specific issues remain:
� Benign tumours and carcinomas in situ are not routinely captured or reportedexcept for in situ carcinomas of the bladder; all cancer registries except Ontarioreport in situ bladder cancers to the CCR.
� The Newfoundland and Labrador Cancer Registry did not receive information ondeath certificates that mentioned cancer until very recently. This has led tounderestimates of the incidence of some cancers because there were no “deathcertificate only” (DCO) cases. This could result in death counts or rates exceedingthose for incidence in a specific year; this especially affects highly fatal cancers.
APPENDIX II: DATA SOURCES AND METHODS
Canadian Cancer Society: Canadian Cancer Statistics 2012 51
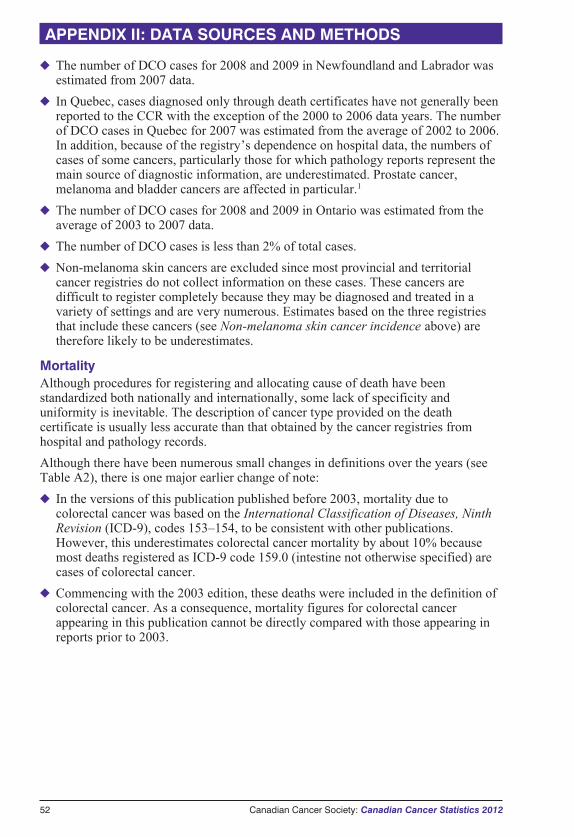
� The number of DCO cases for 2008 and 2009 in Newfoundland and Labrador wasestimated from 2007 data.
� In Quebec, cases diagnosed only through death certificates have not generally beenreported to the CCR with the exception of the 2000 to 2006 data years. The numberof DCO cases in Quebec for 2007 was estimated from the average of 2002 to 2006.In addition, because of the registry’s dependence on hospital data, the numbers ofcases of some cancers, particularly those for which pathology reports represent themain source of diagnostic information, are underestimated. Prostate cancer,melanoma and bladder cancers are affected in particular.1
� The number of DCO cases for 2008 and 2009 in Ontario was estimated from theaverage of 2003 to 2007 data.
� The number of DCO cases is less than 2% of total cases.
� Non-melanoma skin cancers are excluded since most provincial and territorialcancer registries do not collect information on these cases. These cancers aredifficult to register completely because they may be diagnosed and treated in avariety of settings and are very numerous. Estimates based on the three registriesthat include these cancers (see Non-melanoma skin cancer incidence above) aretherefore likely to be underestimates.
MortalityAlthough procedures for registering and allocating cause of death have beenstandardized both nationally and internationally, some lack of specificity anduniformity is inevitable. The description of cancer type provided on the deathcertificate is usually less accurate than that obtained by the cancer registries fromhospital and pathology records.
Although there have been numerous small changes in definitions over the years (seeTable A2), there is one major earlier change of note:
� In the versions of this publication published before 2003, mortality due tocolorectal cancer was based on the International Classification of Diseases, NinthRevision (ICD-9), codes 153–154, to be consistent with other publications.However, this underestimates colorectal cancer mortality by about 10% becausemost deaths registered as ICD-9 code 159.0 (intestine not otherwise specified) arecases of colorectal cancer.
� Commencing with the 2003 edition, these deaths were included in the definition ofcolorectal cancer. As a consequence, mortality figures for colorectal cancerappearing in this publication cannot be directly compared with those appearing inreports prior to 2003.
52 Canadian Cancer Society: Canadian Cancer Statistics 2012
APPENDIX II: DATA SOURCES AND METHODS
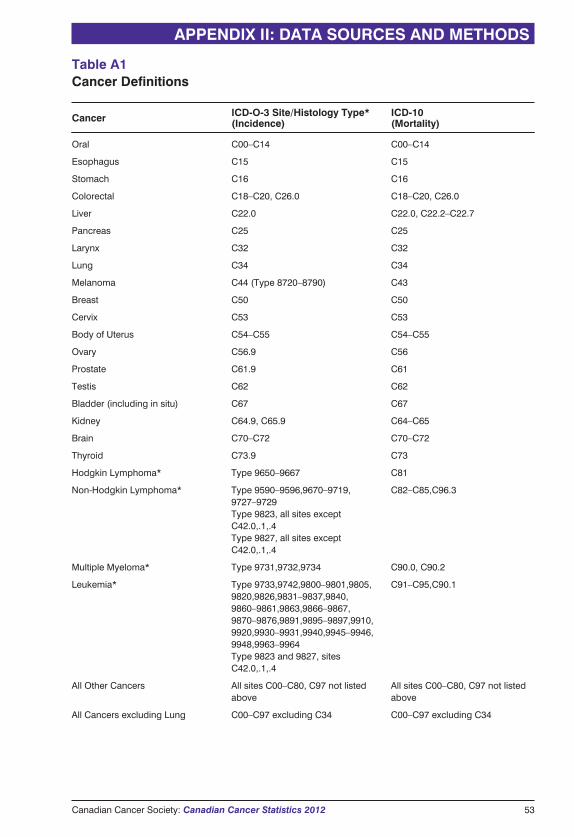
Canadian Cancer Society: Canadian Cancer Statistics 2012 53
APPENDIX II: DATA SOURCES AND METHODS
Cancer ICD-O-3 Site/Histology Type*(Incidence)
ICD-10(Mortality)
Oral C00–C14 C00–C14
Esophagus C15 C15
Stomach C16 C16
Colorectal C18–C20, C26.0 C18–C20, C26.0
Liver C22.0 C22.0, C22.2–C22.7
Pancreas C25 C25
Larynx C32 C32
Lung C34 C34
Melanoma C44 (Type 8720–8790) C43
Breast C50 C50
Cervix C53 C53
Body of Uterus C54–C55 C54–C55
Ovary C56.9 C56
Prostate C61.9 C61
Testis C62 C62
Bladder (including in situ) C67 C67
Kidney C64.9, C65.9 C64–C65
Brain C70–C72 C70–C72
Thyroid C73.9 C73
Hodgkin Lymphoma* Type 9650–9667 C81
Non-Hodgkin Lymphoma* Type 9590–9596,9670–9719,9727–9729Type 9823, all sites exceptC42.0,.1,.4Type 9827, all sites exceptC42.0,.1,.4
C82–C85,C96.3
Multiple Myeloma* Type 9731,9732,9734 C90.0, C90.2
Leukemia* Type 9733,9742,9800–9801,9805,9820,9826,9831–9837,9840,9860–9861,9863,9866–9867,9870–9876,9891,9895–9897,9910,9920,9930–9931,9940,9945–9946,9948,9963–9964Type 9823 and 9827, sitesC42.0,.1,.4
C91–C95,C90.1
All Other Cancers All sites C00–C80, C97 not listedabove
All sites C00–C80, C97 not listedabove
All Cancers excluding Lung C00–C97 excluding C34 C00–C97 excluding C34
Table A1Cancer Definitions
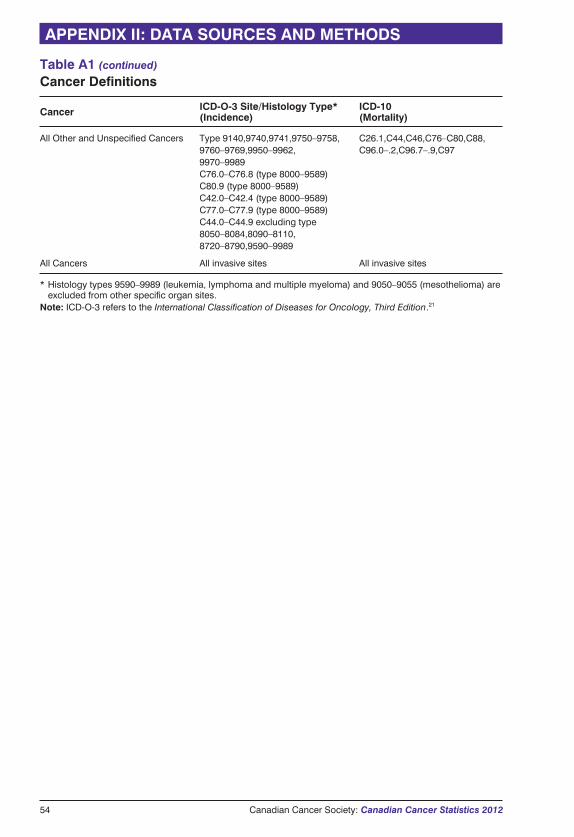
54 Canadian Cancer Society: Canadian Cancer Statistics 2012
APPENDIX II: DATA SOURCES AND METHODS
Cancer ICD-O-3 Site/Histology Type*(Incidence)
ICD-10(Mortality)
All Other and Unspecified Cancers Type 9140,9740,9741,9750–9758,9760–9769,9950–9962,9970–9989C76.0–C76.8 (type 8000–9589)C80.9 (type 8000–9589)C42.0–C42.4 (type 8000–9589)C77.0–C77.9 (type 8000–9589)C44.0–C44.9 excluding type8050–8084,8090–8110,8720–8790,9590–9989
C26.1,C44,C46,C76–C80,C88,C96.0–.2,C96.7–.9,C97
All Cancers All invasive sites All invasive sites
* Histology types 9590–9989 (leukemia, lymphoma and multiple myeloma) and 9050–9055 (mesothelioma) areexcluded from other specific organ sites.
Note: ICD-O-3 refers to the International Classification of Diseases for Oncology, Third Edition.21
Table A1 (continued)
Cancer Definitions
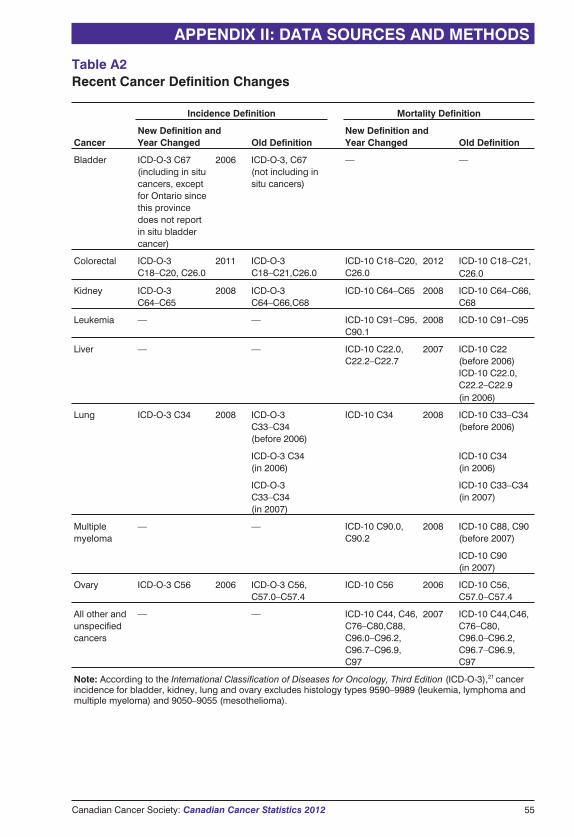
Table A2Recent Cancer Definition Changes
Cancer
Incidence Definition Mortality Definition
New Definition andYear Changed Old Definition
New Definition andYear Changed Old Definition
Bladder ICD-O-3 C67(including in situcancers, exceptfor Ontario sincethis provincedoes not reportin situ bladdercancer)
2006 ICD-O-3, C67(not including insitu cancers)
— —
Colorectal ICD-O-3C18–C20, C26.0
2011 ICD-O-3C18–C21,C26.0
ICD-10 C18–C20,C26.0
2012 ICD-10 C18–C21,C26.0
Kidney ICD-O-3C64–C65
2008 ICD-O-3C64–C66,C68
ICD-10 C64–C65 2008 ICD-10 C64–C66,C68
Leukemia — — ICD-10 C91–C95,C90.1
2008 ICD-10 C91–C95
Liver — — ICD-10 C22.0,C22.2–C22.7
2007 ICD-10 C22(before 2006)ICD-10 C22.0,C22.2–C22.9(in 2006)
Lung ICD-O-3 C34 2008 ICD-O-3C33–C34(before 2006)
ICD-10 C34 2008 ICD-10 C33–C34(before 2006)
ICD-O-3 C34(in 2006)
ICD-10 C34(in 2006)
ICD-O-3C33–C34(in 2007)
ICD-10 C33–C34(in 2007)
Multiplemyeloma
— — ICD-10 C90.0,C90.2
2008 ICD-10 C88, C90(before 2007)
ICD-10 C90(in 2007)
Ovary ICD-O-3 C56 2006 ICD-O-3 C56,C57.0–C57.4
ICD-10 C56 2006 ICD-10 C56,C57.0–C57.4
All other andunspecifiedcancers
— — ICD-10 C44, C46,C76–C80,C88,C96.0–C96.2,C96.7–C96.9,C97
2007 ICD-10 C44,C46,C76–C80,C96.0–C96.2,C96.7–C96.9,C97
Note: According to the International Classification of Diseases for Oncology, Third Edition (ICD-O-3),21 cancerincidence for bladder, kidney, lung and ovary excludes histology types 9590–9989 (leukemia, lymphoma andmultiple myeloma) and 9050–9055 (mesothelioma).
APPENDIX II: DATA SOURCES AND METHODS
Canadian Cancer Society: Canadian Cancer Statistics 2012 55
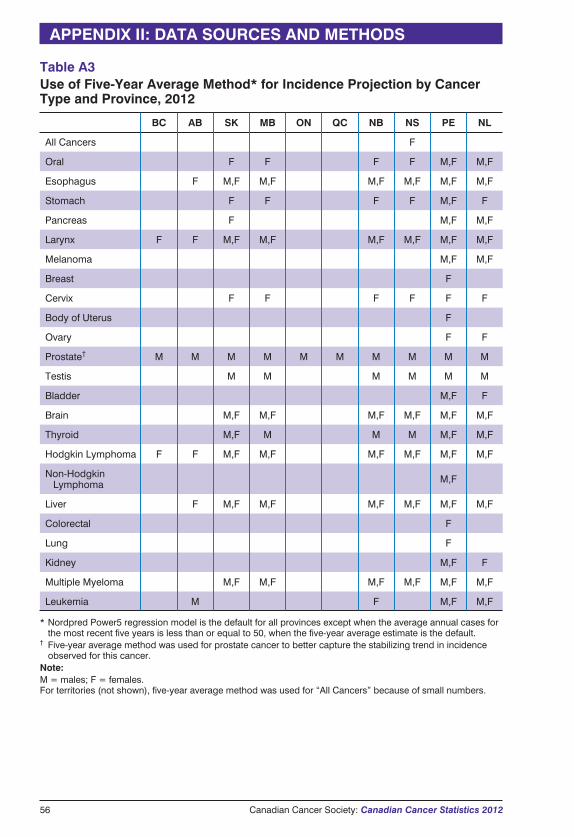
Table A3Use of Five-Year Average Method* for Incidence Projection by CancerType and Province, 2012
BC AB SK MB ON QC NB NS PE NL
All Cancers F
Oral F F F F M,F M,F
Esophagus F M,F M,F M,F M,F M,F M,F
Stomach F F F F M,F F
Pancreas F M,F M,F
Larynx F F M,F M,F M,F M,F M,F M,F
Melanoma M,F M,F
Breast F
Cervix F F F F F F
Body of Uterus F
Ovary F F
Prostate† M M M M M M M M M M
Testis M M M M M M
Bladder M,F F
Brain M,F M,F M,F M,F M,F M,F
Thyroid M,F M M M M,F M,F
Hodgkin Lymphoma F F M,F M,F M,F M,F M,F M,F
Non-HodgkinLymphoma M,F
Liver F M,F M,F M,F M,F M,F M,F
Colorectal F
Lung F
Kidney M,F F
Multiple Myeloma M,F M,F M,F M,F M,F M,F
Leukemia M F M,F M,F
* Nordpred Power5 regression model is the default for all provinces except when the average annual cases forthe most recent five years is less than or equal to 50, when the five-year average estimate is the default.
† Five-year average method was used for prostate cancer to better capture the stabilizing trend in incidenceobserved for this cancer.
Note:M = males; F = females.For territories (not shown), five-year average method was used for “All Cancers” because of small numbers.
56 Canadian Cancer Society: Canadian Cancer Statistics 2012
APPENDIX II: DATA SOURCES AND METHODS
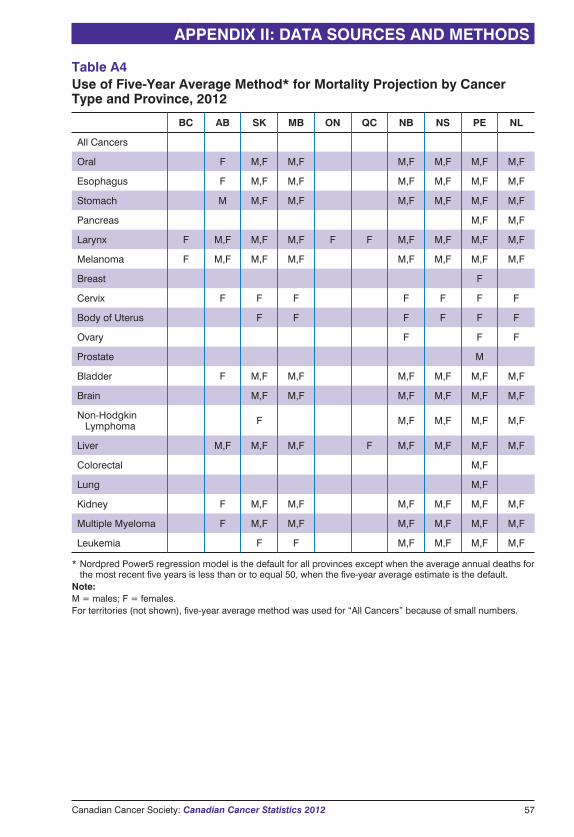
Table A4Use of Five-Year Average Method* for Mortality Projection by CancerType and Province, 2012
BC AB SK MB ON QC NB NS PE NL
All Cancers
Oral F M,F M,F M,F M,F M,F M,F
Esophagus F M,F M,F M,F M,F M,F M,F
Stomach M M,F M,F M,F M,F M,F M,F
Pancreas M,F M,F
Larynx F M,F M,F M,F F F M,F M,F M,F M,F
Melanoma F M,F M,F M,F M,F M,F M,F M,F
Breast F
Cervix F F F F F F F
Body of Uterus F F F F F F
Ovary F F F
Prostate M
Bladder F M,F M,F M,F M,F M,F M,F
Brain M,F M,F M,F M,F M,F M,F
Non-HodgkinLymphoma F M,F M,F M,F M,F
Liver M,F M,F M,F F M,F M,F M,F M,F
Colorectal M,F
Lung M,F
Kidney F M,F M,F M,F M,F M,F M,F
Multiple Myeloma F M,F M,F M,F M,F M,F M,F
Leukemia F F M,F M,F M,F M,F
* Nordpred Power5 regression model is the default for all provinces except when the average annual deaths forthe most recent five years is less than or to equal 50, when the five-year average estimate is the default.
Note:M = males; F = females.For territories (not shown), five-year average method was used for “All Cancers” because of small numbers.
APPENDIX II: DATA SOURCES AND METHODS
Canadian Cancer Society: Canadian Cancer Statistics 2012 57
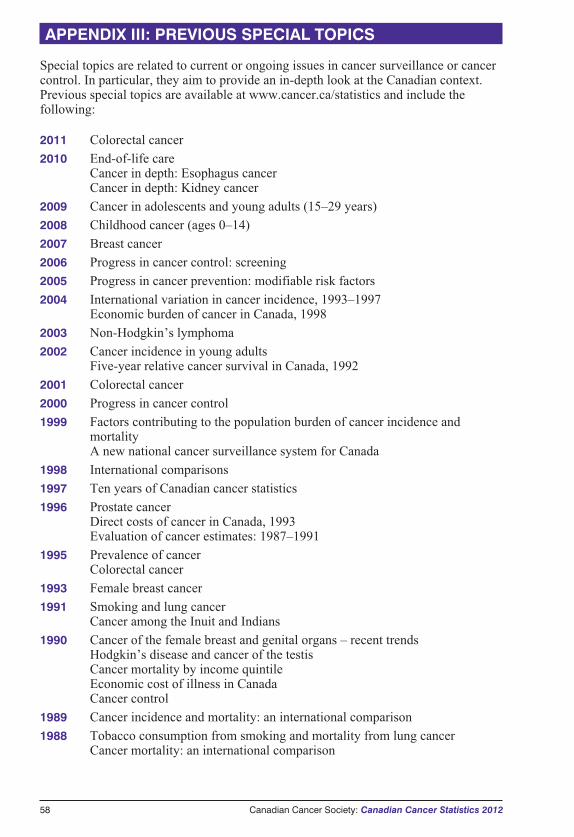
58 Canadian Cancer Society: Canadian Cancer Statistics 2012
Special topics are related to current or ongoing issues in cancer surveillance or cancercontrol. In particular, they aim to provide an in-depth look at the Canadian context.Previous special topics are available at www.cancer.ca/statistics and include thefollowing:
2011 Colorectal cancer
2010 End-of-life careCancer in depth: Esophagus cancerCancer in depth: Kidney cancer
2009 Cancer in adolescents and young adults (15–29 years)
2008 Childhood cancer (ages 0–14)
2007 Breast cancer
2006 Progress in cancer control: screening
2005 Progress in cancer prevention: modifiable risk factors
2004 International variation in cancer incidence, 1993–1997Economic burden of cancer in Canada, 1998
2003 Non-Hodgkin’s lymphoma
2002 Cancer incidence in young adultsFive-year relative cancer survival in Canada, 1992
2001 Colorectal cancer
2000 Progress in cancer control
1999 Factors contributing to the population burden of cancer incidence andmortalityA new national cancer surveillance system for Canada
1998 International comparisons
1997 Ten years of Canadian cancer statistics
1996 Prostate cancerDirect costs of cancer in Canada, 1993Evaluation of cancer estimates: 1987–1991
1995 Prevalence of cancerColorectal cancer
1993 Female breast cancer
1991 Smoking and lung cancerCancer among the Inuit and Indians
1990 Cancer of the female breast and genital organs – recent trendsHodgkin’s disease and cancer of the testisCancer mortality by income quintileEconomic cost of illness in CanadaCancer control
1989 Cancer incidence and mortality: an international comparison
1988 Tobacco consumption from smoking and mortality from lung cancerCancer mortality: an international comparison
APPENDIX III: PREVIOUS SPECIAL TOPICS
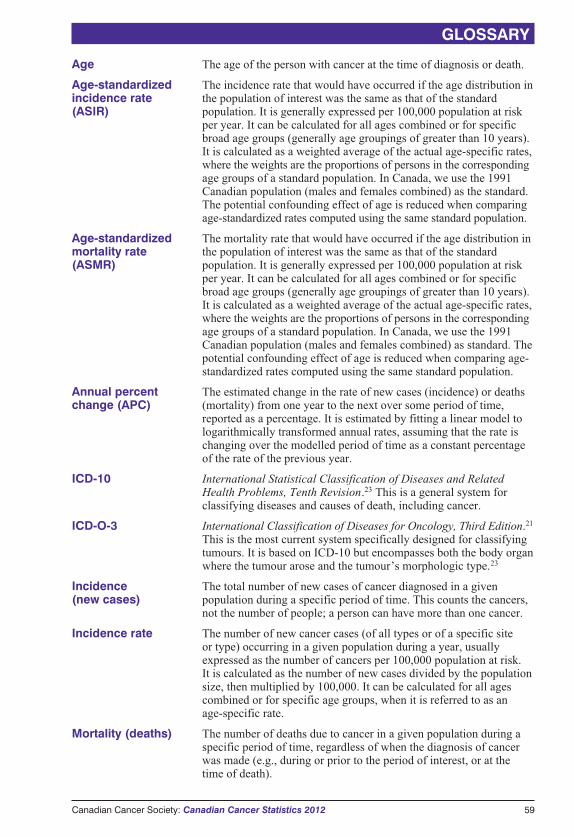
Age The age of the person with cancer at the time of diagnosis or death.
Age-standardizedincidence rate(ASIR)
The incidence rate that would have occurred if the age distribution inthe population of interest was the same as that of the standardpopulation. It is generally expressed per 100,000 population at riskper year. It can be calculated for all ages combined or for specificbroad age groups (generally age groupings of greater than 10 years).It is calculated as a weighted average of the actual age-specific rates,where the weights are the proportions of persons in the correspondingage groups of a standard population. In Canada, we use the 1991Canadian population (males and females combined) as the standard.The potential confounding effect of age is reduced when comparingage-standardized rates computed using the same standard population.
Age-standardizedmortality rate(ASMR)
The mortality rate that would have occurred if the age distribution inthe population of interest was the same as that of the standardpopulation. It is generally expressed per 100,000 population at riskper year. It can be calculated for all ages combined or for specificbroad age groups (generally age groupings of greater than 10 years).It is calculated as a weighted average of the actual age-specific rates,where the weights are the proportions of persons in the correspondingage groups of a standard population. In Canada, we use the 1991Canadian population (males and females combined) as standard. Thepotential confounding effect of age is reduced when comparing age-standardized rates computed using the same standard population.
Annual percentchange (APC)
The estimated change in the rate of new cases (incidence) or deaths(mortality) from one year to the next over some period of time,reported as a percentage. It is estimated by fitting a linear model tologarithmically transformed annual rates, assuming that the rate ischanging over the modelled period of time as a constant percentageof the rate of the previous year.
ICD-10 International Statistical Classification of Diseases and RelatedHealth Problems, Tenth Revision.23 This is a general system forclassifying diseases and causes of death, including cancer.
ICD-O-3 International Classification of Diseases for Oncology, Third Edition.21
This is the most current system specifically designed for classifyingtumours. It is based on ICD-10 but encompasses both the body organwhere the tumour arose and the tumour’s morphologic type.23
Incidence(new cases)
The total number of new cases of cancer diagnosed in a givenpopulation during a specific period of time. This counts the cancers,not the number of people; a person can have more than one cancer.
Incidence rate The number of new cancer cases (of all types or of a specific siteor type) occurring in a given population during a year, usuallyexpressed as the number of cancers per 100,000 population at risk.It is calculated as the number of new cases divided by the populationsize, then multiplied by 100,000. It can be calculated for all agescombined or for specific age groups, when it is referred to as anage-specific rate.
Mortality (deaths) The number of deaths due to cancer in a given population during aspecific period of time, regardless of when the diagnosis of cancerwas made (e.g., during or prior to the period of interest, or at thetime of death).
Canadian Cancer Society: Canadian Cancer Statistics 2012 59
GLOSSARY

Mortality rate The number of cancer deaths (of all types or of a specific site ortype) occurring in a given population during a year, usually expressedas the number of cancer deaths per 100,000 population at risk. It iscalculated as the number of deaths divided by the population size,then multiplied by 100,000. It can be calculated for all ages combinedor for specific age groups, when it is referred to as an age-specificrate.
Province/territory The province or territory of the person’s permanent residence at thetime of cancer diagnosis or death. This may not be the same locationas where the new case of cancer or the cancer death was registered,or where treatment was delivered.
Standard population The Canadian population distribution is based on the final postcensalestimates of the July 1, 1991, Canadian population, adjusted forcensus under-coverage. The age distribution of the population hasbeen weighted and normalized. Data were obtained from the Censusand Demographics Branch, Statistics Canada.
60 Canadian Cancer Society: Canadian Cancer Statistics 2012
GLOSSARY
1991 Canadian Standard Population
AgeGroup
Population(per 100,000)
0–4 6,946.4
5–9 6,945.4
10–14 6,803.4
15–19 6,849.5
20–24 7,501.6
25–29 8,994.4
30–34 9,240.0
35–39 8,338.8
40–44 7,606.3
45–49 5,953.6
50–54 4,764.9
55–59 4,404.1
60–64 4,232.6
65–69 3,857.0
70–74 2,965.9
75–79 2,212.7
80–84 1,359.5
85+ 1,023.7
Total 100,000

1. Brisson J, Major D, Pelletier E. Evaluation of the completeness of the Fichier destumeurs du Québec. Institut national de la santé publique du Québec; 2003.
2. Statistics Canada. Population Projections for Canada, Provinces and Territories2009 to 2036. Catalogue no. 91-520-X. Ottawa, ON: Minister of Industry; 2010.Available at: http://www.statcan.gc.ca/pub/91-520-x/91-520-x2010001-eng.htm(accessed Dec 30, 2011).
3. Statistics Canada. Demographic Estimates Compendium 2010. Ottawa, ON: Ministerof Industry; 2010. CANSIM table 051-0001 released on September 29, 2010.
4. Health Canada. Canadian Tobacco Use Monitoring Survey (CTUMS) 2010.Available at: http://www.hc-sc.gc.ca/hc-ps/tobac-tabac/research-recherche/stat/ctums-esutc_2010-eng.php (accessed Dec 13, 2011).
5. Bray F, McCarron P, Parkin DM. The changing global patterns of female breastcancer incidence and mortality. Breast Cancer Res 2004;6(6):229–239.
6. Chow WH, Devesa SS. Contemporary epidemiology of renal cell cancer. Cancer J2008;14(5):288–301.
7. Chow WH, Devesa SS, Warren JL, Fraumeni JF. Rising incidence of renal cellcancer in the United States. JAMA 1999;281(17):1628–1631.
8. Mathew A, Devesa SS, Fraumeni JF, Chow WH. Global increases in kidney cancerincidence, 1973–1992. Eur J Cancer Prev 2002;11(2):171–178.
9. Tjepkema M. Adult obesity in Canada: measured height and weight. In: Nutrition:Findings from the Canadian Community Health Survey, No. 1. Ottawa, ON:Statistics Canada; 2006. Catalogue no. 82-620-MWE.
10. International Agency for Research on Cancer (IARC). Tobacco smoke andinvoluntary smoking. In: IARC Monographs on the Evaluation of CarcinogenicRisks to Humans. vol. 83. Lyon, France: IARC; 2004.
11. International Agency for Research on Cancer (IARC). Alcohol consumption andethyl carbamate. In: IARC Monographs on the Evaluation of Carcinogenic Risks toHumans. vol. 96. Lyon, France: IARC; 2010.
12. Health Canada. Canadian Alcohol and Drug Use Monitoring Survey (CADUMS)2010. Available at: http://www.hc-sc.gc.ca/hc-ps/drugs-drogues/stat/_2010/summary-sommaire-eng.php#alc (accessed Dec 3, 2011).
13. El-Serag HB, Davila JA, Petersen NJ, et al. The continuing increase in the incidenceof hepatocellular carcinoma in the United States: an update. Ann Intern Med2003;139:817–823.
14. Nordenstedt H, White DL, El-Serag HB. The changing pattern of epidemiology inhepatocellular carcinoma. Dig Liver Dis 2010 Jul;42 Suppl 3:S206–S214.
15. Andriole GL, Crawford ED, Grubb RL 3rd, et al. Mortality results from arandomized prostate-cancer screening trial. N Engl J Med 2009;360(13):1310–1319.
16. Schröder FH, Hugosson J, Roobol MJ, et al. Screening and prostate-cancer mortalityin a randomized European study. N Engl J Med 2009;360(13):1320–1328.
17. Kent WD, Hall SF, Isotalo PA, et al. Increased incidence of differentiated thyroidcarcinoma and detection of subclinical disease. CMAJ 2007;177:1357–1361.
18. Enewold L, Zhu K, Ron E, et al. Rising thyroid cancer incidence in the United Statesby demographic and tumor characteristics, 1980-2005. Cancer EpidemiolBiomarkers Prev 2009;18(3): 784–91.
Canadian Cancer Society: Canadian Cancer Statistics 2012 61
REFERENCES
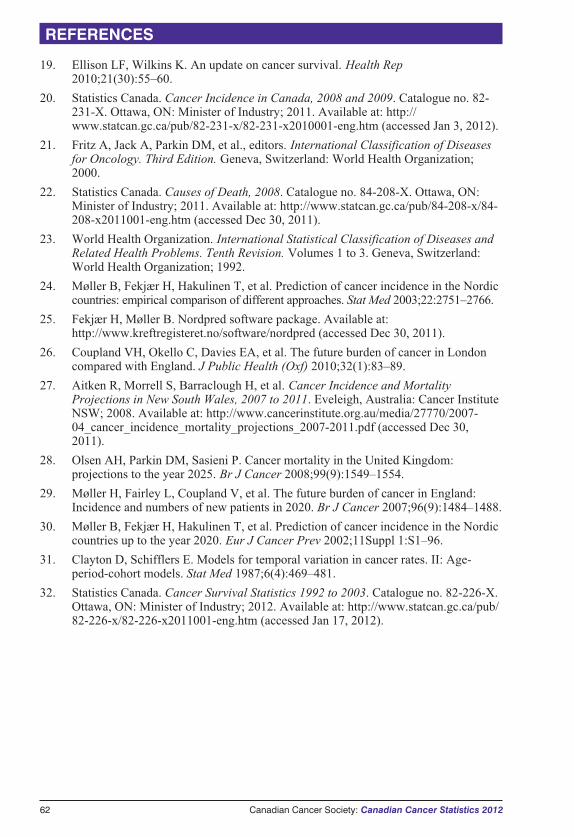
19. Ellison LF, Wilkins K. An update on cancer survival. Health Rep2010;21(30):55–60.
20. Statistics Canada. Cancer Incidence in Canada, 2008 and 2009. Catalogue no. 82-231-X. Ottawa, ON: Minister of Industry; 2011. Available at: http://www.statcan.gc.ca/pub/82-231-x/82-231-x2010001-eng.htm (accessed Jan 3, 2012).
21. Fritz A, Jack A, Parkin DM, et al., editors. International Classification of Diseasesfor Oncology. Third Edition. Geneva, Switzerland: World Health Organization;2000.
22. Statistics Canada. Causes of Death, 2008. Catalogue no. 84-208-X. Ottawa, ON:Minister of Industry; 2011. Available at: http://www.statcan.gc.ca/pub/84-208-x/84-208-x2011001-eng.htm (accessed Dec 30, 2011).
23. World Health Organization. International Statistical Classification of Diseases andRelated Health Problems. Tenth Revision. Volumes 1 to 3. Geneva, Switzerland:World Health Organization; 1992.
24. Møller B, Fekjær H, Hakulinen T, et al. Prediction of cancer incidence in the Nordiccountries: empirical comparison of different approaches. Stat Med 2003;22:2751–2766.
25. Fekjær H, Møller B. Nordpred software package. Available at:http://www.kreftregisteret.no/software/nordpred (accessed Dec 30, 2011).
26. Coupland VH, Okello C, Davies EA, et al. The future burden of cancer in Londoncompared with England. J Public Health (Oxf) 2010;32(1):83–89.
27. Aitken R, Morrell S, Barraclough H, et al. Cancer Incidence and MortalityProjections in New South Wales, 2007 to 2011. Eveleigh, Australia: Cancer InstituteNSW; 2008. Available at: http://www.cancerinstitute.org.au/media/27770/2007-04_cancer_incidence_mortality_projections_2007-2011.pdf (accessed Dec 30,2011).
28. Olsen AH, Parkin DM, Sasieni P. Cancer mortality in the United Kingdom:projections to the year 2025. Br J Cancer 2008;99(9):1549–1554.
29. Møller H, Fairley L, Coupland V, et al. The future burden of cancer in England:Incidence and numbers of new patients in 2020. Br J Cancer 2007;96(9):1484–1488.
30. Møller B, Fekjær H, Hakulinen T, et al. Prediction of cancer incidence in the Nordiccountries up to the year 2020. Eur J Cancer Prev 2002;11Suppl 1:S1–96.
31. Clayton D, Schifflers E. Models for temporal variation in cancer rates. II: Age-period-cohort models. Stat Med 1987;6(4):469–481.
32. Statistics Canada. Cancer Survival Statistics 1992 to 2003. Catalogue no. 82-226-X.Ottawa, ON: Minister of Industry; 2012. Available at: http://www.statcan.gc.ca/pub/82-226-x/82-226-x2011001-eng.htm (accessed Jan 17, 2012).
62 Canadian Cancer Society: Canadian Cancer Statistics 2012
REFERENCES
Data contained in this publication and additional information are available from the following:
� Canadian Cancer Societywww.cancer.ca
� Public Health Agency of Canadawww.phac-aspc.gc.ca (select surveillance)
� Statistics Canadawww.statcan.gc.ca (search “cancer”)
Additional information related to this publication can be found in other print sources, includingthe following:
� reports from provincial and territorial cancer registries
� Cancer Incidence in Canada,20 Cancer Survival Statistics32 and Health Reports, publishedby Statistics Canada
� Chronic Diseases and Injuries in Canada, published by Health Canada/Public HealthAgency of Canada
� a collaborative monograph entitled Cancer in North America: 2004–2008, published by theNorth American Association of Central Cancer Registries and available at www.naaccr.org/DataandPublications/CINAPubs.aspx
� Cancer Incidence in Five Continents, published by the International Agency for Research onCancer in 2007 and available at: http://www.iarc.fr/en/publications/pdfs-online/epi/sp160/index.php.
Information from the Canadian Cancer SocietyFor general information about cancer statistics or any other aspect of cancer (such as cancerprevention, screening, diagnosis, treatment or care), contact the Canadian Cancer Society ’sCancer Information Service at 1 888 939-3333. Contact information for the Canadian CancerSociety, National, and the divisions is provided on page 66. Your local Canadian CancerSociety office is listed in the white pages of the telephone directory.
For information about cancer research funded by the Canadian Cancer Society ResearchInstitute, contact the Canadian Cancer Society, National, at the address provided on page 66.
Information from the Public Health Agency of CanadaMore detailed information on methodology is available from the Chronic Disease Surveillanceand Monitoring Division, CCDPC, Public Health Agency of Canada, 785 Carling Avenue,Ottawa, Ontario, K1A 0K9. Tel: (613) 952-5176, Fax: (613) 941-2057.
Chronic Disease Infobase Cubes (www.infobase.phac-aspc.gc.ca) is an interactive online toolfor easy access to cancer surveillance data. It allows you to generate tables, chart and mapsaccording to a choice of parameters, such as cancer type, geographic area and period of time.
Information from Statistics CanadaDetailed standard tables are available on the Statistics Canada website (www.statcan.gc.ca).Custom tabulations are available on a cost recovery basis upon request from the HealthStatistics Division, Statistics Canada, National Contact Centre: (613) 951-8116 or toll-free1 800 263-1136; [email protected]. Analytical articles appear regularly in Health Reports,Statistics Canada, Catalogue no. 82-003 (www.statcan.gc.ca/bsolc/olc-cel/olc-cel?catno=82-003-x&lang=eng).
Information from the provincial or territorial cancer registriesCancer incidence data are supplied to Statistics Canada by provincial and territorial cancerregistries. Detailed information regarding the statistics for each province or territory is availablefrom the relevant registry (see pages 64-65 for contact information).
Canadian Cancer Society: Canadian Cancer Statistics 2012 63
FOR FURTHER INFORMATION
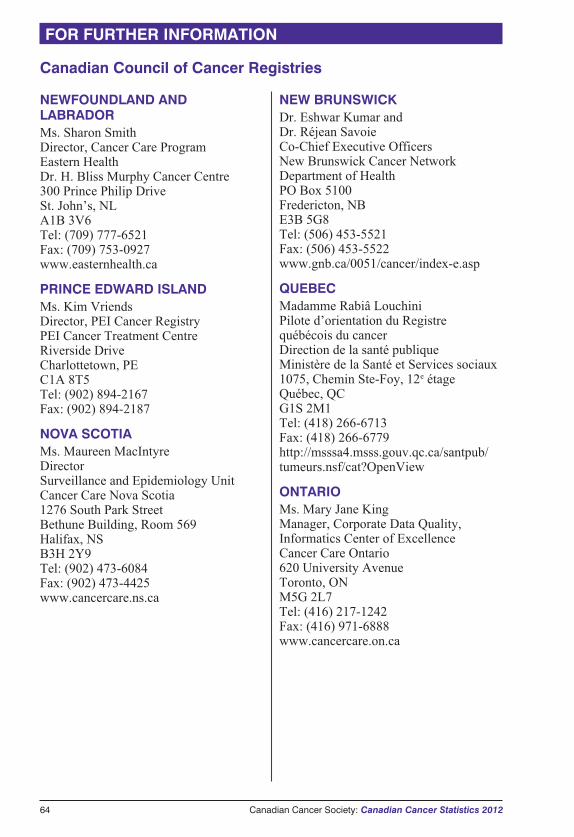
Canadian Council of Cancer Registries
NEWFOUNDLAND ANDLABRADORMs. Sharon SmithDirector, Cancer Care ProgramEastern HealthDr. H. Bliss Murphy Cancer Centre300 Prince Philip DriveSt. John’s, NLA1B 3V6Tel: (709) 777-6521Fax: (709) 753-0927www.easternhealth.ca
PRINCE EDWARD ISLANDMs. Kim VriendsDirector, PEI Cancer RegistryPEI Cancer Treatment CentreRiverside DriveCharlottetown, PEC1A 8T5Tel: (902) 894-2167Fax: (902) 894-2187
NOVA SCOTIAMs. Maureen MacIntyreDirectorSurveillance and Epidemiology UnitCancer Care Nova Scotia1276 South Park StreetBethune Building, Room 569Halifax, NSB3H 2Y9Tel: (902) 473-6084Fax: (902) 473-4425www.cancercare.ns.ca
NEW BRUNSWICKDr. Eshwar Kumar andDr. Réjean SavoieCo-Chief Executive OfficersNew Brunswick Cancer NetworkDepartment of HealthPO Box 5100Fredericton, NBE3B 5G8Tel: (506) 453-5521Fax: (506) 453-5522www.gnb.ca/0051/cancer/index-e.asp
QUEBECMadamme Rabiâ LouchiniPilote d’orientation du Registrequébécois du cancerDirection de la santé publiqueMinistère de la Santé et Services sociaux1075, Chemin Ste-Foy, 12e étageQuébec, QCG1S 2M1Tel: (418) 266-6713Fax: (418) 266-6779http://msssa4.msss.gouv.qc.ca/santpub/tumeurs.nsf/cat?OpenView
ONTARIOMs. Mary Jane KingManager, Corporate Data Quality,Informatics Center of ExcellenceCancer Care Ontario620 University AvenueToronto, ONM5G 2L7Tel: (416) 217-1242Fax: (416) 971-6888www.cancercare.on.ca
64 Canadian Cancer Society: Canadian Cancer Statistics 2012
FOR FURTHER INFORMATION
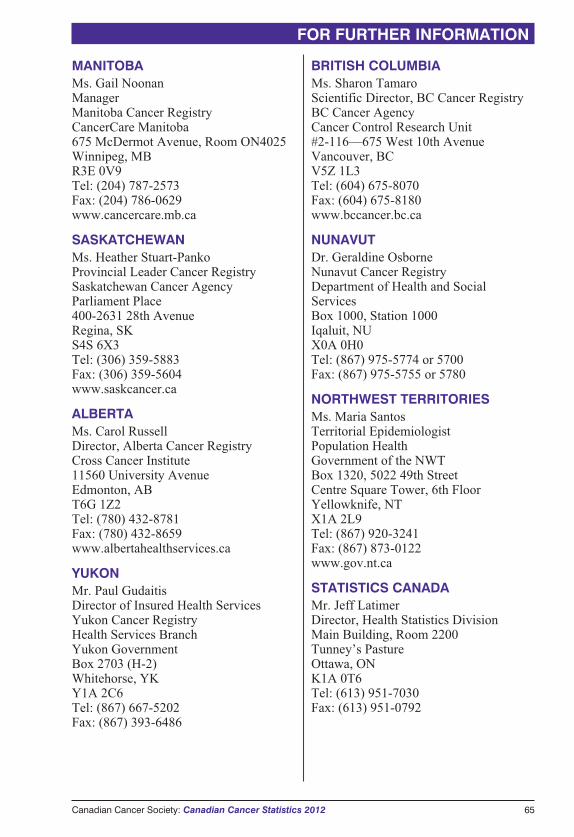
MANITOBAMs. Gail NoonanManagerManitoba Cancer RegistryCancerCare Manitoba675 McDermot Avenue, Room ON4025Winnipeg, MBR3E 0V9Tel: (204) 787-2573Fax: (204) 786-0629www.cancercare.mb.ca
SASKATCHEWANMs. Heather Stuart-PankoProvincial Leader Cancer RegistrySaskatchewan Cancer AgencyParliament Place400-2631 28th AvenueRegina, SKS4S 6X3Tel: (306) 359-5883Fax: (306) 359-5604www.saskcancer.ca
ALBERTAMs. Carol RussellDirector, Alberta Cancer RegistryCross Cancer Institute11560 University AvenueEdmonton, ABT6G 1Z2Tel: (780) 432-8781Fax: (780) 432-8659www.albertahealthservices.ca
YUKONMr. Paul GudaitisDirector of Insured Health ServicesYukon Cancer RegistryHealth Services BranchYukon GovernmentBox 2703 (H-2)Whitehorse, YKY1A 2C6Tel: (867) 667-5202Fax: (867) 393-6486
BRITISH COLUMBIAMs. Sharon TamaroScientific Director, BC Cancer RegistryBC Cancer AgencyCancer Control Research Unit#2-116—675 West 10th AvenueVancouver, BCV5Z 1L3Tel: (604) 675-8070Fax: (604) 675-8180www.bccancer.bc.ca
NUNAVUTDr. Geraldine OsborneNunavut Cancer RegistryDepartment of Health and SocialServicesBox 1000, Station 1000Iqaluit, NUX0A 0H0Tel: (867) 975-5774 or 5700Fax: (867) 975-5755 or 5780
NORTHWEST TERRITORIESMs. Maria SantosTerritorial EpidemiologistPopulation HealthGovernment of the NWTBox 1320, 5022 49th StreetCentre Square Tower, 6th FloorYellowknife, NTX1A 2L9Tel: (867) 920-3241Fax: (867) 873-0122www.gov.nt.ca
STATISTICS CANADAMr. Jeff LatimerDirector, Health Statistics DivisionMain Building, Room 2200Tunney’s PastureOttawa, ONK1A 0T6Tel: (613) 951-7030Fax: (613) 951-0792
Canadian Cancer Society: Canadian Cancer Statistics 2012 65
FOR FURTHER INFORMATION

Canadian Cancer Society Division Offices
National55 St. Clair Avenue West, Suite 300Toronto, ON M4V 2Y7Tel: (416) 961-7223Fax: (416) 961-4189E-mail: [email protected] more information about cancer:[email protected] 888 939-3333
Alberta/NWT325 Manning Road NE, Suite 200Calgary, AB T2E 2P5Toll-free: 1 800 661 2262Tel: (403) 205-3966Fax: (403) 205-3979E-mail: [email protected]
British Columbia & Yukon565 West 10th AvenueVancouver, BC V5Z 4J4Toll-free: 1 800 663 2524Tel: (604) 872-4400Fax: (604) 872-4113E-mail: [email protected]
Manitoba193 Sherbrook StreetWinnipeg, MB R3C 2B7Toll-free: 1 800 532 6982Tel: (204) 774-7483Fax: (204) 774-7500E-mail: [email protected]
New BrunswickPO Box 2089133 Prince William Street, Suite 201Saint John, NB E2L 3T5Toll-free: 1 800 455 9090Tel: (506) 634-6272Fax: (506) 634-3808E-mail: [email protected]
Newfoundland & LabradorPO Box 8921Daffodil Place70 Ropewalk LaneSt. John’s, NL A1B 3R9Toll-free: 1 888 753 6520Tel: (709) 753-6520Fax: (709) 753-9314E-mail: [email protected]
Nova Scotia5826 South Street, Suite 1Halifax, NS B3H 1S6Toll-free: 1 800 639 0222Tel: (902) 423-6183Fax: (902) 429-6563E-mail: [email protected]
Ontario55 St. Clair Avenue West, Suite 500Toronto, ON M4V 2Y7Toll-free: 1 800 268 8874Tel: (416) 488-5400Fax: (416) 488-2872E-mail: [email protected]
Prince Edward Island1 Rochford Street, Suite 1Charlottetown, PE C1A 9L2Toll-free: 1 866 566 4007Tel: (902) 566-4007Fax: (902) 628-8281E-mail: [email protected]
Quebec5151 de l’Assomption Blvd.Montreal, QC H1T 4A9Tel: (514) 255-5151Fax: (514) 255-2808E-mail: [email protected]
Saskatchewan1910 McIntyre StreetRegina, SK S4P 2R3Toll-free: 1 877 977 4673Tel: (306) 790-5822Fax: (306) 569-2133E-mail: [email protected]
66 Canadian Cancer Society: Canadian Cancer Statistics 2012
FOR FURTHER INFORMATION
������ ���� ���c�����When you want to know more about cancer, call the Canadian Cancer Society’s Cancer Information Service.
��������������
Monday to Friday, 9 a.m. – 6 p.m.
����������b��
����� After being diagnosed with Hodgkin’s
disease at age 26, Deanne was determined to survive. She would joke,
“ I have to keep living: I haven’t found the perfect shade of purple nail polish yet!”Photography: Sheilagh O’Leary
!�������� ������Francilla Charles has been diagnosed twice with pancreatic cancer and survived for 10 years and counting. She now lives with diabetes and continues to inspire and amaze her daughter, photographer Michele Clarke.Photography: Michele Clarke
"������#���Throughout his battle with cancer, Evan Pickard’s heart was continuously open to others, making everyone around him laugh. He died in April 2007, leaving behind endless hearts touched by his sincere generosity.Photography: Jennifer Globush
�����#����The photographer took this image of her Uncle Dan, who has a passion for cooking, sitting peacefully in his kitchen in December 2007. He was receiving chemotherapy, having been diagnosed with colon cancer four months earlier. Sadly, he passed away in March 2008.Photography: Kendra Vamplew
"����Photographer Larry Frank was Eddie’s peer support volunteer. They met through Cancer Connection, a division of the Canadian Cancer Society. The two spoke regularly during the two years following Eddie’s cancer diagnosis, while he underwent surgery and radiation. Eddie is now well and looking forward to a healthy life with his wife Tara and young daughter.Photography: Larry Frank
��$ ��������In November 2004, Tim Catterall, a firefighter for the Burlington, Ontario Fire Department, was diagnosed with chronic lymphocytic leukemia. He took a stand and created Firefighters Against Cancer’s Existence.Photography: Caitlin den Boer