2012 Allied Workforce Mobility Survey: Differences by Size - Recruiting
21
IQ www.alliedHRIQ.com 06/2012 ©2012 Allied Van Lines, Inc. U.S. DOT No. 076235, ALLIED and ALLIED ROADWAY DESIGN are registered trademarks and service marks of Allied Van Lines, Inc. 2012 Allied Workforce Mobility Survey : Differences by Size About the 2012 Research The 2012 Allied Workforce Mobility Survey, conducted in March 2012, captures the voice of HR professionals on critical topics relating to “workforce mobility,” which is defined as the willingness and ability of employees to relocate for a job with either a current or new employer. The survey approaches workforce mobility from two angles. One set of questions assesses the “mobility environment,” the context in which relocation occurs, including economic, cultural, demographic and organizational variables. The second set of questions examines HR topic areas related to or affected by workforce mobility: recruitment, relocation, onboarding and retention. These topics encompass a broad range of activities and responsibilities for HR professionals, not limited to moving or relocating. The survey was intended to identify tools and practices, as well as measures for success in these areas. Study results are scheduled to be released in stages: Recruiting and Relocation: April 30 Retention and Onboarding: May 21 Differences by Size: June 11 1 Survey Methodology The 2012 Allied Workforce Mobility Survey was conducted online with 500* human resources professionals from 49 states and the District of Columbia. The vast majority of respondents are employed by companies (95 percent vs. 5 percent external contractors), across a broad spectrum of HR titles, companies and industries. Respondent Responsibilities within HR: HR managers/supervisors ........................................................................................ 28% HR generalists............................................................................................................ 24% Recruiters ................................................................................................................... 14% HR assistants ............................................................................................................. 13% C-level/Directors/VPs ............................................................................................... 11% *A sample of 500 yields a confidence interval of 95 percent ± 4 percent. Sponsored by Allied Van Lines, the survey is intended as a service to human resources professionals and is part of a larger ongoing initiative, Allied HR IQ, which will conduct additional research projects, host events and facilitate discussions in the HR community via the Allied HR IQ website. The topic areas and questions for the survey were determined through collaborative discussions involving Allied Van Lines, Allied’s independent research partners, and distinguished HR professionals.
Transcript of 2012 Allied Workforce Mobility Survey: Differences by Size - Recruiting
IQwww.alliedHRIQ.com 06/2012
©2012 Allied Van Lines, Inc. U.S. DOT No. 076235, ALLIED and ALLIED ROADWAY DESIGN are registered trademarks and service marks of Allied Van Lines, Inc.
2012 Allied Workforce Mobility Survey: Differences by Size
About the 2012 Research The 2012 Allied Workforce Mobility Survey, conducted in March 2012, captures the
voice of HR professionals on critical topics relating to “workforce mobility,” which is
defined as the willingness and ability of employees to relocate for a job with either a
current or new employer.
The survey approaches workforce mobility from two angles. One set of questions
assesses the “mobility environment,” the context in which relocation occurs,
including economic, cultural, demographic and organizational variables.
The second set of questions examines HR topic areas related to or affected by
workforce mobility: recruitment, relocation, onboarding and retention. These topics
encompass a broad range of activities and responsibilities for HR professionals,
not limited to moving or relocating. The survey was intended to identify tools and
practices, as well as measures for success in these areas.
Study results are scheduled to be released in stages: � Recruiting and Relocation: April 30
� Retention and Onboarding: May 21
� Differences by Size: June 11
1
Survey MethodologyThe 2012 Allied Workforce Mobility Survey was conducted online with 500* human
resources professionals from 49 states and the District of Columbia. The vast
majority of respondents are employed by companies (95 percent vs. 5 percent
external contractors), across a broad spectrum of HR titles, companies and
industries.
Respondent Responsibilities within HR:HR managers/supervisors ........................................................................................28%
HR generalists............................................................................................................24%
Recruiters ...................................................................................................................14%
HR assistants .............................................................................................................13%
C-level/Directors/VPs ...............................................................................................11%
*A sample of 500 yields a confidence interval of 95 percent ± 4 percent.
Sponsored by Allied Van Lines, the survey is intended as a service to human
resources professionals and is part of a larger ongoing initiative, Allied HR IQ, which
will conduct additional research projects, host events and facilitate discussions in
the HR community via the Allied HR IQ website.
The topic areas and questions for the survey were determined through collaborative
discussions involving Allied Van Lines, Allied’s independent research partners, and
distinguished HR professionals.
IQwww.alliedHRIQ.com 06/2012
©2012 Allied Van Lines, Inc. U.S. DOT No. 076235, ALLIED and ALLIED ROADWAY DESIGN are registered trademarks and service marks of Allied Van Lines, Inc.
2012 Allied Workforce Mobility Survey: Differences by Size
2
Source: 2012 Allied Workforce Mobility Survey AlliedHRIQ.com
Source: 2012 Allied Workforce Mobility Survey AlliedHRIQ.com
Source: 2012 Allied Workforce Mobility Survey AlliedHRIQ.com
IQwww.alliedHRIQ.com 06/2012
©2012 Allied Van Lines, Inc. U.S. DOT No. 076235, ALLIED and ALLIED ROADWAY DESIGN are registered trademarks and service marks of Allied Van Lines, Inc.
2012 Allied Workforce Mobility Survey: Differences by Size
Results Bigger Companies Wield Advantages in the Talent Pipeline;But Opportunities Abound for Smaller Companies, TooLarger companies hold a considerable edge over smaller companies in recruiting,
relocating and onboarding new employees, according to the 2012 Allied Workforce
Mobility Survey. Large companies do more of all these activities and, in general,
put more money, structure and organizational support behind them.
According to HR professionals, large companies are:
More bullish about recruiting in 2012
More likely to rate their recruiting, relocation and onboarding programs as
“highly successful”
More likely to search nationally or internationally when recruiting
More likely to have a formal program and budget for onboarding
More likely to offer a broad array of recruiting and relocation incentives
to job candidates
Still, small companies have advantages, too, according to the survey results.
In several respects they are equal to or competitive with larger firms.
A significant portion of small companies are “highly successful” at recruiting
and relocation, suggesting that the playing field can be leveled.
Perceptions aside, small and large companies perform about the same
in terms of securing recruits.
Small firms retain a slightly higher percentage of new employees.
In certain areas (e.g., flexible work arrangements, work environment),
small companies are competitive with large companies.
3
This survey analysis based on company size suggests opportunities for HR
professionals in all situations. For example, a case can be made for casting the
net wider when recruiting at small companies. Recruiting costs per employee
are not significantly greater at midsize and large companies, which recruit from
larger geographical areas. Or, larger firms would do well to tout the value of their
relocation packages since they have an advantage in this area.
Five hundred HR professionals in the U.S. took part in the survey, sharing their
perspectives on how their organizations recruit, relocate, onboard and retain talent.
Previous results were released April 30 and May 21. The present release is based
on a segmentation of survey results from small companies (less than 200 full-time
employees), midsize companies (200 to 2,499 employees), large companies
(2,500 to 10,000 employees) and mega-sized companies (more than 10,000
employees) (Figure 1).
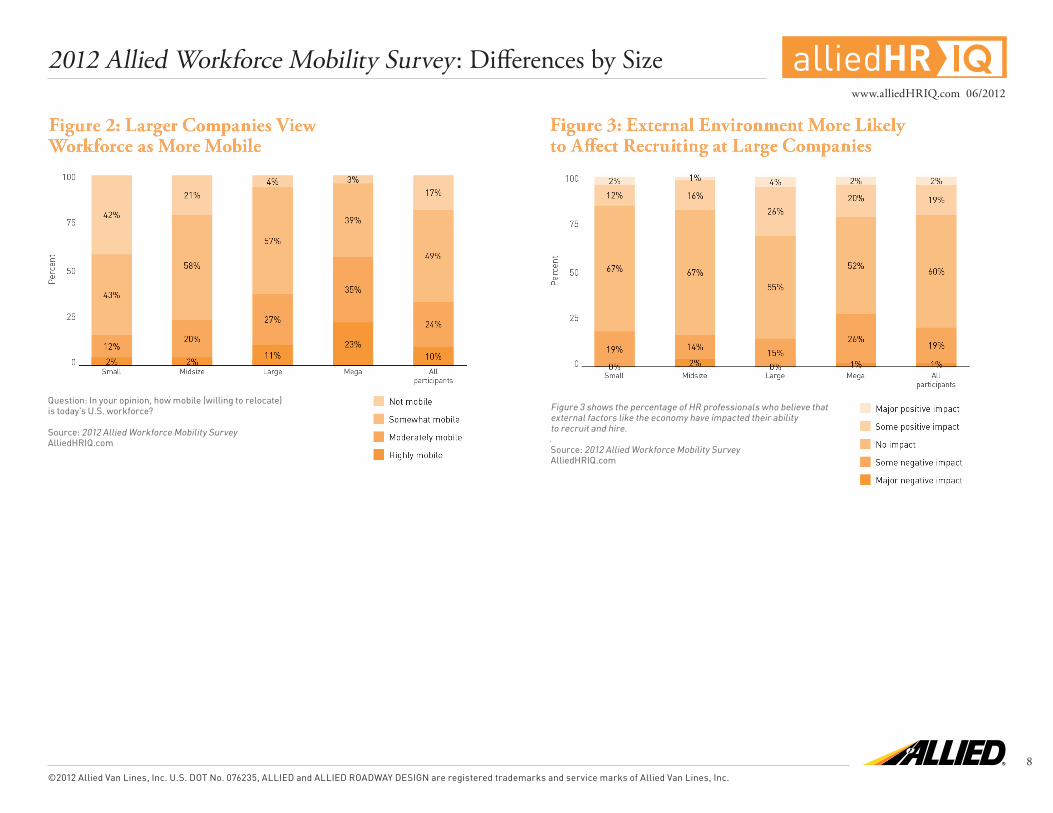
Larger Companies View the Mobility Environment Differently Than Smaller CompaniesHR professionals at large companies are more likely to view the U.S. workforce as
mobile (willing to relocate) (Figure 2).
Larger companies also are more likely to report that the mobility environment
(external factors like the economy, demographics, culture) has impacted their
recruitment or retention efforts — negatively or positively. Larger companies
recruit more, relocate more and cast the net wider when searching for candidates.
As a result, they may be more likely to experience the impact of a sluggish economy
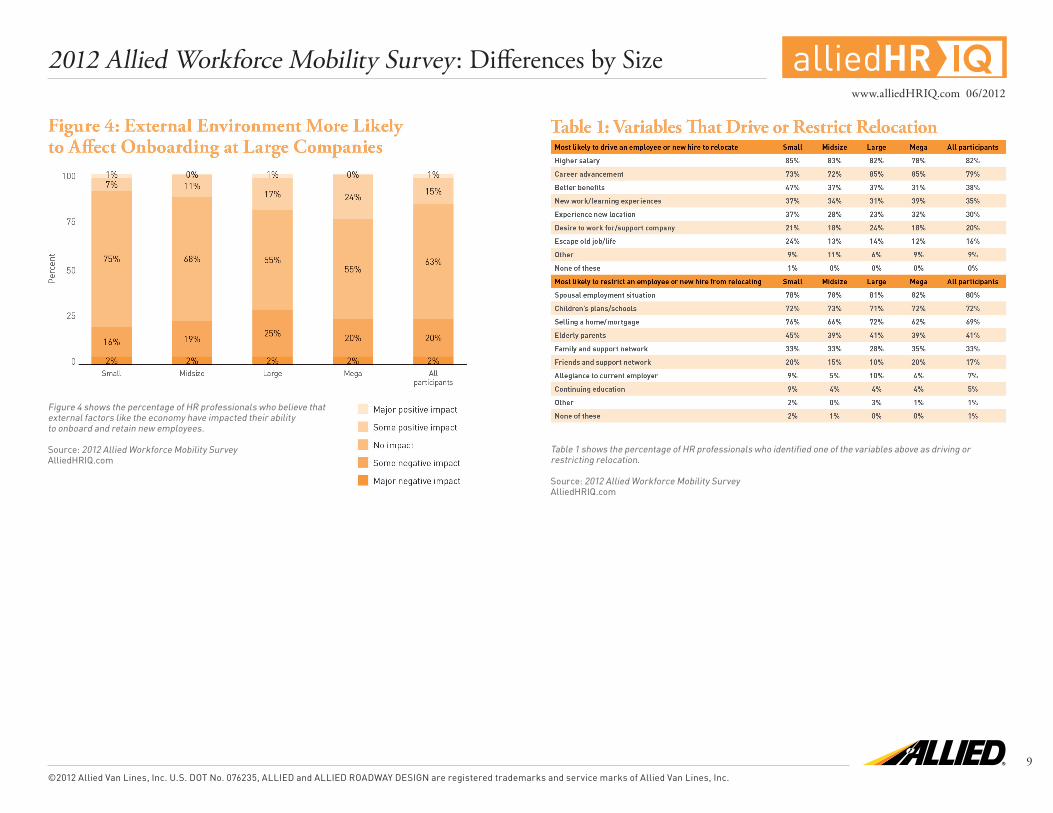
or other external factors (Figures 3 and 4).
IQ2012 Allied Workforce Mobility Survey: Differences by Sizewww.alliedHRIQ.com 06/2012
©2012 Allied Van Lines, Inc. U.S. DOT No. 076235, ALLIED and ALLIED ROADWAY DESIGN are registered trademarks and service marks of Allied Van Lines, Inc.
4
HR professionals at large and small firms generally agree on the factors driving
or restricting a candidate’s willingness to relocate. But there are important
differences (Table 1):
Driving relocations: HR professionals at larger companies are more likely to
cite “career advancement” as a driver for relocation, while those at smaller
firms are more likely to cite “better benefits” and “desire to work for/support
the company.”
Restricting relocations: HR professionals at smaller companies are more
likely to say that “selling a home/mortgage” is a restriction to relocation.
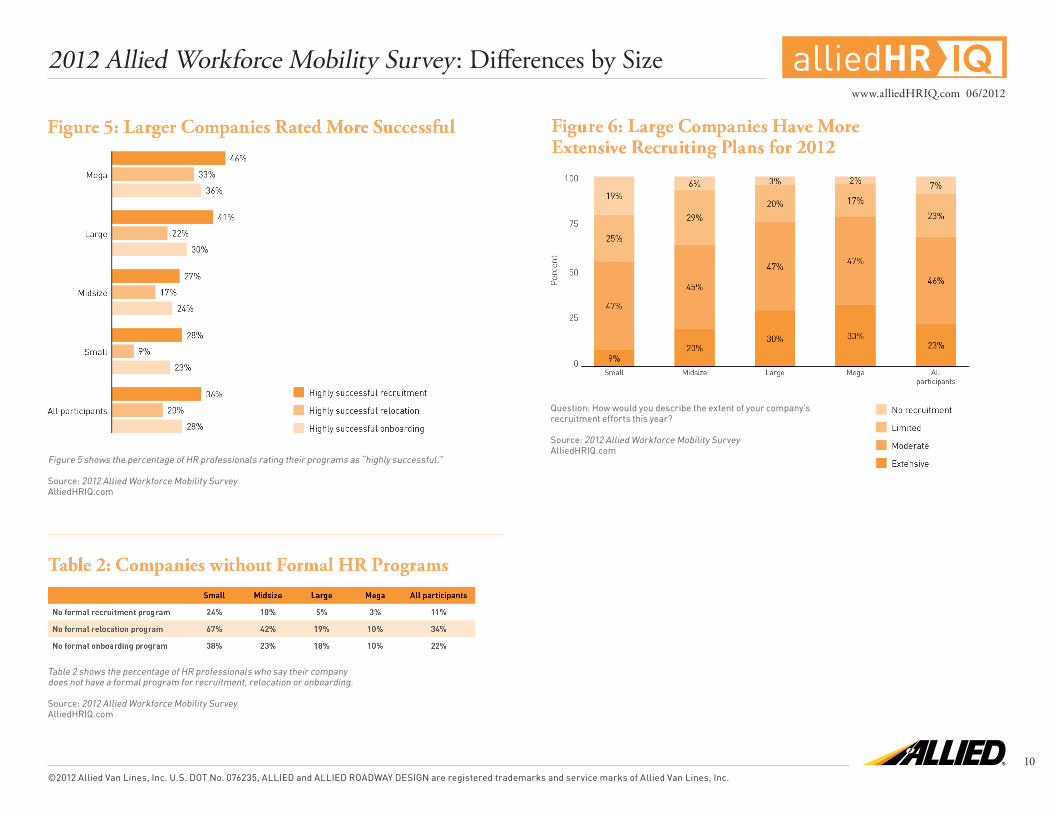
Larger Companies Are More Likely to Rate Their Programs as “Highly Successful” HR professionals at larger companies are more likely to rate the success of their
recruitment, relocation and onboarding programs as “highly successful” (Figure 5):
Recruitment: Forty-six percent of HR professionals at mega companies rate
their recruitment programs as “highly successful” versus 28 percent of HR
professionals at small companies.
Relocation: Thirty-three percent of HR professionals at mega companies
rate their relocation programs as “highly successful” versus 9 percent of HR
professionals at small companies.
Onboarding: Thirty-six percent of HR professionals at mega companies rate
their onboarding programs as “highly successful” versus 23 percent of HR
professionals at small companies.
Further, larger companies are far more likely to have formal programs dedicated
to at least one of these areas (recruitment, relocation or onboarding) (Table 2).
But it’s not a rule that smaller companies are less competitive. For those that apply
best practices and dedicate resources, the returns are significant. Smaller firms
can level the playing field if they truly aspire to. Approximately 25 percent of HR
professionals at small companies rate their recruitment and onboarding programs
as “highly successful,” and 10 percent rate their relocation program as “highly
successful.”
Larger Companies More Bullish about Recruiting in 2012,Cast the Net Wider When Recruiting Larger firms are more bullish about recruiting and relocating. One-third of HR
professionals at mega-sized or large companies say recruitment efforts will be
“extensive” this year, while only 20 percent and 9 percent of midsize and small
companies, respectively, say recruiting will be extensive (Figure 6).
In searching for job candidates, larger companies also are more likely to look
beyond their U.S. or regional location. Four of five mega companies will recruit
from international (25 percent) or national (57 percent) geographic areas (Figure 7). By comparison:
Six percent of small companies look internationally and 38 percent recruit
across the U.S.
Ten percent of midsize companies look internationally and 46 percent recruit
across the U.S.
Does casting the net wider correlate with more spending for larger companies?
Surprisingly not. Average costs per hire (not including relocation costs) are as
follows:
Small companies – $12,423
Midsize companies – $7,311
Large companies – $7,518
Mega companies – $15,359
IQ2012 Allied Workforce Mobility Survey: Differences by Sizewww.alliedHRIQ.com 06/2012
©2012 Allied Van Lines, Inc. U.S. DOT No. 076235, ALLIED and ALLIED ROADWAY DESIGN are registered trademarks and service marks of Allied Van Lines, Inc.
5
Perceived Recruiting Strengths Vary Based on Size Large and small companies rate their recruiting strengths differently. Recruiting
strengths at larger companies generally reflect access to deeper pockets and
more resources. For example, HR professionals at larger companies are more
likely to rate retirement benefits, career advancement opportunities and relocation
packages (when applicable) as strengths (Table 3).
But HR professionals at midsize and small companies are on equal footing in many
other areas. For example, HR professionals at midsize and small companies are
just as likely to rate compensation, flexible working arrangements, location of job/
company and the quality of executives as strengths.
Recruiting Outcomes Slightly Better at Small Firms While HR professionals at larger companies are more likely to rate their
recruitment programs as successful, they do not actually outperform smaller
firms, according to survey data (Table 4). The rate of success in securing recruits
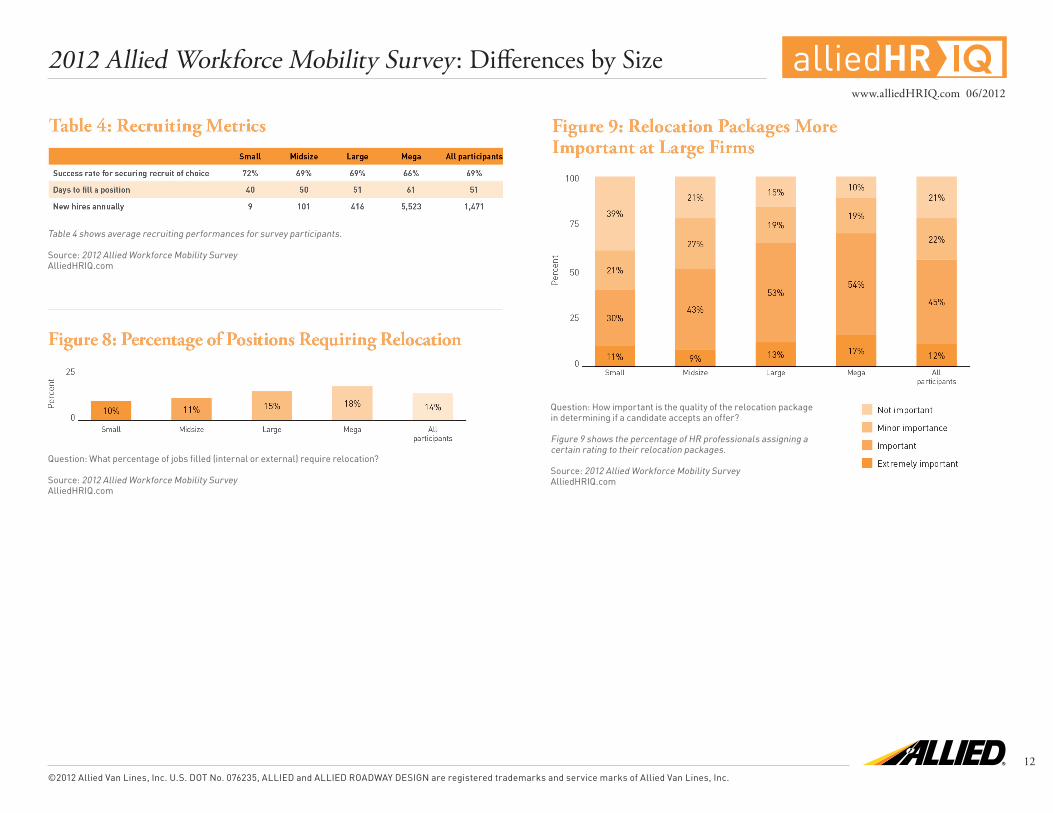
is 72 percent at small firms, as compared to 66 percent at mega-sized companies.
Similarly, the average lead time to fill a position is shorter at small companies.
Still, larger firms have exponentially more positions to fill: an average of 5,523 at
mega-sized companies, 416 at large companies, 101 at midsize companies, and just
9 at small companies.
Larger Companies Offer Better Relocation Packages Larger companies are more likely to require relocation for certain positions
(Figure 8). Also, HR professionals at larger companies are more likely to report
that the quality of relocation packages can affect whether a candidate accepts an
offer. For example, only 10 percent of HR professionals at mega-sized companies
say the relocation package is “not important,” as compared to 39 percent of HR
professionals at small companies (Figure 9).
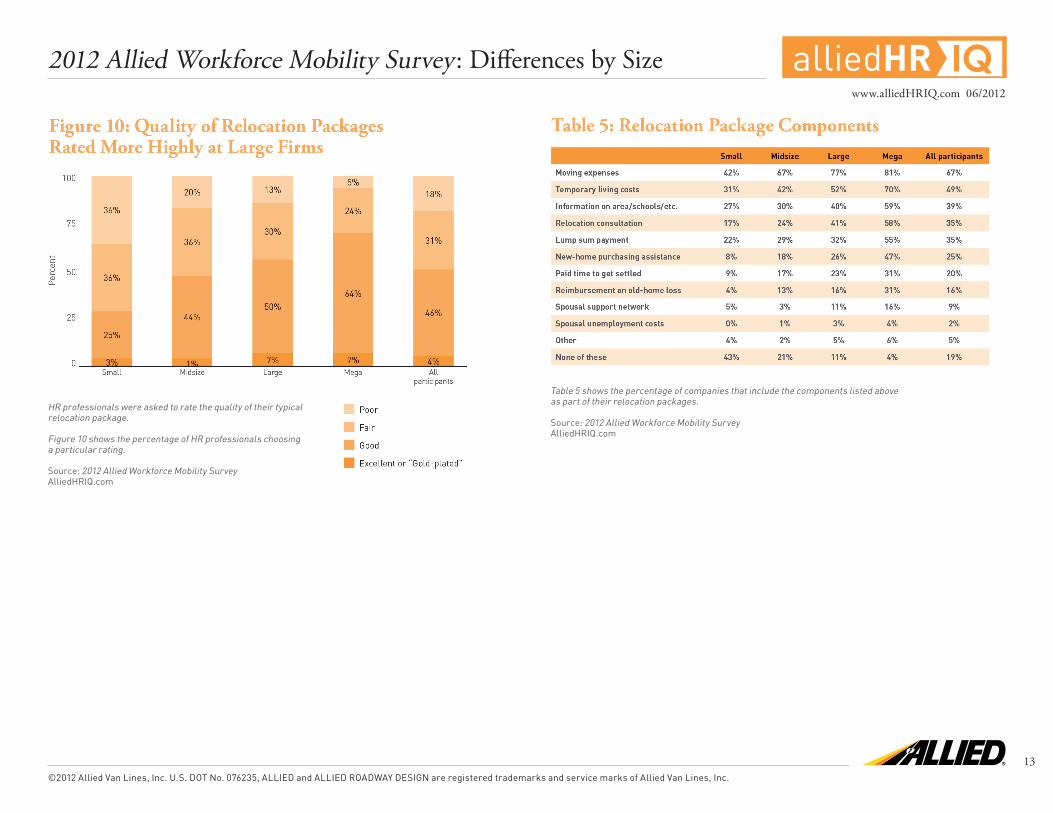
Larger companies relocate more and offer better packages. Only 3 percent of
mega-sized companies and 5 percent of large companies do not have a formal
relocation program, as compared to 42 percent of midsize companies and 67
percent of small companies.
Further, only 4 percent of mega-sized companies and 11 percent of large companies
have none of the incentives listed in the 2012 Allied Workforce Mobility Survey
(Figure 10, Table 5), as compared to 21 percent of midsize and 43 percent of small
companies.
The average cost of relocation packages is comparable among small, midsize
and large companies. However, relocation packages are nearly three times larger
at mega-sized firms. Average relocation costs:
Small companies – $12,073
Midsize companies – $9,606
Large companies – $14,007
Mega companies – $41,052
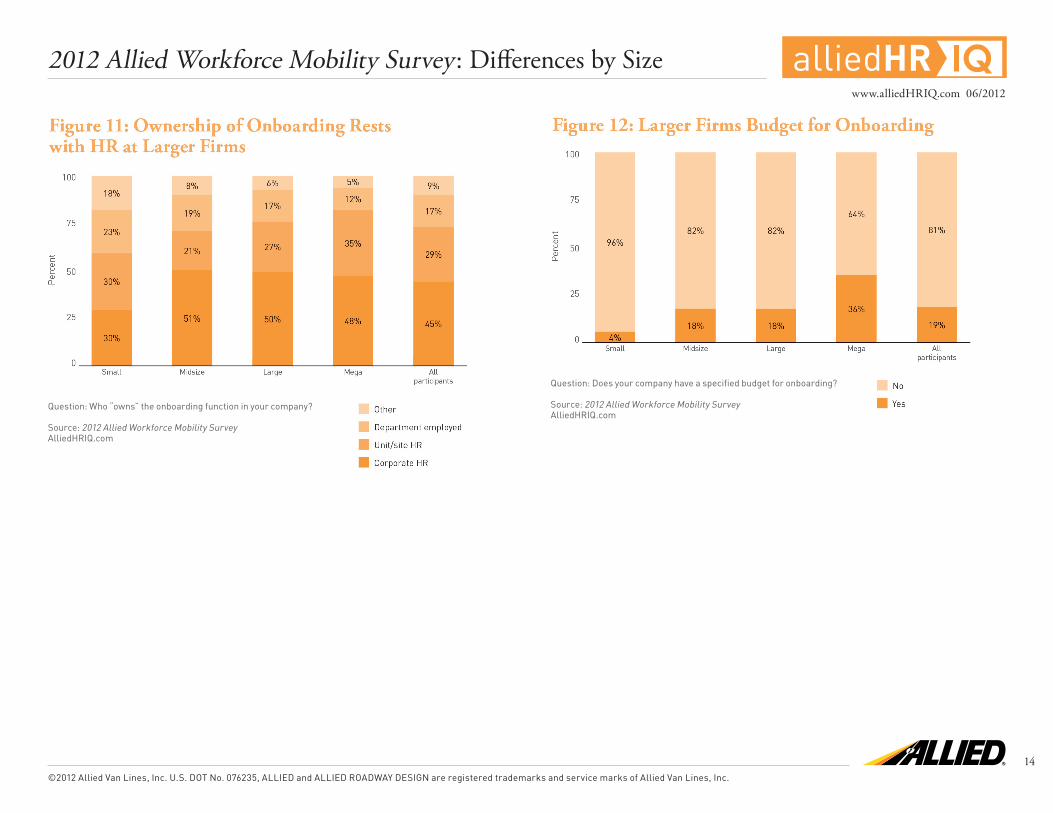
Onboarding Gets More Attention at Larger CompaniesLarger companies put more behind their onboarding programs. They are more
likely to:
Place ownership of the program in the human resources department, as
opposed to non-HR departments (Figure 11)
Establish a specific budget for onboarding (Figure 12)
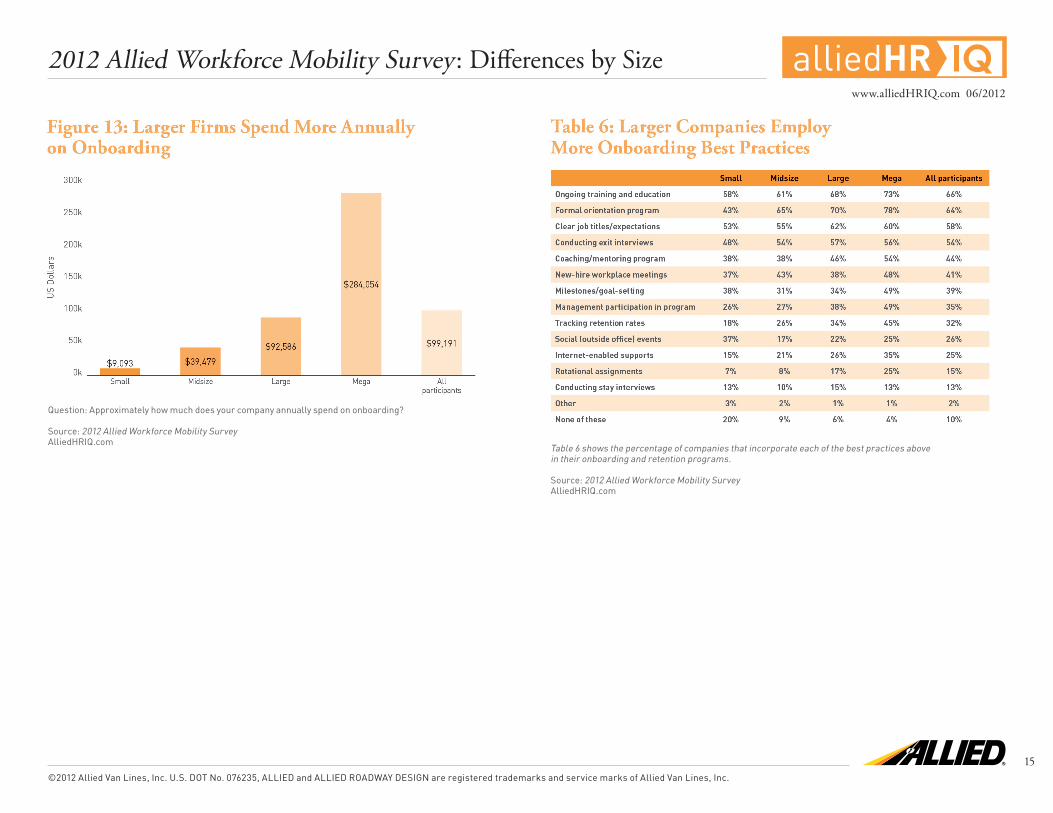
Spend a lot more on onboarding per year* (Figure 13)
As a result, HR professionals at larger companies are more likely to rate their
onboarding programs as “highly successful.”
* However, larger companies spend less per employee because program startup costs are spread over a greater number of new employees.
IQ2012 Allied Workforce Mobility Survey: Differences by Sizewww.alliedHRIQ.com 06/2012
©2012 Allied Van Lines, Inc. U.S. DOT No. 076235, ALLIED and ALLIED ROADWAY DESIGN are registered trademarks and service marks of Allied Van Lines, Inc.
6
Also, larger companies are more likely to employ a range of onboarding best
practices (Table 6). For example:
Seventy-eight percent of mega-sized companies have a formal orientation
program, as compared to 43 percent of small companies
Forty-nine percent of mega-sized companies involve management in
onboarding programs, as compared to 26 percent of small companies
But Smaller Companies (Slightly) Outperform Larger Competitors in Employee Retention All companies want to retain new hires and get them to full productivity quickly.
Interestingly, smaller companies are as good as larger companies or better at the
following (Table 7):
Retaining new hires through the one-year anniversary
Reaching productivity goals with new employees
Turning new hires into corporate influencers/leaders
Employees Leave Large and Small Companies for Mostly the Same Reasons, with Some Interesting DifferencesThe reasons that employees are “very likely” to leave companies prior to their
one-year anniversary are comparable across all sizes of companies. However, there
are some distinctions. Job performance and compensation are more likely to cause
employees to leave smaller companies, while working conditions/arrangements
are more likely to cause employees to leave larger companies (Table 8).
Job performance:
Small companies – 20 percent of HR professionals say job performance is a
“very likely” reason for an employee to leave
Midsize companies – 24 percent
Large companies – 16 percent
Mega companies – 13 percent
Compensation:
Small companies – 17 percent of HR professionals say compensation is a “very
likely” reason for an employee to leave
Midsize companies – 22 percent
Large companies – 12 percent
Mega companies – 9 percent
Working conditions/arrangements:
Small companies – 7 percent of HR professionals say working conditions are
a “very likely” reason for an employee to leave
Midsize companies – 13 percent
Large companies – 13 percent
Mega companies – 15 percent
IQ2012 Allied Workforce Mobility Survey: Differences by Sizewww.alliedHRIQ.com 06/2012
©2012 Allied Van Lines, Inc. U.S. DOT No. 076235, ALLIED and ALLIED ROADWAY DESIGN are registered trademarks and service marks of Allied Van Lines, Inc.
7
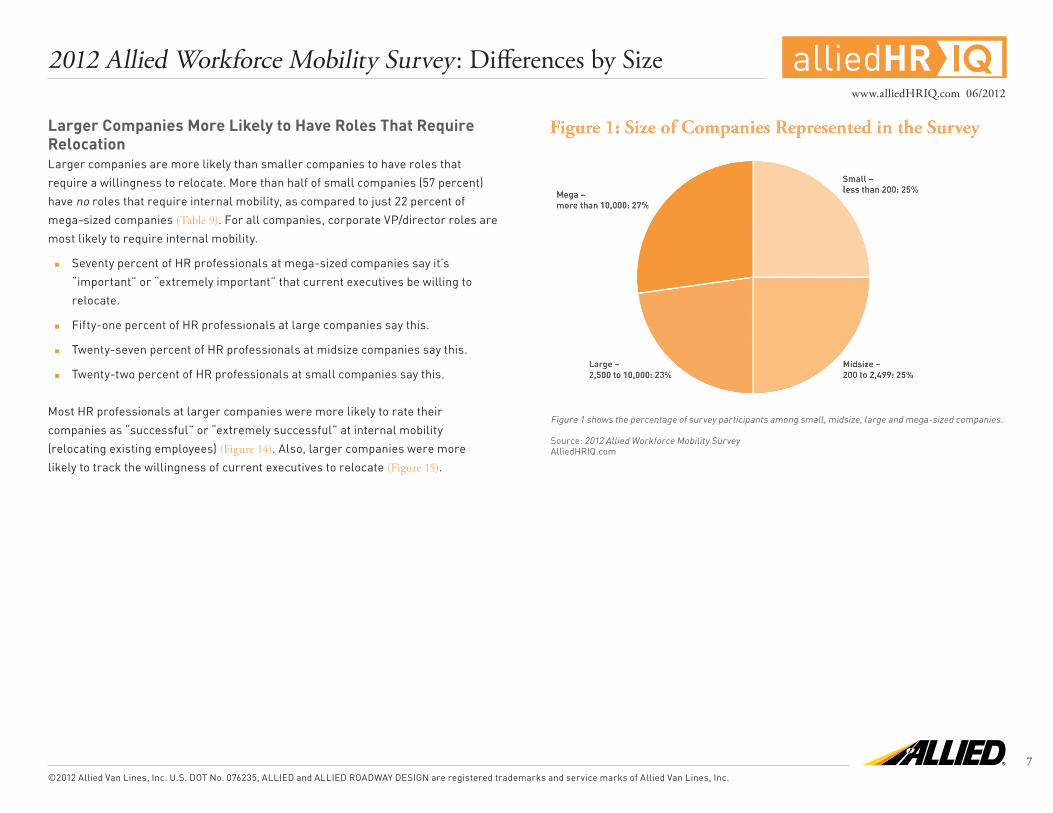
Larger Companies More Likely to Have Roles That Require Relocation Larger companies are more likely than smaller companies to have roles that
require a willingness to relocate. More than half of small companies (57 percent)
have no roles that require internal mobility, as compared to just 22 percent of
mega-sized companies (Table 9). For all companies, corporate VP/director roles are
most likely to require internal mobility.
Seventy percent of HR professionals at mega-sized companies say it’s
“important” or “extremely important” that current executives be willing to
relocate.
Fifty-one percent of HR professionals at large companies say this.
Twenty-seven percent of HR professionals at midsize companies say this.
Twenty-two percent of HR professionals at small companies say this.
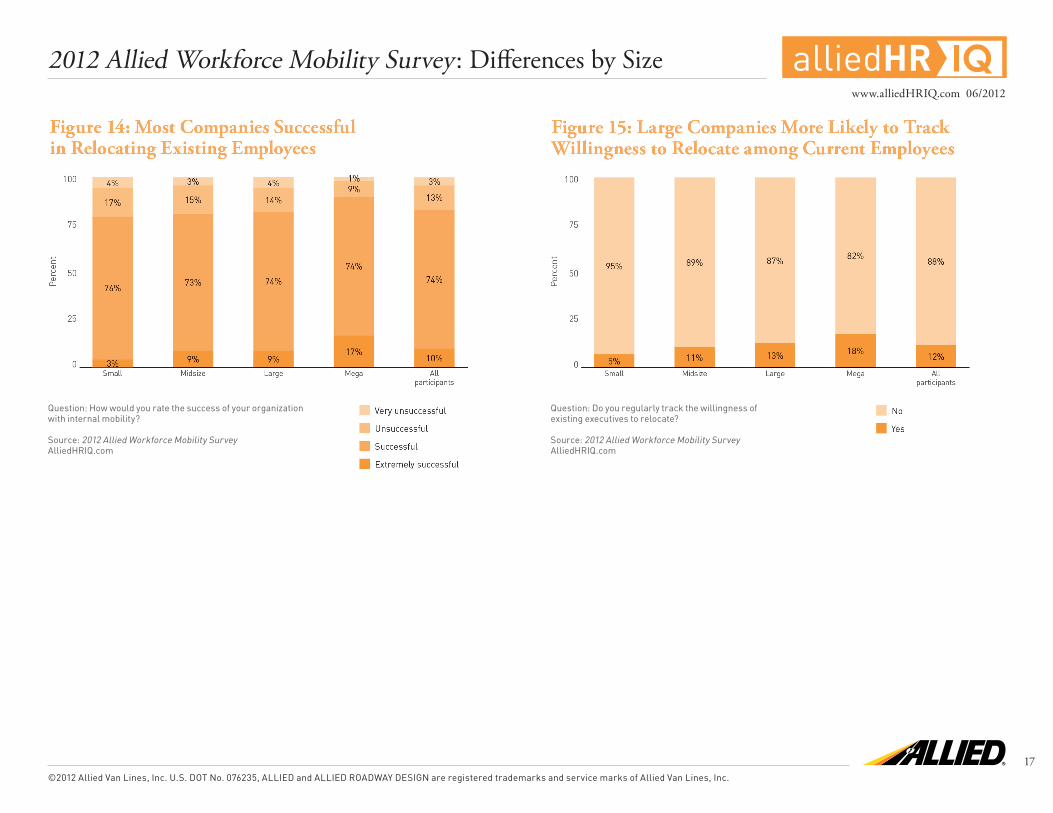
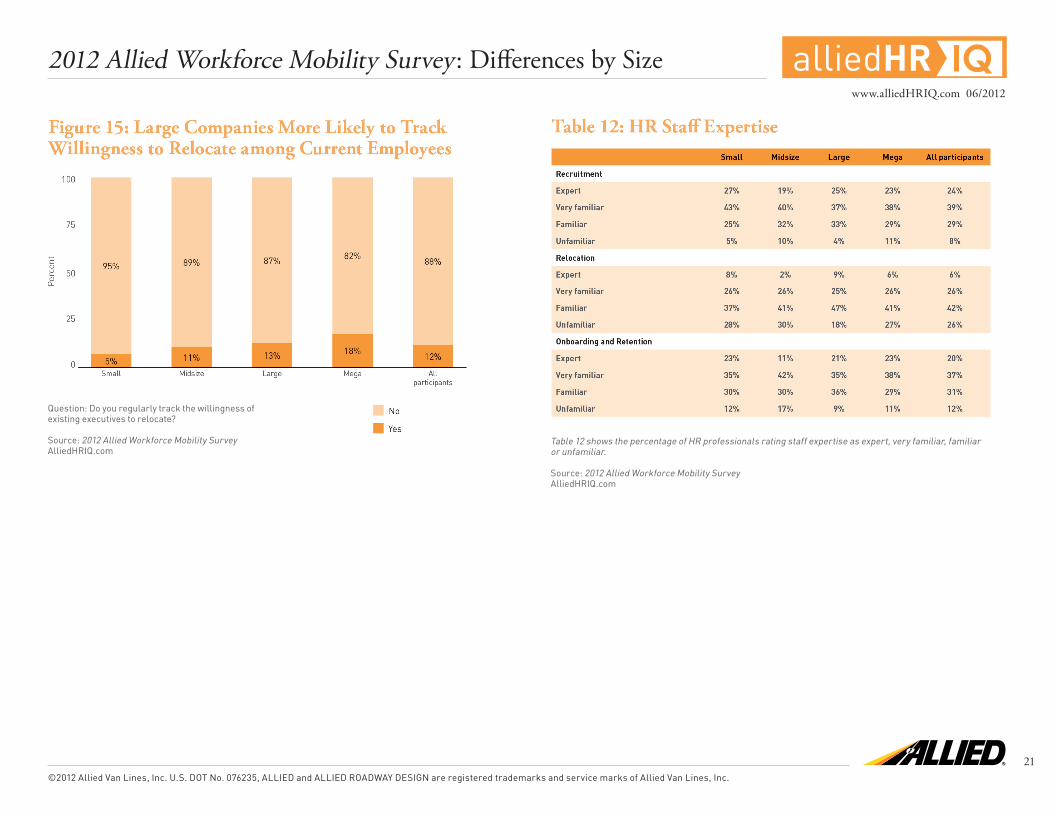
Most HR professionals at larger companies were more likely to rate their
companies as “successful” or “extremely successful” at internal mobility
(relocating existing employees) (Figure 14). Also, larger companies were more
likely to track the willingness of current executives to relocate (Figure 15).
Figure 1 shows the percentage of survey participants among small, midsize, large and mega-sized companies.
Source: 2012 Allied Workforce Mobility SurveyAlliedHRIQ.com
IQwww.alliedHRIQ.com 06/2012
©2012 Allied Van Lines, Inc. U.S. DOT No. 076235, ALLIED and ALLIED ROADWAY DESIGN are registered trademarks and service marks of Allied Van Lines, Inc.
2012 Allied Workforce Mobility Survey: Differences by Size
8
Question: In your opinion, how mobile (willing to relocate) is today’s U.S. workforce?
Source: 2012 Allied Workforce Mobility SurveyAlliedHRIQ.com
Figure 3 shows the percentage of HR professionals who believe that external factors like the economy have impacted their ability to recruit and hire.
Source: 2012 Allied Workforce Mobility SurveyAlliedHRIQ.com
IQwww.alliedHRIQ.com 06/2012
©2012 Allied Van Lines, Inc. U.S. DOT No. 076235, ALLIED and ALLIED ROADWAY DESIGN are registered trademarks and service marks of Allied Van Lines, Inc.
2012 Allied Workforce Mobility Survey: Differences by Size
9
Figure 4 shows the percentage of HR professionals who believe that external factors like the economy have impacted their ability to onboard and retain new employees.
Source: 2012 Allied Workforce Mobility SurveyAlliedHRIQ.com
Table 1 shows the percentage of HR professionals who identified one of the variables above as driving or restricting relocation.
Source: 2012 Allied Workforce Mobility SurveyAlliedHRIQ.com
IQwww.alliedHRIQ.com 06/2012
©2012 Allied Van Lines, Inc. U.S. DOT No. 076235, ALLIED and ALLIED ROADWAY DESIGN are registered trademarks and service marks of Allied Van Lines, Inc.
2012 Allied Workforce Mobility Survey: Differences by Size
10
Figure 5 shows the percentage of HR professionals rating their programs as “highly successful.”
Source: 2012 Allied Workforce Mobility Survey AlliedHRIQ.com
Table 2 shows the percentage of HR professionals who say their company does not have a formal program for recruitment, relocation or onboarding.
Source: 2012 Allied Workforce Mobility SurveyAlliedHRIQ.com
Question: How would you describe the extent of your company’s recruitment efforts this year?
Source: 2012 Allied Workforce Mobility SurveyAlliedHRIQ.com

IQwww.alliedHRIQ.com 06/2012
©2012 Allied Van Lines, Inc. U.S. DOT No. 076235, ALLIED and ALLIED ROADWAY DESIGN are registered trademarks and service marks of Allied Van Lines, Inc.
2012 Allied Workforce Mobility Survey: Differences by Size
11
Question: How wide is the geographic area from which you recruit?
Source: 2012 Allied Workforce Mobility SurveyAlliedHRIQ.com
HR professionals were asked to rate the strength of recruiting incentives on a scale of 1-5. Table 3 shows the percentage of respondents that ranked each of the incentives above as a “5” for strength.
Source: 2012 Allied Workforce Mobility SurveyAlliedHRIQ.com
IQwww.alliedHRIQ.com 06/2012
©2012 Allied Van Lines, Inc. U.S. DOT No. 076235, ALLIED and ALLIED ROADWAY DESIGN are registered trademarks and service marks of Allied Van Lines, Inc.
2012 Allied Workforce Mobility Survey: Differences by Size
12
Table 4 shows average recruiting performances for survey participants.
Source: 2012 Allied Workforce Mobility SurveyAlliedHRIQ.com
Question: What percentage of jobs filled (internal or external) require relocation?
Source: 2012 Allied Workforce Mobility SurveyAlliedHRIQ.com
Question: How important is the quality of the relocation package in determining if a candidate accepts an offer?
Figure 9 shows the percentage of HR professionals assigning a certain rating to their relocation packages.
Source: 2012 Allied Workforce Mobility SurveyAlliedHRIQ.com
IQwww.alliedHRIQ.com 06/2012
©2012 Allied Van Lines, Inc. U.S. DOT No. 076235, ALLIED and ALLIED ROADWAY DESIGN are registered trademarks and service marks of Allied Van Lines, Inc.
2012 Allied Workforce Mobility Survey: Differences by Size
13
HR professionals were asked to rate the quality of their typical relocation package.
Figure 10 shows the percentage of HR professionals choosing a particular rating.
Source: 2012 Allied Workforce Mobility SurveyAlliedHRIQ.com
Table 5 shows the percentage of companies that include the components listed above as part of their relocation packages.
Source: 2012 Allied Workforce Mobility SurveyAlliedHRIQ.com
IQwww.alliedHRIQ.com 06/2012
©2012 Allied Van Lines, Inc. U.S. DOT No. 076235, ALLIED and ALLIED ROADWAY DESIGN are registered trademarks and service marks of Allied Van Lines, Inc.
2012 Allied Workforce Mobility Survey: Differences by Size
14
Question: Who “owns” the onboarding function in your company?
Source: 2012 Allied Workforce Mobility SurveyAlliedHRIQ.com
Question: Does your company have a specified budget for onboarding?
Source: 2012 Allied Workforce Mobility SurveyAlliedHRIQ.com
IQwww.alliedHRIQ.com 06/2012
©2012 Allied Van Lines, Inc. U.S. DOT No. 076235, ALLIED and ALLIED ROADWAY DESIGN are registered trademarks and service marks of Allied Van Lines, Inc.
2012 Allied Workforce Mobility Survey: Differences by Size
15
Question: Approximately how much does your company annually spend on onboarding?
Source: 2012 Allied Workforce Mobility SurveyAlliedHRIQ.com
Table 6 shows the percentage of companies that incorporate each of the best practices above in their onboarding and retention programs.
Source: 2012 Allied Workforce Mobility SurveyAlliedHRIQ.com

IQwww.alliedHRIQ.com 06/2012
©2012 Allied Van Lines, Inc. U.S. DOT No. 076235, ALLIED and ALLIED ROADWAY DESIGN are registered trademarks and service marks of Allied Van Lines, Inc.
2012 Allied Workforce Mobility Survey: Differences by Size
HR professionals were asked to identify the reasons that employees leave before their one-year anniversary. Table 8 shows the percentage of HR professionals choosing one of the reasons listed above.
Source: 2012 Allied Workforce Mobility SurveyAlliedHRIQ.com
16
Table 7 shows average statistics related to onboarding performances.
Source: 2012 Allied Workforce Mobility SurveyAlliedHRIQ.com
Table 9 shows the percentage of companies indicating that the roles listed above require relocation for career advancement.
Source: 2012 Allied Workforce Mobility SurveyAlliedHRIQ.com
IQwww.alliedHRIQ.com 06/2012
©2012 Allied Van Lines, Inc. U.S. DOT No. 076235, ALLIED and ALLIED ROADWAY DESIGN are registered trademarks and service marks of Allied Van Lines, Inc.
2012 Allied Workforce Mobility Survey: Differences by Size
17
Question: How would you rate the success of your organization with internal mobility?
Source: 2012 Allied Workforce Mobility SurveyAlliedHRIQ.com
Question: Do you regularly track the willingness of existing executives to relocate?
Source: 2012 Allied Workforce Mobility SurveyAlliedHRIQ.com
IQwww.alliedHRIQ.com 06/2012
©2012 Allied Van Lines, Inc. U.S. DOT No. 076235, ALLIED and ALLIED ROADWAY DESIGN are registered trademarks and service marks of Allied Van Lines, Inc.
2012 Allied Workforce Mobility Survey: Differences by Size
18
Implications Five Lessons – for Small and Large Companies – in Managing Talent Pipelines The 2012 Allied Workforce Mobility Survey offers five lessons to help companies
manage recruitment, relocation, onboarding and retention.
These lessons are derived from the third set of research findings, which groups
companies and their performances based on number of employees: small (less
than 200 employees), midsize (200 to 2,499 employees), large (2,500 to 10,000
employees) and mega (more than 10,000 employees).
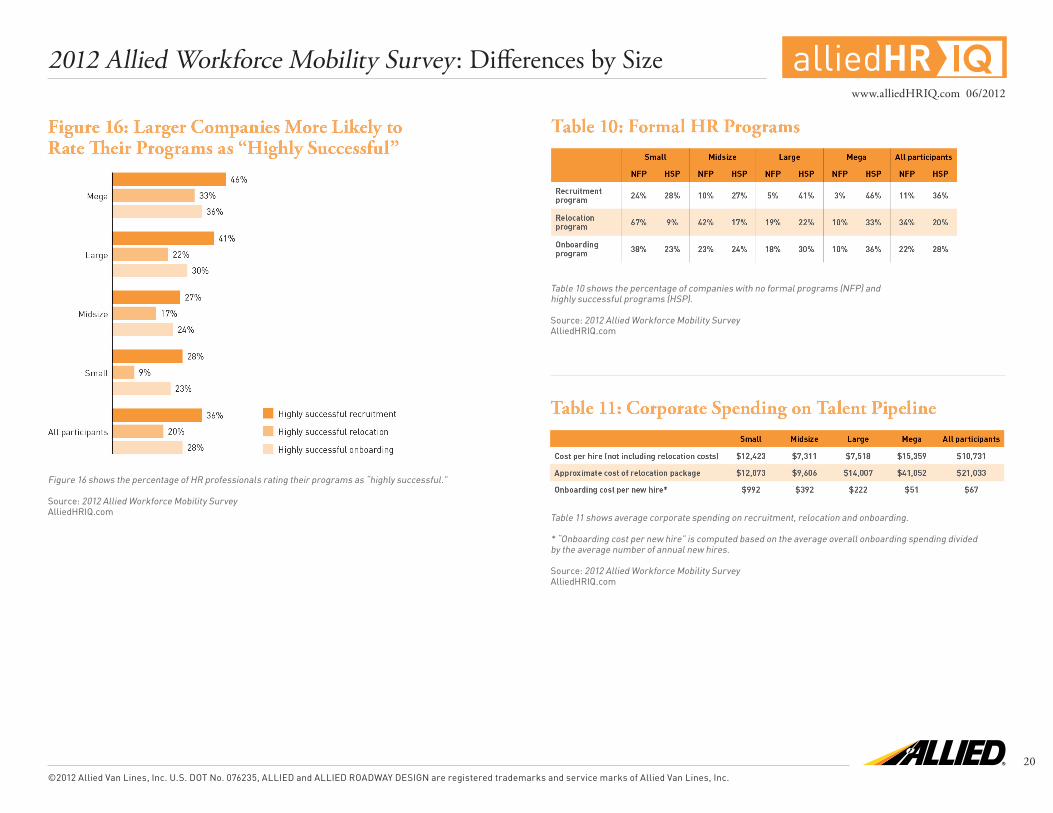
Lesson 1: Any Size Company Can Be Successful in Managing Talent HR professionals at large companies are more likely to rate their recruiting,
relocation and onboarding programs as “highly successful.” That’s an overall
trend – but success is not limited to large companies (Figure 16).
A significant percentage of smaller companies rate their programs as “highly
successful,” too. Approximately one-quarter of HR professionals at small
companies rate their organizations as “highly successful” at recruitment, as
well as onboarding.
Regardless of company size, any firm can improve and succeed at certain facets
of talent management – if they’re willing to invest time, effort and money in the
activity.
Lesson 2: Success Requires Structure Success doesn’t just happen. Programs require structure and budgets to
succeed. Survey results confirm that “highly successful” companies establish
formal programs for recruiting, relocation and onboarding, and in general,
large companies are more likely to have formal programs (Table 10). Even large
companies could do better, though: one in five large companies don’t even have a
relocation program and/or an onboarding program.
As recruiting activities increase in 2012, give some thought to how your firm – small
or large – could formalize your critical talent pipeline programs. What could you
commit to paper and submit to management for approval?
Lesson 3: Money Matters … but in Different Ways Depending on the Size of Your Firm The 2012 Allied Workforce Mobility Survey also shows that talent pipeline
investments vary by size of company. Comparisons are a good place to start in
evaluating your investment and your relative opportunities for success (Table 11).
Recruitment: Costs per new hire (not including relocation costs) are generally
comparable across the range of companies. If companies are hiring and
recruiting, each candidate costs money. It’s as simple as that. Further, a case
can be made for casting the net wider when recruiting at small companies.
According to the survey, recruiting costs per employee are not greater at
midsize and large companies, which recruit from larger geographical areas.
Relocation: The largest of companies (mega) offer relocation packages that
are nearly three times the size of packages offered by other companies. When
smaller firms go after the same candidate, which company is likely to win?
If you’re an HR professional at a smaller company and want a candidate to
relocate, you may have to offer what the biggest companies will. If the recruit is
in high demand and only available at a distance, you may have to make the case
to management.
IQwww.alliedHRIQ.com 06/2012
©2012 Allied Van Lines, Inc. U.S. DOT No. 076235, ALLIED and ALLIED ROADWAY DESIGN are registered trademarks and service marks of Allied Van Lines, Inc.
2012 Allied Workforce Mobility Survey: Differences by Size
Onboarding and retention: Total onboarding costs are vastly higher at larger
companies, even though costs per new hire are actually lower – a lot lower.
How do we explain this? The cost per hire is less because startup and overhead
costs are spread among a larger group of new employees (more new hires
per year). In other words, the return on investment is greater as the number
of new employees increases. Conversely, onboarding budgets can be hard to
justify as the number of new hires decreases. A useful question for every HR
professional is, “Is the quality, extent and budget of my onboarding program
appropriate given the number of new employees participating?”
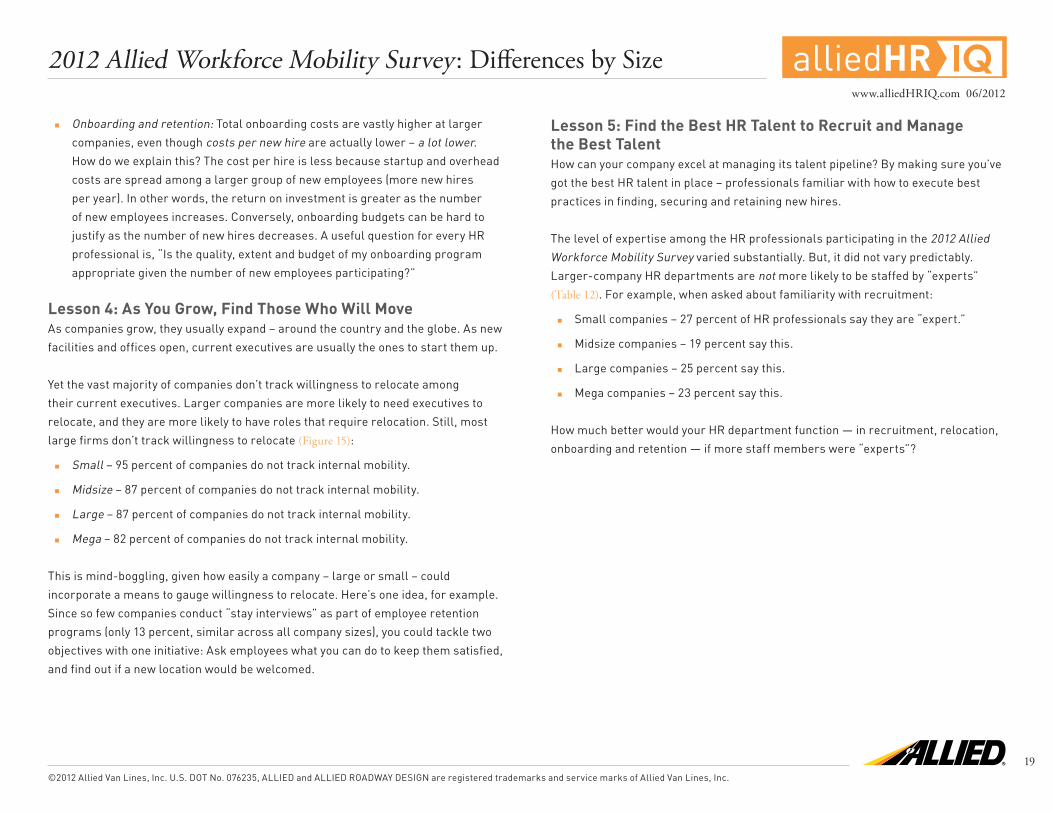
Lesson 4: As You Grow, Find Those Who Will Move As companies grow, they usually expand – around the country and the globe. As new
facilities and offices open, current executives are usually the ones to start them up.
Yet the vast majority of companies don’t track willingness to relocate among
their current executives. Larger companies are more likely to need executives to
relocate, and they are more likely to have roles that require relocation. Still, most
large firms don’t track willingness to relocate (Figure 15):
Small – 95 percent of companies do not track internal mobility.
Midsize – 87 percent of companies do not track internal mobility.
Large – 87 percent of companies do not track internal mobility.
Mega – 82 percent of companies do not track internal mobility.
This is mind-boggling, given how easily a company – large or small – could
incorporate a means to gauge willingness to relocate. Here’s one idea, for example.
Since so few companies conduct “stay interviews” as part of employee retention
programs (only 13 percent, similar across all company sizes), you could tackle two
objectives with one initiative: Ask employees what you can do to keep them satisfied,
and find out if a new location would be welcomed.
Lesson 5: Find the Best HR Talent to Recruit and Manage the Best Talent How can your company excel at managing its talent pipeline? By making sure you’ve
got the best HR talent in place – professionals familiar with how to execute best
practices in finding, securing and retaining new hires.
The level of expertise among the HR professionals participating in the 2012 Allied
Workforce Mobility Survey varied substantially. But, it did not vary predictably.
Larger-company HR departments are not more likely to be staffed by “experts”
(Table 12). For example, when asked about familiarity with recruitment:
Small companies – 27 percent of HR professionals say they are “expert.”
Midsize companies – 19 percent say this.
Large companies – 25 percent say this.
Mega companies – 23 percent say this.
How much better would your HR department function — in recruitment, relocation,
onboarding and retention — if more staff members were “experts”?
19
IQwww.alliedHRIQ.com 06/2012
©2012 Allied Van Lines, Inc. U.S. DOT No. 076235, ALLIED and ALLIED ROADWAY DESIGN are registered trademarks and service marks of Allied Van Lines, Inc.
2012 Allied Workforce Mobility Survey: Differences by Size
20
Figure 16 shows the percentage of HR professionals rating their programs as “highly successful.”
Source: 2012 Allied Workforce Mobility Survey AlliedHRIQ.com
Table 10 shows the percentage of companies with no formal programs (NFP) and highly successful programs (HSP).
Source: 2012 Allied Workforce Mobility SurveyAlliedHRIQ.com
Table 11 shows average corporate spending on recruitment, relocation and onboarding.
* “Onboarding cost per new hire” is computed based on the average overall onboarding spending divided by the average number of annual new hires.
Source: 2012 Allied Workforce Mobility SurveyAlliedHRIQ.com
IQwww.alliedHRIQ.com 06/2012
©2012 Allied Van Lines, Inc. U.S. DOT No. 076235, ALLIED and ALLIED ROADWAY DESIGN are registered trademarks and service marks of Allied Van Lines, Inc.
2012 Allied Workforce Mobility Survey: Differences by Size
21
Question: Do you regularly track the willingness of existing executives to relocate?
Source: 2012 Allied Workforce Mobility SurveyAlliedHRIQ.com
Table 12 shows the percentage of HR professionals rating staff expertise as expert, very familiar, familiar or unfamiliar.
Source: 2012 Allied Workforce Mobility SurveyAlliedHRIQ.com