2012-13 Executive Budget Financial Plan
402
FY 2013 EXECUTIVE BUDGET FINANCIAL PLAN TABLE OF CONTENTS INTRODUCTION ...............................................................................................................1 FINANCIAL PLAN OVERVIEW .......................................................................................5 Financial Plan At-A-Glance .............................................................................................5 Executive Summary .........................................................................................................6 Current Fiscal Year (FY 2012).........................................................................................9 Executive Budget Financial Plan Overview...................................................................11 Projected Closing Balances ............................................................................................14 Annual Spending Growth ...............................................................................................15 Explanation of Executive Budget Gap-Closing Plan .....................................................18 Other Matters Affecting the Financial Plan ...................................................................24 MULTI-YEAR FINANCIAL PLAN PROJECTIONS .............................................................. 33 YEAR-TO-DATE OPERATING RESULTS .....................................................................85 GAAP-BASIS FINANCIAL PLAN/OTHER POST-EMPLOYMENT BENEFITS......... 95 FISCAL IMPACT ON LOCAL GOVERNMENTS ................................................................... 99 GLOSSARY OF ACRONYMS ..................................................................................................... 103 FINANCIAL PLAN TABLES AND ACCOMPANYING NOTES................................107
Transcript of 2012-13 Executive Budget Financial Plan

FY 2013 EXECUTIVE BUDGET FINANCIAL PLAN
TABLE OF CONTENTS INTRODUCTION ...............................................................................................................1
FINANCIAL PLAN OVERVIEW .......................................................................................5 Financial Plan At-A-Glance .............................................................................................5 Executive Summary .........................................................................................................6 Current Fiscal Year (FY 2012) .........................................................................................9 Executive Budget Financial Plan Overview ...................................................................11 Projected Closing Balances ............................................................................................14 Annual Spending Growth ...............................................................................................15 Explanation of Executive Budget Gap-Closing Plan .....................................................18 Other Matters Affecting the Financial Plan ...................................................................24
MULTI-YEAR FINANCIAL PLAN PROJECTIONS .............................................................. 33 YEAR-TO-DATE OPERATING RESULTS .....................................................................85 GAAP-BASIS FINANCIAL PLAN/OTHER POST-EMPLOYMENT BENEFITS ......... 95 FISCAL IMPACT ON LOCAL GOVERNMENTS ................................................................... 99 GLOSSARY OF ACRONYMS ..................................................................................................... 103 FINANCIAL PLAN TABLES AND ACCOMPANYING NOTES ................................107


INTRODUCTION


1
INTRODUCTION This Executive Budget Financial Plan for FY 2013 (the “Executive Budget” or “Executive Budget Financial Plan”) summarizes the State of New York’s official Financial Plan projections for FYs 2012 through 2016. The State’s FY 2013 will begin on April 1, 2012 and end on March 31, 2013. The Financial Plan projections reflect the impact of the Governor’s Executive Budget for FY 2013. The State’s General Fund — the fund that receives the majority of State taxes and all income not earmarked for a particular program or activity — is required to be balanced on a cash basis of accounting. The State Constitution and State Finance Law do not define budget balance. In practice, the General Fund is considered balanced on a cash basis of accounting if sufficient resources are expected to be available during the fiscal year for the State to (a) make all required payments, including personal income tax refunds, without the issuance of deficit notes or bonds, and (b) restore the balances in the Tax Stabilization Reserve and Rainy Day Reserve to levels at or above the levels on deposit when the fiscal year began. The General Fund is typically the financing source of last resort for the State’s other major funds, including HCRA1 funds, the DHBTF, the STAR Fund, and the Lottery Fund. Therefore, the General Fund projections account for any estimated funding shortfalls in these funds. Since the General Fund is the fund that is required to be balanced, the focus of the State’s budget discussion is often weighted toward the General Fund. The State accounts for receipts and disbursements by the fund in which the activity takes place (such as the General Fund), and the broad category or purpose of that activity (such as State Operations). The Financial Plan tables sort State projections and results by fund and category. The State also reports disbursements and receipts activity by two other broad measures: State Operating Funds, which includes the General Fund and funds specified for dedicated purposes, but excludes Federal Funds and Capital Projects Funds; and All Governmental Funds (“All Funds”), which includes both State and Federal Funds and provides the most comprehensive view of the financial operations of the State. Fund types of the State include: the General Fund; State Special Revenue Funds, which receive certain dedicated taxes, fees and other revenues that are used for a specified purpose; Federal Special Revenue Funds, which receive certain Federal grants; Capital Projects Funds, which account for costs incurred in the construction and rehabilitation of roads, bridges, prisons, and other infrastructure projects; and Debt Service Funds, which account for the payment of principal, interest, and related expenses for debt issued by the State and its public authorities.
1 Please see “Glossary of Acronyms” at the end of this document for the definitions of commonly used acronyms and abbreviations that appear in the text.

INTRODUCTION
2
The factors affecting the State's financial condition are complex. This Executive Budget Financial Plan contains forecasts, projections and estimates that are based on expectations and assumptions which existed at the time they were prepared. Since many factors may materially affect fiscal and economic conditions in the State, the inclusion in this Executive Budget Financial Plan of forecasts, projections, and estimates should not be regarded as a representation that such forecasts, projections, and estimates will occur. Forecasts, projections and estimates are not intended as representations of fact or guarantees of results. The words “expects,” “forecasts,” “projects,” “intends,” “anticipates,” “estimates,” and analogous expressions are intended to identify forward-looking statements in the Executive Budget Financial Plan. Any such statements inherently are subject to a variety of risks and uncertainties that could cause actual results to differ materially and adversely from those projected. Such risks and uncertainties include, among others, general economic and business conditions, changes in political, social and economic conditions, impediments to the implementation of gap-closing actions, regulatory initiatives and compliance with governmental regulations, litigation and various other events, conditions and circumstances, many of which are beyond the control of the State. These forward-looking statements speak only as of the date they were prepared.

FINANCIAL PLAN OVERVIEW


5
FINANCIAL PLAN OVERVIEW
FINANCIAL PLAN AT-A-GLANCE
FY 2012 Current
Before Actions 1
Executive Proposal
State Operating Funds Budget - (Adjusted) 2
Size of Budget $86,227 $88,660 $91,472 $89,436Annual Growth 5.2% 2.8% 3.2% 0.9%
State Operating Funds Budget (Unadjusted)Size of Budget $84,417 $87,048 $90,770 $88,734Annual Growth 9.8% 3.1% 4.3% 1.9%
Other Budget Measures General Fund (with transfers) $55,373 $56,915 $59,794 $58,592
6.1% 2.8% 5.1% 2.9%
State Funds (Including Capital) $90,118 $93,288 $96,504 $94,7959.9% 3.5% 3.4% 1.6%
Capital Budget (Federal and State) $7,844 $8,078 $7,299 $7,84410.3% 3.0% -9.6% -2.9%
Federal Operating $42,564 $37,609 $33,839 $35,932-0.8% -11.6% -10.0% -4.5%
All Funds $134,825 $132,735 $131,908 $132,5106.3% -1.6% -0.6% -0.2%
Capital Budget (Including "Off-Budget") $9,280 $9,726 $9,075 $9,5355.6% 4.8% -6.7% -2.0%
All Funds (Including "Off-Budget" Capital) $136,261 $134,383 $133,684 $134,2016.0% -1.4% -0.5% -0.1%
Inflation (CPI) 1.6% 3.2% 1.7% 1.7%
All Funds Receipts Taxes $60,870 $64,532 $65,258 $66,533
5.6% 6.0% 1.1% 3.1%Miscellaneous Receipts $23,148 $23,832 $23,987 $24,255
-1.7% 3.0% 0.7% 1.8%Federal Grants $49,303 $43,942 $39,534 $41,936
4.3% -10.9% -10.0% -4.6%Total Receipts $133,321 $132,306 $128,779 $132,724
3.8% -0.8% -2.7% 0.3%
Budget GapsFY 2013 ($3,500) $0FY 2014 ($3,624) ($715)FY 2015 ($5,044) ($2,974)FY 2016 ($4,246) ($3,721)
Total General Fund Reserves $1,376 $1,675 $1,798Rainy Day Reserve Funds $1,206 $1,306 $1,306All Other Reserves $170 $369 $492
State Workforce (Subject to Direct Executive Control) 125,787 121,868 121,789
Debt Debt Service as % All Funds Receipts 4.6% 4.9% 4.9% 5.1%State Related Debt Outstanding $55,664 $56,978 $57,252 $58,124
1
2
(millions of dollars)FINANCIAL PLAN AT-A-GLANCE: KEY MEASURES
FY 2013
Before December 2011 Special Session and Executive Budget proposals to eliminate the projected budget gap.Adjusted for enhanced Federal share of Medicaid (FMAP) benefit that temporarily lowered State Medicaidspending; school aid payment deferred from FY 2010 to FY 2011; planned pension amortization; and retroactivelabor settlements.
FY 2011 Results

FINANCIAL PLAN OVERVIEW
6
EXECUTIVE SUMMARY UPDATED FISCAL SITUATION
FY 2012
The Mid-Year Update to the Financial Plan2 estimated that the General Fund had a potential budget shortfall of $350 million in the current fiscal year, which was expected to be closed through administrative actions.
Based on a review of updated disbursement patterns (as modified by ongoing spending
controls), the availability of excess cash balances in other funds, and other factors, DOB now expects the General Fund to end the current fiscal year in balance3 on a cash basis of accounting. Significant risks remain, however, especially concerning tax collections in the final quarter of the (See “Current Fiscal Year (FY 2012)” herein.)
FY 2013
For FY 2013, DOB projects a budget gap of $3.5 billion, the upper end of the potential
gap range identified in the Mid-Year Update, based on a review of updated economic and receipts data. (See “Multi-Year Financial Plan Projections” herein.)
The budget gaps projected for the future years of the Financial Plan have been increased
to the upper end of their Mid-Year range and now total $3.6 billion in FY 2014 and $5 billion in FY 2015. All other changes to the gaps, including the impact of tax reform legislation enacted in December 2011, are described as part of the Executive Budget gap-closing plan. (See “Explanation of Executive Budget Gap-Closing Plan” herein.)
Budget gaps represent the difference between projected General Fund disbursements,
including transfers to other funds needed to maintain current services and specific commitments, and the expected level of resources to pay for them.4 The gaps are based on a number of assumptions and projections developed by DOB in conjunction with other State agencies.5
The General Fund is typically the financing source of last resort for the State’s other
major funds, including HCRA, DHBTF, the STAR Fund, and the Lottery Fund. Therefore, the General Fund projections account for any estimated funding shortfalls in these funds.
2 November 11, 2011. 3 Neither the State Constitution nor State Finance Law provides a precise meaning of budget balance. In practice, the General Fund is considered "balanced" on a cash-basis of accounting if, at the end of a State fiscal year, all planned payments, including PIT refunds, have been made without the issuance of deficit notes or bonds, and the balances in the Tax Stabilization Reserve and Rainy Day Reserve have been restored to levels at or above the levels on deposit when the fiscal year began. 4 Typically referred to as the “current services” or “base” gaps. 5 See DOB’s Economic, Revenue, and Spending Methodologies, November 2011, at www.budget.ny.gov.

FINANCIAL PLAN OVERVIEW
7
EXECUTIVE BUDGET FOR FY 2013
Governor Cuomo’s Executive Budget for FY 2013 continues the reformation of State finances that began with the budget for FY 2012. The Executive Budget would eliminate the General Fund budget gap of $3.5 billion in FY 2013 and result in substantially lower budget gaps in future years.
If enacted as proposed, the Executive Budget would hold annual spending growth in State
Operating Funds to 1.9 percent. All Governmental Funds spending would decline by $225 million (-0.2 percent) from the level estimated for FY 2012. All Funds spending in FY 2013 is expected to be $2.3 billion (-1.7 percent) below actual spending in FY 2011, the most recent budget enacted before Governor Cuomo took office.
The gap-closing plan for FY 2013 consists of $2 billion in savings from spending control
and $1.5 billion in net new resources from tax reform approved in December 2011. (See “Explanation of Executive Budget Gap-Closing Plan” herein.)
State agency savings ($1.14 billion) build on redesign and cost-control efforts initiated in
FY 2012. These include further reductions in State agency operations through attrition and strict controls on hiring; enterprise-wide consolidation of procurement, information technology, real estate, and workforce management functions; and a range of operational measures to improve efficiency. The total cost of State Operating Funds agency operations (which consist of personal service, fringe benefit, and non-personal services costs) is estimated at $23.5 billion in FY 2013, a decrease of 0.4 percent from the FY 2012 estimate.
Widening the scope of FY 2012 reforms, key savings proposals in local assistance ($756
million) target automatic spending increases that are unrelated to performance or actual costs. The most significant proposal would repeal automatic “cost-of-living” increases and trend factors in FY 2013 for all human service providers, and grant all future increases, starting in FY 2014, through a rational, performance-based awards system. Other proposed savings include continued programmatic, auditing, and financial reviews, elimination of subsidies, and other measures. Disbursements for State Operating Funds local assistance are projected to total $59.1 billion in FY 2013, an annual increase of 2.6 percent.
The Executive Budget honors the two-year commitment made in FY 2012 to fund School
Aid (on a school year basis) at a level consistent with the growth in NYS personal income, and Medicaid at the long-term average of the medical component of the Consumer Price Index. In FY 2013, State funding for both programs increases by approximately 4 percent from their 2012 levels.

FINANCIAL PLAN OVERVIEW
8
Consistent with principles of sound fiscal management, the gap-closing plan generates recurring savings that reduce the budget gaps projected in future years. After reflecting the proposals in the Executive Budget, the budget gap in FY 2014 is projected at $715 million, the lowest “first out-year” budget gap -- in absolute dollars -- in two decades. The FY 2014 gap is equal to approximately 1.2 percent of projected General Fund receipts. By comparison, the gap closed in FY 2012 equaled nearly 18 percent of receipts.
The gap-closing plan provides sufficient resources to cover essential new costs, including
State funding to maintain thousands of child-care slots for working families that would otherwise be lost due to a reduction in Federal aid.
DOB estimates the State would end FY 2013 with a General Fund balance of $1.8 billion
under the Executive Budget proposal. The closing balance includes a deposit of $100 million to the State’s rainy day reserve that is planned in FY 2012 (the deposit would be the first to the reserve since FY 2008). Balances in the State’s principal reserve funds are expected to remain unchanged in FY 2013. (See "Projected Closing Balances" herein.)
The following sections of the Financial Plan Overview provide more detailed information on the updated estimates for the current fiscal year; the highlights of the Executive Budget gap-closing plan for FY 2013 and the impact of the plan on key fiscal measures; and an assessment of risks to the Financial Plan.

FINANCIAL PLAN OVERVIEW
9
CURRENT FISCAL YEAR (FY 2012) The Mid-Year Update to the Financial Plan estimated that the General Fund had a potential budget shortfall of $350 million in the current fiscal year, which was expected to be closed through administrative actions. Based on a review of updated disbursement patterns (as modified by ongoing spending controls), the availability of excess cash balances in other funds, and other factors, DOB now expects the General Fund to end the current fiscal year in balance on a cash basis. The table below summarizes the revisions to the FY 2012 Financial Plan.
General Fund receipts, including transfers from other funds, are expected to total $57.2 billion in FY 2012, an increase of $348 million compared to the Mid-Year Financial Plan. The estimate for tax receipts (excluding the impact of debt service changes) is virtually unchanged since the Mid-Year Update, reflecting lower estimated collections due to economic weakness offset by the initial impact of State tax reform legislation and higher expected audit receipts in the remainder of the year. Estimated annual debt service on the State’s PIT revenue bonds and LGAC bonds has been revised downward since the Mid-Year Update, due to debt management activities and the timing of bond sales. The estimate for all other receipts, including miscellaneous receipts and cash balances transferred from other funds, has been increased based on a review of collections to date and current fund balances.
FY 2012
MID-YEAR ESTIMATE (350)
Receipts Revisions 348Tax Receipts1
3Miscellaneous Receipts 92Debt Service 82Non-Tax Transfers/Fund Sweeps 171
Disbursements Revisions (60)Forecast Revisions 180 Local Assistance 206 Debt Service 56 Payment of Retroactive Labor Agreement (62) All Other (20)Planned Prepayments (240) Debt Service (140) Additional Pension Payment (100)
Use of Prior-Year Labor Agreements (2007-2011) Reserve 62
CURRENT ESTIMATE 0
GENERAL FUND BUDGETARY BASIS SURPLUS/(GAP) ESTIMATE FOR FY 2012SUMMARY OF CHANGES FROM MID-YEAR UPDATE
(millions of dollars)
1 Excludes impact of debt service reestimates.
SAVINGS/(COSTS)

FINANCIAL PLAN OVERVIEW
10
General Fund disbursements, including transfers to other funds, are now estimated at $56.9 billion in FY 2012, an increase of $60 million from the Mid-Year estimate, which reflects downward revisions to disbursements, offset by planned pre-payment of expenses. Excluding the impact of $240 million in planned prepayments (described below), General Fund disbursements in FY 2012 are expected to fall approximately $180 million below the Mid-Year estimate. Estimated disbursements have been reduced across a range of programs and activities in local assistance and debt service, reflecting operating results to date, the continuing impact of cost control measures imposed on discretionary spending, and the conservative estimation of General Fund costs. In addition, the State reached a tentative collective bargaining agreement for FY 2006 to FY 2015 with the Agency Police Services Unit (APSU) which represents agency law enforcement officers in SUNY and the Department of Environmental Conservation. This agreement, which must still be ratified, is expected to increase State Operations spending in the current year by $62 million for negotiated wage increases that cover the current and prior fiscal years. Payments are expected to be financed from the reserve set aside for this purpose and therefore have no impact on net operating results. The net Financial Plan savings are expected to be used in the current year to (a) pay $140 million in debt service due in FY 2013 (which has the effect of lowering the gap in that year by an equal amount), and (b) increase the State’s planned payment to the New York State and Local Employees’ Retirement System by $100 million, which will provide interest savings over the plan period. Consistent with prior updates, the current Financial Plan includes a planned deposit of $100 million to the Rainy Day Reserve in FY 2012. The deposit is subject to the approval of the budget director and dependent on actual operating results in the final quarter of the fiscal year. The General Fund is expected to end FY 2012 with a cash balance of $1.7 billion. The balance consists of $1.03 billion in the Tax Stabilization Reserve, $275 million in the Rainy Day Reserve (including the $100 million planned deposit), $51 million in the Community Projects Fund, $21 million in the Contingency Reserve, and $13 million reserved for debt management. In addition, the balance includes $284 million set aside for potential retroactive labor settlements with unions that have not agreed to contracts through FY 2011. Risks to budget balance remain in the current fiscal year. They include the potential that actual tax receipts may fall below the revised estimates; year-end transactions, such as the transfer of excess balances from other funds or payments from non-State entities, may occur at lower levels than assumed in the Financial Plan; and disbursements in certain programs, especially economically-sensitive programs such as Medicaid, may exceed budgeted amounts. (See “Other Matters Affecting the Financial Plan - Financial Plan Risks” herein.)

FINANCIAL PLAN OVERVIEW
11
EXECUTIVE BUDGET FINANCIAL PLAN OVERVIEW The Governor’s Executive Budget would eliminate the General Fund budget gap of $3.5 billion in FY 2013 and substantially lower the budget gaps that would need to be closed in future years. The gap-closing plan consists of $2 billion in savings by controlling State spending and $1.5 billion in net new resources from tax reform. It includes no new borrowing for operating expenses. The following table summarizes the multi-year impact of the gap-closing plan.
Spending Control$2.057%
Tax Reform$1.543%
FY 2013 Gap‐Closing Plan$3.5 Billion($ in billions)
FY 2013 FY 2014 FY 2015 FY 20161
REVISED GAPS (3,500) (3,624) (5,044) (4,246)
FY 2013 Executive Budget Proposals 3,500 2,909 2,070 525
Spending Control 1,964 1,506 1,435 1,250Agency Operations 1,141 1,089 842 861Local Assistance 756 580 779 660Debt Management 140 0 0 0New Initiatives (73) (163) (186) (271)
Tax Reform 1,536 1,702 1,033 (178)Tax Reform 1,931 2,034 1,335 79MTA Payroll Tax Small Business Relief (250) (250) (250) (250)Tax Credits/Other Initiatives (145) (82) (52) (7)
New Costs 0 (299) (398) (547)Child Care Preservation (93) (215) (215) (215)Mental Hygiene System Funding 0 (100) (200) (300)Additional Pension Payment 0 (80) (70) (61)All Other 93 96 87 29
EXECUTIVE BUDGET SURPLUS/(GAPS) 0 (715) (2,974) (3,721)1 Gap estimate for FY 2016 is published for the first time with this FY 2013 Executive Budget.
(millions of dollars)
GENERAL FUND BUDGETARY BASIS SURPLUS/(GAP) PROJECTIONSSUMMARY OF CHANGES FROM MID-YEAR THROUGH EXECUTIVE BUDGET RECOMMENDATION
FINANCIAL PLAN OVERVIEW
12
Under the Executive proposal, the budget gap in FY 2014 is projected at $715 million, equal to approximately 1.2 percent of projected General Fund receipts. By comparison, the gap closed in FY 2012 equaled nearly 18 percent of expected receipts. The budget gaps in future years of the plan are also reduced. The total gap over the four-year plan period is projected to total approximately $7.4 billion -- more than 25 percent lower than the one-year gap that needed to be closed in FY 2012. SPENDING CONTROL The Executive Budget gap-closing plan reflects $2 billion in savings from spending control.
State agency operations savings ($1.14 billion) build on redesign and cost-control efforts initiated in FY 2012. These include further reductions in State agency operations through attrition and strict controls on hiring; enterprise-wide consolidation of procurement, information technology, real estate, workforce management; and a range of operational measures to improve efficiency. The total cost of State Operating Funds agency operations, which consists of personal service, fringe benefit, and non-personal services costs, is estimated at $23.5 billion in FY 2013, a decrease of 0.4 percent from the FY 2012 estimate.
Widening the scope of FY 2012 reforms, key savings proposals in local assistance ($756
million) target automatic spending increases that are unrelated to performance or actual costs. The most significant proposal would repeal automatic “cost-of-living” increases and trend factors in FY 2013 for all human service providers, and grant all future increases, starting in FY 2014, through a rational, performance-based awards system. Other savings include continued programmatic, auditing, and financial reviews, elimination of subsidies, and other measures. Disbursements for State Operating Funds local assistance are projected to total $59.1 billion in FY 2013, an annual increase of 2.6 percent.
Efficient management of the State’s debt portfolio is expected to permit the State to pay
in FY 2012 approximately $140 million in debt service that is due in FY 2013. This has the effect of lowering the gap in FY 2013 by the amount of the prepayment.
The Executive Budget includes a number of new initiatives, which will be financed by
recurring savings proposed in the gap-closing plan. The Budget proposes that the State (a) assume the full cost of annual growth in the Medicaid program over a period of three years, and responsibilities for Medicaid eligibility and enrollment over a period of five years; (b) dedicate resources to create a new centralized hotline to report allegations of abuse and neglect of vulnerable persons; and (c) assume responsibility for administering SSI benefits from the Federal government.

FINANCIAL PLAN OVERVIEW
13
TAX REFORM The tax reform legislation approved in December 2011 will generate an estimated $1.5 billion in net resources to help close the FY 2013 budget gap. The tax code changes are expected to provide approximately $1.9 billion in additional receipts in FY 2013 when compared with the Mid-Year Update. Of this amount, approximately $250 million will be used to mitigate the impact of the law changes on the MTA, and $145 million will be used for tax credits and employment initiatives. (See the “2012-13 Executive Budget Economic and Revenue Outlook,” a companion volume to this Financial Plan.) NEW COSTS/OTHER CHANGES The Financial Plan provides sufficient resources in FY 2013 to cover essential new costs, including State funding to maintain child care slots that would otherwise be lost due to a reduction in Federal aid. In addition, the Financial Plan assumes new State resources will be needed to maintain service levels in the Mental Hygiene System, starting in FY 2014, as Federal aid declines due, in part, to continuing movement of clients from institutionalized settings into community settings. Lastly, the Financial Plan assumes the State will increase its annual pension contribution, starting in FY 2014, above the level required under the 2010 amortization legislation, thereby lowering long-term interest costs. In FY 2013, the costs of these programs are expected to be fully offset by other savings.

FINANCIAL PLAN OVERVIEW
14
PROJECTED CLOSING BALANCES DOB estimates that the General Fund will end with balances of $1.7 billion in FY 2012 and $1.8 billion in FY 2013. The following table summarizes the balances within the General Fund.
FY 2012Current
Annual Change
FY 2013Proposed
Projected Fund Balance 1,675 123 1,798
Statutory Reserves:
Tax Stabilization Reserve Fund 1,031 0 1,031
Rainy Day Reserve Fund 275 0 275
Contingency Reserve Fund 21 0 21
Community Projects Fund 51 (51) 0
Reserved for:
Prior Year Labor Agreements (2007-2011) 284 174 458
Reserved for Debt Reduction 13 0 13
GENERAL FUND ESTIMATED CLOSING BALANCES(millions of dollars)
The closing balances in each year include amounts reserved to cover the costs of potential retroactive labor settlements with unions that have not agreed to terms for prior contract periods. The amounts are calculated based on the pattern settlement for the FY 2008 through FY 2011 period agreed to by the State’s largest unions. The Financial Plan assumes that no additional agreements will be financed from the reserve in FY 2012 beyond the APSU agreement described above, and that the remaining reserve will be carried forward into FY 2013. Reserves will be reduced as subsequent labor agreements for prior periods are reached. The Community Projects Fund, which finances discretionary (“member item”) grants allocated by the Legislature and Governor, is expected to decrease by $51 million, reflecting the spend-down of the balance and no planned future deposits. Balances in the State’s principal reserve funds are expected to remain unchanged in FY 2013.

FINANCIAL PLAN OVERVIEW
15
ANNUAL SPENDING GROWTH DOB estimates that State Operating Funds spending will total $88.7 billion in FY 2013, an increase of $1.7 billion (1.9 percent) from the estimate for FY 2012. All Governmental Funds spending, which includes capital projects and Federal operating funds, would total $132.5 billion, a decrease of $225 million (-0.2 percent) from the current year. Consistent with past years, the aggregate spending projections (i.e., the sum of all projected spending by individual agencies) in special revenue funds have been adjusted downward based on typical spending patterns and the observed variance over time between estimated and actual results.
The annual growth in State Operating Funds spending is affected by several unique factors: (a) the planned amortization of the State’s pension costs above a certain percentage of payroll, as authorized in 2010; (b) the set-aside of a reserve to pay for potential retroactive labor settlements, rather than assuming spending for these settlements; and (c) the phase-out of the Federal government’s payment of an increased share of State Medicaid costs. Adjusted for these unique factors, State Operating Funds spending would increase by approximately $717 million in FY 2013, or 0.8 percent, as shown in the table below.
Annual $ Change
Annual % Change
Annual $ Change
Annual % Change
State Operating Funds 87,048 90,770 3,722 4.3% 88,734 1,686 1.9%General Fund (excluding transfers) 50,787 53,107 2,320 4.6% 51,425 638 1.3%Other State Funds 30,328 31,301 973 3.2% 31,113 785 2.6%Debt Service Funds 5,933 6,362 429 7.2% 6,196 263 4.4%
All Governmental Funds 132,735 131,908 (827) -0.6% 132,510 (225) -0.2%State Operating Funds 87,048 90,770 3,722 4.3% 88,734 1,686 1.9%Capital Projects Funds 8,078 7,299 (779) -9.6% 7,844 (234) -2.9%Federal Operating Funds 37,609 33,839 (3,770) -10.0% 35,932 (1,677) -4.5%
General Fund, including Transfers 56,915 59,794 2,879 5.1% 58,592 1,677 2.9%
State Funds 93,288 96,504 3,216 3.4% 94,795 1,507 1.6%
TOTAL DISBURSEMENTS
Before Actions After Actions
FY 2012 Current
FY 2013 Base
FY 2013 Proposed
(millions of dollars)
Annual $ Change
Annual % Change
Annual $ Change
Annual % Change
State Operating Funds 87,048 90,770 3,722 4.3% 88,734 1,686 1.9%
Adjustments 1 1,612 702 (910) -56.5% 702 (910) -56.5%Pension Amortization (Authorized 2011) 575 782 207 36.0% 782 207 36.0%Retroactive Labor Settlements 284 174 (110) -38.7% 174 (110) -38.7%Enhanced FMAP (DOH Medicaid) 753 (254) (1,007) -133.7% (254) (1,007) -133.7%
STATE OPERATING FUNDS (ADJUSTED) 88,660 91,472 2,812 3.2% 89,436 776 0.9%
1
STATE OPERATING FUNDS TOTAL DISBURSEMENTS (ADJUSTED)(millions of dollars)
See text above.
FY 2012 Current
FY 2013 Base
Before Actions
FY 2013 Proposed
After Actions

FINANCIAL PLAN OVERVIEW
16
SOURCES OF SPENDING GROWTH
Local assistance spending is expected to increase by $1.5 billion, or 2.6 percent, over FY 2012. In FY 2013, State funding for School Aid (on a school year basis) and Medicaid increases by approximately 4 percent from 2012 levels, consistent with caps enacted in FY 2012. Medicaid spending, before factoring in the savings expected from the State’s takeover of administration and including Medicaid costs that are reflected on the non-personal services line of the Financial Plan, increases by 4 percent (not shown on table). Other local assistance increases include transportation, reflecting disbursements of dedicated tax receipts; special education, resulting from actions that temporarily reduced spending in FY 2012; and child welfare, due to a reduction in available Federal funding and lower growth in claims-based programs. These increases are partly offset by annual reductions in mental hygiene programs
$ % $ %
State Operating Funds:
Local Assistance 57,548 59,768 2,220 3.9% 59,060 1,512 2.6%
School Aid 19,677 20,250 573 2.9% 20,002 325 1.7%
Medicaid 15,280 15,893 613 4.0% 15,859 579 3.8%
Transportation 4,257 4,325 68 1.6% 4,398 141 3.3%
Mental Hygiene 3,580 3,854 274 7.7% 3,576 (4) -0.1%
STAR 3,293 3,322 29 0.9% 3,322 29 0.9%
Social Services 3,010 3,229 219 7.3% 3,073 63 2.1%
Higher Education 2,605 2,691 86 3.3% 2,662 57 2.2%
All Other 5,846 6,204 358 6.1% 6,168 322 5.5%
State Operations/Fringe Benefits 23,623 24,697 1,074 4.5% 23,520 (103) -0.4%
State Operations 17,087 17,647 560 3.3% 17,132 45 0.3%
Executive Agecies: 9,429 9,593 164 1.7% 9,338 (91) -1.0%
Personal Service 6,672 6,697 25 0.4% 6,685 13 0.2%
Non-Personal Service 2,757 2,896 139 5.0% 2,653 (104) -3.8%
State University 5,167 5,361 194 3.8% 5,298 131 2.5%
City University 137 147 10 7.3% 120 (17) -12.4%
Elected Officials 2,354 2,546 192 8.2% 2,376 22 0.9%
Fringe Benefits/Fixed Costs 6,536 7,050 514 7.9% 6,388 (148) -2.3%
Pension Contribution 1,680 1,610 (70) -4.2% 1,574 (106) -6.3%
Employee/Retiree Health Insurance 3,291 3,731 440 13.4% 3,240 (51) -1.5%
Other Fringe Benefits/Fixed Costs 1,565 1,709 144 9.2% 1,574 9 0.6%
Debt Service 5,872 6,300 428 7.3% 6,149 277 4.7%
Capital Projects 5 5 0 0.0% 5 0 0.0%
TOTAL STATE OPERATING FUNDS 87,048 90,770 3,722 4.3% 88,734 1,686 1.9%
Capital Projects (State Funded) 6,240 5,734 (506) -8.1% 6,061 (179) -2.9%
TOTAL STATE FUNDS 93,288 96,504 3,216 3.4% 94,795 1,507 1.6%
Federal Aid (Including Capital Grants) 39,447 35,404 (4,043) -10.2% 37,715 (1,732) -4.4%
TOTAL ALL GOVERNMENTAL FUNDS 132,735 131,908 (827) -0.6% 132,510 (225) -0.2%
STATE SPENDING MEASURES: BEFORE AND AFTER BUDGET ACTIONS(millions of dollars)
FY 2012 Current
FY 2013 Base
Annual Change Before Actions FY 2013
Proposed
Annual Change After Actions

FINANCIAL PLAN OVERVIEW
17
reflecting the impact of ongoing cost-containment efforts, continued programmatic and costs reviews, and lower public health spending due to the phase-down of Federal-State Health Reform Partnership (F-SHRP) program and declines in the EPIC program resulting from prior-year cost containment actions. Agency spending on personal and non-personal service is expected to remain nearly flat on an annual basis. This reflects ongoing efforts to redesign State agency operations initiated in FY 2012. Spending on fringe benefits is projected to decline by $148 million (-2.3 percent). The decline is comprised of lower pension costs due to a $100 million prepayment of certain pension obligations in FY 2012 and a reconciliation of prior-year pension costs that will lower the State's pension bill in FY 2013 ($77 million), and lower employee health insurance due to the annualization of employee premium increases that were effective in mid-FY 2011.

FINANCIAL PLAN OVERVIEW
18
EXPLANATION OF EXECUTIVE BUDGET GAP-CLOSING PLAN The table below summarizes the Executive Budget gap-closing plan.
FY 2013 FY 2014 FY 2015 FY 2016
CURRENT SERVICES GAP ESTIMATES (3,500) (3,624) (5,044) (4,246)
Spending Controls 1,964 1,506 1,435 1,250
Agency Operations 1,141 1,089 842 861Agencies 580 386 18 127Independent Officials 255 310 424 330Enterprise/Consolidations 109 175 180 180Health Insurance Rate Renewal 130 130 130 130Fringe Benefits (New Proposals) 67 88 90 94
Local Assistance 756 580 779 660COLAs/Trends 150 169 168 118Mental Hygiene 172 92 59 (8)Social Services/Housing 144 98 204 195Public Health 105 58 28 19All Other 185 163 320 336
Debt Management 140 0 0 0
New Initiatives/Investments (73) (163) (186) (271)Local Medicaid Growth/Administrative Takeover 16 (23) (83) (181)Agency Redesign - Enterprise Services (43) (66) (27) (17)SSI Administration Takeover From Federal Government (11) (13) (21) (16)Protection of Vulnerable Populations (10) (30) (30) (30)Rural Rental Assistance (6) (6) (6) (6)All Other (19) (25) (19) (21)
Tax Reform 1,536 1,702 1,033 (178)Tax Code Reform 1,931 2,034 1,335 79MTA Payroll Tax Small Business Relief (250) (250) (250) (250)Reduce Corporate Tax on Manufacturers (25) (25) (25) 0New York Youth Works Tax Credit (20) (5) 0 0Economic Development Initiatives (32) (32) (13) (3)Inner-City Summer Youth Employment (25) 0 0 0Disaster Relief Package (20) (15) (10) 0Educational Opportunities (11) (4) (4) (4)All Other (12) (1) 0 0
New Costs/Other 0 (299) (398) (547)TANF Child Care Replacement (93) (215) (215) (215)Mental Hygiene System Funding 0 (100) (200) (300)Excess Pension Payment 0 (80) (70) (61)All Other 93 96 87 29
EXECUTIVE BUDGET SURPLUS/(GAP) ESTIMATE 0 (715) (2,974) (3,721)
GENERAL FUND GAP-CLOSING PLAN FOR FY 2013(millions of dollars)

FINANCIAL PLAN OVERVIEW
19
The sections below provide details on spending control and new costs in the Executive Budget Financial Plan. For more information on the Budget recommendations for major programs and activities see the section entitled “Multi-Year Financial Plan Projections - Disbursements” herein and the Executive Budget Briefing Book. For a discussion of the tax code changes, please see “FY 2012-13 Executive Budget Economic and Revenue Outlook.” SPENDING CONTROL Before the proposed spending controls and management actions in the Executive Budget, State Operating Funds spending was projected to total $90.8 billion, an increase of $3.7 billion, or 4.3 percent, over the current-year estimate. The FY 2013 Executive Budget recommends $2.0 billion in savings from spending control, which would reduce State Operating Funds spending in FY 2013 to $88.7 billion, an annual increase of 1.9 percent over the FY 2012 estimate. STATE AGENCY OPERATIONS Agency Operations include salaries, wages, fringe benefits, and non-personal service costs (e.g., utilities). State Operating Funds spending for agency operations is estimated at $23.5 billion in FY 2013, a decline of $103 million (-0.4 percent) from the current year. Reductions from the FY 2013 current-services forecast for agency operating costs contribute $1.1 billion to the General Fund gap-closing plan.
Agencies: Continued workforce management through a strict hiring freeze, annualization of savings from recent closures of facilities and elimination of excess capacity, and efforts to downsize State government are expected to result in lowered personal service and fringe benefits costs. The size of the Executive State workforce has declined from 125,787 FTEs in FY 2011 to 121,868 FTEs in FY 2012, a reduction of nearly 4,000 FTEs. The reduction in the size of the State workforce has led to significant declines in fringe benefit costs directly tied to salary levels, such as Social Security and pensions. In addition, a reconciliation of pension costs in FY 2011 will lower the State's pension bill in FY 2013 by $77 million. Additional savings are expected through operational efficiencies as agencies continue to redesign operations to improve service delivery, reduce costs, and eliminate duplicative functions.

FINANCIAL PLAN OVERVIEW
20
Independent Officials: The budgets for the Legislature, Judiciary, State Comptroller, and the Department of Law do not propose spending increases for FY 2013. The Judiciary budget includes pay increases for judges, as recommended by the Judicial Compensation Commission. This spending increase is offset by commensurate reductions achieved through the streamlining of administrative functions and reductions in funding for non-essential programs.
Enterprise/Consolidations: Efforts to centralize and coordinate enterprise services
such as procurement of information technology services, software and mobile communications, office supplies, and health services and pharmaceutical supplies, as well as rent reductions from statewide office space consolidations, are expected to reduce operational costs by reducing office vacancy rates and leveraging the State’s purchasing power. After necessary one-time investments, the multi-year Financial Plan reflects net savings from expected cost reductions. Specific actions for FY 2013 include: procurement savings through strategic sourcing of goods and services such as vehicles, software, food and office supplies ($100 million); and real estate savings through the relocation of state agencies from leased space into State-owned office space ($9 million). Longer-term projects are underway in information technology, grants management, call centers, business services, fleet management, enterprise-wide licensing and permitting, and learning management.
Health Benefits Management: The State has effectively managed its health benefits to control growth in health insurance spending. Year-to-year growth is expected to be less than national health trends.
Fringe Benefits (New Proposals): Savings is achieved by pre-paying certain pension
obligations in FY 2012 to avoid annual interest costs ($30 million); increasing Federal Medicare Part D reimbursements through the conversion of the retiree drug coverage program from the current Retiree Drug Subsidy to an Employer Group Waiver Plan ($26 million); and extending to employees of certain State public authorities the State's existing policy that requires State employees and retirees to contribute toward the cost of Medicare Part B premium reimbursement ($11 million).
FINANCIAL PLAN OVERVIEW
21
LOCAL ASSISTANCE Local assistance spending includes financial aid to local governments and non-profit organizations, as well as entitlement payments to individuals. State Operating Funds spending for local assistance is estimated at $59.1 billion in FY 2013, an increase of $1.5 billion (2.6 percent) from the current year. Reductions from the FY 2013 current-services forecast for local assistance include both targeted actions and additional savings from the continuation of prior-year cost containment actions, which together contribute $756 million to the General Fund gap-closing plan. The most significant gap-closing actions in local assistance include the following:
Human Services Cost-of-Living Increases/Trends: The Budget proposes eliminating the automatic 3.6 percent human services “cost-of-living” increase and maintaining existing rates for other programs, including OMH residential treatment facilities, community residences, family based treatment, and various residential and day programs for individuals with developmental disabilities. Beginning in FY 2014, a new system will take effect that will provide annual adjustments based on actual costs and performance.
Mental Hygiene: Savings are expected through continued programmatic reviews of OMH providers, and from expanded efforts to recover State funds through enhanced audit activities and financial reviews of not-for-profit providers; stringent cost controls and reduced use of institutional services, and investments in community based OPWDD programs; restructuring the Continuing Day Treatment program, shifting funding to more effective program models; and converting residential pipeline units to lower-cost alternatives.
Social Services/Housing: Savings are expected through streamlining and restructuring
financing of child support administration; eliminating funding for a shelter supplement initiative; and phasing in the planned 10 percent increase in public assistance grants over two years (5 percent in 2012 and 5 percent in 2013). In addition, funding for the Neighborhood and Rural Preservation programs would be eliminated.
Public Health: Disbursement projections have been adjusted to reflect claims by
municipalities in the GPHW program and other trends.
Other Local Programs: Savings are expected across multiple functions and program areas. These include cost-based revisions to School Aid based on updated claiming information from school districts and the estimated growth in NYS personal income; updated payment schedules for the Local Government Performance and Efficiency Program; and updated cost estimates for certain other programs. Savings are partially offset by increases in TAP funding driven by tuition increases and updated participation trends and funding for the Close to Home Juvenile Justice Initiative.

FINANCIAL PLAN OVERVIEW
22
In addition, changes in General Fund Medicaid spending reflect reduced HCRA financing due to downward revisions to cigarette tax forecasts, an acceleration of financing for capital improvements at health care facilities throughout the State, and multi-year revisions to estimated spending for the EPIC program and other HCRA programs. Projected Medicaid spending has also been updated for the estimated impact of enhanced Federal Financial Participation for individuals and couples without children, pursuant to Federal Health Care Reform, which is expected to lower the State share of Medicaid spending in FYs 2015 and 2016.
NEW INITIATIVES/INVESTMENTS
Local Government Medicaid Growth/Administrative Takeover: The FY 2013
Executive Budget includes proposals to establish a phased-in takeover of local government administration of the Medicaid program and to cap spending on local Medicaid administration at FY 2012 appropriated levels. The FY 2013 Executive Budget also provides Medicaid relief for all counties and New York City by reducing growth in local Medicaid payments.
Agency Redesign - Enterprise Services: The Executive Budget reflects investments to improve State operations. Specifically, State support for OFT and OGS has been increased to cover costs associated with the more centralized role these agencies are expected to take in providing shared business services, which are now decentralized across many State agencies. These services include management of the State’s assets, the streamlining of procurement processes, and the consolidation of technical and administrative resources. The greater centralization of these services is expected to achieve statewide savings and allow agencies to better focus on their core missions. These investments are expected to generate significant statewide savings over the multi-year Financial Plan from cost reductions, increased efficiency, and business transformation.
SSI Administration Takeover: The Executive Budget recommends that the State take over administration of the State’s participation in the Federal Supplemental Security Income Benefit currently administered by the Federal government, which is expected to generate savings in the later years of the Financial Plan.
Protection of Vulnerable Populations: Pursuant to preliminary recommendations of the Governor’s Special Advisor on Vulnerable Persons, a new centralized hotline will be established for reporting allegations of abuse and neglect of vulnerable persons in certain programs operated by State agencies, including Mental Hygiene, Health and Education.
Rental Assistance Program: Increased funding is recommended for the Rural Rental Assistance Program that provides State funded rental subsidies to approximately 4,700 low income occupants of rural housing projects financed by the Federal Department of Agriculture.

FINANCIAL PLAN OVERVIEW
23
NEW COSTS
TANF Child Care Replacement: Less Federal TANF funding is available for the State’s child care program. Therefore, State funding has been increased to maintain current funding levels in the child care program.
Mental Hygiene System Funding: Ongoing de-institutionalizing efforts, which will
allow individuals currently residing in State-operated Developmental Centers to be placed in more clinically appropriate settings based on their needs and abilities, is expected to reduce Federal Medicaid revenues.
Excess Pension Payment: The Financial Plan assumes the State will increase its annual
pension contribution, starting in FY 2014, above the level required under the 2010 amortization legislation, thereby lowering long-term interest costs.

FINANCIAL PLAN OVERVIEW
24
OTHER MATTERS AFFECTING THE FINANCIAL PLAN GENERAL The Executive Budget is subject to many complex economic, social, financial, and political risks and uncertainties, many of which are outside the ability of the State to control. DOB believes that the projections of receipts and disbursements in the Executive Budget are based on reasonable assumptions, but there can be no assurance that actual results will not differ materially and adversely from these projections. In recent fiscal years, actual receipts collections have fallen substantially below the levels forecast in the Financial Plan. The Executive Budget is based on numerous assumptions, including the condition of the State and national economies and the concomitant receipt of economically sensitive tax receipts in the amounts projected. Other uncertainties and risks concerning the economic and receipts forecasts include the impact of: national and international events, such as the Euro-zone financial crisis, on consumer confidence, oil supplies, and oil prices; Federal statutory and regulatory changes concerning financial sector activities; changes concerning financial sector bonus payouts, as well as any future legislation governing the structure of compensation; shifts in monetary policy affecting interest rates and the financial markets; financial and real estate market developments on bonus income and capital gains realizations; and household deleveraging on consumer spending and State tax collections. Among other factors, the Executive Budget is subject to various other uncertainties and contingencies relating to the extent, if any, to which wage increases for State employees exceed the annual wage costs assumed; realization of the projected rate of return for pension fund assets and current assumptions with respect to wages for State employees affecting the State's required pension fund contributions; the willingness and ability of the Federal government to provide the aid contemplated by the Executive Budget; the ability of the State to implement cost reduction initiatives, including reductions in State agency operations, and the success with which the State controls expenditures; and the ability of the State and its public authorities to market securities successfully in the public credit markets. Some of these specific issues are described in more detail herein. The projections and assumptions contained in the Executive Budget are subject to revisions which may involve substantial change. No assurance can be given that these estimates and projections, which include actions the State expects to be taken but which are not within the State's control, will be realized. BUDGET RISKS AND UNCERTAINTIES The Executive Budget is a proposal. There can be no assurance that the Legislature will not make changes that have an adverse impact on the budgetary projections set forth herein, or that it will take final action on the Executive Budget before the start of the new fiscal year on April 1, 2012. In prior years when a budget has not been enacted by the start of the fiscal year, the State has enacted interim appropriation and Article VII bills to maintain certain governmental services. Starting in FY 1996, the Legislature has annually approved the State’s debt service appropriations by the start of each State fiscal year.

FINANCIAL PLAN OVERVIEW
25
There can be no assurance that the General Fund will end the current fiscal year in balance on a budgetary cash basis of accounting, or that the budget gaps will not increase materially from current projections. If this were to occur, the State would be required to take additional gap-closing actions. These may include, but are not limited to, additional reductions in State agency operations; delays or reductions in payments to local governments or other recipients of State aid; suspension of capital maintenance and construction; extraordinary financing of operating expenses; or other measures. In some cases, the ability of the State to implement such actions requires the approval of the Legislature and cannot be implemented solely by the action of the Governor. State law grants the Executive certain powers to achieve the Medicaid savings assumed in the Financial Plan. However, there can be no assurance that these powers will be sufficient to limit the rate of annual growth in DOH State Funds Medicaid spending to the levels estimated in the Executive Budget Financial Plan. In addition, savings are dependent upon timely Federal approvals, appropriate amendments to existing systems and processes, and the participation of health care industry stakeholders. In the current fiscal year, State-share Medicaid disbursements to date have been consistent with expectations. The forecast contains specific transaction risks and other uncertainties including, but not limited to, the receipt of certain payments from public authorities; the receipt of miscellaneous revenues at the levels expected in the Financial Plan, including payments pursuant to the Tribal State Compact; and the achievement of cost-saving measures including, but not limited to, the transfer of available fund balances to the General Fund at the levels currently projected. Such risks and uncertainties, if they were to materialize, could have an adverse impact on the Financial Plan in the current year or future years. STATUS OF CURRENT LABOR NEGOTIATIONS The State has a five-year labor contract with the State’s largest union, CSEA, and a four-year labor contract with the State’s second-largest State employee union, PEF. Under both PEF and CSEA labor contracts, there are no general salary increases for three years (FY 2012 through FY 2014). Employee compensation during FY 2012 and FY 2013 will be temporarily reduced. Employees will receive deficit reduction leave (totaling nine days). CSEA-represented employees will receive a $1,000 lump sum payment ($775 paid in FY 2014 and $225 paid in FY 2015). Employees will receive a 2 percent salary increase in FY 2015 under both agreements, and CSEA-represented employees will receive a 2 percent increase in FY 2016. Employees represented by CSEA will be repaid the value of four days in equal consecutive installments starting at the end of the CSEA contract term and employees represented by PEF will be repaid the value of nine days in equal consecutive installments starting in FY 2016. The agreements also include substantial changes to employee health care contributions. Under the agreements, employees in these unions have contingent layoff protection for FYs 2012 and 2013 and continuing protection for the full term of the agreements. Workforce reductions due to management decisions to close or restructure facilities authorized by legislation, SAGE Commission recommendations, or material or unanticipated changes in the State's fiscal circumstances are not covered by this protection.

FINANCIAL PLAN OVERVIEW
26
Negotiations with the State’s other unions, which represent approximately 35 percent of the State workforce, are ongoing. The largest of these unions, with whom negotiations are continuing, are UUP, which represents faculty and non-teaching professional staff within the State University system, and NYSCOPBA, which represents the State’s correction officers. LABOR SETTLEMENTS FOR PRIOR CONTRACT PERIODS The Executive Budget Financial Plan continues to include a reserve to cover the costs of a pattern settlement with all unions that have not agreed to contracts through FY 2011. The pattern is based on the general salary increases agreed to by the State’s largest unions for the same period. There can be no assurance that actual settlements, some of which are subject to binding arbitration, will not exceed the amounts reserved. In August 2011, a statutorily authorized judicial compensation commission authorized a multi-year plan to provide salary increases for judges beginning in FY 2013, which will automatically take effect barring action by the Legislature and the Governor to obviate the increases. The Executive Budget assumes salary increases will be accommodated in the Judiciary’s current budget projections. CASH-FLOW PROJECTIONS The General Fund is authorized to borrow resources temporarily from other available funds in STIP for up to four months, or to the end of the fiscal year, whichever period is shorter. The amount of resources that can be borrowed by the General Fund is limited to the available balances in STIP, as determined by the State Comptroller. Available balances include money in the State’s governmental funds and a relatively small amount of other moneys belonging to the State. Several accounts in Debt Service Funds and Capital Projects Funds that are part of All Governmental Funds are excluded from the balances deemed available in STIP. These excluded funds consist of money obligated for debt service payments and bond proceeds. FY 2012 Through the first nine months of FY 2012, the General Fund used this STIP to meet certain payment obligations in April 2011, and repaid such amounts by the end of April 2011. While the General Fund may rely on this borrowing authority at other times during FY 2012, it is expected that such amounts will be repaid by the end of the month. The State continues to reserve money on a quarterly basis for debt service payments that are financed with General Fund resources. Money to pay debt service on bonds secured by dedicated receipts, including PIT bonds, continues to be set aside as required by law and bond covenants. DOB will continue to monitor and manage the State's cash position closely during the final quarter of the fiscal year in an effort to maintain adequate operating balances.

FINANCIAL PLAN OVERVIEW
27
FY 2013 Under the Executive Budget proposal, DOB estimates that the State will have sufficient liquidity to make payments as they become due. Consistent with prior years, DOB estimates that balances will reach relatively low levels in May, June, August, and December 2012. The following table provides an estimate of month-end balances for FY 2013. The information will be updated with the Enacted Budget Financial Plan.
General Other All Fund Funds Funds
April 4,599 3,223 7,822May 1,382 3,624 5,006June 1,773 2,846 4,619July 2,028 3,443 5,471August 1,493 4,437 5,930September 4,834 2,100 6,934October 3,601 2,578 6,179November 2,542 3,318 5,860December 1,873 2,266 4,139January 6,299 4,240 10,539February 6,169 4,565 10,734March 1,675 2,675 4,350
PROJECTED ALL FUNDS MONTH-END CASH BALANCES
(millions of dollars)FY 2013
FEDERAL ACTIONS The State receives a substantial amount of Federal aid for health care, education, transportation, and other governmental purposes. Any reduction in Federal funding levels could have a materially adverse impact on the State's Executive Budget. The Federal Budget Control Act (BCA) established a Joint Select Committee for Deficit Reduction to achieve $1.2 trillion in deficit reduction over ten years. On November 21, 2011, the Joint Select Committee announced that it failed to reach agreement on actions to reduce the deficit. Pursuant to the BCA, deficit reduction will now be achieved through the sequestration process, with automatic reductions scheduled to begin in January 2013. The BCA prescribes that approximately 18 percent of the $1.2 trillion in deficit reduction can be attributed to assumed debt service savings, while the remainder must be achieved through spending reductions, divided evenly between the Defense Department and non-Defense spending. The State is analyzing the potential impact of the BCA on the State Financial Plan and State economy. DOB estimates that, if the sequestration process were to operate as set forth in the BCA and without any further modification by Congress, New York State and local governments could lose approximately $5 billion in Federal funding over nine years, beginning in FY 2013. This does not account for potential declines in other revenues that may occur as a result of lost

FINANCIAL PLAN OVERVIEW
28
Federal funding. DOB will continue to refine its estimates and make adjustments to the Financial Plan as more definitive information becomes available. In addition, the Executive Budget may be adversely affected by other actions taken by the Federal government, including audits, disallowances, and changes to Medicaid rules. For example, all Medicaid claims are subject to audit and review by the Federal government. The Federal CMS recently engaged the State regarding claims for services provided to individuals in developmental centers operated by the New York State OPWDD. Although no official audit has commenced and the rates paid for these services are established in full accordance with the methodology set forth in the approved State Plan, adverse action by CMS relative to these claims could jeopardize a significant amount of Federal financial participation in the State Medicaid program. The State has begun the process of seeking CMS approval to proceed with the development of a new form of waiver (known as the “section 1115 demonstration waiver”) to create a contemporary and sustainable system of service funding and delivery for individuals with developmental disabilities. HEALTH INSURANCE COMPANY CONVERSIONS State law permits a health insurance company to convert its organizational status from a not-for-profit to a for-profit corporation (a “health care conversion”), subject to a number of terms, conditions, and approvals. Under State law, the State must use the proceeds from a health care company conversion for health-care-related expenses. For planning purposes, the Executive Budget assumes no proceeds from a health care conversion in FY 2012, but counts on proceeds of $250 million in FY 2013 and $300 million in FYs 2014 and 2015, which would be deposited into the HCRA account. If a conversion does not occur on the timetable or at the levels assumed in the Executive Budget, the State would be required to take other actions to increase available resources or to reduce planned spending in HCRA.

FINANCIAL PLAN OVERVIEW
29
DEBT REFORM ACT LIMIT The Debt Reform Act of 2000 restricts the issuance of State-supported debt to capital purposes only and limits such debt to a maximum term of 30 years. The Act limits the amount of new State-supported debt to 4 percent of State personal income and new State-supported debt service costs to 5 percent of All Funds receipts. The restrictions apply to all new State-supported debt issued on and after April 1, 2000. The cap on new State-supported debt outstanding began at 0.75 percent of personal income in FY 2001 and was fully phased-in at 4 percent of personal income during FY 2011, while the cap on new State-supported debt service costs began at 0.75 percent of All Funds receipts in FY 2001 and will increase until it is fully phased in at 5 percent during FY 2014. The State was found to be in compliance with the statutory caps for the most recent calculation period (October 2011). Current projections estimate that debt outstanding and debt service will continue to remain below the limits imposed by the Act. However, the State is continuing through a period of declining debt capacity. Based on the most recent personal income and debt outstanding forecasts, the available room under the debt outstanding cap is expected to decline from $3.1 billion in FY 2012 to $314 million in FY 2014. The State may consider measures to address capital spending priorities, debt financing practices, the inherent volatility of personal income as a basis for long-term planning, and other factors affecting debt capacity as events warrant.
Personal Actual/ $ %Year Income Cap % Recommended % (Above)/Below Cap (Above)/Below Cap
FY 2012 982,118 4.00% 3.68% 3,094 0.32%
FY 2013 1,014,195 4.00% 3.88% 1,203 0.12%
FY 2014 1,057,395 4.00% 3.97% 314 0.03%
FY 2015 1,118,421 4.00% 3.95% 614 0.05%
FY 2016 1,179,167 4.00% 3.90% 1,218 0.10%FY 2017 1,240,011 4.00% 3.80% 2,445 0.20%
All Funds Actual/ $ %Year Receipts Cap % Recommended % (Above)/Below Cap (Above)/Below Cap
FY 2012 132,307 4.65% 2.66% 2,632 1.99%
FY 2013 132,724 4.98% 2.87% 2,805 2.11%
FY 2014 137,947 5.00% 2.97% 2,798 2.03%
FY 2015 142,449 5.00% 3.05% 2,774 1.95%
FY 2016 147,169 5.00% 3.13% 2,747 1.87%
FY 2017 153,379 5.00% 3.17% 2,808 1.83%
New Debt Service Costs(millions of dollars)
New Debt Outstanding (millions of dollars)

FINANCIAL PLAN OVERVIEW
30
SECURED HOSPITAL PROGRAM Under the Secured Hospital program, the State entered into service contracts to enable certain financially distressed not-for-profit hospitals to issue debt. The contracts obligate the State to pay debt service, subject to annual appropriations by the Legislature, on bonds issued by the New York State MCFFA and by DASNY through the Secured Hospital program (all now included as debt of DASNY). In the event there are shortfalls in revenues from other sources, which include hospital payments made under loan agreements between DASNY and the hospitals, and certain reserve funds held by the applicable trustees for the bonds, the State is liable for the debt service. As of March 31, 2011, there is a total of $585 million of outstanding bonds for the program. The financial condition of most hospitals in the State’s Secured Hospital Program continues to deteriorate. Of the nine hospitals in the program, several are experiencing significant operating losses that are likely to impair their ability to remain current on their loan agreements with DASNY. The Financial Plan includes costs to cover debt service payments under its service contract obligation for the hospitals that are not performing on their loan agreements with DASNY and have no reserve funds available to cover the payments. If recent trends continue, additional State resources may be needed to meet debt service obligations on outstanding bonds pursuant to the service contracts. BOND MARKET Implementation of the Executive Budget is dependent on the State's ability to market its bonds successfully. The State finances much of its capital spending in the first instance from the General Fund or STIP, which it then reimburses with proceeds from the sale of bonds. If the State cannot sell bonds at the levels (or on the timetable) expected in the capital plan, it can adversely affect the State’s overall cash position and capital funding plan. The success of projected public sales will be subject to prevailing market conditions. Future developments in the financial markets generally, as well as future developments concerning the State and public discussion of such developments, may affect the market for outstanding State-supported and State-related debt. LITIGATION Litigation against the State may include potential challenges to the constitutionality of various actions. The State may also be affected by adverse decisions that are the result of various lawsuits. Such adverse decisions may not meet the materiality threshold to warrant individual description but, in the aggregate, could still adversely affect the State's Financial Plan.

MULTI-YEAR FINANCIAL PLAN PROJECTIONS


33
MULTI-YEAR FINANCIAL PLAN PROJECTIONS INTRODUCTION This section presents the State’s updated multi-year Financial Plan projections for receipts and disbursements, reflecting the impact of the FY 2013 Executive Budget proposal. The projections cover the period for FYs 2012 through 2016, with an emphasis on the FY 2013 projections. The State’s cash-basis budgeting system, complex fund structure, and practice of earmarking certain tax receipts for specific purposes complicate the discussion of the State’s receipts and disbursement projections. Therefore, to minimize the distortions caused by these factors and, equally important, to highlight relevant aspects of the projections, DOB has adopted the following approaches in summarizing the projections:
Receipts: The detailed discussion of tax receipts covers projections for both the General Fund and State Funds (including capital projects). The latter perspective reflects overall estimated tax receipts before their diversion among various funds and accounts, including tax receipts dedicated to capital projects funds (which fall outside of the General Fund and State Operating Funds accounting perspectives). DOB believes this presentation provides a clearer picture of projected receipts, trends and forecast assumptions, by factoring out the distorting effects of earmarking certain tax receipts.
Disbursements: Over 40 percent of projected State-financed spending for operating
purposes is accounted for outside of the General Fund and is primarily concentrated in the areas of health care, School Aid, higher education, transportation and mental hygiene. To provide a clearer picture of spending commitments, the multi-year projections and growth rates are presented, where appropriate, on both a General Fund and State Operating Funds basis.
In evaluating the State’s multi-year operating forecast, it should be noted that the reliability of the estimates and projections as a predictor of the State’s future financial position is likely to diminish the further removed such estimates and projections are from the date of this Executive Budget. Accordingly, in terms of the FY 2013 Executive Budget outyear projections (FY 2014 through FY 2016), FY 2014 is the most relevant from a planning perspective.

MULTI-YEAR FINANCIAL PLAN PROJECTIONS
34
SUMMARY DOB estimates that the Executive Budget, if enacted as proposed, would provide for a balanced General Fund Financial Plan in FY 2013, and leave projected gaps that total approximately $715 million in FY 2014, $3.0 billion in FY 2015, and $3.7 billion in FY 2016. The net operating shortfall in State Operating Funds is projected at $2.2 billion in FY 2015 and $3.1 billion in FY 2016. The imbalances projected for the General Fund and State Operating Funds in future years are similar because the General Fund is the financing source of last resort for many State programs. Imbalances in other funds are typically financed by the General Fund. The following tables present the multi-year projections and growth rates for the General Fund and State Operating Funds, as well as a reconciliation between the State Operating Funds projections and the General Fund budget gaps. The tables are followed by a summary of the multi-year receipts and disbursements forecasts.

MULTI-YEAR FINANCIAL PLAN PROJECTIONS
35
GENERAL FUND PROJECTIONS
FY 2012 Current
FY 2013 Proposed
FY 2014 Projected
FY 2015 Projected
FY 2016 Projected
ReceiptsTaxes (After Debt Service) 52,816 54,597 57,829 58,984 61,314Miscellaneous Receipts/Federal Grants 3,304 3,129 2,638 2,243 2,336Other Transfers 1,094 989 878 786 776Total Receipts 57,214 58,715 61,345 62,013 64,426
DisbursementsLocal Assistance Grants 38,515 39,403 41,393 42,877 45,107
Education 18,500 18,832 19,731 20,595 21,614Health Care 10,933 11,127 11,626 12,025 12,931Mental Hygiene 1,903 1,868 2,063 2,182 2,276Social Services 2,999 3,067 3,423 3,430 3,562Higher Education 2,589 2,629 2,753 2,845 2,925All Other 1 1,591 1,880 1,797 1,800 1,799
State Operations 7,565 7,588 6,974 7,150 7,524Personal Service 5,770 5,729 5,362 5,473 5,731Non-Personal Service 1,795 1,859 1,612 1,677 1,793
General State Charges 4,707 4,434 4,823 5,168 5,459Gross State Pension Contribution 1,680 1,574 1,986 2,230 2,440Gross State Employee Health Insurance 3,291 3,240 3,408 3,667 3,949Fringe Benefit Escrow Offset/Fixed Costs (264) (380) (571) (729) (930)
Transfers to Other Funds 6,128 7,167 8,736 9,659 9,925Debt Service 1,539 1,610 1,681 1,611 1,585Capital Projects 790 1,079 1,278 1,403 1,298State Share Medicaid 2,912 2,903 2,697 2,551 2,451Mental Hygiene 0 69 955 1,886 2,475Medicaid Payments for State Facility Patients 244 244 244 244 244SUNY - University Operations 0 390 976 995 1,015SUNY - Hospital Operations 60 60 60 60 60Department of Transportation (MTA Tax) 25 279 332 334 334Judiciary Funds 113 115 116 117 118Banking Services 61 57 65 65 65Financial Management System 36 50 55 55 55Indigent Legal Services 40 40 40 40 40All Other 308 271 237 298 185
Total Disbursements 56,915 58,592 61,926 64,854 68,015
Change in Reserves 299 123 134 133 132Prior-Year Labor Agreements (2007-11)2 284 174 134 133 132Community Projects Fund (85) (51) 0 0 0Rainy Day Fund 100 0 0 0 0
Budget Surplus/(Gap) Before Actions 0 0 (715) (2,974) (3,721)
1
2
MULTI-YEAR GENERAL FUND PROJECTIONS(millions of dollars)
All Other includes local aid spending in a number of other programs, including general municipal aid and incentives, parks and the environment, economic development, and public safety. Fund balances will roll to next fiscal year, if unspent in FY 2012.

MULTI-YEAR FINANCIAL PLAN PROJECTIONS
36
FY 2012 Current
FY 2013 Proposed
FY 2014 Projected
FY 2015 Projected
FY 2016 Projected
ReceiptsTaxes 63,199 65,132 68,832 70,510 73,250Miscellaneous Receipts/Federal Grants 19,480 20,159 20,127 20,023 20,159Total Receipts 82,679 85,291 88,959 90,533 93,409
DisbursementsLocal Assistance Grants 57,548 59,060 61,835 63,941 66,255
School Aid 19,677 20,002 20,815 21,613 22,558STAR 3,293 3,322 3,508 3,691 3,793Other Education Aid 1,719 1,890 1,980 2,051 2,126Higher Education 2,605 2,662 2,769 2,845 2,925Medicaid (DOH incl. administration) 15,280 15,859 16,513 17,049 17,895Public Health/Aging 2,134 2,033 2,115 2,198 2,051Mental Hygiene 3,580 3,576 3,969 4,231 4,423Social Services 3,010 3,072 3,424 3,431 3,563Transportation 4,257 4,398 4,556 4,650 4,745Local Government Assistance 758 776 786 801 803All Other 1 1,235 1,470 1,400 1,381 1,373
State Operations 17,087 17,132 17,385 17,873 18,584Personal Service 11,876 11,965 12,199 12,522 13,054Non-Personal Service 5,211 5,167 5,186 5,351 5,530
General State Charges 6,536 6,388 6,917 7,428 7,880Pension Contribution 1,680 1,574 1,986 2,230 2,440Health Insurance (Active Employees) 2,057 2,025 2,130 2,292 2,468Health Insurance (Retired Employees) 1,234 1,215 1,278 1,375 1,481All Other 1,565 1,574 1,523 1,531 1,491
Debt Service 5,872 6,149 6,449 6,568 6,705Capital Projects 5 5 5 5 5Total Disbursements 87,048 88,734 92,591 95,815 99,429
Net Other Financing Sources/(Uses) 4,524 4,044 3,677 3,114 2,915
Net Operating Surplus/(Deficit) 155 601 45 (2,168) (3,105)
Reconciliation to General Fund Gap:Designated Fund Balances (155) (601) (760) (806) (616)General Fund (299) (123) (134) (133) (132)Special Revenue Funds 239 (401) (549) (558) (499)Debt Service Funds (95) (77) (77) (115) 15
General Fund Budget Gap 0 0 (715) (2,974) (3,721)
1
STATE OPERATING FUNDS PROJECTIONS(millions of dollars)
All Other includes school aid deferral and local aid spending in a number of other programs, including parks and the environment, economic development, and public safety.

MULTI-YEAR FINANCIAL PLAN PROJECTIONS
37
RECEIPTS OVERVIEW Financial Plan receipts comprise a variety of taxes, fees, charges for State provided services, Federal grants, and other miscellaneous receipts. The receipt estimates and projections have been prepared by DOB with the assistance of the Department of Taxation and Finance and other agencies concerned with the collection of State receipts. THE NATIONAL ECONOMY The U.S. economic recovery survived an almost continuous series of setbacks in 2011 that included spiking energy prices, supply chain disruptions resulting from a virtual shutdown of the world's third largest economy, threats to the global financial system stemming from the European sovereign debt crisis, and uncertainty surrounding the U.S. government's own looming debt problems. As the impacts of the oil shock and Japanese supply chain disruptions unwind, some positive momentum appears to be building, with the fourth quarter of 2011 now expected to have exhibited the strongest growth since the first half of 2010. However, the economy faces many headwinds going forward, including a slowing global economy, financial market volatility, continued weak income growth, and a very slowly moving housing sector. Consequently, real U.S. GDP is now projected to grow 2.2 percent for 2012, following growth of 1.7 percent for 2011. With the euro-zone likely to have entered a recession in the fourth quarter and the large developing economies in Asia and Latin America slowing, the U.S. economy is expected to feel the pinch through lower export growth during the first half of 2012. Since a large portion of U.S. corporate earnings are derived from overseas activity, growth in U.S. corporate profits from current production are expected to decelerate to 4.7 percent in 2012, down from 7.9 percent in 2011, and 32.2 percent in 2010. The anticipated slowdown in production for export could modestly dampen employment growth yet again early this year, before picking up during the second half. U.S. nonagricultural employment is projected to grow 1.3 percent in 2012, following 1.0 percent growth in 2011. The absence of a sustained improvement in job growth will keep wage growth low as well, which in turn will help keep consumer price pressures at bay. The unwinding of the gasoline and food price spikes experienced in 2011 will keep consumer price inflation well below last year's rate. The rate of inflation, as measured by growth in the Consumer Price Index, is projected to fall from 3.2 percent in 2011 to 1.8 percent in 2012. RISKS TO THE U.S. FORECAST DOB’s outlook calls for the recovery from the nation’s worst recession since the 1930s to continue through 2012 at below-trend growth rates as the economy’s domestic momentum struggles with a recession in Europe and slow growth in other areas of the world. But there are a number of significant risks to the forecast, both positive and negative. If resolution of the euro-debt crisis should turn negative, and in the worst case result in a bank run as occurred in September 2008, short-term credit markets could seize up and the U.S. economy could potentially be dragged back into a recession. A breakup of the euro-zone, or a dissolution of the euro itself could have even worse consequences. Similarly, a hard landing in China would likely cause a deeper global slowdown than expected, resulting in slower export growth than is reflected in the forecast. In contrast, a slow but

MULTI-YEAR FINANCIAL PLAN PROJECTIONS
38
steady path to resolution of the euro-debt crisis, along with a milder recession in Europe and/or a more modest slowdown elsewhere could result in stronger export and employment growth than anticipated. The forecast rests on the assumption that the U.S. Congress will extend the payroll tax cut and UI benefit extensions beyond the first two months of the year. If the Congress should fail to come to an agreement, household spending could be less than anticipated. Furthermore, should the failure to come to an agreement cause the household and business sector to lose confidence in the recovery, an even greater pullback in spending could ensue, resulting in much slower growth than is reflected in the forecast. A renewed confidence in the recovery depends upon an improvement in the pace of job growth over the coming quarters. If that improvement fails to materialize, households may pull back once again, resulting in lower consumption growth than expected. Weaker household spending would ripple through the economy and likely result in lower investment growth as well. A substantial equity market correction could have a similar effect. In contrast, if actions taken by the Federal government inspire confidence within the business sector, employment and household spending growth could be stronger than expected. The housing sector has been virtually absent from this recovery. If home foreclosures accelerate substantially more than expected, a housing market recovery could be further delayed. A surge in foreclosures could also impede the recovery in home prices, which would in turn delay the recovery in household net worth, also resulting in lower rates of household spending than projected. Alternatively, a large increase in household formation could result in stronger demand for housing and therefore a quicker recovery in home prices and construction employment than expected. Finally, oil prices are once again on the rise due to global tensions. These increases could cause gasoline prices to return their lofty May 2011 peaks. Since energy price growth acts as a virtual tax on household spending, faster growth in the price of oil could also result in lower consumption spending than anticipated. A quick resolution of these tensions could send energy prices back down faster than expected, resulting in greater real household spending for non-energy goods and services. THE NEW YORK STATE ECONOMY The State coincident index indicates that New York’s recovery got underway in early 2010, coinciding with the State economy’s response to the Federal Reserve’s highly accommodating monetary policy – its near-zero interest rate policy target and the historic expansion of its balance sheet. As home to the world’s financial capital, the State economy is especially sensitive to monetary policy shifts. The strong economic stimulus provided by central bank was reinforced by a weak dollar and strong foreign demand for State produced goods and services, particularly those related to tourism. Foreign demand for New York City real estate has also been strong. These developments helped to support above average quarterly private year-ago job growth of an estimated 2.0 percent over the first three quarters of 2011. Private sector employment is estimated to have grown 1.9 percent for 2011 overall, following virtually flat growth of 0.2 percent in 2010. While private sector growth appears to have been broad-based, with even manufacturing seeing positive year-ago growth, government employment is estimated to have fallen during each quarter of 2011 on a year-ago basis, and 2.9 percent for the year.

MULTI-YEAR FINANCIAL PLAN PROJECTIONS
39
But 2011 turned out to be an historically turbulent year for financial markets, with securities industry revenues falling sharply over the course of the year and the nation's banks perceived to be at risk due to the crisis in Europe. That turbulence occurred against a backdrop of an evolving regulatory environment that has altered the pattern of risk-taking behavior of Wall Street firms. These forces resulted in steadily deteriorating revenues over the course of last year, with NYSE member firms experiencing losses in the third quarter, the first since 2008. Fourth quarter revenues and profits are not anticipated to exhibit much improvement. Thus, with finance industry revenues 2011 likely to be well below their 2010 levels, and executive compensation is likely to decline, finance and insurance industry bonus payouts for the FY 2012 bonus season are likely to be well below their FY 2011 levels, with finance and insurance sector bonuses for the first quarter of 2012 expected to be 34.4 percent below their year-ago total. Slower global growth and a stronger dollar are expected to result in slower private sector job growth of 1.4 percent in 2012. Fiscal strains are expected to continue to put pressure on government employment at all levels; public sector jobs are expected to fall 1.0 percent in 2012. State wages are projected to rise 1.9 percent in 2012, following growth of 3.8 percent in 2011, with total personal income rising 3.3 percent in 2012, following growth of 4.5 in 2011. These growth rates are well below historical averages. RISKS TO THE NEW YORK FORECAST All of the risks to the U.S. forecast apply to the State forecast as well, although as the nation’s financial capital, developments that have an impact on credit markets, such as the euro-debt crisis, pose a particularly large degree of risk for New York. Yet another financial crisis induced recession would be devastating for the State economy. Even lesser risks, such as a further erosion of equity prices could be quite destabilizing to the financial sector and ultimately bonuses and State wages overall. These risks are compounded by the uncertainty surrounding the implementation of financial reform, which is already altering the composition of bonus packages in favor of stock grants with long-term payouts and claw-back provisions, thus affecting the forecast for taxable wages. As financial regulations evolve, it is becoming increasingly uncertain as when finance sector revenue generating activity such as trading, lending, and underwriting will return to pre-crisis levels, resulting in additional risk to the forecasts for bonuses and personal capital gains. There are, however, some upside risks to DOB’s New York economic outlook as well. A stronger national or global economy than projected could increase the demand for New York goods and services, resulting in stronger job growth than projected. Such an outcome could lead to stronger levels of business activity and income growth than anticipated. If corporate earnings surprise to the upside, a stronger and earlier upturn in stock prices could result, stimulating additional financial market activity, and producing higher wage and bonus growth than currently projected. Of course, a stronger national economy could force the Federal Reserve to raise interest rates earlier or more rapidly than projected, which could negatively affect the State economy and the financial sector in particular.

MULTI-YEAR FINANCIAL PLAN PROJECTIONS
40
2010 2011 2012 2013 2014 2015(actual1) (estimate) (forecast) (forecast) (forecast) (forecast)
U.S. Indicators2
Real Gross Domestic Product ($ B) 13,088 13,316 13,615 14,014 14,525 15,009 Percent Change 3.0 1.7 2.2 2.9 3.6 3.3Personal Income ($ B) 12,374 12,955 13,401 13,943 14,772 15,618 Percent Change 3.7 4.7 3.4 4.0 5.9 5.7Nonagricultural Employment (millions) 129.8 131.2 132.9 135.1 137.7 140.4 Percent Change (0.7) 1.0 1.3 1.7 1.9 2.0Unemployment Rate 9.6 9.0 8.6 8.2 7.6 7.1CPI Inflation 1.6 3.2 1.8 2.1 2.1 2.3
New York State IndicatorsPersonal Income2 ($ B) 921.4 963.1 994.6 1,036.9 1,096.8 1,156.3 Percent Change 4.1 4.5 3.3 4.3 5.8 5.4Wages and Salaries2 ($ B) 502.0 521.3 531.5 557.6 585.1 613.3 Percent Change 4.4 3.8 1.9 4.9 4.9 4.8Bonuses3 ($ B) 68.2 71.7 63.8 67.8 72.0 76.2 Percent Change 20.7 5.2 (11.0) 6.3 6.1 5.9Employment2 (thousands) 8,318.7 8,408.5 8,490.9 8,577.2 8,659.7 8,731.7 Percent Change 0.1 1.1 1.0 1.0 1.0 0.8Unemployment Rate (percent) 8.6 7.9 7.6 7.1 6.6 6.2
NYS Adjusted Gross Income (NYSAGI)Capital Gains ($ millions) 48,163 56,744 79,721 63,159 65,182 74,496 Percent Change 42.2 17.8 40.5 (20.8) 3.2 14.3Total NYSAGI ($ millions) 635,441 667,958 710,560 728,456 765,956 812,127 Percent Change 6.5 5.1 6.4 2.5 5.1 6.0
Source: Moody's Analytics; NYS Department of Labor; NYS Department of Taxation and Finance; DOB staff estimates.
SELECTED ECONOMIC INDICATORS(Calendar Year)
1 For NYSAGI variables, 2010 is an estimate based on preliminary processing data.2 Nonagricultural employment, wage, and personal income numbers are based on QCEW data.3 Series created by the Division of the Budget.
THE REVENUE SITUATION Revenue results during the current fiscal year have been of two extremes: strong growth during the first half of the year and much weaker growth during the latter half. A significant portion of the growth during the first part of the year was due to a strong tax year 2010 personal income tax settlement. After inching up 2.7 percent in FY 2011, base tax growth is estimated to increase 7.5 percent in FY 2012, but projected to decelerate to 5.7 percent growth in FY 2013, reflecting a continuation of the overall slower growth witnessed during the second half of FY 2012. Consistent with the economic factors described above, revenue collections have exhibited their own volatility. In particular, business tax estimated payments received in December 2011 were flat compared to December 2010, and personal income tax estimated payments received in January 2012 actually declined year over year, both of which are unusual at this point in a recovery. The estimated decline in personal income tax payments likely reflect the economic changes that took place during the course of calendar year 2011 - the first half of the year provided strong positive wage and nonwage income gains resulting in double-digit growth in estimated payments in June and September, but the roller coaster stock market ride caused by the euro crisis, and financial sector cutbacks that are believed to have occurred during the second

MULTI-YEAR FINANCIAL PLAN PROJECTIONS
41
half of the year likely left high-income taxpayers overpaid for tax year 2011. In contrast, sales tax receipts exceeded expectations late in 2011 due to a strong holiday shopping season. Unlike FY 2011, when there was uncertainty surrounding the impacts of potential changes in the timing and level of financial sector bonus payments, there is sufficient evidence that financial sector bonus payments made for the next two months will fall by a significant double digit percentage from the same period last year - DOB’s forecast calls for a 32 percent decline. After slowing in FY 2012, average wage, total wage, and personal income growth are expected to recover and result in net growth in personal income tax receipts of 4.3 percent, after accounting for the combined impact of the sunset of the high income surcharge and enactment of PIT reform in December 2011. Projected corporate profits growth for the 2012 calendar year combined with an incremental gain from tax credit deferral legislation enacted in 2010 should provide a second consecutive year of growth in business tax receipts in FY 2013. Income and employment growth, partially offset by the return of the full tax exemption on clothing, is expected to produce sales tax growth of 1.9 percent in FY 2013.

MULTI-YEAR FINANCIAL PLAN PROJECTIONS
42
State InflationFiscal Actual Base Adjusted BaseYear Receipts Receipts Receipts
1988-89 1.6 2.9 (1.3)1989-90 6.8 8.3 3.31990-91 (0.8) (3.8) (9.2)1991-92 7.2 1.4 (2.3)1992-93 6.1 5.0 1.81993-94 4.3 0.7 (2.2)1994-95 0.1 1.5 (1.1)1995-96 2.6 3.6 0.81996-97 2.0 2.6 (0.4)1997-98 3.7 5.6 3.61998-99 7.2 7.9 6.51999-00 7.5 9.1 6.32000-01 7.9 10.1 6.72001-02 (4.9) (4.2) (6.4)2002-03 (6.7) (8.0) (10.0)2003-04 8.2 5.8 3.82004-05 13.4 11.5 8.52005-06 10.2 9.3 5.82006-07 9.7 4.9 2.02007-08 3.7 13.5 10.22008-09 (0.8) (3.1) (5.8)2009-10 (3.2) (12.4) (12.7)2010-11 5.6 2.7 1.12011-12* 6.0 7.4 4.12012-13** 3.0 5.5 3.62013-14** 5.7 6.3 4.22014-15** 2.4 5.2 3.12015-16** 3.8 4.8 2.5
Actual Base Adjusted BaseChange Change Change
Historical Average (88-89 to 10-11) 4.0 3.2 0.4Forecast Average (11-12 to 15-16) 4.2 5.8 3.5Forecast Average (12-13 to 15-16) 3.7 5.5 3.3
Recessions 1.3 (1.2) (4.2)Expansions 5.7 6.1 3.3
*Estimated Receipts
**Projected Receipts
Governmental FundsActual and Base Tax Receipts Growth
(percent growth)

MULTI-YEAR FINANCIAL PLAN PROJECTIONS
43
2010-11 2011-12 Annual $ Annual % 2012-13 Annual $ Annual %Actual Estimated Change Change Projected Change Change
General Fund 54,447 57,214 2,767 5.1% 58,715 1,501 2.6% Taxes 39,205 41,920 2,715 6.9% 43,373 1,453 3.5% Miscellaneous Receipts 3,095 3,244 149 4.8% 3,069 (175) -5.4% Federal Grants 54 60 6 11.1% 60 0 0.0% Transfers 12,093 11,990 (103) -0.9% 12,213 223 1.9%
State Funds 83,981 88,377 4,396 5.2% 90,802 2,425 2.7% Taxes 60,870 64,532 3,662 6.0% 66,533 2,001 3.1% Miscellaneous Receipts 22,994 23,700 706 3.1% 24,124 424 1.8% Federal Grants 117 145 28 23.9% 145 0 0.0%
All Funds 133,321 132,306 (1,015) -0.8% 132,724 418 0.3% Taxes 60,870 64,532 3,662 6.0% 66,533 2,001 3.1% Miscellaneous Receipts 23,148 23,832 684 3.0% 24,255 423 1.8% Federal Grants 49,303 43,942 (5,361) -10.9% 41,936 (2,006) -4.6%
TOTAL RECEIPTS(millions of dollars)
FY 2012 OVERVIEW
Total All Funds receipts are estimated to reach $132.3 billion, a decline of $1 billion (0.8 percent) from FY 2011 results. All Funds tax receipts are estimated to increase by $3.7 billion, or 6 percent. The majority of the increase in tax receipts is attributable to growth in personal income tax collections. All Funds Federal Grants are expected to decline $5.4 billion (10.9 percent) due to ARRA funding declines.
All Funds miscellaneous receipts are projected to reach $23.8 billion in FY 2012, an increase of $684 million from FY 2011. General Fund miscellaneous receipts are estimated to increase $149 million as well as growth in other areas, primarily SUNY revenue growth from expansions at the three SUNY teaching hospitals, enrollment growth, and greater bond proceeds available for SUNY capital projects ($694 million).
Total State Funds receipts are estimated to reach $88.4 billion in FY 2012, an increase of
$4.4 billion, or 5.2 percent.
Total General Fund receipts are estimated at $57.2 billion, an increase of $2.8 billion, or 5.1 percent from FY 2011. General Fund tax receipts are estimated to increase by 6.9 percent. General Fund miscellaneous receipts are estimated to increase by 4.8 percent, reflecting gains from 2011 Abandoned Property legislation.
Base tax receipts growth, which nets out the impact of law changes, will increase by an estimated 7.5 percent in FY 2012 after a modest base increase of 2.7

MULTI-YEAR FINANCIAL PLAN PROJECTIONS
44
FY 2013 OVERVIEW
Total All Funds receipts are projected to reach $132.7 billion, an increase of $418 million, or 0.3 percent from FY 2012 estimates. All Funds tax receipts are projected to grow by $2 billion or 3.1 percent. This increase is attributable to continued positive economic growth, partially offset by the net impact of expired and recently enacted personal income tax rate legislation.
All Funds Miscellaneous receipts are projected to increase by $423 million, or 1.8
percent driven by increases in HCRA ($636 million) and lottery receipts ($251 million) offset by a projected decline in programs financed with authority bond proceeds including economic development and health projects ($255 million) and General Fund declines described below. All Funds Federal grants are expected to decrease by $2 billion, or 4.6 percent primarily driven by the loss of ARRA funding.
Total State Funds receipts are projected to be $90.8 billion, an increase of $2.4 billion, or
2.7 percent from the FY 2012 estimate.
Total General Fund receipts are projected to be $58.7 billion, an increase of $1.5 billion, or 2.6 percent from FY 2012 estimates. General Fund tax receipts are projected to grow by 3.5 percent, while General Fund miscellaneous receipts are projected to decline by $175 million (5.4 percent). Federal grants revenues are projected to remain constant.
After controlling for the impact of policy changes, base tax revenue growth is estimated
to increase by 5.7 percent for FY 2013.

MULTI-YEAR FINANCIAL PLAN PROJECTIONS
45
CHANGE FROM MID-YEAR UPDATE REVISED ESTIMATES AND PROJECTIONS
$ % $ %Change Change Change Change
General Fund1 45,098 45,224 126 0.3% 45,286 46,502 1,216 2.7% Taxes 41,886 41,920 34 0.1% 42,202 43,373 1,171 2.8% Miscellaneous Receipts 3,152 3,244 92 2.9% 3,024 3,069 45 1.5% Federal Grants 60 60 0 0.0% 60 60 0 0.0%
State Funds 87,816 88,377 561 0.6% 89,259 90,802 1,543 1.7% Taxes 64,503 64,532 29 0.0% 65,258 66,533 1,275 2.0% Miscellaneous Receipts 23,168 23,700 532 2.3% 23,856 24,124 268 1.1% Federal Grants 145 145 0 0.0% 145 145 0 0.0%
All Funds 130,834 132,306 1,472 1.1% 128,779 132,724 3,945 3.1% Taxes 64,503 64,532 29 0.0% 65,258 66,533 1,275 2.0% Miscellaneous Receipts 23,300 23,832 532 2.3% 23,987 24,255 268 1.1% Federal Grants 43,031 43,942 911 2.1% 39,534 41,936 2,402 6.1%
1 Excludes Transfers
CHANGE FROM MID-YEAR UPDATE FORECAST(millions of dollars)
2011-12 2012-13Mid-Year Update
Mid-Year Update
Executive Budget
Executive Budget
All funds receipts estimates have been revised upward by $1.5 billion for FY 2012 from the Mid-Year Update. The upward tax revision of $30 million is mostly due to the impact of the December 2011 personal income tax reform, stronger than expected sales tax receipts, and an increase in expected business tax audit receipts during the remainder of FY 2012, partially offset by weaker than expected personal income tax receipts.
All Funds miscellaneous receipts in FY 2012 were revised upward by $532 million
largely reflecting increased projections for programs financed with authority bond proceeds, including economic development ($343 million) and modest receipts revisions in various special revenue funds ($81 million) and the General Fund increase detailed below.
All Funds Federal grants were revised upward in FY 2012 and FY 2013 from the Mid-Year update by $911 million and $2.4 billion, respectively, primarily driven by revisions to Medicaid spending.
General Fund receipts for FY 2012 have been revised upward by $126 million, reflecting the All Funds tax changes noted above and year-to-date miscellaneous receipts collections.
All Funds receipts estimates have been increased by nearly $3.9 billion for FY 2013 from
the Mid-Year Update.

MULTI-YEAR FINANCIAL PLAN PROJECTIONS
46
All Funds miscellaneous receipts in FY 2013 were revised upward by $268 million largely reflecting increased projections for programs financed with authority bond proceeds, including economic development, transportation and parks ($370 million) offset by declines in lottery receipts and receipts revisions in various special revenue funds ($146 million).
General Fund receipts for FY 2013 have been revised upward by $1.2 billion. Tax
revisions account for virtually all the increase (mainly from the December 2011 personal income tax reform).
FY 2013, FY 2014, AND FY 2015 OVERVIEW
Overall, tax receipts growth in the three fiscal years following FY 2013 is expected to remain in the range of 2.4 percent to 5.6 percent. This is consistent with projected modest economic growth in the New York economy during this period and the sunset of personal income tax reform.
Total All Funds receipts in FY 2014 are projected to be $137.9 billion, an increase of $5.2 billion over the prior year. All Funds receipts in FY 2015 are expected to increase by $4.5 billion over FY 2014 projections. In FY 2016, receipts are expected to increase by nearly $4.7 billion over FY 2015 projections.
Total State Funds receipts are projected to be nearly $94.4 billion in FY 2014, $95.8
billion in FY 2015 and $98.7 billion in FY 2016.
Total General Fund receipts are projected to reach just over $61.3 billion in FY 2014, $62 billion in FY 2015 and $64.4 billion in FY 2016.
All Funds tax receipts are expected to increase by 5.6 percent in FY 2014, 2.4 percent in FY 2015 and 3.8 percent in FY 2016. Again, the growth pattern is consistent with an economic forecast for continued but slower economic growth.
2012-13 2013-14 Annual $ 2014-15 Annual $ 2015-16 Annual $Projected Projected Change Projected Change Projected Change
General Fund 58,715 61,345 2,630 62,013 668 64,426 2,413 Taxes 43,373 45,859 2,486 46,645 786 48,566 1,921State Funds 90,802 94,367 3,565 95,782 1,415 98,670 2,888 Taxes 66,533 70,253 3,720 71,941 1,688 74,697 2,756All Funds 132,724 137,949 5,225 142,449 4,500 147,169 4,720 Taxes 66,533 70,253 3,720 71,941 1,688 74,697 2,756
TOTAL RECEIPTS(millions of dollars)

MULTI-YEAR FINANCIAL PLAN PROJECTIONS
47
BASE GROWTH Base growth, adjusted for law changes, in tax receipts for FY 2012 is estimated to grow 7.5 percent and 5.7 percent in FY 2013. Overall base growth in tax receipts is dependent on a multitude of factors. The estimated base receipts growth in FY 2012 results from:
A strong tax year 2010 personal income tax settlement;
Moderate corporate profits growth and insurance premium growth; and
Increased consumption resulting from wage and employment growth as well as the federal payroll tax cut.
The deceleration in base growth in FY 2013 results from:
A decline in extension payments;
Slower corporate profits growth; and
Slower consumer spending growth resulting from a return of the full federal payroll tax. PERSONAL INCOME TAX
2010-11 2011-12 Annual $ Annual % 2012-13 Annual $ Annual %Actual Estimated Change Change Projected Change Change
General Fund1 23,894 25,705 1,811 7.6% 26,911 1,206 4.7% Gross Collections 44,002 45,891 1,889 4.3% 48,117 2,226 4.9% Refunds/Offsets (7,793) (7,227) 566 -7.3% (7,806) (579) 8.0% STAR (3,263) (3,293) (30) 0.9% (3,322) (29) 0.9% RBTF (9,052) (9,666) (614) 6.8% (10,078) (412) 4.3%
State/All Funds 36,209 38,664 2,455 6.8% 40,311 1,647 4.3% Gross Collections 44,002 45,891 1,889 4.3% 48,117 2,226 4.9% Refunds (7,793) (7,227) 566 -7.3% (7,806) (579) 8.0%
1 Excludes Transfers.
PERSONAL INCOME TAX(millions of dollars)
All Funds receipts for FY 2012 are estimated to be $38.7 billion, an increase of $2.5 billion (6.8 percent) from the prior year. This is primarily attributable to increases in extension payments of $1.2 billion for tax year 2010 and in current estimated payments of $599 million for tax year 2011. The personal income tax reform enacted in December 2011 (effective starting tax year 2012) is projected to generate $385 million in withholding in the first quarter of 2012 and should partially counteract the revenue loss resulting from the expiration of the 2009 temporary rate increase and the year-over-year decline from projected lower financial sector bonuses for FY

MULTI-YEAR FINANCIAL PLAN PROJECTIONS
48
2012. The spike in extension payments for tax year 2010 most likely reflects one-time realization of capital gains caused by uncertainty surrounding the late extension of the lower Federal tax rates on capital gains and high-income taxpayers in December of 2010. Total refunds are expected to decrease by $566 million (7.3 percent) compared to FY 2011. This decrease primarily reflects an artificially high FY 2011 refunds base caused by the shift of $500 million of 2009-10 refunds into FY 2011. Prior year refunds for tax years prior to 2010, which decreased by $367 million, also contributed to lower FY 2012 refunds. The following table summarizes, by component, actual receipts for FY 2011 and forecast amounts through FY 2015.
2010-11 2011-12 2012-13 2013-14 2014-15Actual Estimated Projected Projected Projected
ReceiptsWithholding 31,240 31,197 32,598 34,667 36,032Estimated Payments 9,735 11,530 12,212 13,063 13,702 Current Year 7,386 7,985 8,879 9,097 10,143 Prior Year* 2,349 3,545 3,334 3,966 3,559Final Returns 1,964 2,125 2,203 2,170 2,167 Current Year 215 227 227 241 242 Prior Year* 1,749 1,898 1,976 1,929 1,925Delinquent 1,063 1,039 1,104 1,137 1,238
Gross Receipts 44,002 45,891 48,117 51,036 53,139
RefundsPrior Year* 5,170 4,715 5,201 5,434 6,312Previous Years 772 404 557 576 569Current Year* 1,750 1,750 1,750 1,750 1,750State-City Offset* 100 358 298 198 148
Total Refunds 7,793 7,227 7,806 7,958 8,779Net Receipts 36,209 38,664 40,311 43,078 44,360
* These components, collectively, are known as the “settlement” on the prior year’s tax liability.
PERSONAL INCOME TAX FISCAL YEAR COLLECTION COMPONENTSALL FUNDS
(millions of dollars)
All Funds receipts for FY 2013 are projected to be $40.3 billion, an increase of $1.6 billion (4.3 percent) from FY 2012. This primarily reflects a year-over-year increase of $1.5 billion in receipts from the personal income tax reform enacted in December 2011 and an increase of $829 million in pre-reform withholding receipts partially reduced by $579 million (8 percent) in higher total refunds. Withholding is projected to be $1.4 billion (4.5 percent) higher compared to FY 2012 due mainly to an increase of $572 million in receipts from recently enacted personal income tax reform combined with modest growth in the pre-reform withholding base. Estimated payments for tax year 2012, which include $974 million from PIT reform, are projected to be $894 million

MULTI-YEAR FINANCIAL PLAN PROJECTIONS
49
(11.2 percent) higher. Final return payments for tax year 2011 and delinquencies are projected to be $78 million (4.1 percent) and $65 million (7.1 percent) higher, respectively. The increase in total refunds of $579 million reflects a $486 million (10.8 percent) increase in current refunds and a $153 million (38.3 percent) increase in prior refunds offset by a $60 million (16.8 percent) decrease in the state-city offset. General Fund income tax receipts are net of deposits to the STAR Fund, which provides property tax relief, and the RBTF, which supports debt service payments on State personal income tax revenue bonds. General Fund income tax receipts for FY 2012 of $25.7 billion are expected to increase by $1.8 billion (7.6 percent), from the prior year, mainly reflecting the increase in All Funds receipts noted above. The RBTF deposit is projected to increase by $614 million. General Fund income tax receipts for FY 2013 of $26.9 billion are projected to increase by $1.2 billion (4.7 percent). The RBTF deposit is projected to increase by $412 million.
Mid-Year Executive $ % Mid-Year Executive $ %Update Budget Change Change Update Budget Change Change
General Fund1 25,870 25,705 (165) -0.6% 25,619 26,911 1,292 5.0% Gross Collections 46,376 45,891 (485) -1.0% 46,612 48,117 1,505 3.2% Refunds/Offsets (7,492) (7,227) 265 -3.5% (8,023) (7,806) 217 -2.7% STAR (3,293) (3,293) 0 0.0% (3,322) (3,322) 0 0.0% RBTF (9,721) (9,666) 55 -0.6% (9,648) (10,078) (430) 4.5%
State/All Funds 38,884 38,664 (220) -0.6% 38,589 40,311 1,722 4.5% Gross Collections 46,376 45,891 (485) -1.0% 46,612 48,117 1,505 3.2% Refunds (7,492) (7,227) 265 -3.5% (8,023) (7,806) 217 -2.7%
1 Excludes Transfers
PERSONAL INCOME TAX CHANGE FROM MID-YEAR UPDATE FORECAST(millions of dollars)
2011-12 2012-13
Compared to the Mid-Year Update, FY 2012 All Funds income tax receipts are revised downward by $220 million. The decrease primarily reflects lower-than-expected estimated payments on tax year 2011 ($445 million) and lower-than-estimated assessments ($50 million) partially offset by lower-than-expected refunds ($265 million). The reduction in estimated payments is driven by apparent weaker-than-projected non-wage income for the second half of 2011. Also, compared to the Mid-Year Update, $385 million in projected withholding receipts from the December 2011 personal income tax reform is expected to offset the $390 million reduction in pre-reform withholding. The lower estimate for current year refunds of $60 million is based on lower than expected refund requests on tax year 2010. Likewise, reduced prior refunds of $265 million partly reflect lower refunds in the third quarter of FY 2012 for tax years prior to 2010. Lower current and prior refunds are partially offset by a spike in the state-city offset of $60 million related to the 2010 change in New York City personal income tax rates related to the STAR program.

MULTI-YEAR FINANCIAL PLAN PROJECTIONS
50
Compared to the Mid-Year Update, FY 2013 All Funds income tax receipts are revised upward by $1.7 billion, reflecting $1.9 billion in new receipts from the above mentioned personal income tax reform ($957 million in withholding and $974 million in estimated payments for tax year 2012), $217 million in lower refunds and $9 million in projected revenue from proposed legislation, partially offset by downward revisions of $240 million in extension payments for tax year 2011 and $160 million in withholding.
2012-13 2013-14 Annual $ 2014-15 Annual $ 2015-16 Annual $Projected Projected Change Projected Change Projected Change
General Fund1 26,911 28,803 1,892 29,582 779 30,566 984 Gross Collections 48,117 51,036 2,919 53,139 2,103 55,062 1,923 Refunds/Offsets (7,806) (7,958) (152) (8,779) (821) (9,254) (475) STAR (3,322) (3,505) (183) (3,688) (183) (3,790) (102) RBTF (10,078) (10,770) (692) (11,090) (320) (11,452) (362)
State/All Funds 40,311 43,078 2,767 44,360 1,282 45,808 1,448 Gross Collections 48,117 51,036 2,919 53,139 2,103 55,062 1,923 Refunds (7,806) (7,958) (152) (8,779) (821) (9,254) (475)
PERSONAL INCOME TAX(millions of dollars)
1 Excludes Transfers. All Funds income tax receipts for FY 2014 of $43.1 billion are projected to increase $2.8 billion (6.9 percent) from the prior year. Gross receipts are projected to increase 6.1 percent and reflect withholding that is projected to grow by $2.1 billion (6.3 percent) and estimated payments related to tax year FY 2013 that are projected to grow by $218 million (2.5 percent). Payments from tax year FY 2012 extensions are projected to increase by $632 million (19 percent) reflecting $612 million from recently enacted personal income tax reform, but offset by the expiration of the 2009 temporary tax increase. Payments from final returns are expected to decrease $47 million (2.4 percent). Delinquencies are projected to increase $26 million (2.7 percent) from the prior year. Total refunds are projected to increase by $152 million (2 percent) from the prior year, partly reflecting $173 million in refunds due to tax cuts implemented as a part of the recent personal income tax reform, partly offset by lower pre reform base refunds. General Fund income tax receipts for FY 2014 of $28.8 billion are projected to increase by $1.9 billion (7 percent). RBTF deposits are projected to increase by $692 million. All Funds income tax receipts are projected to increase by $1.3 billion (3 percent)in FY 2015 and $1.4 billion (3.3 percent) in FY 2016. General Fund receipts are projected at $29.6 billion and $30.6 billion, respectively.

MULTI-YEAR FINANCIAL PLAN PROJECTIONS
51
USER TAXES AND FEES
2010-11 2011-12 Annual $ Annual % 2012-13 Annual $ Annual %Actual Estimated Change Change Projected Change Change
General Fund1,2 8,795 9,135 340 3.9% 9,341 206 2.3% Sales Tax 8,085 8,426 341 4.2% 8,592 166 2.0% Cigarette and Tobacco Taxes 480 476 (4) -0.8% 511 35 7.4% Alcoholic Beverage Taxes 230 233 3 1.3% 238 5 2.1%
State/All Funds 14,205 14,719 514 3.6% 15,076 357 2.4% Sales Tax 11,538 11,997 459 4.0% 12,246 249 2.1% Cigarette and Tobacco Taxes 1,616 1,665 49 3.0% 1,733 68 4.1% Motor Fuel Tax 516 501 (15) -2.9% 515 14 2.8% Highway Use Tax 129 134 5 3.9% 147 13 9.7% Alcoholic Beverage Taxes 230 233 3 1.3% 238 5 2.1% Taxicab Surcharge 81 85 4 4.9% 88 3 3.5% Auto Rental Tax 95 104 9 9.5% 109 5 4.8%
1 Excludes Transfers.
2 Receipts from motor vehicle fees and alcohol beverage control license fees are now reflected under miscellaneous receipts.
USER TAXES AND FEES(millions of dollars)
All Funds user taxes and fees receipts for FY 2012 are estimated to be $14.7 billion, an increase of $514 million (3.6 percent) from FY 2011. Sales tax receipts are expected to increase by $459 million (4 percent) from the prior year due to base growth (i.e., absent law changes) of 6.4 percent, offset partly by a return of the clothing exemption at a $55 per item threshold. The remaining estimated increase of $55 million from FY 2011 is mainly from an increase in cigarette and tobacco tax collections due in part to increased compliance as a result of implementation of the prior-approval/coupon system. General Fund user taxes and fees receipts are expected to total $9.1 billion in FY 2012, an increase of $340 million (3.9 percent) from FY 2011. The increase reflects growth in sales tax receipts of $341 million (4.2 percent) and small and nearly offsetting year-over-year changes in cigarette and tobacco taxes (a decrease of $4 million) and alcoholic beverage taxes (an increase of $3 million). All Funds user taxes and fees receipts for FY 2013 are projected to be $15.1 billion, an increase of $357 million (2.4 percent) from FY 2012. The increase in sales tax receipts of $249 million (2.1 percent) mostly reflects sales tax base growth of 3.2 percent, offset by a return of the full clothing exemption (at $110 per item). General Fund user taxes and fees receipts are projected to total $9.3 billion in FY 2013, an increase of $206 million (2.3 percent) from FY 2012. This increase largely reflects the projected increases in All Funds sales tax receipts discussed above.

MULTI-YEAR FINANCIAL PLAN PROJECTIONS
52
Mid-Year Executive $ % Mid-Year Executive $ %Update Budget Change Change Update Budget Change Change
General Fund1,2 9,056 9,135 79 0.9% 9,288 9,341 53 0.6% Sales Tax 8,351 8,426 75 0.9% 8,552 8,592 40 0.5% Cigarette and Tobacco Taxes 472 476 4 0.8% 498 511 13 2.6% Alcoholic Beverage Taxes 233 233 0 0.0% 238 238 0 0.0%
State/All Funds 14,603 14,719 116 0.8% 15,018 15,076 58 0.4% Sales Tax 11,877 11,997 120 1.0% 12,172 12,246 74 0.6% Cigarette and Tobacco Taxes 1,666 1,665 (1) -0.1% 1,752 1,733 (19) -1.1% Motor Fuel Tax 504 501 (3) -0.6% 515 515 0 0.0% Highway Use Tax 134 134 0 0.0% 147 147 0 0.0% Alcoholic Beverage Taxes 233 233 0 0.0% 238 238 0 0.0% Taxicab Surcharge 85 85 0 0.0% 85 88 3 3.5% Auto Rental Tax 104 104 0 0.0% 109 109 0 0.0%
1 Excludes Transfers2 Receipts from motor vehicle fees and alcohol beverage control license fees are now reflected under miscellaneous receipts.
2011-12
USER TAXES AND FEES CHANGE FROM MID-YEAR UPDATE FORECAST(millions of dollars)
2012-13
All Funds user taxes and fees in FY 2012 are revised up by $116 million from the Mid-Year Update based on stronger than expected to-date sales tax receipts ($120 million), partially offset by minor changes in the remaining taxes. All Funds user taxes and fees are revised up by $58 million for FY 2013, the result of FY 2012 base increases ($69 million), and proposed legislation ($18 million), offset by a reduction in receipts projected from the cigarette tax prior approval system ($30 million).
2012-13 2013-14 Annual $ 2014-15 Annual $ 2015-16 Annual $Projected Projected Change Projected Change Projected Change
General Fund1,2 9,341 9,706 365 10,123 417 10,487 364 Sales Tax 8,592 8,954 362 9,373 419 9,745 372 Cigarette and Tobacco Taxes 511 510 (1) 503 (7) 495 (8) Alcoholic Beverage Taxes 238 242 4 247 5 247 0
State/All Funds 15,076 15,572 496 16,147 575 16,659 512 Sales Tax 12,246 12,759 513 13,348 589 13,874 526 Cigarette and Tobacco Taxes 1,733 1,709 (24) 1,680 (29) 1,650 (30) Motor Fuel Tax 515 516 1 519 3 522 3 Highway Use Tax 147 142 (5) 144 2 152 8 Alcoholic Beverage Taxes 238 242 4 247 5 247 0 Taxicab Surcharge 88 90 2 90 0 90 0 Auto Rental Tax 109 114 5 119 5 124 5
USER TAXES AND FEES(millions of dollars)
1 Excludes Transfers.2 Receipts from motor vehicle fees and alcohol beverage control license fees are now reflected under miscellaneous receipts.

MULTI-YEAR FINANCIAL PLAN PROJECTIONS
53
All Funds user taxes and fees in FY 2014 are projected to increase by $494 million (3.3 percent) and then increase by $575 million (3.7 percent) in FY 2015 and $512 million (3.2 percent) in FY 2016. BUSINESS TAXES
2010-11 2011-12 Annual $ Annual % 2012-13 Annual $ Annual %Actual Estimated Change Change Projected Change Change
General Fund 5,278 5,868 590 11.2% 5,977 109 1.9% Corporate Franchise Tax 2,472 2,825 353 14.3% 2,844 19 0.7% Corporation & Utilities Tax 616 626 10 1.6% 682 56 8.9% Insurance Tax 1,217 1,274 57 4.7% 1,322 48 3.8% Bank Tax 973 1,143 170 17.5% 1,129 (14) -1.2%
State/All Funds 7,279 7,922 643 8.8% 8,152 230 2.9% Corporate Franchise Tax 2,846 3,231 385 13.5% 3,299 68 2.1% Corporation & Utilities Tax 813 815 2 0.2% 877 62 7.6% Insurance Tax 1,351 1,413 62 4.6% 1,463 50 3.5% Bank Tax 1,178 1,374 196 16.6% 1,351 (23) -1.7% Petroleum Business Tax 1,091 1,089 (2) -0.2% 1,162 73 6.7%
BUSINESS TAXES(millions of dollars)
All Funds business tax receipts for FY 2012 are estimated at $7.9 billion, an increase of $643 million (8.8 percent) from the prior year. This increase is mainly driven by the corporate franchise and bank taxes. Higher gross receipts for the bank tax and higher audits for the corporate franchise tax are the primary reasons for the increase as well as an incremental $213 million increase (from $100 million in FY 2011 to $313 million in FY 2012) for the tax deferral of certain tax credits included in the corporate franchise tax. All Funds corporate franchise tax receipts are estimated to be $3.2 billion, an increase of $385 million (13.5 percent) from FY 2011. The year-to-year increase is primarily due to higher audit receipts and the incremental increase for the tax deferral of certain tax credits. Gross receipts adjusted for the impact of the tax deferral are estimated to decline 6.2 percent from FY 2011. This is primarily attributable to the weakness in to-date 2011 liability payments. Through December 2011 payments from calendar year filers were basically flat compared to the prior year. The majority of the weakness occurred in the month of December when payments declined 11.9 percent. All Funds corporation and utilities receipts for FY 2012 are estimated to be $815 million, an increase of $2 million (0.2 percent) from last year. Gross receipts for FY 2012 are estimated to decline 1 percent from FY 2011. This lack of growth is related to continued erosion of the telecommunication sector's taxable base, and a large refund ($40 million) expected to be paid in FY 2012. Adjusted for the large refund, receipts growth would be 5.1 percent, primarily driven by higher audit receipts. Consumers continue to shift to mobile and non-cable company voice-over-internet-protocol telecommunications at the expense of landline telecommunications while internet-based communications tools such as Twitter and Facebook continue to grow. In

MULTI-YEAR FINANCIAL PLAN PROJECTIONS
54
contrast, revenue from the regulated utilities provides a stabilizing component to the corporation and utilities tax base. All Funds insurance tax receipts for FY 2012 are estimated to be $1.4 billion, an increase of $62 million (4.6 percent) from last year. This increase is driven by higher calendar year 2011 liability. Liability year 2011 payments are estimated to increase 5.3 percent over the prior year. All Funds bank tax receipts for FY 2012 are estimated to be $1,374 million, an increase of $196 million (16.6 percent) above last year. This increase is mainly attributable to strong December collections in commercial bank calendar year liability estimated payments and the corresponding expected increase in the March prepayment. Additionally, refunds are significantly lower in FY 2012 compared to FY 2011 due to the delay in payment of 2009-10 refunds to April 2010. Lower audit receipts are expected to offset a portion of the increase in receipts from higher gross receipts and lower refunds. General Fund business tax receipts for FY 2012 of nearly $5.9 billion are estimated to increase by $590 million (11.2 percent) from FY 2011. Business tax receipts deposited to the General Fund reflect the All Funds trends discussed previously.
2008-09 Actual
2009-10 Actual
2010-11 Actual
2011-12 Estimated
2012-13 Projected
Corporate Franchise Tax 3,220 2,511 2,846 3,231 3,299
Audit 905 698 810 1,085 800
Non-Audit 2,315 1,813 2,036 2,146 2,499
Corporation and Utilities Taxes 863 954 814 815 877
Audit 47 52 14 54 54
Non-Audit 816 902 800 761 823
Insurance Taxes 1,181 1,491 1,351 1,413 1,463
Audit 41 35 38 18 13
Non-Audit 1,140 1,456 1,313 1,395 1,450
Bank Taxes 1,233 1,399 1,178 1,374 1,351
Audit 455 290 239 126 287
Non-Audit 778 1,109 939 1,248 1,064
PBT 1,107 1,104 1,091 1,089 1,162
Audit 16 10 7 6 6
Non-Audit 1,091 1,094 1,084 1,083 1,156
Total Business Taxes 7,604 7,459 7,280 7,922 8,152
Audit 1,464 1,085 1,108 1,289 1,160
Non-Audit 6,140 6,374 6,172 6,633 6,992
ALL FUNDS BUSINESS TAX AUDIT AND NON-AUDIT RECEIPTS
(millions of dollars)
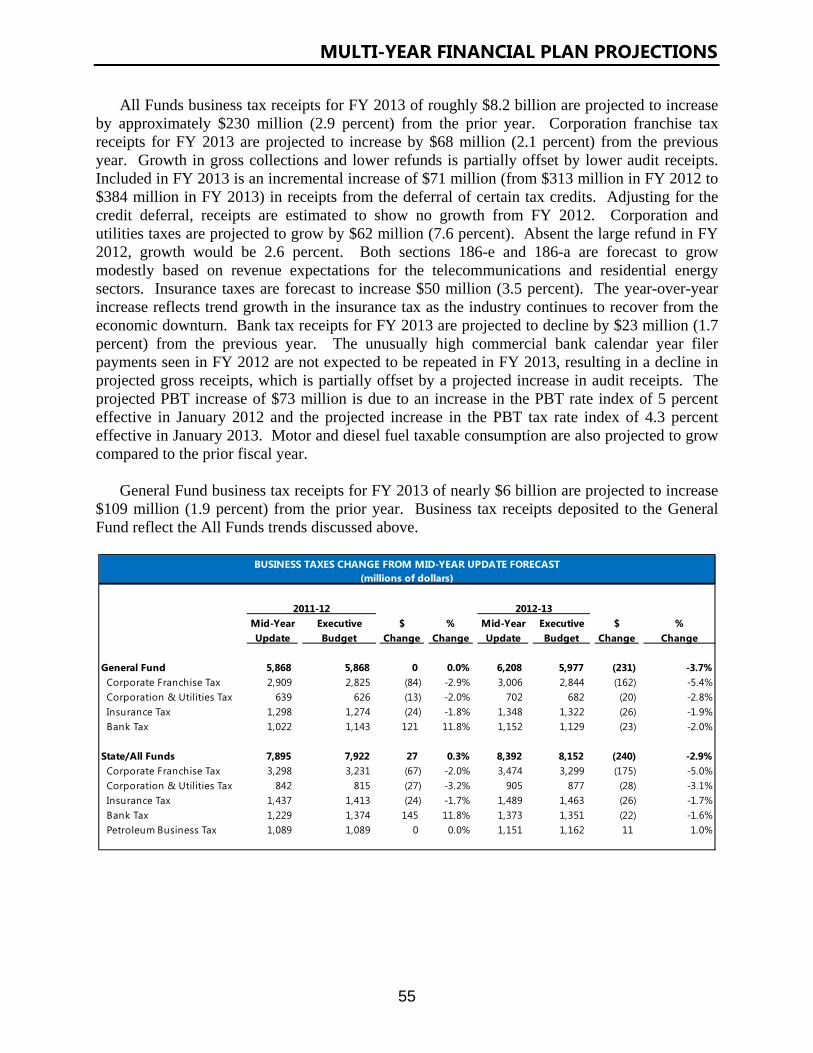
MULTI-YEAR FINANCIAL PLAN PROJECTIONS
55
All Funds business tax receipts for FY 2013 of roughly $8.2 billion are projected to increase by approximately $230 million (2.9 percent) from the prior year. Corporation franchise tax receipts for FY 2013 are projected to increase by $68 million (2.1 percent) from the previous year. Growth in gross collections and lower refunds is partially offset by lower audit receipts. Included in FY 2013 is an incremental increase of $71 million (from $313 million in FY 2012 to $384 million in FY 2013) in receipts from the deferral of certain tax credits. Adjusting for the credit deferral, receipts are estimated to show no growth from FY 2012. Corporation and utilities taxes are projected to grow by $62 million (7.6 percent). Absent the large refund in FY 2012, growth would be 2.6 percent. Both sections 186-e and 186-a are forecast to grow modestly based on revenue expectations for the telecommunications and residential energy sectors. Insurance taxes are forecast to increase $50 million (3.5 percent). The year-over-year increase reflects trend growth in the insurance tax as the industry continues to recover from the economic downturn. Bank tax receipts for FY 2013 are projected to decline by $23 million (1.7 percent) from the previous year. The unusually high commercial bank calendar year filer payments seen in FY 2012 are not expected to be repeated in FY 2013, resulting in a decline in projected gross receipts, which is partially offset by a projected increase in audit receipts. The projected PBT increase of $73 million is due to an increase in the PBT rate index of 5 percent effective in January 2012 and the projected increase in the PBT tax rate index of 4.3 percent effective in January 2013. Motor and diesel fuel taxable consumption are also projected to grow compared to the prior fiscal year. General Fund business tax receipts for FY 2013 of nearly $6 billion are projected to increase $109 million (1.9 percent) from the prior year. Business tax receipts deposited to the General Fund reflect the All Funds trends discussed above.
Mid-Year Executive $ % Mid-Year Executive $ %Update Budget Change Change Update Budget Change Change
General Fund 5,868 5,868 0 0.0% 6,208 5,977 (231) -3.7% Corporate Franchise Tax 2,909 2,825 (84) -2.9% 3,006 2,844 (162) -5.4% Corporation & Utilities Tax 639 626 (13) -2.0% 702 682 (20) -2.8% Insurance Tax 1,298 1,274 (24) -1.8% 1,348 1,322 (26) -1.9% Bank Tax 1,022 1,143 121 11.8% 1,152 1,129 (23) -2.0%
State/All Funds 7,895 7,922 27 0.3% 8,392 8,152 (240) -2.9% Corporate Franchise Tax 3,298 3,231 (67) -2.0% 3,474 3,299 (175) -5.0% Corporation & Utilities Tax 842 815 (27) -3.2% 905 877 (28) -3.1% Insurance Tax 1,437 1,413 (24) -1.7% 1,489 1,463 (26) -1.7% Bank Tax 1,229 1,374 145 11.8% 1,373 1,351 (22) -1.6% Petroleum Business Tax 1,089 1,089 0 0.0% 1,151 1,162 11 1.0%
2011-12
BUSINESS TAXES CHANGE FROM MID-YEAR UPDATE FORECAST(millions of dollars)
2012-13

MULTI-YEAR FINANCIAL PLAN PROJECTIONS
56
Compared to the Mid-Year Update, FY 2012 All Funds business tax receipts are estimated to increase $27 million (0.3 percent). The increase is attributable to the bank tax. Higher than estimated December bank tax receipts are the primary cause of the increase. Reductions in the other business taxes (excluding the PBT) resulting from year-to-date collection trends partially offset the gain from the bank tax. The petroleum business tax is unchanged from the Mid-Year Update. All Funds business tax receipts for FY 2013 are nearly $8.2 billion, or $240 million (2.9 percent) below the Mid-Year Update. The decrease is primarily the result of corporate franchise tax receipts. Lower gross receipts carried forward from FY 2012 and the negative impact of the December 2011 Special Session items ($45 million) are the primary reasons for the decrease from the Mid-Year Update. The changes from the Mid-Year Update for the other business taxes are modest.
2012-13 2013-14 Annual $ 2014-15 Annual $ 2015-16 Annual $Projected Projected Change Projected Change Projected Change
General Fund 5,977 6,213 236 5,718 (495) 6,291 573 Corporate Franchise Tax 2,844 3,024 180 2,335 (689) 2,736 401 Corporation & Utilities Tax 682 706 24 730 24 757 27 Insurance Tax 1,322 1,383 61 1,422 39 1,491 69 Bank Tax 1,129 1,100 (29) 1,231 131 1,307 76
State/All Funds 8,152 8,452 300 8,042 (410) 8,674 632 Corporate Franchise Tax 3,299 3,526 227 2,886 (640) 3,315 429 Corporation & Utilities Tax 877 904 27 930 26 963 33 Insurance Tax 1,463 1,533 70 1,579 46 1,654 75 Bank Tax 1,351 1,289 (62) 1,442 153 1,532 90 Petroleum Business Tax 1,162 1,200 38 1,205 5 1,210 5
BUSINESS TAXES(millions of dollars)
All Funds business tax receipts for FY 2014, FY 2015, and FY 2016 reflect trend growth that is determined, in part, by the expected level of corporate profits, the expected profitability of banks, the change in taxable insurance premiums, residential energy expenditures and the consumption of telecommunications services. Business tax receipts are estimated to increase to $8.5 billion (3.7 percent) in FY 2014, decline to $8 billion (4.9 percent) in FY 2015, and increase to $8.7 billion (7.9 percent) in FY 2016. The decline in FY 2015 reflects the first year of the credit deferral payback to taxpayers. General Fund business tax receipts will reflect the factors outlined above, and are projected to increase to $6.2 billion (3.9 percent) in FY 2014, decline to $5.7 billion (8 percent) in FY 2015, and increase to $6.3 billion (10 percent) in FY 2016.
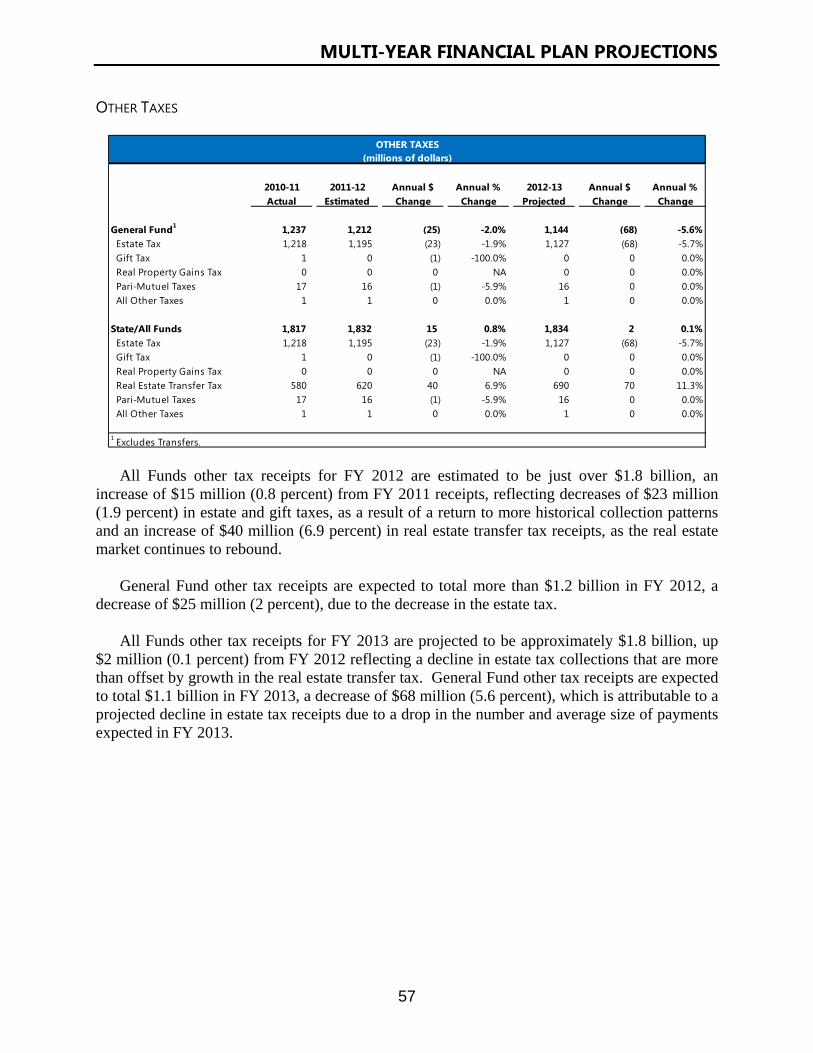
MULTI-YEAR FINANCIAL PLAN PROJECTIONS
57
OTHER TAXES
2010-11 2011-12 Annual $ Annual % 2012-13 Annual $ Annual %Actual Estimated Change Change Projected Change Change
General Fund1 1,237 1,212 (25) -2.0% 1,144 (68) -5.6% Estate Tax 1,218 1,195 (23) -1.9% 1,127 (68) -5.7% Gift Tax 1 0 (1) -100.0% 0 0 0.0% Real Property Gains Tax 0 0 0 NA 0 0 0.0% Pari-Mutuel Taxes 17 16 (1) -5.9% 16 0 0.0% All Other Taxes 1 1 0 0.0% 1 0 0.0%
State/All Funds 1,817 1,832 15 0.8% 1,834 2 0.1% Estate Tax 1,218 1,195 (23) -1.9% 1,127 (68) -5.7% Gift Tax 1 0 (1) -100.0% 0 0 0.0% Real Property Gains Tax 0 0 0 NA 0 0 0.0% Real Estate Transfer Tax 580 620 40 6.9% 690 70 11.3% Pari-Mutuel Taxes 17 16 (1) -5.9% 16 0 0.0% All Other Taxes 1 1 0 0.0% 1 0 0.0%
1 Excludes Transfers.
OTHER TAXES(millions of dollars)
All Funds other tax receipts for FY 2012 are estimated to be just over $1.8 billion, an increase of $15 million (0.8 percent) from FY 2011 receipts, reflecting decreases of $23 million (1.9 percent) in estate and gift taxes, as a result of a return to more historical collection patterns and an increase of $40 million (6.9 percent) in real estate transfer tax receipts, as the real estate market continues to rebound. General Fund other tax receipts are expected to total more than $1.2 billion in FY 2012, a decrease of $25 million (2 percent), due to the decrease in the estate tax. All Funds other tax receipts for FY 2013 are projected to be approximately $1.8 billion, up $2 million (0.1 percent) from FY 2012 reflecting a decline in estate tax collections that are more than offset by growth in the real estate transfer tax. General Fund other tax receipts are expected to total $1.1 billion in FY 2013, a decrease of $68 million (5.6 percent), which is attributable to a projected decline in estate tax receipts due to a drop in the number and average size of payments expected in FY 2013.

MULTI-YEAR FINANCIAL PLAN PROJECTIONS
58
Mid-Year Executive $ % Mid-Year Executive $ %Update Budget Change Change Update Budget Change Change
General Fund1 1,092 1,212 120 11.0% 1,087 1,144 57 5.2% Estate Tax 1,075 1,195 120 11.2% 1,070 1,127 57 5.3% Gift Tax 0 0 0 0.0% 0 0 0 0.0% Real Property Gains Tax 0 0 0 0.0% 0 0 0 0.0% Pari-Mutuel Taxes 16 16 0 0.0% 16 16 0 0.0% All Other Taxes 1 1 0 0.0% 1 1 0 0.0%
State/All Funds 1,712 1,832 120 7.0% 1,777 1,834 57 3.2% Estate Tax 1,075 1,195 120 11.2% 1,070 1,127 57 5.3% Gift Tax 0 0 0 0.0% 0 0 0 0.0% Real Property Gains Tax 0 0 0 0.0% 0 0 0 0.0% Real Estate Transfer Tax 620 620 0 0.0% 690 690 0 0.0% Pari-Mutuel Taxes 16 16 0 0.0% 16 16 0 0.0% All Other Taxes 1 1 0 0.0% 1 1 0 0.0%
1 Excludes Transfers.
OTHER TAXES CHANGE FROM MID-YEAR UPDATE FORECAST
2012-13
(millions of dollars)
2011-12
All Funds other tax receipts in FY 2012 are revised up by $120 million from the Mid-Year Update due entirely to an upward revision to estate tax receipts driven by stronger than-anticipated year-to-date results. All Funds other taxes for FY 2013 are revised up by $57 million in recognition of strength in current year estate tax receipts.
2012-13 2013-14 Annual $ 2014-15 Annual $ 2015-16 Annual $Projected Projected Change Projected Change Projected Change
General Fund1 1,144 1,137 (7) 1,222 85 1,222 0 Estate Tax 1,127 1,120 (7) 1,205 85 1,205 0 Gift Tax 0 0 0 0 0 0 0 Real Property Gains Tax 0 0 0 0 0 0 0 Pari-Mutuel Taxes 16 16 0 16 0 16 0 All Other Taxes 1 1 0 1 0 1 0
State/All Funds 1,834 1,907 73 2,062 155 2,137 75 Estate Tax 1,127 1,120 (7) 1,205 85 1,205 0 Gift Tax 0 0 0 0 0 0 0 Real Property Gains Tax 0 0 0 0 0 0 0 Real Estate Transfer Tax 690 770 80 840 70 915 75 Pari-Mutuel Taxes 16 16 0 16 0 16 0 All Other Taxes 1 1 0 1 0 1 0
1 Excludes Transfers.
OTHER TAXES(millions of dollars)

MULTI-YEAR FINANCIAL PLAN PROJECTIONS
59
The FY 2014 All Funds receipts projection for other taxes of just over $1.9 billion represents an increase of $73 million (4 percent) from FY 2013 receipts. The forecast reflects continued increases in household net worth and the value of real property transfers. The FY 2015 All Funds receipts projection for other taxes of nearly $2.1 billion is up $155 million (8.1 percent) from FY 2014 as continued growth in estate and real estate transfer tax collections is expected. The FY 2016 All Funds receipts projection for other taxes is slightly more than $2.1 billion, up $75 million (3.6 percent) from FY 2015 receipts. Receipts from the real estate transfer tax are projected to increase, reflecting the continued rebound in residential and commercial transactions. MISCELLANEOUS RECEIPTS AND FEDERAL GRANTS
2010-11 2011-12 Annual $ Annual % 2012-13 Annual $ Annual %Actual Estimated Change Change Projected Change Change
General Fund 3,149 3,304 155 4.9% 3,129 (175) -5.3% Miscellaneous Receipts1 3,095 3,244 149 4.8% 3,069 (175) -5.4% Federal Grants 54 60 6 11.1% 60 0 0.0%
State Funds 23,111 23,845 734 3.2% 24,269 424 1.8% Miscellaneous Receipts1 22,994 23,700 706 3.1% 24,124 424 1.8% Federal Grants 117 145 28 23.9% 145 0 0.0%
All Funds 72,451 67,774 (4,677) -6.5% 66,191 (1,583) -2.3% Miscellaneous Receipts1 23,148 23,832 684 3.0% 24,255 423 1.8% Federal Grants 49,303 43,942 (5,361) -10.9% 41,936 (2,006) -4.6%
1 Includes receipts from motor vehicle fees and alcohol beverage control license fees, previously reflected as "user taxes and fees."
MISCELLANEOUS RECEIPTS AND FEDERAL GRANTS(millions of dollars)
All funds miscellaneous receipts include monies received from HCRA financing sources, SUNY tuition and patient income, lottery receipts for education, assessments on regulated industries, and a variety of fees and licenses. All Funds miscellaneous receipts are projected to reach $23.8 billion in FY 2012, an increase of $684 million from FY 2011. Augmenting General Fund growth are (see below) growth in SUNY receipts, including bond proceeds available for SUNY capital projects ($694 million), and changes in bond proceed funding for several capital improvement projects including health and environmental conservation ($333 million). Federal grants help pay for State spending on Medicaid, temporary and disability assistance, mental hygiene, school aid, public health, and other activities. Annual changes to Federal grants generally correspond to changes in federally-reimbursed spending. Accordingly, DOB typically plans that Federal reimbursement will be received in the State fiscal year in which spending occurs, but timing is often unpredictable. All Funds Federal grant are projected to total $43.9 billion in FY 2012, a decline of $5.4 billion from FY 2011 reflecting a decrease in Federal ARRA funding.

MULTI-YEAR FINANCIAL PLAN PROJECTIONS
60
General Fund miscellaneous receipts collections are estimated to be $3.2 billion in FY 2012, an increase of $149 million from FY 2011 receipts. This increase is primarily due to timing of payments and the decreased dormancy period for abandoned property from five years to three years. General fund miscellaneous receipts collections are projected to be $3.1 billion in FY 2013, a decrease of $175 million from FY 2012. This decrease is primarily the result of a decrease in the New York Power for Jobs program receipts and lower public authority receipts.
General Fund miscellaneous receipts for FY 2012 have been revised upward by $92 million, reflecting re-estimates from stronger than expected year-to-date receipts and an upward revision of $25 million to the New York Power for Jobs program receipts.
All Funds miscellaneous receipts in FY 2012 were revised upward by $532 million largely reflecting increased projections for programs financed with authority bond proceeds, including economic development ($343 million) and modest receipts revisions in various special revenue funds ($81 million) and general fund increase detailed below. General Fund miscellaneous receipts for FY 2013 have been revised upward by $45 million. This revision is the result of upward re-estimates in fees and abandoned property slightly offset by a downward revision to New York Power for Jobs program. All Funds miscellaneous receipts in FY 2013 were revised upward by $268 million largely reflecting increased projections for programs financed with authority bond proceeds, including economic development, transportation and parks ($370 million) offset by declines in lottery receipts and receipts revisions in various special revenue funds ($146 million). All Funds Federal grants were revised upward in FY 2012 and FY 2013 from Mid-Year by $911 million and $2.4 billion, respectively primarily driven by revisions to Medicaid spending.
$ % $ %Change Change Change Change
General Fund1 3,212 3,304 92 2.9% 3,084 3,129 45 1.5% Miscellaneous Receipts2 3,152 3,244 92 2.9% 3,024 3,069 45 1.5% Federal Grants 60 60 0 0.0% 60 60 0 0.0%
State Funds 23,313 23,845 532 2.3% 24,001 24,269 268 1.1% Miscellaneous Receipts2 23,168 23,700 532 2.3% 23,856 24,124 268 1.1% Federal Grants 145 145 0 0.0% 145 145 0 0.0%
All Funds 66,331 67,774 1,443 2.2% 63,521 66,191 2,670 4.2% Miscellaneous Receipts2 23,300 23,832 532 2.3% 23,987 24,255 268 1.1% Federal Grants 43,031 43,942 911 2.1% 39,534 41,936 2,402 6.1%
1 Excludes Transfers.2 Includes receipts from motor vehicle fees and alcohol beverage control license fees, previously reflected as "user taxes and fees."
2012-13
MISCELLANEOUS RECEIPTS AND FEDERAL GRANTS: CHANGE FROM MID-YEAR UPDATE FORECAST(millions of dollars)
Mid-Year Update
Executive Budget
Executive Budget
Mid-Year Update
2011-12

MULTI-YEAR FINANCIAL PLAN PROJECTIONS
61
2012-13 2013-14 Annual $ 2014-15 Annual $ 2015-16 Annual $Projected Projected Change Projected Change Projected Change
General Fund 3,129 2,638 (491) 2,243 (395) 2,336 93 Miscellaneous Receipts1 3,069 2,636 (433) 2,243 (393) 2,336 93 Federal Grants 60 2 (58) 0 (2) 0 0
State Funds 24,269 24,114 (155) 23,841 (273) 23,973 132 Miscellaneous Receipts1 24,124 24,027 (97) 23,756 (271) 23,888 132 Federal Grants 145 87 (58) 85 (2) 85 0
All Funds 66,191 67,696 1,505 70,508 2,812 72,472 1,964 Miscellaneous Receipts1 24,255 24,158 (97) 23,887 (271) 24,019 132 Federal Grants 41,936 43,538 1,602 46,621 3,083 48,453 1,832
1 Includes receipts from motor vehicle fees and alcohol beverage control license fees, previously reflected as "user taxes and fees."
MISCELLANEOUS RECEIPTS AND FEDERAL GRANTS(millions of dollars)
General Fund miscellaneous receipts and Federal Grants are estimated to be $2.6 billion in FY 2014, down $491 million from FY 2013 receipts. This decrease is primarily due to lower 18-A public utility assessments, lower fee estimates, and a change in how Federal grants are reimbursed. General Fund miscellaneous receipts and Federal grants in FY 2015 are projected to be $2.2 billion, down $393 million from FY 2014. This decrease primarily results from lower 18-A public utility assessments. General Fund miscellaneous receipts and Federal grants in FY 2016 are projected to be just over $2.3 billion, an increase of $93 million from the prior year. This increase primarily results from an increase in the New York Power of Jobs program receipts. All Funds miscellaneous receipts are projected to total $24.2 billion in FY 2014, a decrease of $97 million from FY 2013. General Fund reductions described above are offset by growth in other areas, primarily HCRA ($179 million) and SUNY receipts ($167 million). All Funds miscellaneous receipts decrease by $271 million in FY 2015, driven by the decline in General Funds and the projected decline in programs financed with authority bond proceeds, including health projects ($169 million) partially offset by increases in HCRA ($119 million) and SUNY receipts ($159 million). All Funds miscellaneous receipts are projected to total $24 billion in FY 2016, an increase of $132 million from FY 2015 driven by General Fund increases described above. All Funds Federal grants are projected to increase in all years driven primarily by Medicaid spending.

MULTI-YEAR FINANCIAL PLAN PROJECTIONS
62
DISBURSEMENTS General Fund disbursements in FY 2013 are estimated to total $58.6 billion, an increase of $1.7 billion (2.9 percent) over the current FY 2012 estimate. State Operating Funds disbursements for FY 2013 are estimated to total $88.7 billion, an increase of $1.7 billion (1.9 percent) over FY 2012. The multi-year disbursements projections take into account agency staffing levels, program caseloads, formulas contained in State and Federal law, inflation and other factors. The factors that affect spending estimates vary by program. For example, welfare spending is based primarily on anticipated caseloads that are estimated by analyzing historical trends and projected economic conditions. Projections account for the timing of payments, since not all of the amounts appropriated in the Budget are disbursed in the same fiscal year. Consistent with past years, the aggregate spending projections (i.e., the sum of all projected spending by individual agencies) in special revenue funds have been adjusted downward in all fiscal years based on typical spending patterns and the observed variance between estimated and actual results over time. Over the multi-year Financial Plan, State Operating Funds spending is expected to increase by an average annual rate of 3.4 percent. The projections reflect spending at the capped growth rates for Medicaid and School Aid, and contemplates the effect of national health care reform on State health care costs. The projections do not reflect any potential impact of automatic spending reductions that would be triggered if the Federal government fails to amend existing deficit reduction legislation. Medicaid, education, pension costs, employee and retiree health benefits, social services programs and debt service are significant drivers of spending growth over the Plan period. Selected assumptions used by DOB in preparing the spending projections for the State’s major programs and activities are summarized in the following tables.

MULTI-YEAR FINANCIAL PLAN PROJECTIONS
63
LOCAL ASSISTANCE GRANTS Local Assistance spending includes payments to local governments, school districts, health care providers, and other entities, as well as financial assistance to, or on behalf of, individuals, families and not-for-profit organizations. State-funded local assistance spending is estimated at $59.1 billion in FY 2013 and accounts for over 65 percent of total State Operating Funds spending. Education and health care spending account for three-quarters of local assistance spending. Selected assumptions used in preparing the spending projections for the State’s major local aid programs and activities are summarized in the following table.
FY 2012 FY 2013 FY 2014 FY 2015Current Proposed Projected Projected
Medicaid Medicaid Coverage 4,535,463 4,628,505 4,856,565 5,324,544 Family Health Plus Coverage 427,066 453,355 479,644 505,932 Child Health Plus Coverage 418,241 436,241 454,241 472,241 State Takeover of County/NYC Costs ($000) $1,544 $1,466 $1,846 $2,458 - Family Health Plus $428 $515 $597 $682 - Medicaid $1,116 $952 $1,249 $1,776
Education School Aid (School Year) ($000) $19,507 $20,312 $21,023 $21,864 Personal Income Growth Index N/A 4.1 3.5 4.0
Higher Education Public Higher Education Enrollment (FTEs) 576,300 577,664 578,242 578,820 Tuition Assistance Program Recipients 309,334 310,633 310,633 310,633
Welfare Family Assistance Caseload 385,180 374,822 363,077 352,880 Single Adult/No Children Caseload 180,338 178,207 176,780 175,786
Mental HygieneTotal: Mental Hygiene Community Beds 88,426 92,458 96,280 100,265 - OMH Community Beds 36,527 40,002 42,953 46,189 - OPWDD Community Beds 39,101 39,621 40,404 41,077 - OASAS Community Beds 12,798 12,835 12,923 12,999
Prison Population (Corrections) 55,100 55,100 55,100 55,100
FORECAST FOR SELECTED PROGRAM MEASURES AFFECTING OPERATING ACTIVITIES
Forecast
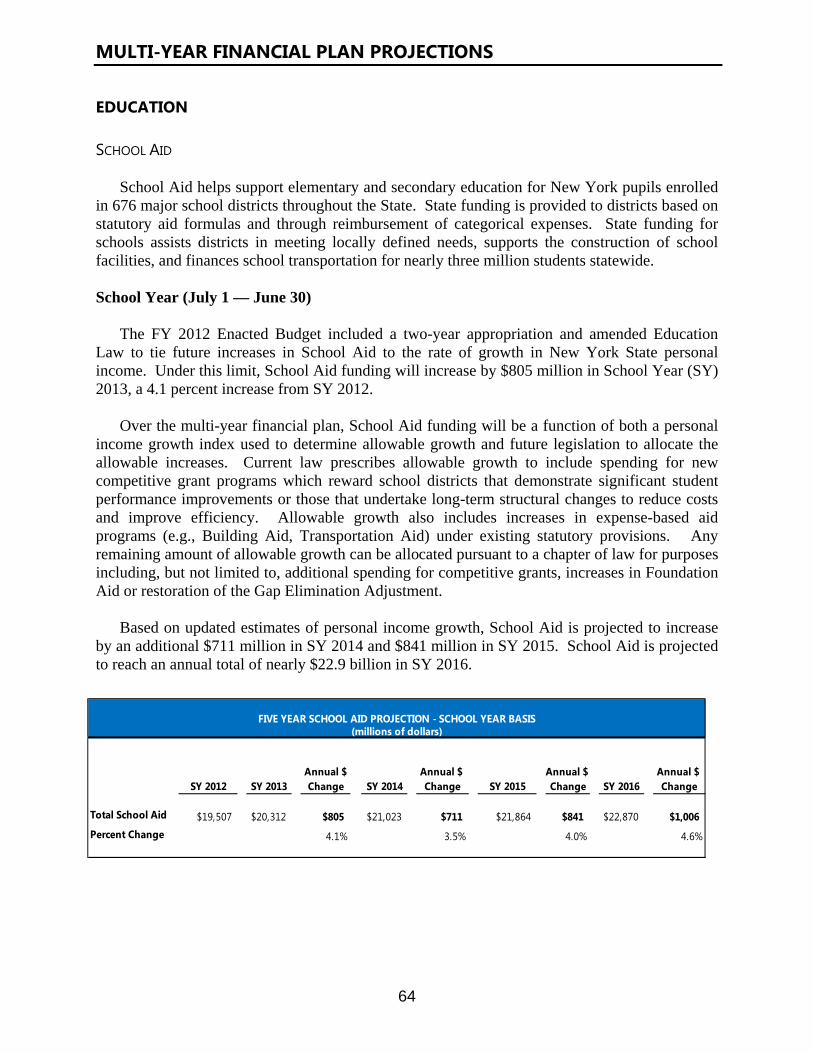
MULTI-YEAR FINANCIAL PLAN PROJECTIONS
64
EDUCATION SCHOOL AID School Aid helps support elementary and secondary education for New York pupils enrolled in 676 major school districts throughout the State. State funding is provided to districts based on statutory aid formulas and through reimbursement of categorical expenses. State funding for schools assists districts in meeting locally defined needs, supports the construction of school facilities, and finances school transportation for nearly three million students statewide. School Year (July 1 — June 30) The FY 2012 Enacted Budget included a two-year appropriation and amended Education Law to tie future increases in School Aid to the rate of growth in New York State personal income. Under this limit, School Aid funding will increase by $805 million in School Year (SY) 2013, a 4.1 percent increase from SY 2012. Over the multi-year financial plan, School Aid funding will be a function of both a personal income growth index used to determine allowable growth and future legislation to allocate the allowable increases. Current law prescribes allowable growth to include spending for new competitive grant programs which reward school districts that demonstrate significant student performance improvements or those that undertake long-term structural changes to reduce costs and improve efficiency. Allowable growth also includes increases in expense-based aid programs (e.g., Building Aid, Transportation Aid) under existing statutory provisions. Any remaining amount of allowable growth can be allocated pursuant to a chapter of law for purposes including, but not limited to, additional spending for competitive grants, increases in Foundation Aid or restoration of the Gap Elimination Adjustment. Based on updated estimates of personal income growth, School Aid is projected to increase by an additional $711 million in SY 2014 and $841 million in SY 2015. School Aid is projected to reach an annual total of nearly $22.9 billion in SY 2016.
Annual $ Annual $ Annual $ Annual $ SY 2012 SY 2013 Change SY 2014 Change SY 2015 Change SY 2016 Change
Total School Aid $19,507 $20,312 $805 $21,023 $711 $21,864 $841 $22,870 $1,006Percent Change 4.1% 3.5% 4.0% 4.6%
FIVE YEAR SCHOOL AID PROJECTION - SCHOOL YEAR BASIS(millions of dollars)
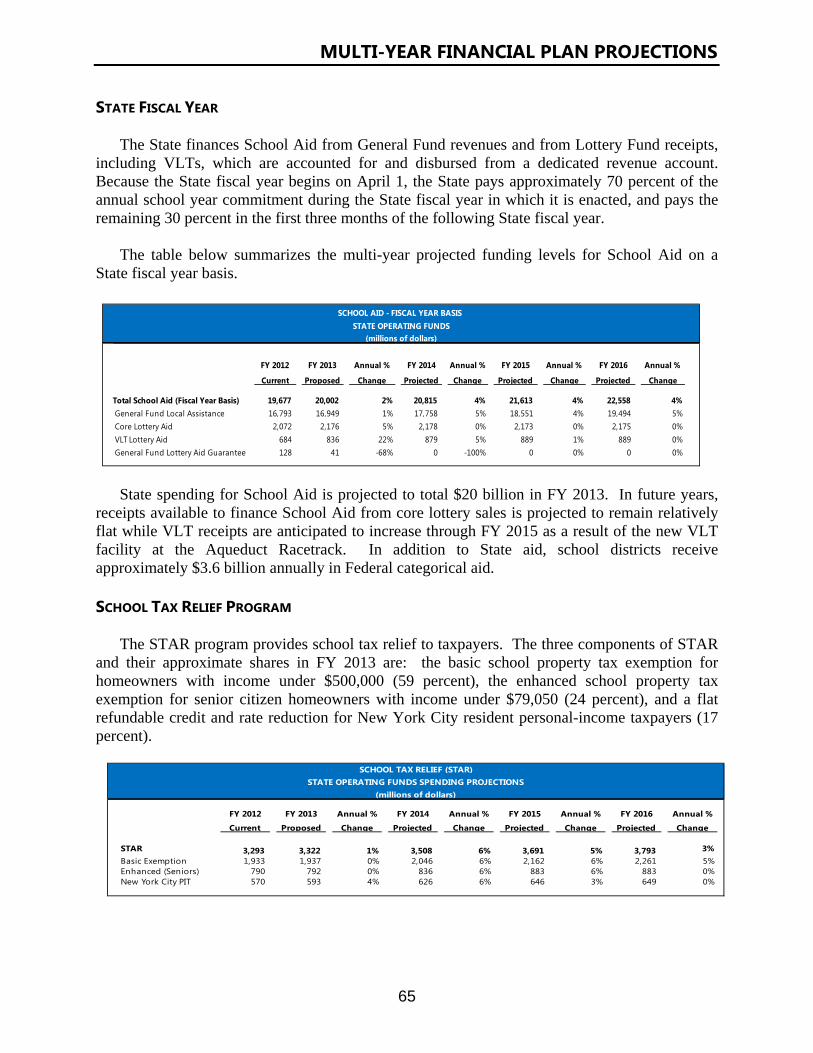
MULTI-YEAR FINANCIAL PLAN PROJECTIONS
65
STATE FISCAL YEAR The State finances School Aid from General Fund revenues and from Lottery Fund receipts, including VLTs, which are accounted for and disbursed from a dedicated revenue account. Because the State fiscal year begins on April 1, the State pays approximately 70 percent of the annual school year commitment during the State fiscal year in which it is enacted, and pays the remaining 30 percent in the first three months of the following State fiscal year. The table below summarizes the multi-year projected funding levels for School Aid on a State fiscal year basis.
State spending for School Aid is projected to total $20 billion in FY 2013. In future years, receipts available to finance School Aid from core lottery sales is projected to remain relatively flat while VLT receipts are anticipated to increase through FY 2015 as a result of the new VLT facility at the Aqueduct Racetrack. In addition to State aid, school districts receive approximately $3.6 billion annually in Federal categorical aid. SCHOOL TAX RELIEF PROGRAM The STAR program provides school tax relief to taxpayers. The three components of STAR and their approximate shares in FY 2013 are: the basic school property tax exemption for homeowners with income under $500,000 (59 percent), the enhanced school property tax exemption for senior citizen homeowners with income under $79,050 (24 percent), and a flat refundable credit and rate reduction for New York City resident personal-income taxpayers (17 percent).
FY 2012 FY 2013 Annual % FY 2014 Annual % FY 2015 Annual % FY 2016 Annual %
Current Proposed Change Projected Change Projected Change Projected Change
Total School Aid (Fiscal Year Basis) 19,677 20,002 2% 20,815 4% 21,613 4% 22,558 4%General Fund Local Assistance 16,793 16,949 1% 17,758 5% 18,551 4% 19,494 5%Core Lottery Aid 2,072 2,176 5% 2,178 0% 2,173 0% 2,175 0%VLT Lottery Aid 684 836 22% 879 5% 889 1% 889 0%General Fund Lottery Aid Guarantee 128 41 -68% 0 -100% 0 0% 0 0%
SCHOOL AID - FISCAL YEAR BASIS STATE OPERATING FUNDS
(millions of dollars)
FY 2012 FY 2013 Annual % FY 2014 Annual % FY 2015 Annual % FY 2016 Annual %
Current Proposed Change Projected Change Projected Change Projected Change
STAR 3,293 3,322 1% 3,508 6% 3,691 5% 3,793 3%Basic Exemption 1,933 1,937 0% 2,046 6% 2,162 6% 2,261 5%Enhanced (Seniors) 790 792 0% 836 6% 883 6% 883 0%New York City PIT 570 593 4% 626 6% 646 3% 649 0%
SCHOOL TAX RELIEF (STAR)
(millions of dollars)STATE OPERATING FUNDS SPENDING PROJECTIONS

MULTI-YEAR FINANCIAL PLAN PROJECTIONS
66
The STAR program exempts the first $30,000 of every eligible homeowner’s property value from the local school tax levy. Lower-income senior citizens receive a $62,200 exemption. Spending for the STAR property tax exemption reflects reimbursements made to school districts to offset the reduction in property tax revenues. The annual increase in a qualifying homeowner’s STAR exemption benefit is limited to 2 percent. Homeowners who earn more than $500,000 a year are not eligible for the STAR property tax exemption. New York City personal income taxpayers with annual income over $500,000 have a reduced benefit. The multi-year Financial Plan reflects a program under which the Department of Tax and Finance would instruct local assessors to withhold the STAR exemption benefit from taxpayers who have overdue State-imposed and State-administered taxes and who own a home that is STAR-eligible. New York City residents who are similarly in arrears would lose their City PIT rate-reduction benefit, as well as the State School Tax Reduction Credit. OTHER EDUCATION AID In addition to School Aid, the State provides funding and support for various other education-related initiatives. These include: special education services; prekindergarten through grade 12 education programs; cultural education; higher and professional education programs; and adult career and continuing education services. Major programs under the Office of Prekindergarten through Grade 12 education address specialized student needs or reimburse school districts for education-related services, including the school breakfast and lunch programs, non-public school aid, and various special education programs. In special education, New York provides a full spectrum of services to over 400,000 students from ages 3 to 21. Higher and professional education programs monitor the quality and availability of postsecondary education programs and regulate the licensing and oversight of 48 professions.
FY 2012 FY 2013 Annual % FY 2014 Annual % FY 2015 Annual % FY 2016 Annual %
Current Proposed Change Projected Change Projected Change Projected Change
Total Other Education Aid 1,718 1,890 10% 1,980 5% 2,051 4% 2,126 4%
Special Education 1,181 1,358 15% 1,456 7% 1,529 5% 1,604 5%Preschool Special Education 869 937 8% 1,012 8% 1,075 6% 1,140 6%Summer Special Education Programs 292 322 10% 345 7% 355 3% 365 3%Schools for Blind and Deaf Children 20 99 395% 99 0% 99 0% 99 0%
All Other Education 537 532 -1% 524 -2% 522 0% 522 0%Higher Education Programs 85 92 8% 85 -8% 85 0% 85 0%Non-Public School Aid 103 117 14% 117 0% 117 0% 117 0%Cultural Education Programs 100 98 -2% 97 -1% 97 0% 97 0%Vocational Rehabilitation 84 83 -1% 83 0% 83 0% 83 0%School Nutrition 36 37 3% 37 0% 38 3% 38 0%Other Education Programs 129 105 -19% 105 0% 102 -3% 102 0%
OTHER EDUCATION
(millions of dollars)STATE OPERATING FUNDS SPENDING PROJECTIONS

MULTI-YEAR FINANCIAL PLAN PROJECTIONS
67
Spending for special education is expected to increase as program costs and enrollment rise. In FY 2012, school districts will finance the costs associated with schools for the blind and deaf in the first instance and will be reimbursed by the State in the first quarter of FY 2013, which drives a significant annual increase in FY 2013 spending. Other education spending is affected by the phase-out of Federal ARRA Stabilization Funds. HIGHER EDUCATION Local assistance for higher education spending includes funding for CUNY, SUNY and HESC. The State provides assistance for CUNY’s senior college operations, and works in conjunction with the City of New York to support CUNY’s community colleges. The CUNY system is the largest urban public university system in the nation. Funding for SUNY supports 30 community colleges across multiple campuses. The State also provides a sizeable benefit to SUNY and CUNY through the debt service it pays on bond-financed capital projects at the universities. This is not reflected in the annual spending totals for the universities. State debt service payments for higher education are expected to total over $1.2 billion in FY 2013. HESC administers the TAP program that provides awards to income-eligible students, and NY HELPS. It also provides centralized processing for other student financial aid programs, and offers prospective students information and guidance on how to finance a college education. The financial aid programs that the Corporation administers are funded by the State and the Federal government.
FY 2012 FY 2013 Annual % FY 2014 Annual % FY 2015 Annual % FY 2016 Annual %Current Proposed Change Projected Change Projected Change Projected Change
Total Higher Education 2,605 2,661 2% 2,769 4% 2,845 3% 2,925 3%
City University 1,202 1,271 6% 1,329 5% 1,392 5% 1,460 5% Operating Aid to NYC (Senior Colleges) 1,023 1,101 8% 1,164 6% 1,227 5% 1,295 6% Community College Aid 178 169 -5% 165 -2% 165 0% 165 0% Community Projects 1 1 0% 0 -100% 0 0
Higher Education Services 924 951 3% 1,001 5% 1,014 1% 1,026 1% Tuition Assistance Program 849 893 5% 935 5% 941 1% 947 1% Aid for Part Time Study 12 12 0% 12 0% 12 0% 12 0% Scholarships/Awards 47 46 -2% 54 17% 61 13% 67 10% Other 16 0 -100% 0 0 0% 0 0%
State University 479 439 -8% 439 0% 439 0% 439 0% Community College Aid1 442 434 -2% 434 0% 434 0% 434 0% Hospital Subsidy2 32 0 -100% 0 0 0% 0 0% Other 5 5 0% 5 0% 5 0% 5 0%
1 State support for SUNY 4-year institutions is funded through State operations rather than local assistance.2 Beginning in academic year 2011-12, the SUNY hospital subsidy will be funded as a transfer from General Fund State operations rather than local assistance.
HIGHER EDUCATION
(millions of dollars)STATE OPERATING FUNDS LOCAL ASSISTANCE SPENDING PROJECTIONS

MULTI-YEAR FINANCIAL PLAN PROJECTIONS
68
Growth in spending for higher education over the plan period largely reflects aid to New York City for reimbursement of CUNY senior college operating expenses associated with the rising contribution rates for fringe benefits. Spending growth for tuition assistance reflects the impact of upward trends in student enrollment at institutions of higher education. HEALTH CARE Local assistance for health care-related spending includes Medicaid, statewide public health programs and a variety of mental hygiene programs. The DOH works with the local health departments and social services departments, including New York City, to coordinate and administer statewide health insurance programs and activities. The majority of government-financed health care programs are included under DOH, but many programs are supported through multi-agency efforts. The Medicaid program finances inpatient hospital care, outpatient hospital services, clinics, nursing homes, managed care, prescription drugs, home care, FHP, and services provided in a variety of community-based settings (including mental health, substance abuse treatment, developmental disabilities services, school-based services, foster care services and inpatient hospital services provided to inmates on medical leave from State correctional facilities). The State share of Medicaid spending is budgeted and expended principally through DOH, but State share Medicaid spending also appears in the mental hygiene agencies, child welfare programs, School Aid and DOCCS. Medicaid spending is reported separately in the Financial Plan tables for each of the agencies. MEDICAID Medicaid is a means-tested program that finances health care services for low-income individuals and long-term care services for the elderly and disabled, primarily through payments to health care providers. The Medicaid program is financed jointly by the State, the Federal government, and local governments (including New York City). New York’s Medicaid spending is projected to total approximately $54.0 billion in FY 2013, including the local contribution.6
6 The local contribution to the Medicaid program is not included in the State’s Financial Plan. Since January 2006, the State has paid the entire non-Federal share of the FHP program and any annual Medicaid increases above a fixed level for local social services districts. The FY 2013 Executive Budget proposes to amend these statutory indexing provisions by implementing a three-year phased-takeover of the local share of growth above the previous year’s enacted levels beginning in April 2013 for CY 2013, with the State assuming all growth CY 2015. This initiative is expected to save local governments nearly $1.2 billion through the next five state fiscal years, as compared to levels assumed under current statute.

MULTI-YEAR FINANCIAL PLAN PROJECTIONS
69
FY 2012 FY 2013 FY 2014 FY 2015 FY 2016Current Proposed Projected Projected Projected
Department of Health:State Share Without FMAP 16,033 15,605 16,513 17,049 17,895Enhanced FMAP (753) 254 0 0 0
DOH State Share With FMAP 15,280 15,859 16,513 17,049 17,895
Annual $ Change - DOH Only 579 654 536 846Annual % Change - DOH Only 4% 4% 3% 5%
Mental Hygiene 5,692 5,744 6,137 6,440 6,801Foster Care 111 113 117 122 127Corrections 0 12 12 12 13
State Operations - Contractual Expenses2 46 53 56 56 56
State Share Total (All Agencies) 21,129 21,781 22,835 23,679 24,892
Annual $ Change - Total State Share 652 1,054 844 1,213Annual % Change - Total State Share 3% 5% 4% 5%
TOTAL STATE-SHARE MEDICAID DISBURSEMENTS 1
(millions of dollars)
1 To conform the Financial Plan classification of State Operating Funds spending to the classification followed by the State Comptroller, approximately $3 billion in Medicaid spending supported by a transfer from Federal Funds to the State Mental Hygiene Patient Income Account is now classified as State spending.2 Includes operational costs that support contracts related to the management of the Medicaid program and various activities to ensure appropriate utilization.
The Executive Budget reflects continuation of the Medicaid spending cap enacted in FY 2012, and recommends funding consistent with its provisions. The cap is based on the ten-year average change in the medical component of the Consumer Price Index. Statutory changes approved with the FY 2012 budget grant the Executive certain administrative powers to help hold Medicaid pending to the capped level. The statutory changes expire at the end of FY 2013. The Executive Budget proposes a one-year extension through FY 2014. The cap itself remains in place and the Financial Plan assumes that statutory authority will be extended in subsequent years.
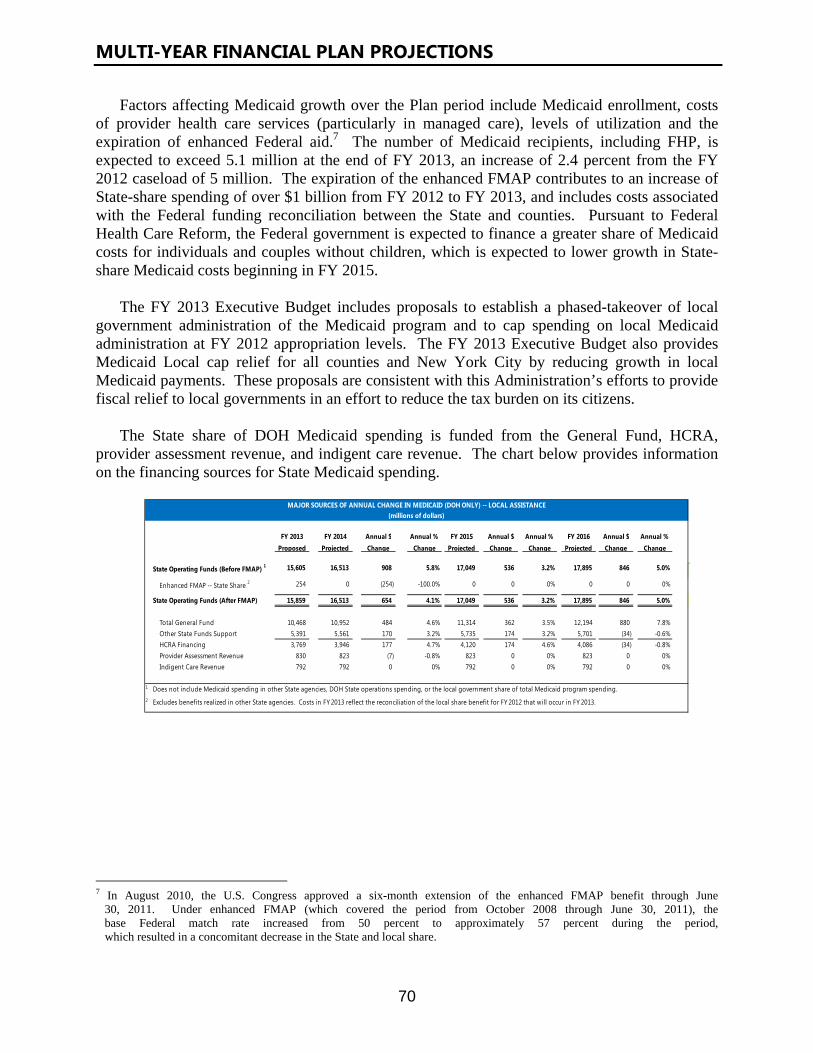
MULTI-YEAR FINANCIAL PLAN PROJECTIONS
70
Factors affecting Medicaid growth over the Plan period include Medicaid enrollment, costs of provider health care services (particularly in managed care), levels of utilization and the expiration of enhanced Federal aid.7 The number of Medicaid recipients, including FHP, is expected to exceed 5.1 million at the end of FY 2013, an increase of 2.4 percent from the FY 2012 caseload of 5 million. The expiration of the enhanced FMAP contributes to an increase of State-share spending of over $1 billion from FY 2012 to FY 2013, and includes costs associated with the Federal funding reconciliation between the State and counties. Pursuant to Federal Health Care Reform, the Federal government is expected to finance a greater share of Medicaid costs for individuals and couples without children, which is expected to lower growth in State-share Medicaid costs beginning in FY 2015. The FY 2013 Executive Budget includes proposals to establish a phased-takeover of local government administration of the Medicaid program and to cap spending on local Medicaid administration at FY 2012 appropriation levels. The FY 2013 Executive Budget also provides Medicaid Local cap relief for all counties and New York City by reducing growth in local Medicaid payments. These proposals are consistent with this Administration’s efforts to provide fiscal relief to local governments in an effort to reduce the tax burden on its citizens. The State share of DOH Medicaid spending is funded from the General Fund, HCRA, provider assessment revenue, and indigent care revenue. The chart below provides information on the financing sources for State Medicaid spending.
7 In August 2010, the U.S. Congress approved a six-month extension of the enhanced FMAP benefit through June 30, 2011. Under enhanced FMAP (which covered the period from October 2008 through June 30, 2011), the base Federal match rate increased from 50 percent to approximately 57 percent during the period, which resulted in a concomitant decrease in the State and local share.
FY 2013 FY 2014 Annual $ Annual % FY 2015 Annual $ Annual % FY 2016 Annual $ Annual % Proposed Projected Change Change Projected Change Change Projected Change Change
State Operating Funds (Before FMAP) 1 15,605 16,513 908 5.8% 17,049 536 3.2% 17,895 846 5.0%
Enhanced FMAP -- State Share 2 254 0 (254) -100.0% 0 0 0% 0 0 0%
State Operating Funds (After FMAP) 15,859 16,513 654 4.1% 17,049 536 3.2% 17,895 846 5.0%
Total General Fund 10,468 10,952 484 4.6% 11,314 362 3.5% 12,194 880 7.8% Other State Funds Support 5,391 5,561 170 3.2% 5,735 174 3.2% 5,701 (34) -0.6%
HCRA Financing 3,769 3,946 177 4.7% 4,120 174 4.6% 4,086 (34) -0.8%Provider Assessment Revenue 830 823 (7) -0.8% 823 0 0% 823 0 0%Indigent Care Revenue 792 792 0 0% 792 0 0% 792 0 0%
1
2
Does not include Medicaid spending in other State agencies, DOH State operations spending, or the local government share of total Medicaid program spending.
Excludes benefits realized in other State agencies. Costs in FY 2013 reflect the reconciliation of the local share benefit for FY 2012 that will occur in FY 2013.
MAJOR SOURCES OF ANNUAL CHANGE IN MEDICAID (DOH ONLY) -- LOCAL ASSISTANCE(millions of dollars)

MULTI-YEAR FINANCIAL PLAN PROJECTIONS
71
PUBLIC HEALTH/AGING PROGRAMS Public Health includes the EPIC program that provides prescription drug insurance to low-income seniors, the CHP program that finances health insurance coverage for children of low-income families up to the age of 19, the GPHW program that reimburses local health departments for the cost of providing certain public health services, the EI program that pays for services to infants and toddlers under the age of three with disabilities or developmental delays, and other HCRA and State-supported programs. The SOFA promotes and administers programs and services for New Yorkers 60 years of age and older. The Office primarily oversees community-based services, including but not limited to in-home services and nutrition assistance, provided through a network of county Area Agencies on Aging and local providers. Many public health programs, such as the EI and GPHW programs, are run by county health departments and reimbursed by the State for a share of program costs. The State spending projections do not include the county share of public health funding. In addition, a significant portion of HCRA spending is included under the public health budget. For more information on HCRA projections, see the section entitled “HCRA Financial Plan” below.
Increased enrollment in the CHP program and inflationary costs are expected to drive growth in the outyears of the plan, while outyear growth in the GPHW program reflects anticipated claiming from counties. The steep decline in spending in FY 2013 is due in large part to the annual impact of peak utilization in FY 2012 of funding received through the F-SHRP program, which was provided to the state on a time-limited basis (expiring March 31, 2014) through a Federal waiver under certain terms and conditions aimed at improving the delivery and access of community health care services. EPIC spending is projected to decline sharply in FY 2013, resulting from previous budgetary actions to provide coverage to Medicare Part D enrollees only when they are in the coverage gap. After FY 2013, EPIC spending is projected to stabilize and increase accordingly with the rising costs of prescription medication.
FY 2012 FY 2013 Annual % FY 2014 Annual % FY 2015 Annual % FY 2016 Annual %Current Proposed Change Projected Change Projected Change Projected Change
Public Health 2,020 1,919 -5% 1,997 4% 2,073 4% 1,920 -7%Child Health Plus 320 346 8% 374 8% 400 7% 414 4%General Public Health Work 254 254 0% 270 6% 283 5% 288 2%EPIC 178 118 -34% 125 6% 136 9% 149 10%Early Intervention 167 164 -2% 158 -4% 162 3% 165 2%HCRA Program Account 470 482 3% 481 0% 483 0% 483 0%F-SHRP 250 175 -30% 205 17% 205 0% 0 -100%All Other 381 380 0% 384 1% 404 5% 421 4%
Aging 114 114 0% 118 4% 124 5% 131 6%
PUBLIC HEALTH
(millions of dollars)STATE OPERATING FUNDS SPENDING PROJECTIONS

MULTI-YEAR FINANCIAL PLAN PROJECTIONS
72
HCRA FINANCIAL PLAN HCRA was established in 1996 to help finance a portion of State health care activities in various areas of the budget: Medicaid, Public Health, and the Department of Financial Services. Extensions and modifications to HCRA have financed new health care programs, including FHP, and provided additional funding for the expansion of existing programs such as CHP. HCRA has also provided additional financing for the health care industry, including investments in worker recruitment and retention, and the HEAL NY capital program. HCRA receipts include surcharges and assessments on hospital revenues, a “covered lives” assessment paid by insurance carriers, a portion of cigarette tax revenues, and other revenues dedicated by statute, as well as potential future proceeds from insurance company conversions. HCRA spending primarily finances Medicaid, EPIC, CHP, FHP and Indigent Care payments, which provide funds to hospitals that serve a disproportionate share of individuals without health insurance. HCRA also provides funding for Workforce Recruitment and Retention and rate adjustments to health facilities, physician excess medical malpractice, and HEAL NY for capital improvements to health care facilities.
FY 2012 Current
FY 2013Proposed
FY 2014Projected
FY 2015Projected
FY 2016Projected
Opening Balance 159 0 0 0 0
Total Receipts 5,359 6,029 6,185 6,282 6,260Surcharges 2,692 3,064 3,171 3,264 3,239Covered Lives Assessment 1,050 1,045 1,045 1,045 1,045Cigarette Tax Revenue 1,189 1,222 1,199 1,177 1,155Conversion Proceeds 0 250 300 300 300Hospital Assessments 373 394 417 444 469NYC Cigarette Tax Transfer/Other 55 54 53 52 52
Total Disbursements 5,518 6,029 6,185 6,282 6,260Medicaid Assistance Account 3,358 3,775 3,953 4,127 4,093 Medicaid Costs 2,136 2,386 2,632 2,806 2,772 Family Health Plus 602 690 657 657 657 Workforce Recruitment & Retention 184 211 197 197 197 All Other 436 488 467 467 467
HCRA Program Account 493 506 504 506 506Hospital Indigent Care 792 792 792 792 792Elderly Pharmaceutical Insurance Coverage 110 128 135 146 158Child Health Plus 327 354 382 408 422Public Health Programs 120 120 120 120 120All Other 318 354 299 183 169
Annual Operating Surplus/(Deficit) (159) 0 0 0 0
Closing Balance 0 0 0 0 0
HCRA FINANCIAL PLAN FY 2012 THROUGH FY 2016(millions of dollars)

MULTI-YEAR FINANCIAL PLAN PROJECTIONS
73
HCRA is expected to remain in balance over the multi-year projection period. Under the current HCRA appropriation structure, spending reductions will occur if resources are insufficient to meet spending levels. These spending reductions could potentially affect core HCRA programs. The reauthorizations of HCRA in prior years maintained HCRA’s balance without the need for automatic spending reductions. Given the close relationship between the General Fund and HCRA, any balances in HCRA are typically eliminated by adjusting the level of Medicaid expenditures that HCRA finances. This reduces costs that otherwise would have been paid for by the General Fund. Conversely, any shortfall in HCRA is expected to be financed by the General Fund. MENTAL HYGIENE The Department of Mental Hygiene is comprised of four independent agencies, OMH, OPWDD, OASAS, and DDPC, as well as one oversight agency, the CQCAPD. Services are administered to adults with serious and persistent mental illness; children with serious emotional disturbances; individuals with developmental disabilities and their families; and persons with chemical dependence. These agencies provide services directly to their patients through State-operated facilities and indirectly through community service providers. The costs associated with providing these services are funded by reimbursement from Medicaid, Medicare, third-party insurance and State funding. Patient care revenues are pledged first to the payment of debt service on outstanding mental hygiene bonds, which are issued to finance improvements to infrastructure at mental hygiene facilities throughout the State, with the remaining revenue used to support State operating costs.
FY 2012 FY 2013 Annual % FY 2014 Annual % FY 2015 Annual % FY 2016 Annual %
Current Proposed Change Projected Change Projected Change Projected Change
Total Mental Hygiene 3,581 3,576 0% 3,969 11% 4,231 7% 4,423 5%
People with Developmental Disabilities 2,158 2,159 0% 2,386 11% 2,496 5% 2,567 3% Residential Services 1,489 1,490 0% 1,652 11% 1,733 5% 1,808 4% Day Programs 561 561 0% 626 12% 655 5% 651 -1% Clinic 22 22 0% 22 0% 22 0% 22 0% Other 86 86 0% 86 0% 86 0% 86 0%
Mental Health 1,107 1,100 -1% 1,247 13% 1,381 11% 1,486 8% Adult Local Services 925 919 -1% 1,042 13% 1,154 11% 1,242 8% Children Local Services 182 181 -1% 205 13% 227 11% 244 7%
Alcohol and Substance Abuse 315 316 0% 335 6% 353 5% 369 5% Outpatient/Methadone 124 124 0% 128 3% 131 2% 134 2% Residential 131 131 0% 146 11% 161 10% 174 8% Prevention 38 38 0% 38 0% 38 0% 38 0% Crisis 13 13 0% 13 0% 13 0% 13 0% Program Support 9 10 11% 10 0% 10 0% 10 0%
CQCAPD 1 1 0% 1 0% 1 0% 1 0%
MENTAL HYGIENE
(millions of dollars)STATE OPERATING FUNDS SPENDING PROJECTIONS

MULTI-YEAR FINANCIAL PLAN PROJECTIONS
74
Local assistance spending in mental hygiene accounts for nearly half of total mental hygiene spending from State Operating Funds, and is projected to grow by an average rate of 5.4 percent annually. This growth is attributable to increases in the projected State share of Medicaid costs and projected expansion of the various mental hygiene service systems, including: increases primarily associated with the OPWDD NYS-CARES program; the New York/New York III Supportive Housing agreement and community beds that are currently under development in the OMH pipeline. Additional outyear spending is assumed in Financial Plan estimates for costs associated with efforts to move individuals in nursing homes and other settings to the least restrictive setting possible, as well as several chemical dependence treatment and prevention initiatives for individuals receiving services through OASAS. The plan also reflects costs of roughly $100 million annually for adjustments based on not-for-profit provider performance and actual costs. SOCIAL SERVICES OTDA local assistance programs provide cash benefits and supportive services to low-income families. The State’s three main programs include Family Assistance, Safety Net Assistance and SSI. The Family Assistance program, which is financed by the Federal government, provides time-limited cash assistance to eligible families. The Safety Net Assistance program, financed by the State and local districts, provides cash assistance for single adults, childless couples, and families that have exhausted their five-year limit on Family Assistance imposed by Federal law. The State SSI Supplementation program provides a supplement to the Federal SSI benefit for the elderly, visually handicapped, and disabled.
The average public assistance caseload is projected to total 553,029 recipients in FY 2013, a decrease of 2.2 percent from FY 2012 levels. Approximately 255,031 families are expected to receive benefits through the Family Assistance program, a decrease of 2.6 percent from the current year. In the Safety Net program, an average of 119,791 families are expected to be helped in FY 2013, a decrease of 2.9 percent. The caseload for single adults/childless couples supported through the Safety Net program is projected at 178,207, a decrease of 1.2 percent.
FY 2012 FY 2013 Annual % FY 2014 Annual % FY 2015 Annual % FY 2016 Annual %
Current Proposed Change Projected Change Projected Change Projected Change
Temporary and Disability Assistance 1,413 1,491 6% 1,537 3% 1,441 -6% 1,469 2%SSI 740 753 2% 766 2% 664 -13% 692 4%Public Assistance Benefits 485 616 27% 650 6% 656 1% 656 0%Welfare Initiatives 23 19 -17% 19 0% 19 0% 19 0%All Other 165 103 -38% 102 -1% 102 0% 102 0%
TEMPORARY AND DISABILITY ASSISTANCE
(millions of dollars)STATE OPERATING FUNDS SPENDING PROJECTIONS

MULTI-YEAR FINANCIAL PLAN PROJECTIONS
75
OCFS provides funding for foster care, adoption, child protective services, preventive services, delinquency prevention, and child care. OCFS oversees the State’s system of family support and child welfare services administered by local departments of social services and community-based organizations. Specifically, child welfare services, which are financed jointly by the Federal government, the State, and local districts, are structured to encourage local governments to invest in preventive services to reduce out-of-home placement of children. In addition, the Child Care Block Grant, which is also financed by a combination of Federal, State and local sources, supports child care subsidies for public assistance and low-income families. The youth facilities program serves youth directed by family or criminal courts to be placed in residential facilities.
OCFS spending reflects expected growth in claims-based programs and an increase in child care General Fund spending to offset a reduction in available TANF dollars. Growth in Child Welfare Services and Adult Protective/Domestic Violence reflects anticipated growth in local claims and flat Federal funding.
FY 2012 FY 2013 Annual % FY 2014 Annual % FY 2015 Annual % FY 2016 Annual %Current Proposed Change Projected Change Projected Change Projected Change
Children and Family Services 1,597 1,581 -1% 1,887 19% 1,990 5% 2,094 5%Child Welfare Service 421 330 -22% 463 40% 508 10% 556 9%
Foster Care Block Grant 436 436 0% 464 6% 492 6% 521 6%
Adoption 170 175 3% 182 4% 190 4% 199 5%
Day Care 145 242 67% 355 47% 354 0% 354 0%
Youth Programs 137 123 -10% 148 20% 155 5% 156 1%
Medicaid 111 113 2% 117 4% 122 4% 127 4%
Committees on Special Education 38 39 3% 42 8% 46 10% 51 11%
Adult Protective/Domestic Violence 33 34 3% 39 15% 44 13% 51 16%
All Other 106 89 -16% 77 -13% 79 3% 79 0%
CHILDREN AND FAMILY SERVICES
(millions of dollars)STATE OPERATING FUNDS SPENDING PROJECTIONS

MULTI-YEAR FINANCIAL PLAN PROJECTIONS
76
TRANSPORTATION In FY 2013, the DOT will provide $4.4 billion in local assistance to support statewide mass transit systems. This funding, financed through the collection of dedicated taxes and fees, is provided to mass transit operators throughout the State to support operating costs. The MTA, due to the size and scope of its transit system, receives the majority of the statewide mass transit operating aid. Additionally, the MTA receives operating support from the Mobility Tax and MTA Aid Trust Fund, authorized in May 2009 to collect regional taxes and fees imposed within the Metropolitan Commuter Transportation District. The State collects these taxes and fees on behalf of, and disburses the entire amount to, the MTA to support the transit system. Spending from this fund is projected to grow from 5 percent to 9 percent each year from FY 2013 to FY 2016. Legislation enacted in December 2011 eliminates the MTA payroll tax for all elementary and secondary schools as well as for certain small businesses. The Financial Plan assumes the State will compensate the MTA for the decrease in receipts from the tax reduction.
FY 2012 FY 2013 Annual % FY 2014 Annual % FY 2015 Annual % FY 2016 Annual % Current Proposed Change Projected Change Projected Change Projected Change
Transportation 4,257 4,398 3% 4,556 4% 4,650 2% 4,745 2%Mass Transit Operating Aid: 1,785 1,907 7% 1,907 0% 1,907 0% 1,907 0%
Metro Mass Transit Aid 1,646 1,762 7% 1,762 0% 1,762 0% 1,762 0%Public Transit Aid 87 93 7% 93 0% 93 0% 93 0%18-B General Fund Aid 27 27 0% 27 0% 27 0% 27 0%School Fare 25 25 0% 25 0% 25 0% 25 0%
Mobility Tax and MTA Aid Trust 1,752 1,762 1% 1,915 9% 2,008 5% 2,100 5%Dedicated Mass Transit 674 684 1% 689 1% 690 0% 693 0%AMTAP 45 45 0% 45 0% 45 0% 45 0%All Other 1 0 -100% 0 0% 0 0% 0 0%
TRANSPORTATION
(millions of dollars)STATE OPERATING FUNDS SPENDING PROJECTIONS

MULTI-YEAR FINANCIAL PLAN PROJECTIONS
77
LOCAL GOVERNMENT ASSISTANCE Direct aid to local governments primarily includes the AIM program, which was created in FY 2006 to consolidate various unrestricted local aid funding streams. Along with AIM, the State provides incentive grants to local governments. Other direct aid to local governments includes VLT impact aid, Small Government Assistance and Miscellaneous Financial Assistance.
ALL OTHER LOCAL ASSISTANCE SPENDING Other local assistance programs and activities include criminal justice, economic development, housing, parks and recreation and environmental quality. Spending in these areas is not expected to change materially over the Financial Plan period.
FY 2012 FY 2013 Annual % FY 2014 Annual % FY 2015 Annual % FY 2016 Annual %
Current Proposed Change Projected Change Projected Change Projected Change
Local Government Assistance 758 776 2% 786 1% 801 2% 803 0%AIM Big Four Cities 429 429 0% 429 0% 429 0% 429 0% Other Cities 218 218 0% 218 0% 218 0% 218 0% Towns and Villages 68 68 0% 68 0% 68 0% 68 0% Efficiency Incentives 6 26 333% 42 62% 58 38% 60 3%
All Other Local Aid 37 35 -5% 29 -17% 28 -3% 28 0%
LOCAL GOVERNMENT ASSISTANCE
(millions of dollars)STATE OPERATING FUNDS SPENDING PROJECTIONS

MULTI-YEAR FINANCIAL PLAN PROJECTIONS
78
AGENCY OPERATIOS
Agency operating costs include personal service, non-personal service, and GSCs. Personal service includes salaries of State employees of the Executive, Legislative, and Judicial branches, as well as overtime payments and costs for temporary employees. Non-personal service generally accounts for the cost of operating State agencies, including real estate rental, utilities, contractual payments (i.e., consultants, information technology, and professional business services), supplies and materials, equipment, telephone service and employee travel. GSCs account for the costs of fringe benefits (e.g., pensions, health insurance) provided to State employees and retirees of the Executive, Legislative and Judicial branches, and certain fixed costs paid by the State. In addition, certain agency operations of Transportation and Motor Vehicles are included in the capital projects fund type and not reflected in the State Operating Funds personal service or non-personal service totals.
Approximately 94 percent of the State workforce is unionized. The largest unions include
CSEA, which primarily represents office support staff and administrative personnel, machine operators, skilled trade workers, and therapeutic and custodial care staff; PEF, which primarily represents professional and technical personnel (e.g., attorneys, nurses, accountants, engineers, social workers, and institution teachers); UUP, which represents faculty and non-teaching professional staff within the State University system; and NYSCOPBA, which represents security personnel (correction officers, safety and security officers).
FY 2012 FY 2013 FY 2014 FY 2015Current Proposed Projected Projected
Negotiated Base Salary Increases 1
CSEA 0 0 0 2% PEF 0 0 0 2%
State Workforce 2 121,868 121,789 122,090 122,090
ERS Pension Contribution Rate3
Before Amortization 16.5% 19.4% 21.6% 23.1% After Amortization 10.5% 11.5% 12.5% 13.5% PFRS Pension Contribution Rate Before Amortization 22.3% 26.9% 29.2% 31.3% After Amortization 18.5% 19.5% 20.5% 21.5% Employee/Retiree Health Insurance Growth Rates 5.8% -1.4% 5.6% 8.2% PS/Fringe as % of Receipts (All Funds Basis) 14.4% 14.5% 14.5% 14.4%
1
2
3 As Percent of Salary.
FORECAST OF SELECTED PROGRAM MEASURES AFFECTING PERSONAL SERVICE AND FRINGE BENEFITS
Reflects current collective bargaining agreements with settled unions. Does not reflect potential impact of future negotiated workforce agreements.Subject to Direct Executive Control.
Forecast

MULTI-YEAR FINANCIAL PLAN PROJECTIONS
79
Selected assumptions used in preparing the spending projections for the State’s major programs and activities are summarized in the following table.
Growth in State Operations spending over the multi-year Financial Plan is concentrated in
agencies that operate large facilities, such as the State University, the mental hygiene agencies, and Corrections and Community Supervision. The main causes of growth include inflationary increases in operating costs expected for food, medical care and prescription drugs, and energy costs in State facilities, offset by expected savings from enterprise procurement efforts.
FY 2012 FY 2013 Annual $ FY 2014 Annual $ FY 2015 Annual $ FY 2016 Annual $Current Proposed Change Proposaed Change Proposaed Change Proposaed Change
Subject to Direct Executive Control 9,429 9,338 (91) 9,369 31 9,592 223 10,027 435Mental Hygiene 2,973 2,960 (13) 3,075 115 3,181 106 3,332 151
Corrections and Community Supervision 2,473 2,392 (81) 2,441 49 2,493 52 2,624 131
State Police 657 648 (9) 649 1 655 6 668 13
Public Health 552 559 7 604 45 626 22 631 5
Tax and Finance 385 393 8 395 2 406 11 413 7
Children and Family Services 304 330 26 322 (8) 309 (13) 306 (3)
Environmental Conservation 228 226 (2) 228 2 229 1 232 3
Financial Services 204 204 0 207 3 209 2 212 3
Temporary and Disability Assistance 161 207 46 210 3 221 11 219 (2)
Parks, Recreation and Historic Preservation 170 160 (10) 163 3 165 2 167 2
Workers' Compensation Board 158 153 (5) 150 (3) 153 3 156 3
Lottery 162 152 (10) 155 3 159 4 159 0
General Services 128 148 20 138 (10) 133 (5) 136 3
All Other 874 806 (68) 632 (174) 653 21 772 119
University System 5,304 5,418 114 5,576 158 5,744 168 5,914 170State University 5,167 5,298 131 5,455 157 5,621 166 5,789 168
City University 137 120 (17) 121 1 123 2 125 2
Independent Agencies 301 301 0 305 4 313 8 321 8Law 162 162 0 163 1 167 4 171 4
Audit & Control 139 139 0 142 3 146 4 150 4
Total, excluding Legislature and Judiciary 15,034 15,057 23 15,250 193 15,649 399 16,262 613
Judiciary 1,834 1,856 22 1,914 58 2,000 86 2,095 95
Legislature 219 219 0 221 2 224 3 227 3
Statewide Total 17,087 17,132 45 17,385 253 17,873 488 18,584 711 Personal Service 11,876 11,965 89 12,199 234 12,522 323 13,054 532
Non-Personal Service 5,211 5,167 (44) 5,186 19 5,351 165 5,530 179
STATE OPERATING FUNDS - AGENCY OPERATIONS(millions of dollars)

MULTI-YEAR FINANCIAL PLAN PROJECTIONS
80
GENERAL STATE CHARGES Fringe benefit payments, many of which are mandated by statute or collective bargaining
agreements, include employer contributions for pensions, Social Security, health insurance, workers’ compensation, unemployment insurance, and dental and vision benefits. The majority of employee fringe benefit costs are paid centrally from statewide appropriations. However, certain agencies including the Judiciary and SUNY, directly pay all or a portion of their employees’ fringe benefit costs from their respective budgets. Employee fringe benefits paid through GSCs are paid from the General Fund in the first instance and then partially reimbursed by revenue collected from fringe benefit assessments on Federal funds and other special revenue accounts. The largest General Fund reimbursement comes from the mental hygiene agencies.
GSCs also include certain fixed costs such as State taxes paid to local governments for
certain State-owned lands, and payments related to lawsuits against the State and its public officers.
GSCs are projected to increase at an average annual rate of 4.8 percent over the plan
period. The annual decrease in FY 2013 is driven by the impact of collective bargaining agreements, attritions and the prepayment of certain pension costs in FY 2012. Increases in future years are driven by projected growth in health insurance and pension costs, offset by revenue collected from fringe benefit assessments, particularly from the mental hygiene agencies.
FY 2012 FY 2013 Annual % FY 2014 Annual % FY 2015 Annual % FY 2016 Annual %Current Proposed Change Projected Change Projected Change Projected Change
General State Charges 6,536 6,388 -2% 6,917 8% 7,428 7% 7,880 6%
Fringe Benefits 6,180 6,035 -2% 6,562 9% 7,058 8% 7,511 6%Health Insurance 3,291 3,240 -2% 3,408 5% 3,667 8% 3,949 8%
Employee Health Insurance 2,057 2,025 -2% 2,130 5% 2,292 8% 2,468 8%Retiree Health Insurance 1,234 1,215 -2% 1,278 5% 1,375 8% 1,481 8%
Pensions 1,680 1,574 -6% 1,986 26% 2,230 12% 2,440 9%Social Security 915 931 2% 943 1% 969 3% 1,000 3%All Other Fringe 294 290 -1% 225 -22% 192 -15% 122 -36%
Fixed Costs 356 353 -1% 355 1% 370 4% 369 0%
GENERAL STATE CHARGES
(millions of dollars)STATE OPERATING FUNDS SPENDING PROJECTIONS

MULTI-YEAR FINANCIAL PLAN PROJECTIONS
81
TRANSFERS TO OTHER FUNDS (GENERAL FUND BASIS)
General Fund transfers help finance certain capital activities, the State’s share of Medicaid costs for State-operated mental hygiene facilities, debt service for bonds that do not have dedicated revenues, and a range of other activities.
A significant portion of the capital and operating expenses of DOT and DMV are funded from DHBTF. The Fund receives dedicated tax and fee revenue from the Petroleum Business Tax, the Motor Fuel Tax, the Auto Rental Tax, highway use taxes, transmission taxes and motor vehicle fees administered by DMV. The Financial Plan includes transfers from the General Fund that effectively subsidize the expenses of the DHBTF. The subsidy is required because the cumulative expenses of the fund – capital and operating expenses of DOT and DMV, debt service on DHBTF bonds and transfers for debt service on bonds that fund CHIPs and local transportation programs – exceed current and projected revenue deposits and bond proceeds.
FY 2012 FY 2013 FY 2014 FY 2015 FY 2016Current Proposed Projected Projected Projected
Transfers to Other Funds: 6,128 7,167 8,736 9,659 9,925
Medicaid State Share 2,912 2,903 2,697 2,551 2,451Debt Service 1,539 1,610 1,681 1,611 1,585
Capital Projects 790 1,079 1,278 1,403 1,298Dedicated Highway and Bridge Trust Fund 453 543 605 619 621All Other Capital 337 536 673 784 677
All Other Transfers 887 1,575 3,080 4,094 4,591Mental Hygiene 0 69 955 1,886 2,475Medicaid Payments for State Facility Patients 244 244 244 244 244 Judiciary Funds 113 115 116 117 118 SED GSPS 138 56 0 0 0SUNY - Operating Subsidy 0 390 976 995 1,015 SUNY - Hospital Operations 60 60 60 60 60 Banking Services 61 57 65 65 65 Financial Management System 36 50 55 55 55 Indigent Legal Services 40 40 40 40 40 Department of Transportation (MTA Tax) 25 279 332 334 334 Mass Transportation Operating Assistance 19 19 19 19 19 Alcoholic Beverage Control 17 17 19 20 20 DCJS - Crimes Against Revenues Account 16 16 16 16 16 Public Transportation Systems 12 12 12 12 12 Correctional Industries 10 10 10 10 10 OFT Centralized Tech Services 4 24 52 20 10
All Other 92 117 109 201 98
MULTI-YEAR DISBURSEMENT PROJECTIONS - GENERAL FUND TRANSFERS TO OTHER FUNDS(millions of dollars)

MULTI-YEAR FINANCIAL PLAN PROJECTIONS
82
Transfers to other funds are expected to total $7.2 billion in FY 2013, an annual increase of over $1.0 billion, or 17 percent. This increase is mainly due to higher costs related to capital projects, the SUNY operating subsidy, Mental Hygiene, and supplementation to MTA for the recent payroll tax reduction.
DEBT SERVICE The State pays debt service on all outstanding State-supported bonds. These include general obligation bonds, for which the State is constitutionally obligated to pay debt service, as well as bonds issued by State public authorities (i.e., ESDC, DASNY, and the TA, subject to an appropriation). Depending on the credit structure, debt service is financed by transfers from the General Fund, dedicated taxes and fees, and other resources, such as patient income revenues.
FY 2012 Current
FY 2013 Proposed
Annual Change
Percent Change
General Fund 1,539 1,610 71 4.6%Other State Support 4,333 4,539 206 4.8%State Operating Funds 5,872 6,149 277 4.7%Total All Funds 5,872 6,149 277 4.7%
DEBT SERVICE SPENDING PROJECTIONS(millions of dollars)
Total debt service is projected at $6.1 billion in FY 2013, of which $1.6 billion is paid from the General Fund through transfers, and $4.5 billion from other State funds. The General Fund transfer primarily finances debt service payments on general obligation and service contract bonds. Debt service is paid directly from other State funds for the State’s revenue bonds, including PIT bonds, DHBTF bonds, and mental health facilities bonds. Executive Budget projections for debt service spending have been revised to reflect the pre-payment of $140 million of SUNY debt service in March 2012. Otherwise, FY 2013 debt service estimates are relatively unchanged compared to prior estimates, with minor revisions for PIT, Mental Health, DHBTF, and other bonding programs.

YEAR-TO-DATE OPERATING RESULTS


85
YEAR-TO-DATE OPERATING RESULTS Through the first nine months of FY 2012, General Fund receipts, including transfers from other funds, totaled $39.2 billion, or $11 million above the forecast in the Mid-Year Update. General Fund disbursements, including transfers to other funds, totaled $38.3 billion through December 2011, or $342 million below the Mid-Year forecast. The favorable results were due in part to the timing of certain payments and lower spending across a number of programs. This information has been reflected in the revised annual disbursement estimates.
Enacted Budget
Mid-Year Update
ActualResults
Enacted Budget
Mid-Year Update
Opening Balance 1,376 1,376 1,376 0 0
Receipts 39,093 39,227 39,238 145 11 Personal Income Tax1 23,039 23,338 23,163 124 (175) User Taxes and Fees1 8,853 8,794 8,849 (4) 55 Business Taxes 3,900 3,777 3,723 (177) (54) Other Taxes1 1,087 1,171 1,194 107 23 Non-Tax Revenue 2,214 2,147 2,309 95 162
Disbursements 38,563 38,641 38,299 264 342 Education 11,047 10,843 10,644 403 199 Health Care 8,727 8,835 8,878 (151) (43) Social Services 2,315 2,085 2,044 271 41 All Other Local 4,063 4,346 4,266 (203) 80 Personal Service 4,357 4,580 4,633 (276) (53) Non-Personal Service 1,323 1,186 1,194 129 (8)General State Charges 2,595 2,675 2,506 89 169 Transfers To Other Funds 4,136 4,091 4,134 2 (43)
Change in Operations 530 586 939 409 353
Closing Balance 1,906 1,962 2,315 409 353
1 Includes transfers from other funds after debt service.
GENERAL FUND OPERATING RESULTS THROUGH DECEMBER 2011(millions of dollars)
Projections Favorable/ (Unfavorable) vs.

YEAR-TO-DATE OPERATING RESULTS
86
RECEIPTS VARIANCE FROM MID-YEAR PLAN Through the first nine months of FY 2012, General Fund receipts, including transfers from other funds, totaled $39.2 billion, or $11 million above the forecast in the Mid-Year Update. Total taxes, including transfers from other funds after debt service, were $151 million lower than projected, mainly due to lower collections in personal income taxes and business taxes, reflecting slower than expected wage and non-wage income growth and continued weakness in the general business, insurance, and telecommunication sectors. These lower receipts were partially offset by higher than expected collections from user taxes and other tax revenue. Non-tax receipts (including miscellaneous receipts) exceeded estimates, primarily attributable to earlier than expected abandoned property receipts. DISBURSEMENTS VARIANCE FROM MID-YEAR PLAN Disbursements through December 2011 fell below projections, consistent with the pattern observed in prior months. While the variance for some programs appears to be due to the timing of payments, a review of overall spending patterns indicates that the annual disbursements estimate for the current year should be reduced from the Mid-Year estimate. (See “Financial Plan Overview -- Current Fiscal Year (FY 2012)” herein.) Disbursements for education and Medicaid, the two largest components of the General Fund, generally appear to be in line with annual estimates. The variances to date reflect routine differences in the timing of payments and the application of resources from other funds. Lower than expected spending to date in other local assistance programs, including public health and mental health, is expected to translate into reduced annual disbursements. Disbursements for State Operations through December 2011 exceeded planned levels. This appears to be primarily due to the processing of certain accounting transactions by several State agencies. The annual estimate for State Operations has been increased modestly due to overall trends in non-personal spending and the APSU labor settlement. Lower spending in GSCs reflects the impact of overall attrition rates, and lower disbursements for health insurance premiums and other costs. The annual estimate for GSCs, excluding the impact of a planned excess pension payment, has been lowered to reflect updated trends.

YEAR-TO-DATE OPERATING RESULTS
87
GENERAL FUND ANNUAL CHANGE
$ %
Opening Balance 2,302 1,376 (926)
Receipts 38,221 39,238 1,017 2.7%2010 STAR Deferral 2,405 - (2,405) -100.0%Personal Income Tax1 20,354 23,163 2,809 13.8%User Taxes and Fees1 8,536 8,849 313 3.7%Business Taxes 3,430 3,723 293 8.5%Other Taxes1 1,150 1,194 44 3.8%Non-Tax Revenue 2,346 2,309 (37) -1.6%
Disbursements 37,515 38,299 784 2.1%2010 School Aid Deferral 2,060 0 (2,060) -100.0%Education 10,665 10,644 (21) -0.2%Health Care 6,064 8,878 2,814 46.4%Social Services 2,081 2,044 (37) -1.8%All Other Local 4,093 4,266 173 4.2%Personal Service 4,814 4,633 (181) -3.8%Non-Personal Service 1,299 1,194 (105) -8.1%General State Charges 2,297 2,506 209 9.1%Transfers To Other Funds 4,142 4,134 (8) -0.2%
Change in Operations 706 939 233
Closing Balance 3,008 2,315 (693) 1 Includes transfers from other funds after debt service.
Increase/(Decrease)FY 2012 Results
FY 2011 Results
GENERAL FUND OPERATING RESULTS YEAR OVER YEARAPRIL THROUGH DECEMBER
(millions of dollars)
The comparison of results on a year-over-year basis is affected by a number of cash management actions taken by the State in FY 2010 and FY 2011 to preserve liquidity and manage expenses. The most significant actions that affect the comparison of results include:
Cash management actions taken in FY 2010, which deferred $2.1 billion in payments from the final quarter of FY 2010 until the end of the first quarter of FY 2011. This had the effect of increasing the opening cash balance in FY 2011 and total spending for the fiscal year.
Cash management actions taken in December 2010 (FY 2011) to defer certain deposits
and payments by one month into January 2011 (the largest of which was the STAR deposit). No similar actions were needed in December 2011.
Excluding these cash management factors, receipts through December 2011 were approximately $3.4 billion higher than the same period in FY 2010. This was primarily due to growth in PIT receipts driven by a strong April 2011 PIT settlement; continued corporate profits from certain deferred tax credit claims that have aided the corporate franchise tax; and increased consumer spending, reflecting improved economic conditions.

YEAR-TO-DATE OPERATING RESULTS
88
Through December 2011, spending was $784 million (2.1 percent) higher than the same period last year. Excluding the deferral of the FY 2010 school aid payment, spending through December 2011 was $2.8 billion above last year’s level. The increase in local assistance is mainly due to Medicaid, reflecting expiration of the temporary enhanced Federal share of Medicaid costs that has added approximately $2 billion year-over-year to the State share through December 2011 and the payment of an extra Medicaid cycle in FY 2012 instead of FY 2011 ($322 million), which was approved as part of the FY 2010 Enacted Budget. In addition, other local assistance programs with significant changes include: the timing of SUNY Community College Operating Aid payments ($147 million), a result of the timing of administrative payment to campuses during December 2010; higher TAP awards ($106 million), as enrollment figures continue to trend higher than in previous years; and spending for local assistance programs designated for certain economic development initiatives ($61 million). These increases in local assistance were partially offset by declining payments to not-for-profit mental hygiene service providers, primarily reflecting the impact of shifting the spending source for certain programs from the General Fund to other State funds in recent years; and lower year-to-year spending for other local programs. Spending for agency operations has continued to decline, consistent with Financial Plan expectations. The decline in Personal Service ($181 million) reflects the impact of increased attrition, strict hiring controls, and the other savings. The decline in Non-Personal Service reflects the continuing impact of statewide spending controls and agency redesign efforts. Increased year-over-year spending for GSCs ($209 million) reflects higher health insurance payments in FY 2012.

YEAR-TO-DATE OPERATING RESULTS
89
STATE OPERATING FUNDS
Enacted Budget
Mid-Year Update
ActualResults
Enacted Budget
Mid-Year Update
Opening Balance 3,970 3,970 3,969 (1) (1)
Receipts 58,150 59,099 58,766 616 (333) Taxes 44,950 45,121 44,885 (65) (236) Miscellaneous/Federal Receipts 13,200 13,978 13,881 681 (97)
Disbursements 61,190 61,922 61,390 (200) 532 Education 13,630 13,426 13,227 403 199 Health Care 13,000 13,242 13,274 (274) (32) Social Services 2,326 2,094 2,055 271 39 All Other Local 12,136 12,681 12,499 (363) 182 Personal Service 8,795 9,014 9,025 (230) (11) Non-Personal Service 3,653 3,767 3,762 (109) 5 General State Charges 3,923 3,989 3,852 71 137 Debt Service 3,727 3,706 3,691 36 15 Capital Projects 0 3 5 (5) (2)
Other Financing Sources 3,598 3,596 3,564 (34) (32)
Change in Operations 558 773 940 382 167
Closing Balance 4,528 4,743 4,909 381 166
STATE OPERATING FUNDS RESULTS APRIL - DECEMBER 2011(millions of dollars)
Projections Favorable/ (Unfavorable) vs.
State Operating Funds results for receipts and disbursements are generally consistent with the General Fund variances described earlier. In addition to General Fund receipts variances, Miscellaneous receipts collections in other State funds were approximately $260 million below Financial Plan projections, reflecting lower receipts from tuition income ($81 million), youth facilities ($55 million), HCRA ($51 million), worker’s compensation ($35 million) and other sources. Additional spending variances are due to the timing of payments and are not expected to affect annual results. These include payments related to the STAR program ($87 million), operating aid for transit services provided by the MTA ($60 million) and regulatory support of the insurance industry ($27 million).

YEAR-TO-DATE OPERATING RESULTS
90
$ %
Opening Balance 4,810 3,969 (841)
Receipts 54,869 58,766 3,897 7.1%Taxes 41,245 44,885 3,640 8.8%Miscellaneous/Federal Receipts 13,624 13,881 257 1.9%
Disbursements 57,255 61,390 4,135 7.2%2010 School Aid Deferral 2,060 0 (2,060) -100.0%2010 STAR Deferral (2,405) 0 2,405 N/AEducation 13,267 13,227 (40) -0.3%Health Care 10,343 13,274 2,931 28.3%Social Services 2,089 2,055 (34) -1.6%All Other Local 11,931 12,499 568 4.8%Personal Service 9,312 9,025 (287) -3.1%Non-Personal Service 3,469 3,762 293 8.4%General State Charges 3,630 3,852 222 6.1%Debt Service 3,542 3,691 149 4.2%Capital Projects 17 5 (12) -70.6%
Other Financing Sources 3,866 3,564 (302)
Change in Operations 1,480 940 (540)
Closing Balance 6,290 4,909 (1,381)
FY 2011 Results
FY 2012 Results
Increase/(Decrease)
APRIL - DECEMBER STATE OPERATING FUNDS RESULTS YEAR OVER YEAR(millions of dollars)
The annual results for State Operating Funds tax receipts and spending, in addition to the General Fund annual changes, are mainly due to higher local assistance spending for the STAR program ($2.4 billion) due to the cash management actions described above, as authorized in statute, and mental hygiene programs ($255 million), reflecting timing associated with quarterly payments to not-for-profit service providers. Agency Operations in other State funds has remained relatively flat year-over-year, reflecting the net impact of declining Personal Service costs, primarily in the mental hygiene and environmental agencies, and growth in year-over-year Non-Personal Service costs, which primarily reflects increased contractual services associated with expansions to SUNY-operated hospitals and campuses.

YEAR-TO-DATE OPERATING RESULTS
91
ALL GOVERNMENTAL FUNDS
Enacted Budget
Mid-Year Update
ActualResults
Enacted Budget
Mid-Year Update
Opening Balance 3,811 3,811 3,812 1 1
Receipts 94,896 95,526 96,322 1,426 796Taxes 45,978 46,123 45,892 (86) (231) Miscellaneous Receipts 16,014 16,937 16,594 580 (343) Federal Grants 32,904 32,466 33,836 932 1,370
Disbursements 94,503 95,254 96,444 (1,941) (1,190) State Operating Funds 61,190 61,922 61,390 (200) 532 Capital Projects Funds 5,418 5,598 5,757 (339) (159) Federal Operating Funds 27,895 27,734 29,297 (1,402) (1,563)
Other Financing Sources 322 114 322 - 208
Change in Operations 715 386 200 (515) (186)
Closing Balance 4,526 4,197 4,012 (514) (185)
All GOVERNMENTAL FUNDS RESULTS THROUGH DECEMBER 2011(millions of dollars)
Projections Favorable/ (Unfavorable) vs.
Medicaid spending in Federal Operating Funds was significantly above projections (approximately $779 million), reflecting the timing of certain payments, including DSH and UPL payments and retroactive adjustments, which were originally expected in the prior year. Also contributing to the variance in Federal Operating Funds was higher than projected spending for Social Services ($577 million), reflecting an increase in payments for Foster Care due to higher than anticipated receipts of Federal grants and timing of payments. Higher than projected receipts of Federal grants mirrors the increase in Federal Medicaid and Social Services spending.
$ %
Opening Balance 4,860 3,812 (1,048)
Receipts 96,161 96,322 161 0.2%Taxes 42,247 45,892 3,645 8.6%Miscellaneous Receipts 16,449 16,594 145 0.9%Federal Grants 37,465 33,836 (3,629) -9.7%
Disbursements 95,605 96,444 839 0.9%State Operating Funds 57,255 61,390 4,135 7.2%Capital Projects Funds 5,632 5,757 125 2.2%Federal Operating Funds 32,718 29,297 (3,421) -10.5%
Other Financing Sources (57) 322 379
Change in Operations 499 200 (299)
Closing Balance 5,359 4,012 (1,347)
FY 2012 Results
Increase/(Decrease)
APRIL - DECEMBER All GOVERNMENTAL FUNDS RESULTS YEAR OVER YEAR(millions of dollars)
FY 2011 Results


GAAP-BASIS FINANCIAL PLANS/ OTHER POST-EMPLOYMENT BENEFITS


95
GAAP-BASIS FINANCIAL PLAN/ OTHER POST-EMPLOYMENT BENEFITS
GAAP-BASIS FINANCIAL PLAN The State Budget is required to be balanced on a cash basis, which is DOB’s primary focus in preparing and implementing the State Financial Plan. State Finance Law also requires the Financial Plan be presented for informational purposes on a GAAP basis. The GAAP-basis plans model, to the extent practicable, the accounting principles applied by OSC in preparation of the annual Financial Statements. Tables comparing the cash-basis and GAAP-basis General Fund Financial Plans are provided at the end of this Financial Plan. In FY 2012, the General Fund GAAP Financial Plan shows total revenues of $48.1 billion, total expenditures of $58.4 billion, and net other financing sources of $9.3 billion, resulting in an operating deficit of $960 million. In FY 2013, the General Fund GAAP Financial Plan shows total revenues of $50.2 billion, total expenditures of $59.8 billion, and net other financing sources of $9.3 billion, resulting in an operating deficit of $215 million. These results reflect the net impact of the Executive Budget gap-closing actions. DOB’s detailed GAAP Financial Plans for FY 2012 through FY 2016 are provided in the Financial Plan Tables. OTHER POST-EMPLOYMENT BENEFITS Substantially all of the State’s employees become eligible for post retirement benefits if they reach retirement while working for the State. In accordance with GASB 45, the State must perform an actuarial valuation every two years for purposes of calculating OPEB liabilities. As disclosed in note 13 of the State’s Basic Financial Statements for FY 2011, the ARC represents the annual level of funding that, if set-aside on an ongoing basis, is projected to cover normal costs each year and amortize any unfunded liabilities of the plan over a period not to exceed thirty years. Amounts required but not actually set aside to pay for these benefits are accumulated with interest as part of the net OPEB obligation, after adjusting for amounts previously required. As reported in the State’s Basic Financial Statements for FY 2011, an actuarial valuation of OPEB liabilities was performed as of April 1, 2008 with results projected to April 1, 2009 for the fiscal year ended March 31, 2011. The valuation calculated the present value of the actuarial accrued total liability for benefits as of March 31, 2011 at $55.9 billion ($46.3 billion for the State and $9.6 billion for SUNY), determined using the Frozen Entry Age actuarial cost method, and is amortized over an open period of 30 years using the level percentage of projected payroll amortization method. The net OPEB liability for FY 2011 totaled $3.3 billion ($2.7 billion for the State and $0.6 billion for SUNY) under the Frozen Entry Age actuarial cost method, allocating costs on a level basis over earnings. This was $2.1 billion ($1.7 billion for the State and $0.4 billion for SUNY)

GAAP BASIS FINANCIAL PLAN/OTHER POST-EMPLOYMENT BENEFITS
above the payments for retiree costs made by the State in FY 2011. This difference between the State’s PAYGO costs and the actuarially determined required annual contribution under GASB 45 reduced the State’s currently positive net asset condition at the end of FY 2011 by $2.1 billion. The State’s actuarial consultant has provided an updated calculation of the ARC and annual OPEB costs. The updated calculation will ultimately be reflected in the financial statements for the State and SUNY for FY 2012. The updated calculation shows the present value of the actuarial accrued total liability for benefits at $60.2 billion ($50.1 billion for the State and $10.1 billion for SUNY). GASB does not require the additional costs to be funded on the State’s budgetary basis, and no funding is assumed for this purpose in the Financial Plan. On a budgetary (cash) basis, the State continues to finance these costs, along with all other employee health care expenses, on a PAYGO basis. As noted, there is no provision in the current Financial Plan to pre-fund the GASB 45 liability. If such liability were pre-funded at this time, the additional cost above the PAYGO amounts would be lowered. The State’s Health Insurance Council, which consists of GOER, Civil Service, and DOB, will continue to review this matter and seek input from the State Comptroller, the legislative fiscal committees and other outside parties. However, it is not expected that the State will alter its planned funding practices in light of existing fiscal conditions.
FISCAL IMPACT ON LOCAL GOVERNMENTS


99
FISCAL IMPACT ON LOCAL GOVERNMENTS FISCAL IMPACT ON LOCAL GOVERNMENTS This section presents the estimated fiscal impact of changes proposed in the FY 2013 Executive Budget on New York’s municipalities as required by State Finance Law. To supplement the narrative below, charts detailing the local government impact are provided in the “Financial Plan Tables” section of this report. MAJOR ACTIONS AFFECTING LOCAL GOVERNMENTS
State Takeover of Local Medicaid Expenses. The Executive Budget proposes to reduce growth in the local share of Medicaid payments by one percentage point per year for counties and New York City, effective April 1, 2013. The Budget also begins a phased-takeover of local government administration of the Medicaid program. The takeover of the 3 percent Medicaid growth factor will save counties and New York City $1.2 billion over five State fiscal years.
Tier VI Pension Reform. The Executive Budget advances a new Tier VI pension proposal for new public employees designed to save local governments nearly $79 billion over 30 years. Changes include increasing employee contributions, raising the retirement age, decreasing the pension multiplier, excluding overtime and other payments from the formula used to calculate final average salary for pension allowances, and by making a defined contribution option available to employees.
Reform Early Intervention Program. The EI program provides a comprehensive array of therapeutic and support services to children under the age of three with confirmed disabilities (i.e., autism, cerebral palsy) or developmental delays. The Executive Budget recommends a series of program modifications to reduce costs and relieve administrative burdens on localities. In addition, with the enactment of these program modifications, the State will reinvest its savings to reduce local reimbursement payment lags, beginning in FY 2015. In total, these initiatives will generate cumulative local savings totaling $99 million over five years.
Reforms to Preschool Special Education. The State’s investment in Preschool Special Education has doubled over the past ten-years to a projected State cost of nearly $1.1 billion for the upcoming school year. The Executive Budget proposes several changes to both rationalize the existing Preschool Special Education financing system and limit the ability of some providers to reap excessive financial benefits. These proposals include: equally assigning any county growth (excluding New York City) above FY 2012 school year costs to the State, the county, and school districts and eliminating potential conflicts of interest inherent in the current evaluation system. For counties outside of New York City, these reforms will result in $20 million in cumulative reduced liabilities for the 2013 local fiscal year.

FISCAL IMPACT ON LOCAL GOVERNMENTS
100
LOCAL YEAR 2013 FISCAL SUMMARY Executive Budget actions, in total, will result in a positive local impact of $942 million for local fiscal years ending in 2013 — the first full-annual local fiscal year affected by the FY 2013 Executive Budget. The fiscal summary of the impact on local governments for local FY 2013 is as follows:
School Districts: School districts outside of New York City will realize a $351 million positive impact in the FY 2013 school year driven mostly by a $331 million increase in school aid (exclusive of the competitive performance grants), offset by $5 million in costs from reforms to Preschool Special Education. School districts will also experience $25 million in savings from the creation of a new Pension Tier VI.
New York City: A $243 million positive impact is estimated for New York City due
primarily to $224 million in additional aid for New York City schools (exclusive of the competitive performance grants), and $11 million from the takeover of the Medicaid growth factor. Other actions include $8 million in increased transit assistance for NYCDOT and Staten Island Ferry and $2 million in savings from EI program reforms. These savings will be partially offset by a $2 million net decrease for human services programs.
Counties: County governments will realize an estimated $62 million net positive impact
in 2013, primarily due to $20 million in savings from Preschool Special Education reforms, $14 million from the takeover of the Medicaid growth factor, and $12 million in savings from the creation of a new Pension Tier VI. In addition, counties will realize $10 million in increased assistance for downstate county transit systems, a $4 million net increase for human service programs, and $2 million in savings from EI program reforms.
Other Municipalities: Other cities, towns and villages will experience a $36 million
positive impact in local fiscal years ending in 2013 attributed to an acceleration of AIM of up to $28 million for the City of Rochester and $8 million in savings from the creation of a new Pension Tier VI.
MANDATE RELIEF As part of the more than $125 million in mandate relief that Governor Cuomo signed into law in June, a newly created Mandate Relief Council goes into effect this month. The Council will be chaired by the Secretary to the Governor and has both Executive and Legislative representatives serving on it. It is charged with reviewing and referring statutory and regulatory mandates to the Legislature and to Executive agencies for modification or repeal. In addition to reviewing mandates submitted by members of the Council, local governments and school districts are empowered to request that the Council review a particular mandate.

GLOSSARY OF ACRONYMS


103
GLOSSARY OF ACRONYMS
(AIM) .......................................................................... Aid and Incentive for Municipalities (APSU) .................................................................................... Agency Police Services Unit (ARC) .................................................................................... Annual Required Contribution (ARRA) ................................................ American Recovery and Reinvestment Act of 2009 (BCA) ..................................................................................................... Budget Control Act (CHIPs) ...................................................... Consolidated Highway Improvement Programs (CHP) ........................................................................................................ Child Health Plus (CMS) ............................................................ Centers for Medicare and Medicaid Services (COLA) ...................................................................................... Cost-of-Living Adjustment (CPI) ................................................................................................... Consumer Price Index (CQCAPD) ............................................ Commission on Quality of Care and Advocacy for Persons with Disabilities (CSEA) ....................................................................... Civil Service Employees Association (CUNY)................................................................................... City University of New York (DASNY) .................................................... Dormitory Authority of the State of New York (DDPC) ......................................................... Developmental Disabilities Planning Council (DHBTF) .......................................................... Dedicated Highway and Bridge Trust Fund (DMV).................................................................................. Department of Motor Vehicles (DOB) ............................................................................................... Division of the Budget (DOCCS)...................................... Department of Corrections and Community Supervision (DOH) ................................................................................................. Department of Health (DOT) ..................................................................................... Department of Transportation (DSH) ................................................................................. Disproportionate Share Hospital (EI) .......................................................................................................... Early Intervention (EITC) ......................................................................................... Earned Income Tax Credit (EPIC) ............................................................. Elderly Pharmaceutical Insurance Coverage (ERI) .......................................................................................... Early Retirement Incentive (ERS)................................................................................... Employees' Retirement System (ESDC) ................................................................... Empire State Development Corporation (EXCEL) .............................................. Expanding Our Children’s Education and Learning (FHP)....................................................................................................... Family Health Plus (FMAP) ................................................................... Federal Medical Assistance Percentage (F-SHRP) ............................................................. Federal-State Health Reform Partnership (FTE) ................................................................................................... Full-Time Equivalent (FY) ..................................................................................................................... Fiscal Year (GAAP) ............................................................. Generally Accepted Accounting Principles (GASB) ........................................................... Governmental Accounting Standards Board (GASB 45) ................................ Governmental Accounting Standards Board Statement 45 (GDP) ............................................................................................. Gross Domestic Product (GOER) ............................................................... Governor's Office of Employee Relations (GPHW) ................................................................................. General Public Health Works (GSCs)................................................................................................ General State Charges (HCRA) .......................................................................................... Health Care Reform Act

GLOSSARY OF ACRONYMS
104
(HEAL NY) ..................... Health Care Efficiency and Affordability Law for New Yorkers (HESC) ................................................................... Higher Education Services Corporation (LGAC) .......................................................... Local Governmental Assistance Corporation (MCFFA) ........................................................... Medical Care Facilities Financing Agency (MTA) ...................................................................... Metropolitan Transportation Authority (NYS-CARES) .................................. New York State Creating Alternatives in Residential Environments and Services (NYSCOPBA).................................................... New York State Correctional Officers and Police Benevolent Association (NYHELPS) .................................................... New York Higher Education Loan Program (OASAS) ............................................ Office of Alcoholism and Substance Abuse Services (OCA) ................................................................................ Office of Court Administrations (OCFS) ................................................................... Office of Children and Family Services (OFT) ................................................................................................. Office for Technology (OGS) .......................................................................................... Office of General Services (OMH)............................................................................................. Office of Mental Health (OPEB) ............................................................................. Other Post-Employment Benefits (OPWDD) ............................................. Office for People with Developmental Disabilities (OSC) ...................................................................................Office of the State Comptroller (OTDA) ....................................................... Office of Temporary and Disability Assistance (PAYGO) ....................................................................................................... Pay-as-you-go (PBT)............................................................................................... Petroleum Business Tax (PEF) ...................................................................................... Public Employees Federation (PFRS)............................................................................ Police and Fire Retirement System (PIT) ..................................................................................................... Personal Income Tax (RBTF) .......................................................................................... Revenue Bond Tax Fund (SAGE) ................................................ Spending and Government Efficiency Commission (SED) ....................................................................................... State Education Department (SOFA) ....................................................................... New York State Office for the Aging (SSI) ..................................................................................... Supplemental Security Income (STAR) ..................................................................................................... School Tax Relief (STIP) ....................................................................................... Short-Term Investment Pool (SUNY) .................................................................................. State University of New York (SY) .................................................................................................................... School Year (TA)......................................................................................................... Thruway Authority (TANF) .............................................................. Temporary Assistance for Needy Families (TAP) ........................................................................................ Tuition Assistance Program (UPL) ................................................................................................. Ultra Petroleum Corp. (UUP) .................................................................................... United University Professions (VLT) .............................................................................................. Video Lottery Terminal

FINANCIAL PLAN TABLES AND ACCOMPANYING NOTES

107
FINANCIAL PLAN TABLES AND ACCOMPANYING NOTES
The notes to the Financial Plan tables herein should be read in conjunction with the tables that follow. NOTE 1 — BASIS OF ACCOUNTING Pursuant to law, all Financial Plan tables presented herein are prepared on the cash basis of accounting, unless otherwise noted. Under the cash basis of accounting, revenues are recognized when received, and spending is recorded when cash is disbursed. NOTE 2 — FUND TYPES AND PERSPECTIVES The State records its transactions in the following fund types: Governmental Funds General Fund - This is the major operating fund of the State. It receives all State income not earmarked for a particular program or activity and not specified by law to be deposited in another fund. State income for Financial Plan purposes consists of moneys (taxes, fees, and miscellaneous receipts including certain repayments of State advances) deposited to the credit of the General Fund during the fiscal year and transfers from other funds from current revenues. Special Revenue - These funds account for State receipts from specific revenue sources and are legally restricted to disbursement for specified purposes. This governmental fund type is divided into two classifications: (1) State Special Revenue Funds and (2) Federal Special Revenue Funds. An example of a State Special Revenue Fund is the Conservation Fund which finances a number of State environmental programs. An example of a Federal Special Revenue Fund is the Health and Human Services Fund. Although any earmarked revenue fund is treated as a Special Revenue Fund for cash-basis budgeting and reporting purposes, some are combined with the General Fund for purposes of reporting on the basis of GAAP. Debt Service - All tax-financed State debt service on long-term debt and payments on certain lease-purchase or other contractual obligations are paid from Debt Service funds. These account for the accumulation of money for, and the payment of principal and interest on, general long-term debt. Lease-purchase payments for State University, Health and Mental Hygiene facilities under contractual agreements with public authorities are also paid from funds classified as Debt Service funds. Debt service on highway bonds supported by dedicated highway revenues is also reflected in this fund type. Sources of revenue for this fund type include transfers from the General Fund, dedicated taxes, and other revenues.

FINANCIAL PLAN TABLES AND ACCOMPANYING NOTES
108
Capital Projects - These funds finance a variety of capital construction costs including: (1) planning, land acquisition, design, construction, construction management and supervision, and equipment costs; (2) highway, parkway and rail preservation projects; outdoor recreation and environmental conservation projects, and buildings and other capital facilities required by various State departments and agencies; (3) payments to local governments to help finance their capital programs, including highway, parkway, bridge, mass transportation, aviation, economic development, port development, community college, community and State mental health, outdoor recreation, State-assisted housing, and environmental quality; and (4) advances for capital construction costs reimbursable by public authorities, instrumentalities of the State, the Federal government or local governments. Sources of revenue for this fund type include transfers from other State funds including the General Fund, dedicated taxes and other revenues, reimbursement of advances, bond proceeds, and Federal capital grants. State Operating Funds The State Funds operating budget comprises the General Fund and other State-supported activities financed by dedicated revenues in State Special Revenue funds, as well as Debt Service funds accounting for the payment of debt service on all tax-financed State long-term debt. All capital spending, regardless of financing source, is included in the Capital budget. Proprietary Funds Internal Service Funds - Account for the financing of goods or services supplied by one State agency to other State agencies or governmental units on a cost-reimbursement basis. Enterprise Funds - Account for operations that are similar to private business enterprises. The Internal Service funds and Enterprise funds are treated as Proprietary funds for cash-basis budgeting and reporting purposes, and are combined with the General Fund for purposes of reporting on a GAAP basis. Fiduciary Funds Private-Purpose Trust Funds - Accounts for all trust arrangements under which principal and income benefit individuals, private organizations, or other governments. Pension Trust Fund - Accounts for the cash-basis results of operations for the administrative portion of the State’s Common Retirement Fund. It does not reflect investment activity, balances, or other assets available to this Fund. In addition, pension contributions and payments to retirees are excluded since these payments are not required to be appropriated. Agency Funds - Accounts for funds held by the State in a purely custodial capacity. Cash is held temporarily until disbursements are made to individuals, private organizations, or other governments.

FINANCIAL PLAN TABLES AND ACCOMPANYING NOTES
109
NOTE 3 — DISBURSEMENT DESCRIPTIONS The State’s Financial Plan and reporting includes only those payments made pursuant to an appropriation and paid from funds available in the State Treasury. All State spending is classified in one of the following categories: Local Assistance Grants - Include payments to counties, cities, towns, villages, school districts and other local entities, as well as certain financial assistance to, or on behalf of, individuals and nonprofit organizations. Personal Service - Includes the payment of salaries and compensation for State employees. Non-Personal Service - Includes payments for miscellaneous contractual obligations, supplies and materials, travel, rentals and repairs, utilities, postage and shipping, printing, telephone, and other operating costs. General State Charges - Include costs mandated by statute, collective bargaining agreements or court order. Charges in this category can be further subdivided into the following: Fringe Benefits: Contributions to pension systems, the employer’s share of Social Security contributions, employer contributions toward the cost of health insurance, workers compensation and unemployment insurance, and contributions to union employee benefit funds which provide vision care and other services. Fixed Costs: For State payments in lieu of taxes, as well as payments for local assessments on State-owned land, judgments against the State pursuant to the Court of Claims Act, defense(s) by private counsel or alternatively payments on behalf of State officers and employees in civil judicial proceedings. Debt Service - Include payments made for tax-financed State debt service on long-term debt; contractual-obligation and lease-purchase arrangements with several public authorities and municipalities; and lease-purchase payments for State University, Health, and Mental Hygiene facilities. Capital Projects - Include payments made for the acquisition or construction of the State’s capital facilities. Included in this category are planning, land acquisition, design, construction, engineering services, and equipment costs attributable to highway, parkway and rail preservation projects; outdoor recreation and environmental conservation projects; payments to local government units and public authorities to help finance highways, parkways, bridges, mass transportation, aviation, economic development, port development, community colleges, community and State mental hygiene buildings, outdoor recreational parks, correctional and State-assisted housing as well as environmental quality projects. Advances are made for capital construction costs reimbursable by public authorities, the Federal or local governments, or from the proceeds of State bond and note sales.

FINANCIAL PLAN TABLES AND ACCOMPANYING NOTES
110
Bond Proceeds - Includes the proceeds of general obligation bonds and short-term notes issued in the form of commercial paper or Bond Anticipation Notes (BANs) and are stated net of notes redeemed from the proceeds of permanent bonds or reissued notes. Operating Transfers - Constitutes legally authorized transfers from a fund receiving revenues, to a fund through which disbursements will ultimately be made. NOTE 4 — RESERVATIONS OF GENERAL FUND BALANCE Fund balance may be legally segregated for specific future use or set aside informally for specified purposes. The following terms are used in the reporting of reservations of General Fund Balance: Tax Stabilization Reserve Fund - Created pursuant to law in order to provide a reserve to finance a cash-basis operating deficit in the General Fund at the end of the fiscal year, and to make temporary loans to the General Fund during the year. Annual deposits may not exceed 0.2 percent of General Fund spending and the balance may not exceed 2.0 percent of General Fund spending. These amounts may be borrowed by the General Fund temporarily and repaid within the same fiscal year. They may also be borrowed to cover an operating deficit at year end, but these loans must be repaid within six years in no less than three annual installments. Rainy Day Reserve Fund - Created pursuant to law, to account for funds set aside for use during economic downturns or in response to a catastrophic event, as defined in the law. The economic downturn clause is triggered after five consecutive months of decline in the State's composite index of business cycle indicators. The reserve may have a maximum balance equal to three percent of projected General Fund spending during the fiscal year immediately following the then-current fiscal year. Contingency Reserve Fund - Created pursuant to law to provide a reserve to fund extraordinary needs arising from litigation against the State. These amounts may be used for payment of judgments against the State where the amount is in excess of $25 million and such payments are not previously appropriated, or emergency payments relating to natural or physical disasters, or to make payments for the enhancement of the State's economy. Community Projects Fund - Created pursuant to law to finance discretionary, usually local, projects ("member items") sponsored by individual legislators and the Governor. The Enacted State Budget typically includes lump sum appropriations for the Governor, Senate and the Assembly, to be designated for various grants, awards and contracts with local governments, not-for-profit organizations and community groups. During the fiscal year, each party may allocate their respective appropriations, by grant amount, to the intended recipient organizations.

FINANCIAL PLAN TABLES AND ACCOMPANYING NOTES
111
Informal Designation of Fund Balance - From time to time, DOB will informally designate unrestricted balances in the General Fund for specific policy goals. These amounts are typically identified with the phrase “reserved for.” NOTE 5 — SPENDING ADJUSTMENTS Certain Special Revenue accounts formerly reported in the Financial Plan as Federal Operating Funds have been reclassified to State Operating Funds. This change has the effect of increasing the reported disbursements from State Operating Funds, and reducing reported disbursements from Federal Operating Funds by an equal amount. Accordingly, there is no impact on the State's reported All Governmental Funds spending totals. For purposes of comparability, the impact of the reclassification on historical results is summarized in the following table.
Before Restatement
Reporting Adjustment1 Restated
2005-06 66,240 3,065 69,3052006-07 73,476 3,031 76,5072007-08 76,989 3,029 80,0182008-09 78,166 3,459 81,6252009-10 76,873 3,786 80,6592010-11 80,491 3,926 84,417
STATE OPERATING FUNDS AS RESTATED(millions of dollars)
1DOB has reclassified certain special revenue accounts from Federal Operating Funds to State Operating Funds to be consistent with the methodology used by the Office of the State Comptroller.
NOTE 6 — ITEMS AFFECTING FY 2011 TO FY 2012 COMPARABILITY School Aid Payment - The end-of-year school aid payment ($2.06 billion) scheduled for the last quarter of FY 2010 was paid in the first quarter of FY 2011, as authorized in statute. This was done to shift the FY 2010 budget shortfall into FY 2011. American Recovery and Reinvestment Act of 2009 - On February 17, 2009, President Obama signed into law ARRA of 2009. This Act contains provisions for direct Federal aid for fiscal relief, consisting of increases in the Federal matching rate for eligible State Medicaid expenditures, and funds provided through the State Fiscal Stabilization Fund to restore proposed reductions in education, higher education, and to maintain essential government services.

FINANCIAL PLAN TABLES AND ACCOMPANYING NOTES
112
Pension Amortization - The Financial Plan projections assume that the State will amortize pension costs above a percentage of payroll, as authorized by legislation enacted in 2010. The percentage of payroll above which costs may be amortized increases annually as follows: 9.5 percent in FY 2011; 10.5 percent in FY 2012; 11.5 percent in FY 2013; 12.5 percent in FY 2014; 13.5 percent in FY 2015, and 14.5 percent in FY 2016 for ERS; and 17.5 percent in FY 2011; 18.5 percent in FY 2012; 19.5 percent in FY 2013; 20.5 percent in FY 2014; and 21.5 percent in FY 2016 for PFRS. The amortization reduces the State’s annual pension contribution in the short term, but results in long-term costs. The amounts expected to be amortized total $249 million in FY 2011, $575 million in FY 2012, $782 million in FY 2013, $771 million in FY 2014, $916 million in FY 2015 and $554M in FY 2016. Retroactive Labor Settlements - Several unions have not agreed to labor settlements for contract periods prior to FY 2012. In recent years, the State has included spending in the Financial Plan for potential settlements, which have not materialized. The Current Financial Plan costs sets aside a portion of the General Fund balance for this purpose. The amount of the reserve is calculated on the assumption that the unions that have not agreed to contracts will receive the same general salary increases as the unions with ratified contracts. Mergers - Consistent with the FY 2012 Enacted Budget, State agency mergers have been reflected in the Financial Plan tables that follow. As such, actual spending for FY 2011 has been reflected in the former agencies, while projections for FY 2012 and forward reflect the impact of the agency merger. These mergers include:
• Division of Parole merged with the Department of Correctional Services to become the new Department of Corrections and Community Supervision;
• Consumer Protection Board merged into Department of State; and • Foundation for Science, Innovation & Technology merged into the Department of
Economic Development The Banking and Insurance Departments have been merged to create a new agency known as the Department of Financial Services. For reporting purposes, DOB assigned FY 2011 actual spending from these departments to the Department of Financial Services. Reductions in spending for the Department of Financial Services reflect the projected impact of cost control and efficiency actions contemplated by the merger of the Insurance and Banking departments. NOTE 7 — OFF-BUDGET TRANSACTIONS Represent certain capital spending that is not reported in actual cash spending results, but is reported in the State's GAAP Financial Statements. This spending is related to programs which are financed directly from bond proceeds that are on deposit at various public authorities, rather than from a short-term STIP or cash from the General Fund.

FINANCIAL PLAN TABLES AND ACCOMPANYING NOTES
113
NOTE 8 — GENERAL FUND/HCRA COMBINED GAP The current HCRA authorization expires on March 31, 2014. HCRA is projected to remain balanced through FY 2016. However, any unaddressed shortfall would need to be financed by the General Fund. NOTE 9 — METROPOLITAN TRANSPORTATION AUTHORITY FINANCIAL ASSISTANCE FUND The Metropolitan Commuter Transportation Mobility Tax (Mobility Tax) is imposed on certain employers and self-employed individuals engaging in business within the metropolitan commuter transportation district. This revenue source is collected by the State on behalf of, and disbursed in its entirety to, the MTA. Due to requirements of the enabling legislation, the tax is reflected in the State's Special Revenue Funds, increasing both receipts and disbursements by an actual $1.7 billion in FY 2011, growing to an estimated $2.0 billion in FY 2015. NOTE 10 — CHANGES TO THE MEDICAID PROGRAM As of January 2006, the State pays for the entire non-Federal share of FHP program and any annual Medicaid increases for counties above a fixed level. In accordance with statutory indexing provisions, 2012 Medicaid payments by local governments will not be allowed to increase by more than 3.0 percent over 2011 levels. NOTE 11 — STATEWIDE CASH FLOW ADMINISTRATION OSC invests General Fund moneys, bond proceeds, and other funds not immediately required to make payments through STIP, which is comprised of joint custody funds (Governmental Funds, Internal Service Funds, Enterprise Funds and Private Purpose Trust Funds), as well as several sole custody funds including the Tobacco Settlement Fund. OSC is authorized to make short-term loans from STIP to cover temporary cash shortfalls in certain funds and accounts, including the General Fund, resulting from the timing of receipts and disbursements. The Legislature authorizes the funds and accounts that may receive loans each year, based on legislation submitted with the Executive Budget. Loans may be granted only for amounts that the Director of the Budget certifies are “receivable on account” or can be repaid from the current operating receipts of the fund (i.e., loans cannot be granted in expectation of future revenue enhancements).

FINANCIAL PLAN TABLES AND ACCOMPANYING NOTES
114
NOTE 12 — OUTSTANDING TEMPORARY LOANS SUMMARY The total outstanding loan balance as of March 31, 2011 was $1.7 billion, comprised of advances for bond-reimbursable capital spending pending the receipt of bond proceeds ($857 million), activities that are financed initially by the State pending Federal receipt ($344 million), State Special Revenue Funds ($414 million), and Proprietary Funds ($42 million). The total loan balance typically increases throughout the State fiscal year, reaching its peak between the second and third quarters. The spike mainly reflects the payment of lottery aid for education, which is financed in large part by a loan that is repaid over the course of the year as lottery revenues are received.

FINANCIAL PLAN TABLES AND ACCOMPANYING NOTES
115
FINANCIAL PLAN TABLES General Fund – Total Budget Financial Plan Projections FY 2013 through FY 2016 ................................................ T-1 Financial Plan, Annual Change from FY 2011 (Actual) to FY 2012 .......................... T-2 Financial Plan, Annual Change from FY 2012 to FY 2013 ......................................... T-3 Update of FY 2012 (Change from Mid-Year Update) ................................................. T-4 Update of FY 2013 (Change from Mid-Year Update) ................................................. T-5 Update of FY 2014 (Change from Mid-Year Update) ................................................. T-6 Update of FY 2015 (Change from Mid-Year Update) ................................................. T-7 General Fund – Revenue Detail (Excluding Transfers) Financial Plan Projections FY 2013 through FY 2016 ................................................ T-8 Financial Plan, Annual Change from FY 2011 (Actual) to FY 2012 .......................... T-9 Financial Plan, Annual Change from FY 2012 to FY 2013 ....................................... T-10 State Operating Funds Budget FY 2012 Financial Plan .............................................................................................. T-11 FY 2013 Financial Plan .............................................................................................. T-12 FY 2014 Financial Plan .............................................................................................. T-13 FY 2015 Financial Plan .............................................................................................. T-14 FY 2016 Financial Plan .............................................................................................. T-15 Annual Change from FY 2012 to FY 2013 ................................................................ T-16 All Governmental Funds – Total Budget FY 2012 Financial Plan .............................................................................................. T-17 FY 2013 Financial Plan .............................................................................................. T-18 FY 2014 Financial Plan .............................................................................................. T-19 FY 2015 Financial Plan .............................................................................................. T-20 FY 2016 Financial Plan .............................................................................................. T-21 Annual Change from FY 2012 to FY 2013 ................................................................ T-22 All Governmental Funds – Revenue Detail FY 2012 Financial Plan .............................................................................................. T-23 FY 2013 Financial Plan .............................................................................................. T-24 FY 2014 Financial Plan .............................................................................................. T-25 FY 2015 Financial Plan .............................................................................................. T-26 FY 2016 Financial Plan .............................................................................................. T-27 Annual Change from FY 2012 to FY 2013 ................................................................ T-28 Special Revenue Funds FY 2012 State and Federal Funds .............................................................................. T-29 FY 2013 State and Federal Funds .............................................................................. T-30 FY 2014 State and Federal Funds .............................................................................. T-31 FY 2015 State and Federal Funds .............................................................................. T-32 FY 2016 State and Federal Funds .............................................................................. T-33

FINANCIAL PLAN TABLES AND ACCOMPANYING NOTES
116
Annual Change from FY 2012 to FY 2013 ................................................................ T-34 Receipts Detail, FY 2013 through FY 2016 ............................................................... T-35 Receipts Detail, Annual Change from FY 2012 to FY 2013 ..................................... T-36 Capital Budget FY 2012 State and Federal Funds .............................................................................. T-37 FY 2013 State and Federal Funds .............................................................................. T-38 FY 2014 State and Federal Funds .............................................................................. T-39 FY 2015 State and Federal Funds .............................................................................. T-40 FY 2016 State and Federal Funds .............................................................................. T-41 Annual Change from FY 2012 to FY 2013 ................................................................ T-42 Receipts Detail, FY 2013 through FY 2016 ............................................................... T-43 Receipts Detail, Annual Change from FY 2012 to FY 2013 ..................................... T-44 Off Budget Capital Spending, FY 2012 through FY 2016 ........................................ T-45 Debt Service Funds – Revenue Detail Projections FY 2013 through FY 2016 ...................................................................... T-46 Annual Change from FY 2012 to FY 2013 ................................................................ T-47 State Funds – Total Budget FY 2012 Financial Plan .............................................................................................. T-48 FY 2013 Financial Plan .............................................................................................. T-49 FY 2014 Financial Plan .............................................................................................. T-50 FY 2015 Financial Plan .............................................................................................. T-51 FY 2016 Financial Plan .............................................................................................. T-52 Annual Change from FY 2012 to FY 2013 ................................................................ T-53 Cash Flow – FY 2011 General Fund Monthly Projections (Actual) ....................... T-54 Cash Flow – Update of FY 2012 Monthly Projections General Fund .............................................................................................................. T-55 State Operating Funds ................................................................................................ T-56 Capital Projects Funds - Total .................................................................................... T-57 Capital Projects Funds - State .................................................................................... T-58 Capital Projects Funds - Federal ................................................................................ T-59 Special Revenue Funds - Total ................................................................................... T-60 Special Revenue Funds - State ................................................................................... T-61 Special Revenue Funds - Federal ............................................................................... T-62 Debt Service Funds .................................................................................................... T-63 All Governmental Funds ............................................................................................ T-64 State Funds ................................................................................................................. T-65 Cash Flow – FY 2013 Monthly Projections General Fund .............................................................................................................. T-66 State Operating Funds ................................................................................................ T-67 Capital Projects Funds - Total .................................................................................... T-68

FINANCIAL PLAN TABLES AND ACCOMPANYING NOTES
117
Capital Projects Funds - State .................................................................................... T-69 Capital Projects Funds - Federal ................................................................................ T-70 Special Revenue Funds - Total ................................................................................... T-71 Special Revenue Funds - State ................................................................................... T-72 Special Revenue Funds - Federal ............................................................................... T-73 Debt Service Funds .................................................................................................... T-74 All Governmental Funds ............................................................................................ T-75 State Funds ................................................................................................................. T-76 Health Care Reform Act Resources Fund Projections FY 2013 through FY 2016 ...................................................................... T-77 Annual Change from FY 2012 to FY 2013 ................................................................ T-78 FY 2012 Monthly Cash Flow Projections .................................................................. T-79 FY 2013 Monthly Cash Flow Projections .................................................................. T-80 Proprietary and Fiduciary Funds FY 2012 Financial Plan .............................................................................................. T-81 FY 2013 Financial Plan .............................................................................................. T-82 FY 2014 Financial Plan .............................................................................................. T-83 FY 2015 Financial Plan .............................................................................................. T-84 FY 2016 Financial Plan .............................................................................................. T-85 Workforce Summary Report (FY 2011 through FY 2013) General Fund ............................................................................................................. T-86 State Operating Funds ................................................................................................ T-88 State Funds ................................................................................................................ T-90 All Funds ................................................................................................................... T-92 Special Revenue Fund - Other ................................................................................... T-94 Special Revenue Fund - Federal ................................................................................. T-96 Capital Projects Fund - State ...................................................................................... T-97 Capital Projects Fund - Federal .................................................................................. T-98 Enterprise Fund .......................................................................................................... T-99 Internal Service Fund ............................................................................................... T-100 Agency Trust Fund ................................................................................................... T-101 Pension Trust Fund ................................................................................................... T-102 Private Purpose Trust Fund ...................................................................................... T-103 Local Government Impact Summary Report Impact on Local Fiscal Year Ending FY 2012 ......................................................... T-104 Impact on Local Fiscal Year Ending FY 2013 ......................................................... T-105 Impact on Local Fiscal Years Ending FY 2012 through FY 2015 ........................... T-106 Impact on New York City Fiscal Years FY 2012 through FY 2015 ........................ T-107

FINANCIAL PLAN TABLES AND ACCOMPANYING NOTES
118
Spending Detail by Agency (FY 2011 through FY 2016) General Fund – Total (Agency Detail Excluding Transfers) ................................... T-108 General Fund – Total ................................................................................................ T-114 General Fund – Local Assistance ............................................................................. T-116 General Fund – State Operations ............................................................................. T-118 General Fund – Personal Service ............................................................................. T-120 General Fund – Non-personal Service ..................................................................... T-122 General Fund – General State Charges .................................................................... T-124 State Operating Funds – Total (Agency Detail) ....................................................... T-125 State Operating Funds – Total .................................................................................. T-133 State Operating Funds – Local Assistance ............................................................... T-135 State Operating Funds – State Operations ................................................................ T-137 State Operating Funds – Personal Service ............................................................... T-139 State Operating Funds – Non-personal Service ....................................................... T-141 State Operating Funds – General State Charges ...................................................... T-143 State Operating Funds – Capital Projects ................................................................. T-145 Capital Projects Funds – Total ................................................................................. T-146 All Governmental Funds – Total (Agency Detail) ................................................... T-148 All Governmental Funds – Total .............................................................................. T-157 All Governmental Funds – Local Assistance ........................................................... T-159 All Governmental Funds – State Operations ............................................................ T-161 All Governmental Funds – Personal Service ........................................................... T-163 All Governmental Funds – Non-personal Service ................................................... T-165 All Governmental Funds – General State Charges .................................................. T-167 All Governmental Funds – Capital Projects ............................................................. T-169 State Funds – Total ................................................................................................... T-171 State Funds – Local Assistance ................................................................................ T-173 State Funds – State Operations ................................................................................. T-175 State Funds – Personal Service ................................................................................ T-177 State Funds – Non-personal Service ........................................................................ T-179 State Funds – General State Charges ....................................................................... T-181 State Funds – Capital Projects .................................................................................. T-183 Special Revenue State Funds – Local Assistance .................................................... T-185 Special Revenue State Funds – Personal Service ..................................................... T-187 Special Revenue State Funds – Non-personal Service ............................................. T-189 Special Revenue State Funds – General State Charges ............................................ T-191 Special Revenue Federal Funds – Local Assistance ................................................ T-193 Special Revenue Federal Funds – Personal Service ................................................. T-194 Special Revenue Federal Funds – Non-personal Service ......................................... T-196 Special Revenue Federal Funds – General State Charges ........................................ T-198

FINANCIAL PLAN TABLES AND ACCOMPANYING NOTES
119
General Fund Transfers (FY 2012 through FY 2016) General Fund Transfers from Other Funds .............................................................. T-199 General Fund Transfers to Other Funds ................................................................... T-201 FY 2012 Cash Basis Combining Statement General Fund ............................................................................................................ T-202 Special Revenue Funds ............................................................................................ T-203 Special Revenue Other Funds Detail by Account .................................................... T-209 Miscellaneous Special Revenue Fund (339) Detail by Account .............................. T-212 Capital Projects Funds .............................................................................................. T-217 Debt Service Funds .................................................................................................. T-221 Internal Services ....................................................................................................... T-222 Enterprise ................................................................................................................. T-223 FY 2013 Cash Basis Combining Statement General Fund ............................................................................................................ T-224 Special Revenue Funds ............................................................................................ T-225 Special Revenue Other Funds Detail by Account .................................................... T-231 Miscellaneous Special Revenue Fund (339) Detail by Account .............................. T-234 Capital Projects Funds .............................................................................................. T-239 Debt Service Funds .................................................................................................. T-243 Internal Services ....................................................................................................... T-244 Enterprise ................................................................................................................. T-245 Cash to Appropriation Table – General Fund FY 2011 (Actual) ..................................................................................................... T-246 FY 2012 .................................................................................................................... T-249 FY 2013 .................................................................................................................... T-252 GAAP – General Fund Update of FY 2012 (Change from Mid-Year Update) ............................................. T-255 Annual Change from FY 2012 to FY 2013 .............................................................. T-256 Projections FY 2013 through FY 2016 .................................................................... T-257 GAAP – All Governmental Funds FY 2012 Financial Plan ............................................................................................ T-258 FY 2013 Financial Plan ............................................................................................ T-259 FY 2012 Major Funds Financial Plan ...................................................................... T-260 FY 2013 Major Funds Financial Plan ...................................................................... T-261 GAAP Basis Combining Statement FY 2012 General Fund ............................................................................................. T-262 FY 2013 General Fund ............................................................................................. T-264

FINANCIAL PLAN TABLES AND ACCOMPANYING NOTES
120
FY 2012 Cash to GAAP Conversion Tables General Fund ............................................................................................................ T-266 Special Revenue Funds ............................................................................................ T-267 Capital Projects Funds .............................................................................................. T-268 Debt Service Funds .................................................................................................. T-269 FY 2013 Cash to GAAP Conversion Tables General Fund ............................................................................................................ T-270 Special Revenue Funds ............................................................................................ T-271 Capital Projects Funds .............................................................................................. T-272 Debt Service Funds .................................................................................................. T-273 Financial Plan Table Appendices List of Joint Custody Funds ..................................................................................... T-274 State Fund Structure ................................................................................................. T-278
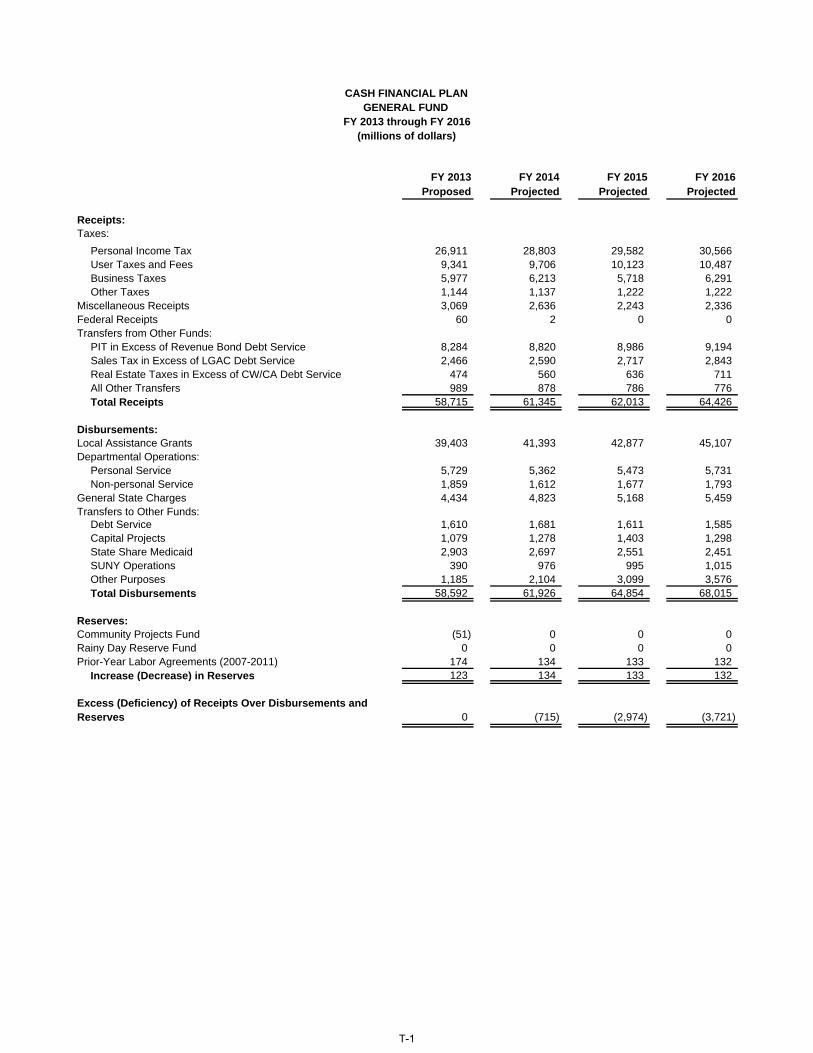
FY 2013 FY 2014 FY 2015 FY 2016Proposed Projected Projected Projected
Receipts:Taxes:
Personal Income Tax 26,911 28,803 29,582 30,566User Taxes and Fees 9,341 9,706 10,123 10,487Business Taxes 5,977 6,213 5,718 6,291Other Taxes 1,144 1,137 1,222 1,222
Miscellaneous Receipts 3,069 2,636 2,243 2,336Federal Receipts 60 2 0 0Transfers from Other Funds:
PIT in Excess of Revenue Bond Debt Service 8,284 8,820 8,986 9,194Sales Tax in Excess of LGAC Debt Service 2,466 2,590 2,717 2,843Real Estate Taxes in Excess of CW/CA Debt Service 474 560 636 711All Other Transfers 989 878 786 776Total Receipts 58,715 61,345 62,013 64,426
Disbursements:Local Assistance Grants 39,403 41,393 42,877 45,107Departmental Operations:
Personal Service 5,729 5,362 5,473 5,731Non-personal Service 1,859 1,612 1,677 1,793
General State Charges 4,434 4,823 5,168 5,459Transfers to Other Funds:
Debt Service 1,610 1,681 1,611 1,585Capital Projects 1,079 1,278 1,403 1,298State Share Medicaid 2,903 2,697 2,551 2,451SUNY Operations 390 976 995 1,015Other Purposes 1,185 2,104 3,099 3,576Total Disbursements 58,592 61,926 64,854 68,015
Reserves:Community Projects Fund (51) 0 0 0Rainy Day Reserve Fund 0 0 0 0Prior-Year Labor Agreements (2007-2011) 174 134 133 132
Increase (Decrease) in Reserves 123 134 133 132
0 (715) (2,974) (3,721)
GENERAL FUND FY 2013 through FY 2016
(millions of dollars)
CASH FINANCIAL PLAN
Excess (Deficiency) of Receipts Over Disbursements and Reserves
T-1

FY 2011 FY 2012 Annual AnnualResults Current $ Change % Change
Opening Fund Balance 2,302 1,376 (926) -40.2%
Receipts:Taxes:
Personal Income Tax 23,894 25,705 1,811 7.6%User Taxes and Fees 8,795 9,135 340 3.9%Business Taxes 5,279 5,868 589 11.2%Other Taxes 1,237 1,212 (25) -2.0%
Miscellaneous Receipts 3,095 3,244 149 4.8%Federal Receipts 54 60 6 11.1%Transfers from Other Funds:
PIT in Excess of Revenue Bond Debt Service 7,625 8,069 444 5.8%Sales Tax in Excess of LGAC Debt Service 2,351 2,430 79 3.4%Real Estate Taxes in Excess of CW/CA Debt Service 348 397 49 14.1%All Other Transfers 1,769 1,094 (675) -38.2%Total Receipts 54,447 57,214 2,767 5.1%
Disbursements:Local Assistance Grants 37,206 38,515 1,309 3.5%Departmental Operations:
Personal Service 6,151 5,770 (381) -6.2%Non-Personal Service 1,822 1,795 (27) -1.5%
General State Charges 4,187 4,707 520 12.4%Transfers to Other Funds:
Debt Service 1,737 1,539 (198) -11.4%Capital Projects 932 790 (142) -15.2%State Share Medicaid 2,497 2,912 415 16.6%SUNY Operations 0 0 0 --Other Purposes 841 887 46 5.5%Total Disbursements 55,373 56,915 1,542 2.8%
(926) 299 1,225 -132.3%
Closing Fund Balance 1,376 1,675 299 21.7%
Statutory ReservesTax Stabilization Reserve Fund 1,031 1,031 0Rainy Day Reserve Fund 175 275 100Contingency Reserve Fund 21 21 0Community Projects Fund 136 51 (85)
Reserved ForPrior-Year Labor Agreements (2007-2011) 0 284 284Debt Management 13 13 0
CASH FINANCIAL PLAN GENERAL FUND
ANNUAL CHANGE(millions of dollars)
Excess (Deficiency) of Receipts Over Disbursements and Reserves
T-2

FY 2012 FY 2013 Annual AnnualCurrent Proposed $ Change % Change
Opening Fund Balance 1,376 1,675 299 21.7%
Receipts:Taxes:
Personal Income Tax 25,705 26,911 1,206 4.7%User Taxes and Fees 9,135 9,341 206 2.3%Business Taxes 5,868 5,977 109 1.9%Other Taxes 1,212 1,144 (68) -5.6%
Miscellaneous Receipts 3,244 3,069 (175) -5.4%Federal Receipts 60 60 0 0.0%Transfers from Other Funds:
PIT in Excess of Revenue Bond Debt Service 8,069 8,284 215 2.7%Sales Tax in Excess of LGAC Debt Service 2,430 2,466 36 1.5%Real Estate Taxes in Excess of CW/CA Debt Service 397 474 77 19.4%All Other Transfers 1,094 989 (105) -9.6%Total Receipts 57,214 58,715 1,501 2.6%
Disbursements:Local Assistance Grants 38,515 39,403 888 2.3%Departmental Operations:
Personal Service 5,770 5,729 (41) -0.7%Non-Personal Service 1,795 1,859 64 3.6%
General State Charges 4,707 4,434 (273) -5.8%Transfers to Other Funds:
Debt Service 1,539 1,610 71 4.6%Capital Projects 790 1,079 289 36.6%State Share Medicaid 2,912 2,903 (9) -0.3%SUNY Operations 0 390 390 --Other Purposes 887 1,185 298 33.6%Total Disbursements 56,915 58,592 1,677 2.9%
299 123 (176) -58.9%
Closing Fund Balance 1,675 1,798 123 7.3%
Statutory ReservesTax Stabilization Reserve Fund 1,031 1,031 0Rainy Day Reserve Fund 275 275 0Contingency Reserve Fund 21 21 0Community Projects Fund 51 0 (51)
Reserved ForPrior-Year Labor Agreements (2007-2011) 284 458 174Debt Management 13 13 0
CASH FINANCIAL PLAN GENERAL FUND
ANNUAL CHANGE FROM CURRENT YEAR(millions of dollars)
Excess (Deficiency) of Receipts Over Disbursements and Reserves
T-3

Mid-Year Change Executive
Opening fund balance 1,376 0 1,376
Receipts:Taxes: Personal Income Tax 25,870 (165) 25,705 User Taxes and Fees 9,056 79 9,135 Business Taxes 5,868 0 5,868 Other Taxes 1,092 120 1,212Miscellaneous Receipts 3,152 92 3,244Federal Receipts 60 0 60Transfers from Other Funds: PIT in Excess of Revenue Bond Debt Service 8,056 13 8,069 Sales Tax in Excess of LGAC Debt Service 2,394 36 2,430 Real Estate Taxes in Excess of CW/CA Debt Service 395 2 397 All Other 923 171 1,094 Total Receipts 56,866 348 57,214
Disbursements:Local Assistance Grants 38,721 (206) 38,515State Operations: Personal Service 5,713 57 5,770 Non-Personal Service 1,749 46 1,795General State Charges 4,704 3 4,707Transfers to Other Funds: Debt Service 1,455 84 1,539 Capital Projects 778 12 790 State Share Medicaid 2,910 2 2,912 SUNY Operations 0 0 0 Other Purposes 825 62 887 Total Disbursements 56,855 60 56,915
Reserves:Community Projects Fund (85) 0 (85)Rainy Day Reserve Fund 100 0 100Prior-Year Labor Agreements (2007-2011) 346 (62) 284 Increase (Decrease) in Reserves 361 (62) 299
Excess (Deficiency) of Receipts Over Disbursements and Reserves (350) 350 0
GENERAL FUND
(millions of dollars)
CASH FINANCIAL PLAN
FY 2012
T-4

Mid-Year Change Executive
Receipts:Taxes: Personal Income Tax 25,619 1,292 26,911 User Taxes and Fees 9,288 53 9,341 Business Taxes 6,208 (231) 5,977 Other Taxes 1,087 57 1,144Miscellaneous Receipts 3,024 45 3,069Federal Receipts 60 0 60Transfers from Other Funds: PIT in Excess of Revenue Bond Debt Service 7,800 484 8,284 Sales Tax in Excess of LGAC Debt Service 2,450 16 2,466 Real Estate Taxes in Excess of CW/CA Debt Service 471 3 474 All Other 628 361 989 Total Receipts 56,635 2,080 58,715
Disbursements:Local Assistance Grants 39,955 (552) 39,403Departmental Operations: Personal Service 5,674 55 5,729 Non-Personal Service 1,995 (136) 1,859General State Charges 5,093 (659) 4,434Transfers to Other Funds: Debt Service 1,722 (112) 1,610 Capital Projects 1,126 (47) 1,079 State Share Medicaid 2,903 0 2,903 SUNY Operations 390 0 390 Other Purposes 936 249 1,185 Total Disbursements 59,794 (1,202) 58,592
Reserves:Community Projects Fund (51) 0 (51)Prior-Year Labor Agreements (2007-2011) 142 32 174 Increase (Decrease) in Reserves 91 32 123
Excess (Deficiency) of Receipts Over Disbursements and Reserves (3,250) 3,250 0
GENERAL FUNDFY 2013
(millions of dollars)
CASH FINANCIAL PLAN
T-5
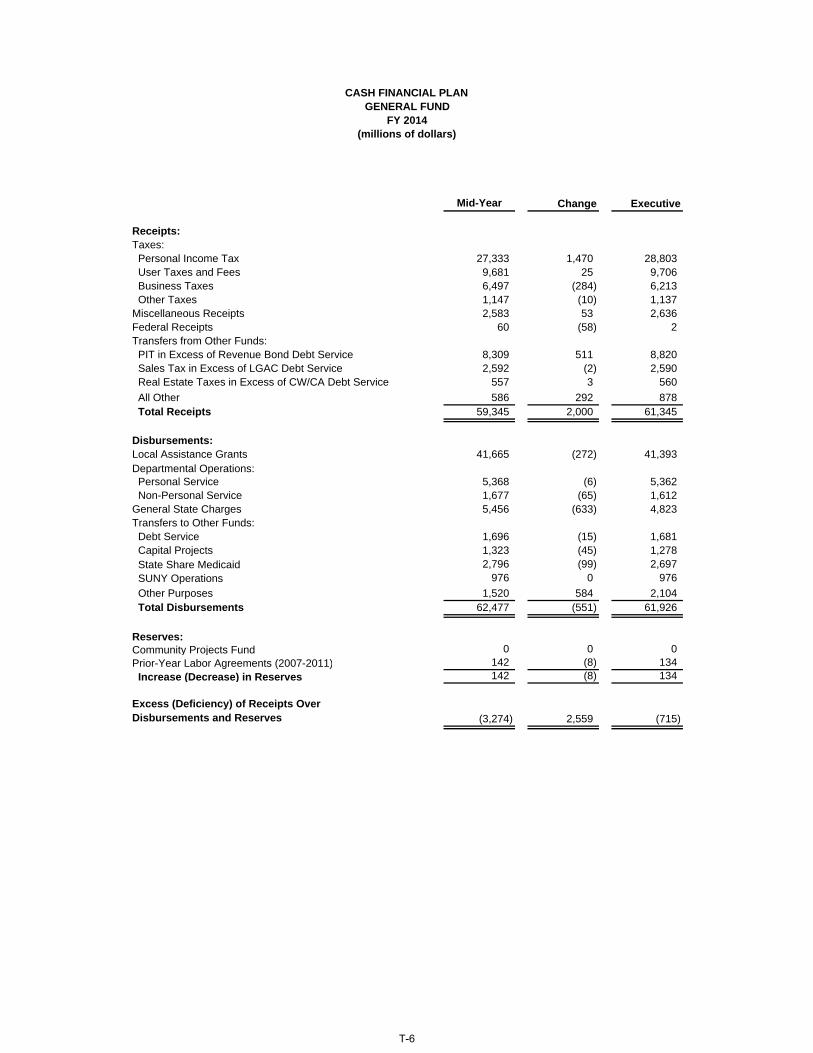
Mid-Year Change Executive
Receipts:Taxes: Personal Income Tax 27,333 1,470 28,803 User Taxes and Fees 9,681 25 9,706 Business Taxes 6,497 (284) 6,213 Other Taxes 1,147 (10) 1,137Miscellaneous Receipts 2,583 53 2,636Federal Receipts 60 (58) 2Transfers from Other Funds: PIT in Excess of Revenue Bond Debt Service 8,309 511 8,820 Sales Tax in Excess of LGAC Debt Service 2,592 (2) 2,590 Real Estate Taxes in Excess of CW/CA Debt Service 557 3 560 All Other 586 292 878 Total Receipts 59,345 2,000 61,345
Disbursements:Local Assistance Grants 41,665 (272) 41,393Departmental Operations: Personal Service 5,368 (6) 5,362 Non-Personal Service 1,677 (65) 1,612General State Charges 5,456 (633) 4,823Transfers to Other Funds: Debt Service 1,696 (15) 1,681 Capital Projects 1,323 (45) 1,278 State Share Medicaid 2,796 (99) 2,697 SUNY Operations 976 0 976 Other Purposes 1,520 584 2,104 Total Disbursements 62,477 (551) 61,926
Reserves:Community Projects Fund 0 0 0Prior-Year Labor Agreements (2007-2011) 142 (8) 134 Increase (Decrease) in Reserves 142 (8) 134
Excess (Deficiency) of Receipts Over Disbursements and Reserves (3,274) 2,559 (715)
CASH FINANCIAL PLAN GENERAL FUND
FY 2014(millions of dollars)
T-6

Mid-Year Change Executive
Receipts:Taxes: Personal Income Tax 28,623 959 29,582 User Taxes and Fees 10,099 24 10,123 Business Taxes 5,952 (234) 5,718 Other Taxes 1,212 10 1,222Miscellaneous Receipts 2,122 121 2,243Federal Receipts 60 (60) 0Transfers from Other Funds: PIT in Excess of Revenue Bond Debt Service 8,673 313 8,986 Sales Tax in Excess of LGAC Debt Service 2,724 (7) 2,717 Real Estate Taxes in Excess of CW/CA Debt Service 634 2 636 All Other 602 184 786 Total Receipts 60,701 1,312 62,013
Disbursements:Local Assistance Grants 43,352 (475) 42,877Departmental Operations: Personal Service 5,517 (44) 5,473 Non-Personal Service 1,798 (121) 1,677General State Charges 5,623 (455) 5,168Transfers to Other Funds: Debt Service 1,614 (3) 1,611 Capital Projects 1,419 (16) 1,403 State Share Medicaid 2,750 (199) 2,551 SUNY Operations 995 0 995 Other Purposes 2,289 810 3,099 Total Disbursements 65,357 (503) 64,854
Reserves:Community Projects Fund 0 0 0Prior-Year Labor Agreements (2007-2011) 142 (9) 133 Increase (Decrease) in Reserves 142 (9) 133
Excess (Deficiency) of Receipts Over Disbursements and Reserves (4,798) 1,824 (2,974)
CASH FINANCIAL PLAN GENERAL FUND
FY 2015(millions of dollars)
T-7

FY 2013 FY 2014 FY 2015 FY 2016Proposed Projected Projected Projected
Taxes: Withholdings 32,598 34,667 36,032 37,947 Estimated Payments 12,212 13,063 13,702 13,560 Final Payments 2,203 2,170 2,167 2,267 Other Payments 1,104 1,136 1,238 1,288 Gross Collections 48,117 51,036 53,139 55,062 State/City Offset (298) (198) (148) (148) Refunds (7,508) (7,760) (8,631) (9,106) Reported Tax Collections 40,311 43,078 44,360 45,808 STAR (Dedicated Deposits) (3,322) (3,505) (3,688) (3,790) RBTF (Dedicated Transfers) (10,078) (10,770) (11,090) (11,452) Personal Income Tax 26,911 28,803 29,582 30,566
Sales and Use Tax 11,455 11,937 12,496 12,992 Cigarette and Tobacco Taxes 511 510 503 495 Motor Fuel Tax 0 0 0 0 Alcoholic Beverage Taxes 238 242 247 247 Highway Use Tax 0 0 0 0 Auto Rental Tax 0 0 0 0 Taxicab Surcharge 0 0 0 0 Gross Utility Taxes and Fees 12,204 12,689 13,246 13,734 LGAC Sales Tax (Dedicated Transfers) (2,863) (2,983) (3,123) (3,247) User Taxes and Fees 9,341 9,706 10,123 10,487
Corporation Franchise Tax 2,844 3,024 2,335 2,736 Corporation and Utilities Tax 682 706 730 757 Insurance Taxes 1,322 1,383 1,422 1,491 Bank Tax 1,129 1,100 1,231 1,307 Petroleum Business Tax 0 0 0 0 Business Taxes 5,977 6,213 5,718 6,291
Estate Tax 1,127 1,120 1,205 1,205 Real Estate Transfer Tax 690 770 840 915 Gift Tax 0 0 0 0 Real Property Gains Tax 0 0 0 0 Pari-Mutuel Taxes 16 16 16 16 Other Taxes 1 1 1 1 Gross Other Taxes 1,834 1,907 2,062 2,137 Real Estate Transfer Tax (Dedicated) (690) (770) (840) (915) Other Taxes 1,144 1,137 1,222 1,222
Payroll Tax 0 0 0 0
Total Taxes 43,373 45,859 46,645 48,566
Licenses, Fees, Etc. 661 606 594 585Abandoned Property 785 670 655 655Motor Vehicle Fees 99 26 26 26ABC License Fee 51 50 50 50Reimbursements 202 202 202 202Investment Income 10 30 30 30Other Transactions 1,261 1,052 686 788Miscellaneous Receipts 3,069 2,636 2,243 2,336
Federal Grants 60 2 0 0
Total 46,502 48,497 48,888 50,902
CASH RECEIPTS
GENERAL FUNDFY 2013 THROUGH FY 2016
(millions of dollars)
CURRENT STATE RECEIPTS
T-8

FY 2011 FY 2012 Annual AnnualResults Current $ Change % Change
Taxes: Withholdings 31,240 31,197 (43) -0.1% Estimated Payments 9,735 11,530 1,795 18.4% Final Payments 1,964 2,125 161 8.2% Other Payments 1,063 1,039 (24) -2.3% Gross Collections 44,002 45,891 1,889 4.3% State/City Offset (100) (358) (258) 258.0% Refunds (7,693) (6,869) 824 -10.7% Reported Tax Collections 36,209 38,664 2,455 6.8% STAR (Dedicated Deposits) (3,263) (3,293) (30) 0.9% RBTF (Dedicated Transfers) (9,052) (9,666) (614) 6.8% Personal Income Tax 23,894 25,705 1,811 7.6%
Sales and Use Tax 10,782 11,235 453 4.2% Cigarette and Tobacco Taxes 480 476 (4) -0.8% Motor Fuel Tax 0 0 0 0 Alcoholic Beverage Taxes 230 233 3 1.3% Highway Use Tax 0 0 0 #DIV/0! Auto Rental Tax 0 0 0 #DIV/0! Taxicab Surcharge 0 0 0 #DIV/0! Gross Utility Taxes and Fees 11,492 11,944 452 3.9% LGAC Sales Tax (Dedicated Transfers) (2,697) (2,809) (112) 4.2% User Taxes and Fees 8,795 9,135 340 3.9%
Corporation Franchise Tax 2,472 2,825 353 14.3% Corporation and Utilities Tax 616 626 10 1.6% Insurance Taxes 1,217 1,274 57 4.7% Bank Tax 974 1,143 169 17.4% Petroleum Business Tax 0 0 0 #DIV/0! Business Taxes 5,279 5,868 589 11.2%
Estate Tax 1,218 1,195 (23) -1.9% Real Estate Transfer Tax 579 620 41 7.1% Gift Tax 1 0 (1) -100.0% Real Property Gains Tax 0 0 0 #DIV/0! Pari-Mutuel Taxes 17 16 (1) -5.9% Other Taxes 1 1 0 0.0% Gross Other Taxes 1,816 1,832 16 0.9% Real Estate Transfer Tax (Dedicated) (579) (620) (41) 7.1% Other Taxes 1,237 1,212 (25) -2.0%
Payroll Tax 0 0 0 #DIV/0!
Total Taxes 39,205 41,920 2,715 6.9%
Licenses, Fees, Etc. 680 620 (60) -8.8%Abandoned Property 645 755 110 17.1%Motor Vehicle Fees 34 112 78 229.4%ABC License Fee 52 55 3 5.8%Reimbursements 270 222 (48) -17.8%Investment Income 6 10 4 66.7%Other Transactions 1,408 1,470 62 4.4%Miscellaneous Receipts 3,095 3,244 149 4.8%
Federal Grants 54 60 6 11.1%
Total 42,354 45,224 2,870 6.8%
CURRENT STATE RECEIPTS GENERAL FUND
FY 2011 and FY 2012(millions of dollars)
T-9

FY 2012 FY 2013 Annual AnnualCurrent Proposed $ Change % Change
Taxes: Withholdings 31,197 32,598 1,401 4.5% Estimated Payments 11,530 12,212 682 5.9% Final Payments 2,125 2,203 78 3.7% Other Payments 1,039 1,104 65 6.3% Gross Collections 45,891 48,117 2,226 4.9% State/City Offset (358) (298) 60 -16.8% Refunds (6,869) (7,508) (639) 9.3% Reported Tax Collections 38,664 40,311 1,647 4.3% STAR (Dedicated Deposits) (3,293) (3,322) (29) 0.9% RBTF (Dedicated Transfers) (9,666) (10,078) (412) 4.3% Personal Income Tax 25,705 26,911 1,206 4.7%
Sales and Use Tax 11,235 11,455 220 2.0% Cigarette and Tobacco Taxes 476 511 35 7.4% Motor Fuel Tax 0 0 0 0 Alcoholic Beverage Taxes 233 238 5 2.1% Highway Use Tax 0 0 0 #DIV/0! Auto Rental Tax 0 0 0 #DIV/0! Taxicab Surcharge 0 0 0 #DIV/0! Gross Utility Taxes and Fees 11,944 12,204 260 2.2% LGAC Sales Tax (Dedicated Transfers) (2,809) (2,863) (54) 1.9% User Taxes and Fees 9,135 9,341 206 2.3%
Corporation Franchise Tax 2,825 2,844 19 0.7% Corporation and Utilities Tax 626 682 56 8.9% Insurance Taxes 1,274 1,322 48 3.8% Bank Tax 1,143 1,129 (14) -1.2% Petroleum Business Tax 0 0 0 #DIV/0! Business Taxes 5,868 5,977 109 1.9%
Estate Tax 1,195 1,127 (68) -5.7% Real Estate Transfer Tax 620 690 70 11.3% Gift Tax 0 0 0 #DIV/0! Real Property Gains Tax 0 0 0 #DIV/0! Pari-Mutuel Taxes 16 16 0 0.0% Other Taxes 1 1 0 0.0% Gross Other Taxes 1,832 1,834 2 0.1% Real Estate Transfer Tax (Dedicated) (620) (690) (70) 11.3% Other Taxes 1,212 1,144 (68) -5.6%
Payroll Tax 0 0 0 #DIV/0!
Total Taxes 41,920 43,373 1,453 3.5%
Licenses, Fees, Etc. 620 661 41 6.6%Abandoned Property 755 785 30 4.0%Motor Vehicle Fees 112 99 (13) -11.6%ABC License Fee 55 51 (4) -7.3%Reimbursements 222 202 (20) -9.0%Investment Income 10 10 0 0.0%Other Transactions 1,470 1,261 (209) -14.2%Miscellaneous Receipts 3,244 3,069 (175) -5.4%
Federal Grants 60 60 0 0.0%
Total 45,224 46,502 1,278 2.8%
CURRENT STATE RECEIPTS GENERAL FUND
FY 2012 and FY 2013(millions of dollars)
T-10

StateSpecial Debt Operating
General Revenue Service FundsFund Funds Funds Total
Opening Fund Balance 1,376 2,139 454 3,969
Receipts:Taxes 41,920 8,303 12,976 63,199Miscellaneous Receipts 3,244 15,147 949 19,340Federal Receipts 60 1 79 140
Total Receipts 45,224 23,451 14,004 82,679
Disbursements:Local Assistance Grants 38,515 19,033 0 57,548Departmental Operations:
Personal Service 5,770 6,106 0 11,876Non-Personal Service 1,795 3,355 61 5,211
General State Charges 4,707 1,829 0 6,536Debt Service 0 0 5,872 5,872Capital Projects 0 5 0 5
Total Disbursements 50,787 30,328 5,933 87,048
Other Financing Sources (Uses):Transfers from Other Funds 11,990 7,251 6,505 25,746Transfers to Other Funds (6,128) (613) (14,481) (21,222)Bond and Note Proceeds 0 0 0 0
Net Other Financing Sources (Uses) 5,862 6,638 (7,976) 4,524
299 (239) 95 155
Closing Fund Balance 1,675 1,900 549 4,124
Designated General Fund Reserves:Reserve for Collective Bargaining (284)Reserve for Community Projects Fund 85Rainy Day Fund (100)
Net Designated General Fund Reserves (299)
STATE OPERATING FUNDS BUDGETFY 2012
(millions of dollars)
CASH FINANCIAL PLAN
Excess (Deficiency) of Receipts and OtherFinancing Sources Over Disbursements and Other Financing Uses
T-11

StateSpecial Debt Operating
General Revenue Service FundsFund Funds Funds Total
Receipts:Taxes 43,373 8,247 13,512 65,132Miscellaneous Receipts 3,069 15,954 996 20,019Federal Receipts 60 1 79 140
Total Receipts 46,502 24,202 14,587 85,291
Disbursements:Local Assistance Grants 39,403 19,657 0 59,060Departmental Operations:
Personal Service 5,729 6,236 0 11,965Non-Personal Service 1,859 3,261 47 5,167
General State Charges 4,434 1,954 0 6,388Debt Service 0 0 6,149 6,149Capital Projects 0 5 0 5
Total Disbursements 51,425 31,113 6,196 88,734
Other Financing Sources (Uses):Transfers from Other Funds 12,213 7,711 6,295 26,219Transfers to Other Funds (7,167) (399) (14,609) (22,175)Bond and Note Proceeds 0 0 0 0
Net Other Financing Sources (Uses) 5,046 7,312 (8,314) 4,044
123 401 77 601
Designated General Fund Reserves:Reserve for Collective Bargaining (174)Reserve for Community Projects Fund 51
Net Designated General Fund Reserves (123)
CASH FINANCIAL PLAN STATE OPERATING FUNDS BUDGET
FY 2013(millions of dollars)
Excess (Deficiency) of Receipts and OtherFinancing Sources Over Disbursements and Other Financing Uses
T-12

StateSpecial Debt Operating
General Revenue Service FundsFund Funds Funds Total
Receipts:Taxes 45,859 8,569 14,404 68,832Miscellaneous Receipts 2,636 16,366 1,043 20,045Federal Receipts 2 1 79 82
Total Receipts 48,497 24,936 15,526 88,959
Disbursements:Local Assistance Grants 41,393 20,442 0 61,835Departmental Operations:
Personal Service 5,362 6,837 0 12,199Non-Personal Service 1,612 3,527 47 5,186
General State Charges 4,823 2,094 0 6,917Debt Service 0 0 6,449 6,449Capital Projects 0 5 0 5
Total Disbursements 53,190 32,905 6,496 92,591
Other Financing Sources (Uses):Transfers from Other Funds 12,848 8,726 6,155 27,729Transfers to Other Funds (8,736) (208) (15,108) (24,052)Bond and Note Proceeds 0 0 0 0
Net Other Financing Sources (Uses) 4,112 8,518 (8,953) 3,677
(581) 549 77 45
Designated General Fund Reserves:Reserve for Collective Bargaining (134)
Net Designated General Fund Reserves (134)
CASH FINANCIAL PLAN STATE OPERATING FUNDS BUDGET
FY 2014(millions of dollars)
Excess (Deficiency) of Receipts and OtherFinancing Sources Over Disbursements and Other Financing Uses
T-13

StateSpecial Debt Operating
General Revenue Service FundsFund Funds Funds Total
Receipts:Taxes 46,645 8,931 14,934 70,510Miscellaneous Receipts 2,243 16,636 1,064 19,943Federal Receipts 0 1 79 80
Total Receipts 48,888 25,568 16,077 90,533
Disbursements:Local Assistance Grants 42,877 21,064 0 63,941Departmental Operations:
Personal Service 5,473 7,049 0 12,522Non-Personal Service 1,677 3,627 47 5,351
General State Charges 5,168 2,260 0 7,428Debt Service 0 0 6,568 6,568Capital Projects 0 5 0 5
Total Disbursements 55,195 34,005 6,615 95,815
Other Financing Sources (Uses):Transfers from Other Funds 13,125 9,056 5,654 27,835Transfers to Other Funds (9,659) (61) (15,001) (24,721)Bond and Note Proceeds 0 0 0 0
Net Other Financing Sources (Uses) 3,466 8,995 (9,347) 3,114
(2,841) 558 115 (2,168)
Designated General Fund Reserves:Reserve for Collective Bargaining (133)
Net Designated General Fund Reserves (133)
CASH FINANCIAL PLAN STATE OPERATING FUNDS BUDGET
FY 2015(millions of dollars)
Excess (Deficiency) of Receipts and OtherFinancing Sources Over Disbursements and Other Financing Uses
T-14

StateSpecial Debt Operating
General Revenue Service FundsFund Funds Funds Total
Receipts:Taxes 48,566 9,189 15,495 73,250Miscellaneous Receipts 2,336 16,681 1,062 20,079Federal Receipts 0 1 79 80
Total Receipts 50,902 25,871 16,636 93,409
Disbursements:Local Assistance Grants 45,107 21,148 0 66,255Departmental Operations:
Personal Service 5,731 7,323 0 13,054Non-Personal Service 1,793 3,690 47 5,530
General State Charges 5,459 2,421 0 7,880Debt Service 0 0 6,705 6,705Capital Projects 0 5 0 5
Total Disbursements 58,090 34,587 6,752 99,429
Other Financing Sources (Uses):Transfers from Other Funds 13,524 9,456 5,411 28,391Transfers to Other Funds (9,925) (241) (15,310) (25,476)Bond and Note Proceeds 0 0 0 0
Net Other Financing Sources (Uses) 3,599 9,215 (9,899) 2,915
(3,589) 499 (15) (3,105)
Designated General Fund Reserves:Reserve for Collective Bargaining (132)
Net Designated General Fund Reserves (132)
CASH FINANCIAL PLAN STATE OPERATING FUNDS BUDGET
FY 2016(millions of dollars)
Excess (Deficiency) of Receipts and OtherFinancing Sources Over Disbursements and Other Financing Uses
T-15

FY 2012 FY 2013 Annual AnnualCurrent Proposed $ Change % Change
Opening Fund Balance 3,969 4,124 155
Receipts:Taxes 63,199 65,132 1,933 3.1%Miscellaneous Receipts 19,340 20,019 679 3.5%Federal Receipts 140 140 0 0.0%
Total Receipts 82,679 85,291 2,612 3.2%
Disbursements:Local Assistance Grants 57,548 59,060 1,512 2.6%Departmental Operations:
Personal Service 11,876 11,965 89 0.7%Non-Personal Service 5,211 5,167 (44) -0.8%
General State Charges 6,536 6,388 (148) -2.3%Debt Service 5,872 6,149 277 4.7%Capital Projects 5 5 0 0.0%
Total Disbursements 87,048 88,734 1,686 1.9%
Other Financing Sources (Uses):Transfers from Other Funds 25,746 26,219 473 1.8%Transfers to Other Funds (21,222) (22,175) (953) 4.5%Bond and Note Proceeds 0 0 0 #DIV/0!
Net Other Financing Sources (uses) 4,524 4,044 (480) -10.6%
155 601 446
Closing Fund Balance 4,124 4,726 602
CASH FINANCIAL PLAN STATE OPERATING FUNDS BUDGET
FY 2012 and FY 2013(millions of dollars)
Excess (Deficiency) of Receipts and OtherFinancing Sources Over Disbursements and Other Financing Uses
T-16

Special Capital Debt AllGeneral Revenue Projects Service Funds
Fund Funds Funds Funds Total
Opening Fund Balance 1,376 2,149 (167) 454 3,812
Receipts:Taxes 41,920 8,303 1,333 12,976 64,532Miscellaneous Receipts 3,244 15,279 4,360 949 23,832Federal Receipts 60 41,601 2,202 79 43,942
Total Receipts 45,224 65,183 7,895 14,004 132,306
Disbursements:Local Assistance Grants 38,515 54,743 2,564 0 95,822Departmental Operations:
Personal Service 5,770 6,749 0 0 12,519Non-Personal Service 1,795 4,314 0 61 6,170
General State Charges 4,707 2,126 0 0 6,833Debt Service 0 0 0 5,872 5,872Capital Projects 0 5 5,514 0 5,519
Total Disbursements 50,787 67,937 8,078 5,933 132,735
Other financing sources (Uses):Transfers from Other Funds 11,990 7,252 1,050 6,505 26,797Transfers to Other Funds (6,128) (4,738) (1,439) (14,481) (26,786)Bond and Note Proceeds 0 0 475 0 475
Net Other Financing Sources (Uses) 5,862 2,514 86 (7,976) 486
299 (240) (97) 95 57
Closing Fund Balance 1,675 1,909 (264) 549 3,869
Designated General Fund Reserves:Reserve for Collective Bargaining (284)Reserve for Community Projects Fund 85Rainy Day Fund (100)
Net Designated General Fund Reserves (299)
ALL GOVERNMENTAL FUNDSFY 2012
(millions of dollars)
CASH FINANCIAL PLAN
Excess (Deficiency) of Receipts and Other Financing Sources Over Disbursementsand Other Financing Uses
T-17

Special Capital Debt AllGeneral Revenue Projects Service Funds
Fund Funds Funds Funds Total
Receipts:Taxes 43,373 8,247 1,401 13,512 66,533Miscellaneous Receipts 3,069 16,085 4,105 996 24,255Federal Receipts 60 39,712 2,085 79 41,936
Total Receipts 46,502 64,044 7,591 14,587 132,724
Disbursements:Local Assistance Grants 39,403 53,787 1,995 0 95,185Departmental Operations:
Personal Service 5,729 6,837 0 0 12,566Non-Personal Service 1,859 4,148 0 47 6,054
General State Charges 4,434 2,268 0 0 6,702Debt Service 0 0 0 6,149 6,149Capital Projects 0 5 5,849 0 5,854
Total Disbursements 51,425 67,045 7,844 6,196 132,510
Other Financing Sources (Uses):Transfers from Other Funds 12,213 7,712 1,352 6,295 27,572Transfers to Other Funds (7,167) (4,309) (1,496) (14,609) (27,581)Bond and Note Proceeds 0 0 400 0 400
Net Other Financing Sources (Uses) 5,046 3,403 256 (8,314) 391
123 402 3 77 605
Designated General Fund Reserves:Reserve for Collective Bargaining (174)Reserve for Community Projects Fund 51
Net Designated General Fund Reserves (123)
CASH FINANCIAL PLAN ALL GOVERNMENTAL FUNDS
FY 2013(millions of dollars)
Excess (Deficiency) of Receipts and Other Financing Sources Over Disbursementsand Other Financing Uses
T-18

Special Capital Debt AllGeneral Revenue Projects Service Funds
Fund Funds Funds Funds Total
Receipts:Taxes 45,859 8,569 1,421 14,404 70,253Miscellaneous Receipts 2,636 16,497 3,982 1,043 24,158Federal Receipts 2 41,305 2,152 79 43,538
Total Receipts 48,497 66,371 7,555 15,526 137,949
Disbursements:Local Assistance Grants 41,393 56,328 1,956 0 99,677Departmental Operations:
Personal Service 5,362 7,431 0 0 12,793Non-Personal Service 1,612 4,478 0 47 6,137
General State Charges 4,823 2,414 0 0 7,237Debt Service 0 0 0 6,449 6,449Capital Projects 0 5 5,735 0 5,740
Total Disbursements 53,190 70,656 7,691 6,496 138,033
Other Financing Sources (Uses):Transfers from Other Funds 12,848 8,727 1,475 6,155 29,205Transfers to Other Funds (8,736) (3,892) (1,547) (15,108) (29,283)Bond and Note Proceeds 0 0 338 0 338
Net Other Financing Sources (Uses) 4,112 4,835 266 (8,953) 260
(581) 550 130 77 176
Designated General Fund Reserves:Reserve for Collective Bargaining (134)
Net Designated General Fund Reserves (134)
CASH FINANCIAL PLAN ALL GOVERNMENTAL FUNDS
FY 2014(millions of dollars)
Excess (Deficiency) of Receipts and Other Financing Sources Over Disbursementsand Other Financing Uses
T-19

Special Capital Debt AllGeneral Revenue Projects Service Funds
Fund Funds Funds Funds Total
Receipts:Taxes 46,645 8,931 1,431 14,934 71,941Miscellaneous Receipts 2,243 16,767 3,813 1,064 23,887Federal Receipts 0 44,571 1,971 79 46,621
Total Receipts 48,888 70,269 7,215 16,077 142,449
Disbursements:Local Assistance Grants 42,877 60,834 1,883 0 105,594Departmental Operations:
Personal Service 5,473 7,655 0 0 13,128Non-Personal Service 1,677 4,520 0 47 6,244
General State Charges 5,168 2,587 0 0 7,755Debt Service 0 0 0 6,568 6,568Capital Projects 0 5 5,572 0 5,577
Total Disbursements 55,195 75,601 7,455 6,615 144,866
Other Financing Sources (Uses):Transfers from Other Funds 13,125 9,057 1,467 5,654 29,303Transfers to Other Funds (9,659) (3,166) (1,530) (15,001) (29,356)Bond and Note Proceeds 0 0 306 0 306
Net Other Financing Sources (Uses) 3,466 5,891 243 (9,347) 253
(2,841) 559 3 115 (2,164)
Designated General Fund Reserves:Reserve for Collective Bargaining 133
Net Designated General Fund Reserves 133
Excess (Deficiency) of Receipts and Other Financing Sources Over Disbursementsand Other Financing Uses
CASH FINANCIAL PLAN ALL GOVERNMENTAL FUNDS
FY 2015(millions of dollars)
T-20

Special Capital Debt AllGeneral Revenue Projects Service Funds
Fund Funds Funds Funds Total
Receipts:Taxes 48,566 9,189 1,447 15,495 74,697Miscellaneous Receipts 2,336 16,812 3,809 1,062 24,019Federal Receipts 0 46,718 1,656 79 48,453
Total Receipts 50,902 72,719 6,912 16,636 147,169
Disbursements:Local Assistance Grants 45,107 63,421 1,552 0 110,080Departmental Operations:
Personal Service 5,731 7,941 0 0 13,672Non-Personal Service 1,793 4,516 0 47 6,356
General State Charges 5,459 2,752 0 0 8,211Debt Service 0 0 0 6,705 6,705Capital Projects 0 5 5,333 0 5,338
Total Disbursements 58,090 78,635 6,885 6,752 150,362
Other Financing Sources (Uses):Transfers from Other Funds 13,524 9,457 1,362 5,411 29,754Transfers to Other Funds (9,925) (3,042) (1,538) (15,310) (29,815)Bond and Note Proceeds 0 0 121 0 121
Net Other Financing Sources (Uses) 3,599 6,415 (55) (9,899) 60
(3,589) 499 (28) (15) (3,133)
Designated General Fund Reserves:Reserve for Collective Bargaining 132
Net Designated General Fund Reserves 132
CASH FINANCIAL PLAN ALL GOVERNMENTAL FUNDS
FY 2016(millions of dollars)
Excess (Deficiency) of Receipts and Other Financing Sources Over Disbursementsand Other Financing Uses
T-21

FY 2012 FY 2013 Annual AnnualCurrent Proposed $ Change % Change
Opening Fund Balance 3,812 3,869 57
Receipts:Taxes 64,532 66,533 2,001 3.1%Miscellaneous Receipts 23,832 24,255 423 1.8%Federal Receipts 43,942 41,936 (2,006) -4.6%
Total Receipts 132,306 132,724 418 0.3%
Disbursements:Local Assistance Grants 95,822 95,185 (637) -0.7%Departmental Operations:
Personal Service 12,519 12,566 47 0.4%Non-Personal Service 6,170 6,054 (116) -1.9%
General State Charges 6,833 6,702 (131) -1.9%Debt Service 5,872 6,149 277 4.7%Capital Projects 5,519 5,854 335 6.1%
Total Disbursements 132,735 132,510 (225) -0.2%
Other Financing Sources (Uses):Transfers from Other Funds 26,797 27,572 775 2.9%Transfers to Other Funds (26,786) (27,581) (795) 3.0%Bond and Note Proceeds 475 400 (75) -15.8%
Net Other Financing Sources (Uses) 486 391 (95) -19.5%
57 605 548
CASH FINANCIAL PLAN ALL GOVERNMENTAL FUNDS
FY 2012 and FY 2013(millions of dollars)
Excess (Deficiency) of Receipts and Other Financing Sources Over Disbursementsand Other Financing Uses 57 605 548
Closing Fund Balance 3,869 4,474 605
Designated General Fund Reserves:Reserve for Collective Bargaining (284) (174) 110 -38.7%Reserve for Community Projects Fund 85 51 (34) -40.0%Rainy Day Fund (100) 0 100 -100.0%
Net Designated General Fund Reserves (299) (123) 176 -58.9%
and Other Financing Uses
T-22

Special Capital DebtGeneral Revenue Projects Service
Fund Funds Funds Funds Total
Taxes: Withholdings 31,197 0 0 0 31,197 Estimated Payments 11,530 0 0 0 11,530 Final Payments 2,125 0 0 0 2,125 Other Payments 1,039 0 0 0 1,039 Gross Collections 45,891 0 0 0 45,891 State/City Offset (358) 0 0 0 (358) Refunds (6,869) 0 0 0 (6,869) Reported Tax Collections 38,664 0 0 0 38,664 STAR (Dedicated Deposits) (3,293) 3,293 0 0 0 RBTF (Dedicated Transfers) (9,666) 0 0 9,666 0 Personal Income Tax 25,705 3,293 0 9,666 38,664
Sales and Use Tax 11,235 762 0 0 11,997 Cigarette and Tobacco Taxes 476 1,189 0 0 1,665 Motor Fuel Tax 0 105 396 0 501 Alcoholic Beverage Taxes 233 0 0 0 233 Highway Use Tax 0 0 134 0 134 Auto Rental Tax 0 39 65 0 104 Taxicab Surcharge 0 85 0 0 85 Gross Utility Taxes and Fees 11,944 2,180 595 0 14,719 LGAC Sales Tax (Dedicated Transfers) (2,809) 0 0 2,809 0 User Taxes and Fees 9,135 2,180 595 2,809 14,719
Corporation Franchise Tax 2,825 406 0 0 3,231 Corporation and Utilities Tax 626 174 15 0 815 Insurance Taxes 1,274 139 0 0 1,413 Bank Tax 1,143 231 0 0 1,374 Petroleum Business Tax 0 484 604 0 1,088 Business Taxes 5,868 1,434 619 0 7,921
Estate Tax 1,195 0 0 0 1,195 Real Estate Transfer Tax 620 0 0 0 620 Gift Tax 0 0 0 0 0 Real Property Gains Tax 0 0 0 0 0 Pari-Mutuel Taxes 16 0 0 0 16 Other Taxes 1 0 0 0 1 Gross Other Taxes 1,832 0 0 0 1,832 Real Estate Transfer Tax (Dedicated) (620) 0 119 501 0 Other Taxes 1,212 0 119 501 1,832
Payroll Tax 0 1,396 0 0 1,396
Total Taxes 41,920 8,303 1,333 12,976 64,532
Licenses, Fees, Etc. 620 0 0 0 620Abandoned Property 755 0 0 0 755Motor Vehicle Fees 112 486 802 0 1,400ABC License Fee 55 0 0 0 55Reimbursements 222 0 0 0 222Investment Income 10 0 0 0 10Other Transactions 1,470 14,793 3,558 949 20,770Miscellaneous Receipts 3,244 15,279 4,360 949 23,832
Federal Grants 60 41,601 2,202 79 43,942
Total 45,224 65,183 7,895 14,004 132,306
CASH RECEIPTS ALL GOVERNMENTAL FUNDS
FY 2012(millions of dollars)
T-23

Special Capital DebtGeneral Revenue Projects Service
Fund Funds Funds Funds Total
Taxes: Withholdings 32,598 0 0 0 32,598 Estimated Payments 12,212 0 0 0 12,212 Final Payments 2,203 0 0 0 2,203 Other Payments 1,104 0 0 0 1,104 Gross Collections 48,117 0 0 0 48,117 State/City Offset (298) 0 0 0 (298) Refunds (7,508) 0 0 0 (7,508) Reported Tax Collections 40,311 0 0 0 40,311 STAR (Dedicated Deposits) (3,322) 3,322 0 0 0 RBTF (Dedicated Transfers) (10,078) 0 0 10,078 0 Personal Income Tax 26,911 3,322 0 10,078 40,311
Sales and Use Tax 11,455 791 0 0 12,246 Cigarette and Tobacco Taxes 511 1,222 0 0 1,733 Motor Fuel Tax 0 108 407 0 515 Alcoholic Beverage Taxe 238 0 0 0 238 Highway Use Tax 0 0 147 0 147 Auto Rental Tax 0 41 68 0 109 Taxicab Surcharge 0 88 0 0 88 Gross Utility Taxes and Fees 12,204 2,250 622 0 15,076 LGAC Sales Tax (Dedicated Transfers) (2,863) 0 0 2,863 0 User Taxes and Fees 9,341 2,250 622 2,863 15,076
Corporation Franchise Tax 2,844 455 0 0 3,299 Corporation and Utilities Tax 682 180 15 0 877 Insurance Taxes 1,322 141 0 0 1,463 Bank Tax 1,129 222 0 0 1,351 Petroleum Business Tax 0 517 645 0 1,162 Business Taxes 5,977 1,515 660 0 8,152
Estate Tax 1,127 0 0 0 1,127 Real Estate Transfer Tax 690 0 0 0 690 Gift Tax 0 0 0 0 0 Real Property Gains Tax 0 0 0 0 0 Pari-Mutuel Taxes 16 0 0 0 16 Other Taxes 1 0 0 0 1 Gross Other Taxes 1,834 0 0 0 1,834 Real Estate Transfer Tax (Dedicated) (690) 0 119 571 0 Other Taxes 1,144 0 119 571 1,834
Payroll Tax 0 1,160 0 0 1,160
Total Taxes 43,373 8,247 1,401 13,512 66,533
Licenses, Fees, Etc. 661 0 0 0 661Abandoned Property 785 0 0 0 785Motor Vehicle Fees 99 482 799 0 1,380ABC License Fee 51 0 0 0 51Reimbursements 202 0 0 0 202Investment Income 10 0 0 0 10Other Transactions 1,261 15,603 3,306 996 21,166Miscellaneous Receipts 3,069 16,085 4,105 996 24,255
Federal Grants 60 39,712 2,085 79 41,936
Total 46,502 64,044 7,591 14,587 132,724
CASH RECEIPTS ALL GOVERNMENTAL FUNDS
FY 2013(millions of dollars)
T-24

Special Capital DebtGeneral Revenue Projects Service
Fund Funds Funds Funds Total
Taxes: Withholdings 34,667 0 0 0 34,667 Estimated Payments 13,063 0 0 0 13,063 Final Payments 2,170 0 0 0 2,170 Other Payments 1,136 0 0 0 1,136 Gross Collections 51,036 0 0 0 51,036 State/City Offset (198) 0 0 0 (198) Refunds (7,760) 0 0 0 (7,760) Reported Tax Collections 43,078 0 0 0 43,078 STAR (Dedicated Deposits) (3,505) 3,506 0 0 1 RBTF (Dedicated Transfers) (10,770) 0 0 10,770 0 Personal Income Tax 28,803 3,506 0 10,770 43,079
Sales and Use Tax 11,937 822 0 0 12,759 Cigarette and Tobacco Taxes 510 1,199 0 0 1,709 Motor Fuel Tax 0 109 407 0 516 Alcoholic Beverage Taxes 242 0 0 0 242 Highway Use Tax 0 0 142 0 142 Auto Rental Tax 0 43 71 0 114 Taxicab Surcharge 0 90 0 0 90 Gross Utility Taxes and Fees 12,689 2,263 620 0 15,572 LGAC Sales Tax (Dedicated Transfers) (2,983) 0 0 2,983 0 User Taxes and Fees 9,706 2,263 620 2,983 15,572
Corporation Franchise Tax 3,024 502 0 0 3,526 Corporation and Utilities Tax 706 183 15 0 904 Insurance Taxes 1,383 150 0 0 1,533 Bank Tax 1,100 189 0 0 1,289 Petroleum Business Tax 0 534 667 0 1,201 Business Taxes 6,213 1,558 682 0 8,453
Estate Tax 1,120 0 0 0 1,120 Real Estate Transfer Tax 770 0 0 0 770 Gift Tax 0 0 0 0 0 Real Property Gains Tax 0 0 0 0 0 Pari-Mutuel Taxes 16 0 0 0 16 Other Taxes 1 0 0 0 1 Gross Other Taxes 1,907 0 0 0 1,907 Real Estate Transfer Tax (Dedicated) (770) 0 119 651 0 Other Taxes 1,137 0 119 651 1,907
Payroll Tax 0 1,242 0 0 1,242
Total Taxes 45,859 8,569 1,421 14,404 70,253
Licenses, Fees, Etc. 606 0 0 0 606Abandoned Property 670 0 0 0 670Motor Vehicle Fees 26 481 811 0 1,318ABC License Fee 50 0 0 0 50Reimbursements 202 0 0 0 202Investment Income 30 0 0 0 30Other Transactions 1,052 16,016 3,171 1,043 21,282Miscellaneous Receipts 2,636 16,497 3,982 1,043 24,158
Federal Grants 2 41,305 2,152 79 43,538
Total 48,497 66,371 7,555 15,526 137,949
CASH RECEIPTS ALL GOVERNMENTAL FUNDS
FY 2014(millions of dollars)
T-25

Special Capital DebtGeneral Revenue Projects Service
Fund Funds Funds Funds Total
Taxes: Withholdings 36,032 0 0 0 36,032 Estimated Payments 13,702 0 0 0 13,702 Final Payments 2,167 0 0 0 2,167 Other Payments 1,238 0 0 0 1,238 Gross Collections 53,139 0 0 0 53,139 State/City Offset (148) 0 0 0 (148) Refunds (8,631) 0 0 0 (8,631) Reported Tax Collections 44,360 0 0 0 44,360 STAR (Dedicated Deposits) (3,688) 3,688 0 0 0 RBTF (Dedicated Transfers) (11,090) 0 0 11,090 0 Personal Income Tax 29,582 3,688 0 11,090 44,360
Sales and Use Tax 12,496 852 0 0 13,348 Cigarette and Tobacco Taxes 503 1,177 0 0 1,680 Motor Fuel Tax 0 109 410 0 519 Alcoholic Beverage Taxes 247 0 0 0 247 Highway Use Tax 0 0 144 0 144 Auto Rental Tax 0 45 74 0 119 Taxicab Surcharge 0 90 0 0 90 Gross Utility Taxes and Fees 13,246 2,273 628 0 16,147 LGAC Sales Tax (Dedicated Transfers) (3,123) 0 0 3,123 0 User Taxes and Fees 10,123 2,273 628 3,123 16,147
Corporation Franchise Tax 2,335 551 0 0 2,886 Corporation and Utilities Tax 730 185 15 0 930 Insurance Taxes 1,422 157 0 0 1,579 Bank Tax 1,231 211 0 0 1,442 Petroleum Business Tax 0 537 669 0 1,206 Business Taxes 5,718 1,641 684 0 8,043
Estate Tax 1,205 0 0 0 1,205 Real Estate Transfer Tax 840 0 0 0 840 Gift Tax 0 0 0 0 0 Real Property Gains Tax 0 0 0 0 0 Pari-Mutuel Taxes 16 0 0 0 16 Other Taxes 1 0 0 0 1 Gross Other Taxes 2,062 0 0 0 2,062 Real Estate Transfer Tax (Dedicated) (840) 0 119 721 0 Other Taxes 1,222 0 119 721 2,062
Payroll Tax 0 1,329 0 0 1,329
Total Taxes 46,645 8,931 1,431 14,934 71,941
Licenses, Fees, Etc. 594 0 0 0 594Abandoned Property 655 0 0 0 655Motor Vehicle Fees 26 481 811 0 1,318ABC License Fee 50 0 0 0 50Reimbursements 202 0 0 0 202Investment Income 30 0 0 0 30Other Transactions 686 16,286 3,002 1,064 21,038Miscellaneous Receipts 2,243 16,767 3,813 1,064 23,887
Federal Grants 0 44,571 1,971 79 46,621
Total 48,888 70,269 7,215 16,077 142,449
CASH RECEIPTS ALL GOVERNMENTAL FUNDS
FY 2015(millions of dollars)
T-26

Special Capital DebtGeneral Revenue Projects Service
Fund Funds Funds Funds Total
Taxes: Withholdings 37,947 0 0 0 37,947 Estimated Payments 13,560 0 0 0 13,560 Final Payments 2,267 0 0 0 2,267 Other Payments 1,288 0 0 0 1,288 Gross Collections 55,062 0 0 0 55,062 State/City Offset (148) 0 0 0 (148) Refunds (9,106) 0 0 0 (9,106) Reported Tax Collections 45,808 0 0 0 45,808 STAR (Dedicated Deposits) (3,790) 3,790 0 0 0 RBTF (Dedicated Transfers) (11,452) 0 0 11,452 0 Personal Income Tax 30,566 3,790 0 11,452 45,808
Sales and Use Tax 12,992 882 0 0 13,874 Cigarette and Tobacco Taxes 495 1,155 0 0 1,650 Motor Fuel Tax 0 110 412 0 522 Alcoholic Beverage Taxes 247 0 0 0 247 Highway Use Tax 0 0 152 0 152 Auto Rental Tax 0 47 77 0 124 Taxicab Surcharge 0 90 0 0 90 Gross Utility Taxes and Fees 13,734 2,284 641 0 16,659 LGAC Sales Tax (Dedicated Transfers) (3,247) 0 0 3,247 0 User Taxes and Fees 10,487 2,284 641 3,247 16,659
Corporation Franchise Tax 2,736 579 0 0 3,315 Corporation and Utilities Tax 757 191 15 0 963 Insurance Taxes 1,491 163 0 0 1,654 Bank Tax 1,307 225 0 0 1,532 Petroleum Business Tax 0 539 672 0 1,211 Business Taxes 6,291 1,697 687 0 8,675
Estate Tax 1,205 0 0 0 1,205 Real Estate Transfer Tax 915 0 0 0 915 Gift Tax 0 0 0 0 0 Real Property Gains Tax 0 0 0 0 0 Pari-Mutuel Taxes 16 0 0 0 16 Other Taxes 1 0 0 0 1 Gross Other Taxes 2,137 0 0 0 2,137 Real Estate Transfer Tax (Dedicated) (915) 0 119 796 0 Other Taxes 1,222 0 119 796 2,137
Payroll Tax 0 1,418 0 0 1,418
Total Taxes 48,566 9,189 1,447 15,495 74,697
Licenses, Fees, Etc. 585 0 0 0 585Abandoned Property 655 0 0 0 655Motor Vehicle Fees 26 481 811 0 1,318ABC License Fee 50 0 0 0 50Reimbursements 202 0 0 0 202Investment Income 30 0 0 0 30Other Transactions 788 16,331 2,998 1,062 21,179Miscellaneous Receipts 2,336 16,812 3,809 1,062 24,019
Federal Grants 0 46,718 1,656 79 48,453
Total 50,902 72,719 6,912 16,636 147,169
CASH RECEIPTS ALL GOVERNMENTAL FUNDS
FY 2016(millions of dollars)
T-27

FY 2012 FY 2013 Annual AnnualCurrent Proposed $ Change % Change
Taxes: Withholdings 31,197 32,598 1,401 4.5% Estimated Payments 11,530 12,212 682 5.9% Final Payments 2,125 2,203 78 3.7% Other Payments 1,039 1,104 65 6.3% Gross Collections 45,891 48,117 2,226 4.9% State/City Offset (358) (298) 60 -16.8% Refunds (6,869) (7,508) (639) 9.3% Reported Tax Collections 38,664 40,311 1,647 4.3% STAR (Dedicated Deposits) 0 0 0 #DIV/0! RBTF (Dedicated Transfers) 0 0 0 #DIV/0! Personal Income Tax 38,664 40,311 1,647 4.3%
Sales and Use Tax 11,997 12,246 249 2.1% Cigarette and Tobacco Taxes 1,665 1,733 68 4.1% Motor Fuel Tax 501 515 14 2.8% Alcoholic Beverage Taxes 233 238 5 2.1% Highway Use Tax 134 147 13 9.7% Auto Rental Tax 104 109 5 4.8% Taxicab Surcharge 85 88 3 3.5% Gross Utility Taxes and Fees 14,719 15,076 357 2.4% LGAC Sales Tax (Dedicated Transfers) 0 0 0 #DIV/0! User Taxes and Fees 14,719 15,076 357 2.4%
Corporation Franchise Tax 3,231 3,299 68 2.1% Corporation and Utilities Tax 815 877 62 7.6% Insurance Taxes 1,413 1,463 50 3.5% Bank Tax 1,374 1,351 (23) -1.7% Petroleum Business Tax 1,088 1,162 74 6.8% Business Taxes 7,921 8,152 231 2.9%
Estate Tax 1,195 1,127 (68) -5.7% Real Estate Transfer Tax 620 690 70 11.3% Gift Tax 0 0 0 #DIV/0! Real Property Gains Tax 0 0 0 #DIV/0! Pari-Mutuel Taxes 16 16 0 0.0% Other Taxes 1 1 0 0.0% Gross Other Taxes 1,832 1,834 2 0.1% Real Estate Transfer Tax (Dedicated) 0 0 0 #DIV/0! Other Taxes 1,832 1,834 2 0.1%
Payroll Tax 1,396 1,160 (236) -16.9%
Total Taxes 64,532 66,533 2,001 3.1%
Licenses, Fees, Etc. 620 661 41 6.6%Abandoned Property 755 785 30 4.0%Motor Vehicle Fees 1,400 1,380 (20) -1.4%ABC License Fee 55 51 (4) -7.3%Reimbursements 222 202 (20) -9.0%Investment Income 10 10 0 0.0%Other Transactions 20,770 21,166 396 1.9%Miscellaneous Receipts 23,832 24,255 423 1.8%
Federal Grants 43,942 41,936 (2,006) -4.6%
Total 132,306 132,724 418 0.3%
CURRENT STATE RECEIPTS ALL GOVERNMENTAL FUNDS
FY 2012 and FY 2013(millions of dollars)
T-28

State Federal Total
Opening Fund Balance 2,139 10 2,149
Receipts:Taxes 8,303 0 8,303Miscellaneous Receipts 15,147 132 15,279Federal Receipts 1 41,600 41,601
Total Receipts 23,451 41,732 65,183
Disbursements:Local Assistance Grants 19,033 35,710 54,743Departmental Operations: Personal Service 6,106 643 6,749 Non-Personal Service 3,355 959 4,314General State Charges 1,829 297 2,126Debt Service 0 0 0Capital Projects 5 0 5
Total Disbursements 30,328 37,609 67,937
Other Financing Sources (Uses):Transfers from Other Funds 7,251 1 7,252Transfers to Other Funds (613) (4,125) (4,738)Bond and Note Proceeds 0 0 0
Net Other Financing Sources (Uses) 6,638 (4,124) 2,514
Excess (Deficiency) of Receipts and Other Financing Sources Over Disbursementsand Other Financing Uses (239) (1) (240)
Closing Fund Balance 1,900 9 1,909
SPECIAL REVENUE FUNDSFY 2012
(millions of dollars)
CASH FINANCIAL PLAN
T-29
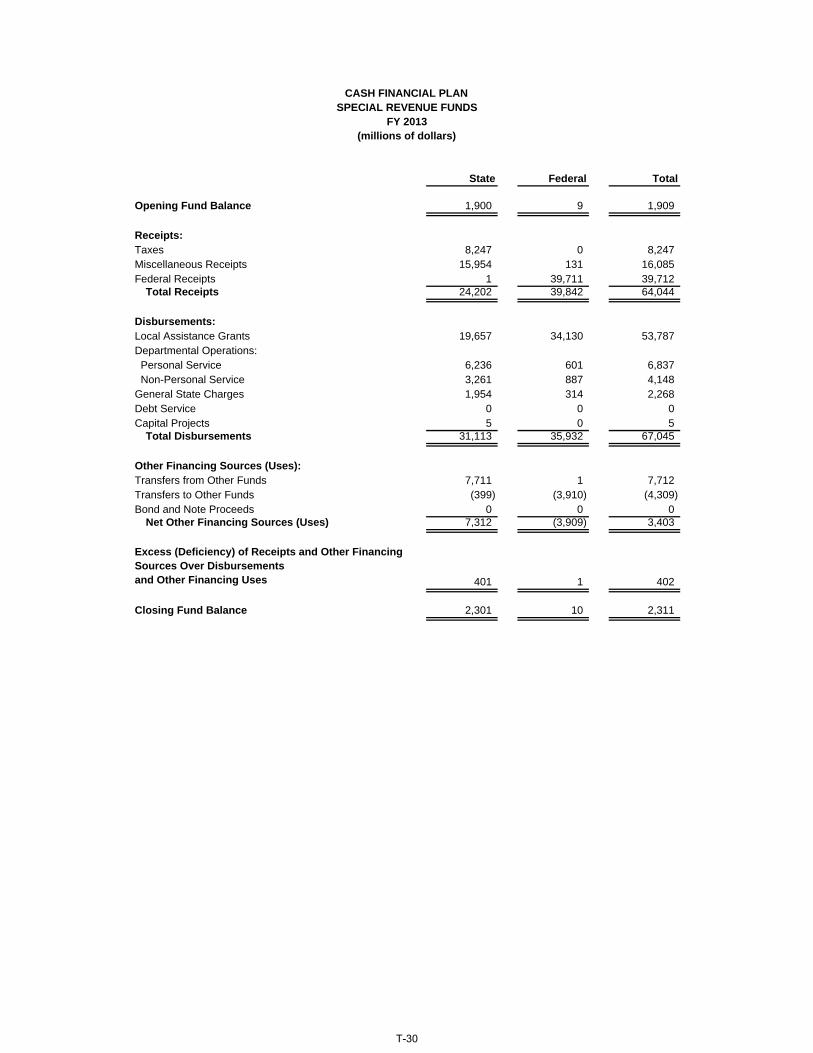
State Federal Total
Opening Fund Balance 1,900 9 1,909
Receipts:Taxes 8,247 0 8,247Miscellaneous Receipts 15,954 131 16,085Federal Receipts 1 39,711 39,712
Total Receipts 24,202 39,842 64,044
Disbursements:Local Assistance Grants 19,657 34,130 53,787Departmental Operations: Personal Service 6,236 601 6,837 Non-Personal Service 3,261 887 4,148General State Charges 1,954 314 2,268Debt Service 0 0 0Capital Projects 5 0 5
Total Disbursements 31,113 35,932 67,045
Other Financing Sources (Uses):Transfers from Other Funds 7,711 1 7,712Transfers to Other Funds (399) (3,910) (4,309)Bond and Note Proceeds 0 0 0
Net Other Financing Sources (Uses) 7,312 (3,909) 3,403
Excess (Deficiency) of Receipts and Other Financing Sources Over Disbursementsand Other Financing Uses 401 1 402
Closing Fund Balance 2,301 10 2,311
SPECIAL REVENUE FUNDSFY 2013
(millions of dollars)
CASH FINANCIAL PLAN
T-30

State Federal Total
Opening Fund Balance 2,301 10 2,311
Receipts:Taxes 8,569 0 8,569Miscellaneous Receipts 16,366 131 16,497Federal Receipts 1 41,304 41,305
Total Receipts 24,936 41,435 66,371
Disbursements:Local Assistance Grants 20,442 35,886 56,328Departmental Operations: Personal Service 6,837 594 7,431 Non-Personal Service 3,527 951 4,478General State Charges 2,094 320 2,414Debt Service 0 0 0Capital Projects 5 0 5
Total Disbursements 32,905 37,751 70,656
Other Financing Sources (Uses):Transfers from Other Funds 8,726 1 8,727Transfers to Other Funds (208) (3,684) (3,892)Bond and Note Proceeds 0 0 0
Net Other Financing Sources (Uses) 8,518 (3,683) 4,835
Excess (Deficiency) of Receipts and Other Financing Sources Over Disbursementsand Other Financing Uses 549 1 550
Closing Fund Balance 2,850 11 2,861
CASH FINANCIAL PLAN SPECIAL REVENUE FUNDS
FY 2014(millions of dollars)
T-31

State Federal Total
Opening Fund Balance 2,850 11 2,861
Receipts:Taxes 8,931 0 8,931Miscellaneous Receipts 16,636 131 16,767Federal Receipts 1 44,570 44,571
Total Receipts 25,568 44,701 70,269
Disbursements:Local Assistance Grants 21,064 39,770 60,834Departmental Operations: Personal Service 7,049 606 7,655 Non-Personal Service 3,627 893 4,520General State Charges 2,260 327 2,587Debt Service 0 0 0Capital Projects 5 0 5
Total Disbursements 34,005 41,596 75,601
Other Financing Sources (Uses):Transfers from Other Funds 9,056 1 9,057Transfers to Other Funds (61) (3,105) (3,166)Bond and Note Proceeds 0 0 0
Net Other Financing Sources (Uses) 8,995 (3,104) 5,891
Excess (Deficiency) of Receipts and Other Financing Sources Over Disbursementsand Other Financing Uses 558 1 559
Closing Fund Balance 3,408 12 3,420
CASH FINANCIAL PLAN SPECIAL REVENUE FUNDS
FY 2015(millions of dollars)
T-32
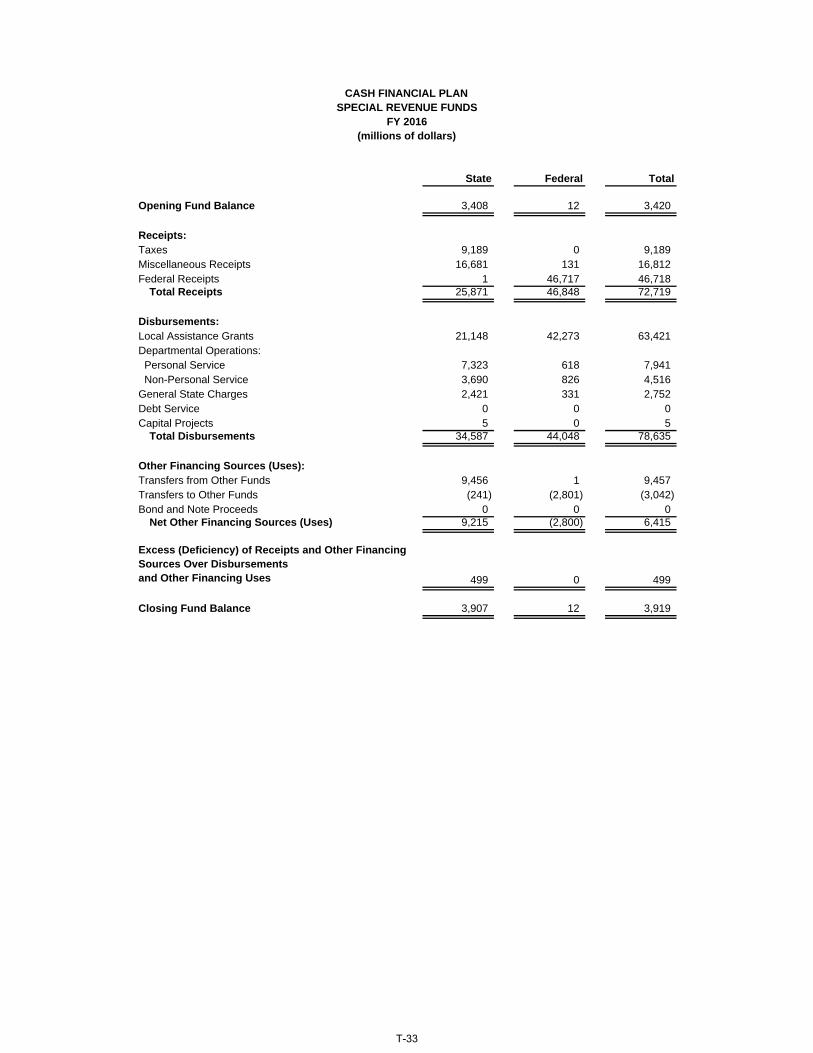
State Federal Total
Opening Fund Balance 3,408 12 3,420
Receipts:Taxes 9,189 0 9,189Miscellaneous Receipts 16,681 131 16,812Federal Receipts 1 46,717 46,718
Total Receipts 25,871 46,848 72,719
Disbursements:Local Assistance Grants 21,148 42,273 63,421Departmental Operations: Personal Service 7,323 618 7,941 Non-Personal Service 3,690 826 4,516General State Charges 2,421 331 2,752Debt Service 0 0 0Capital Projects 5 0 5
Total Disbursements 34,587 44,048 78,635
Other Financing Sources (Uses):Transfers from Other Funds 9,456 1 9,457Transfers to Other Funds (241) (2,801) (3,042)Bond and Note Proceeds 0 0 0
Net Other Financing Sources (Uses) 9,215 (2,800) 6,415
Excess (Deficiency) of Receipts and Other Financing Sources Over Disbursementsand Other Financing Uses 499 0 499
Closing Fund Balance 3,907 12 3,919
CASH FINANCIAL PLAN SPECIAL REVENUE FUNDS
FY 2016(millions of dollars)
T-33

FY2012 FY 2013 Annual AnnualCurrent Proposed $ Change % Change
Opening Fund Balance 2,149 1,909 (240) -11.2%
Receipts:Taxes 8,303 8,247 (56) -0.7%Miscellaneous Receipts 15,279 16,085 806 5.3%Federal Receipts 41,601 39,712 (1,889) -4.5%
Total receipts 65,183 64,044 (1,139) -1.7%
Disbursements:Local Assistance Grants 54,743 53,787 (956) -1.7%Departmental Operations:
Personal Service 6,749 6,837 88 1.3%Non-Personal Service 4,314 4,148 (166) -3.8%
General State Charges 2,126 2,268 142 6.7%Debt Service 0 0 0 #DIV/0!Capital Projects 5 5 0 0.0%
Total Disbursements 67,937 67,045 (892) -1.3%
Other Financing Sources (Uses):Transfers from Other Funds 7,252 7,712 460 6.3%Transfers to Other Funds (4,738) (4,309) 429 -9.1%Bond and Proceed Notes 0 0 0 #DIV/0!
Net Other Financing Sources (Uses) 2,514 3,403 889 35.4%
(240) 402 642 -267.5%
Closing Fund Balance 1,909 2,311 402 21.1%
CASH FINANCIAL PLAN SPECIAL REVENUE FUNDS
FY 2012 and FY 2013(millions of dollars)
Excess (Deficiency) of Receipts and Other Financing Sources Over Disbursementsand Other Financing Uses
T-34
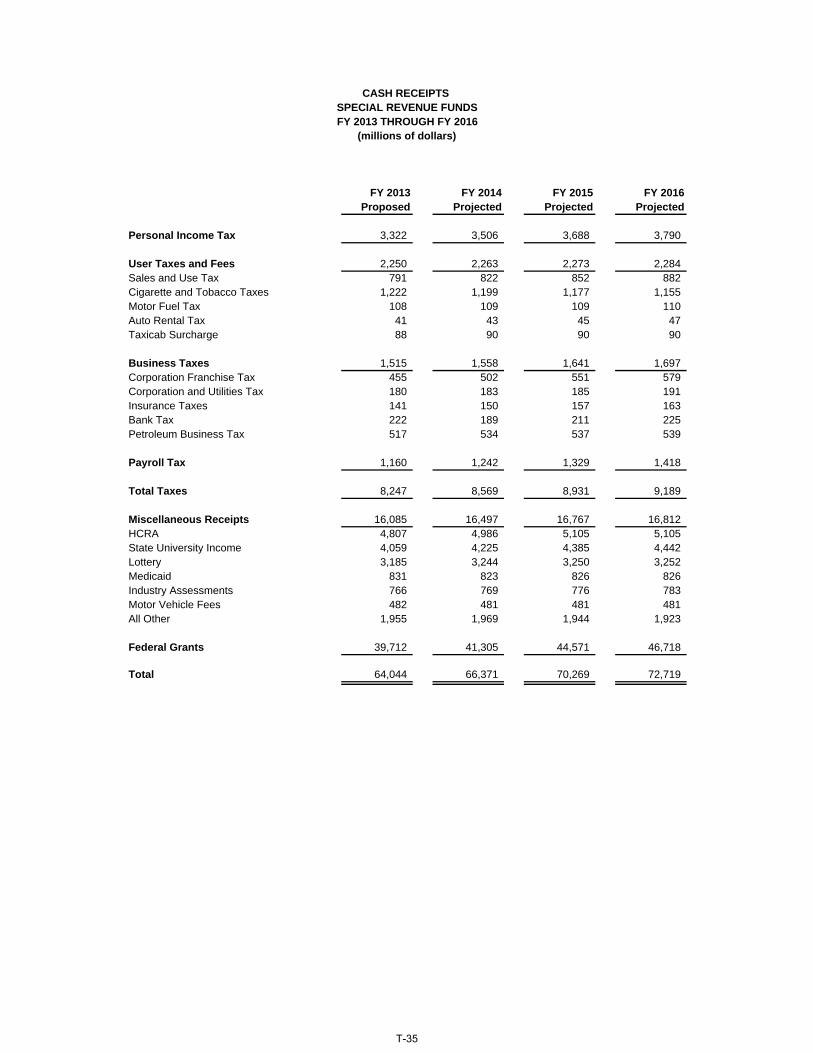
FY 2013 FY 2014 FY 2015 FY 2016Proposed Projected Projected Projected
Personal Income Tax 3,322 3,506 3,688 3,790
User Taxes and Fees 2,250 2,263 2,273 2,284Sales and Use Tax 791 822 852 882Cigarette and Tobacco Taxes 1,222 1,199 1,177 1,155Motor Fuel Tax 108 109 109 110Auto Rental Tax 41 43 45 47Taxicab Surcharge 88 90 90 90
Business Taxes 1,515 1,558 1,641 1,697Corporation Franchise Tax 455 502 551 579Corporation and Utilities Tax 180 183 185 191Insurance Taxes 141 150 157 163Bank Tax 222 189 211 225Petroleum Business Tax 517 534 537 539
Payroll Tax 1,160 1,242 1,329 1,418
Total Taxes 8,247 8,569 8,931 9,189
Miscellaneous Receipts 16,085 16,497 16,767 16,812HCRA 4,807 4,986 5,105 5,105State University Income 4,059 4,225 4,385 4,442Lottery 3,185 3,244 3,250 3,252Medicaid 831 823 826 826Industry Assessments 766 769 776 783Motor Vehicle Fees 482 481 481 481All Other 1,955 1,969 1,944 1,923
Federal Grants 39,712 41,305 44,571 46,718
Total 64,044 66,371 70,269 72,719
CASH RECEIPTS SPECIAL REVENUE FUNDSFY 2013 THROUGH FY 2016
(millions of dollars)
T-35

FY 2012 FY 2013 Annual AnnualCurrent Proposed $ Change % Change
Personal Income Tax 3,293 3,322 29 0.9%
User Taxes and Fees 2,180 2,250 70 3.2%Sales and Use Tax 762 791 29 3.8%Cigarette and Tobacco Taxes 1,189 1,222 33 2.8%Motor Fuel Tax 105 108 3 2.9%Auto Rental Tax 39 41 2 5.1%Taxicab Surcharge 85 88 3 3.5%
Business Taxes 1,434 1,515 81 5.6%Corporation Franchise Tax 406 455 49 12.1%Corporation and Utilities Tax 174 180 6 3.4%Insurance Taxes 139 141 2 1.4%Bank Tax 231 222 (9) -3.9%Petroleum Business Tax 484 517 33 6.8%
Payroll Tax 1,396 1,160 (236) -16.9%
Total Taxes 8,303 8,247 (56) -0.7%
Miscellaneous Receipts 15,279 16,085 806 5.3%HCRA 4,170 4,807 637 15.3%State University Income 3,768 4,059 291 7.7%Lottery 2,934 3,185 251 8.6%Medicaid 870 831 (39) -4.5%Industry Assessments 753 766 13 1.7%Motor Vehicle Fees 486 482 (4) -0.8%All Other 2,298 1,955 (343) -14.9%
Federal Grants 41,601 39,712 (1,889) -4.5%
Total 65,183 64,044 (1,139) -1.7%
CASH RECEIPTS SPECIAL REVENUE FUNDS
FY 2012 and FY 2013(millions of dollars)
T-36
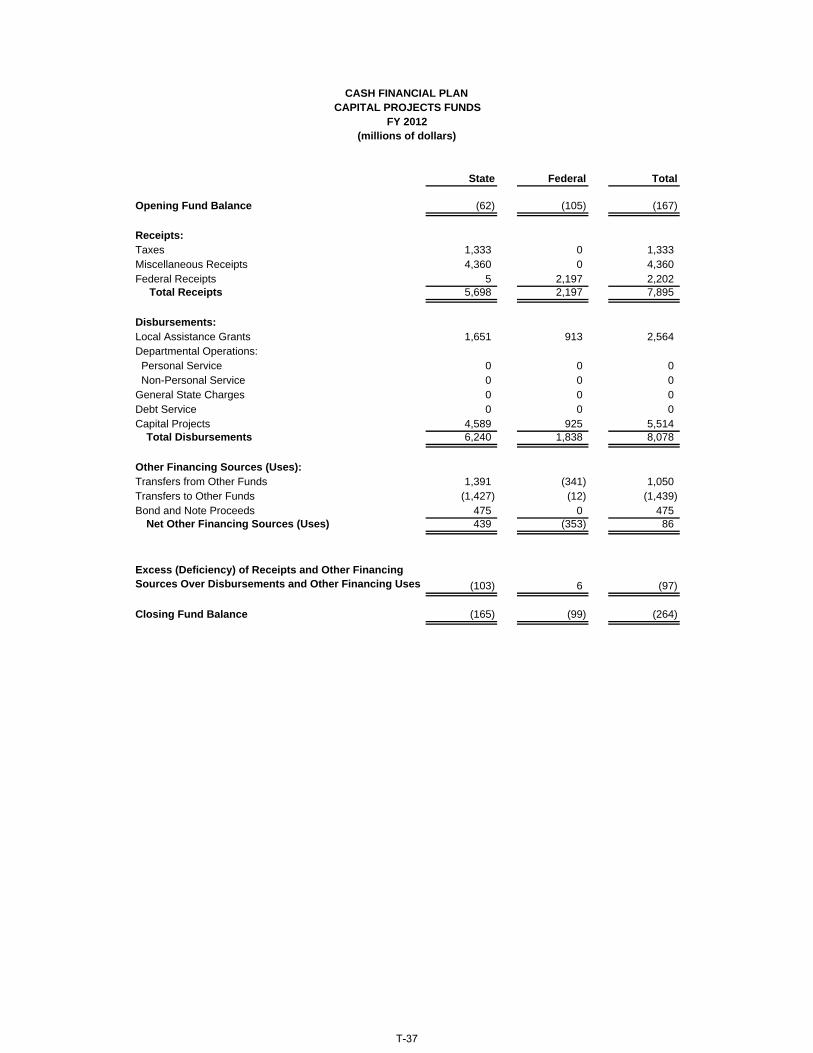
State Federal Total
Opening Fund Balance (62) (105) (167)
Receipts:Taxes 1,333 0 1,333Miscellaneous Receipts 4,360 0 4,360Federal Receipts 5 2,197 2,202
Total Receipts 5,698 2,197 7,895
Disbursements:Local Assistance Grants 1,651 913 2,564Departmental Operations: Personal Service 0 0 0 Non-Personal Service 0 0 0General State Charges 0 0 0Debt Service 0 0 0Capital Projects 4,589 925 5,514
Total Disbursements 6,240 1,838 8,078
Other Financing Sources (Uses):Transfers from Other Funds 1,391 (341) 1,050Transfers to Other Funds (1,427) (12) (1,439)Bond and Note Proceeds 475 0 475
Net Other Financing Sources (Uses) 439 (353) 86
Excess (Deficiency) of Receipts and Other Financing Sources Over Disbursements and Other Financing Uses (103) 6 (97)
Closing Fund Balance (165) (99) (264)
CAPITAL PROJECTS FUNDSFY 2012
(millions of dollars)
CASH FINANCIAL PLAN
T-37

State Federal Total
Opening Fund Balance (165) (99) (264)
Receipts:Taxes 1,401 0 1,401Miscellaneous Receipts 4,105 0 4,105Federal Receipts 5 2,080 2,085
Total Receipts 5,511 2,080 7,591
Disbursements:Local Assistance Grants 1,243 752 1,995Departmental Operations: Personal Service 0 0 0 Non-Personal Service 0 0 0General State Charges 0 0 0Debt Service 0 0 0Capital Projects 4,818 1,031 5,849
Total Disbursements 6,061 1,783 7,844
Other Financing Sources (Uses):Transfers from Other Funds 1,661 (309) 1,352Transfers to Other Funds (1,485) (11) (1,496)Bond and Note Proceeds 400 0 400
Net Other Financing Sources (Uses) 576 (320) 256
Excess (Deficiency) of Receipts and Other Financing Sources Over Disbursements and Other Financing Uses 26 (23) 3
Closing Fund Balance (139) (122) (261)
CAPITAL PROJECTS FUNDSFY 2013
(millions of dollars)
CASH FINANCIAL PLAN
T-38

State Federal Total
Opening Fund Balance (139) (122) (261)
Receipts:Taxes 1,421 0 1,421Miscellaneous Receipts 3,982 0 3,982Federal Receipts 5 2,147 2,152
Total Receipts 5,408 2,147 7,555
Disbursements:Local Assistance Grants 1,249 707 1,956Departmental Operations: Personal Service 0 0 0 Non-Personal Service 0 0 0General State Charges 0 0 0Debt Service 0 0 0Capital Projects 4,652 1,083 5,735
Total Disbursements 5,901 1,790 7,691
Other Financing Sources (Uses):Transfers from Other Funds 1,789 (314) 1,475Transfers to Other Funds (1,535) (12) (1,547)Bond and Note Proceeds 338 0 338
Net Other Financing Sources (Uses) 592 (326) 266
Excess (Deficiency) of Receipts and Other Financing Sources Over Disbursements and Other Financing Uses 99 31 130
Closing Fund Balance (40) (91) (131)
CASH FINANCIAL PLAN CAPITAL PROJECTS FUNDS
FY 2014(millions of dollars)
T-39

State Federal Total
Opening Fund Balance (40) (91) (131)
Receipts:Taxes 1,431 0 1,431Miscellaneous Receipts 3,813 0 3,813Federal Receipts 5 1,966 1,971
Total Receipts 5,249 1,966 7,215
Disbursements:Local Assistance Grants 1,185 698 1,883Departmental Operations: Personal Service 0 0 0 Non-Personal Service 0 0 0General State Charges 0 0 0Debt Service 0 0 0Capital Projects 4,668 904 5,572
Total Disbursements 5,853 1,602 7,455
Other Financing Sources (Uses):Transfers from Other Funds 1,775 (308) 1,467Transfers to Other Funds (1,519) (11) (1,530)Bond and Note Proceeds 306 0 306
Net Other Financing Sources (Uses) 562 (319) 243
Excess (Deficiency) of Receipts and Other Financing Sources Over Disbursements and Other Financing Uses (42) 45 3
Closing Fund Balance (82) (46) (128)
CASH FINANCIAL PLAN CAPITAL PROJECTS FUNDS
FY 2015(millions of dollars)
T-40

State Federal Total
Opening Fund Balance (82) (46) (128)
Receipts:Taxes 1,447 0 1,447Miscellaneous Receipts 3,809 0 3,809Federal Receipts 5 1,651 1,656
Total Receipts 5,261 1,651 6,912
Disbursements:Local Assistance Grants 896 656 1,552Departmental Operations: Personal Service 0 0 0 Non-Personal Service 0 0 0General State Charges 0 0 0Debt Service 0 0 0Capital Projects 4,666 667 5,333
Total Disbursements 5,562 1,323 6,885
Other Financing Sources (Uses):Transfers from Other Funds 1,665 (303) 1,362Transfers to Other Funds (1,526) (12) (1,538)Bond and Note Proceeds 121 0 121
Net Other Financing Sources (Uses) 260 (315) (55)
Excess (Deficiency) of Receipts and Other Financing Sources Over Disbursements and Other Financing Uses (41) 13 (28)
Closing Fund Balance (123) (33) (156)
CASH FINANCIAL PLAN CAPITAL PROJECTS FUNDS
FY 2016(millions of dollars)
T-41

FY 2012 FY 2013 Annual AnnualCurrent Proposed $ Change % Change
Opening Fund Balance (167) (264) (97)
Receipts:Taxes 1,333 1,401 68 5.1%Miscellaneous Receipts 4,360 4,105 (255) -5.8%Federal Receipts 2,202 2,085 (117) -5.3%
Total Receipts 7,895 7,591 (304) -3.9%
Disbursements:Local Assistance Grants 2,564 1,995 (569) -22.2%Departmental Operations: Personal Service 0 0 0 -- Non-Personal Service 0 0 0 --General State Charges 0 0 0 --Debt Service 0 0 0 --Capital Projects 5,514 5,849 335 6.1%
Total Disbursements 8,078 7,844 (234) -2.9%
Other financing sources (uses):Transfers From Other Funds 1,050 1,352 302 28.8%Transfers to Other Funds (1,439) (1,496) (57) 4.0%Bond and Note Proceeds 475 400 (75) -15.8%
Net Other Financing Sources (Uses) 86 256 170 197.7%
Excess (Deficiency) of Receipts and Other Financing Sources Over Disbursements and Other Financing Uses (97) 3 100
Closing Fund Balance (264) (261) 3
CASH FINANCIAL PLAN CAPITAL PROJECTS FUNDS
FY 2012 and FY 2013(millions of dollars)
T-42

FY 2013 FY 2014 FY 2015 FY 2016Proposed Projected Projected Projected
User Taxes and Fees 622 620 628 641Motor Fuel Tax 407 407 410 412Highway Use Tax 147 142 144 152Auto Rental Tax 68 71 74 77
Business Taxes 660 682 684 687Corporation and Utilities Tax 15 15 15 15Petroleum Business Tax 645 667 669 672
Other Taxes 119 119 119 119Real Estate Transfer Tax 119 119 119 119
Total Taxes 1,401 1,421 1,431 1,447
Miscellaneous Receipts 4,105 3,982 3,813 3,809Authority Bond Proceeds 3,115 2,978 2,768 2,728State Park Fees 87 60 47 33Environmental Revenues 77 77 77 77Motor Vehicle Fees 799 811 811 811All Other 27 56 110 160
Federal Grants 2,085 2,152 1,971 1,656
Total 7,591 7,555 7,215 6,912
CASH RECEIPTS CAPITAL PROJECTS FUNDSFY 2013 THROUGH FY 2016
(millions of dollars)
T-43

FY 2012 FY 2013 Annual AnnualCurrent Proposed $ Change % Change
User Taxes and Fees 595 622 27 4.5%Motor Fuel Tax 396 407 11 2.8%Highway Use Tax 134 147 13 9.7%Auto Rental Tax 65 68 3 4.6%
Business Taxes 619 660 41 6.6%Corporation and Utilities Tax 15 15 0 0.0%Petroleum Business Tax 604 645 41 6.8%
Other Taxes 119 119 0 0.0%Real Estate Transfer Tax 119 119 0 0.0%
Total Taxes 1,333 1,401 68 5.1%
Miscellaneous Receipts 4,360 4,105 (255) -5.8%Authority Bond Proceeds 3,388 3,115 (273) -8.1%State Park Fees 33 87 54 163.6%Environmental Revenues 77 77 0 0.0%Motor Vehicle Fees 802 799 (3) -0.4%All Other 60 27 (33) -55.0%
Federal Grants 2,202 2,085 (117) -5.3%
Total 7,895 7,591 (304) -3.9%
CASH RECEIPTS CAPITAL PROJECTS FUNDS
FY 2012 and FY 2013(millions of dollars)
T-44

FY 2
012
FY 2
013
FY 2
014
FY 2
015
FY 2
016
Cur
rent
Prop
osed
Proj
ecte
dPr
ojec
ted
Proj
ecte
d
ECO
NO
MIC
DEV
ELO
PMEN
T A
ND
GO
VER
NM
ENT
OVE
RSI
GH
TE
cono
mic
Dev
elop
men
t 48
,330
38,0
2037
,700
21,0
0021
,000
Em
pire
Sta
te D
evel
opm
ent C
orpo
ratio
n16
,770
13,0
0013
,000
13,0
0013
,000
Func
tiona
l Tot
al65
,100
51,0
2050
,700
34,0
0034
,000
TRA
NSP
OR
TATI
ON
Tran
spor
tatio
n, D
epar
tmen
t of
456,
555
403,
400
403,
400
403,
400
403,
400
Func
tiona
l Tot
al45
6,55
540
3,40
040
3,40
040
3,40
040
3,40
0
MEN
TAL
HEA
LTH
Men
tal H
ealth
, Offi
ce o
f24
3,34
824
6,55
321
4,11
726
4,11
721
4,11
7P
eopl
e w
ith D
evel
opm
enta
l Dis
abili
ties,
Offi
ce fo
r30
,000
59,3
7966
,129
91,1
2991
,129
Alc
ohol
ism
and
Sub
stan
ce A
buse
Ser
vice
s, O
ffice
of
5,00
05,
000
5,00
05,
000
5,00
0Fu
nctio
nal T
otal
278,
348
310,
932
285,
246
360,
246
310,
246
HIG
HER
ED
UC
ATI
ON
City
Uni
vers
ity o
f New
Yor
k45
5,93
045
3,23
946
9,10
348
3,74
351
0,54
2E
duca
tion
Sch
ool A
id11
0,00
010
0,00
010
0,00
092
,172
0S
tate
Uni
vers
ity o
f New
Yor
k27
0,80
036
3,92
715
5,87
598
,500
93,5
00Fu
nctio
nal T
otal
836,
730
917,
166
724,
978
674,
415
604,
042
ALL
OTH
ERJu
dici
ary
11,5
008,
100
9,00
05,
100
0Fu
nctio
nal T
otal
11,5
008,
100
9,00
05,
100
0
TOTA
L C
API
TAL
OFF
-BU
DG
ET S
PEN
DIN
G1,
648,
233
1,69
0,61
81,
473,
324
1,47
7,16
11,
351,
688
CA
SH D
ISB
UR
SEM
ENTS
BY
FUN
CTI
ON
C
API
TAL
OFF
-BU
DG
ET S
PEN
DIN
G(th
ousa
nds
of d
olla
rs)
Ref
lect
s ce
rtain
cap
ital s
pend
ing
that
is n
ot re
porte
d in
act
ual
cash
spe
ndin
g re
sults
, but
is re
porte
d in
the
Sta
te's
GA
AP
Fin
anci
al S
tate
men
ts.
This
spe
ndin
g is
rela
ted
to p
rogr
ams
whi
ch a
re fi
nanc
ed d
irect
ly fr
om b
ond
proc
eeds
that
are
on
depo
sit a
t var
ious
pub
lic a
utho
ritie
s ra
ther
than
fro
m a
sho
rt-te
rm lo
an fr
om th
e S
hort-
Term
Inve
stm
ent P
ool o
r cas
h fro
m th
e G
ener
al F
und.
T-45

FY 2013 FY 2014 FY 2015 FY 2016Proposed Projected Projected Projected
Personal Income Tax 10,078 10,770 11,090 11,452
User Taxes and Fees 2,863 2,983 3,123 3,247Sales and Use Tax 2,863 2,983 3,123 3,247
Other Taxes 571 651 721 796Real Estate Transfer Tax 571 651 721 796
Total Taxes 13,512 14,404 14,934 15,495
Miscellaneous Receipts 996 1,043 1,064 1,062Mental Hygiene Patient Receipts 352 375 403 403SUNY Dormitory Fees 505 529 554 554Health Patient Receipts 128 128 98 98All Other 11 11 9 7
Federal Grants 79 79 79 79
Total 14,587 15,526 16,077 16,636
CASH RECEIPTS DEBT SERVICE FUNDS
FY 2013 THROUGH FY 2016(millions of dollars)
T-46

FY 2012 FY 2013 Annual AnnualCurrent Proposed $ Change % Change
Personal Income Tax 9,666 10,078 412 4.3%
User Taxes and Fees 2,809 2,863 54 1.9%Sales and Use Tax 2,809 2,863 54 1.9%
Other Taxes 501 571 70 14.0%Real Estate Transfer Tax 501 571 70 14.0%
Total Taxes 12,976 13,512 536 4.1%
Miscellaneous Receipts 949 996 47 5.0%Mental Hygiene Patient Receipts 325 352 27 8.3%SUNY Dormitory Fees 482 505 23 4.8%Health Patient Receipts 128 128 0 0.0%All Other 14 11 (3) -21.4%
Federal Grants 79 79 0 0.0%
Total 14,004 14,587 583 4.2%
CASH RECEIPTS DEBT SERVICE FUNDS
FY 2012 and FY 2013(millions of dollars)
T-47

Special Capital Debt StateGeneral Revenue Projects Service Funds
Fund Funds Funds Funds Total
Opening Fund Balance 1,376 2,139 (62) 454 3,907
Receipts:Taxes 41,920 8,303 1,333 12,976 64,532Miscellaneous Receipts 3,244 15,147 4,360 949 23,700Federal Receipts 60 1 5 79 145
Total Receipts 45,224 23,451 5,698 14,004 88,377
Disbursements:Local Assistance Grants 38,515 19,033 1,651 0 59,199Departmental Operations:
Personal Service 5,770 6,106 0 0 11,876Non-Personal Service 1,795 3,355 0 61 5,211
General State Charges 4,707 1,829 0 0 6,536Debt Service 0 0 0 5,872 5,872Capital Projects 0 5 4,589 0 4,594
Total Disbursements 50,787 30,328 6,240 5,933 93,288
Other Financing Sources (Uses):Transfers from Other Funds 11,990 7,251 1,391 6,505 27,137Transfers to Other Funds (6,128) (613) (1,427) (14,481) (22,649)Bond and Note Proceeds 0 0 475 0 475
Net Other Financing Sources (Uses) 5,862 6,638 439 (7,976) 4,963
299 (239) (103) 95 52
Closing Fund Balance 1,675 1,900 (165) 549 3,959
Designated General Fund Reserves:Reserve for Collective Bargaining (284)Reserve for Community Projects Fund 85Rainy Day Fund (100)
Net Designated General Fund Reserves (299)
CASH FINANCIAL PLAN STATE FUNDS
FY 2012(millions of dollars)
Excess (Deficiency) of Receipts and OtherFinancing Sources Over Disbursements and Other Financing Uses
T-48

Special Capital Debt StateGeneral Revenue Projects Service Funds
Fund Funds Funds Funds Total
Receipts:Taxes 43,373 8,247 1,401 13,512 66,533Miscellaneous Receipts 3,069 15,954 4,105 996 24,124Federal Receipts 60 1 5 79 145
Total Receipts 46,502 24,202 5,511 14,587 90,802
Disbursements:Local Assistance Grants 39,403 19,657 1,243 0 60,303Departmental Operations:
Personal Service 5,729 6,236 0 0 11,965Non-Personal Service 1,859 3,261 0 47 5,167
General State Charges 4,434 1,954 0 0 6,388Debt Service 0 0 0 6,149 6,149Capital Projects 0 5 4,818 0 4,823
Total Disbursements 51,425 31,113 6,061 6,196 94,795
Other Financing Sources (Uses):Transfers from Other Funds 12,213 7,711 1,661 6,295 27,880Transfers to Other Funds (7,167) (399) (1,485) (14,609) (23,660)Reserve for Collective Bargaining 0 0 0 0 0Reserve for Community Projects Fund 0 0 0 0 0Bond and Note Proceeds 0 0 400 0 400
Net Other Financing Sources (Uses) 5,046 7,312 576 (8,314) 4,620
123 401 26 77 627
Designated General Fund Reserves:Reserve for Collective Bargaining (174)Reserve for Community Projects Fund 51
Net Designated General Fund Reserves (123)
CASH FINANCIAL PLAN STATE FUNDS
FY 2013(millions of dollars)
Excess (Deficiency) of Receipts and OtherFinancing Sources Over Disbursements and Other Financing Uses
T-49

Special Capital Debt StateGeneral Revenue Projects Service Funds
Fund Funds Funds Funds Total
Receipts:Taxes 45,859 8,569 1,421 14,404 70,253Miscellaneous Receipts 2,636 16,366 3,982 1,043 24,027Federal Receipts 2 1 5 79 87
Total Receipts 48,497 24,936 5,408 15,526 94,367
Disbursements:Local Assistance Grants 41,393 20,442 1,249 0 63,084Departmental Operations:
Personal Service 5,362 6,837 0 0 12,199Non-Personal Service 1,612 3,527 0 47 5,186
General State Charges 4,823 2,094 0 0 6,917Debt Service 0 0 0 6,449 6,449Capital Projects 0 5 4,652 0 4,657
Total Disbursements 53,190 32,905 5,901 6,496 98,492
Other Financing Sources (Uses):Transfers from Other Funds 12,848 8,726 1,789 6,155 29,518Transfers to Other Funds (8,736) (208) (1,535) (15,108) (25,587)Bond and Note Proceeds 0 0 338 0 338
Net Other Financing Sources (Uses) 4,112 8,518 592 (8,953) 4,269
(581) 549 99 77 144
Designated General Fund Reserves:Reserve for Collective Bargaining (134)
Net Designated General Fund Reserves (134)
CASH FINANCIAL PLAN STATE FUNDS
FY 2014(millions of dollars)
Excess (Deficiency) of Receipts and OtherFinancing Sources Over Disbursements and Other
T-50
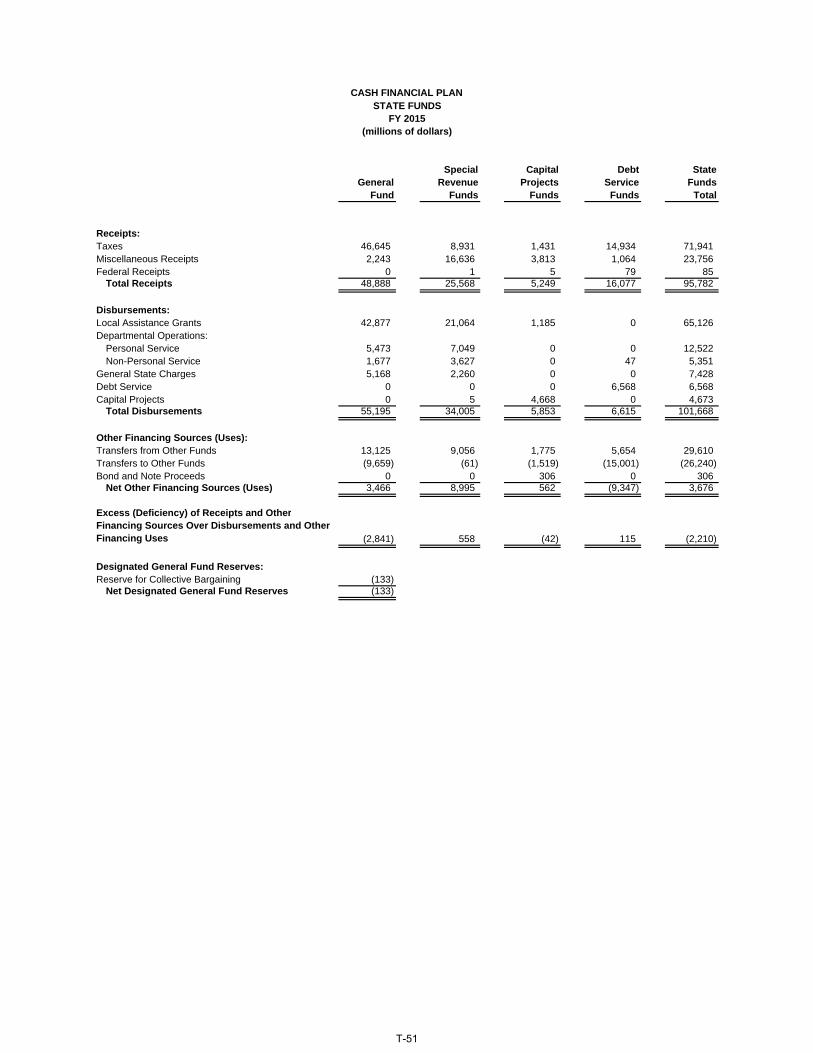
Special Capital Debt StateGeneral Revenue Projects Service Funds
Fund Funds Funds Funds Total
Receipts:Taxes 46,645 8,931 1,431 14,934 71,941Miscellaneous Receipts 2,243 16,636 3,813 1,064 23,756Federal Receipts 0 1 5 79 85
Total Receipts 48,888 25,568 5,249 16,077 95,782
Disbursements:Local Assistance Grants 42,877 21,064 1,185 0 65,126Departmental Operations:
Personal Service 5,473 7,049 0 0 12,522Non-Personal Service 1,677 3,627 0 47 5,351
General State Charges 5,168 2,260 0 0 7,428Debt Service 0 0 0 6,568 6,568Capital Projects 0 5 4,668 0 4,673
Total Disbursements 55,195 34,005 5,853 6,615 101,668
Other Financing Sources (Uses):Transfers from Other Funds 13,125 9,056 1,775 5,654 29,610Transfers to Other Funds (9,659) (61) (1,519) (15,001) (26,240)Bond and Note Proceeds 0 0 306 0 306
Net Other Financing Sources (Uses) 3,466 8,995 562 (9,347) 3,676
(2,841) 558 (42) 115 (2,210)
Designated General Fund Reserves:Reserve for Collective Bargaining (133)
Net Designated General Fund Reserves (133)
CASH FINANCIAL PLAN STATE FUNDS
FY 2015(millions of dollars)
Excess (Deficiency) of Receipts and OtherFinancing Sources Over Disbursements and Other Financing Uses
T-51

Special Capital Debt StateGeneral Revenue Projects Service Funds
Fund Funds Funds Funds Total
Receipts:Taxes 48,566 9,189 1,447 15,495 74,697Miscellaneous Receipts 2,336 16,681 3,809 1,062 23,888Federal Receipts 0 1 5 79 85
Total Receipts 50,902 25,871 5,261 16,636 98,670
Disbursements:Local Assistance Grants 45,107 21,148 896 0 67,151Departmental Operations:
Personal Service 5,731 7,323 0 0 13,054Non-Personal Service 1,793 3,690 0 47 5,530
General State Charges 5,459 2,421 0 0 7,880Debt Service 0 0 0 6,705 6,705Capital Projects 0 5 4,666 0 4,671
Total Disbursements 58,090 34,587 5,562 6,752 104,991
Other Financing Sources (Uses):Transfers from Other Funds 13,524 9,456 1,665 5,411 30,056Transfers to Other Funds (9,925) (241) (1,526) (15,310) (27,002)Bond and Note Proceeds 0 0 121 0 121
Net Other Financing Sources (Uses) 3,599 9,215 260 (9,899) 3,175
(3,589) 499 (41) (15) (3,146)
Designated General Fund Reserves:Reserve for Collective Bargaining (132)
Net Designated General Fund Reserves (132)
CASH FINANCIAL PLAN STATE FUNDS
FY 2016(millions of dollars)
Excess (Deficiency) of Receipts and OtherFinancing Sources Over Disbursements and Other Financing Uses
T-52

FY 2012 FY 2013 Annual AnnualCurrent Proposed $ Change % Change
Opening Fund Balance 3,907 3,959 52
Receipts:Taxes 64,532 66,533 2,001 3.1%Miscellaneous Receipts 23,700 24,124 424 1.8%Federal Receipts 145 145 0 0.0%
Total Receipts 88,377 90,802 2,425 2.7%
Disbursements:Local Assistance Grants 59,199 60,303 1,104 1.9%Departmental Operations:
Personal Service 11,876 11,965 89 0.7%Non-Personal Service 5,211 5,167 (44) -0.8%
General State Charges 6,536 6,388 (148) -2.3%Debt Service 5,872 6,149 277 4.7%Capital Projects 4,594 4,823 229 5.0%
Total Disbursements 93,288 94,795 1,507 1.6%
Other Financing Sources (Uses):Transfers from Other Funds 27,137 27,880 743 2.7%Transfers to Other Funds (22,649) (23,660) (1,011) 4.5%Bond and Note Proceeds 475 400 (75) -15.8%
Net Other Financing Sources (Uses) 4,963 4,620 (343) -6.9%
52 627 575
Closing Fund Balance 3,959 4,586 627
Designated General Fund Reserves:Reserve for Collective Bargaining (284) (174) 110 -38.7%Reserve for Community Projects Fund 85 51 (34) -40.0%Rainy Day Fund (100) 0 100 -100.0%
Net Designated General Fund Reserves (299) (123) 176 -58.9%
CASH FINANCIAL PLAN STATE FUNDS
FY 2012 and FY 2013(millions of dollars)
Excess (Deficiency) of Receipts and OtherFinancing Sources Over Disbursements and Other Financing Uses
T-53

2010
2011
Apr
ilM
ayJu
neJu
lyA
ugus
tSe
ptem
ber
Oct
ober
Nov
embe
rD
ecem
ber
Janu
ary
Febr
uary
Mar
chR
esul
tsR
esul
tsR
esul
tsR
esul
tsR
esul
tsR
esul
tsR
esul
tsR
esul
tsR
esul
tsR
esul
tsR
esul
tsR
esul
tsTo
tal
OPE
NIN
G B
ALA
NC
E2,
302
4,27
41,
648
(87)
590
528
2,38
12,
256
1,68
93,
008
5,61
76,
419
2,30
2
REC
EIPT
S:P
erso
nal I
ncom
e Ta
x3,
069
783
2,16
41,
575
1,66
92,
571
1,61
01,
329
2,73
22,
575
1,95
51,
862
23,8
94U
ser T
axes
and
Fee
s66
958
985
866
666
686
366
968
893
175
460
383
98,
795
Bus
ines
s Ta
xes
602
915
8021
990
5913
21,
169
122
124
1,60
55,
279
Oth
er T
axes
9383
103
155
8111
682
8596
149
108
861,
237
Tota
l Tax
es3,
891
1,45
74,
040
2,47
62,
437
4,54
02,
420
2,23
44,
928
3,60
02,
790
4,39
239
,205
Lice
nses
, Fee
s, e
tc.
4756
5577
5369
5272
4836
6649
680
Aba
ndon
ed P
rope
rty0
(4)
773
2843
3212
968
1812
239
645
AB
C L
icen
se F
ee9
16
44
42
44
55
452
Mot
or v
ehic
le fe
es0
00
00
00
00
00
3434
Rei
mbu
rsem
ents
713
3513
647
98
355
3161
270
Inve
stm
ent I
ncom
e1
00
10
01
00
10
26
Oth
er T
rans
actio
ns26
3380
4169
423
5136
7198
2345
71,
408
Tota
l Mis
cella
neou
s R
ecei
pts
9099
253
139
160
586
147
249
226
163
137
846
3,09
5
Fede
ral G
rant
s1
130
00
017
013
00
1054
PIT
in E
xces
s of
Rev
enue
Bon
d D
ebt S
ervi
ce1,
022
108
887
509
232
964
382
162
989
1,24
522
590
07,
625
Sal
es T
ax in
Exc
ess
of L
GA
C D
ebt S
ervi
ce18
010
035
020
213
226
719
120
729
423
27
189
2,35
1R
eal E
stat
e Ta
xes
in E
xces
s of
CW
/CA
Deb
t Ser
vice
3234
3339
3328
2621
1133
3919
348
All
Oth
er4
162
8720
1118
2114
410
518
81,
108
1,76
9To
tal T
rans
fers
from
Oth
er F
unds
1,23
824
31,
332
837
417
1,27
061
741
11,
438
1,61
545
92,
216
12,0
93
TOTA
L R
EC
EIP
TS5,
220
1,81
25,
625
3,45
23,
014
6,39
63,
201
2,89
46,
605
5,37
83,
386
7,46
454
,447
DIS
BU
RSE
MEN
TS:
Sch
ool A
id49
12,
616
3,76
710
057
41,
063
397
871
1,74
512
546
76,
489
18,7
05H
ighe
r Edu
catio
n16
1637
919
814
314
5837
712
618
443
722
2,44
7A
ll O
ther
Edu
catio
n17
1417
2488
523
2417
022
455
3726
61,
459
Med
icai
d - D
OH
1,08
563
366
851
659
038
924
463
883
246
275
267
07,
479
Pub
lic H
ealth
4030
122
1665
117
1720
4040
1212
964
8M
enta
l Hyg
iene
105
362
5013
039
216
416
398
122
157
433
2,23
9C
hild
ren
and
Fam
ilies
915
1466
274
7433
872
235
149
5536
31,
664
Tem
pora
ry &
Dis
abili
ty A
ssis
tanc
e61
140
6162
114
8315
273
236
663
145
1,19
6Tr
ansp
orta
tion
00
011
918
013
293
122
97U
nres
trict
ed A
id3
1227
41
196
90
209
30
167
775
All
Oth
er
1916
189
(27)
4548
(48)
8757
4426
4149
7To
tal L
ocal
Ass
ista
nce
Gra
nts
1,75
13,
497
5,85
31,
017
1,90
43,
117
1,35
52,
337
4,13
11,
253
1,56
49,
427
37,2
06
Per
sona
l Ser
vice
514
547
586
619
465
622
405
475
579
351
389
599
6,15
1N
on-P
erso
nal S
ervi
ce14
310
815
117
118
017
512
311
213
613
415
923
01,
822
Tota
l Sta
te O
pera
tions
657
655
737
790
645
797
528
587
715
485
548
829
7,97
3
Gen
eral
Sta
te C
harg
es12
230
485
112
348
298
439
317
147
412
791,
398
4,18
7
Deb
t Ser
vice
414
383
470
(5)
(133
)60
1(3
7)19
422
(15)
(40)
1,73
7C
apita
l Pro
ject
s14
214
121
(42)
6388
(10)
67(2
0)10
851
893
2
Sta
te S
hare
Med
icai
d18
016
224
418
518
436
317
919
318
415
728
717
92,
497
Oth
er P
urpo
ses
110
3534
8042
3813
674
2360
1319
684
1To
tal T
rans
fers
to O
ther
Fun
ds71
825
628
585
617
933
11,
004
220
293
619
393
853
6,00
7
TOTA
L D
ISB
UR
SE
ME
NTS
3,24
84,
438
7,36
02,
775
3,07
64,
543
3,32
63,
461
5,28
62,
769
2,58
412
,507
55,3
73
Exc
ess/
(Def
icie
ncy)
of R
ecei
pts
over
Dis
burs
emen
ts1,
972
(2,6
26)
(1,7
35)
677
(62)
1,85
3(1
25)
(567
)1,
319
2,60
980
2(5
,043
)(9
26)
CLO
SIN
G B
ALA
NC
E4,
274
1,64
8(8
7)59
052
82,
381
2,25
61,
689
3,00
85,
617
6,41
91,
376
1,37
6
CA
SHFL
OW
(dol
lars
in m
illio
ns)
GEN
ERA
L FU
ND
2010
-201
1
*Una
udite
d Y
ear-
end
Res
ults
T-54

2011
2012
Apr
ilM
ayJu
neJu
lyA
ugus
tSe
ptem
ber
Oct
ober
Nov
embe
rD
ecem
ber
Janu
ary
Febr
uary
Mar
chR
esul
tsR
esul
tsR
esul
tsR
esul
tsR
esul
tsR
esul
tsR
esul
tsR
esul
tsPr
ojec
ted
Proj
ecte
dPr
ojec
ted
Proj
ecte
dTo
tal
OPE
NIN
G B
ALA
NC
E1,
376
4,51
01,
809
2,49
21,
884
1,57
14,
948
3,39
43,
264
2,31
56,
271
6,31
01,
376
REC
EIPT
S:P
erso
nal I
ncom
e Ta
x4,
153
1,07
22,
610
1,66
11,
817
2,68
91,
540
1,56
117
94,
849
1,92
91,
645
25,7
05U
ser T
axes
and
Fee
s68
966
789
271
668
888
169
868
991
573
562
693
99,
135
Bus
ines
s Ta
xes
161
281,
173
(36)
431,
022
5811
01,
163
112
199
1,83
55,
868
Oth
er T
axes
6513
274
8810
911
998
106
7811
411
411
51,
212
Tota
l Tax
es5,
068
1,89
94,
749
2,42
92,
657
4,71
12,
394
2,46
62,
335
5,81
02,
868
4,53
441
,920
Lice
nses
, Fee
s, e
tc.
4664
5629
4785
2848
106
4344
2462
0A
band
oned
Pro
perty
10
3932
1877
2332
212
4240
149
755
AB
C L
icen
se F
ee5
56
55
65
54
44
155
Mot
or v
ehic
le fe
es0
013
(13)
00
020
1319
2139
112
Rei
mbu
rsem
ents
47
562
1836
1026
1510
1325
222
Inve
stm
ent I
ncom
e1
01
10
00
00
12
410
Oth
er T
rans
actio
ns21
1614
659
3430
180
3788
4471
573
1,47
0To
tal M
isce
llane
ous
Rec
eipt
s78
9231
711
512
250
514
645
823
816
319
581
53,
244
Fede
ral G
rant
s2
130
00
170
015
00
1360
PIT
in E
xces
s of
Rev
enue
Bon
d D
ebt S
ervi
ce1,
385
211
1,00
049
125
11,
092
268
234
949
942
347
899
8,06
9S
ales
Tax
in E
xces
s of
LG
AC
Deb
t Ser
vice
201
9837
821
513
628
121
220
928
522
54
186
2,43
0R
eal E
stat
e Ta
xes
in E
xces
s of
CW
/CA
Deb
t Ser
vice
3841
1942
6634
3423
2723
2129
397
All
Oth
er96
217
1211
1025
810
2487
792
1,09
4To
tal T
rans
fers
from
Oth
er F
unds
1,72
035
21,
414
760
464
1,41
753
947
41,
271
1,21
445
91,
906
11,9
90
TOTA
L R
EC
EIP
TS6,
868
2,35
66,
480
3,30
43,
243
6,65
03,
079
3,39
83,
859
7,18
73,
522
7,26
857
,214
DIS
BU
RSE
MEN
TS:
Sch
ool A
id23
32,
579
1,89
414
554
41,
207
597
911
1,47
327
046
56,
475
16,7
93H
ighe
r Edu
catio
n32
1952
512
934
151
449
3119
147
313
461
2,58
9A
ll O
ther
Edu
catio
n23
2122
326
642
3123
064
162
273
175
197
1,70
7M
edic
aid
- DO
H96
290
498
31,
327
691
300
1,30
61,
310
649
645
933
258
10,2
68P
ublic
Hea
lth15
1841
3715
539
4836
5843
6610
966
5M
enta
l Hyg
iene
192
387
36
545
151
479
514
829
21,
902
Chi
ldre
n an
d Fa
mili
es8
114
230
6771
4425
478
6218
077
411
1,59
6Te
mpo
rary
& D
isab
ility
Ass
ista
nce
326
6365
166
191
6591
7674
7718
191
1,40
3Tr
ansp
orta
tion
024
00
240
025
150
101
99U
nres
trict
ed A
id1
1229
40
391
90
204
00
144
758
All
Oth
er
(30)
1619
021
4130
24(1
0)54
6668
265
735
Tota
l Loc
al A
ssis
tanc
e G
rant
s1,
589
3,77
24,
832
2,16
12,
109
2,40
33,
023
2,52
23,
421
1,60
62,
273
8,80
438
,515
Per
sona
l Ser
vice
602
525
598
554
667
356
370
404
556
297
518
323
5,77
0N
on-P
erso
nal S
ervi
ce19
912
590
143
165
118
9010
915
418
418
723
11,
795
Tota
l Sta
te O
pera
tions
801
650
688
697
832
474
460
513
710
481
705
554
7,56
5
Gen
eral
Sta
te C
harg
es40
432
211
941
924
124
835
872
323
296
184
1,72
14,
707
Deb
t Ser
vice
522
22(1
29)
376
38(1
11)
469
(2)
(4)
518
(18)
(142
)1,
539
Cap
ital P
roje
cts
(23)
5252
1664
(12)
3646
5129
8539
479
0
Sta
te S
hare
Med
icai
d27
320
220
621
724
420
519
626
524
827
523
734
42,
912
S
UN
Y O
pera
tions
00
00
00
00
00
00
0O
ther
Pur
pose
s16
837
2926
2866
9111
259
2617
228
887
Tota
l Tra
nsfe
rs to
Oth
er F
unds
940
313
158
635
374
148
792
421
354
848
321
824
6,12
8
TOTA
L D
ISB
UR
SE
ME
NTS
3,73
45,
057
5,79
73,
912
3,55
63,
273
4,63
33,
528
4,80
83,
231
3,48
311
,903
56,9
15
Exc
ess/
(Def
icie
ncy)
of R
ecei
pts
over
Dis
burs
emen
ts3,
134
(2,7
01)
683
(608
)(3
13)
3,37
7(1
,554
)(1
30)
(949
)3,
956
39(4
,635
)29
9
CLO
SIN
G B
ALA
NC
E4,
510
1,80
92,
492
1,88
41,
571
4,94
83,
394
3,26
42,
315
6,27
16,
310
1,67
51,
675
Res
erve
s:C
omm
unity
Pro
ject
s Fu
nd
00
00
00
00
00
0(8
5)(8
5)R
ainy
Day
Res
erve
Fun
d0
00
00
00
00
00
100
100
Prio
r-Y
ear L
abor
Agr
eem
ents
(200
7-20
11)
00
00
00
00
00
028
428
4TO
TAL
RE
SE
RV
ES
00
00
00
00
00
029
929
9
Exc
ess/
(Def
icie
ncy)
of R
ecei
pts
over
Dis
burs
emen
ts a
fter R
eser
ves
3,13
4(2
,701
)68
3(6
08)
(313
)3,
377
(1,5
54)
(130
)(9
49)
3,95
639
(4,9
34)
0
CLO
SIN
G B
ALA
NC
E W
ITH
RES
ERVE
S4,
510
1,80
92,
492
1,88
41,
571
4,94
83,
394
3,26
42,
315
6,27
16,
310
1,37
61,
376
CA
SHFL
OW
(dol
lars
in m
illio
ns)
GEN
ERA
L FU
ND
FY 2
012
T-55

2011
2012
Intr
a-Fu
ndA
pril
May
June
July
Aug
ust
Sept
embe
rO
ctob
erN
ovem
ber
Dec
embe
rJa
nuar
yFe
brua
ryM
arch
Tran
sfer
Res
ults
Res
ults
Res
ults
Res
ults
Res
ults
Res
ults
Res
ults
Res
ults
Proj
ecte
dPr
ojec
ted
Proj
ecte
dPr
ojec
ted
Elim
inat
ions
Tota
l
OPE
NIN
G B
ALA
NC
E3,
969
8,65
26,
240
5,96
26,
395
6,45
97,
715
6,98
57,
020
4,90
910
,463
10,7
993,
969
REC
EIPT
S:Ta
xes
7,09
82,
854
6,96
73,
574
3,92
06,
634
3,52
53,
631
6,67
98,
103
4,06
96,
145
063
,199
Mis
cella
neou
s R
ecei
pts
1,24
61,
238
1,54
81,
239
1,52
32,
245
1,46
61,
745
1,54
31,
678
1,67
32,
196
019
,340
Fede
ral G
rant
s5
130
236
190
015
02
480
140
TOTA
L R
EC
EIP
TS8,
349
4,10
58,
515
4,81
55,
479
8,89
84,
991
5,37
68,
237
9,78
15,
744
8,38
90
82,6
79
DIS
BU
RSE
MEN
TS:
Sch
ool A
id23
32,
579
2,21
314
554
43,
156
700
1,01
41,
575
372
568
6,57
80
19,6
77H
ighe
r Edu
catio
n32
1952
512
934
151
449
3119
147
313
477
02,
605
All
Oth
er E
duca
tion
2421
223
267
4333
231
6416
327
417
719
80
1,71
8S
TAR
00
392
00
178
636
2,59
40
087
03,
293
Med
icai
d - D
OH
1,35
61,
365
1,27
01,
617
1,17
969
11,
640
1,79
688
11,
169
1,42
789
00
15,2
81P
ublic
Hea
lth37
136
235
104
262
152
163
119
271
148
159
234
02,
020
Men
tal H
ygie
ne70
6757
114
475
729
174
7676
277
257
578
03,
580
Chi
ldre
n an
d Fa
mili
es9
115
230
6771
4425
578
6218
078
408
01,
597
Tem
pora
ry &
Dis
abili
ty A
ssis
tanc
e32
763
6616
719
266
9475
7679
2018
80
1,41
3Tr
ansp
orta
tion
161
445
353
262
475
214
402
500
686
223
318
219
04,
258
Unr
estri
cted
Aid
112
294
03
919
020
40
014
40
758
All
Oth
er
(18)
3719
940
253
6183
1970
7594
435
01,
348
Tota
l Loc
al A
ssis
tanc
e G
rant
s2,
232
4,85
96,
571
2,94
23,
438
5,46
64,
206
3,80
87,
535
2,64
43,
411
10,4
360
57,5
48
Per
sona
l Ser
vice
994
922
1,08
891
71,
218
947
918
920
1,10
094
91,
162
741
011
,876
Non
-Per
sona
l Ser
vice
392
392
465
342
432
396
431
411
498
431
446
575
05,
211
Tota
l Sta
te O
pera
tions
1,38
61,
314
1,55
31,
259
1,65
01,
343
1,34
91,
331
1,59
81,
380
1,60
81,
316
017
,087
Gen
eral
Sta
te C
harg
es44
940
040
146
146
144
140
142
042
046
723
91,
976
06,
536
Deb
t ser
vice
157
293
566
102
286
878
104
186
1,11
994
465
1,62
20
5,87
2
Cap
ital P
roje
cts
01
00
11
00
10
01
05
TOTA
L D
ISB
UR
SE
ME
NTS
4,22
46,
867
9,09
14,
764
5,83
68,
129
6,06
05,
745
10,6
734,
585
5,72
315
,351
087
,048
OTH
ER F
INA
NC
ING
SO
UR
CES
(use
s):
Tr
ansf
ers
from
oth
er fu
nds
3,54
91,
312
2,42
92,
003
1,89
62,
155
1,98
71,
562
2,24
22,
711
1,35
43,
346
(800
)25
,746
Tr
ansf
ers
to o
ther
fund
s(2
,991
)(9
62)
(2,1
31)
(1,6
21)
(1,4
75)
(1,6
68)
(1,6
48)
(1,1
58)
(1,9
17)
(2,3
53)
(1,0
39)
(3,0
59)
800
(21,
222)
B
ond
and
note
pro
ceed
s0
00
00
00
00
00
00
0N
ET
OTH
ER
FIN
AN
CIN
G S
OU
RC
ES
/(US
ES
)55
835
029
838
242
148
733
940
432
535
831
528
70
4,52
4
Exc
ess/
(Def
icie
ncy)
of R
ecei
pts
over
Dis
burs
emen
ts4,
683
(2,4
12)
(278
)43
364
1,25
6(7
30)
35(2
,111
)5,
554
336
(6,6
75)
015
5
CLO
SIN
G B
ALA
NC
E8,
652
6,24
05,
962
6,39
56,
459
7,71
56,
985
7,02
04,
909
10,4
6310
,799
4,12
40
4,12
4
Res
erve
s:C
omm
unity
Pro
ject
s Fu
nd
00
00
00
00
00
0(8
5)0
(85)
Rai
ny D
ay R
eser
ve F
und
00
00
00
00
00
010
00
100
Prio
r-Y
ear L
abor
Agr
eem
ents
(200
7-20
11)
00
00
00
00
00
028
40
284
TOTA
L R
ES
ER
VE
S0
00
00
00
00
00
299
029
9
Exc
ess/
(Def
icie
ncy)
of R
ecei
pts
over
Dis
burs
emen
ts a
fter R
eser
ves
4,68
3(2
,412
)(2
78)
433
641,
256
(730
)35
(2,1
11)
5,55
433
6(6
,974
)0
(144
)
CLO
SIN
G B
ALA
NC
E W
ITH
RES
ERVE
S8,
652
6,24
05,
962
6,39
56,
459
7,71
56,
985
7,02
04,
909
10,4
6310
,799
3,82
50
3,82
5
CA
SHFL
OW
STA
TE O
PER
ATI
NG
FU
ND
SFY
201
2(d
olla
rs in
mill
ions
)
T-56

2011
2012
Apr
ilM
ayJu
n eJu
lyA
ugus
tSe
ptem
ber
Oct
ober
Nov
embe
rD
ecem
ber
Janu
ary
Febr
uary
Mar
chR
esul
tsR
esul
tsR
esul
tsR
esul
tsR
esul
tsR
esul
tsR
esul
tsR
esul
tsPr
ojec
ted
Proj
ecte
dPr
ojec
ted
Proj
ecte
dTo
tal
OPE
NIN
G B
ALA
NC
E(1
67)
(213
)(3
28)
(401
)(5
36)
(620
)(8
45)
(861
)(1
,013
)(8
77)
(795
)(8
57)
(167
)
REC
EIPT
S:Ta
xes
8886
123
116
110
134
107
9115
110
399
125
1,33
3M
isce
llane
ous
Rec
eipt
s34
332
023
838
222
624
638
519
433
745
024
099
94,
360
Fede
ral G
rant
s12
713
222
911
723
315
814
916
719
616
514
538
42,
202
TOTA
L R
EC
EIP
TS55
853
859
061
556
953
864
145
268
471
848
41,
508
7,89
5
DIS
BU
RSE
MEN
TS:
Loca
l Ass
ista
nce
Gra
nts
191
293
201
267
121
153
100
113
339
123
109
554
2,56
4To
tal L
ocal
Ass
ista
nce
Gra
nts
191
293
201
267
121
153
100
113
339
123
109
554
2,56
4
Eco
nom
ic D
evel
opm
ent
22
45
72
44
855
5511
025
8P
arks
& th
e E
nviro
nmen
t18
1718
1732
2018
3654
3533
125
423
Tran
spor
tatio
n19
120
732
024
831
725
734
130
633
625
220
261
3,03
8H
ealth
& S
ocia
l Wel
fare
32
314
33
132
23
3(1
7)34
Men
tal H
ygie
ne6
77
106
76
711
1111
3612
5P
ublic
Pro
tect
ion
2046
2119
1724
1925
1925
3352
320
Edu
catio
n54
5387
7510
092
8477
8994
113
169
1,08
7A
ll O
ther
23
1515
1517
1714
1521
631
4022
9To
tal C
apita
l Pro
ject
s31
734
947
540
349
942
249
947
254
048
148
157
65,
514
TOTA
L D
ISB
UR
SE
ME
NTS
508
642
676
670
620
575
599
585
879
604
590
1,13
08,
078
OTH
ER F
INA
NC
ING
SO
UR
CES
(use
s):
Tran
sfer
s fro
m o
ther
fund
s(7
)79
107
1964
3038
7773
2682
462
1,05
0Tr
ansf
ers
to o
ther
fund
s(8
9)(9
0)(9
4)(9
9)(9
7)(2
18)
(96)
(96)
(94)
(98)
(43)
(325
)(1
,439
)B
ond
and
note
pro
ceed
s0
00
00
00
035
240
578
475
NE
T O
THE
R F
INA
NC
ING
SO
UR
CE
S/(U
SE
S)
(96)
(11)
13(8
0)(3
3)(1
88)
(58)
(19)
331
(32)
4421
586
Exc
ess/
(Def
icie
ncy)
of R
ecei
pts
over
Dis
burs
emen
ts(4
6)(1
15)
(73)
(135
)(8
4)(2
25)
(16)
(152
)13
682
(62)
593
(97)
CLO
SIN
G B
ALA
NC
E(2
13)
(328
)(4
01)
(536
)(6
20)
(845
)(8
61)
(1,0
13)
(877
)(7
95)
(857
)(2
64)
(264
)
CA
SHFL
OW
(dol
lars
in m
illio
ns)
CA
PITA
L PR
OJE
CTS
FU
ND
SFY
201
2
T-57
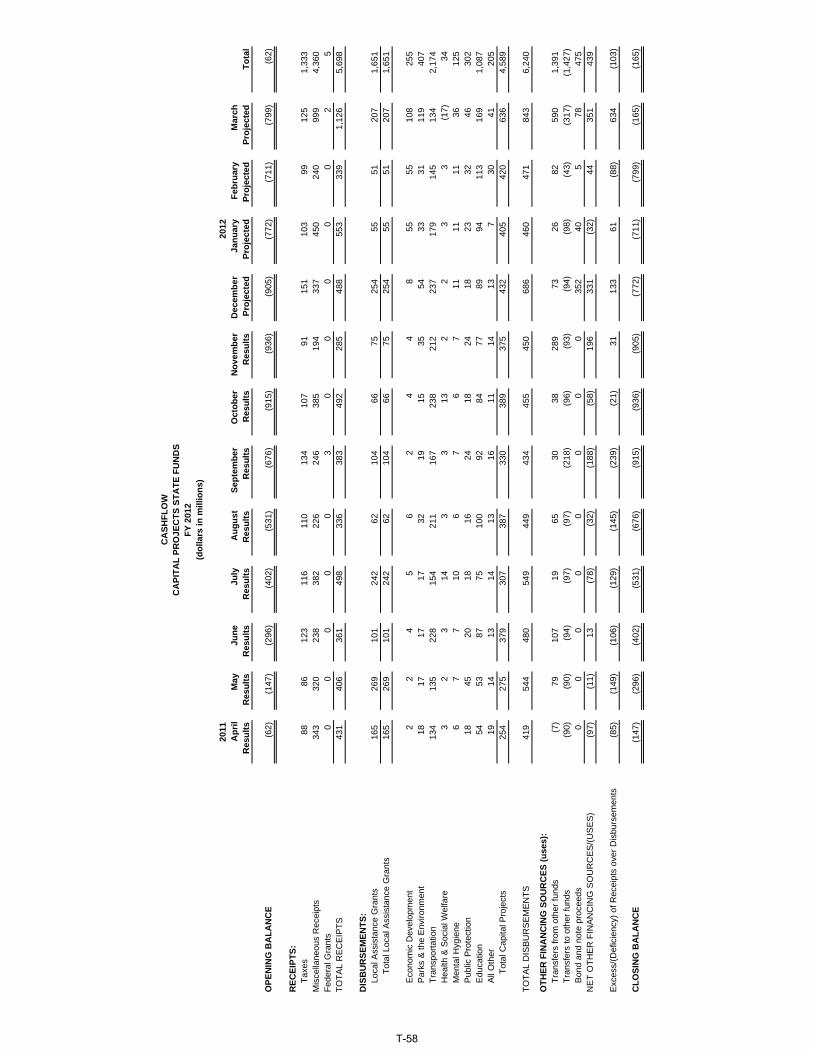
2011
2012
Apr
ilM
ayJu
neJu
lyA
ugus
tSe
ptem
ber
Oct
ober
Nov
embe
rD
ecem
ber
Janu
ary
Febr
uary
Mar
chR
esul
tsR
esul
tsR
esul
tsR
esul
tsR
esul
tsR
esul
tsR
esul
tsR
esul
tsPr
ojec
ted
Proj
ecte
dPr
ojec
ted
Proj
ecte
dTo
tal
OPE
NIN
G B
ALA
NC
E(6
2)(1
47)
(296
)(4
02)
(531
)(6
76)
(915
)(9
36)
(905
)(7
72)
(711
)(7
99)
(62)
REC
EIPT
S:Ta
xes
8886
123
116
110
134
107
9115
110
399
125
1,33
3M
isce
llane
ous
Rec
eipt
s34
332
023
838
222
624
638
519
433
745
024
099
94,
360
Fede
ral G
rant
s0
00
00
30
00
00
25
TOTA
L R
EC
EIP
TS43
140
636
149
833
638
349
228
548
855
333
91,
126
5,69
8
DIS
BU
RSE
MEN
TS:
Loca
l Ass
ista
nce
Gra
nts
165
269
101
242
6210
466
7525
455
5120
71,
651
Tota
l Loc
al A
ssis
tanc
e G
rant
s16
526
910
124
262
104
6675
254
5551
207
1,65
1
Eco
nom
ic D
evel
opm
ent
22
45
62
44
855
5510
825
5P
arks
& th
e E
nviro
nmen
t18
1717
1732
1915
3554
3331
119
407
Tran
spor
tatio
n13
413
522
815
421
116
723
821
223
717
914
513
42,
174
Hea
lth &
Soc
ial W
elfa
re3
23
143
313
22
33
(17)
34M
enta
l Hyg
iene
67
710
67
67
1111
1136
125
Pub
lic P
rote
ctio
n18
4520
1816
2418
2418
2332
4630
2E
duca
tion
5453
8775
100
9284
7789
9411
316
91,
087
All
Oth
er
1914
1314
1316
1114
137
3041
205
Tota
l Cap
ital P
roje
cts
254
275
379
307
387
330
389
375
432
405
420
636
4,58
9
TOTA
L D
ISB
UR
SE
ME
NTS
419
544
480
549
449
434
455
450
686
460
471
843
6,24
0
OTH
ER F
INA
NC
ING
SO
UR
CES
(use
s):
Tran
sfer
s fro
m o
ther
fund
s(7
)79
107
1965
3038
289
7326
8259
01,
391
Tran
sfer
s to
oth
er fu
nds
(90)
(90)
(94)
(97)
(97)
(218
)(9
6)(9
3)(9
4)(9
8)(4
3)(3
17)
(1,4
27)
Bon
d an
d no
te p
roce
eds
00
00
00
00
352
405
7847
5N
ET
OTH
ER
FIN
AN
CIN
G S
OU
RC
ES
/(US
ES
)(9
7)(1
1)13
(78)
(32)
(188
)(5
8)19
633
1(3
2)44
351
439
Exc
ess/
(Def
icie
ncy)
of R
ecei
pts
over
Dis
burs
emen
ts(8
5)(1
49)
(106
)(1
29)
(145
)(2
39)
(21)
3113
361
(88)
634
(103
)
CLO
SIN
G B
ALA
NC
E(1
47)
(296
)(4
02)
(531
)(6
76)
(915
)(9
36)
(905
)(7
72)
(711
)(7
99)
(165
)(1
65)
CA
SHFL
OW
(dol
lars
in m
illio
ns)
CA
PITA
L PR
OJE
CTS
STA
TE F
UN
DS
FY 2
012
T-58

2011
2012
Apr
ilM
ayJu
neJu
lyA
ugus
tSe
ptem
ber
Oct
ober
Nov
embe
rD
ecem
ber
Janu
ary
Febr
uary
Mar
chR
esul
tsR
esul
tsR
esul
tsR
esul
tsR
esul
tsR
esul
tsR
esul
tsR
esul
tsPr
ojec
ted
Proj
ecte
dPr
ojec
ted
Proj
ecte
dTo
tal
OPE
NIN
G B
ALA
NC
E(1
05)
(66)
(32)
1(5
)56
7075
(108
)(1
05)
(84)
(58)
(105
)
REC
EIPT
S:
Taxe
s0
00
00
00
00
00
00
M
isce
llane
ous
Rec
eipt
s0
00
00
00
00
00
00
Fe
dera
l Gra
nts
127
132
229
117
233
155
149
167
196
165
145
382
2,19
7TO
TAL
RE
CE
IPTS
127
132
229
117
233
155
149
167
196
165
145
382
2,19
7
DIS
BU
RSE
MEN
TS:
Loca
l Ass
ista
nce
Gra
nts
2624
100
2559
4934
3885
6858
347
913
Tota
l Loc
al A
ssis
tanc
e G
rant
s26
2410
025
5949
3438
8568
5834
791
3
Eco
nom
ic D
evel
opm
ent
00
00
10
00
00
02
3P
arks
& th
e E
nviro
nmen
t0
01
00
13
10
22
616
Tran
spor
tatio
n57
7292
9410
690
103
9499
7357
(73)
864
Hea
lth &
Soc
ial W
elfa
re0
00
00
00
00
00
00
Men
tal H
ygie
ne0
00
00
00
00
00
00
Pub
lic P
rote
ctio
n2
11
11
01
11
21
618
Edu
catio
n0
00
00
00
00
00
00
All
Oth
er
41
21
41
31
8(1
)1
(1)
24To
tal C
apita
l Pro
ject
s63
7496
9611
292
110
9710
876
61(6
0)92
5
TOTA
L D
ISB
UR
SE
ME
NTS
8998
196
121
171
141
144
135
193
144
119
287
1,83
8
OTH
ER F
INA
NC
ING
SO
UR
CES
(use
s):
Tr
ansf
ers
from
oth
er fu
nds
00
00
(1)
00
(212
)0
00
(128
)(3
41)
Tr
ansf
ers
to o
ther
fund
s1
00
(2)
00
0(3
)0
00
(8)
(12)
B
ond
and
note
pro
ceed
s0
00
00
00
00
00
00
NE
T O
THE
R F
INA
NC
ING
SO
UR
CE
S/(U
SE
S)
10
0(2
)(1
)0
0(2
15)
00
0(1
36)
(353
)
Exc
ess/
(Def
icie
ncy)
of R
ecei
pts
over
Dis
burs
emen
ts39
3433
(6)
6114
5(1
83)
321
26(4
1)6
CLO
SIN
G B
ALA
NC
E(6
6)(3
2)1
(5)
5670
75(1
08)
(105
)(8
4)(5
8)(9
9)(9
9)
CA
SHFL
OW
(dol
lars
in m
illio
ns)
CA
PITA
L PR
OJE
CTS
FED
ERA
L FU
ND
SFY
201
2
T-59

2011
2012
Intr
a-Fu
ndA
pril
May
June
July
Aug
ust
Sept
embe
rO
ctob
erN
ovem
ber
Dec
embe
rJa
nuar
yFe
brua
ryM
arch
Tran
sfer
Res
ults
Res
ults
Res
ults
Res
ults
Res
ults
Res
ults
Res
ults
Res
ults
Proj
ecte
dPr
ojec
ted
Proj
ecte
dPr
ojec
ted
Elim
inat
ions
Tota
l
OPE
NIN
G B
ALA
NC
E2,
149
3,39
63,
362
2,86
53,
636
3,45
02,
323
2,35
81,
340
1,82
71,
755
1,94
22,
149
REC
EIPT
S:P
erso
nal I
ncom
e Ta
x0
039
20
017
86
362,
593
00
880
3,29
3U
ser T
axes
and
Fee
s20
616
219
619
317
720
118
616
719
020
313
816
10
2,18
0B
usin
ess
Taxe
s61
5624
052
4820
054
6223
551
5731
80
1,43
4O
ther
Tax
es12
512
885
9713
471
114
126
8216
714
012
70
1,39
6To
tal T
axes
392
346
913
342
359
650
360
391
3,10
042
133
569
40
8,30
3
HC
RA
339
349
345
364
354
291
396
346
354
440
315
277
04,
170
Sta
te U
nive
rsity
Inco
me
183
195
225
213
294
599
337
268
250
431
458
315
03,
768
Lotte
ry23
222
527
521
126
620
921
428
423
523
928
525
90
2,93
4M
edic
aid
6068
6784
9065
6863
7075
8278
087
0M
otor
veh
icle
fees
4451
5242
4654
3829
3826
3333
048
6O
ther
rece
ipts
255
252
210
171
293
407
193
256
283
227
223
281
03,
051
Tota
l Mis
cella
neou
s R
ecei
pts
1,11
31,
140
1,17
41,
085
1,34
31,
625
1,24
61,
246
1,23
01,
438
1,39
61,
243
015
,279
Fede
ral G
rant
s3,
978
2,92
73,
758
4,01
73,
243
3,62
13,
077
3,52
84,
090
2,38
73,
382
3,59
30
41,6
01
TOTA
L R
EC
EIP
TS5,
483
4,41
35,
845
5,44
44,
945
5,89
64,
683
5,16
58,
420
4,24
65,
113
5,53
00
65,1
83
DIS
BU
RSE
MEN
TS:
Sch
ool A
id33
641
676
824
117
82,
178
225
244
439
276
627
610
06,
538
Hig
her E
duca
tion
11
11
04
00
00
016
024
All
Oth
er E
duca
tion
215
188
104
4453
3423
149
150
2924
670
1,08
0S
TAR
00
392
00
178
636
2,59
40
087
03,
293
Med
icai
d - D
OH
2,79
32,
263
3,06
12,
765
2,28
82,
545
2,06
63,
044
1,87
72,
241
2,37
92,
115
029
,437
Pub
lic H
ealth
7324
128
616
121
321
018
117
238
017
716
623
00
2,49
0M
enta
l Hyg
iene
7176
202
151
8919
617
396
293
8811
128
70
1,83
3C
hild
ren
and
Fam
ilies
119
616
727
936
118
180
169
155
40
999
Tem
pora
ry &
Dis
abili
ty A
ssis
tanc
e66
4263
274
615
7246
867
832
930
929
933
20
3,54
7Tr
ansp
orta
tion
164
424
354
263
454
218
405
479
673
226
311
228
04,
199
Unr
estri
cted
Aid
00
00
00
00
00
00
00
All
Oth
er
2210
066
6630
213
293
5318
559
7814
70
1,30
3To
tal L
ocal
Ass
ista
nce
Gra
nts
3,75
23,
760
5,30
34,
133
4,47
15,
803
3,75
85,
131
7,08
93,
420
4,00
04,
123
054
,743
Per
sona
l Ser
vice
445
454
537
411
621
639
596
561
592
689
694
510
06,
749
Non
-Per
sona
l Ser
vice
250
316
431
245
335
398
440
371
405
330
373
420
04,
314
Tota
l Sta
te O
pera
tions
695
770
968
656
956
1,03
71,
036
932
997
1,01
91,
067
930
011
,063
Gen
eral
Sta
te C
harg
es48
103
322
4524
222
256
408
100
189
6532
60
2,12
6
Cap
ital P
roje
cts
01
00
11
00
10
01
05
TOTA
L D
ISB
UR
SE
ME
NTS
4,49
54,
634
6,59
34,
834
5,67
07,
063
4,85
06,
471
8,18
74,
628
5,13
25,
380
067
,937
OTH
ER F
INA
NC
ING
SO
UR
CES
(use
s):
Tran
sfer
s fro
m o
ther
fund
s74
850
265
845
590
832
151
560
555
559
955
982
77,
252
Tran
sfer
s to
oth
er fu
nds
(489
)(3
15)
(407
)(2
94)
(369
)(2
81)
(313
)(3
17)
(301
)(2
89)
(353
)(1
,010
)(4
,738
)
NE
T O
THE
R F
INA
NC
ING
SO
UR
CE
S/(U
SE
S)
259
187
251
161
539
4020
228
825
431
020
6(1
83)
02,
514
Exc
ess/
(Def
icie
ncy)
of R
ecei
pts
over
Dis
burs
emen
ts1,
247
(34)
(497
)77
1(1
86)
(1,1
27)
35(1
,018
)48
7(7
2)18
7(3
3)0
(240
)
CLO
SIN
G B
ALA
NC
E3,
396
3,36
22,
865
3,63
63,
450
2,32
32,
358
1,34
01,
827
1,75
51,
942
1,90
90
1,90
9
CA
SHFL
OW
SPEC
IAL
REV
ENU
E FU
ND
SFY
201
2(d
olla
rs in
mill
ions
)
T-60
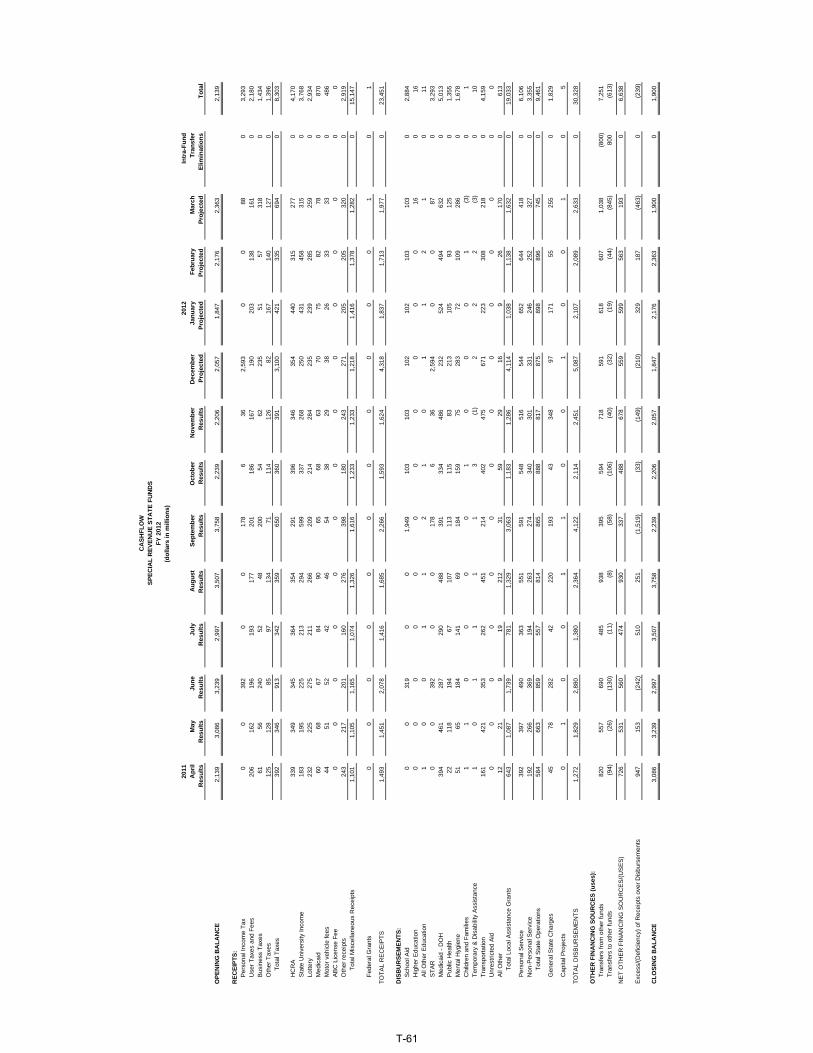
2011
2012
Intr
a-Fu
ndA
pril
May
June
July
Aug
ust
Sept
embe
rO
ctob
erN
ovem
ber
Dec
embe
rJa
nuar
yFe
brua
ryM
arch
Tran
sfer
Res
ults
Res
ults
Res
ults
Res
ults
Res
ults
Res
ults
Res
ults
Res
ults
Proj
ecte
dPr
ojec
ted
Proj
ecte
dPr
ojec
ted
Elim
inat
ions
Tota
l
OPE
NIN
G B
ALA
NC
E2,
139
3,08
63,
239
2,99
73,
507
3,75
82,
239
2,20
62,
057
1,84
72,
176
2,36
32,
139
REC
EIPT
S:P
erso
nal I
ncom
e Ta
x0
039
20
017
86
362,
593
00
880
3,29
3U
ser T
axes
and
Fee
s20
616
219
619
317
720
118
616
719
020
313
816
10
2,18
0B
usin
ess
Taxe
s61
5624
052
4820
054
6223
551
5731
80
1,43
4O
ther
Tax
es12
512
885
9713
471
114
126
8216
714
012
70
1,39
6To
tal T
axes
392
346
913
342
359
650
360
391
3,10
042
133
569
40
8,30
3
HC
RA
339
349
345
364
354
291
396
346
354
440
315
277
04,
170
Sta
te U
nive
rsity
Inco
me
183
195
225
213
294
599
337
268
250
431
458
315
03,
768
Lotte
ry23
222
527
521
126
620
921
428
423
523
928
525
90
2,93
4M
edic
aid
6068
6784
9065
6863
7075
8278
087
0M
otor
veh
icle
fees
4451
5242
4654
3829
3826
3333
048
6A
BC
Lic
ense
Fee
00
00
00
00
00
00
00
Oth
er re
ceip
ts24
321
720
116
027
639
818
024
327
120
520
532
00
2,91
9To
tal M
isce
llane
ous
Rec
eipt
s1,
101
1,10
51,
165
1,07
41,
326
1,61
61,
233
1,23
31,
218
1,41
61,
378
1,28
20
15,1
47
Fede
ral G
rant
s0
00
00
00
00
00
10
1
TOTA
L R
EC
EIP
TS1,
493
1,45
12,
078
1,41
61,
685
2,26
61,
593
1,62
44,
318
1,83
71,
713
1,97
70
23,4
51
DIS
BU
RSE
MEN
TS:
Sch
ool A
id0
031
90
01,
949
103
103
102
102
103
103
02,
884
Hig
her E
duca
tion
00
00
00
00
00
016
016
All
Oth
er E
duca
tion
10
01
12
10
11
21
011
STA
R0
039
20
017
86
362,
594
00
870
3,29
3M
edic
aid
- DO
H39
446
128
729
048
839
133
448
623
252
449
463
20
5,01
3P
ublic
Hea
lth22
118
194
6710
711
311
583
213
105
9312
50
1,35
5M
enta
l Hyg
iene
5165
184
141
6918
415
975
283
7210
928
60
1,67
8C
hild
ren
and
Fam
ilies
11
00
00
10
00
1(3
)0
1Te
mpo
rary
& D
isab
ility
Ass
ista
nce
10
11
11
3(1
)2
22
(3)
010
Tran
spor
tatio
n16
142
135
326
245
121
440
247
567
122
330
821
80
4,15
9U
nres
trict
ed A
id0
00
00
00
00
00
00
0A
ll O
ther
12
219
1921
231
5929
169
2617
00
613
Tota
l Loc
al A
ssis
tanc
e G
rant
s64
31,
087
1,73
978
11,
329
3,06
31,
183
1,28
64,
114
1,03
81,
138
1,63
20
19,0
33
Per
sona
l Ser
vice
392
397
490
363
551
591
548
516
544
652
644
418
06,
106
Non
-Per
sona
l Ser
vice
192
266
369
194
263
274
340
301
331
246
252
327
03,
355
Tota
l Sta
te O
pera
tions
584
663
859
557
814
865
888
817
875
898
896
745
09,
461
Gen
eral
Sta
te C
harg
es45
7828
242
220
193
4334
897
171
5525
50
1,82
9
Cap
ital P
roje
cts
01
00
11
00
10
01
05
TOTA
L D
ISB
UR
SE
ME
NTS
1,27
21,
829
2,88
01,
380
2,36
44,
122
2,11
42,
451
5,08
72,
107
2,08
92,
633
030
,328
OTH
ER F
INA
NC
ING
SO
UR
CES
(use
s):
Tran
sfer
s fro
m o
ther
fund
s82
055
769
048
593
839
559
471
859
161
860
71,
038
(800
)7,
251
Tran
sfer
s to
oth
er fu
nds
(94)
(26)
(130
)(1
1)(8
)(5
8)(1
06)
(40)
(32)
(19)
(44)
(845
)80
0(6
13)
NE
T O
THE
R F
INA
NC
ING
SO
UR
CE
S/(U
SE
S)
726
531
560
474
930
337
488
678
559
599
563
193
06,
638
Exc
ess/
(Def
icie
ncy)
of R
ecei
pts
over
Dis
burs
emen
ts94
715
3(2
42)
510
251
(1,5
19)
(33)
(149
)(2
10)
329
187
(463
)0
(239
)
CLO
SIN
G B
ALA
NCE
3,08
63,
239
2,99
73,
507
3,75
82,
239
2,20
62,
057
1,84
72,
176
2,36
31,
900
01,
900
CA
SHFL
OW
SPEC
IAL
REV
ENU
E ST
ATE
FU
ND
SFY
201
2(d
olla
rs in
mill
ions
)
T-61

2011
2012
Apr
ilM
ayJu
neJu
lyA
ugus
tSe
ptem
ber
Oct
ober
Nov
embe
rD
ecem
ber
Janu
ary
Febr
uary
Mar
chR
esul
tsR
esul
tsR
esul
tsR
esul
tsR
esul
tsR
esul
tsR
esul
tsR
esul
tsPr
ojec
ted
Proj
ecte
dPr
ojec
ted
Proj
ecte
dTo
tal
OPE
NIN
G B
ALA
NC
E10
310
123
(131
)12
9(3
08)
8415
2(7
17)
(19)
(419
)(4
19)
10
REC
EIPT
S:M
isce
llane
ous
Rec
eipt
s12
359
1117
913
1312
2218
(39)
132
Fede
ral G
rant
s3,
978
2,92
73,
758
4,01
73,
243
3,62
13,
077
3,52
84,
090
2,38
73,
382
3,59
241
,600
TOTA
L R
EC
EIP
TS3,
990
2,96
23,
767
4,02
83,
260
3,63
03,
090
3,54
14,
102
2,40
93,
400
3,55
341
,732
DIS
BU
RSE
MEN
TS:
Sch
ool A
id33
641
644
924
117
822
912
214
133
717
452
450
73,
654
Hig
her E
duca
tion
11
11
04
00
00
00
8A
ll O
ther
Edu
catio
n21
418
810
443
5232
2214
914
928
2266
1,06
9S
TAR
00
00
00
00
00
00
0M
edic
aid
- DO
H2,
399
1,80
22,
774
2,47
51,
800
2,15
41,
732
2,55
81,
645
1,71
71,
885
1,48
324
,424
Pub
lic H
eatlh
5112
392
9410
697
6689
167
7273
105
1,13
5M
enta
l Hyg
iene
2011
1810
2012
1421
1016
21
155
Chi
ldre
n an
d Fa
mili
es10
86
167
279
3611
718
016
915
47
998
Tem
pora
ry &
Dis
abili
ty A
ssis
tanc
e65
4262
273
614
7146
567
932
730
729
733
53,
537
Tran
spor
tatio
n3
31
13
43
42
33
1040
Unr
estri
cted
Aid
00
00
00
00
00
00
0A
ll O
ther
10
7957
4790
101
3424
169
5052
(23)
690
Tota
l Loc
al A
ssis
tanc
e G
rant
s3,
109
2,67
33,
564
3,35
23,
142
2,74
02,
575
3,84
52,
975
2,38
22,
862
2,49
135
,710
Per
sona
l Ser
vice
5357
4748
7048
4845
4837
5092
643
Non
-Per
sona
l Ser
vice
5850
6251
7212
410
070
7484
121
9395
9To
tal S
tate
Ope
ratio
ns11
110
710
999
142
172
148
115
122
121
171
185
1,60
2
Gen
eral
Sta
te C
harg
es3
2540
322
2913
603
1810
7129
7
Cap
ital P
roje
cts
00
00
00
00
00
00
0
TOTA
L D
ISB
UR
SE
ME
NTS
3,22
32,
805
3,71
33,
454
3,30
62,
941
2,73
64,
020
3,10
02,
521
3,04
32,
747
37,6
09
OTH
ER F
INA
NC
ING
SO
UR
CES
(use
s):
Tr
ansf
ers
from
oth
er fu
nds
00
00
00
00
00
01
1
Tran
sfer
s to
oth
er fu
nds
(467
)(3
44)
(308
)(3
14)
(391
)(2
97)
(286
)(3
90)
(304
)(2
88)
(357
)(3
79)
(4,1
25)
NE
T O
THE
R F
INA
NC
ING
SO
UR
CE
S/(U
SE
S)
(467
)(3
44)
(308
)(3
14)
(391
)(2
97)
(286
)(3
90)
(304
)(2
88)
(357
)(3
78)
(4,1
24)
Exc
ess/
(Def
icie
ncy)
of R
ecei
pts
over
Dis
burs
emen
ts30
0(1
87)
(254
)26
0(4
37)
392
68(8
69)
698
(400
)0
428
(1)
CLO
SIN
G B
ALA
NC
E31
012
3(1
31)
129
(308
)84
152
(717
)(1
9)(4
19)
(419
)9
9
CA
SHFL
OW
SPEC
IAL
REV
ENU
E FE
DER
AL
FUN
DS
FY 2
012
(dol
lars
in m
illio
ns)
T-62

2011
2012
Apr
ilM
ayJu
neJu
lyA
ugus
tSe
ptem
ber
Oct
ober
Nov
embe
rD
ecem
ber
Janu
ary
Febr
uary
Mar
chR
esul
tsR
esul
tsR
esul
tsR
esul
tsR
esul
tsR
esul
tsR
esul
tsR
esul
tsPr
ojec
ted
Proj
ecte
dPr
ojec
ted
Proj
ecte
dTo
tal
OPE
NIN
G B
ALA
NC
E45
41,
056
1,19
247
31,
004
1,13
052
81,
385
1,69
974
72,
016
2,12
645
4
REC
EIPT
S:Ta
xes
1,63
860
91,
305
803
904
1,27
377
177
41,
244
1,87
286
691
712
,976
Mis
cella
neou
s R
ecei
pts
6741
6650
7512
487
5487
9910
099
949
Fede
ral G
rant
s3
00
236
20
00
02
3479
TOTA
L R
EC
EIP
TS1,
708
650
1,37
185
51,
015
1,39
985
882
81,
331
1,97
196
81,
050
14,0
04
DIS
BU
RSE
MEN
TS:
Sta
te O
pera
tions
11
65
44
11
131
717
61D
ebt S
ervi
ce15
729
356
610
228
687
810
418
61,
119
9446
51,
622
5,87
2TO
TAL
DIS
BU
RS
EM
EN
TS15
829
457
210
729
088
210
518
71,
132
9547
21,
639
5,93
3
OTH
ER F
INA
NC
ING
SO
UR
CES
(use
s):
Tran
sfer
s fro
m o
ther
fund
s1,
009
403
325
758
494
343
854
370
380
879
288
402
6,50
5Tr
ansf
ers
to o
ther
fund
s(1
,957
)(6
23)
(1,8
43)
(975
)(1
,093
)(1
,462
)(7
50)
(697
)(1
,531
)(1
,486
)(6
74)
(1,3
90)
(14,
481)
NE
T O
THE
R F
INA
NC
ING
SO
UR
CE
S/(U
SE
S)
(948
)(2
20)
(1,5
18)
(217
)(5
99)
(1,1
19)
104
(327
)(1
,151
)(6
07)
(386
)(9
88)
(7,9
76)
Exc
ess/
(Def
icie
ncy)
of R
ecei
pts
over
Dis
burs
emen
ts60
213
6(7
19)
531
126
(602
)85
731
4(9
52)
1,26
911
0(1
,577
)95
CLO
SIN
G B
ALA
NC
E1,
056
1,19
247
31,
004
1,13
052
81,
385
1,69
974
72,
016
2,12
654
954
9
CA
SHFL
OW
(dol
lars
in m
illio
ns)
DEB
T SE
RVI
CE
FUN
DS
FY 2
012
T-63

2011
2012
Intr
a-Fu
ndA
pril
May
June
July
Aug
ust
Sept
embe
rO
ctob
erN
ovem
ber
Dec
embe
rJa
nuar
yFe
brua
ryM
arch
Tran
sfer
Res
ults
Res
ults
Res
ults
Res
ults
Res
ults
Res
ults
Res
ults
Res
ults
Proj
ecte
dPr
ojec
ted
Proj
ecte
dPr
ojec
ted
Elim
inat
ions
Tota
l
OPE
NIN
G B
ALA
NC
E3,
812
8,74
96,
035
5,42
95,
988
5,53
16,
954
6,27
65,
290
4,01
29,
247
9,52
13,
812
REC
EIPT
S:Ta
xes
7,18
62,
940
7,09
03,
690
4,03
06,
768
3,63
23,
722
6,83
08,
206
4,16
86,
270
064
,532
Mis
cella
neou
s R
ecei
pts
1,60
11,
593
1,79
51,
632
1,76
62,
500
1,86
41,
952
1,89
22,
150
1,93
13,
156
023
,832
Fede
ral G
rant
s4,
110
3,07
23,
987
4,13
63,
512
3,79
83,
226
3,69
54,
301
2,55
23,
529
4,02
40
43,9
42
TOTA
L R
EC
EIP
TS12
,897
7,60
512
,872
9,45
89,
308
13,0
668,
722
9,36
913
,023
12,9
089,
628
13,4
500
132,
306
DIS
BU
RSE
MEN
TS:
Sch
ool A
id56
92,
995
2,66
238
672
23,
385
822
1,15
51,
912
546
1,09
27,
085
023
,331
Hig
her E
duca
tion
3320
526
130
341
5544
931
191
4731
347
70
2,61
3A
ll O
ther
Edu
catio
n23
820
932
731
095
6525
321
331
230
219
926
40
2,78
7S
TAR
00
392
00
178
636
2,59
40
087
03,
293
Med
icai
d - D
OH
3,75
53,
167
4,04
44,
092
2,97
92,
845
3,37
24,
354
2,52
62,
886
3,31
22,
373
039
,705
Pub
lic H
ealth
8825
932
719
836
824
922
920
843
822
023
233
90
3,15
5M
enta
l Hyg
iene
9078
589
154
9574
118
897
772
9325
957
90
3,73
5C
hild
ren
and
Fam
ilies
1912
323
623
435
080
372
258
231
195
8241
50
2,59
5Te
mpo
rary
& D
isab
ility
Ass
ista
nce
392
105
128
440
806
137
559
754
403
386
317
523
04,
950
Tran
spor
tatio
n16
444
835
426
347
821
840
550
468
822
632
122
90
4,29
8U
nres
trict
ed A
id1
1229
40
391
90
204
00
144
075
8A
ll O
ther
18
340
945
735
446
431
521
715
657
824
825
596
60
4,60
2To
tal L
ocal
Ass
ista
nce
Gra
nts
5,53
27,
825
10,3
366,
561
6,70
18,
359
6,88
17,
766
10,8
495,
149
6,38
213
,481
095
,822
Per
sona
l Ser
vice
1,04
797
91,
135
965
1,28
899
596
696
51,
148
986
1,21
283
30
12,5
19N
on-P
erso
nal S
ervi
ce45
044
252
739
350
452
053
148
157
251
556
766
80
6,17
0To
tal S
tate
Ope
ratio
ns1,
497
1,42
11,
662
1,35
81,
792
1,51
51,
497
1,44
61,
720
1,50
11,
779
1,50
10
18,6
89
Gen
eral
Sta
te C
harg
es45
242
544
146
448
347
041
448
042
348
524
92,
047
06,
833
Deb
t ser
vice
157
293
566
102
286
878
104
186
1,11
994
465
1,62
20
5,87
2
Cap
ital P
roje
cts
317
350
475
403
500
423
499
472
541
481
481
577
05,
519
TOTA
L D
ISB
UR
SE
ME
NTS
7,95
510
,314
13,4
808,
888
9,76
211
,645
9,39
510
,350
14,6
527,
710
9,35
619
,228
013
2,73
5
OTH
ER F
INA
NC
ING
SO
UR
CES
(use
s):
Tr
ansf
ers
from
oth
er fu
nds
3,47
01,
336
2,50
41,
992
1,93
02,
111
1,94
61,
526
2,27
92,
718
1,38
83,
597
026
,797
Tr
ansf
ers
to o
ther
fund
s(3
,475
)(1
,341
)(2
,502
)(2
,003
)(1
,933
)(2
,109
)(1
,951
)(1
,531
)(2
,280
)(2
,721
)(1
,391
)(3
,549
)0
(26,
786)
B
ond
and
note
pro
ceed
s0
00
00
00
035
240
578
047
5N
ET
OTH
ER
FIN
AN
CIN
G S
OU
RC
ES
/(US
ES
)(5
)(5
)2
(11)
(3)
2(5
)(5
)35
137
212
60
486
Exc
ess/
(Def
icie
ncy)
of R
ecei
pts
over
Dis
burs
emen
ts4,
937
(2,7
14)
(606
)55
9(4
57)
1,42
3(6
78)
(986
)(1
,278
)5,
235
274
(5,6
52)
057
CLO
SIN
G B
ALA
NC
E8,
749
6,03
55,
429
5,98
85,
531
6,95
46,
276
5,29
04,
012
9,24
79,
521
3,86
90
3,86
9
Res
erve
s:C
omm
unity
Pro
ject
s Fu
nd
00
00
00
00
00
0(8
5)0
(85)
Rai
ny D
ay R
eser
ve F
und
00
00
00
00
00
010
00
100
Prio
r-Y
ear L
abor
Agr
eem
ents
(200
7-20
11)
00
00
00
00
00
028
40
284
TOTA
L R
ES
ER
VE
S0
00
00
00
00
00
299
029
9
Exc
ess/
(Def
icie
ncy)
of R
ecei
pts
over
Dis
burs
emen
ts a
fter R
eser
ves
4,93
7(2
,714
)(6
06)
559
(457
)1,
423
(678
)(9
86)
(1,2
78)
5,23
527
4(5
,951
)0
(242
)
CLO
SIN
G B
ALA
NC
E W
ITH
RES
ERVE
S8,
749
6,03
55,
429
5,98
85,
531
6,95
46,
276
5,29
04,
012
9,24
79,
521
3,57
00
3,57
0
CA
SHFL
OW
ALL
GO
VER
NM
ENTA
L FU
ND
SFY
201
2(d
olla
rs in
mill
ions
)
T-64

2011
2012
Intr
a-Fu
ndA
pril
May
June
July
Aug
ust
Sept
embe
rO
ctob
erN
ovem
ber
Dec
embe
rJa
nuar
yFe
brua
ryM
arch
Tran
sfer
Res
ults
Res
ults
Res
ults
Res
ults
Res
ults
Res
ults
Res
ults
Res
ults
Proj
ecte
dPr
ojec
ted
Proj
ecte
dPr
ojec
ted
Elim
inat
ions
Tota
l
OPE
NIN
G B
ALA
NC
E3,
907
8,50
55,
944
5,56
05,
864
5,78
36,
800
6,04
96,
115
4,13
79,
752
10,0
003,
907
REC
EIPT
S:Ta
xes
7,18
62,
940
7,09
03,
690
4,03
06,
768
3,63
23,
722
6,83
08,
206
4,16
86,
270
064
,532
Mis
cella
neou
s R
ecei
pts
1,58
91,
558
1,78
61,
621
1,74
92,
491
1,85
11,
939
1,88
02,
128
1,91
33,
195
023
,700
Fede
ral G
rant
s5
130
236
220
015
02
500
145
TOTA
L R
EC
EIP
TS8,
780
4,51
18,
876
5,31
35,
815
9,28
15,
483
5,66
18,
725
10,3
346,
083
9,51
50
88,3
77
DIS
BU
RSE
MEN
TS:
Sch
ool A
id23
32,
579
2,21
314
554
43,
156
700
1,01
41,
575
372
568
6,57
80
19,6
77H
ighe
r Edu
catio
n32
1952
512
934
151
449
3119
147
313
477
02,
605
All
Oth
er E
duca
tion
2421
223
267
4333
231
6416
327
417
719
80
1,71
8S
TAR
00
392
00
178
636
2,59
40
087
03,
293
Med
icai
d - D
OH
1,35
61,
365
1,27
01,
617
1,17
969
11,
640
1,79
688
11,
169
1,42
789
00
15,2
81P
ublic
Hea
lth37
136
235
104
262
152
163
119
271
148
159
234
02,
020
Men
tal H
ygie
ne70
6757
114
475
729
174
7676
277
257
578
03,
580
Chi
ldre
n an
d Fa
mili
es9
115
230
6771
4425
578
6218
078
408
01,
597
Tem
pora
ry &
Dis
abili
ty A
ssis
tanc
e32
763
6616
719
266
9475
7679
2018
80
1,41
3Tr
ansp
orta
tion
161
445
353
262
475
214
402
500
686
223
318
219
04,
258
Unr
estri
cted
Aid
112
294
03
919
020
40
014
40
758
All
Oth
er
147
306
300
282
315
165
149
9432
413
014
564
20
2,99
9To
tal L
ocal
Ass
ista
nce
Gra
nts
2,39
75,
128
6,67
23,
184
3,50
05,
570
4,27
23,
883
7,78
92,
699
3,46
210
,643
059
,199
Per
sona
l Ser
vice
994
922
1,08
891
71,
218
947
918
920
1,10
094
91,
162
741
011
,876
Non
-Per
sona
l Ser
vice
392
392
465
342
432
396
431
411
498
431
446
575
05,
211
Tota
l Sta
te O
pera
tions
1,38
61,
314
1,55
31,
259
1,65
01,
343
1,34
91,
331
1,59
81,
380
1,60
81,
316
017
,087
Gen
eral
Sta
te C
harg
es44
940
040
146
146
144
140
142
042
046
723
91,
976
06,
536
Deb
t ser
vice
157
293
566
102
286
878
104
186
1,11
994
465
1,62
20
5,87
2
Cap
ital P
roje
cts
254
276
379
307
388
331
389
375
433
405
420
637
04,
594
TOTA
L D
ISB
UR
SE
ME
NTS
4,64
37,
411
9,57
15,
313
6,28
58,
563
6,51
56,
195
11,3
595,
045
6,19
416
,194
093
,288
OTH
ER F
INA
NC
ING
SO
UR
CES
(use
s):
Tr
ansf
ers
from
oth
er fu
nds
3,54
21,
391
2,53
62,
022
1,96
12,
185
2,02
51,
851
2,31
52,
737
1,43
63,
936
(800
)27
,137
Tr
ansf
ers
to o
ther
fund
s(3
,081
)(1
,052
)(2
,225
)(1
,718
)(1
,572
)(1
,886
)(1
,744
)(1
,251
)(2
,011
)(2
,451
)(1
,082
)(3
,376
)80
0(2
2,64
9)
Bon
d an
d no
te p
roce
eds
00
00
00
00
352
405
780
475
NE
T O
THE
R F
INA
NC
ING
SO
UR
CE
S/(U
SE
S)
461
339
311
304
389
299
281
600
656
326
359
638
04,
963
Exc
ess/
(Def
icie
ncy)
of R
ecei
pts
over
Dis
burs
emen
ts4,
598
(2,5
61)
(384
)30
4(8
1)1,
017
(751
)66
(1,9
78)
5,61
524
8(6
,041
)0
52
CLO
SIN
G B
ALA
NC
E8,
505
5,94
45,
560
5,86
45,
783
6,80
06,
049
6,11
54,
137
9,75
210
,000
3,95
90
3,95
9
Res
erve
s:C
omm
unity
Pro
ject
s Fu
nd
00
00
00
00
00
0(8
5)0
(85)
Rai
ny D
ay R
eser
ve F
und
00
00
00
00
00
010
00
100
Prio
r-Y
ear L
abor
Agr
eem
ents
(200
7-20
11)
00
00
00
00
00
028
40
284
TOTA
L R
ES
ER
VE
S0
00
00
00
00
00
299
029
9
Exc
ess/
(Def
icie
ncy)
of R
ecei
pts
over
Dis
burs
emen
ts a
fter R
eser
ves
4,59
8(2
,561
)(3
84)
304
(81)
1,01
7(7
51)
66(1
,978
)5,
615
248
(6,3
40)
0(2
47)
CLO
SIN
G B
ALA
NC
E W
ITH
RES
ERVE
S8,
505
5,94
45,
560
5,86
45,
783
6,80
06,
049
6,11
54,
137
9,75
210
,000
3,66
00
3,66
0
CA
SHFL
OW
STA
TE F
UN
DS
FY 2
012
(dol
lars
in m
illio
ns)
T-65

2012
2013
Apr
ilM
ayJu
neJu
lyA
ugus
tSe
ptem
ber
Oct
ober
Nov
embe
rD
ecem
ber
Janu
ary
Febr
uary
Mar
chPr
ojec
ted
Proj
ecte
dPr
ojec
ted
Proj
ecte
dPr
ojec
ted
Proj
ecte
dPr
ojec
ted
Proj
ecte
dPr
ojec
ted
Proj
ecte
dPr
ojec
ted
Proj
ecte
dTo
tal
OPE
NIN
G B
ALA
NC
E1,
675
4,59
91,
381
1,77
12,
025
1,49
04,
831
3,59
82,
539
1,86
96,
294
6,16
41,
675
REC
EIPT
S:P
erso
nal I
ncom
e Ta
x3,
899
1,06
42,
701
1,78
61,
864
2,85
51,
744
1,45
532
35,
363
1,94
81,
909
26,9
11U
ser T
axes
and
Fee
s71
169
089
972
770
591
571
070
392
775
264
395
99,
341
Bus
ines
s Ta
xes
5447
1,10
663
891,
382
100
691,
232
104
133
1,59
85,
977
Oth
er T
axes
9595
9695
9696
9595
9595
9596
1,14
4To
tal T
axes
4,75
91,
896
4,80
22,
671
2,75
45,
248
2,64
92,
322
2,57
76,
314
2,81
94,
562
43,3
73
Lice
nses
, Fee
s, e
tc.
5472
6438
6760
4957
5451
5441
661
Aba
ndon
ed P
rope
rty1
140
3318
7620
158
5969
5225
878
5A
BC
Lic
ense
Fee
45
55
55
33
56
32
51M
otor
veh
icle
fees
00
00
00
1417
1717
1717
99R
eim
burs
emen
ts4
756
218
1512
1225
1010
3120
2In
vest
men
t Inc
ome
10
11
00
11
11
12
10O
ther
Tra
nsac
tions
2216
144
5823
303
3942
9339
6941
31,
261
Tota
l Mis
cella
neou
s R
ecei
pts
8610
131
013
713
145
913
829
025
419
320
676
43,
069
Fede
ral G
rant
s0
130
00
150
015
00
1760
PIT
in E
xces
s of
Rev
enue
Bon
d D
ebt S
ervi
ce1,
299
212
1,03
751
320
71,
130
398
173
1,00
789
540
11,
012
8,28
4S
ales
Tax
in E
xces
s of
LG
AC
Deb
t Ser
vice
213
4044
721
815
227
821
621
428
622
83
171
2,46
6R
eal E
stat
e Ta
xes
in E
xces
s of
CW
/CA
Deb
t Ser
vice
4748
3450
5044
4324
3333
3434
474
All
Oth
er23
462
(2)
534
53(3
)47
(3)
7569
498
9To
tal T
rans
fers
from
Oth
er F
unds
1,58
230
41,
580
779
414
1,48
671
040
81,
373
1,15
351
31,
911
12,2
13
TOTA
L R
EC
EIP
TS6,
427
2,31
46,
692
3,58
73,
299
7,20
83,
497
3,02
04,
219
7,66
03,
538
7,25
458
,715
DIS
BU
RSE
MEN
TS:
Sch
ool A
id23
42,
620
1,86
012
053
01,
225
600
930
1,49
822
546
56,
642
16,9
49H
ighe
r Edu
catio
n22
856
611
531
351
470
2220
933
322
499
2,63
0A
ll O
ther
Edu
catio
n23
116
263
118
6628
156
5529
099
279
236
1,88
2M
edic
aid
- DO
H89
51,
025
1,08
395
31,
197
428
1,22
01,
334
771
630
931
110
,468
Pub
lic H
ealth
4543
111
7036
6460
2148
5120
9065
9M
enta
l Hyg
iene
01
355
11
372
166
135
611
512
437
51,
867
Chi
ldre
n an
d Fa
mili
es9
122
246
7474
6324
885
6917
869
344
1,58
1Te
mpo
rary
& D
isab
ility
Ass
ista
nce
350
100
119
100
100
119
100
100
119
100
3115
01,
488
Tran
spor
tatio
n0
240
024
00
2415
010
198
Unr
estri
cted
Aid
214
298
22
9711
220
52
413
777
6A
ll O
ther
36
4017
149
4086
(29)
4244
168
165
193
1,00
5To
tal L
ocal
Ass
ista
nce
Gra
nts
1,61
64,
113
5,07
21,
602
2,38
32,
786
2,90
22,
616
3,62
41,
601
2,42
08,
668
39,4
03
Per
sona
l Ser
vice
560
635
514
413
534
423
404
452
416
510
422
446
5,72
9N
on-P
erso
nal S
ervi
ce16
315
222
714
312
313
311
213
114
913
317
421
91,
859
Tota
l Sta
te O
pera
tions
723
787
741
556
657
556
516
583
565
643
596
665
7,58
8
Gen
eral
Sta
te C
harg
es28
736
614
719
843
229
532
036
020
927
123
41,
315
4,43
4
Deb
t Ser
vice
507
0(1
7)43
6(4
)(1
12)
547
0(2
)42
2(1
8)(1
49)
1,61
0C
apita
l Pro
ject
s(3
8)15
8620
81(4
1)45
8015
771
3157
21,
079
S
tate
Sha
re M
edic
aid
248
215
154
285
210
326
227
215
304
195
278
246
2,90
3
SU
NY
Ope
ratio
ns0
00
200
00
010
00
090
039
0O
ther
Pur
pose
s16
036
119
3675
5717
312
532
3237
303
1,18
5To
tal T
rans
fers
to O
ther
Fun
ds87
726
634
297
736
223
099
252
049
172
041
897
27,
167
TOTA
L D
ISB
UR
SE
ME
NTS
3,50
35,
532
6,30
23,
333
3,83
43,
867
4,73
04,
079
4,88
93,
235
3,66
811
,620
58,5
92
Exc
ess/
(Def
icie
ncy)
of R
ecei
pts
over
Dis
burs
emen
ts2,
924
(3,2
18)
390
254
(535
)3,
341
(1,2
33)
(1,0
59)
(670
)4,
425
(130
)(4
,366
)12
3
CLO
SIN
G B
ALA
NC
E4,
599
1,38
11,
771
2,02
51,
490
4,83
13,
598
2,53
91,
869
6,29
46,
164
1,79
81,
798
RES
ERVE
S:C
omm
unity
Pro
ject
s Fu
nd
00
00
00
00
00
0(5
1)(5
1)P
rior-
Yea
r Lab
or A
gree
men
ts (2
007-
2011
)0
00
00
00
00
00
174
174
TOTA
RE
SE
RV
ES
00
00
00
00
00
012
312
3
Exc
ess/
(Def
icie
ncy)
of R
ecei
pts
over
Dis
burs
emen
ts a
fter R
eser
ves
2,92
4(3
,218
)39
025
4(5
35)
3,34
1(1
,233
)(1
,059
)(6
70)
4,42
5(1
30)
(4,4
89)
0
CLO
SIN
G B
ALA
NC
E W
ITH
RES
ERVE
S4,
599
1,38
11,
771
2,02
51,
490
4,83
13,
598
2,53
91,
869
6,29
46,
164
1,67
51,
675
CA
SHFL
OW
(dol
lars
in m
illio
ns)
GEN
ERA
L FU
ND
FY 2
013
T-66

2012
2013
Intr
a-Fu
ndA
pril
May
June
July
Aug
ust
Sept
embe
rO
ctob
erN
ovem
ber
Dec
embe
rJa
nuar
yFe
brua
ryM
arch
Tran
sfer
Proj
ecte
dPr
ojec
ted
Proj
ecte
dPr
ojec
ted
Proj
ecte
dPr
ojec
ted
Proj
ecte
dPr
ojec
ted
Proj
ecte
dPr
ojec
ted
Proj
ecte
dPr
ojec
ted
Elim
inat
ions
Tota
l
OPE
NIN
G B
ALA
NC
E4,
124
8,09
05,
228
4,84
46,
082
6,18
47,
322
7,00
26,
310
4,59
611
,045
11,2
064,
124
REC
EIPT
S:Ta
xes
6,70
12,
832
7,06
33,
883
4,00
17,
335
3,87
53,
466
7,07
08,
754
4,03
16,
121
065
,132
Mis
cella
neou
s R
ecei
pts
1,40
01,
443
1,63
31,
448
1,56
02,
125
1,59
71,
656
1,57
62,
020
1,67
21,
889
020
,019
Fede
ral G
rant
s0
130
02
530
015
02
550
140
TOTA
L R
EC
EIP
TS8,
101
4,28
88,
696
5,33
15,
563
9,51
35,
472
5,12
28,
661
10,7
745,
705
8,06
50
85,2
91
DIS
BU
RSE
MEN
TS:
Sch
ool A
id23
42,
620
2,19
312
053
03,
194
725
1,05
51,
623
350
591
6,76
70
20,0
02H
ighe
r Edu
catio
n22
856
611
531
351
470
2220
933
322
531
02,
662
All
Oth
er E
duca
tion
2311
726
311
867
282
5655
292
100
279
238
01,
890
STA
R0
040
10
019
222
742,
633
00
00
3,32
2M
edic
aid
- DO
H1,
234
1,53
81,
392
1,23
91,
580
814
1,62
91,
764
1,07
51,
077
1,51
11,
006
015
,859
Pub
lic H
ealth
9710
532
714
011
218
111
995
238
132
107
265
01,
918
Men
tal H
ygie
ne81
6047
217
811
555
236
378
532
286
229
628
03,
574
Chi
ldre
n an
d Fa
mili
es9
122
246
7474
6324
885
6917
869
345
01,
582
Tem
pora
ry &
Dis
abili
ty A
ssis
tanc
e35
110
112
010
110
112
110
010
011
910
031
147
01,
492
Tran
spor
tatio
n19
852
032
631
355
932
431
758
563
316
929
316
10
4,39
8U
nres
trict
ed A
id2
1429
82
297
112
205
24
137
077
6A
ll O
ther
76
7921
011
285
150
1981
8220
720
527
90
1,58
5To
tal L
ocal
Ass
ista
nce
Gra
nts
2,32
75,
284
6,81
42,
512
3,53
86,
021
4,07
93,
996
7,71
02,
634
3,64
110
,504
059
,060
Per
sona
l Ser
vice
1,04
61,
187
937
922
1,15
895
196
51,
018
883
1,11
11,
009
778
011
,965
Non
-Per
sona
l Ser
vice
436
383
548
383
403
403
450
456
522
412
474
297
05,
167
Tota
l Sta
te O
pera
tions
1,48
21,
570
1,48
51,
305
1,56
11,
354
1,41
51,
474
1,40
51,
523
1,48
31,
075
017
,132
Gen
eral
Sta
te C
harg
es47
141
141
342
648
550
751
941
444
444
629
21,
560
06,
388
Deb
t ser
vice
176
243
605
9532
797
910
521
51,
086
9549
01,
733
06,
149
Cap
ital P
roje
cts
00
00
00
00
00
05
05
TOTA
L D
ISB
UR
SE
ME
NTS
4,45
67,
508
9,31
74,
338
5,91
18,
861
6,11
86,
099
10,6
454,
698
5,90
614
,877
088
,734
OTH
ER F
INA
NC
ING
SO
UR
CES
(use
s):
Tr
ansf
ers
from
oth
er fu
nds
2,98
31,
219
2,43
32,
193
1,67
02,
537
2,24
41,
473
2,55
32,
604
1,58
03,
349
(619
)26
,219
Tr
ansf
ers
to o
ther
fund
s(2
,662
)(8
61)
(2,1
96)
(1,9
48)
(1,2
20)
(2,0
51)
(1,9
18)
(1,1
88)
(2,2
83)
(2,2
31)
(1,2
18)
(3,0
18)
619
(22,
175)
B
ond
and
note
pro
ceed
s0
00
00
00
00
00
00
0N
ET
OTH
ER
FIN
AN
CIN
G S
OU
RC
ES
/(US
ES
)32
135
823
724
545
048
632
628
527
037
336
233
10
4,04
4
Exc
ess/
(Def
icie
ncy)
of R
ecei
pts
over
Dis
burs
emen
ts3,
966
(2,8
62)
(384
)1,
238
102
1,13
8(3
20)
(692
)(1
,714
)6,
449
161
(6,4
81)
060
1
CLO
SIN
G B
ALA
NC
E8,
090
5,22
84,
844
6,08
26,
184
7,32
27,
002
6,31
04,
596
11,0
4511
,206
4,72
50
4,72
5
RES
ERVE
S:C
omm
unity
Pro
ject
s Fu
nd
00
00
00
00
00
0(5
1)0
(51)
Prio
r-Y
ear L
abor
Agr
eem
ents
(200
7-20
11)
00
00
00
00
00
017
40
174
TOTA
L R
ES
ER
VE
S0
00
00
00
00
00
123
012
3
Exc
ess/
(Def
icie
ncy)
of R
ecei
pts
over
Dis
burs
emen
ts a
fter R
eser
ves
3,96
6(2
,862
)(3
84)
1,23
810
21,
138
(320
)(6
92)
(1,7
14)
6,44
916
1(6
,604
)0
478
CLO
SIN
G B
ALA
NC
E W
ITH
RES
ERVE
S8,
090
5,22
84,
844
6,08
26,
184
7,32
27,
002
6,31
04,
596
11,0
4511
,206
4,60
20
4,60
2
CA
SHFL
OW
STA
TE O
PER
ATI
NG
FU
ND
SFY
201
3(d
olla
rs in
mill
ions
)
T-67

2012
2013
Apr
ilM
ayJu
n eJu
lyA
ugus
tSe
ptem
ber
Oct
ober
Nov
embe
rD
ecem
ber
Janu
ary
Febr
uary
Mar
chPr
ojec
ted
Proj
ecte
dPr
ojec
ted
Proj
ecte
dPr
ojec
ted
Proj
ecte
dPr
ojec
ted
Proj
ecte
dPr
ojec
ted
Proj
ecte
dPr
ojec
ted
Proj
ecte
dTo
tal
OPE
NIN
G B
ALA
NC
E(2
64)
(277
)(2
32)
(237
)(2
24)
(266
)(4
00)
(435
)(4
63)
(471
)(5
21)
(487
)(2
64)
REC
EIPT
S:Ta
xes
9391
135
121
115
142
111
109
140
110
106
128
1,40
1M
isce
llane
ous
Rec
eipt
s33
234
325
432
128
032
523
625
426
623
726
399
44,
105
Fede
ral G
rant
s13
914
916
518
019
921
321
119
918
016
514
913
62,
085
TOTA
L R
EC
EIP
TS56
458
355
462
259
468
055
856
258
651
251
81,
258
7,59
1
DIS
BU
RSE
MEN
TS:
Loca
l Ass
ista
nce
Gra
nts
9812
511
714
914
913
513
215
929
512
212
738
71,
995
Tota
l Loc
al A
ssis
tanc
e G
rant
s98
125
117
149
149
135
132
159
295
122
127
387
1,99
5
Eco
nom
ic D
evel
opm
ent
12
144
411
72
96
494
158
Par
ks &
the
Env
ironm
ent
2121
2321
2321
2321
2121
2322
946
8Tr
ansp
orta
tion
210
224
271
263
321
326
294
280
295
280
224
399
3,38
7H
ealth
& S
ocia
l Wel
fare
33
33
33
33
33
31
34M
enta
l Hyg
iene
68
98
910
67
1213
1233
133
Pub
lic P
rote
ctio
n25
2328
2727
2725
2526
2332
4433
2E
duca
tion
101
7114
779
106
7372
9866
9074
208
1,18
5A
ll O
ther
17
1819
1818
1919
1817
1718
(46)
152
Tota
l Cap
ital P
roje
cts
384
370
514
423
511
490
449
454
449
453
390
963
5,84
9
TOTA
L D
ISB
UR
SE
ME
NTS
482
495
631
572
660
625
581
613
744
575
517
1,35
07,
844
OTH
ER F
INA
NC
ING
SO
UR
CES
(use
s):
Tran
sfer
s fro
m o
ther
fund
s(3
4)18
140
2485
1349
8421
174
3565
31,
352
Tran
sfer
s to
oth
er fu
nds
(94)
(94)
(101
)(9
4)(9
4)(2
35)
(94)
(94)
(94)
(94)
(35)
(373
)(1
,496
)B
ond
and
note
pro
ceed
s33
3333
3333
3333
3333
3333
3740
0N
ET
OTH
ER
FIN
AN
CIN
G S
OU
RC
ES
/(US
ES
)(9
5)(4
3)72
(37)
24(1
89)
(12)
2315
013
3331
725
6
Exc
ess/
(Def
icie
ncy)
of R
ecei
pts
over
Dis
burs
emen
ts(1
3)45
(5)
13(4
2)(1
34)
(35)
(28)
(8)
(50)
3422
53
CLO
SIN
G B
ALA
NC
E(2
77)
(232
)(2
37)
(224
)(2
66)
(400
)(4
35)
(463
)(4
71)
(521
)(4
87)
(262
)(2
61)
CA
SHFL
OW
(dol
lars
in m
illio
ns)
CA
PITA
L PR
OJE
CTS
FU
ND
SFY
201
3
T-68
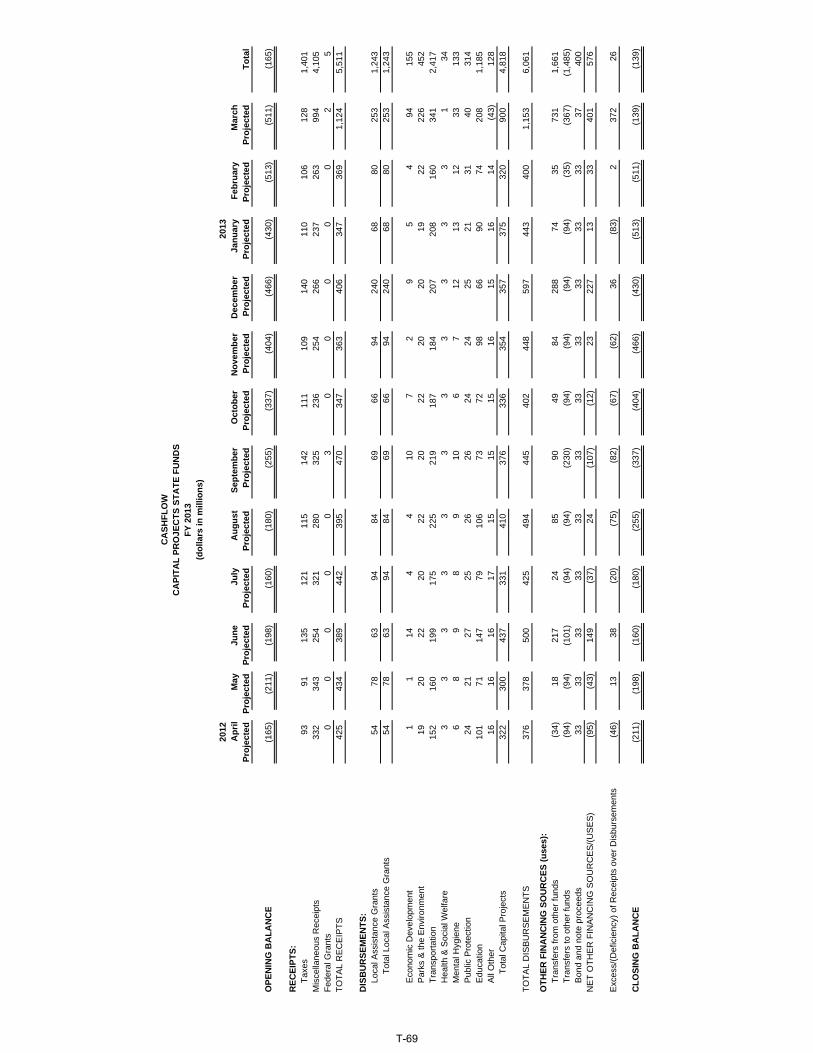
2012
2013
Apr
ilM
ayJu
neJu
lyA
ugus
tSe
ptem
ber
Oct
ober
Nov
embe
rD
ecem
ber
Janu
ary
Febr
uary
Mar
chPr
ojec
ted
Proj
ecte
dPr
ojec
ted
Proj
ecte
dPr
ojec
ted
Proj
ecte
dPr
ojec
ted
Proj
ecte
dPr
ojec
ted
Proj
ecte
dPr
ojec
ted
Proj
ecte
dTo
tal
OPE
NIN
G B
ALA
NC
E(1
65)
(211
)(1
98)
(160
)(1
80)
(255
)(3
37)
(404
)(4
66)
(430
)(5
13)
(511
)(1
65)
REC
EIPT
S:Ta
xes
9391
135
121
115
142
111
109
140
110
106
128
1,40
1M
isce
llane
ous
Rec
eipt
s33
234
325
432
128
032
523
625
426
623
726
399
44,
105
Fede
ral G
rant
s0
00
00
30
00
00
25
TOTA
L R
EC
EIP
TS42
543
438
944
239
547
034
736
340
634
736
91,
124
5,51
1
DIS
BU
RSE
MEN
TS:
Loca
l Ass
ista
nce
Gra
nts
5478
6394
8469
6694
240
6880
253
1,24
3To
tal L
ocal
Ass
ista
nce
Gra
nts
5478
6394
8469
6694
240
6880
253
1,24
3
Eco
nom
ic D
evel
opm
ent
11
144
410
72
95
494
155
Par
ks &
the
Env
ironm
ent
1920
2220
2220
2220
2019
2222
645
2Tr
ansp
orta
tion
152
160
199
175
225
219
187
184
207
208
160
341
2,41
7H
ealth
& S
ocia
l Wel
fare
33
33
33
33
33
31
34M
enta
l Hyg
iene
68
98
910
67
1213
1233
133
Pub
lic P
rote
ctio
n24
2127
2526
2624
2425
2131
4031
4E
duca
tion
101
7114
779
106
7372
9866
9074
208
1,18
5A
ll O
ther
16
1616
1715
1515
1615
1614
(43)
128
Tota
l Cap
ital P
roje
cts
322
300
437
331
410
376
336
354
357
375
320
900
4,81
8
TOTA
L D
ISB
UR
SE
ME
NTS
376
378
500
425
494
445
402
448
597
443
400
1,15
36,
061
OTH
ER F
INA
NC
ING
SO
UR
CES
(use
s):
Tran
sfer
s fro
m o
ther
fund
s(3
4)18
217
2485
9049
8428
874
3573
11,
661
Tran
sfer
s to
oth
er fu
nds
(94)
(94)
(101
)(9
4)(9
4)(2
30)
(94)
(94)
(94)
(94)
(35)
(367
)(1
,485
)B
ond
and
note
pro
ceed
s33
3333
3333
3333
3333
3333
3740
0N
ET
OTH
ER
FIN
AN
CIN
G S
OU
RC
ES
/(US
ES
)(9
5)(4
3)14
9(3
7)24
(107
)(1
2)23
227
1333
401
576
Exc
ess/
(Def
icie
ncy)
of R
ecei
pts
over
Dis
burs
emen
ts(4
6)13
38(2
0)(7
5)(8
2)(6
7)(6
2)36
(83)
237
226
CLO
SIN
G B
ALA
NC
E(2
11)
(198
)(1
60)
(180
)(2
55)
(337
)(4
04)
(466
)(4
30)
(513
)(5
11)
(139
)(1
39)
CA
SHFL
OW
(dol
lars
in m
illio
ns)
CA
PITA
L PR
OJE
CTS
STA
TE F
UN
DS
FY 2
013
T-69
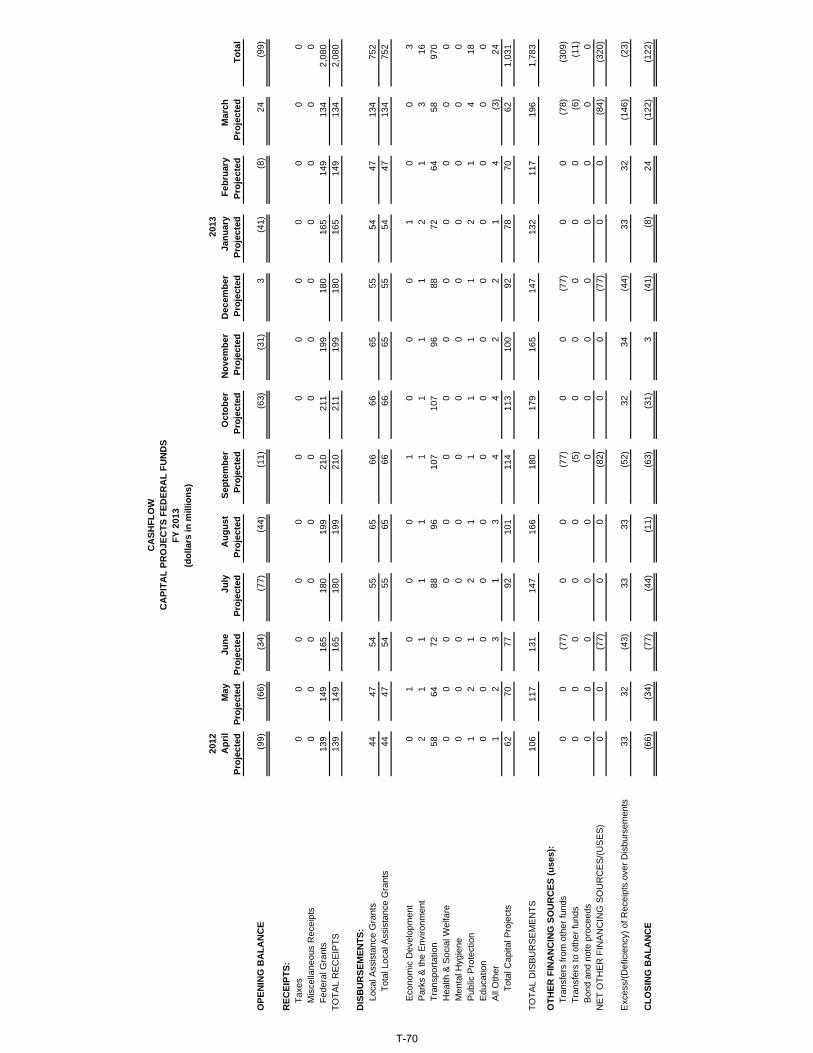
2012
2013
Apr
ilM
ayJu
neJu
lyA
ugus
tSe
ptem
ber
Oct
ober
Nov
embe
rD
ecem
ber
Janu
ary
Febr
uary
Mar
chPr
ojec
ted
Proj
ecte
dPr
ojec
ted
Proj
ecte
dPr
ojec
ted
Proj
ecte
dPr
ojec
ted
Proj
ecte
dPr
ojec
ted
Proj
ecte
dPr
ojec
ted
Proj
ecte
dTo
tal
OPE
NIN
G B
ALA
NC
E(9
9)(6
6)(3
4)(7
7)(4
4)(1
1)(6
3)(3
1)3
(41)
(8)
24(9
9)
REC
EIPT
S:
Taxe
s0
00
00
00
00
00
00
M
isce
llane
ous
Rec
eipt
s0
00
00
00
00
00
00
Fe
dera
l Gra
nts
139
149
165
180
199
210
211
199
180
165
149
134
2,08
0TO
TAL
RE
CE
IPTS
139
149
165
180
199
210
211
199
180
165
149
134
2,08
0
DIS
BU
RSE
MEN
TS:
Loca
l Ass
ista
nce
Gra
nts
4447
5455
6566
6665
5554
4713
475
2To
tal L
ocal
Ass
ista
nce
Gra
nts
4447
5455
6566
6665
5554
4713
475
2
Eco
nom
ic D
evel
opm
ent
01
00
01
00
01
00
3P
arks
& th
e E
nviro
nmen
t2
11
11
11
11
21
316
Tran
spor
tatio
n58
6472
8896
107
107
9688
7264
5897
0H
ealth
& S
ocia
l Wel
fare
00
00
00
00
00
00
0M
enta
l Hyg
iene
00
00
00
00
00
00
0P
ublic
Pro
tect
ion
12
12
11
11
12
14
18E
duca
tion
00
00
00
00
00
00
0A
ll O
ther
1
23
13
44
22
14
(3)
24To
tal C
apita
l Pro
ject
s62
7077
9210
111
411
310
092
7870
621,
031
TOTA
L D
ISB
UR
SE
ME
NTS
106
117
131
147
166
180
179
165
147
132
117
196
1,78
3
OTH
ER F
INA
NC
ING
SO
UR
CES
(use
s):
Tr
ansf
ers
from
oth
er fu
nds
00
(77)
00
(77)
00
(77)
00
(78)
(309
)
Tran
sfer
s to
oth
er fu
nds
00
00
0(5
)0
00
00
(6)
(11)
B
ond
and
note
pro
ceed
s0
00
00
00
00
00
00
NE
T O
THE
R F
INA
NC
ING
SO
UR
CE
S/(U
SE
S)
00
(77)
00
(82)
00
(77)
00
(84)
(320
)
Exc
ess/
(Def
icie
ncy)
of R
ecei
pts
over
Dis
burs
emen
ts33
32(4
3)33
33(5
2)32
34(4
4)33
32(1
46)
(23)
CLO
SIN
G B
ALA
NC
E(6
6)(3
4)(7
7)(4
4)(1
1)(6
3)(3
1)3
(41)
(8)
24(1
22)
(122
)
CA
SHFL
OW
(dol
lars
in m
illio
ns)
CA
PITA
L PR
OJE
CTS
FED
ERA
L FU
ND
SFY
201
3
T-70

2012
2013
Intr
a-Fu
ndA
pril
May
June
July
Aug
ust
Sept
embe
rO
ctob
erN
ovem
ber
Dec
embe
rJa
nuar
yFe
brua
ryM
arch
Tran
sfer
Proj
ecte
dPr
ojec
ted
Proj
ecte
dPr
ojec
ted
Proj
ecte
dPr
ojec
ted
Proj
ecte
dPr
ojec
ted
Proj
ecte
dPr
ojec
ted
Proj
ecte
dPr
ojec
ted
Elim
inat
ions
Tota
l
OPE
NIN
G B
ALA
NC
E1,
909
2,47
32,
611
2,47
32,
485
3,22
91,
902
1,65
92,
136
2,04
42,
701
2,97
21,
909
REC
EIPT
S:P
erso
nal I
ncom
e Ta
x0
040
60
018
822
742,
633
00
(1)
03,
322
Use
r Tax
es a
nd F
ees
214
161
202
203
185
210
194
169
208
189
150
165
02,
250
Bus
ines
s Ta
xes
5047
228
5758
283
5853
252
5962
308
01,
515
Oth
er T
axes
107
106
6981
111
6096
9287
135
112
104
01,
160
Tota
l Tax
es37
131
490
534
135
474
137
038
83,
180
383
324
576
08,
247
HC
RA
375
375
375
400
375
325
400
450
375
632
350
375
04,
807
Sta
te U
nive
rsity
Inco
me
253
239
278
226
360
562
334
262
268
467
492
318
04,
059
Lotte
ry24
429
425
224
229
925
629
424
525
429
424
326
80
3,18
5M
edic
aid
6969
6969
6969
6969
6969
6972
083
1M
otor
veh
icle
fees
4653
5243
3960
3826
3727
2932
048
2O
ther
rece
ipts
261
235
223
261
214
318
262
249
248
280
216
(46)
02,
721
Tota
l Mis
cella
neou
s R
ecei
pts
1,24
81,
265
1,24
91,
241
1,35
61,
590
1,39
71,
301
1,25
11,
769
1,39
91,
019
016
,085
Fede
ral G
rant
s3,
087
3,22
03,
277
2,63
93,
659
3,10
52,
589
3,48
03,
367
3,38
43,
596
4,30
90
39,7
12
TOTA
L R
EC
EIP
TS4,
706
4,79
95,
431
4,22
15,
369
5,43
64,
356
5,16
97,
798
5,53
65,
319
5,90
40
64,0
44
DIS
BU
RSE
MEN
TS:
Sch
ool A
id27
025
163
221
211
12,
046
232
258
358
383
553
590
05,
896
Hig
her E
duca
tion
10
11
11
00
11
132
040
All
Oth
er E
duca
tion
7565
6651
2925
6127
4113
810
110
30
782
STA
R0
040
10
019
222
742,
633
00
00
3,32
2M
edic
aid
- DO
H2,
333
2,55
52,
342
2,29
72,
395
2,41
92,
421
2,44
22,
338
2,45
92,
592
3,01
60
29,6
09P
ublic
Hea
lth12
715
331
617
217
422
913
816
929
417
818
029
80
2,42
8M
enta
l Hyg
iene
8965
126
184
127
189
206
9322
318
711
526
20
1,86
6C
hild
ren
and
Fam
ilies
5480
5559
120
5963
6591
7777
136
093
6Te
mpo
rary
& D
isab
ility
Ass
ista
nce
262
262
262
262
262
263
261
261
261
261
261
516
03,
394
Tran
spor
tatio
n20
149
932
931
653
832
732
056
462
117
228
616
70
4,34
0U
nres
trict
ed A
id0
00
00
00
00
00
00
0A
ll O
ther
93
8052
123
9112
421
104
104
9093
199
01,
174
Tota
l Loc
al A
ssis
tanc
e G
rant
s3,
505
4,01
04,
582
3,67
73,
848
5,87
43,
745
4,05
76,
965
3,94
64,
259
5,31
90
53,7
87
Per
sona
l Ser
vice
534
598
467
554
687
573
606
610
511
662
633
402
06,
837
Non
-Per
sona
l Ser
vice
331
282
369
293
337
377
432
387
391
344
428
177
04,
148
Tota
l Sta
te O
pera
tions
865
880
836
847
1,02
495
01,
038
997
902
1,00
61,
061
579
010
,985
Gen
eral
Sta
te C
harg
es18
947
333
232
5626
521
270
287
180
8031
70
2,26
8
Cap
ital P
roje
cts
00
00
00
00
00
05
05
TOTA
L D
ISB
UR
SE
ME
NTS
4,55
94,
937
5,75
14,
756
4,92
87,
089
4,99
55,
124
8,15
45,
132
5,40
06,
220
067
,045
OTH
ER F
INA
NC
ING
SO
UR
CES
(use
s):
Tran
sfer
s fro
m o
ther
fund
s59
953
148
569
671
865
060
568
369
657
772
175
17,
712
Tran
sfer
s to
oth
er fu
nds
(182
)(2
55)
(303
)(1
49)
(415
)(3
24)
(209
)(2
51)
(432
)(3
24)
(369
)(1
,096
)(4
,309
)
NE
T O
THE
R F
INA
NC
ING
SO
UR
CE
S/(U
SE
S)
417
276
182
547
303
326
396
432
264
253
352
(345
)0
3,40
3
Exc
ess/
(Def
icie
ncy)
of R
ecei
pts
over
Dis
burs
emen
ts56
413
8(1
38)
1274
4(1
,327
)(2
43)
477
(92)
657
271
(661
)0
402
CLO
SIN
G B
ALA
NC
E2,
473
2,61
12,
473
2,48
53,
229
1,90
21,
659
2,13
62,
044
2,70
12,
972
2,31
10
2,31
1
CA
SHFL
OW
SPEC
IAL
REV
ENU
E FU
ND
SFY
201
3(d
olla
rs in
mill
ions
)
T-71

2012
2013
Intr
a-Fu
ndA
pril
May
June
July
Aug
ust
Sept
embe
rO
ctob
erN
ovem
ber
Dec
embe
rJa
nuar
yFe
brua
ryM
arch
Tran
sfer
Proj
ecte
dPr
ojec
ted
Proj
ecte
dPr
ojec
ted
Proj
ecte
dPr
ojec
ted
Proj
ecte
dPr
ojec
ted
Proj
ecte
dPr
ojec
ted
Proj
ecte
dPr
ojec
ted
Elim
inat
ions
Tota
l
OPE
NIN
G B
ALA
NC
E1,
900
2,46
42,
602
2,46
32,
875
3,22
01,
893
2,05
02,
126
2,03
42,
691
2,96
21,
900
REC
EIPT
S:P
erso
nal I
ncom
e Ta
x0
040
60
018
822
742,
633
00
(1)
03,
322
Use
r Tax
es a
nd F
ees
214
161
202
203
185
210
194
169
208
189
150
165
02,
250
Bus
ines
s Ta
xes
5047
228
5758
283
5853
252
5962
308
01,
515
Oth
er T
axes
107
106
6981
111
6096
9287
135
112
104
01,
160
Tota
l Tax
es37
131
490
534
135
474
137
038
83,
180
383
324
576
08,
247
HC
RA
375
375
375
400
375
325
400
450
375
632
350
375
04,
807
Sta
te U
nive
rsity
Inco
me
253
239
278
226
360
562
334
262
268
467
492
318
04,
059
Lotte
ry24
429
425
224
229
925
629
424
525
429
424
326
80
3,18
5M
edic
aid
6969
6969
6969
6969
6969
6972
083
1M
otor
veh
icle
fees
4653
5243
3960
3826
3727
2932
048
2A
BC
Lic
ense
Fee
00
00
00
00
00
00
00
Oth
er re
ceip
ts24
422
621
424
420
530
924
524
023
926
220
7(4
5)0
2,59
0To
tal M
isce
llane
ous
Rec
eipt
s1,
231
1,25
61,
240
1,22
41,
347
1,58
11,
380
1,29
21,
242
1,75
11,
390
1,02
00
15,9
54
Fede
ral G
rant
s0
00
00
00
00
00
10
1
TOTA
L R
EC
EIP
TS1,
602
1,57
02,
145
1,56
51,
701
2,32
21,
750
1,68
04,
422
2,13
41,
714
1,59
70
24,2
02
DIS
BU
RSE
MEN
TS:
Sch
ool A
id0
033
30
01,
969
125
125
125
125
126
125
03,
053
Hig
her E
duca
tion
00
00
00
00
00
032
032
All
Oth
er E
duca
tion
01
00
11
00
21
02
08
STA
R0
040
10
019
222
742,
633
00
00
3,32
2M
edic
aid
- DO
H33
951
330
928
638
338
640
943
030
444
758
01,
005
05,
391
Pub
lic H
ealth
5262
216
7076
117
5974
190
8187
175
01,
259
Men
tal H
ygie
ne81
5911
717
711
418
019
777
176
171
105
253
01,
707
Chi
ldre
n an
d Fa
mili
es0
00
00
00
00
00
10
1Te
mpo
rary
& D
isab
ility
Ass
ista
nce
11
11
12
00
00
0(3
)0
4Tr
ansp
orta
tion
198
496
326
313
535
324
317
561
618
169
283
160
04,
300
Unr
estri
cted
Aid
00
00
00
00
00
00
00
All
Oth
er
4039
3963
4564
4839
3839
4086
058
0To
tal L
ocal
Ass
ista
nce
Gra
nts
711
1,17
11,
742
910
1,15
53,
235
1,17
71,
380
4,08
61,
033
1,22
11,
836
019
,657
Per
sona
l Ser
vice
486
552
423
509
624
528
561
566
467
601
587
332
06,
236
Non
-Per
sona
l Ser
vice
272
230
315
240
272
265
337
323
359
279
296
730
3,26
1To
tal S
tate
Ope
ratio
ns75
878
273
874
989
679
389
888
982
688
088
340
50
9,49
7
Gen
eral
Sta
te C
harg
es18
445
266
228
5321
219
954
235
175
5824
50
1,95
4
Cap
ital P
roje
cts
00
00
00
00
00
05
05
TOTA
L D
ISB
UR
SE
ME
NTS
1,65
31,
998
2,74
61,
887
2,10
44,
240
2,27
42,
323
5,14
72,
088
2,16
22,
491
031
,113
OTH
ER F
INA
NC
ING
SO
UR
CES
(use
s):
Tran
sfer
s fro
m o
ther
fund
s63
857
057
473
275
468
473
471
673
060
875
583
5(6
19)
7,71
1Tr
ansf
ers
to o
ther
fund
s(2
3)(4
)(1
12)
2(6
)(9
3)(5
3)3
(97)
3(3
6)(6
02)
619
(399
)
NE
T O
THE
R F
INA
NC
ING
SO
UR
CE
S/(U
SE
S)
615
566
462
734
748
591
681
719
633
611
719
233
07,
312
Exc
ess/
(Def
icie
ncy)
of R
ecei
pts
over
Dis
burs
emen
ts56
413
8(1
39)
412
345
(1,3
27)
157
76(9
2)65
727
1(6
61)
040
1
CLO
SIN
G B
ALA
NCE
2,46
42,
602
2,46
32,
875
3,22
01,
893
2,05
02,
126
2,03
42,
691
2,96
22,
301
02,
301
CA
SHFL
OW
SPEC
IAL
REV
ENU
E ST
ATE
FU
ND
SFY
201
3(d
olla
rs in
mill
ions
)
T-72

2012
2013
Apr
ilM
ayJu
neJu
lyA
ugus
tSe
ptem
ber
Oct
ober
Nov
embe
rD
ecem
ber
Janu
ary
Febr
uary
Mar
chPr
ojec
ted
Proj
ecte
dPr
ojec
ted
Proj
ecte
dPr
ojec
ted
Proj
ecte
dPr
ojec
ted
Proj
ecte
dPr
ojec
ted
Proj
ecte
dPr
ojec
ted
Proj
ecte
dTo
tal
OPE
NIN
G B
ALA
NC
E9
99
10(3
90)
910
(390
)10
1011
109
REC
EIPT
S:M
isce
llane
ous
Rec
eipt
s17
99
179
917
99
189
(1)
131
Fede
ral G
rant
s3,
087
3,22
03,
277
2,63
93,
659
3,10
52,
589
3,48
03,
367
3,38
43,
596
4,30
839
,711
TOTA
L R
EC
EIP
TS3,
104
3,22
93,
286
2,65
63,
668
3,11
42,
606
3,48
93,
376
3,40
23,
605
4,30
739
,842
DIS
BU
RSE
MEN
TS:
Sch
ool A
id27
025
129
921
211
177
107
133
233
258
427
465
2,84
3H
ighe
r Edu
catio
n1
01
11
10
01
11
08
All
Oth
er E
duca
tion
7564
6651
2824
6127
3913
710
110
177
4S
TAR
00
00
00
00
00
00
0M
edic
aid
- DO
H1,
994
2,04
22,
033
2,01
12,
012
2,03
32,
012
2,01
22,
034
2,01
22,
012
2,01
124
,218
Pub
lic H
eatlh
7591
100
102
9811
279
9510
497
9312
31,
169
Men
tal H
ygie
ne8
69
713
99
1647
1610
915
9C
hild
ren
and
Fam
ilies
5480
5559
120
5963
6591
7777
135
935
Tem
pora
ry &
Dis
abili
ty A
ssis
tanc
e26
126
126
126
126
126
126
126
126
126
126
151
93,
390
Tran
spor
tatio
n3
33
33
33
33
33
740
Unr
estri
cted
Aid
00
00
00
00
00
00
0A
ll O
ther
53
4113
6046
60(2
7)65
6651
5311
359
4To
tal L
ocal
Ass
ista
nce
Gra
nts
2,79
42,
839
2,84
02,
767
2,69
32,
639
2,56
82,
677
2,87
92,
913
3,03
83,
483
34,1
30
Per
sona
l Ser
vice
4846
4445
6345
4544
4461
4670
601
Non
-Per
sona
l Ser
vice
5952
5453
6511
295
6432
6513
210
488
7To
tal S
tate
Ope
ratio
ns10
798
9898
128
157
140
108
7612
617
817
41,
488
Gen
eral
Sta
te C
harg
es5
267
43
5313
1652
522
7231
4
Cap
ital P
roje
cts
00
00
00
00
00
00
0
TOTA
L D
ISB
UR
SE
ME
NTS
2,90
62,
939
3,00
52,
869
2,82
42,
849
2,72
12,
801
3,00
73,
044
3,23
83,
729
35,9
32
OTH
ER F
INA
NC
ING
SO
UR
CES
(use
s):
Tr
ansf
ers
from
oth
er fu
nds
00
00
00
00
00
01
1
Tran
sfer
s to
oth
er fu
nds
(198
)(2
90)
(280
)(1
87)
(445
)(2
64)
(285
)(2
88)
(369
)(3
57)
(368
)(5
79)
(3,9
10)
NE
T O
THE
R F
INA
NC
ING
SO
UR
CE
S/(U
SE
S)
(198
)(2
90)
(280
)(1
87)
(445
)(2
64)
(285
)(2
88)
(369
)(3
57)
(368
)(5
78)
(3,9
09)
Exc
ess/
(Def
icie
ncy)
of R
ecei
pts
over
Dis
burs
emen
ts0
01
(400
)39
91
(400
)40
00
1(1
)0
1
CLO
SIN
G B
ALA
NC
E9
910
(390
)9
10(3
90)
1010
1110
1010
CA
SHFL
OW
SPEC
IAL
REV
ENU
E FE
DER
AL
FUN
DS
FY 2
013
(dol
lars
in m
illio
ns)
T-73

2012
2013
Apr
ilM
ayJu
neJu
lyA
ugus
tSe
ptem
ber
Oct
ober
Nov
embe
rD
ecem
ber
Janu
ary
Febr
uary
Mar
chPr
ojec
ted
Proj
ecte
dPr
ojec
ted
Proj
ecte
dPr
ojec
ted
Proj
ecte
dPr
ojec
ted
Proj
ecte
dPr
ojec
ted
Proj
ecte
dPr
ojec
ted
Proj
ecte
dTo
tal
OPE
NIN
G B
ALA
NC
E54
91,
027
1,24
561
01,
182
1,47
459
81,
354
1,64
569
32,
060
2,08
054
9
REC
EIPT
S:Ta
xes
1,57
162
21,
356
871
893
1,34
685
675
61,
313
2,05
788
898
313
,512
Mis
cella
neou
s R
ecei
pts
8386
8387
8285
7974
8076
7610
599
6Fe
dera
l Gra
nts
00
00
238
00
00
237
79TO
TAL
RE
CE
IPTS
1,65
470
81,
439
958
977
1,46
993
583
01,
393
2,13
396
61,
125
14,5
87
DIS
BU
RSE
MEN
TS:
Sta
te O
pera
tions
11
60
85
12
140
45
47D
ebt S
ervi
ce17
624
360
595
327
979
105
215
1,08
695
490
1,73
36,
149
TOTA
L D
ISB
UR
SE
ME
NTS
177
244
611
9533
598
410
621
71,
100
9549
41,
738
6,19
6
OTH
ER F
INA
NC
ING
SO
UR
CES
(use
s):
Tran
sfer
s fro
m o
ther
fund
s76
334
527
968
250
236
780
034
945
084
331
260
36,
295
Tran
sfer
s to
oth
er fu
nds
(1,7
62)
(591
)(1
,742
)(9
73)
(852
)(1
,728
)(8
73)
(671
)(1
,695
)(1
,514
)(7
64)
(1,4
44)
(14,
609)
NE
T O
THE
R F
INA
NC
ING
SO
UR
CE
S/(U
SE
S)
(999
)(2
46)
(1,4
63)
(291
)(3
50)
(1,3
61)
(73)
(322
)(1
,245
)(6
71)
(452
)(8
41)
(8,3
14)
Exc
ess/
(Def
icie
ncy)
of R
ecei
pts
over
Dis
burs
emen
ts47
821
8(6
35)
572
292
(876
)75
629
1(9
52)
1,36
720
(1,4
54)
77
CLO
SIN
G B
ALA
NC
E1,
027
1,24
561
01,
182
1,47
459
81,
354
1,64
569
32,
060
2,08
062
662
6
CA
SHFL
OW
(dol
lars
in m
illio
ns)
DEB
T SE
RVI
CE
FUN
DS
FY 2
013
T-74

2012
2013
Intr
a-Fu
ndA
pril
May
June
July
Aug
ust
Sept
embe
rO
ctob
erN
ovem
ber
Dec
embe
rJa
nuar
yFe
brua
ryM
arch
Tran
sfer
Proj
ecte
dPr
ojec
ted
Proj
ecte
dPr
ojec
ted
Proj
ecte
dPr
ojec
ted
Proj
ecte
dPr
ojec
ted
Proj
ecte
dPr
ojec
ted
Proj
ecte
dPr
ojec
ted
Elim
inat
ions
Tota
l
OPE
NIN
G B
ALA
NC
E3,
869
7,82
25,
005
4,61
75,
468
5,92
76,
931
6,17
65,
857
4,13
510
,534
10,7
293,
869
REC
EIPT
S:Ta
xes
6,79
42,
923
7,19
84,
004
4,11
67,
477
3,98
63,
575
7,21
08,
864
4,13
76,
249
066
,533
Mis
cella
neou
s R
ecei
pts
1,74
91,
795
1,89
61,
786
1,84
92,
459
1,85
01,
919
1,85
12,
275
1,94
42,
882
024
,255
Fede
ral G
rant
s3,
226
3,38
23,
442
2,81
93,
860
3,37
12,
800
3,67
93,
562
3,54
93,
747
4,49
90
41,9
36
TOTA
L R
EC
EIP
TS11
,769
8,10
012
,536
8,60
99,
825
13,3
078,
636
9,17
312
,623
14,6
889,
828
13,6
300
132,
724
DIS
BU
RSE
MEN
TS:
Sch
ool A
id50
42,
871
2,49
233
264
13,
271
832
1,18
81,
856
608
1,01
87,
232
022
,845
Hig
her E
duca
tion
238
567
116
314
5247
022
210
3432
353
10
2,67
0A
ll O
ther
Edu
catio
n98
181
329
169
9530
611
782
331
237
380
339
02,
664
STA
R0
040
10
019
222
742,
633
00
00
3,32
2M
edic
aid
- DO
H3,
228
3,58
03,
425
3,25
03,
592
2,84
73,
641
3,77
63,
109
3,08
93,
523
3,01
70
40,0
77P
ublic
Hea
lth17
219
642
724
221
029
319
819
034
222
920
038
80
3,08
7M
enta
l Hyg
iene
8966
481
185
128
561
372
9457
930
223
963
70
3,73
3C
hild
ren
and
Fam
ilies
6320
230
113
319
412
231
115
016
025
514
648
00
2,51
7Te
mpo
rary
& D
isab
ility
Ass
ista
nce
612
362
381
362
362
382
361
361
380
361
292
666
04,
882
Tran
spor
tatio
n20
152
332
931
656
232
732
058
863
617
229
616
80
4,43
8U
nres
trict
ed A
id2
1429
82
297
112
205
24
137
077
6A
ll O
ther
22
724
534
032
128
034
512
430
544
338
038
577
90
4,17
4To
tal L
ocal
Ass
ista
nce
Gra
nts
5,21
98,
248
9,77
15,
428
6,38
08,
795
6,77
96,
832
10,8
845,
669
6,80
614
,374
095
,185
Per
sona
l Ser
vice
1,09
41,
233
981
967
1,22
199
61,
010
1,06
292
71,
172
1,05
584
80
12,5
66N
on-P
erso
nal S
ervi
ce49
543
560
243
646
851
554
552
055
447
760
640
10
6,05
4To
tal S
tate
Ope
ratio
ns1,
589
1,66
81,
583
1,40
31,
689
1,51
11,
555
1,58
21,
481
1,64
91,
661
1,24
90
18,6
20
Gen
eral
Sta
te C
harg
es47
641
348
043
048
856
053
243
049
645
131
41,
632
06,
702
Deb
t ser
vice
176
243
605
9532
797
910
521
51,
086
9549
01,
733
06,
149
Cap
ital P
roje
cts
384
370
514
423
511
490
449
454
449
453
390
967
05,
854
TOTA
L D
ISB
UR
SE
ME
NTS
7,84
410
,942
12,9
537,
779
9,39
512
,335
9,42
09,
513
14,3
968,
317
9,66
119
,955
013
2,51
0
OTH
ER F
INA
NC
ING
SO
UR
CES
(use
s):
Tr
ansf
ers
from
oth
er fu
nds
2,91
01,
198
2,48
42,
181
1,71
92,
516
2,16
41,
524
2,73
02,
647
1,58
13,
918
027
,572
Tr
ansf
ers
to o
ther
fund
s(2
,915
)(1
,206
)(2
,488
)(2
,193
)(1
,723
)(2
,517
)(2
,168
)(1
,536
)(2
,712
)(2
,652
)(1
,586
)(3
,885
)0
(27,
581)
B
ond
and
note
pro
ceed
s33
3333
3333
3333
3333
3333
370
400
NE
T O
THE
R F
INA
NC
ING
SO
UR
CE
S/(U
SE
S)
2825
2921
2932
2921
5128
2870
039
1
Exc
ess/
(Def
icie
ncy)
of R
ecei
pts
over
Dis
burs
emen
ts3,
953
(2,8
17)
(388
)85
145
91,
004
(755
)(3
19)
(1,7
22)
6,39
919
5(6
,255
)0
605
CLO
SIN
G B
ALA
NC
E7,
822
5,00
54,
617
5,46
85,
927
6,93
16,
176
5,85
74,
135
10,5
3410
,729
4,47
40
4,47
4
RES
ERVE
S:C
omm
unity
Pro
ject
s Fu
nd
00
00
00
00
00
0(5
1)0
(51)
Prio
r-Y
ear L
abor
Agr
eem
ents
(200
7-20
11)
00
00
00
00
00
017
40
174
TOTA
RE
SE
RV
ES
00
00
00
00
00
012
30
123
Exc
ess/
(Def
icie
ncy)
of R
ecei
pts
over
Dis
burs
emen
ts a
fter R
eser
ves
3,95
3(2
,817
)(3
88)
851
459
1,00
4(7
55)
(319
)(1
,722
)6,
399
195
(6,3
78)
048
2
CLO
SIN
G B
ALA
NC
E W
ITH
RES
ERVE
S7,
822
5,00
54,
617
5,46
85,
927
6,93
16,
176
5,85
74,
135
10,5
3410
,729
4,35
10
4,35
1
CA
SHFL
OW
ALL
GO
VER
NM
ENTA
L FU
ND
SFY
201
3(d
olla
rs in
mill
ions
)
T-75

2012
2013
Intr
a-Fu
ndA
pril
May
June
July
Aug
ust
Sept
embe
rO
ctob
erN
ovem
ber
Dec
embe
rJa
nuar
yFe
brua
ryM
arch
Tran
sfer
Proj
ecte
dPr
ojec
ted
Proj
ecte
dPr
ojec
ted
Proj
ecte
dPr
ojec
ted
Proj
ecte
dPr
ojec
ted
Proj
ecte
dPr
ojec
ted
Proj
ecte
dPr
ojec
ted
Elim
inat
ions
Tota
l
OPE
NIN
G B
ALA
NC
E3,
959
7,87
95,
030
4,68
45,
902
5,92
96,
985
6,59
85,
844
4,16
610
,532
10,6
953,
959
REC
EIPT
S:Ta
xes
6,79
42,
923
7,19
84,
004
4,11
67,
477
3,98
63,
575
7,21
08,
864
4,13
76,
249
066
,533
Mis
cella
neou
s R
ecei
pts
1,73
21,
786
1,88
71,
769
1,84
02,
450
1,83
31,
910
1,84
22,
257
1,93
52,
883
024
,124
Fede
ral G
rant
s0
130
02
560
015
02
570
145
TOTA
L R
EC
EIP
TS8,
526
4,72
29,
085
5,77
35,
958
9,98
35,
819
5,48
59,
067
11,1
216,
074
9,18
90
90,8
02
DIS
BU
RSE
MEN
TS:
Sch
ool A
id23
42,
620
2,19
312
053
03,
194
725
1,05
51,
623
350
591
6,76
70
20,0
02H
ighe
r Edu
catio
n22
856
611
531
351
470
2220
933
322
531
02,
662
All
Oth
er E
duca
tion
2311
726
311
867
282
5655
292
100
279
238
01,
890
STA
R0
040
10
019
222
742,
633
00
00
3,32
2M
edic
aid
- DO
H1,
234
1,53
81,
392
1,23
91,
580
814
1,62
91,
764
1,07
51,
077
1,51
11,
006
015
,859
Pub
lic H
ealth
9710
532
714
011
218
111
995
238
132
107
265
01,
918
Men
tal H
ygie
ne81
6047
217
811
555
236
378
532
286
229
628
03,
574
Chi
ldre
n an
d Fa
mili
es9
122
246
7474
6324
885
6917
869
345
01,
582
Tem
pora
ry &
Dis
abili
ty A
ssis
tanc
e35
110
112
010
110
112
110
010
011
910
031
147
01,
492
Tran
spor
tatio
n19
852
032
631
355
932
431
758
563
316
929
316
10
4,39
8U
nres
trict
ed A
id2
1429
82
297
112
205
24
137
077
6A
ll O
ther
13
015
727
320
616
921
985
175
322
275
285
532
02,
828
Tota
l Loc
al A
ssis
tanc
e G
rant
s2,
381
5,36
26,
877
2,60
63,
622
6,09
04,
145
4,09
07,
950
2,70
23,
721
10,7
570
60,3
03
Per
sona
l Ser
vice
1,04
61,
187
937
922
1,15
895
196
51,
018
883
1,11
11,
009
778
011
,965
Non
-Per
sona
l Ser
vice
436
383
548
383
403
403
450
456
522
412
474
297
05,
167
Tota
l Sta
te O
pera
tions
1,48
21,
570
1,48
51,
305
1,56
11,
354
1,41
51,
474
1,40
51,
523
1,48
31,
075
017
,132
Gen
eral
Sta
te C
harg
es47
141
141
342
648
550
751
941
444
444
629
21,
560
06,
388
Deb
t ser
vice
176
243
605
9532
797
910
521
51,
086
9549
01,
733
06,
149
Cap
ital P
roje
cts
322
300
437
331
410
376
336
354
357
375
320
905
04,
823
TOTA
L D
ISB
UR
SE
ME
NTS
4,83
27,
886
9,81
74,
763
6,40
59,
306
6,52
06,
547
11,2
425,
141
6,30
616
,030
094
,795
OTH
ER F
INA
NC
ING
SO
UR
CES
(use
s):
Tr
ansf
ers
from
oth
er fu
nds
2,94
91,
237
2,65
02,
217
1,75
52,
627
2,29
31,
557
2,84
12,
678
1,61
54,
080
(619
)27
,880
Tr
ansf
ers
to o
ther
fund
s(2
,756
)(9
55)
(2,2
97)
(2,0
42)
(1,3
14)
(2,2
81)
(2,0
12)
(1,2
82)
(2,3
77)
(2,3
25)
(1,2
53)
(3,3
85)
619
(23,
660)
B
ond
and
note
pro
ceed
s33
3333
3333
3333
3333
3333
370
400
NE
T O
THE
R F
INA
NC
ING
SO
UR
CE
S/(U
SE
S)
226
315
386
208
474
379
314
308
497
386
395
732
04,
620
Exc
ess/
(Def
icie
ncy)
of R
ecei
pts
over
Dis
burs
emen
ts3,
920
(2,8
49)
(346
)1,
218
271,
056
(387
)(7
54)
(1,6
78)
6,36
616
3(6
,109
)0
627
CLO
SIN
G B
ALA
NC
E7,
879
5,03
04,
684
5,90
25,
929
6,98
56,
598
5,84
44,
166
10,5
3210
,695
4,58
60
4,58
6
RES
ERVE
S:C
omm
unity
Pro
ject
s Fu
nd
00
00
00
00
00
0(5
1)0
(51)
Prio
r-Y
ear L
abor
Agr
eem
ents
(200
7-20
11)
00
00
00
00
00
017
40
174
TOTA
L R
ES
ER
VE
S0
00
00
00
00
00
123
012
3
Exc
ess/
(Def
icie
ncy)
of R
ecei
pts
over
Dis
burs
emen
ts a
fter R
eser
ves
3,92
0(2
,849
)(3
46)
1,21
827
1,05
6(3
87)
(754
)(1
,678
)6,
366
163
(6,2
32)
050
4
CLO
SIN
G B
ALA
NC
E W
ITH
RES
ERVE
S7,
879
5,03
04,
684
5,90
25,
929
6,98
56,
598
5,84
44,
166
10,5
3210
,695
4,46
30
4,46
3
CA
SHFL
OW
STA
TE F
UN
DS
FY 2
013
(dol
lars
in m
illio
ns)
T-76

FY 2013 FY 2014 FY 2015 FY 2016Proposed Projected Projected Projected
Opening fund balance 0 0 0 0
Receipts:Taxes 1,222 1,199 1,177 1,155Miscellaneous receipts 4,807 4,986 5,105 5,105
Total receipts 6,029 6,185 6,282 6,260
Disbursements:Medical Assistance Account 3,775 3,953 4,127 4,093HCRA Program Account 506 504 506 506Hospital Indigent Care Fund 792 792 792 792Elderly Pharmaceutical Insurance Coverage (EPIC) 128 135 146 158Child Health Plus (CHP) 354 382 408 422Public Health 120 120 120 120All Other 354 299 183 169
Total disbursements 6,029 6,185 6,282 6,260
Change in fund balance 0 0 0 0
Closing fund balance 0 0 0 0
Note: Statutory authorization for HCRA expires on March 31, 2014.
HEALTH CARE REFORM ACT RESOURCES FUNDFY 2013 THROUGH FY 2016
(millions of dollars)
CASH FINANCIAL PLAN
T-77

FY 2012 FY 2013 AnnualCurrent Proposed Change
Opening fund balance 159 0 (159)
Receipts:Taxes 1,189 1,222 33Miscellaneous receipts 4,170 4,807 637
Total receipts 5,359 6,029 670
Disbursements:Medical Assistance Account 3,358 3,775 417HCRA Program Account 493 506 13Hospital Indigent Care Fund 792 792 0Elderly Pharmaceutical Insurance Coverage (EPIC) 110 128 18Child Health Plus (CHP) 327 354 27Public Health 120 120 0All Other 318 354 36
Total disbursements 5,518 6,029 511
Change in fund balance (159) 0 159
Closing fund balance 0 0 0
HEALTH CARE REFORM ACT RESOURCES FUNDFY 2012 and FY 2013(millions of dollars)
CASH FINANCIAL PLAN
T-78

Apr
ilM
ayJu
neJu
lyA
ugus
tSe
ptem
ber
Oct
ober
Nov
embe
rD
ecem
ber
Janu
ary
Febr
uary
Mar
chR
esul
tsR
esul
tsR
esul
tsR
esul
tsR
esul
tsR
esul
tsR
esul
tsR
esul
tsR
esul
tsPr
ojec
ted
Proj
ecte
dPr
ojec
ted
Tota
l
Ope
ning
fund
bal
ance
159
233
195
220
435
407
336
421
425
422
498
387
159
Rec
eipt
s:Ta
xes
9598
106
106
111
108
9898
9910
077
931,
189
Mis
cella
neou
s re
ceip
ts33
934
934
536
435
429
139
634
635
444
031
527
74,
170
Tota
l rec
eipt
s43
444
745
147
046
539
949
444
445
354
039
237
05,
359
Dis
burs
emen
ts:
Med
ical
Ass
ista
nce
Acc
ount
266
335
160
150
348
251
244
296
169
313
346
480
3,35
8H
CR
A P
rogr
am A
ccou
nt10
513
96
1034
2112
119
4232
6349
3H
ospi
tal I
ndig
ent C
are
Fund
6964
6564
6564
6863
6566
6673
792
Eld
erly
Pha
rmac
eutic
al In
sura
nce
Cov
erag
e (E
PIC
)3
00
014
1019
1516
1111
1111
0C
hild
Hea
lth P
lus
(CH
P)
345
1325
2629
5017
5122
2224
327
Pub
lic H
ealth
58
137
2418
512
87
67
120
All
Oth
er
428
363
664
225
283
2099
318
Tota
l dis
burs
emen
ts36
048
542
625
549
347
040
944
045
646
450
375
75,
518
Cha
nge
in fu
nd b
alan
ce74
(38)
2521
5(2
8)(7
1)85
4(3
)76
(111
)(3
87)
(159
)
Clo
sing
fund
bal
anc e
233
195
220
435
407
336
421
425
422
498
387
00
CA
SH F
LOW
HEA
LTH
CA
RE
REF
OR
M A
CT
RES
OU
RC
ES F
UN
DFY
201
2(d
olla
rs in
mill
ions
)
T-79

Apr
ilM
ayJu
neJu
lyA
ugus
tSe
ptem
ber
Oct
ober
Nov
embe
rD
ecem
ber
Janu
ary
Febr
uary
Mar
chPr
ojec
ted
Proj
ecte
dPr
ojec
ted
Proj
ecte
dPr
ojec
ted
Proj
ecte
dPr
ojec
ted
Proj
ecte
dPr
ojec
ted
Proj
ecte
dPr
ojec
ted
Proj
ecte
dTo
tal
Ope
ning
fund
bal
ance
016
412
811
133
544
538
749
860
761
688
472
50
Rec
eipt
s:Ta
xes
101
9710
811
211
711
410
097
103
9186
961,
222
Mis
cella
neou
s re
ceip
ts37
537
537
540
037
532
540
045
037
563
235
037
54,
807
Tota
l rec
eipt
s47
647
248
351
249
243
950
054
747
872
343
647
16,
029
Dis
burs
emen
ts:
Med
ical
Ass
ista
nce
Acc
ount
204
378
175
152
248
252
274
295
169
313
445
870
3,77
5H
CR
A P
rogr
am A
ccou
nt9
515
56
1033
210
127
2330
9650
6H
ospi
tal I
ndig
ent C
are
Fund
6666
6666
6666
6666
6666
6666
792
Eld
erly
Pha
rmac
eutic
al In
sura
nce
Cov
erag
e (E
PIC
)8
1013
1315
1415
1111
65
712
8C
hild
Hea
lth P
lus
(CH
P)
1529
3029
2944
1529
3029
2946
354
Pub
lic H
ealth
66
810
1015
1314
1210
97
120
All
Oth
er
414
5312
473
413
548
1110
435
4To
tal d
isbu
rsem
ents
312
508
500
288
382
497
389
438
469
455
595
1,19
66,
029
Cha
nge
in fu
nd b
alan
ce16
4(3
6)(1
7)22
411
0(5
8)11
110
99
268
(159
)(7
25)
0
Clo
sing
fund
bal
anc e
164
128
111
335
445
387
498
607
616
884
725
00
CA
SH F
LOW
HEA
LTH
CA
RE
REF
OR
M A
CT
RES
OU
RC
ES F
UN
DFY
201
3(d
olla
rs in
mill
ions
)
T-80

InternalService Enterprise Fiduciary
Opening Fund Balance 29 21 (61)
Receipts:Unemployment Taxes 0 3,775 0Miscellaneous Receipts 635 216 1Federal Receipts 0 2,775 0
Total receipts 635 6,766 1
Disbursements:Local Assistance Grants 2 0 0Departmental Operations:
Personal Service 125 7 0Non-Personal Service 439 152 0
Unemployment Benefits 0 6,550 0General State Charges 61 3 0Debt Service 0 0 0Capital Projects 0 0 0
Total Disbursements 627 6,712 0
Other Financing Sources (Uses):Transfers from Other Funds 82 0 0Transfers to Other Funds (92) 0 0Bond & Note Proceeds 0 0 0
(10) 0 0
(2) 54 1
Closing Fund Balance 27 75 (60)
PROPRIETARY AND FIDUCIARY FUNDSFY 2012
(millions of dollars)
CASH FINANCIAL PLAN
Excess (Deficiency) of Receipts and OtherFinancing Sources Over Disbursements and Other Financing Uses
T-81

InternalService Enterprise Fiduciary
Opening Fund Balance 27 75 (60)
Receipts:Unemployment Taxes 0 3,331 0Miscellaneous Receipts 1,152 216 1Federal Receipts 0 225 0
Total Receipts 1,152 3,772 1
Disbursements:Local Assistance Grants 0 0 0Departmental Operations:
Personal Service 123 7 0Non-Personal Service 964 203 0
Unemployment Benefits 0 3,556 0General State Charges 65 3 0Debt Service 0 0 0Capital Projects 0 0 0
Total disbursements 1,152 3,769 0
Other Financing Sources (Uses):Transfers from Other Funds 99 0 0Transfers to Other Funds (89) 0 0Bond & Note Proceeds 0 0 0
10 0 0
10 3 1
Closing Fund Balance 37 78 (59)
PROPRIETARY AND FIDUCIARY FUNDSFY 2013
(millions of dollars)
CASH FINANCIAL PLAN
Excess (Deficiency) of Receipts and OtherFinancing Sources Over Disbursements and Other Financing Uses
T-82

InternalService Enterprise Fiduciary
Opening Fund Balance 37 78 (59)
Receipts:Unemployment Taxes 0 3,456 0Miscellaneous Receipts 1,119 227 1Federal Receipts 0 25 0
Total Receipts 1,119 3,708 1
Disbursements:Local Assistance Grants 0 0 0Departmental Operations:
Personal Service 125 7 0Non-Personal Service 1,008 211 0
Unemployment Benefits 0 3,481 0General State Charges 71 4 0Debt Service 0 0 0Capital Projects 0 0 0
Total disbursements 1,204 3,703 0
Other Financing Sources (Uses):Transfers from Other Funds 135 0 0Transfers to Other Funds (58) 0 0Bond & Note Proceeds 0 0 0
77 0 0
(8) 5 1
Closing Fund Balance 29 83 (58)
CASH FINANCIAL PLAN PROPRIETARY AND FIDUCIARY FUNDS
FY 2014(millions of dollars)
Excess (Deficiency) of Receipts and OtherFinancing Sources Over Disbursements and Other Financing Uses
T-83

InternalService Enterprise Fiduciary
Opening Fund Balance 29 83 (58)
Receipts:Unemployment Taxes 0 3,447 0Miscellaneous Receipts 1,130 218 1Federal Receipts 0 25 0
Total Receipts 1,130 3,690 1
Disbursements:Local Assistance Grants 0 0 0Departmental Operations:
Personal Service 127 7 0Non-Personal Service 981 202 0
Unemployment Benefits 0 3,472 0General State Charges 75 4 0Debt Service 0 0 0Capital Projects 0 0 0
Total disbursements 1,183 3,685 0
Other Financing Sources (Uses):Transfers from Other Funds 103 0 0Transfers to Other Funds (49) 0 0Bond & Note Proceeds 0 0 0
54 0 0
1 5 1
Closing Fund Balance 30 88 (57)
CASH FINANCIAL PLAN PROPRIETARY AND FIDUCIARY FUNDS
FY 2015(millions of dollars)
Excess (Deficiency) of Receipts and OtherFinancing Sources Over Disbursements and Other Financing Uses
T-84

InternalService Enterprise Fiduciary
Opening Fund Balance 30 88 (57)
Receipts:Unemployment Taxes 0 3,447 0Miscellaneous Receipts 1,095 198 1Federal Receipts 0 25 0
Total Receipts 1,095 3,670 1
Disbursements:Local Assistance Grants 0 0 0Departmental Operations:
Personal Service 130 7 0Non-Personal Service 974 183 0
Unemployment Benefits 0 3,472 0General State Charges 78 4 0Debt Service 0 0 0Capital Projects 0 0 0
Total disbursements 1,182 3,666 0
Other Financing Sources (Uses):Transfers from Other Funds 93 0 0Transfers to Other Funds (31) 0 0Bond & Note Proceeds 0 0 0
62 0 0
(25) 4 1
Closing Fund Balance 5 92 (56)
CASH FINANCIAL PLAN PROPRIETARY AND FIDUCIARY FUNDS
FY 2016(millions of dollars)
Excess (Deficiency) of Receipts and OtherFinancing Sources Over Disbursements and Other Financing Uses
T-85

Workforce Impact SummaryGeneral Fund
2010-11 Through 2012-13
2010-11 Actuals
(03/31/11)
Starting Estimate (03/31/12) Layoffs* Attritions
New Fills
Fund Shifts Mergers
Net Change
Ending Estimate (03/31/13)
Major AgenciesChildren and Family Services, Office of 2,899 2,683 (123) (466) 780 0 0 191 2,874Corrections and Community Supervision, Department of 29,158 28,788 0 (1,899) 1,899 0 0 0 28,788Education Department, State 261 286 0 (14) 7 0 0 (7) 279Environmental Conservation, Department of 1,079 1,127 0 (10) 26 (44) 0 (28) 1,099General Services, Office of 800 790 0 (50) 60 0 0 10 800Health, Department of 1,777 1,703 0 (104) 224 0 0 120 1,823Parks, Recreation and Historic Preservation, Office of 1,448 1,381 0 (75) 63 0 0 (12) 1,369Parole, Division of 1,863 0 0 0 0 0 0 0 0State Police, Division of 5,039 4,803 0 (208) 208 0 0 0 4,803Taxation and Finance, Department of 5,057 4,103 0 (194) 97 0 0 (97) 4,006Temporary and Disability Assistance, Office of 920 183 0 (12) 59 895 (6) 936 1,119
Subtotal - Major Agencies 50,301 45,847 (123) (3,032) 3,423 851 (6) 1,113 46,960
Minor Agencies 3,429 3,197 (3) (224) 235 132 6 146 3,343
Subtotal - Subject to Direct Executive Control 53,730 49,044 (126) (3,256) 3,658 983 0 1,259 50,303
University SystemsState University of New York 23,604 23,362 0 0 0 0 0 0 23,362
Subtotal - University Systems 23,604 23,362 0 0 0 0 0 0 23,362
Off-Budget AgenciesScience, Technology and Innovation, NYS Foundation for 20 0 0 0 0 0 0 0 0
Subtotal - Off-Budget Agencies 20 0 0 0 0 0 0 0 0
Independently Elected AgenciesAudit and Control, Department of 1,451 1,337 0 0 47 0 0 47 1,384Law, Department of 1,109 1,041 0 0 25 0 0 25 1,066
Subtotal - Independently Elected Agencies 2,560 2,378 0 0 72 0 0 72 2,450
Grand Total 79,914 74,784 (126) (3,256) 3,730 983 0 1,331 76,115
* This table does not reflect layoffs that may be necessary in the absence of negotiated workforce savings.
T-86
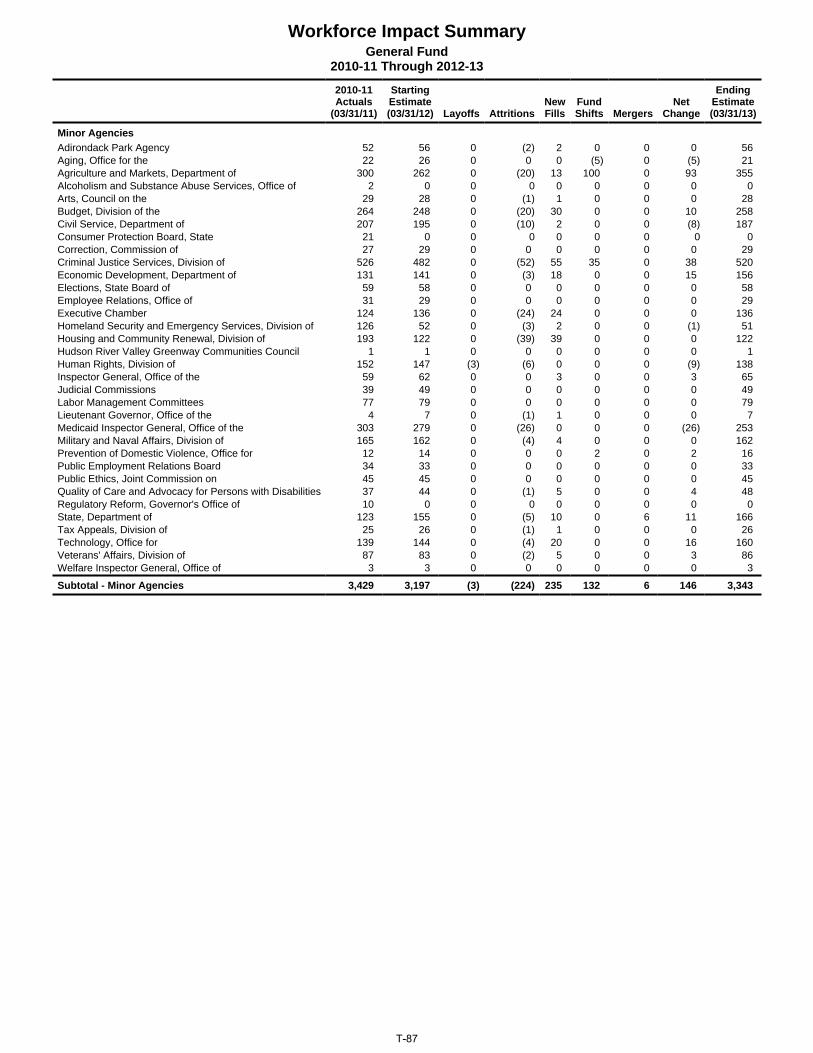
Workforce Impact SummaryGeneral Fund
2010-11 Through 2012-13
2010-11 Actuals
(03/31/11)
Starting Estimate (03/31/12) Layoffs Attritions
New Fills
Fund Shifts Mergers
Net Change
Ending Estimate (03/31/13)
Minor AgenciesAdirondack Park Agency 52 56 0 (2) 2 0 0 0 56Aging, Office for the 22 26 0 0 0 (5) 0 (5) 21Agriculture and Markets, Department of 300 262 0 (20) 13 100 0 93 355Alcoholism and Substance Abuse Services, Office of 2 0 0 0 0 0 0 0 0Arts, Council on the 29 28 0 (1) 1 0 0 0 28Budget, Division of the 264 248 0 (20) 30 0 0 10 258Civil Service, Department of 207 195 0 (10) 2 0 0 (8) 187Consumer Protection Board, State 21 0 0 0 0 0 0 0 0Correction, Commission of 27 29 0 0 0 0 0 0 29Criminal Justice Services, Division of 526 482 0 (52) 55 35 0 38 520Economic Development, Department of 131 141 0 (3) 18 0 0 15 156Elections, State Board of 59 58 0 0 0 0 0 0 58Employee Relations, Office of 31 29 0 0 0 0 0 0 29Executive Chamber 124 136 0 (24) 24 0 0 0 136Homeland Security and Emergency Services, Division of 126 52 0 (3) 2 0 0 (1) 51Housing and Community Renewal, Division of 193 122 0 (39) 39 0 0 0 122Hudson River Valley Greenway Communities Council 1 1 0 0 0 0 0 0 1Human Rights, Division of 152 147 (3) (6) 0 0 0 (9) 138Inspector General, Office of the 59 62 0 0 3 0 0 3 65Judicial Commissions 39 49 0 0 0 0 0 0 49Labor Management Committees 77 79 0 0 0 0 0 0 79Lieutenant Governor, Office of the 4 7 0 (1) 1 0 0 0 7Medicaid Inspector General, Office of the 303 279 0 (26) 0 0 0 (26) 253Military and Naval Affairs, Division of 165 162 0 (4) 4 0 0 0 162Prevention of Domestic Violence, Office for 12 14 0 0 0 2 0 2 16Public Employment Relations Board 34 33 0 0 0 0 0 0 33Public Ethics, Joint Commission on 45 45 0 0 0 0 0 0 45Quality of Care and Advocacy for Persons with Disabilities 37 44 0 (1) 5 0 0 4 48Regulatory Reform, Governor's Office of 10 0 0 0 0 0 0 0 0State, Department of 123 155 0 (5) 10 0 6 11 166Tax Appeals, Division of 25 26 0 (1) 1 0 0 0 26Technology, Office for 139 144 0 (4) 20 0 0 16 160Veterans' Affairs, Division of 87 83 0 (2) 5 0 0 3 86Welfare Inspector General, Office of 3 3 0 0 0 0 0 0 3
Subtotal - Minor Agencies 3,429 3,197 (3) (224) 235 132 6 146 3,343
T-87

Workforce Impact SummaryState Operating Funds
2010-11 Through 2012-13
2010-11 Actuals
(03/31/11)
Starting Estimate (03/31/12) Layoffs* Attritions
New Fills
Fund Shifts Mergers
Net Change
Ending Estimate (03/31/13)
Major AgenciesChildren and Family Services, Office of 2,949 2,731 (123) (466) 780 0 0 191 2,922Corrections and Community Supervision, Department of 29,158 28,788 0 (1,899) 1,899 0 0 0 28,788Education Department, State 1,296 1,295 0 (49) 72 0 0 23 1,318Environmental Conservation, Department of 2,320 2,294 0 (45) 45 0 0 0 2,294Financial Services, Department of 0 1,531 0 (52) 52 0 0 0 1,531General Services, Office of 860 854 0 (50) 60 0 0 10 864Health, Department of 4,190 4,165 0 (252) 372 0 0 120 4,285Labor, Department of 361 342 0 (45) 45 0 0 0 342Mental Health, Office of 15,681 15,248 0 (1,620) 1,620 0 0 0 15,248Motor Vehicles, Department of 789 785 0 0 11 0 0 11 796Parks, Recreation and Historic Preservation, Office of 1,677 1,614 0 (75) 63 0 0 (12) 1,602Parole, Division of 1,863 0 0 0 0 0 0 0 0People with Developmental Disabilities, Office for 21,208 20,700 0 (1,842) 1,728 0 0 (114) 20,586State Police, Division of 5,435 5,220 0 (208) 208 0 0 0 5,220Taxation and Finance, Department of 5,125 4,897 0 (194) 97 0 0 (97) 4,800Temporary and Disability Assistance, Office of 985 817 0 (12) 59 261 (6) 302 1,119Transportation, Department of 147 141 0 (6) 6 (6) 0 (6) 135Workers' Compensation Board 1,364 1,380 0 (80) 71 0 0 (9) 1,371
Subtotal - Major Agencies 95,408 92,802 (123) (6,895) 7,188 255 (6) 419 93,221
Minor Agencies 8,720 7,206 (3) (503) 479 32 6 11 7,217
Subtotal - Subject to Direct Executive Control 104,128 100,008 (126) (7,398) 7,667 287 0 430 100,438
University SystemsCity University of New York 278 280 0 0 0 0 0 0 280State University Construction Fund 140 152 0 0 0 0 0 0 152State University of New York 41,046 42,199 0 0 0 0 0 0 42,199
Subtotal - University Systems 41,464 42,631 0 0 0 0 0 0 42,631
Off-Budget AgenciesRoswell Park Cancer Institute 2,025 2,025 0 (101) 101 0 0 0 2,025Science, Technology and Innovation, NYS Foundation for 20 0 0 0 0 0 0 0 0
Subtotal - Off-Budget Agencies 2,045 2,025 0 (101) 101 0 0 0 2,025
Independently Elected AgenciesAudit and Control, Department of 1,487 1,506 0 0 47 0 0 47 1,553Law, Department of 1,429 1,518 0 0 25 0 0 25 1,543
Subtotal - Independently Elected Agencies 2,916 3,024 0 0 72 0 0 72 3,096
Grand Total 150,553 147,688 (126) (7,499) 7,840 287 0 502 148,190
* This table does not reflect layoffs that may be necessary in the absence of negotiated workforce savings.
T-88

Workforce Impact SummaryState Operating Funds
2010-11 Through 2012-13
2010-11 Actuals
(03/31/11)
Starting Estimate (03/31/12) Layoffs Attritions
New Fills
Fund Shifts Mergers
Net Change
Ending Estimate (03/31/13)
Minor AgenciesAdirondack Park Agency 52 56 0 (2) 2 0 0 0 56Aging, Office for the 23 27 0 0 0 (5) 0 (5) 22Agriculture and Markets, Department of 456 413 0 (31) 24 0 0 (7) 406Alcoholic Beverage Control, Division of 128 123 0 (2) 11 0 0 9 132Alcoholism and Substance Abuse Services, Office of 842 732 0 (35) 26 0 0 (9) 723Arts, Council on the 29 28 0 (1) 1 0 0 0 28Banking Department 530 0 0 0 0 0 0 0 0Budget, Division of the 313 307 0 (20) 30 0 0 10 317Civil Service, Department of 212 200 0 (10) 2 0 0 (8) 192Consumer Protection Board, State 21 0 0 0 0 0 0 0 0Correction, Commission of 27 29 0 0 0 0 0 0 29Criminal Justice Services, Division of 531 489 0 (52) 55 35 0 38 527Deferred Compensation Board 4 4 0 0 0 0 0 0 4Economic Development, Department of 133 143 0 (3) 18 0 0 15 158Elections, State Board of 59 58 0 0 0 0 0 0 58Employee Relations, Office of 31 29 0 0 0 0 0 0 29Environmental Facilities Corporation 76 88 0 (98) 10 0 0 (88) 0Executive Chamber 124 136 0 (24) 24 0 0 0 136Financial Control Board, New York State 14 14 0 0 0 0 0 0 14Higher Education Services Corporation, New York State 502 495 0 (25) 25 0 0 0 495Homeland Security and Emergency Services, Division of 293 321 0 (11) 10 0 0 (1) 320Housing and Community Renewal, Division of 602 577 0 (61) 75 0 0 14 591Hudson River Valley Greenway Communities Council 1 1 0 0 0 0 0 0 1Human Rights, Division of 152 147 (3) (6) 0 0 0 (9) 138Indigent Legal Services, Office of 1 10 0 0 0 0 0 0 10Inspector General, Office of the 59 62 0 0 3 0 0 3 65Insurance Department 899 0 0 0 0 0 0 0 0Interest on Lawyer Account 8 8 0 0 0 0 0 0 8Judicial Commissions 39 49 0 0 0 0 0 0 49Labor Management Committees 77 79 0 0 0 0 0 0 79Lieutenant Governor, Office of the 4 7 0 (1) 1 0 0 0 7Lottery, Division of the 314 362 0 (15) 15 0 0 0 362Medicaid Inspector General, Office of the 303 279 0 (26) 0 0 0 (26) 253Military and Naval Affairs, Division of 171 168 0 (4) 4 0 0 0 168Prevention of Domestic Violence, Office for 13 14 0 0 0 2 0 2 16Public Employment Relations Board 34 33 0 0 0 0 0 0 33Public Ethics, Joint Commission on 45 45 0 0 0 0 0 0 45Public Service Department 493 493 0 (30) 46 0 0 16 509Quality of Care and Advocacy for Persons with Disabilities 69 75 0 (1) 5 0 0 4 79Racing and Wagering Board, State 102 105 0 (5) 5 0 0 0 105Regulatory Reform, Governor's Office of 10 0 0 0 0 0 0 0 0State, Department of 523 548 0 (14) 30 0 6 22 570Statewide Financial System 88 136 0 (17) 26 0 0 9 145Statewide Wireless Network 3 0 0 0 0 0 0 0 0Tax Appeals, Division of 25 26 0 (1) 1 0 0 0 26Technology, Office for 139 149 0 (4) 20 0 0 16 165Veterans' Affairs, Division of 87 83 0 (2) 5 0 0 3 86Victim Services, Office of 54 51 0 (2) 5 0 0 3 54Welfare Inspector General, Office of 5 7 0 0 0 0 0 0 7
Subtotal - Minor Agencies 8,720 7,206 (3) (503) 479 32 6 11 7,217
T-89

Workforce Impact SummaryState Funds
2010-11 Through 2012-13
2010-11 Actuals
(03/31/11)
Starting Estimate (03/31/12) Layoffs* Attritions
New Fills
Fund Shifts Mergers
Net Change
Ending Estimate (03/31/13)
Major AgenciesChildren and Family Services, Office of 2,955 2,737 (123) (466) 780 0 0 191 2,928Corrections and Community Supervision, Department of 29,484 29,120 0 (1,899) 1,899 0 0 0 29,120Education Department, State 1,445 1,443 0 (55) 75 0 0 20 1,463Environmental Conservation, Department of 2,714 2,677 0 (47) 47 0 0 0 2,677Financial Services, Department of 0 1,531 0 (52) 52 0 0 0 1,531General Services, Office of 1,345 1,315 0 (60) 74 0 0 14 1,329Health, Department of 4,246 4,221 0 (255) 375 0 0 120 4,341Labor, Department of 361 342 0 (45) 45 0 0 0 342Mental Health, Office of 15,727 15,316 0 (1,620) 1,620 0 0 0 15,316Motor Vehicles, Department of 2,430 2,375 0 (52) 73 0 0 21 2,396Parks, Recreation and Historic Preservation, Office of 1,788 1,734 0 (75) 63 0 0 (12) 1,722Parole, Division of 1,863 0 0 0 0 0 0 0 0People with Developmental Disabilities, Office for 21,208 20,700 0 (1,842) 1,728 0 0 (114) 20,586State Police, Division of 5,435 5,220 0 (208) 208 0 0 0 5,220Taxation and Finance, Department of 5,125 4,897 0 (194) 97 0 0 (97) 4,800Temporary and Disability Assistance, Office of 989 821 0 (12) 59 261 (6) 302 1,123Transportation, Department of 9,064 8,498 0 (301) 210 0 0 (91) 8,407Workers' Compensation Board 1,364 1,380 0 (80) 71 0 0 (9) 1,371
Subtotal - Major Agencies 107,543 104,327 (123) (7,263) 7,476 261 (6) 345 104,672
Minor Agencies 9,457 7,923 (3) (517) 516 31 6 33 7,956
Subtotal - Subject to Direct Executive Control 117,000 112,250 (126) (7,780) 7,992 292 0 378 112,628
University SystemsCity University of New York 12,844 12,747 0 0 0 0 0 0 12,747State University Construction Fund 140 152 0 0 0 0 0 0 152State University of New York 41,053 42,206 0 0 0 0 0 0 42,206
Subtotal - University Systems 54,037 55,105 0 0 0 0 0 0 55,105
Off-Budget AgenciesRoswell Park Cancer Institute 2,025 2,025 0 (101) 101 0 0 0 2,025Science, Technology and Innovation, NYS Foundation for 20 0 0 0 0 0 0 0 0State Insurance Fund 2,545 2,536 0 (125) 125 0 0 0 2,536
Subtotal - Off-Budget Agencies 4,590 4,561 0 (226) 226 0 0 0 4,561
Independently Elected AgenciesAudit and Control, Department of 2,439 2,516 0 0 98 0 0 98 2,614Law, Department of 1,435 1,525 0 0 25 0 0 25 1,550
Subtotal - Independently Elected Agencies 3,874 4,041 0 0 123 0 0 123 4,164
Grand Total 179,501 175,957 (126) (8,006) 8,341 292 0 501 176,458
* This table does not reflect layoffs that may be necessary in the absence of negotiated workforce savings.
T-90

Workforce Impact SummaryState Funds
2010-11 Through 2012-13
2010-11 Actuals
(03/31/11)
Starting Estimate (03/31/12) Layoffs Attritions
New Fills
Fund Shifts Mergers
Net Change
Ending Estimate (03/31/13)
Minor AgenciesAdirondack Park Agency 52 56 0 (2) 2 0 0 0 56Aging, Office for the 23 27 0 0 0 (5) 0 (5) 22Agriculture and Markets, Department of 504 470 0 (35) 28 0 0 (7) 463Alcoholic Beverage Control, Division of 128 123 0 (2) 11 0 0 9 132Alcoholism and Substance Abuse Services, Office of 842 732 0 (35) 26 0 0 (9) 723Arts, Council on the 29 28 0 (1) 1 0 0 0 28Banking Department 530 0 0 0 0 0 0 0 0Budget, Division of the 313 307 0 (20) 30 0 0 10 317Civil Service, Department of 432 416 0 (10) 2 0 0 (8) 408Consumer Protection Board, State 21 0 0 0 0 0 0 0 0Correction, Commission of 27 29 0 0 0 0 0 0 29Criminal Justice Services, Division of 531 489 0 (52) 55 35 0 38 527Deferred Compensation Board 4 4 0 0 0 0 0 0 4Economic Development, Department of 133 143 0 (3) 18 0 0 15 158Elections, State Board of 59 58 0 0 0 0 0 0 58Employee Relations, Office of 42 41 0 0 13 0 0 13 54Environmental Facilities Corporation 76 88 0 (98) 10 0 0 (88) 0Executive Chamber 124 136 0 (24) 24 0 0 0 136Financial Control Board, New York State 14 14 0 0 0 0 0 0 14Higher Education Services Corporation, New York State 502 495 0 (25) 25 0 0 0 495Homeland Security and Emergency Services, Division of 293 321 0 (11) 10 0 0 (1) 320Housing and Community Renewal, Division of 602 577 0 (61) 75 0 0 14 591Hudson River Valley Greenway Communities Council 1 1 0 0 0 0 0 0 1Human Rights, Division of 152 147 (3) (6) 0 0 0 (9) 138Indigent Legal Services, Office of 1 10 0 0 0 0 0 0 10Inspector General, Office of the 59 62 0 0 3 0 0 3 65Insurance Department 899 0 0 0 0 0 0 0 0Interest on Lawyer Account 8 8 0 0 0 0 0 0 8Judicial Commissions 39 49 0 0 0 0 0 0 49Labor Management Committees 77 79 0 0 0 0 0 0 79Lieutenant Governor, Office of the 4 7 0 (1) 1 0 0 0 7Lottery, Division of the 314 362 0 (15) 15 0 0 0 362Medicaid Inspector General, Office of the 303 279 0 (26) 0 0 0 (26) 253Military and Naval Affairs, Division of 171 168 0 (4) 4 0 0 0 168Prevention of Domestic Violence, Office for 23 24 0 0 0 1 0 1 25Public Employment Relations Board 34 33 0 0 0 0 0 0 33Public Ethics, Joint Commission on 45 45 0 0 0 0 0 0 45Public Service Department 493 493 0 (30) 46 0 0 16 509Quality of Care and Advocacy for Persons with Disabilities 69 75 0 (1) 5 0 0 4 79Racing and Wagering Board, State 102 105 0 (5) 5 0 0 0 105Regulatory Reform, Governor's Office of 10 0 0 0 0 0 0 0 0State, Department of 523 548 0 (14) 30 0 6 22 570Statewide Financial System 88 136 0 (17) 26 0 0 9 145Statewide Wireless Network 3 0 0 0 0 0 0 0 0Tax Appeals, Division of 25 26 0 (1) 1 0 0 0 26Technology, Office for 587 571 0 (14) 40 0 0 26 597Veterans' Affairs, Division of 87 83 0 (2) 5 0 0 3 86Victim Services, Office of 54 51 0 (2) 5 0 0 3 54Welfare Inspector General, Office of 5 7 0 0 0 0 0 0 7
Subtotal - Minor Agencies 9,457 7,923 (3) (517) 516 31 6 33 7,956
T-91

Workforce Impact SummaryAll Funds
2010-11 Through 2012-13
2010-11 Actuals
(03/31/11)
Starting Estimate (03/31/12) Layoffs* Attritions
New Fills
Fund Shifts Mergers
Net Change
Ending Estimate (03/31/13)
Major AgenciesChildren and Family Services, Office of 3,352 3,143 (123) (466) 780 0 0 191 3,334Corrections and Community Supervision, Department of 29,530 29,773 0 (1,899) 1,899 0 0 0 29,773Education Department, State 2,735 2,672 0 (111) 204 0 0 93 2,765Environmental Conservation, Department of 3,003 2,983 0 (52) 52 0 0 0 2,983Financial Services, Department of 0 1,531 0 (52) 52 0 0 0 1,531General Services, Office of 1,345 1,315 0 (60) 74 0 0 14 1,329Health, Department of 4,995 5,000 0 (301) 421 0 0 120 5,120Labor, Department of 3,953 3,753 0 (424) 197 0 0 (227) 3,526Mental Health, Office of 15,727 15,327 0 (1,620) 1,620 0 0 0 15,327Motor Vehicles, Department of 2,447 2,393 0 (52) 73 0 0 21 2,414Parks, Recreation and Historic Preservation, Office of 1,800 1,748 0 (75) 63 0 0 (12) 1,736Parole, Division of 1,863 0 0 0 0 0 0 0 0People with Developmental Disabilities, Office for 21,221 20,718 0 (1,842) 1,728 0 0 (114) 20,604State Police, Division of 5,435 5,220 0 (208) 208 0 0 0 5,220Taxation and Finance, Department of 5,125 4,897 0 (194) 97 0 0 (97) 4,800Temporary and Disability Assistance, Office of 2,159 2,225 0 (12) 59 0 (6) 41 2,266Transportation, Department of 9,130 8,583 0 (304) 213 0 0 (91) 8,492Workers' Compensation Board 1,364 1,380 0 (80) 71 0 0 (9) 1,371
Subtotal - Major Agencies 115,184 112,661 (123) (7,752) 7,811 0 (6) (70) 112,591
Minor Agencies 10,603 9,207 (3) (588) 576 0 6 (9) 9,198
Subtotal - Subject to Direct Executive Control 125,787 121,868 (126) (8,340) 8,387 0 0 (79) 121,789
University SystemsCity University of New York 12,844 12,747 0 0 0 0 0 0 12,747State University Construction Fund 140 152 0 0 0 0 0 0 152State University of New York 41,053 42,206 0 0 0 0 0 0 42,206
Subtotal - University Systems 54,037 55,105 0 0 0 0 0 0 55,105
Off-Budget AgenciesRoswell Park Cancer Institute 2,025 2,025 0 (101) 101 0 0 0 2,025Science, Technology and Innovation, NYS Foundation for 20 0 0 0 0 0 0 0 0State Insurance Fund 2,545 2,536 0 (125) 125 0 0 0 2,536
Subtotal - Off-Budget Agencies 4,590 4,561 0 (226) 226 0 0 0 4,561
Independently Elected AgenciesAudit and Control, Department of 2,444 2,516 0 0 98 0 0 98 2,614Law, Department of 1,653 1,747 0 0 51 0 0 51 1,798
Subtotal - Independently Elected Agencies 4,097 4,263 0 0 149 0 0 149 4,412
Grand Total 188,511 185,797 (126) (8,566) 8,762 0 0 70 185,867
* This table does not reflect layoffs that may be necessary in the absence of negotiated workforce savings.
T-92

Workforce Impact SummaryAll Funds
2010-11 Through 2012-13
2010-11 Actuals
(03/31/11)
Starting Estimate (03/31/12) Layoffs Attritions
New Fills
Fund Shifts Mergers
Net Change
Ending Estimate (03/31/13)
Minor AgenciesAdirondack Park Agency 52 56 0 (2) 2 0 0 0 56Aging, Office for the 119 114 0 (14) 14 0 0 0 114Agriculture and Markets, Department of 508 495 0 (37) 30 0 0 (7) 488Alcoholic Beverage Control, Division of 128 123 0 (2) 11 0 0 9 132Alcoholism and Substance Abuse Services, Office of 842 822 0 (39) 30 0 0 (9) 813Arts, Council on the 29 28 0 (1) 1 0 0 0 28Banking Department 530 0 0 0 0 0 0 0 0Budget, Division of the 313 307 0 (20) 30 0 0 10 317Civil Service, Department of 432 416 0 (10) 2 0 0 (8) 408Consumer Protection Board, State 21 0 0 0 0 0 0 0 0Correction, Commission of 27 29 0 0 0 0 0 0 29Criminal Justice Services, Division of 630 589 0 (52) 55 0 0 3 592Deferred Compensation Board 4 4 0 0 0 0 0 0 4Economic Development, Department of 133 143 0 (3) 18 0 0 15 158Elections, State Board of 59 58 0 0 0 0 0 0 58Employee Relations, Office of 42 41 0 0 13 0 0 13 54Environmental Facilities Corporation 76 88 0 (98) 10 0 0 (88) 0Executive Chamber 124 136 0 (24) 24 0 0 0 136Financial Control Board, New York State 14 14 0 0 0 0 0 0 14Higher Education Services Corporation, New York State 502 495 0 (25) 25 0 0 0 495Homeland Security and Emergency Services, Division of 383 427 0 (20) 35 0 0 15 442Housing and Community Renewal, Division of 749 745 0 (68) 82 0 0 14 759Hudson River Valley Greenway Communities Council 1 1 0 0 0 0 0 0 1Human Rights, Division of 194 188 (3) (7) 0 0 0 (10) 178Indigent Legal Services, Office of 1 10 0 0 0 0 0 0 10Inspector General, Office of the 59 62 0 0 3 0 0 3 65Insurance Department 899 0 0 0 0 0 0 0 0Interest on Lawyer Account 8 8 0 0 0 0 0 0 8Judicial Commissions 39 49 0 0 0 0 0 0 49Labor Management Committees 77 79 0 0 0 0 0 0 79Lieutenant Governor, Office of the 4 7 0 (1) 1 0 0 0 7Lottery, Division of the 314 362 0 (15) 15 0 0 0 362Medicaid Inspector General, Office of the 606 558 0 (52) 0 0 0 (52) 506Military and Naval Affairs, Division of 410 433 0 (9) 9 0 0 0 433Prevention of Domestic Violence, Office for 25 26 0 0 0 0 0 0 26Public Employment Relations Board 34 33 0 0 0 0 0 0 33Public Ethics, Joint Commission on 45 45 0 0 0 0 0 0 45Public Service Department 510 508 0 (30) 46 0 0 16 524Quality of Care and Advocacy for Persons with Disabilities 92 99 0 (1) 5 0 0 4 103Racing and Wagering Board, State 102 105 0 (5) 5 0 0 0 105Regulatory Reform, Governor's Office of 10 0 0 0 0 0 0 0 0State, Department of 574 598 0 (14) 30 0 6 22 620Statewide Financial System 88 136 0 (17) 26 0 0 9 145Statewide Wireless Network 3 0 0 0 0 0 0 0 0Tax Appeals, Division of 25 26 0 (1) 1 0 0 0 26Technology, Office for 587 571 0 (14) 40 0 0 26 597Veterans' Affairs, Division of 96 91 0 (5) 8 0 0 3 94Victim Services, Office of 78 75 0 (2) 5 0 0 3 78Welfare Inspector General, Office of 5 7 0 0 0 0 0 0 7
Subtotal - Minor Agencies 10,603 9,207 (3) (588) 576 0 6 (9) 9,198
T-93

Workforce Impact SummarySpecial Revenue Funds - Other
2010-11 Through 2012-13
2010-11 Actuals
(03/31/11)
Starting Estimate (03/31/12) Layoffs* Attritions
New Fills
Fund Shifts Mergers
Net Change
Ending Estimate (03/31/13)
Major AgenciesChildren and Family Services, Office of 50 48 0 0 0 0 0 0 48Education Department, State 1,035 1,009 0 (35) 65 0 0 30 1,039Environmental Conservation, Department of 1,241 1,167 0 (35) 19 44 0 28 1,195Financial Services, Department of 0 1,531 0 (52) 52 0 0 0 1,531General Services, Office of 60 64 0 0 0 0 0 0 64Health, Department of 2,413 2,462 0 (148) 148 0 0 0 2,462Labor, Department of 361 342 0 (45) 45 0 0 0 342Mental Health, Office of 15,681 15,248 0 (1,620) 1,620 0 0 0 15,248Motor Vehicles, Department of 789 785 0 0 11 0 0 11 796Parks, Recreation and Historic Preservation, Office of 229 233 0 0 0 0 0 0 233People with Developmental Disabilities, Office for 21,208 20,700 0 (1,842) 1,728 0 0 (114) 20,586State Police, Division of 396 417 0 0 0 0 0 0 417Taxation and Finance, Department of 68 794 0 0 0 0 0 0 794Temporary and Disability Assistance, Office of 65 634 0 0 0 (634) 0 (634) 0Transportation, Department of 147 141 0 (6) 6 (6) 0 (6) 135Workers' Compensation Board 1,364 1,380 0 (80) 71 0 0 (9) 1,371
Subtotal - Major Agencies 45,107 46,955 0 (3,863) 3,765 (596) 0 (694) 46,261
Minor Agencies 5,291 4,009 0 (279) 244 (100) 0 (135) 3,874
Subtotal - Subject to Direct Executive Control 50,398 50,964 0 (4,142) 4,009 (696) 0 (829) 50,135
University SystemsCity University of New York 278 280 0 0 0 0 0 0 280State University Construction Fund 140 152 0 0 0 0 0 0 152State University of New York 17,442 18,837 0 0 0 0 0 0 18,837
Subtotal - University Systems 17,860 19,269 0 0 0 0 0 0 19,269
Off-Budget AgenciesRoswell Park Cancer Institute 2,025 2,025 0 (101) 101 0 0 0 2,025
Subtotal - Off-Budget Agencies 2,025 2,025 0 (101) 101 0 0 0 2,025
Independently Elected AgenciesAudit and Control, Department of 36 169 0 0 0 0 0 0 169Law, Department of 320 477 0 0 0 0 0 0 477
Subtotal - Independently Elected Agencies 356 646 0 0 0 0 0 0 646
Grand Total 70,639 72,904 0 (4,243) 4,110 (696) 0 (829) 72,075
* This table does not reflect layoffs that may be necessary in the absence of negotiated workforce savings.
T-94

Workforce Impact SummarySpecial Revenue Funds - Other
2010-11 Through 2012-13
2010-11 Actuals
(03/31/11)
Starting Estimate (03/31/12) Layoffs Attritions
New Fills
Fund Shifts Mergers
Net Change
Ending Estimate (03/31/13)
Minor AgenciesAging, Office for the 1 1 0 0 0 0 0 0 1Agriculture and Markets, Department of 156 151 0 (11) 11 (100) 0 (100) 51Alcoholic Beverage Control, Division of 128 123 0 (2) 11 0 0 9 132Alcoholism and Substance Abuse Services, Office of 840 732 0 (35) 26 0 0 (9) 723Banking Department 530 0 0 0 0 0 0 0 0Budget, Division of the 49 59 0 0 0 0 0 0 59Civil Service, Department of 5 5 0 0 0 0 0 0 5Criminal Justice Services, Division of 5 7 0 0 0 0 0 0 7Deferred Compensation Board 4 4 0 0 0 0 0 0 4Economic Development, Department of 2 2 0 0 0 0 0 0 2Environmental Facilities Corporation 76 88 0 (98) 10 0 0 (88) 0Financial Control Board, New York State 14 14 0 0 0 0 0 0 14Higher Education Services Corporation, New York State 502 495 0 (25) 25 0 0 0 495Homeland Security and Emergency Services, Division of 167 269 0 (8) 8 0 0 0 269Housing and Community Renewal, Division of 409 455 0 (22) 36 0 0 14 469Indigent Legal Services, Office of 1 10 0 0 0 0 0 0 10Insurance Department 899 0 0 0 0 0 0 0 0Interest on Lawyer Account 8 8 0 0 0 0 0 0 8Lottery, Division of the 314 362 0 (15) 15 0 0 0 362Military and Naval Affairs, Division of 6 6 0 0 0 0 0 0 6Prevention of Domestic Violence, Office for 1 0 0 0 0 0 0 0 0Public Service Department 493 493 0 (30) 46 0 0 16 509Quality of Care and Advocacy for Persons with Disabilities 32 31 0 0 0 0 0 0 31Racing and Wagering Board, State 102 105 0 (5) 5 0 0 0 105State, Department of 400 393 0 (9) 20 0 0 11 404Statewide Financial System 88 136 0 (17) 26 0 0 9 145Statewide Wireless Network 3 0 0 0 0 0 0 0 0Technology, Office for 0 5 0 0 0 0 0 0 5Victim Services, Office of 54 51 0 (2) 5 0 0 3 54Welfare Inspector General, Office of 2 4 0 0 0 0 0 0 4
Subtotal - Minor Agencies 5,291 4,009 0 (279) 244 (100) 0 (135) 3,874
T-95
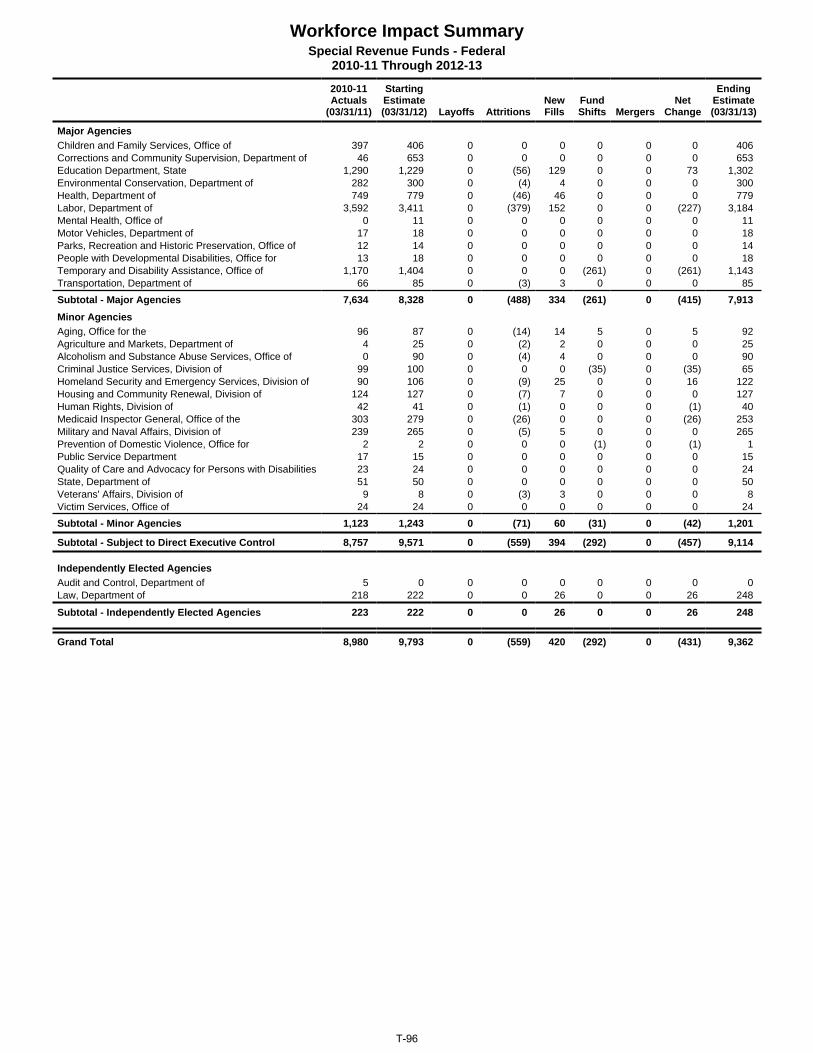
Workforce Impact SummarySpecial Revenue Funds - Federal
2010-11 Through 2012-13
2010-11 Actuals
(03/31/11)
Starting Estimate (03/31/12) Layoffs Attritions
New Fills
Fund Shifts Mergers
Net Change
Ending Estimate (03/31/13)
Major AgenciesChildren and Family Services, Office of 397 406 0 0 0 0 0 0 406Corrections and Community Supervision, Department of 46 653 0 0 0 0 0 0 653Education Department, State 1,290 1,229 0 (56) 129 0 0 73 1,302Environmental Conservation, Department of 282 300 0 (4) 4 0 0 0 300Health, Department of 749 779 0 (46) 46 0 0 0 779Labor, Department of 3,592 3,411 0 (379) 152 0 0 (227) 3,184Mental Health, Office of 0 11 0 0 0 0 0 0 11Motor Vehicles, Department of 17 18 0 0 0 0 0 0 18Parks, Recreation and Historic Preservation, Office of 12 14 0 0 0 0 0 0 14People with Developmental Disabilities, Office for 13 18 0 0 0 0 0 0 18Temporary and Disability Assistance, Office of 1,170 1,404 0 0 0 (261) 0 (261) 1,143Transportation, Department of 66 85 0 (3) 3 0 0 0 85
Subtotal - Major Agencies 7,634 8,328 0 (488) 334 (261) 0 (415) 7,913
Minor AgenciesAging, Office for the 96 87 0 (14) 14 5 0 5 92Agriculture and Markets, Department of 4 25 0 (2) 2 0 0 0 25Alcoholism and Substance Abuse Services, Office of 0 90 0 (4) 4 0 0 0 90Criminal Justice Services, Division of 99 100 0 0 0 (35) 0 (35) 65Homeland Security and Emergency Services, Division of 90 106 0 (9) 25 0 0 16 122Housing and Community Renewal, Division of 124 127 0 (7) 7 0 0 0 127Human Rights, Division of 42 41 0 (1) 0 0 0 (1) 40Medicaid Inspector General, Office of the 303 279 0 (26) 0 0 0 (26) 253Military and Naval Affairs, Division of 239 265 0 (5) 5 0 0 0 265Prevention of Domestic Violence, Office for 2 2 0 0 0 (1) 0 (1) 1Public Service Department 17 15 0 0 0 0 0 0 15Quality of Care and Advocacy for Persons with Disabilities 23 24 0 0 0 0 0 0 24State, Department of 51 50 0 0 0 0 0 0 50Veterans' Affairs, Division of 9 8 0 (3) 3 0 0 0 8Victim Services, Office of 24 24 0 0 0 0 0 0 24
Subtotal - Minor Agencies 1,123 1,243 0 (71) 60 (31) 0 (42) 1,201
Subtotal - Subject to Direct Executive Control 8,757 9,571 0 (559) 394 (292) 0 (457) 9,114
Independently Elected AgenciesAudit and Control, Department of 5 0 0 0 0 0 0 0 0Law, Department of 218 222 0 0 26 0 0 26 248
Subtotal - Independently Elected Agencies 223 222 0 0 26 0 0 26 248
Grand Total 8,980 9,793 0 (559) 420 (292) 0 (431) 9,362
T-96

Workforce Impact SummaryCapital Projects Funds - Other
2010-11 Through 2012-13
2010-11 Actuals
(03/31/11)
Starting Estimate (03/31/12) Layoffs* Attritions
New Fills
Fund Shifts Mergers
Net Change
Ending Estimate (03/31/13)
Major AgenciesChildren and Family Services, Office of 6 6 0 0 0 0 0 0 6Corrections and Community Supervision, Department of 28 30 0 0 0 0 0 0 30Environmental Conservation, Department of 394 383 0 (2) 2 0 0 0 383Health, Department of 56 56 0 (3) 3 0 0 0 56Mental Health, Office of 31 41 0 0 0 0 0 0 41Motor Vehicles, Department of 1,641 1,590 0 (52) 62 0 0 10 1,600Parks, Recreation and Historic Preservation, Office of 111 120 0 0 0 0 0 0 120Transportation, Department of 8,917 8,357 0 (295) 204 6 0 (85) 8,272
Subtotal - Major Agencies 11,184 10,583 0 (352) 271 6 0 (75) 10,508
Subtotal - Subject to Direct Executive Control 11,184 10,583 0 (352) 271 6 0 (75) 10,508
University SystemsState University of New York 7 7 0 0 0 0 0 0 7
Subtotal - University Systems 7 7 0 0 0 0 0 0 7
Independently Elected AgenciesLaw, Department of 6 7 0 0 0 0 0 0 7
Subtotal - Independently Elected Agencies 6 7 0 0 0 0 0 0 7
Grand Total 11,197 10,597 0 (352) 271 6 0 (75) 10,522
* This table does not reflect layoffs that may be necessary in the absence of negotiated workforce savings.
T-97

Workforce Impact SummaryCapital Projects Funds - Federal
2010-11 Through 2012-13
2010-11 Actuals
(03/31/11)
Starting Estimate (03/31/12) Layoffs Attritions
New Fills
Fund Shifts Mergers
Net Change
Ending Estimate (03/31/13)
Major AgenciesEnvironmental Conservation, Department of 7 6 0 (1) 1 0 0 0 6
Subtotal - Major Agencies 7 6 0 (1) 1 0 0 0 6
Minor AgenciesHousing and Community Renewal, Division of 23 41 0 0 0 0 0 0 41
Subtotal - Minor Agencies 23 41 0 0 0 0 0 0 41
Subtotal - Subject to Direct Executive Control 30 47 0 (1) 1 0 0 0 47
Grand Total 30 47 0 (1) 1 0 0 0 47
T-98

Workforce Impact SummaryEnterprise Funds
2010-11 Through 2012-13
2010-11 Actuals
(03/31/11)
Starting Estimate (03/31/12) Layoffs* Attritions
New Fills
Fund Shifts Mergers
Net Change
Ending Estimate (03/31/13)
Major AgenciesCorrections and Community Supervision, Department of 5 11 0 0 0 0 0 0 11General Services, Office of 8 10 0 0 0 0 0 0 10Mental Health, Office of 0 10 0 0 0 0 0 0 10
Subtotal - Major Agencies 13 31 0 0 0 0 0 0 31
Minor AgenciesAgriculture and Markets, Department of 45 54 0 (4) 4 0 0 0 54
Subtotal - Minor Agencies 45 54 0 (4) 4 0 0 0 54
Subtotal - Subject to Direct Executive Control 58 85 0 (4) 4 0 0 0 85
Grand Total 58 85 0 (4) 4 0 0 0 85
* This table does not reflect layoffs that may be necessary in the absence of negotiated workforce savings.
T-99

Workforce Impact SummaryInternal Service Funds
2010-11 Through 2012-13
2010-11 Actuals
(03/31/11)
Starting Estimate (03/31/12) Layoffs* Attritions
New Fills
Fund Shifts Mergers
Net Change
Ending Estimate (03/31/13)
Major AgenciesCorrections and Community Supervision, Department of 293 291 0 0 0 0 0 0 291Education Department, State 149 148 0 (6) 3 0 0 (3) 145General Services, Office of 477 451 0 (10) 14 0 0 4 455Mental Health, Office of 15 17 0 0 0 0 0 0 17Temporary and Disability Assistance, Office of 4 4 0 0 0 0 0 0 4
Subtotal - Major Agencies 938 911 0 (16) 17 0 0 1 912
Minor AgenciesCivil Service, Department of 220 216 0 0 0 0 0 0 216Employee Relations, Office of 11 12 0 0 13 0 0 13 25Prevention of Domestic Violence, Office for 10 10 0 0 0 (1) 0 (1) 9Technology, Office for 448 422 0 (10) 20 0 0 10 432
Subtotal - Minor Agencies 689 660 0 (10) 33 (1) 0 22 682
Subtotal - Subject to Direct Executive Control 1,627 1,571 0 (26) 50 (1) 0 23 1,594
Independently Elected AgenciesAudit and Control, Department of 25 33 0 0 14 0 0 14 47
Subtotal - Independently Elected Agencies 25 33 0 0 14 0 0 14 47
Grand Total 1,652 1,604 0 (26) 64 (1) 0 37 1,641
* This table does not reflect layoffs that may be necessary in the absence of negotiated workforce savings.
T-100

Workforce Impact SummaryAgency Trust Funds
2010-11 Through 2012-13
2010-11 Actuals
(03/31/11)
Starting Estimate (03/31/12) Layoffs Attritions
New Fills
Fund Shifts Mergers
Net Change
Ending Estimate (03/31/13)
University SystemsCity University of New York 12,566 12,467 0 0 0 0 0 0 12,467
Subtotal - University Systems 12,566 12,467 0 0 0 0 0 0 12,467
Off-Budget AgenciesState Insurance Fund 2,545 2,536 0 (125) 125 0 0 0 2,536
Subtotal - Off-Budget Agencies 2,545 2,536 0 (125) 125 0 0 0 2,536
Grand Total 15,111 15,003 0 (125) 125 0 0 0 15,003
T-101

Workforce Impact SummaryPension Trust Funds
2010-11 Through 2012-13
2010-11 Actuals
(03/31/11)
Starting Estimate (03/31/12) Layoffs Attritions
New Fills
Fund Shifts Mergers
Net Change
Ending Estimate (03/31/13)
Independently Elected AgenciesAudit and Control, Department of 927 977 0 0 37 0 0 37 1,014
Subtotal - Independently Elected Agencies 927 977 0 0 37 0 0 37 1,014
Grand Total 927 977 0 0 37 0 0 37 1,014
T-102

Workforce Impact SummaryPrivate Purpose Trust Funds
2010-11 Through 2012-13
2010-11 Actuals
(03/31/11)
Starting Estimate (03/31/12) Layoffs Attritions
New Fills
Fund Shifts Mergers
Net Change
Ending Estimate (03/31/13)
Minor AgenciesAgriculture and Markets, Department of 3 3 0 0 0 0 0 0 3
Subtotal - Minor Agencies 3 3 0 0 0 0 0 0 3
Subtotal - Subject to Direct Executive Control 3 3 0 0 0 0 0 0 3
Grand Total 3 3 0 0 0 0 0 0 3
T-103

Tota
lN
YCSc
hool
Dis
tric
tsC
ount
ies
Oth
er C
ities
Tow
ns &
Vi
llage
sSc
hool
Aid
/Edu
catio
n5.
0 0.
0 0.
0 5.
0 0.
0 0.
0
- Ref
orm
Pre
scho
ol S
peci
al E
duca
tion
5.0
0.0
0.0
5.0
0.0
0.0
Rev
enue
Act
ions
0.3
0.2
0.0
0.1
0.0
0.0
- E
xten
d Ta
x M
oder
niza
tion
Pro
visi
ons
0.7
0.3
0.0
0.4
0.0
0.0
- E
xpan
d S
ales
Tax
Reg
istra
tion
Cle
aran
ce0.
5 0.
1 0.
0 0.
4 0.
0 0.
0
- Exp
and
Sol
ar E
nerg
y E
quip
men
t Exe
mpt
ion
(0.9
)(0
.2)
0.0
(0.7
)0.
0 0.
0 H
uman
Ser
vice
s2.
6 (0
.5)
0.0
3.1
0.0
0.0
- D
elay
Sch
edul
ed P
ublic
Ass
ista
nce
Gra
nt In
crea
se6.
3 2.
5 0.
0 3.
8 0.
0 0.
0
- Inc
reas
e Fl
exib
le F
und
for F
amily
Ser
vice
s A
lloca
tion
to D
istri
cts
6.0
1.9
0.0
4.1
0.0
0.0
- I
mpl
emen
t 'C
lose
To
Hom
e' In
itiat
ive
1.4
0.2
0.0
1.2
0.0
0.0
- E
limin
ate
NY
C S
helte
r Sup
plem
ent F
undi
ng
(3.8
)(3
.8)
0.0
0.0
0.0
0.0
- M
odify
Chi
ld S
uppo
rt Fu
ndin
g: E
limin
ate
Sta
te's
Sha
re o
f Adm
inis
trativ
e C
osts
(7.3
)(1
.3)
0.0
(6.0
)0.
0 0.
0 Tr
ansp
orta
tion
12.5
2.
5 0.
0 10
.0
0.0
0.0
-
Incr
ease
Tra
nsit
Ass
ista
nce
(NY
C, S
uffo
lk, N
assa
u, W
estc
hest
er)
12.5
2.
5 0.
0 10
.0
0.0
0.0
All
Oth
er L
ocal
Impa
cts
17.4
0.
0 4.
0 3.
5 8.
6 1.
3
- Cre
ate
New
Pen
sion
Tie
r VI
9.5
TBD
4.0
3.5
0.7
1.3
- A
ccel
erat
e C
ity o
f Alb
any
19-A
Pay
men
t7.
9 0.
0 0.
0 0.
0 7.
9 0.
0 To
tal 2
012-
13 E
xecu
tive
Bud
get A
ctio
ns37
.8
2.2
4.0
21.7
8.
6 1.
3
Impa
ct o
f 201
2-13
Exe
cutiv
e B
udge
t Rec
omm
enda
tions
on
Loca
l Gov
ernm
ents
Loca
l Fis
cal Y
ears
End
ing
in 2
012
($ in
Mill
ions
)
T-104

Tota
lN
YCSc
hool
Dis
tric
tsC
ount
ies
Oth
er C
ities
Tow
ns &
Vi
llage
sSc
hool
Aid
/Edu
catio
n56
9.9
224.
0 32
6.0
19.9
0.
0 0.
0
- Inc
reas
e S
choo
l Aid
555.
0 22
4.0
331.
0 0.
0 0.
0 0.
0
- Ref
orm
Pre
scho
ol S
peci
al E
duca
tion
14.9
0.
0 (5
.0)
19.9
0.
0 0.
0 R
even
ue A
ctio
ns1.
8 0.
9 0.
0 0.
8 0.
0 0.
1
- Ext
end
Tax
Mod
erni
zatio
n P
rovi
sion
s3.
3 1.
5 0.
0 1.
6 0.
1 0.
1
- Exp
and
Sal
es T
ax R
egis
tratio
n C
lear
ance
1.0
0.4
0.0
0.5
0.0
0.1
- E
xpan
d S
olar
Ene
rgy
Equ
ipm
ent E
xem
ptio
n(2
.5)
(1.0
)0.
0 (1
.3)
(0.1
)(0
.1)
Hum
an S
ervi
ces
2.2
(1.9
)0.
0 4.
1 0.
0 0.
0
- Del
ay S
ched
uled
Pub
lic A
ssis
tanc
e G
rant
Incr
ease
15.0
10
.0
0.0
5.0
0.0
0.0
- I
ncre
ase
Flex
ible
Fun
d fo
r Fam
ily S
ervi
ces
Allo
catio
n to
Dis
trict
s13
.0
7.5
0.0
5.5
0.0
0.0
- I
mpl
emen
t 'C
lose
To
Hom
e' In
itiat
ive
2.2
0.6
0.0
1.6
0.0
0.0
- M
odify
Chi
ld S
uppo
rt Fu
ndin
g: E
limin
ate
Sta
te's
Sha
re o
f Adm
inis
trativ
e C
osts
(13.
0)(5
.0)
0.0
(8.0
)0.
0 0.
0
- Elim
inat
e N
YC
She
lter S
uppl
emen
t Fun
ding
(1
5.0)
(15.
0)0.
0 0.
0 0.
0 0.
0 H
ealth
/ M
edic
aid
27.9
12
.3
0.0
15.6
0.
0 0.
0
- Tak
e O
ver o
f Med
icai
d G
row
th F
acto
r24
.3
10.8
0.
0 13
.5
0.0
0.0
- M
odify
Ear
ly In
terv
entio
n (C
omm
erci
al In
sura
nce
/ Fis
cal I
nter
med
iary
/ R
educ
e La
g)3.
6 1.
5 0.
0 2.
1 0.
0 0.
0 Tr
ansp
orta
tion
17.5
7.
5 0.
0 10
.0
0.0
0.0
-
Incr
ease
Tra
nsit
Ass
ista
nce
(NY
C, S
uffo
lk, N
assa
u, R
ockl
and,
Wes
tche
ster
)17
.5
7.5
0.0
10.0
0.
0 0.
0 A
ll O
ther
Loc
al Im
pact
s72
.6
0.0
24.6
12
.0
30.9
5.
1
- Cre
ate
New
Pen
sion
Tie
r VI
44.6
TB
D24
.6
12.0
2.
9 5.
1
- Acc
eler
ate
AIM
Pay
men
t to
the
City
of R
oche
ster
28.0
0.
0 0.
0 0.
0 28
.0
0.0
Subt
otal
691.
9 24
2.8
350.
6 62
.4
30.9
5.
2
- Sch
ool D
istri
ct P
erfo
rman
ce G
rant
s25
0.0
TBD
TBD
0.0
0.0
0.0
Tota
l 201
2-13
Exe
cutiv
e B
udge
t Act
ions
941.
924
2.8
350.
662
.430
.95.
2
Impa
ct o
f 201
2-13
Exe
cutiv
e B
udge
t Rec
omm
enda
tions
on
Loca
l Gov
ernm
ents
Loca
l Fis
cal Y
ears
End
ing
in 2
013
($ in
Mill
ions
)
T-105

LFY
2012
LFY
2013
LFY
2014
LFY
2015
NYC
2.2
242.
854
7.9
948.
0Sc
hool
Dis
tric
ts4.
035
0.6
733.
81,
209.
9C
ount
ies
21.7
62.4
135.
423
3.0
Oth
er C
ities
8.6
30.9
6.0
9.4
Tow
ns &
Vill
ages
1.3
5.2
10.4
15.8
Subt
otal
37.8
691.
91,
433.
52,
416.
1Sc
hool
Dis
tric
t Per
form
ance
Gra
nts
0.0
250.
010
0.0
100.
0To
tal 2
012-
13 E
xecu
tive
Bud
get A
ctio
ns37
.894
1.9
1,53
3.5
2,51
6.1
Impa
ct o
f 201
2-13
Exe
cutiv
e B
udge
t Rec
omm
enda
tions
on
Loca
l Gov
ernm
ents
Loca
l Fis
cal Y
ears
End
ing
($ in
Mill
ions
)
T-106

CFY
2011
-12
CFY
2012
-13
CFY
2013
-14
CFY
2014
-15
Scho
ol A
id/E
duca
tion
0.0
224.
0 46
8.0
765.
0
- Inc
reas
e S
choo
l Aid
0.0
224.
0 46
8.0
765.
0 R
even
ue A
ctio
ns0.
2 0.
9 1.
6 1.
6
- Ext
end
Tax
Mod
erni
zatio
n P
rovi
sion
s0.
3 1.
5 2.
5 2.
5
- Exp
and
Sol
ar E
nerg
y E
quip
men
t Exe
mpt
ion
(0.2
)(1
.0)
(1.3
)(1
.3)
- E
xpan
d S
ales
Tax
Reg
istra
tion
Cle
aran
ce0.
1 0.
4 0.
4 0.
4 H
uman
Ser
vice
s(0
.5)
(1.9
)(3
.8)
(10.
6)
- Del
ay S
ched
uled
Pub
lic A
ssis
tanc
e G
rant
Incr
ease
2.5
10.0
7.
5 0.
0
- Inc
reas
e Fl
exib
le F
und
for F
amily
Ser
vice
s A
lloca
tion
to D
istri
cts
1.9
7.5
7.5
7.5
- I
mpl
emen
t 'C
lose
To
Hom
e' In
itiat
ive
0.2
0.6
1.2
1.9
- M
odify
Chi
ld S
uppo
rt Fu
ndin
g: E
limin
ate
Sta
te's
Sha
re o
f Adm
inis
trativ
e C
osts
(1.3
)(5
.0)
(5.0
)(5
.0)
- E
limin
ate
NY
C S
helte
r Sup
plem
ent F
undi
ng
(3.8
)(1
5.0)
(15.
0)(1
5.0)
Hea
lth /
Med
icai
d0.
0 12
.3
74.1
18
4.0
- T
ake
Ove
r of M
edic
aid
Gro
wth
Fac
tor
0.0
10.8
65
.2
163.
9
- Mod
ify E
arly
Inte
rven
tion
(Com
mer
cial
Insu
ranc
e / F
isca
l Int
erm
edia
ry /
Red
uce
Lag)
0.0
1.5
8.9
20.1
Tr
ansp
orta
tion
2.5
7.5
8.0
8.0
-
Incr
ease
Tra
nsit
Ass
ista
nce
(NY
C D
OT
& S
I Fer
ry)
2.5
7.5
8.0
8.0
All
Oth
er L
ocal
Impa
cts
0.0
0.0
0.0
0.0
- C
reat
e N
ew P
ensi
on T
ier V
ITB
DTB
DTB
DTB
DSu
btot
al2.
2 24
2.8
547.
9 94
8.0
- S
choo
l Dis
trict
Per
form
ance
Gra
nts
TBD
TBD
TBD
TBD
Tota
l 201
2-13
Exe
cutiv
e B
udge
t Act
ions
2.2
242.
8 54
7.9
948.
0
Impa
ct o
f 201
2-13
Exe
cutiv
e B
udge
t Rec
omm
enda
tions
on
NYC
City
Fis
cal Y
ear
($ in
Mill
ions
)
T-107

CASH DISBURSEMENTS BY FUNCTION GENERAL FUND (excludes transfers)
(thousands of dollars)
FY 2011Results
FY 2012Current
FY 2013Proposed
FY 2014Projected
FY 2015Projected
FY 2016Projected
ECONOMIC DEVELOPMENT AND GOVERNMENT OVERSIGHT
Agriculture and Markets, Department of 42,751 52,872 54,056 55,571 56,778 57,605 Local Assistance Grants 15,014 26,358 23,413 23,095 23,095 23,095 State Operations 27,737 26,514 30,643 32,476 33,683 34,510 Personal Service 21,529 18,883 24,538 25,643 26,537 27,104 Non-Personal Service/Indirect Costs 6,208 7,631 6,105 6,833 7,146 7,406
Development Authority of the North Country 10 117 70 0 0 0 Local Assistance Grants 10 117 70 0 0 0
Economic Development, Department of 45,618 85,493 80,836 68,086 76,052 76,307 Local Assistance Grants 25,790 52,620 60,390 47,409 54,772 54,772 State Operations 19,828 32,873 20,446 20,677 21,280 21,535 Personal Service 13,863 11,059 12,601 12,984 13,321 13,576 Non-Personal Service/Indirect Costs 5,965 21,814 7,845 7,693 7,959 7,959
Empire State Development Corporation 35,741 84,368 91,261 71,280 27,800 17,800 Local Assistance Grants 35,741 84,368 91,261 71,280 27,800 17,800
Financial Services, Department of 11,283 0 0 0 0 0 Local Assistance Grants 11,145 0 0 0 0 0 State Operations 138 0 0 0 0 0 Personal Service 138 0 0 0 0 0
Olympic Regional Development Authority 3,471 3,005 2,929 3,056 3,138 3,138 State Operations 3,471 3,005 2,929 3,056 3,138 3,138 Personal Service 2,890 2,485 2,485 2,522 2,548 2,548 Non-Personal Service/Indirect Costs 581 520 444 534 590 590
Functional Total 138,874 225,855 229,152 197,993 163,768 154,850
PARKS AND THE ENVIRONMENT
Adirondack Park Agency 4,637 4,194 4,146 4,175 4,251 4,337 State Operations 4,637 4,194 4,146 4,175 4,251 4,337 Personal Service 4,234 3,753 3,791 3,820 3,896 3,982 Non-Personal Service/Indirect Costs 403 441 355 355 355 355
Environmental Conservation, Department of 105,995 97,839 90,264 92,725 93,852 95,195 Local Assistance Grants 2,425 6,802 5,425 4,802 4,802 4,802 State Operations 103,570 91,037 84,839 87,923 89,050 90,393 Personal Service 88,184 77,259 74,885 77,969 79,096 80,439 Non-Personal Service/Indirect Costs 15,386 13,778 9,954 9,954 9,954 9,954
Parks, Recreation and Historic Preservation, Office of 131,990 120,739 111,321 107,846 108,935 110,462 Local Assistance Grants 11,025 11,716 8,162 2,850 2,850 2,850 State Operations 120,965 109,023 103,159 104,996 106,085 107,612 Personal Service 109,167 99,923 95,287 97,124 98,213 99,740 Non-Personal Service/Indirect Costs 11,798 9,100 7,872 7,872 7,872 7,872
Functional Total 242,622 222,772 205,731 204,746 207,038 209,994
TRANSPORTATION
Transportation, Department of 98,892 100,619 99,958 99,206 99,206 99,206 Local Assistance Grants 97,038 98,964 98,303 97,551 97,551 97,551 State Operations 1,854 1,655 1,655 1,655 1,655 1,655 Non-Personal Service/Indirect Costs 1,854 1,655 1,655 1,655 1,655 1,655
Functional Total 98,892 100,619 99,958 99,206 99,206 99,206
HEALTH
Aging, Office for the 118,710 115,995 115,840 119,604 126,400 133,412 Local Assistance Grants 117,034 113,860 114,104 117,794 124,498 131,443 State Operations 1,676 2,135 1,736 1,810 1,902 1,969 Personal Service 1,641 1,954 1,555 1,619 1,701 1,768 Non-Personal Service/Indirect Costs 35 181 181 191 201 201
Health, Department of 8,316,084 11,126,146 11,339,888 11,870,224 12,281,959 13,191,218
Medical Assistance 6,963,485 9,740,474 9,952,096 10,456,647 10,867,272 11,807,155 Local Assistance Grants 6,940,238 9,694,119 9,899,241 10,400,292 10,811,417 11,751,300 State Operations 23,247 46,355 52,855 56,355 55,855 55,855 Personal Service 500 500 500 500 500 500 Non-Personal Service/Indirect Costs 22,747 45,855 52,355 55,855 55,355 55,355
Medicaid Administration 538,370 573,750 568,750 552,250 502,750 443,250 Local Assistance Grants 538,370 573,750 568,750 552,250 502,750 443,250
T-108

CASH DISBURSEMENTS BY FUNCTION GENERAL FUND (excludes transfers)
(thousands of dollars)
FY 2011Results
FY 2012Current
FY 2013Proposed
FY 2014Projected
FY 2015Projected
FY 2016Projected
Public Health 814,229 811,922 819,042 861,327 911,937 940,813 Local Assistance Grants 647,875 664,661 659,206 674,117 711,222 737,128 State Operations 166,354 147,261 159,836 187,210 200,715 203,685 Personal Service 60,522 51,492 56,985 69,859 76,364 79,334 Non-Personal Service/Indirect Costs 105,832 95,769 102,851 117,351 124,351 124,351
Medicaid Inspector General, Office of the 24,095 22,484 21,095 21,896 23,121 23,592 State Operations 24,095 22,484 21,095 21,896 23,121 23,592 Personal Service 16,930 16,068 14,679 15,150 16,025 16,496 Non-Personal Service/Indirect Costs 7,165 6,416 6,416 6,746 7,096 7,096
Functional Total 8,458,889 11,264,625 11,476,823 12,011,724 12,431,480 13,348,222
SOCIAL WELFARE
Children and Family Services, Office of 1,928,797 1,833,853 1,871,619 2,169,150 2,258,188 2,358,277
OCFS 1,859,442 1,722,752 1,758,168 2,051,782 2,136,215 2,231,554 Local Assistance Grants 1,594,168 1,484,612 1,467,215 1,768,869 1,867,364 1,965,999 State Operations 265,274 238,140 290,953 282,913 268,851 265,555 Personal Service 163,689 146,695 185,764 171,207 160,048 158,198 Non-Personal Service/Indirect Costs 101,585 91,445 105,189 111,706 108,803 107,357
OCFS - Other 69,355 111,101 113,451 117,368 121,973 126,723 Local Assistance Grants 69,355 111,101 113,451 117,368 121,973 126,723
Housing and Community Renewal, Division of 62,719 52,928 44,146 44,137 44,451 44,936 Local Assistance Grants 43,306 37,115 29,099 29,099 29,099 29,099 State Operations 19,413 15,813 15,047 15,038 15,352 15,837 Personal Service 11,572 8,791 9,479 9,464 9,762 10,182 Non-Personal Service/Indirect Costs 7,841 7,022 5,568 5,574 5,590 5,655
Human Rights, Division of 14,165 11,756 10,755 10,958 11,269 11,614 State Operations 14,165 11,756 10,755 10,958 11,269 11,614 Personal Service 12,932 10,652 9,841 9,927 10,207 10,522 Non-Personal Service/Indirect Costs 1,233 1,104 914 1,031 1,062 1,092
Labor, Department of 11,516 9,339 28,112 0 0 0 Local Assistance Grants 11,114 9,339 28,112 0 0 0 State Operations 402 0 0 0 0 0 Personal Service 309 0 0 0 0 0 Non-Personal Service/Indirect Costs 93 0 0 0 0 0
National and Community Service 381 599 601 683 687 687 Local Assistance Grants 0 350 350 350 350 350 State Operations 381 249 251 333 337 337 Personal Service 304 208 210 292 295 295 Non-Personal Service/Indirect Costs 77 41 41 41 42 42
Prevention of Domestic Violence, Office for 1,928 1,962 2,092 2,109 2,148 2,192 Local Assistance Grants 666 685 685 685 685 685 State Operations 1,262 1,277 1,407 1,424 1,463 1,507 Personal Service 1,098 1,133 1,313 1,324 1,356 1,389 Non-Personal Service/Indirect Costs 164 144 94 100 107 118
Temporary and Disability Assistance, Office of 1,254,805 1,440,687 1,694,958 1,746,043 1,661,557 1,687,840
Welfare Assistance 1,043,865 1,250,702 1,387,466 1,434,692 1,339,041 1,365,754 Local Assistance Grants 1,043,865 1,250,702 1,387,466 1,434,692 1,339,041 1,365,754
All Other 210,940 189,985 307,492 311,351 322,516 322,086 Local Assistance Grants 152,334 152,275 100,493 101,893 101,893 103,293 State Operations 58,606 37,710 206,999 209,458 220,623 218,793 Personal Service 14,094 (2,151) 84,922 86,979 91,656 94,056 Non-Personal Service/Indirect Costs 44,512 39,861 122,077 122,479 128,967 124,737
Welfare Inspector General, Office of 326 293 293 307 318 325 State Operations 326 293 293 307 318 325 Personal Service 326 293 293 307 318 325
Functional Total 3,274,637 3,351,417 3,652,576 3,973,387 3,978,618 4,105,871
MENTAL HYGIENE
Alcoholism and Substance Abuse Services, Office of 142,096 33,232 33,011 32,680 32,680 32,680
OASAS 93,007 552 331 0 0 0 Local Assistance Grants 93,007 552 331 0 0 0
OASAS - Other 49,089 32,680 32,680 32,680 32,680 32,680 Local Assistance Grants 49,089 32,680 32,680 32,680 32,680 32,680
T-109

CASH DISBURSEMENTS BY FUNCTION GENERAL FUND (excludes transfers)
(thousands of dollars)
FY 2011Results
FY 2012Current
FY 2013Proposed
FY 2014Projected
FY 2015Projected
FY 2016Projected
Mental Health, Office of 539,404 432,696 385,727 413,811 440,633 472,946
OMH 115,992 26,354 1,132 800 800 800 Local Assistance Grants 115,741 25,554 332 0 0 0 State Operations 251 800 800 800 800 800 Personal Service 167 0 0 0 0 0 Non-Personal Service/Indirect Costs 84 800 800 800 800 800
OMH - Other 423,412 406,342 384,595 413,011 439,833 472,146 Local Assistance Grants 423,412 406,342 384,595 413,011 439,833 472,146
People with Developmental Disabilities, Office for 1,557,858 1,436,974 1,449,553 1,616,689 1,709,357 1,770,723
OPWDD 119,052 1,586 950 0 0 0 Local Assistance Grants 119,052 1,586 950 0 0 0
OPWDD - Other 1,438,806 1,435,388 1,448,603 1,616,689 1,709,357 1,770,723 Local Assistance Grants 1,438,806 1,435,388 1,448,603 1,616,689 1,709,357 1,770,723
Quality of Care and Advocacy for Persons With Disabilities, Commission on 4,434 3,954 4,827 5,428 5,534 5,649 Local Assistance Grants 229 170 170 170 170 170 State Operations 4,205 3,784 4,657 5,258 5,364 5,479 Personal Service 3,228 2,909 3,714 4,259 4,342 4,432 Non-Personal Service/Indirect Costs 977 875 943 999 1,022 1,047
Functional Total 2,243,792 1,906,856 1,873,118 2,068,608 2,188,204 2,281,998
PUBLIC PROTECTION/CRIMINAL JUSTICE
Correction, Commission of 2,419 2,733 2,672 2,711 2,787 2,864 State Operations 2,419 2,733 2,672 2,711 2,787 2,864 Personal Service 2,082 2,319 2,398 2,414 2,481 2,548 Non-Personal Service/Indirect Costs 337 414 274 297 306 316
Correctional Services, Department of 2,586,638 2,477,459 2,396,049 2,445,496 2,497,865 2,628,026 Local Assistance Grants 10,386 6,086 6,051 6,000 6,000 6,000 State Operations 2,574,252 2,471,373 2,389,998 2,439,496 2,491,865 2,622,026 Personal Service 2,043,633 1,958,633 1,919,183 1,949,125 1,981,019 2,089,740 Non-Personal Service/Indirect Costs 530,619 512,740 470,815 490,371 510,846 532,286 General State Charges 2,000 0 0 0 0 0
Corrections and Community Supervision Medicaid, Department of 0 0 11,500 11,500 11,500 12,500 Local Assistance Grants 0 0 11,500 11,500 11,500 12,500
Criminal Justice Services, Division of 183,551 174,260 171,157 172,212 169,950 171,367 Local Assistance Grants 127,375 123,715 120,026 116,006 116,006 116,006 State Operations 56,176 50,545 51,131 56,206 53,944 55,361 Personal Service 34,492 32,296 33,040 33,481 34,314 35,270 Non-Personal Service/Indirect Costs 21,684 18,249 18,091 22,725 19,630 20,091
Homeland Security and Emergency Services, Division of 30,067 90,400 81,093 68,248 56,537 10,588 Local Assistance Grants 17,552 84,503 75,343 62,438 50,463 4,222 State Operations 12,515 5,897 5,750 5,810 6,074 6,366 Personal Service 6,197 5,897 5,750 5,810 6,074 6,366 Non-Personal Service/Indirect Costs 6,318 0 0 0 0 0
Judicial Commissions 4,944 5,150 5,452 5,577 5,795 5,990 State Operations 4,944 5,150 5,452 5,577 5,795 5,990 Personal Service 3,723 3,791 4,093 4,124 4,237 4,357 Non-Personal Service/Indirect Costs 1,221 1,359 1,359 1,453 1,558 1,633
Military and Naval Affairs, Division of 21,953 22,454 22,398 22,654 23,007 23,376 Local Assistance Grants 725 745 867 850 850 850 State Operations 21,228 21,709 21,531 21,804 22,157 22,526 Personal Service 17,690 15,787 15,744 15,872 16,077 16,294 Non-Personal Service/Indirect Costs 3,538 5,922 5,787 5,932 6,080 6,232
Public Security and Emergency Response 0 600 600 600 600 600 State Operations 0 600 600 600 600 600 Personal Service 0 600 600 600 600 600
State Police, Division of 463,968 433,614 553,993 567,205 572,376 585,339 State Operations 463,968 433,614 553,993 567,205 572,376 585,339 Personal Service 421,015 400,214 517,343 516,653 520,387 528,350 Non-Personal Service/Indirect Costs 42,953 33,400 36,650 50,552 51,989 56,989
Functional Total 3,293,540 3,206,670 3,244,914 3,296,203 3,340,417 3,440,650
HIGHER EDUCATION
City University of New York 1,182,813 1,202,263 1,271,312 1,329,217 1,391,978 1,460,122 Local Assistance Grants 1,182,813 1,202,263 1,271,312 1,329,217 1,391,978 1,460,122
T-110

CASH DISBURSEMENTS BY FUNCTION GENERAL FUND (excludes transfers)
(thousands of dollars)
FY 2011Results
FY 2012Current
FY 2013Proposed
FY 2014Projected
FY 2015Projected
FY 2016Projected
Higher Education Services Corporation, New York State 789,025 907,861 918,933 985,349 1,014,412 1,025,891 Local Assistance Grants 791,507 907,861 918,933 985,349 1,014,412 1,025,891 State Operations (2,482) 0 0 0 0 0 Non-Personal Service/Indirect Costs (2,482) 0 0 0 0 0
State University of New York 1,710,963 1,594,559 1,214,999 636,592 636,592 636,592 Local Assistance Grants 472,818 478,855 439,315 438,537 438,537 438,537 State Operations 1,029,227 917,649 577,629 0 0 0 Personal Service 760,404 660,226 404,904 0 0 0 Non-Personal Service/Indirect Costs 268,823 257,423 172,725 0 0 0 General State Charges 208,918 198,055 198,055 198,055 198,055 198,055
Functional Total 3,682,801 3,704,683 3,405,244 2,951,158 3,042,982 3,122,605
EDUCATION
Arts, Council on the 45,173 36,060 35,955 35,957 36,003 36,053 Local Assistance Grants 40,479 31,635 31,835 31,835 31,835 31,835 State Operations 4,694 4,425 4,120 4,122 4,168 4,218 Personal Service 3,098 2,300 2,298 2,300 2,346 2,396 Non-Personal Service/Indirect Costs 1,596 2,125 1,822 1,822 1,822 1,822
Education, Department of 20,206,427 18,545,539 18,873,706 19,774,728 20,638,711 21,657,770
School Aid 18,705,305 16,793,129 16,949,148 17,758,106 18,550,532 19,493,521 Local Assistance Grants 18,705,305 16,793,129 16,949,148 17,758,106 18,550,532 19,493,521
Special Education Categorical Programs 924,218 1,181,271 1,357,636 1,455,616 1,529,216 1,604,116 Local Assistance Grants 924,218 1,181,271 1,357,636 1,455,616 1,529,216 1,604,116
All Other 576,904 571,139 566,922 561,006 558,963 560,133 Local Assistance Grants 534,933 525,810 524,588 517,127 514,752 515,537 State Operations 40,446 43,419 42,334 43,879 44,211 44,596 Personal Service 24,420 24,659 24,498 24,543 24,875 25,260 Non-Personal Service/Indirect Costs 16,026 18,760 17,836 19,336 19,336 19,336 General State Charges 1,525 1,910 0 0 0 0
Functional Total 20,251,600 18,581,599 18,909,661 19,810,685 20,674,714 21,693,823
GENERAL GOVERNMENT
Budget, Division of the 22,928 20,635 21,550 21,930 23,469 24,241 State Operations 22,928 20,635 21,550 21,930 23,469 24,241 Personal Service 20,633 19,360 20,177 20,841 22,212 22,939 Non-Personal Service/Indirect Costs 2,295 1,275 1,373 1,089 1,257 1,302
Civil Service, Department of 16,392 13,988 13,575 15,682 16,035 16,428 State Operations 16,392 13,988 13,575 15,682 16,035 16,428 Personal Service 15,599 13,300 12,897 15,009 15,357 15,745 Non-Personal Service/Indirect Costs 793 688 678 673 678 683
Deferred Compensation Board 113 52 53 54 56 57 State Operations 113 52 53 54 56 57 Personal Service 30 29 29 29 30 31 Non-Personal Service/Indirect Costs 83 23 24 25 26 26
Elections, State Board of 6,096 5,476 7,649 5,179 35,316 5,462 Local Assistance Grants 582 300 2,700 0 30,000 0 State Operations 5,514 5,176 4,949 5,179 5,316 5,462 Personal Service 4,205 4,104 4,144 4,254 4,370 4,495 Non-Personal Service/Indirect Costs 1,309 1,072 805 925 946 967
Employee Relations, Office of 3,000 2,706 2,632 2,652 2,728 2,811 State Operations 3,000 2,706 2,632 2,652 2,728 2,811 Personal Service 2,909 2,625 2,551 2,570 2,646 2,728 Non-Personal Service/Indirect Costs 91 81 81 82 82 83
General Services, Office of 119,460 116,384 139,924 130,020 124,621 127,333 Local Assistance Grants 28 32 19 0 0 0 State Operations 119,432 116,352 139,905 130,020 124,621 127,333 Personal Service 52,715 45,302 48,208 48,009 49,070 50,383 Non-Personal Service/Indirect Costs 66,717 71,050 91,697 82,011 75,551 76,950
Inspector General, Office of the 5,633 5,406 6,523 6,630 6,883 7,109 State Operations 5,633 5,406 6,523 6,630 6,883 7,109 Personal Service 5,519 4,990 6,083 6,129 6,301 6,485 Non-Personal Service/Indirect Costs 114 416 440 501 582 624
Labor Management Committees 32,243 35,000 30,170 32,774 34,889 38,016 State Operations 32,243 35,000 30,170 32,774 34,889 38,016 Personal Service 9,872 5,500 5,500 5,504 6,119 6,366 Non-Personal Service/Indirect Costs 22,371 29,500 24,670 27,270 28,770 31,650
T-111

CASH DISBURSEMENTS BY FUNCTION GENERAL FUND (excludes transfers)
(thousands of dollars)
FY 2011Results
FY 2012Current
FY 2013Proposed
FY 2014Projected
FY 2015Projected
FY 2016Projected
Public Employment Relations Board 3,660 3,309 3,340 3,655 3,761 3,853 State Operations 3,660 3,309 3,340 3,655 3,761 3,853 Personal Service 3,211 2,907 2,938 2,960 3,046 3,138 Non-Personal Service/Indirect Costs 449 402 402 695 715 715
Public Integrity, Commission on 3,794 3,401 4,016 4,061 4,175 4,295 State Operations 3,794 3,401 4,016 4,061 4,175 4,295 Personal Service 3,017 2,651 3,166 3,190 3,282 3,380 Non-Personal Service/Indirect Costs 777 750 850 871 893 915
Regulatory Reform, Governor's Office of 1,653 0 0 0 0 0 State Operations 1,653 0 0 0 0 0 Personal Service 1,537 0 0 0 0 0 Non-Personal Service/Indirect Costs 116 0 0 0 0 0
State, Department of 36,483 30,968 25,367 19,187 19,706 19,969 Local Assistance Grants 19,682 15,613 10,034 3,338 3,338 3,338 State Operations 16,801 15,355 15,333 15,849 16,368 16,631 Personal Service 12,295 11,420 12,721 13,091 13,468 13,731 Non-Personal Service/Indirect Costs 4,506 3,935 2,612 2,758 2,900 2,900
Tax Appeals, Division of 3,134 3,057 3,101 2,813 2,894 2,948 State Operations 3,134 3,057 3,101 2,813 2,894 2,948 Personal Service 2,776 2,736 2,900 2,601 2,673 2,727 Non-Personal Service/Indirect Costs 358 321 201 212 221 221
Taxation and Finance, Department of 366,317 316,246 324,461 325,015 335,037 341,752 Local Assistance Grants 5,270 926 926 926 926 926 State Operations 361,047 315,320 323,535 324,089 334,111 340,826 Personal Service 296,271 256,890 260,866 259,558 267,933 274,648 Non-Personal Service/Indirect Costs 64,776 58,430 62,669 64,531 66,178 66,178
Technology, Office for 22,902 20,544 21,994 21,305 23,877 23,485 Local Assistance Grants 884 1,245 0 0 0 0 State Operations 22,018 19,299 21,994 21,305 23,877 23,485 Personal Service 11,208 10,651 13,586 13,595 13,907 14,246 Non-Personal Service/Indirect Costs 10,810 8,648 8,408 7,710 9,970 9,239
Veterans' Affairs, Division of 14,069 13,642 13,436 12,949 13,155 13,383 Local Assistance Grants 8,044 8,328 7,967 7,397 7,457 7,517 State Operations 6,025 5,314 5,469 5,552 5,698 5,866 Personal Service 5,570 4,875 5,050 5,123 5,259 5,416 Non-Personal Service/Indirect Costs 455 439 419 429 439 450
Functional Total 657,877 590,814 617,791 603,906 646,602 631,142
ELECTED OFFICIALS
Audit and Control, Department of 167,190 155,680 155,642 157,172 160,521 164,148 Local Assistance Grants 31,598 32,024 32,024 32,024 32,024 32,024 State Operations 135,592 123,656 123,618 125,148 128,497 132,124 Personal Service 107,384 93,237 97,964 98,828 101,494 104,421 Non-Personal Service/Indirect Costs 28,208 30,419 25,654 26,320 27,003 27,703
Executive Chamber 12,880 13,926 13,578 13,836 14,773 15,185 State Operations 12,880 13,926 13,578 13,836 14,773 15,185 Personal Service 10,963 10,695 11,338 11,495 12,238 12,589 Non-Personal Service/Indirect Costs 1,917 3,231 2,240 2,341 2,535 2,596
Judiciary 2,339,911 2,315,445 2,312,000 2,444,446 2,569,206 2,696,602 Local Assistance Grants 4,884 2,445 2,500 17,500 17,500 17,500 State Operations 1,792,790 1,730,500 1,749,600 1,807,614 1,892,952 1,986,894 Personal Service 1,467,042 1,407,855 1,410,600 1,456,134 1,503,142 1,559,092 Non-Personal Service/Indirect Costs 325,748 322,645 339,000 351,480 389,810 427,802 General State Charges 542,237 582,500 559,900 619,332 658,754 692,208
Law, Department of 110,613 98,374 95,914 96,220 98,947 101,937 State Operations 110,613 98,374 95,914 96,220 98,947 101,937 Personal Service 96,314 83,937 83,937 83,944 86,364 89,040 Non-Personal Service/Indirect Costs 14,299 14,437 11,977 12,276 12,583 12,897
Legislature 221,740 217,845 217,845 220,399 222,995 225,633 State Operations 221,740 217,845 217,845 220,399 222,995 225,633 Personal Service 174,096 165,284 165,284 166,524 167,773 169,031 Non-Personal Service/Indirect Costs 47,644 52,561 52,561 53,875 55,222 56,602
Lieutenant Governor, Office of the 304 630 614 614 665 680 State Operations 304 630 614 614 665 680 Personal Service 281 480 480 494 515 543 Non-Personal Service/Indirect Costs 23 150 134 120 150 137
Functional Total 2,852,638 2,801,900 2,795,593 2,932,687 3,067,107 3,204,185
T-112

CASH DISBURSEMENTS BY FUNCTION GENERAL FUND (excludes transfers)
(thousands of dollars)
FY 2011Results
FY 2012Current
FY 2013Proposed
FY 2014Projected
FY 2015Projected
FY 2016Projected
LOCAL GOVERNMENT ASSISTANCE
Aid and Incentives for Municipalities 738,940 721,192 740,555 757,414 772,589 775,357 Local Assistance Grants 738,940 721,192 740,555 757,414 772,589 775,357
Efficiency Incentive Grants Program 4,604 9,127 7,823 1,205 0 0 Local Assistance Grants 4,604 9,127 7,823 1,205 0 0
Miscellaneous Financial Assistance 3,920 1,960 1,960 1,960 1,960 1,960 Local Assistance Grants 3,920 1,960 1,960 1,960 1,960 1,960
Municipalities with VLT Facilities 25,800 25,867 25,867 25,867 25,867 25,867 Local Assistance Grants 25,800 25,867 25,867 25,867 25,867 25,867
Small Government Assistance 2,066 218 218 218 218 218 Local Assistance Grants 2,066 218 218 218 218 218
Functional Total 775,330 758,364 776,423 786,664 800,634 803,402
ALL OTHER CATEGORIES
General State Charges 3,432,021 3,920,304 3,671,935 4,001,489 4,306,959 4,564,805 State Operations 5,561 0 0 0 0 0 Personal Service 3,835 0 0 0 0 0 Non-Personal Service/Indirect Costs 1,726 0 0 0 0 0 General State Charges 3,426,460 3,920,304 3,671,935 4,001,489 4,306,959 4,564,805
Miscellaneous (37,343) 150,601 465,966 251,456 247,637 429,936 Local Assistance Grants (44,723) 83,768 340,882 325,882 325,882 401,790 State Operations 1,549 62,413 120,664 (78,846) (82,665) 23,726 Personal Service 25 62,202 45,452 (4,058) (2,877) 53,514 Non-Personal Service/Indirect Costs 1,524 211 75,212 (74,788) (79,788) (29,788) General State Charges 5,831 4,420 4,420 4,420 4,420 4,420
Functional Total 3,394,678 4,070,905 4,137,901 4,252,945 4,554,596 4,994,741
TOTAL GENERAL FUND SPENDING 49,366,170 50,787,079 51,424,885 53,189,912 55,195,366 58,090,689
T-113

CASH DISBURSEMENTS BY FUNCTION GENERAL FUND (excludes transfers)
(thousands of dollars)
FY 2011Results
FY 2012Current
FY 2013Proposed
FY 2014Projected
FY 2015Projected
FY 2016Projected
ECONOMIC DEVELOPMENT AND GOVERNMENT OVERSIGHTAgriculture and Markets, Department of 42,751 52,872 54,056 55,571 56,778 57,605Development Authority of the North Country 10 117 70 0 0 0Economic Development, Department of 45,618 85,493 80,836 68,086 76,052 76,307Empire State Development Corporation 35,741 84,368 91,261 71,280 27,800 17,800Financial Services, Department of 11,283 0 0 0 0 0Olympic Regional Development Authority 3,471 3,005 2,929 3,056 3,138 3,138 Functional Total 138,874 225,855 229,152 197,993 163,768 154,850
PARKS AND THE ENVIRONMENTAdirondack Park Agency 4,637 4,194 4,146 4,175 4,251 4,337Environmental Conservation, Department of 105,995 97,839 90,264 92,725 93,852 95,195Parks, Recreation and Historic Preservation, Office of 131,990 120,739 111,321 107,846 108,935 110,462 Functional Total 242,622 222,772 205,731 204,746 207,038 209,994
TRANSPORTATIONTransportation, Department of 98,892 100,619 99,958 99,206 99,206 99,206 Functional Total 98,892 100,619 99,958 99,206 99,206 99,206
HEALTHAging, Office for the 118,710 115,995 115,840 119,604 126,400 133,412Health, Department of 8,316,084 11,126,146 11,339,888 11,870,224 12,281,959 13,191,218 Medical Assistance 6,963,485 9,740,474 9,952,096 10,456,647 10,867,272 11,807,155 Medicaid Administration 538,370 573,750 568,750 552,250 502,750 443,250 Public Health 814,229 811,922 819,042 861,327 911,937 940,813Medicaid Inspector General, Office of the 24,095 22,484 21,095 21,896 23,121 23,592 Functional Total 8,458,889 11,264,625 11,476,823 12,011,724 12,431,480 13,348,222
SOCIAL WELFAREChildren and Family Services, Office of 1,928,797 1,833,853 1,871,619 2,169,150 2,258,188 2,358,277 OCFS 1,859,442 1,722,752 1,758,168 2,051,782 2,136,215 2,231,554 OCFS - Other 69,355 111,101 113,451 117,368 121,973 126,723Housing and Community Renewal, Division of 62,719 52,928 44,146 44,137 44,451 44,936Human Rights, Division of 14,165 11,756 10,755 10,958 11,269 11,614Labor, Department of 11,516 9,339 28,112 0 0 0National and Community Service 381 599 601 683 687 687Prevention of Domestic Violence, Office for 1,928 1,962 2,092 2,109 2,148 2,192Temporary and Disability Assistance, Office of 1,254,805 1,440,687 1,694,958 1,746,043 1,661,557 1,687,840 Welfare Assistance 1,043,865 1,250,702 1,387,466 1,434,692 1,339,041 1,365,754 All Other 210,940 189,985 307,492 311,351 322,516 322,086Welfare Inspector General, Office of 326 293 293 307 318 325 Functional Total 3,274,637 3,351,417 3,652,576 3,973,387 3,978,618 4,105,871
MENTAL HYGIENEAlcoholism and Substance Abuse Services, Office of 142,096 33,232 33,011 32,680 32,680 32,680 OASAS 93,007 552 331 0 0 0 OASAS - Other 49,089 32,680 32,680 32,680 32,680 32,680Mental Health, Office of 539,404 432,696 385,727 413,811 440,633 472,946 OMH 115,992 26,354 1,132 800 800 800 OMH - Other 423,412 406,342 384,595 413,011 439,833 472,146People with Developmental Disabilities, Office for 1,557,858 1,436,974 1,449,553 1,616,689 1,709,357 1,770,723 OPWDD 119,052 1,586 950 0 0 0 OPWDD - Other 1,438,806 1,435,388 1,448,603 1,616,689 1,709,357 1,770,723Quality of Care and Advocacy for Persons With Disabilities, Commission on 4,434 3,954 4,827 5,428 5,534 5,649 Functional Total 2,243,792 1,906,856 1,873,118 2,068,608 2,188,204 2,281,998
PUBLIC PROTECTION/CRIMINAL JUSTICECorrection, Commission of 2,419 2,733 2,672 2,711 2,787 2,864Correctional Services, Department of 2,586,638 2,477,459 2,396,049 2,445,496 2,497,865 2,628,026Corrections and Community Supervision Medicaid, Department of 0 0 11,500 11,500 11,500 12,500Criminal Justice Services, Division of 183,551 174,260 171,157 172,212 169,950 171,367Homeland Security and Emergency Services, Division of 30,067 90,400 81,093 68,248 56,537 10,588Judicial Commissions 4,944 5,150 5,452 5,577 5,795 5,990Military and Naval Affairs, Division of 21,953 22,454 22,398 22,654 23,007 23,376Public Security and Emergency Response 0 600 600 600 600 600State Police, Division of 463,968 433,614 553,993 567,205 572,376 585,339 Functional Total 3,293,540 3,206,670 3,244,914 3,296,203 3,340,417 3,440,650
HIGHER EDUCATIONCity University of New York 1,182,813 1,202,263 1,271,312 1,329,217 1,391,978 1,460,122Higher Education Services Corporation, New York State 789,025 907,861 918,933 985,349 1,014,412 1,025,891State University of New York 1,710,963 1,594,559 1,214,999 636,592 636,592 636,592 Functional Total 3,682,801 3,704,683 3,405,244 2,951,158 3,042,982 3,122,605
T-114

CASH DISBURSEMENTS BY FUNCTION GENERAL FUND (excludes transfers)
(thousands of dollars)
FY 2011Results
FY 2012Current
FY 2013Proposed
FY 2014Projected
FY 2015Projected
FY 2016Projected
EDUCATIONArts, Council on the 45,173 36,060 35,955 35,957 36,003 36,053Education, Department of 20,206,427 18,545,539 18,873,706 19,774,728 20,638,711 21,657,770 School Aid 18,705,305 16,793,129 16,949,148 17,758,106 18,550,532 19,493,521 Special Education Categorical Programs 924,218 1,181,271 1,357,636 1,455,616 1,529,216 1,604,116 All Other 576,904 571,139 566,922 561,006 558,963 560,133 Functional Total 20,251,600 18,581,599 18,909,661 19,810,685 20,674,714 21,693,823
GENERAL GOVERNMENTBudget, Division of the 22,928 20,635 21,550 21,930 23,469 24,241Civil Service, Department of 16,392 13,988 13,575 15,682 16,035 16,428Deferred Compensation Board 113 52 53 54 56 57Elections, State Board of 6,096 5,476 7,649 5,179 35,316 5,462Employee Relations, Office of 3,000 2,706 2,632 2,652 2,728 2,811General Services, Office of 119,460 116,384 139,924 130,020 124,621 127,333Inspector General, Office of the 5,633 5,406 6,523 6,630 6,883 7,109Labor Management Committees 32,243 35,000 30,170 32,774 34,889 38,016Public Employment Relations Board 3,660 3,309 3,340 3,655 3,761 3,853Public Integrity, Commission on 3,794 3,401 4,016 4,061 4,175 4,295Regulatory Reform, Governor's Office of 1,653 0 0 0 0 0State, Department of 36,483 30,968 25,367 19,187 19,706 19,969Tax Appeals, Division of 3,134 3,057 3,101 2,813 2,894 2,948Taxation and Finance, Department of 366,317 316,246 324,461 325,015 335,037 341,752Technology, Office for 22,902 20,544 21,994 21,305 23,877 23,485Veterans' Affairs, Division of 14,069 13,642 13,436 12,949 13,155 13,383 Functional Total 657,877 590,814 617,791 603,906 646,602 631,142
ELECTED OFFICIALSAudit and Control, Department of 167,190 155,680 155,642 157,172 160,521 164,148Executive Chamber 12,880 13,926 13,578 13,836 14,773 15,185Judiciary 2,339,911 2,315,445 2,312,000 2,444,446 2,569,206 2,696,602Law, Department of 110,613 98,374 95,914 96,220 98,947 101,937Legislature 221,740 217,845 217,845 220,399 222,995 225,633Lieutenant Governor, Office of the 304 630 614 614 665 680 Functional Total 2,852,638 2,801,900 2,795,593 2,932,687 3,067,107 3,204,185
LOCAL GOVERNMENT ASSISTANCEAid and Incentives for Municipalities 738,940 721,192 740,555 757,414 772,589 775,357Efficiency Incentive Grants Program 4,604 9,127 7,823 1,205 0 0Miscellaneous Financial Assistance 3,920 1,960 1,960 1,960 1,960 1,960Municipalities with VLT Facilities 25,800 25,867 25,867 25,867 25,867 25,867Small Government Assistance 2,066 218 218 218 218 218 Functional Total 775,330 758,364 776,423 786,664 800,634 803,402
ALL OTHER CATEGORIESGeneral State Charges 3,432,021 3,920,304 3,671,935 4,001,489 4,306,959 4,564,805Miscellaneous (37,343) 150,601 465,966 251,456 247,637 429,936 Functional Total 3,394,678 4,070,905 4,137,901 4,252,945 4,554,596 4,994,741
TOTAL GENERAL FUND SPENDING 49,366,170 50,787,079 51,424,885 53,189,912 55,195,366 58,090,689
GSC: Agency disbursements include grants to local governments, state operations and general state charges, which is a departure from prior Financial plan publications. In prior reports, general state charges were excluded from agency spending totals.
T-115
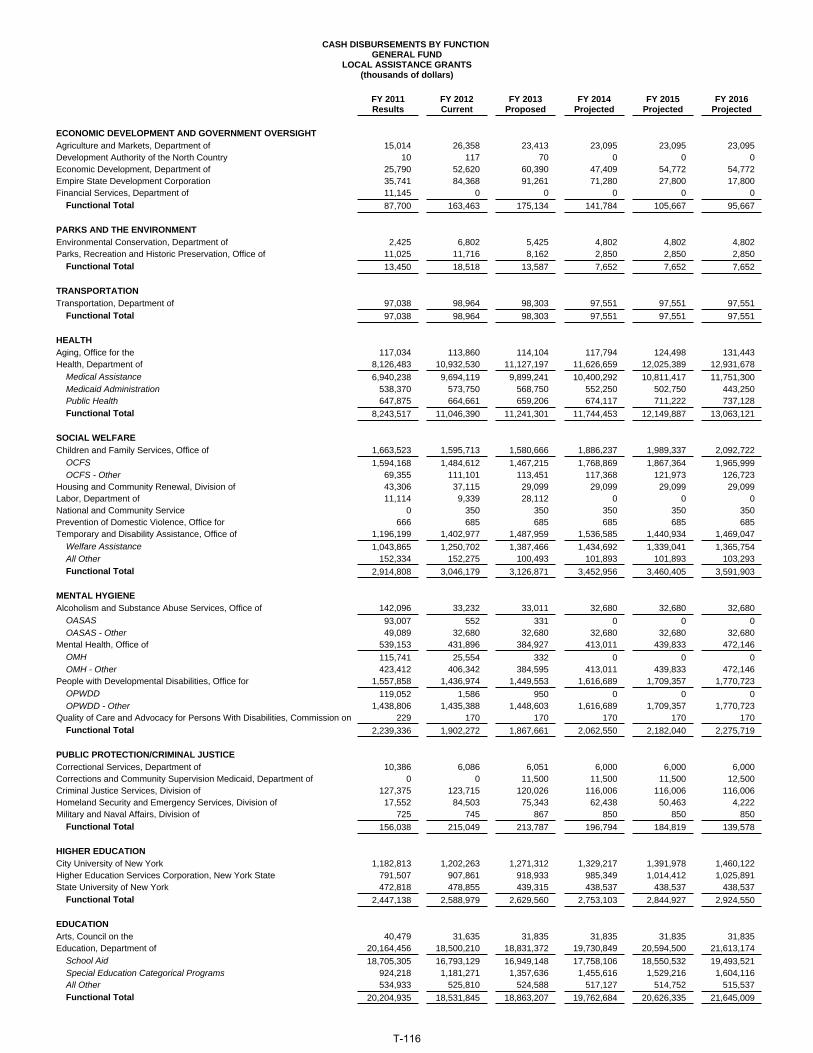
CASH DISBURSEMENTS BY FUNCTION GENERAL FUND
LOCAL ASSISTANCE GRANTS(thousands of dollars)
FY 2011Results
FY 2012Current
FY 2013Proposed
FY 2014Projected
FY 2015Projected
FY 2016Projected
ECONOMIC DEVELOPMENT AND GOVERNMENT OVERSIGHTAgriculture and Markets, Department of 15,014 26,358 23,413 23,095 23,095 23,095Development Authority of the North Country 10 117 70 0 0 0Economic Development, Department of 25,790 52,620 60,390 47,409 54,772 54,772Empire State Development Corporation 35,741 84,368 91,261 71,280 27,800 17,800Financial Services, Department of 11,145 0 0 0 0 0 Functional Total 87,700 163,463 175,134 141,784 105,667 95,667
PARKS AND THE ENVIRONMENTEnvironmental Conservation, Department of 2,425 6,802 5,425 4,802 4,802 4,802Parks, Recreation and Historic Preservation, Office of 11,025 11,716 8,162 2,850 2,850 2,850 Functional Total 13,450 18,518 13,587 7,652 7,652 7,652
TRANSPORTATIONTransportation, Department of 97,038 98,964 98,303 97,551 97,551 97,551 Functional Total 97,038 98,964 98,303 97,551 97,551 97,551
HEALTHAging, Office for the 117,034 113,860 114,104 117,794 124,498 131,443Health, Department of 8,126,483 10,932,530 11,127,197 11,626,659 12,025,389 12,931,678 Medical Assistance 6,940,238 9,694,119 9,899,241 10,400,292 10,811,417 11,751,300 Medicaid Administration 538,370 573,750 568,750 552,250 502,750 443,250 Public Health 647,875 664,661 659,206 674,117 711,222 737,128 Functional Total 8,243,517 11,046,390 11,241,301 11,744,453 12,149,887 13,063,121
SOCIAL WELFAREChildren and Family Services, Office of 1,663,523 1,595,713 1,580,666 1,886,237 1,989,337 2,092,722 OCFS 1,594,168 1,484,612 1,467,215 1,768,869 1,867,364 1,965,999 OCFS - Other 69,355 111,101 113,451 117,368 121,973 126,723Housing and Community Renewal, Division of 43,306 37,115 29,099 29,099 29,099 29,099Labor, Department of 11,114 9,339 28,112 0 0 0National and Community Service 0 350 350 350 350 350Prevention of Domestic Violence, Office for 666 685 685 685 685 685Temporary and Disability Assistance, Office of 1,196,199 1,402,977 1,487,959 1,536,585 1,440,934 1,469,047 Welfare Assistance 1,043,865 1,250,702 1,387,466 1,434,692 1,339,041 1,365,754 All Other 152,334 152,275 100,493 101,893 101,893 103,293 Functional Total 2,914,808 3,046,179 3,126,871 3,452,956 3,460,405 3,591,903
MENTAL HYGIENEAlcoholism and Substance Abuse Services, Office of 142,096 33,232 33,011 32,680 32,680 32,680 OASAS 93,007 552 331 0 0 0 OASAS - Other 49,089 32,680 32,680 32,680 32,680 32,680Mental Health, Office of 539,153 431,896 384,927 413,011 439,833 472,146 OMH 115,741 25,554 332 0 0 0 OMH - Other 423,412 406,342 384,595 413,011 439,833 472,146People with Developmental Disabilities, Office for 1,557,858 1,436,974 1,449,553 1,616,689 1,709,357 1,770,723 OPWDD 119,052 1,586 950 0 0 0 OPWDD - Other 1,438,806 1,435,388 1,448,603 1,616,689 1,709,357 1,770,723Quality of Care and Advocacy for Persons With Disabilities, Commission on 229 170 170 170 170 170 Functional Total 2,239,336 1,902,272 1,867,661 2,062,550 2,182,040 2,275,719
PUBLIC PROTECTION/CRIMINAL JUSTICECorrectional Services, Department of 10,386 6,086 6,051 6,000 6,000 6,000Corrections and Community Supervision Medicaid, Department of 0 0 11,500 11,500 11,500 12,500Criminal Justice Services, Division of 127,375 123,715 120,026 116,006 116,006 116,006Homeland Security and Emergency Services, Division of 17,552 84,503 75,343 62,438 50,463 4,222Military and Naval Affairs, Division of 725 745 867 850 850 850 Functional Total 156,038 215,049 213,787 196,794 184,819 139,578
HIGHER EDUCATIONCity University of New York 1,182,813 1,202,263 1,271,312 1,329,217 1,391,978 1,460,122Higher Education Services Corporation, New York State 791,507 907,861 918,933 985,349 1,014,412 1,025,891State University of New York 472,818 478,855 439,315 438,537 438,537 438,537 Functional Total 2,447,138 2,588,979 2,629,560 2,753,103 2,844,927 2,924,550
EDUCATIONArts, Council on the 40,479 31,635 31,835 31,835 31,835 31,835Education, Department of 20,164,456 18,500,210 18,831,372 19,730,849 20,594,500 21,613,174 School Aid 18,705,305 16,793,129 16,949,148 17,758,106 18,550,532 19,493,521 Special Education Categorical Programs 924,218 1,181,271 1,357,636 1,455,616 1,529,216 1,604,116 All Other 534,933 525,810 524,588 517,127 514,752 515,537 Functional Total 20,204,935 18,531,845 18,863,207 19,762,684 20,626,335 21,645,009
T-116

CASH DISBURSEMENTS BY FUNCTION GENERAL FUND
LOCAL ASSISTANCE GRANTS(thousands of dollars)
FY 2011Results
FY 2012Current
FY 2013Proposed
FY 2014Projected
FY 2015Projected
FY 2016Projected
GENERAL GOVERNMENTElections, State Board of 582 300 2,700 0 30,000 0General Services, Office of 28 32 19 0 0 0State, Department of 19,682 15,613 10,034 3,338 3,338 3,338Taxation and Finance, Department of 5,270 926 926 926 926 926Technology, Office for 884 1,245 0 0 0 0Veterans' Affairs, Division of 8,044 8,328 7,967 7,397 7,457 7,517 Functional Total 34,490 26,444 21,646 11,661 41,721 11,781
ELECTED OFFICIALSAudit and Control, Department of 31,598 32,024 32,024 32,024 32,024 32,024Judiciary 4,884 2,445 2,500 17,500 17,500 17,500 Functional Total 36,482 34,469 34,524 49,524 49,524 49,524
LOCAL GOVERNMENT ASSISTANCEAid and Incentives for Municipalities 738,940 721,192 740,555 757,414 772,589 775,357Efficiency Incentive Grants Program 4,604 9,127 7,823 1,205 0 0Miscellaneous Financial Assistance 3,920 1,960 1,960 1,960 1,960 1,960Municipalities with VLT Facilities 25,800 25,867 25,867 25,867 25,867 25,867Small Government Assistance 2,066 218 218 218 218 218 Functional Total 775,330 758,364 776,423 786,664 800,634 803,402
ALL OTHER CATEGORIESMiscellaneous (44,723) 83,768 340,882 325,882 325,882 401,790 Functional Total (44,723) 83,768 340,882 325,882 325,882 401,790
TOTAL LOCAL ASSISTANCE GRANTS SPENDING 37,205,539 38,514,704 39,402,886 41,393,258 42,877,044 45,107,247
T-117

CASH DISBURSEMENTS BY FUNCTION GENERAL FUND
STATE OPERATIONS(thousands of dollars)
FY 2011Results
FY 2012Current
FY 2013Proposed
FY 2014Projected
FY 2015Projected
FY 2016Projected
ECONOMIC DEVELOPMENT AND GOVERNMENT OVERSIGHTAgriculture and Markets, Department of 27,737 26,514 30,643 32,476 33,683 34,510Economic Development, Department of 19,828 32,873 20,446 20,677 21,280 21,535Financial Services, Department of 138 0 0 0 0 0Olympic Regional Development Authority 3,471 3,005 2,929 3,056 3,138 3,138 Functional Total 51,174 62,392 54,018 56,209 58,101 59,183
PARKS AND THE ENVIRONMENTAdirondack Park Agency 4,637 4,194 4,146 4,175 4,251 4,337Environmental Conservation, Department of 103,570 91,037 84,839 87,923 89,050 90,393Parks, Recreation and Historic Preservation, Office of 120,965 109,023 103,159 104,996 106,085 107,612 Functional Total 229,172 204,254 192,144 197,094 199,386 202,342
TRANSPORTATIONTransportation, Department of 1,854 1,655 1,655 1,655 1,655 1,655 Functional Total 1,854 1,655 1,655 1,655 1,655 1,655
HEALTHAging, Office for the 1,676 2,135 1,736 1,810 1,902 1,969Health, Department of 189,601 193,616 212,691 243,565 256,570 259,540 Medical Assistance 23,247 46,355 52,855 56,355 55,855 55,855 Public Health 166,354 147,261 159,836 187,210 200,715 203,685Medicaid Inspector General, Office of the 24,095 22,484 21,095 21,896 23,121 23,592 Functional Total 215,372 218,235 235,522 267,271 281,593 285,101
SOCIAL WELFAREChildren and Family Services, Office of 265,274 238,140 290,953 282,913 268,851 265,555 OCFS 265,274 238,140 290,953 282,913 268,851 265,555Housing and Community Renewal, Division of 19,413 15,813 15,047 15,038 15,352 15,837Human Rights, Division of 14,165 11,756 10,755 10,958 11,269 11,614Labor, Department of 402 0 0 0 0 0National and Community Service 381 249 251 333 337 337Prevention of Domestic Violence, Office for 1,262 1,277 1,407 1,424 1,463 1,507Temporary and Disability Assistance, Office of 58,606 37,710 206,999 209,458 220,623 218,793 All Other 58,606 37,710 206,999 209,458 220,623 218,793Welfare Inspector General, Office of 326 293 293 307 318 325 Functional Total 359,829 305,238 525,705 520,431 518,213 513,968
MENTAL HYGIENEMental Health, Office of 251 800 800 800 800 800 OMH 251 800 800 800 800 800Quality of Care and Advocacy for Persons With Disabilities, Commission on 4,205 3,784 4,657 5,258 5,364 5,479 Functional Total 4,456 4,584 5,457 6,058 6,164 6,279
PUBLIC PROTECTION/CRIMINAL JUSTICECorrection, Commission of 2,419 2,733 2,672 2,711 2,787 2,864Correctional Services, Department of 2,574,252 2,471,373 2,389,998 2,439,496 2,491,865 2,622,026Criminal Justice Services, Division of 56,176 50,545 51,131 56,206 53,944 55,361Homeland Security and Emergency Services, Division of 12,515 5,897 5,750 5,810 6,074 6,366Judicial Commissions 4,944 5,150 5,452 5,577 5,795 5,990Military and Naval Affairs, Division of 21,228 21,709 21,531 21,804 22,157 22,526Public Security and Emergency Response 0 600 600 600 600 600State Police, Division of 463,968 433,614 553,993 567,205 572,376 585,339 Functional Total 3,135,502 2,991,621 3,031,127 3,099,409 3,155,598 3,301,072
HIGHER EDUCATIONHigher Education Services Corporation, New York State (2,482) 0 0 0 0 0State University of New York 1,029,227 917,649 577,629 0 0 0 Functional Total 1,026,745 917,649 577,629 0 0 0
EDUCATIONArts, Council on the 4,694 4,425 4,120 4,122 4,168 4,218Education, Department of 40,446 43,419 42,334 43,879 44,211 44,596 All Other 40,446 43,419 42,334 43,879 44,211 44,596 Functional Total 45,140 47,844 46,454 48,001 48,379 48,814
GENERAL GOVERNMENTBudget, Division of the 22,928 20,635 21,550 21,930 23,469 24,241Civil Service, Department of 16,392 13,988 13,575 15,682 16,035 16,428Deferred Compensation Board 113 52 53 54 56 57Elections, State Board of 5,514 5,176 4,949 5,179 5,316 5,462Employee Relations, Office of 3,000 2,706 2,632 2,652 2,728 2,811General Services, Office of 119,432 116,352 139,905 130,020 124,621 127,333Inspector General, Office of the 5,633 5,406 6,523 6,630 6,883 7,109
T-118

CASH DISBURSEMENTS BY FUNCTION GENERAL FUND
STATE OPERATIONS(thousands of dollars)
FY 2011Results
FY 2012Current
FY 2013Proposed
FY 2014Projected
FY 2015Projected
FY 2016Projected
Labor Management Committees 32,243 35,000 30,170 32,774 34,889 38,016Public Employment Relations Board 3,660 3,309 3,340 3,655 3,761 3,853Public Integrity, Commission on 3,794 3,401 4,016 4,061 4,175 4,295Regulatory Reform, Governor's Office of 1,653 0 0 0 0 0State, Department of 16,801 15,355 15,333 15,849 16,368 16,631Tax Appeals, Division of 3,134 3,057 3,101 2,813 2,894 2,948Taxation and Finance, Department of 361,047 315,320 323,535 324,089 334,111 340,826Technology, Office for 22,018 19,299 21,994 21,305 23,877 23,485Veterans' Affairs, Division of 6,025 5,314 5,469 5,552 5,698 5,866 Functional Total 623,387 564,370 596,145 592,245 604,881 619,361
ELECTED OFFICIALSAudit and Control, Department of 135,592 123,656 123,618 125,148 128,497 132,124Executive Chamber 12,880 13,926 13,578 13,836 14,773 15,185Judiciary 1,792,790 1,730,500 1,749,600 1,807,614 1,892,952 1,986,894Law, Department of 110,613 98,374 95,914 96,220 98,947 101,937Legislature 221,740 217,845 217,845 220,399 222,995 225,633Lieutenant Governor, Office of the 304 630 614 614 665 680 Functional Total 2,273,919 2,184,931 2,201,169 2,263,831 2,358,829 2,462,453
ALL OTHER CATEGORIESGeneral State Charges 5,561 0 0 0 0 0Miscellaneous 1,549 62,413 120,664 (78,846) (82,665) 23,726 Functional Total 7,110 62,413 120,664 (78,846) (82,665) 23,726
TOTAL STATE OPERATIONS SPENDING 7,973,660 7,565,186 7,587,689 6,973,358 7,150,134 7,523,954
T-119

CASH DISBURSEMENTS BY FUNCTION GENERAL FUND
PERSONAL SERVICE(thousands of dollars)
FY 2011Results
FY 2012Current
FY 2013Proposed
FY 2014Projected
FY 2015Projected
FY 2016Projected
ECONOMIC DEVELOPMENT AND GOVERNMENT OVERSIGHTAgriculture and Markets, Department of 21,529 18,883 24,538 25,643 26,537 27,104Economic Development, Department of 13,863 11,059 12,601 12,984 13,321 13,576Financial Services, Department of 138 0 0 0 0 0Olympic Regional Development Authority 2,890 2,485 2,485 2,522 2,548 2,548 Functional Total 38,420 32,427 39,624 41,149 42,406 43,228
PARKS AND THE ENVIRONMENTAdirondack Park Agency 4,234 3,753 3,791 3,820 3,896 3,982Environmental Conservation, Department of 88,184 77,259 74,885 77,969 79,096 80,439Parks, Recreation and Historic Preservation, Office of 109,167 99,923 95,287 97,124 98,213 99,740 Functional Total 201,585 180,935 173,963 178,913 181,205 184,161
HEALTHAging, Office for the 1,641 1,954 1,555 1,619 1,701 1,768Health, Department of 61,022 51,992 57,485 70,359 76,864 79,834 Medical Assistance 500 500 500 500 500 500 Public Health 60,522 51,492 56,985 69,859 76,364 79,334Medicaid Inspector General, Office of the 16,930 16,068 14,679 15,150 16,025 16,496 Functional Total 79,593 70,014 73,719 87,128 94,590 98,098
SOCIAL WELFAREChildren and Family Services, Office of 163,689 146,695 185,764 171,207 160,048 158,198 OCFS 163,689 146,695 185,764 171,207 160,048 158,198Housing and Community Renewal, Division of 11,572 8,791 9,479 9,464 9,762 10,182Human Rights, Division of 12,932 10,652 9,841 9,927 10,207 10,522Labor, Department of 309 0 0 0 0 0National and Community Service 304 208 210 292 295 295Prevention of Domestic Violence, Office for 1,098 1,133 1,313 1,324 1,356 1,389Temporary and Disability Assistance, Office of 14,094 (2,151) 84,922 86,979 91,656 94,056 All Other 14,094 (2,151) 84,922 86,979 91,656 94,056Welfare Inspector General, Office of 326 293 293 307 318 325 Functional Total 204,324 165,621 291,822 279,500 273,642 274,967
MENTAL HYGIENEMental Health, Office of 167 0 0 0 0 0 OMH 167 0 0 0 0 0Quality of Care and Advocacy for Persons With Disabilities, Commission on 3,228 2,909 3,714 4,259 4,342 4,432 Functional Total 3,395 2,909 3,714 4,259 4,342 4,432
PUBLIC PROTECTION/CRIMINAL JUSTICECorrection, Commission of 2,082 2,319 2,398 2,414 2,481 2,548Correctional Services, Department of 2,043,633 1,958,633 1,919,183 1,949,125 1,981,019 2,089,740Criminal Justice Services, Division of 34,492 32,296 33,040 33,481 34,314 35,270Homeland Security and Emergency Services, Division of 6,197 5,897 5,750 5,810 6,074 6,366Judicial Commissions 3,723 3,791 4,093 4,124 4,237 4,357Military and Naval Affairs, Division of 17,690 15,787 15,744 15,872 16,077 16,294Public Security and Emergency Response 0 600 600 600 600 600State Police, Division of 421,015 400,214 517,343 516,653 520,387 528,350 Functional Total 2,528,832 2,419,537 2,498,151 2,528,079 2,565,189 2,683,525
HIGHER EDUCATIONState University of New York 760,404 660,226 404,904 0 0 0 Functional Total 760,404 660,226 404,904 0 0 0
EDUCATIONArts, Council on the 3,098 2,300 2,298 2,300 2,346 2,396Education, Department of 24,420 24,659 24,498 24,543 24,875 25,260 All Other 24,420 24,659 24,498 24,543 24,875 25,260 Functional Total 27,518 26,959 26,796 26,843 27,221 27,656
GENERAL GOVERNMENTBudget, Division of the 20,633 19,360 20,177 20,841 22,212 22,939Civil Service, Department of 15,599 13,300 12,897 15,009 15,357 15,745Deferred Compensation Board 30 29 29 29 30 31Elections, State Board of 4,205 4,104 4,144 4,254 4,370 4,495Employee Relations, Office of 2,909 2,625 2,551 2,570 2,646 2,728General Services, Office of 52,715 45,302 48,208 48,009 49,070 50,383Inspector General, Office of the 5,519 4,990 6,083 6,129 6,301 6,485Labor Management Committees 9,872 5,500 5,500 5,504 6,119 6,366Public Employment Relations Board 3,211 2,907 2,938 2,960 3,046 3,138Public Integrity, Commission on 3,017 2,651 3,166 3,190 3,282 3,380Regulatory Reform, Governor's Office of 1,537 0 0 0 0 0
T-120

CASH DISBURSEMENTS BY FUNCTION GENERAL FUND
PERSONAL SERVICE(thousands of dollars)
FY 2011Results
FY 2012Current
FY 2013Proposed
FY 2014Projected
FY 2015Projected
FY 2016Projected
State, Department of 12,295 11,420 12,721 13,091 13,468 13,731Tax Appeals, Division of 2,776 2,736 2,900 2,601 2,673 2,727Taxation and Finance, Department of 296,271 256,890 260,866 259,558 267,933 274,648Technology, Office for 11,208 10,651 13,586 13,595 13,907 14,246Veterans' Affairs, Division of 5,570 4,875 5,050 5,123 5,259 5,416 Functional Total 447,367 387,340 400,816 402,463 415,673 426,458
ELECTED OFFICIALSAudit and Control, Department of 107,384 93,237 97,964 98,828 101,494 104,421Executive Chamber 10,963 10,695 11,338 11,495 12,238 12,589Judiciary 1,467,042 1,407,855 1,410,600 1,456,134 1,503,142 1,559,092Law, Department of 96,314 83,937 83,937 83,944 86,364 89,040Legislature 174,096 165,284 165,284 166,524 167,773 169,031Lieutenant Governor, Office of the 281 480 480 494 515 543 Functional Total 1,856,080 1,761,488 1,769,603 1,817,419 1,871,526 1,934,716
ALL OTHER CATEGORIESGeneral State Charges 3,835 0 0 0 0 0Miscellaneous 25 62,202 45,452 (4,058) (2,877) 53,514 Functional Total 3,860 62,202 45,452 (4,058) (2,877) 53,514
TOTAL PERSONAL SERVICE SPENDING 6,151,378 5,769,658 5,728,564 5,361,695 5,472,917 5,730,755
T-121

CASH DISBURSEMENTS BY FUNCTION GENERAL FUND
NON-PERSONAL SERVICE/INDIRECT COSTS(thousands of dollars)
FY 2011Results
FY 2012Current
FY 2013Proposed
FY 2014Projected
FY 2015Projected
FY 2016Projected
ECONOMIC DEVELOPMENT AND GOVERNMENT OVERSIGHTAgriculture and Markets, Department of 6,208 7,631 6,105 6,833 7,146 7,406Economic Development, Department of 5,965 21,814 7,845 7,693 7,959 7,959Olympic Regional Development Authority 581 520 444 534 590 590 Functional Total 12,754 29,965 14,394 15,060 15,695 15,955
PARKS AND THE ENVIRONMENTAdirondack Park Agency 403 441 355 355 355 355Environmental Conservation, Department of 15,386 13,778 9,954 9,954 9,954 9,954Parks, Recreation and Historic Preservation, Office of 11,798 9,100 7,872 7,872 7,872 7,872 Functional Total 27,587 23,319 18,181 18,181 18,181 18,181
TRANSPORTATIONTransportation, Department of 1,854 1,655 1,655 1,655 1,655 1,655 Functional Total 1,854 1,655 1,655 1,655 1,655 1,655
HEALTHAging, Office for the 35 181 181 191 201 201Health, Department of 128,579 141,624 155,206 173,206 179,706 179,706 Medical Assistance 22,747 45,855 52,355 55,855 55,355 55,355 Public Health 105,832 95,769 102,851 117,351 124,351 124,351Medicaid Inspector General, Office of the 7,165 6,416 6,416 6,746 7,096 7,096 Functional Total 135,779 148,221 161,803 180,143 187,003 187,003
SOCIAL WELFAREChildren and Family Services, Office of 101,585 91,445 105,189 111,706 108,803 107,357 OCFS 101,585 91,445 105,189 111,706 108,803 107,357Housing and Community Renewal, Division of 7,841 7,022 5,568 5,574 5,590 5,655Human Rights, Division of 1,233 1,104 914 1,031 1,062 1,092Labor, Department of 93 0 0 0 0 0National and Community Service 77 41 41 41 42 42Prevention of Domestic Violence, Office for 164 144 94 100 107 118Temporary and Disability Assistance, Office of 44,512 39,861 122,077 122,479 128,967 124,737 All Other 44,512 39,861 122,077 122,479 128,967 124,737 Functional Total 155,505 139,617 233,883 240,931 244,571 239,001
MENTAL HYGIENEMental Health, Office of 84 800 800 800 800 800 OMH 84 800 800 800 800 800Quality of Care and Advocacy for Persons With Disabilities, Commission on 977 875 943 999 1,022 1,047 Functional Total 1,061 1,675 1,743 1,799 1,822 1,847
PUBLIC PROTECTION/CRIMINAL JUSTICECorrection, Commission of 337 414 274 297 306 316Correctional Services, Department of 530,619 512,740 470,815 490,371 510,846 532,286Criminal Justice Services, Division of 21,684 18,249 18,091 22,725 19,630 20,091Homeland Security and Emergency Services, Division of 6,318 0 0 0 0 0Judicial Commissions 1,221 1,359 1,359 1,453 1,558 1,633Military and Naval Affairs, Division of 3,538 5,922 5,787 5,932 6,080 6,232State Police, Division of 42,953 33,400 36,650 50,552 51,989 56,989 Functional Total 606,670 572,084 532,976 571,330 590,409 617,547
HIGHER EDUCATIONHigher Education Services Corporation, New York State (2,482) 0 0 0 0 0State University of New York 268,823 257,423 172,725 0 0 0 Functional Total 266,341 257,423 172,725 0 0 0
EDUCATIONArts, Council on the 1,596 2,125 1,822 1,822 1,822 1,822Education, Department of 16,026 18,760 17,836 19,336 19,336 19,336 All Other 16,026 18,760 17,836 19,336 19,336 19,336 Functional Total 17,622 20,885 19,658 21,158 21,158 21,158
GENERAL GOVERNMENTBudget, Division of the 2,295 1,275 1,373 1,089 1,257 1,302Civil Service, Department of 793 688 678 673 678 683Deferred Compensation Board 83 23 24 25 26 26Elections, State Board of 1,309 1,072 805 925 946 967Employee Relations, Office of 91 81 81 82 82 83General Services, Office of 66,717 71,050 91,697 82,011 75,551 76,950Inspector General, Office of the 114 416 440 501 582 624Labor Management Committees 22,371 29,500 24,670 27,270 28,770 31,650
T-122

CASH DISBURSEMENTS BY FUNCTION GENERAL FUND
NON-PERSONAL SERVICE/INDIRECT COSTS(thousands of dollars)
FY 2011Results
FY 2012Current
FY 2013Proposed
FY 2014Projected
FY 2015Projected
FY 2016Projected
Public Employment Relations Board 449 402 402 695 715 715Public Integrity, Commission on 777 750 850 871 893 915Regulatory Reform, Governor's Office of 116 0 0 0 0 0State, Department of 4,506 3,935 2,612 2,758 2,900 2,900Tax Appeals, Division of 358 321 201 212 221 221Taxation and Finance, Department of 64,776 58,430 62,669 64,531 66,178 66,178Technology, Office for 10,810 8,648 8,408 7,710 9,970 9,239Veterans' Affairs, Division of 455 439 419 429 439 450 Functional Total 176,020 177,030 195,329 189,782 189,208 192,903
ELECTED OFFICIALSAudit and Control, Department of 28,208 30,419 25,654 26,320 27,003 27,703Executive Chamber 1,917 3,231 2,240 2,341 2,535 2,596Judiciary 325,748 322,645 339,000 351,480 389,810 427,802Law, Department of 14,299 14,437 11,977 12,276 12,583 12,897Legislature 47,644 52,561 52,561 53,875 55,222 56,602Lieutenant Governor, Office of the 23 150 134 120 150 137 Functional Total 417,839 423,443 431,566 446,412 487,303 527,737
ALL OTHER CATEGORIESGeneral State Charges 1,726 0 0 0 0 0Miscellaneous 1,524 211 75,212 (74,788) (79,788) (29,788) Functional Total 3,250 211 75,212 (74,788) (79,788) (29,788)
TOTAL NON-PERSONAL SERVICE/INDIRECT COSTS SPENDING 1,822,282 1,795,528 1,859,125 1,611,663 1,677,217 1,793,199
T-123

CASH DISBURSEMENTS BY FUNCTION GENERAL FUND
GENERAL STATE CHARGES(thousands of dollars)
FY 2011Results
FY 2012Current
FY 2013Proposed
FY 2014Projected
FY 2015Projected
FY 2016Projected
PUBLIC PROTECTION/CRIMINAL JUSTICECorrectional Services, Department of 2,000 0 0 0 0 0 Functional Total 2,000 0 0 0 0 0
HIGHER EDUCATIONState University of New York 208,918 198,055 198,055 198,055 198,055 198,055 Functional Total 208,918 198,055 198,055 198,055 198,055 198,055
EDUCATIONEducation, Department of 1,525 1,910 0 0 0 0 All Other 1,525 1,910 0 0 0 0 Functional Total 1,525 1,910 0 0 0 0
ELECTED OFFICIALSJudiciary 542,237 582,500 559,900 619,332 658,754 692,208 Functional Total 542,237 582,500 559,900 619,332 658,754 692,208
ALL OTHER CATEGORIESGeneral State Charges 3,426,460 3,920,304 3,671,935 4,001,489 4,306,959 4,564,805Miscellaneous 5,831 4,420 4,420 4,420 4,420 4,420 Functional Total 3,432,291 3,924,724 3,676,355 4,005,909 4,311,379 4,569,225
TOTAL GENERAL STATE CHARGES SPENDING 4,186,971 4,707,189 4,434,310 4,823,296 5,168,188 5,459,488
T-124

CASH DISBURSEMENTS BY FUNCTION STATE OPERATING FUNDS
(thousands of dollars)
FY 2011Results
FY 2012Current
FY 2013Proposed
FY 2014Projected
FY 2015Projected
FY 2016Projected
ECONOMIC DEVELOPMENT AND GOVERNMENT OVERSIGHT
Agriculture and Markets, Department of 77,623 87,757 77,560 79,428 81,487 82,464 Local Assistance Grants 15,014 26,358 23,413 23,095 23,095 23,095 State Operations 57,860 56,257 52,084 54,062 55,847 56,768 Personal Service 31,416 28,640 28,468 29,678 30,751 31,409 Non-Personal Service/Indirect Costs 26,444 27,617 23,616 24,384 25,096 25,359 General State Charges 4,749 5,142 2,063 2,271 2,545 2,601
Alcoholic Beverage Control, Division of 16,706 16,657 17,859 18,314 18,781 19,225 State Operations 12,581 12,904 13,629 13,823 14,020 14,221 Personal Service 8,512 7,833 8,185 8,246 8,308 8,370 Non-Personal Service/Indirect Costs 4,069 5,071 5,444 5,577 5,712 5,851 General State Charges 4,125 3,753 4,230 4,491 4,761 5,004
Development Authority of the North Country 10 117 70 0 0 0 Local Assistance Grants 10 117 70 0 0 0
Economic Development, Department of 46,255 87,437 82,814 70,064 78,030 78,285 Local Assistance Grants 25,790 52,620 60,390 47,409 54,772 54,772 State Operations 20,444 34,789 22,396 22,627 23,230 23,485 Personal Service 13,906 11,227 12,704 13,087 13,424 13,679 Non-Personal Service/Indirect Costs 6,538 23,562 9,692 9,540 9,806 9,806 General State Charges 21 28 28 28 28 28
Empire State Development Corporation 35,741 84,368 91,261 71,280 27,800 17,800 Local Assistance Grants 35,741 84,368 91,261 71,280 27,800 17,800
Energy Research and Development Authority 15,307 15,997 16,158 16,388 16,388 16,388 Local Assistance Grants 9,157 9,234 9,234 9,234 9,234 9,234 State Operations 4,744 5,180 5,286 5,396 5,396 5,396 Personal Service 2,894 3,365 3,432 3,501 3,501 3,501 Non-Personal Service/Indirect Costs 1,850 1,815 1,854 1,895 1,895 1,895 General State Charges 1,406 1,583 1,638 1,758 1,758 1,758
Financial Services, Department of 507,291 490,185 488,005 490,712 494,195 498,348 Local Assistance Grants 228,152 218,832 216,952 216,952 216,952 216,952 State Operations 212,310 204,425 204,123 206,774 209,007 211,596 Personal Service 152,126 134,149 133,847 136,495 138,669 141,191 Non-Personal Service/Indirect Costs 60,184 70,276 70,276 70,279 70,338 70,405 General State Charges 66,829 66,928 66,930 66,986 68,236 69,800
Olympic Regional Development Authority 3,534 3,331 3,079 3,206 3,288 3,288 State Operations 3,534 3,331 3,079 3,206 3,288 3,288 Personal Service 2,890 2,485 2,485 2,522 2,548 2,548 Non-Personal Service/Indirect Costs 644 846 594 684 740 740
Public Service Department 73,076 69,619 74,354 80,290 84,418 88,460 Local Assistance Grants 0 500 500 500 500 500 State Operations 52,777 50,188 52,301 55,506 57,430 59,282 Personal Service 41,801 39,513 41,705 44,591 46,220 47,964 Non-Personal Service/Indirect Costs 10,976 10,675 10,596 10,915 11,210 11,318 General State Charges 20,299 18,931 21,553 24,284 26,488 28,678
Racing and Wagering Board, State 21,573 17,537 18,248 18,513 18,845 19,080 State Operations 18,056 14,809 15,194 15,226 15,333 15,568 Personal Service 12,062 9,335 9,059 9,058 9,133 9,368 Non-Personal Service/Indirect Costs 5,994 5,474 6,135 6,168 6,200 6,200 General State Charges 3,517 2,728 3,054 3,287 3,512 3,512
Functional Total 797,116 873,005 869,408 848,195 823,232 823,338
PARKS AND THE ENVIRONMENT
Adirondack Park Agency 4,637 4,194 4,146 4,175 4,251 4,337 State Operations 4,637 4,194 4,146 4,175 4,251 4,337 Personal Service 4,234 3,753 3,791 3,820 3,896 3,982 Non-Personal Service/Indirect Costs 403 441 355 355 355 355
Environmental Conservation, Department of 296,195 269,068 266,552 268,056 269,778 273,404 Local Assistance Grants 2,835 6,802 5,425 4,802 4,802 4,802 State Operations 255,522 227,776 225,552 228,461 229,432 232,198 Personal Service 186,181 167,335 167,518 169,375 172,285 175,164 Non-Personal Service/Indirect Costs 69,341 60,441 58,034 59,086 57,147 57,034 General State Charges 37,838 34,490 35,575 34,793 35,544 36,404
Environmental Facilities Corporation 9,390 10,277 0 0 0 0 State Operations 7,122 7,155 0 0 0 0 Personal Service 6,060 6,185 0 0 0 0 Non-Personal Service/Indirect Costs 1,062 970 0 0 0 0 General State Charges 2,268 3,122 0 0 0 0
T-125

CASH DISBURSEMENTS BY FUNCTION STATE OPERATING FUNDS
(thousands of dollars)
FY 2011Results
FY 2012Current
FY 2013Proposed
FY 2014Projected
FY 2015Projected
FY 2016Projected
Parks, Recreation and Historic Preservation, Office of 214,344 195,106 182,036 179,707 182,003 184,006 Local Assistance Grants 16,124 16,566 13,012 7,700 7,700 7,700 State Operations 177,022 169,855 160,339 163,180 165,413 167,372 Personal Service 135,297 124,181 123,296 126,137 127,735 129,694 Non-Personal Service/Indirect Costs 41,725 45,674 37,043 37,043 37,678 37,678 General State Charges 2,627 3,685 3,685 3,827 3,890 3,934 Capital Projects 18,571 5,000 5,000 5,000 5,000 5,000
Functional Total 524,566 478,645 452,734 451,938 456,032 461,747
TRANSPORTATION
Motor Vehicles, Department of 95,962 92,653 97,644 101,994 105,772 109,758 State Operations 68,522 69,395 71,836 73,915 75,576 77,460 Personal Service 51,578 48,547 49,937 51,560 52,689 54,020 Non-Personal Service/Indirect Costs 16,944 20,848 21,899 22,355 22,887 23,440 General State Charges 27,440 23,258 25,808 28,079 30,196 32,298
Transportation, Department of 4,287,685 4,302,495 4,427,167 4,586,354 4,681,313 4,776,530 Local Assistance Grants 4,253,828 4,257,399 4,398,264 4,556,412 4,650,412 4,744,612 State Operations 33,454 37,193 23,952 24,548 25,111 25,722 Personal Service 10,853 9,820 9,706 9,957 10,199 10,469 Non-Personal Service/Indirect Costs 22,601 27,373 14,246 14,591 14,912 15,253 General State Charges 403 7,903 4,951 5,394 5,790 6,196
Functional Total 4,383,647 4,395,148 4,524,811 4,688,348 4,787,085 4,886,288
HEALTH
Aging, Office for the 118,718 115,996 115,841 119,605 126,401 133,413 Local Assistance Grants 117,041 113,860 114,104 117,794 124,498 131,443 State Operations 1,677 2,136 1,737 1,811 1,903 1,970 Personal Service 1,641 1,954 1,555 1,619 1,701 1,768 Non-Personal Service/Indirect Costs 36 182 182 192 202 202
Health, Department of 14,418,217 17,938,710 18,432,995 19,216,053 19,851,870 20,551,388
Medical Assistance 11,400,560 14,752,826 15,342,913 16,017,013 16,601,713 17,507,579 Local Assistance Grants 11,377,313 14,706,471 15,290,058 15,960,658 16,545,858 17,451,724 State Operations 23,247 46,355 52,855 56,355 55,855 55,855 Personal Service 500 500 500 500 500 500 Non-Personal Service/Indirect Costs 22,747 45,855 52,355 55,855 55,355 55,355
Medicaid Administration 538,370 573,750 568,750 552,250 502,750 443,250 Local Assistance Grants 538,370 573,750 568,750 552,250 502,750 443,250
Public Health 2,479,287 2,612,134 2,521,332 2,646,790 2,747,407 2,600,559 Local Assistance Grants 1,897,616 2,019,673 1,918,875 1,996,631 2,073,085 1,920,049 State Operations 548,077 551,865 559,095 603,589 626,440 631,006 Personal Service 289,360 280,327 286,301 308,739 321,030 326,676 Non-Personal Service/Indirect Costs 258,717 271,538 272,794 294,850 305,410 304,330 General State Charges 33,594 40,596 43,362 46,570 47,882 49,504
Medicaid Inspector General, Office of the 28,084 26,184 24,795 25,596 26,821 27,292 State Operations 27,990 26,184 24,795 25,596 26,821 27,292 Personal Service 20,818 19,768 18,379 18,850 19,725 20,196 Non-Personal Service/Indirect Costs 7,172 6,416 6,416 6,746 7,096 7,096 General State Charges 94 0 0 0 0 0
Stem Cell and Innovation 37,289 45,000 50,000 63,673 61,373 50,000 State Operations 36,971 45,000 50,000 63,673 61,373 50,000 Personal Service 534 0 0 0 0 0 Non-Personal Service/Indirect Costs 36,437 45,000 50,000 63,673 61,373 50,000 General State Charges 318 0 0 0 0 0
Functional Total 14,602,308 18,125,890 18,623,631 19,424,927 20,066,465 20,762,093
SOCIAL WELFARE
Children and Family Services, Office of 1,991,084 1,904,409 1,914,413 2,211,929 2,301,942 2,402,138
OCFS 1,921,729 1,793,308 1,800,962 2,094,561 2,179,969 2,275,415 Local Assistance Grants 1,598,134 1,486,212 1,468,065 1,769,719 1,868,214 1,966,849 State Operations 321,270 304,430 330,231 322,056 308,937 305,707 Personal Service 192,793 178,802 189,959 175,169 164,108 162,323 Non-Personal Service/Indirect Costs 128,477 125,628 140,272 146,887 144,829 143,384 General State Charges 2,325 2,666 2,666 2,786 2,818 2,859
OCFS - Other 69,355 111,101 113,451 117,368 121,973 126,723 Local Assistance Grants 69,355 111,101 113,451 117,368 121,973 126,723
T-126

CASH DISBURSEMENTS BY FUNCTION STATE OPERATING FUNDS
(thousands of dollars)
FY 2011Results
FY 2012Current
FY 2013Proposed
FY 2014Projected
FY 2015Projected
FY 2016Projected
Housing and Community Renewal, Division of 121,230 107,034 97,844 99,262 101,377 103,817 Local Assistance Grants 44,018 37,967 29,951 29,951 29,951 29,951 State Operations 61,015 53,584 51,392 51,781 52,756 54,285 Personal Service 46,367 41,490 40,890 41,148 41,986 43,395 Non-Personal Service/Indirect Costs 14,648 12,094 10,502 10,633 10,770 10,890 General State Charges 16,197 15,483 16,501 17,530 18,670 19,581
Human Rights, Division of 14,165 11,756 10,755 10,958 11,269 11,614 State Operations 14,165 11,756 10,755 10,958 11,269 11,614 Personal Service 12,932 10,652 9,841 9,927 10,207 10,522 Non-Personal Service/Indirect Costs 1,233 1,104 914 1,031 1,062 1,092
Labor, Department of 71,832 72,225 92,353 62,588 64,237 65,464 Local Assistance Grants 11,237 9,439 28,212 100 100 100 State Operations 44,994 46,869 46,262 43,343 44,403 45,333 Personal Service 32,161 27,801 27,571 27,930 28,620 29,292 Non-Personal Service/Indirect Costs 12,833 19,068 18,691 15,413 15,783 16,041 General State Charges 15,601 15,917 17,879 19,145 19,734 20,031
National and Community Service 381 599 601 683 687 687 Local Assistance Grants 0 350 350 350 350 350 State Operations 381 249 251 333 337 337 Personal Service 304 208 210 292 295 295 Non-Personal Service/Indirect Costs 77 41 41 41 42 42
Prevention of Domestic Violence, Office for 1,956 1,964 2,094 2,111 2,150 2,194 Local Assistance Grants 666 685 685 685 685 685 State Operations 1,290 1,279 1,409 1,426 1,465 1,509 Personal Service 1,098 1,133 1,313 1,324 1,356 1,389 Non-Personal Service/Indirect Costs 192 146 96 102 109 120
Temporary and Disability Assistance, Office of 1,370,873 1,574,694 1,699,158 1,746,243 1,661,757 1,688,040
Welfare Assistance 1,043,865 1,250,702 1,387,466 1,434,692 1,339,041 1,365,754 Local Assistance Grants 1,043,865 1,250,702 1,387,466 1,434,692 1,339,041 1,365,754
All Other 327,008 323,992 311,692 311,551 322,716 322,286 Local Assistance Grants 158,474 161,975 104,493 101,893 101,893 103,293 State Operations 167,085 160,708 207,199 209,658 220,823 218,993 Personal Service 62,305 52,327 84,922 86,979 91,656 94,056 Non-Personal Service/Indirect Costs 104,780 108,381 122,277 122,679 129,167 124,937 General State Charges 1,449 1,309 0 0 0 0
Welfare Inspector General, Office of 1,150 1,391 1,407 1,427 1,456 1,468 State Operations 1,094 1,177 1,186 1,206 1,234 1,244 Personal Service 434 701 701 721 738 748 Non-Personal Service/Indirect Costs 660 476 485 485 496 496 General State Charges 56 214 221 221 222 224
Workers' Compensation Board 194,002 200,058 199,210 198,928 205,530 212,490 State Operations 150,850 158,361 153,148 149,735 152,632 155,909 Personal Service 89,052 87,031 89,130 90,328 92,301 94,633 Non-Personal Service/Indirect Costs 61,798 71,330 64,018 59,407 60,331 61,276 General State Charges 43,152 41,697 46,062 49,193 52,898 56,581
Functional Total 3,766,673 3,874,130 4,017,835 4,334,129 4,350,405 4,487,912
MENTAL HYGIENE
Alcoholism and Substance Abuse Services, Office of 404,678 418,022 417,674 441,197 463,461 487,889
OASAS 292,990 321,914 319,120 340,120 358,577 377,440 Local Assistance Grants 246,366 281,822 283,327 303,356 319,976 337,178 State Operations 34,454 27,785 27,006 27,365 28,300 29,135 Personal Service 25,103 17,464 17,198 17,575 18,255 18,846 Non-Personal Service/Indirect Costs 9,351 10,321 9,808 9,790 10,045 10,289 General State Charges 12,170 12,307 8,787 9,399 10,301 11,127
OASAS - Other 111,688 96,108 98,554 101,077 104,884 110,449 Local Assistance Grants 49,089 32,680 32,680 32,680 32,680 32,680 State Operations 46,364 47,471 46,553 47,648 49,447 52,383 Personal Service 34,493 38,662 37,670 38,769 40,305 42,969 Non-Personal Service/Indirect Costs 11,871 8,809 8,883 8,879 9,142 9,414 General State Charges 16,235 15,957 19,321 20,749 22,757 25,386
Mental Health, Office of 3,121,444 3,019,979 3,057,144 3,304,382 3,562,752 3,795,951
OMH 1,363,390 1,144,968 1,215,893 1,364,814 1,506,327 1,599,912 Local Assistance Grants 682,773 700,999 715,261 834,300 941,444 1,013,408 State Operations 482,556 316,022 370,269 374,040 392,122 399,354 Personal Service 405,776 252,055 290,845 291,573 310,013 316,935 Non-Personal Service/Indirect Costs 76,780 63,967 79,424 82,467 82,109 82,419
T-127

CASH DISBURSEMENTS BY FUNCTION STATE OPERATING FUNDS
(thousands of dollars)
FY 2011Results
FY 2012Current
FY 2013Proposed
FY 2014Projected
FY 2015Projected
FY 2016Projected
General State Charges 198,061 127,947 130,363 156,474 172,761 187,150
OMH - Other 1,758,054 1,875,011 1,841,251 1,939,568 2,056,425 2,196,039 Local Assistance Grants 423,412 406,342 384,595 413,011 439,833 472,146 State Operations 973,298 1,080,916 1,024,029 1,074,810 1,124,167 1,178,179 Personal Service 739,482 850,015 813,670 843,503 873,466 926,013 Non-Personal Service/Indirect Costs 233,816 230,901 210,359 231,307 250,701 252,166 General State Charges 361,344 387,753 432,627 451,747 492,425 545,714
Mental Hygiene, Department of 345 0 0 0 0 0 State Operations 345 0 0 0 0 0 Non-Personal Service/Indirect Costs 345 0 0 0 0 0
People with Developmental Disabilities, Office for 4,297,676 4,186,659 4,239,115 4,576,058 4,774,402 5,000,406
OPWDD 491,009 465,422 435,129 479,595 495,695 505,147 Local Assistance Grants 497,629 465,246 434,953 479,414 495,514 504,966 State Operations (6,620) 176 176 181 181 181 Non-Personal Service/Indirect Costs (6,620) 176 176 181 181 181
OPWDD - Other 3,806,667 3,721,237 3,803,986 4,096,463 4,278,707 4,495,259 Local Assistance Grants 1,677,965 1,692,644 1,724,409 1,906,399 2,000,382 2,061,748 State Operations 1,548,712 1,495,125 1,485,477 1,542,826 1,579,804 1,665,637 Personal Service 1,168,196 1,125,656 1,122,650 1,166,568 1,192,852 1,268,545 Non-Personal Service/Indirect Costs 380,516 369,469 362,827 376,258 386,952 397,092 General State Charges 579,990 533,468 594,100 647,238 698,521 767,874
Quality of Care and Advocacy for Persons With Disabilities, Commission on 8,213 8,161 9,127 9,884 10,174 10,481 Local Assistance Grants 623 620 620 620 620 620 State Operations 6,573 6,400 7,290 7,962 8,144 8,342 Personal Service 5,430 5,247 6,070 6,681 6,834 6,999 Non-Personal Service/Indirect Costs 1,143 1,153 1,220 1,281 1,310 1,343 General State Charges 1,017 1,141 1,217 1,302 1,410 1,519
Functional Total 7,832,356 7,632,821 7,723,060 8,331,521 8,810,789 9,294,727
PUBLIC PROTECTION/CRIMINAL JUSTICE
Correction, Commission of 2,419 2,733 2,672 2,711 2,787 2,864 State Operations 2,419 2,733 2,672 2,711 2,787 2,864 Personal Service 2,082 2,319 2,398 2,414 2,481 2,548 Non-Personal Service/Indirect Costs 337 414 274 297 306 316
Correctional Services, Department of 2,587,693 2,479,163 2,397,618 2,447,065 2,499,434 2,629,595 Local Assistance Grants 10,386 6,086 6,051 6,000 6,000 6,000 State Operations 2,575,307 2,473,077 2,391,567 2,441,065 2,493,434 2,623,595 Personal Service 2,043,633 1,958,633 1,919,183 1,949,125 1,981,019 2,089,740 Non-Personal Service/Indirect Costs 531,674 514,444 472,384 491,940 512,415 533,855 General State Charges 2,000 0 0 0 0 0
Corrections and Community Supervision Medicaid, Department of 0 0 11,500 11,500 11,500 12,500 Local Assistance Grants 0 0 11,500 11,500 11,500 12,500
Criminal Justice Services, Division of 213,480 229,852 226,496 224,071 221,837 223,282 Local Assistance Grants 150,003 159,770 156,081 152,061 152,061 152,061 State Operations 63,391 69,881 70,220 71,802 69,550 70,979 Personal Service 34,806 32,672 33,419 33,864 34,703 35,666 Non-Personal Service/Indirect Costs 28,585 37,209 36,801 37,938 34,847 35,313 General State Charges 86 201 195 208 226 242
Homeland Security and Emergency Services, Division of 33,298 184,626 186,261 182,354 166,967 121,896 Local Assistance Grants 17,552 130,101 136,641 144,436 132,461 86,220 State Operations 15,550 53,824 48,915 37,213 33,801 34,971 Personal Service 6,531 15,280 15,395 15,540 16,056 16,637 Non-Personal Service/Indirect Costs 9,019 38,544 33,520 21,673 17,745 18,334 General State Charges 196 701 705 705 705 705
Indigent Legal Services, Office of 90,793 78,500 78,544 78,588 78,631 78,672 Local Assistance Grants 65,769 77,000 77,000 77,000 77,000 77,000 State Operations 25,024 1,141 1,134 1,151 1,167 1,183 Personal Service 8 750 794 802 810 818 Non-Personal Service/Indirect Costs 25,016 391 340 349 357 365 General State Charges 0 359 410 437 464 489
Judicial Commissions 4,944 5,150 5,452 5,577 5,795 5,990 State Operations 4,944 5,150 5,452 5,577 5,795 5,990 Personal Service 3,723 3,791 4,093 4,124 4,237 4,357 Non-Personal Service/Indirect Costs 1,221 1,359 1,359 1,453 1,558 1,633
Military and Naval Affairs, Division of 32,640 29,672 27,119 28,389 28,750 29,133 Local Assistance Grants 3,659 745 867 850 850 850 State Operations 28,398 28,677 26,002 27,289 27,650 28,033
T-128

CASH DISBURSEMENTS BY FUNCTION STATE OPERATING FUNDS
(thousands of dollars)
FY 2011Results
FY 2012Current
FY 2013Proposed
FY 2014Projected
FY 2015Projected
FY 2016Projected
Personal Service 19,260 16,722 16,679 16,821 17,034 17,265 Non-Personal Service/Indirect Costs 9,138 11,955 9,323 10,468 10,616 10,768 General State Charges 583 250 250 250 250 250
Public Security and Emergency Response 0 600 600 600 600 600 State Operations 0 600 600 600 600 600 Personal Service 0 600 600 600 600 600
State Police, Division of 677,826 676,962 670,849 673,519 680,091 694,075 State Operations 657,091 657,018 647,992 649,446 654,861 667,845 Personal Service 582,393 564,450 568,537 568,523 572,436 580,410 Non-Personal Service/Indirect Costs 74,698 92,568 79,455 80,923 82,425 87,435 General State Charges 20,735 19,944 22,857 24,073 25,230 26,230
Statewide Financial System 9,070 40,638 50,201 51,525 52,826 54,164 State Operations 9,069 40,638 50,201 51,525 52,826 54,164 Personal Service 3,977 9,139 10,814 10,895 10,977 11,060 Non-Personal Service/Indirect Costs 5,092 31,499 39,387 40,630 41,849 43,104 General State Charges 1 0 0 0 0 0
Statewide Wireless Network 28,253 0 0 0 0 0 State Operations 27,655 0 0 0 0 0 Personal Service 8,076 0 0 0 0 0 Non-Personal Service/Indirect Costs 19,579 0 0 0 0 0 General State Charges 598 0 0 0 0 0
Victim Services, Office of 34,594 34,582 34,741 34,931 35,156 35,397 Local Assistance Grants 29,185 28,182 28,182 28,182 28,182 28,182 State Operations 4,521 4,801 4,782 4,862 4,974 5,113 Personal Service 3,761 3,764 3,866 3,931 4,026 4,148 Non-Personal Service/Indirect Costs 760 1,037 916 931 948 965 General State Charges 888 1,599 1,777 1,887 2,000 2,102
Functional Total 3,715,010 3,762,478 3,692,053 3,740,830 3,784,374 3,888,168
HIGHER EDUCATION
City University of New York 1,306,312 1,345,551 1,397,809 1,457,385 1,521,706 1,591,473 Local Assistance Grants 1,182,813 1,202,263 1,271,312 1,329,217 1,391,978 1,460,122 State Operations 117,099 136,747 119,812 121,335 122,895 124,518 Personal Service 85,732 96,651 85,125 85,763 86,406 87,055 Non-Personal Service/Indirect Costs 31,367 40,096 34,687 35,572 36,489 37,463 General State Charges 6,400 6,541 6,685 6,833 6,833 6,833
Higher Education - Miscellaneous 370 355 1,300 1,300 1,300 1,300 State Operations 255 220 1,201 1,201 1,201 1,201 Personal Service 221 175 198 198 198 198 Non-Personal Service/Indirect Costs 34 45 1,003 1,003 1,003 1,003 General State Charges 115 135 99 99 99 99
Higher Education Services Corporation, New York State 889,588 1,012,153 1,035,044 1,088,021 1,103,725 1,117,935 Local Assistance Grants 813,707 923,861 950,933 1,001,349 1,014,412 1,025,891 State Operations 61,052 74,876 68,980 70,309 71,976 73,821 Personal Service 32,756 32,134 30,166 30,554 31,247 32,058 Non-Personal Service/Indirect Costs 28,296 42,742 38,814 39,755 40,729 41,763 General State Charges 14,829 13,416 15,131 16,363 17,337 18,223
State University Construction Fund 18,915 26,172 0 0 0 0 State Operations 14,438 18,579 0 0 0 0 Personal Service 12,562 15,544 0 0 0 0 Non-Personal Service/Indirect Costs 1,876 3,035 0 0 0 0 General State Charges 4,477 7,593 0 0 0 0
State University of New York 5,880,864 6,125,584 6,238,714 6,409,928 6,607,672 6,775,990 Local Assistance Grants 472,818 478,855 439,315 438,537 438,537 438,537 State Operations 4,880,006 5,147,969 5,298,470 5,454,949 5,620,644 5,788,962 Personal Service 3,239,364 3,251,226 3,340,878 3,437,772 3,550,082 3,664,050 Non-Personal Service/Indirect Costs 1,640,642 1,896,743 1,957,592 2,017,177 2,070,562 2,124,912 General State Charges 528,040 498,760 500,929 516,442 548,491 548,491
Functional Total 8,096,049 8,509,815 8,672,867 8,956,634 9,234,403 9,486,698
EDUCATION
Arts, Council on the 45,173 36,158 36,053 36,055 36,101 36,151 Local Assistance Grants 40,479 31,733 31,933 31,933 31,933 31,933 State Operations 4,694 4,425 4,120 4,122 4,168 4,218 Personal Service 3,098 2,300 2,298 2,300 2,346 2,396 Non-Personal Service/Indirect Costs 1,596 2,125 1,822 1,822 1,822 1,822
T-129

CASH DISBURSEMENTS BY FUNCTION STATE OPERATING FUNDS
(thousands of dollars)
FY 2011Results
FY 2012Current
FY 2013Proposed
FY 2014Projected
FY 2015Projected
FY 2016Projected
Education, Department of 26,717,031 24,849,251 25,371,985 26,465,982 27,521,428 28,647,437
School Aid 21,848,300 19,677,129 20,002,148 20,814,906 21,612,532 22,557,521 Local Assistance Grants 21,848,300 19,677,129 20,002,148 20,814,906 21,612,532 22,557,521
STAR Property Tax Relief 3,234,014 3,292,520 3,322,067 3,508,375 3,690,726 3,792,568 Local Assistance Grants 3,234,014 3,292,520 3,322,067 3,508,375 3,690,726 3,792,568
Special Education Categorical Programs 924,218 1,181,271 1,357,636 1,455,616 1,529,216 1,604,116 Local Assistance Grants 924,218 1,181,271 1,357,636 1,455,616 1,529,216 1,604,116
All Other 710,499 698,331 690,134 687,085 688,954 693,232 Local Assistance Grants 549,521 537,233 532,224 524,185 521,644 522,429 State Operations 131,572 131,312 127,577 129,941 131,823 133,609 Personal Service 90,078 83,525 83,466 85,059 86,510 87,989 Non-Personal Service/Indirect Costs 41,494 47,787 44,111 44,882 45,313 45,620 General State Charges 29,406 29,786 30,333 32,959 35,487 37,194
Functional Total 26,762,204 24,885,409 25,408,038 26,502,037 27,557,529 28,683,588
GENERAL GOVERNMENT
Budget, Division of the 33,825 36,345 37,260 38,767 41,458 42,664 State Operations 32,081 34,266 34,963 36,117 38,584 39,570 Personal Service 24,430 23,915 24,961 25,768 27,287 28,166 Non-Personal Service/Indirect Costs 7,651 10,351 10,002 10,349 11,297 11,404 General State Charges 1,744 2,079 2,297 2,650 2,874 3,094
Civil Service, Department of 17,896 15,323 14,904 17,311 17,775 18,179 State Operations 17,677 15,104 14,736 17,143 17,603 18,003 Personal Service 16,153 13,650 13,247 15,359 15,714 16,109 Non-Personal Service/Indirect Costs 1,524 1,454 1,489 1,784 1,889 1,894 General State Charges 219 219 168 168 172 176
Deferred Compensation Board 681 774 796 823 858 867 State Operations 519 598 605 615 633 642 Personal Service 374 390 392 396 408 417 Non-Personal Service/Indirect Costs 145 208 213 219 225 225 General State Charges 162 176 191 208 225 225
Elections, State Board of 6,186 7,372 7,649 5,179 35,316 5,462 Local Assistance Grants 582 300 2,700 0 30,000 0 State Operations 5,604 7,072 4,949 5,179 5,316 5,462 Personal Service 4,205 4,104 4,144 4,254 4,370 4,495 Non-Personal Service/Indirect Costs 1,399 2,968 805 925 946 967
Employee Relations, Office of 3,000 2,760 2,688 2,710 2,786 2,869 State Operations 3,000 2,760 2,688 2,710 2,786 2,869 Personal Service 2,909 2,625 2,551 2,570 2,646 2,728 Non-Personal Service/Indirect Costs 91 135 137 140 140 141
General Services, Office of 128,633 130,630 149,884 140,381 135,345 138,371 Local Assistance Grants 28 32 19 0 0 0 State Operations 127,315 128,454 147,964 138,379 133,201 136,087 Personal Service 56,079 48,664 51,886 51,859 52,985 54,378 Non-Personal Service/Indirect Costs 71,236 79,790 96,078 86,520 80,216 81,709 General State Charges 1,290 2,144 1,901 2,002 2,144 2,284
Inspector General, Office of the 5,703 5,493 6,610 6,717 6,970 7,196 State Operations 5,703 5,493 6,610 6,717 6,970 7,196 Personal Service 5,519 4,990 6,083 6,129 6,301 6,485 Non-Personal Service/Indirect Costs 184 503 527 588 669 711
Labor Management Committees 32,335 35,300 30,470 33,074 35,189 38,316 State Operations 32,335 35,300 30,470 33,074 35,189 38,316 Personal Service 9,872 5,500 5,500 5,504 6,119 6,366 Non-Personal Service/Indirect Costs 22,463 29,800 24,970 27,570 29,070 31,950
Lottery, Division of the 162,910 173,905 164,890 169,076 173,058 173,456 State Operations 152,955 162,440 151,835 155,197 159,080 159,478 Personal Service 21,057 21,738 24,864 25,029 25,495 25,893 Non-Personal Service/Indirect Costs 131,898 140,702 126,971 130,168 133,585 133,585 General State Charges 9,955 11,465 13,055 13,879 13,978 13,978
Public Employment Relations Board 3,988 3,884 3,731 3,857 3,804 3,896 State Operations 3,988 3,884 3,731 3,857 3,804 3,896 Personal Service 3,456 3,182 3,290 3,119 3,046 3,138 Non-Personal Service/Indirect Costs 532 702 441 738 758 758
Public Integrity, Commission on 3,794 3,401 4,016 4,061 4,175 4,295 State Operations 3,794 3,401 4,016 4,061 4,175 4,295 Personal Service 3,017 2,651 3,166 3,190 3,282 3,380 Non-Personal Service/Indirect Costs 777 750 850 871 893 915
T-130

CASH DISBURSEMENTS BY FUNCTION STATE OPERATING FUNDS
(thousands of dollars)
FY 2011Results
FY 2012Current
FY 2013Proposed
FY 2014Projected
FY 2015Projected
FY 2016Projected
Regulatory Reform, Governor's Office of 1,653 0 0 0 0 0 State Operations 1,653 0 0 0 0 0 Personal Service 1,537 0 0 0 0 0 Non-Personal Service/Indirect Costs 116 0 0 0 0 0
State, Department of 75,478 67,659 64,738 60,147 62,133 63,054 Local Assistance Grants 24,495 16,152 10,573 3,877 3,877 3,877 State Operations 41,797 43,770 45,282 46,581 47,676 48,348 Personal Service 31,270 29,124 31,340 32,307 33,039 33,700 Non-Personal Service/Indirect Costs 10,527 14,646 13,942 14,274 14,637 14,648 General State Charges 9,186 7,752 8,898 9,704 10,595 10,844 Capital Projects 0 (15) (15) (15) (15) (15)
Tax Appeals, Division of 3,134 3,057 3,101 2,813 2,894 2,948 State Operations 3,134 3,057 3,101 2,813 2,894 2,948 Personal Service 2,776 2,736 2,900 2,601 2,673 2,727 Non-Personal Service/Indirect Costs 358 321 201 212 221 221
Taxation and Finance, Department of 441,466 404,678 415,599 418,545 429,888 436,603 Local Assistance Grants 5,270 926 926 926 926 926 State Operations 412,940 384,894 393,151 394,799 405,915 412,630 Personal Service 323,767 297,866 301,881 300,966 309,755 316,470 Non-Personal Service/Indirect Costs 89,173 87,028 91,270 93,833 96,160 96,160 General State Charges 23,256 18,858 21,522 22,820 23,047 23,047
Technology, Office for 22,902 24,544 23,780 22,091 24,691 24,303 Local Assistance Grants 884 1,245 0 0 0 0 State Operations 22,018 22,799 23,280 21,591 24,191 23,803 Personal Service 11,208 10,851 13,786 13,795 14,121 14,464 Non-Personal Service/Indirect Costs 10,810 11,948 9,494 7,796 10,070 9,339 General State Charges 0 500 500 500 500 500
Veterans' Affairs, Division of 14,069 13,642 13,436 12,949 13,155 13,383 Local Assistance Grants 8,044 8,328 7,967 7,397 7,457 7,517 State Operations 6,025 5,314 5,469 5,552 5,698 5,866 Personal Service 5,570 4,875 5,050 5,123 5,259 5,416 Non-Personal Service/Indirect Costs 455 439 419 429 439 450
Functional Total 957,653 928,767 943,552 938,501 989,495 975,862
ELECTED OFFICIALS
Audit and Control, Department of 171,821 174,170 173,479 175,736 179,315 183,489 Local Assistance Grants 31,598 32,024 32,024 32,024 32,024 32,024 State Operations 138,841 139,405 139,394 142,190 145,658 149,721 Personal Service 110,320 103,442 108,671 109,385 112,012 115,214 Non-Personal Service/Indirect Costs 28,521 35,963 30,723 32,805 33,646 34,507 General State Charges 1,382 2,741 2,061 1,522 1,633 1,744
Executive Chamber 12,880 13,926 13,578 13,836 14,773 15,185 State Operations 12,880 13,926 13,578 13,836 14,773 15,185 Personal Service 10,963 10,695 11,338 11,495 12,238 12,589 Non-Personal Service/Indirect Costs 1,917 3,231 2,240 2,341 2,535 2,596
Judiciary 2,540,268 2,546,823 2,546,998 2,679,944 2,805,004 2,934,500 Local Assistance Grants 119,798 106,645 106,700 121,700 121,700 121,700 State Operations 1,868,890 1,833,880 1,855,900 1,914,414 1,999,952 2,095,494 Personal Service 1,525,120 1,463,935 1,468,250 1,514,284 1,561,492 1,618,742 Non-Personal Service/Indirect Costs 343,770 369,945 387,650 400,130 438,460 476,752 General State Charges 551,580 606,298 584,398 643,830 683,352 717,306
Law, Department of 169,761 173,046 176,139 177,667 183,089 188,749 State Operations 161,877 161,965 162,109 162,564 166,796 171,368 Personal Service 111,750 107,411 110,920 110,913 113,920 117,232 Non-Personal Service/Indirect Costs 50,127 54,554 51,189 51,651 52,876 54,136 General State Charges 7,884 11,081 14,030 15,103 16,293 17,381
Legislature 222,536 218,795 218,795 221,349 223,945 226,583 State Operations 222,536 218,795 218,795 221,349 223,945 226,583 Personal Service 174,096 165,284 165,284 166,524 167,773 169,031 Non-Personal Service/Indirect Costs 48,440 53,511 53,511 54,825 56,172 57,552
Lieutenant Governor, Office of the 304 630 614 614 665 680 State Operations 304 630 614 614 665 680 Personal Service 281 480 480 494 515 543 Non-Personal Service/Indirect Costs 23 150 134 120 150 137
Functional Total 3,117,570 3,127,390 3,129,603 3,269,146 3,406,791 3,549,186
T-131
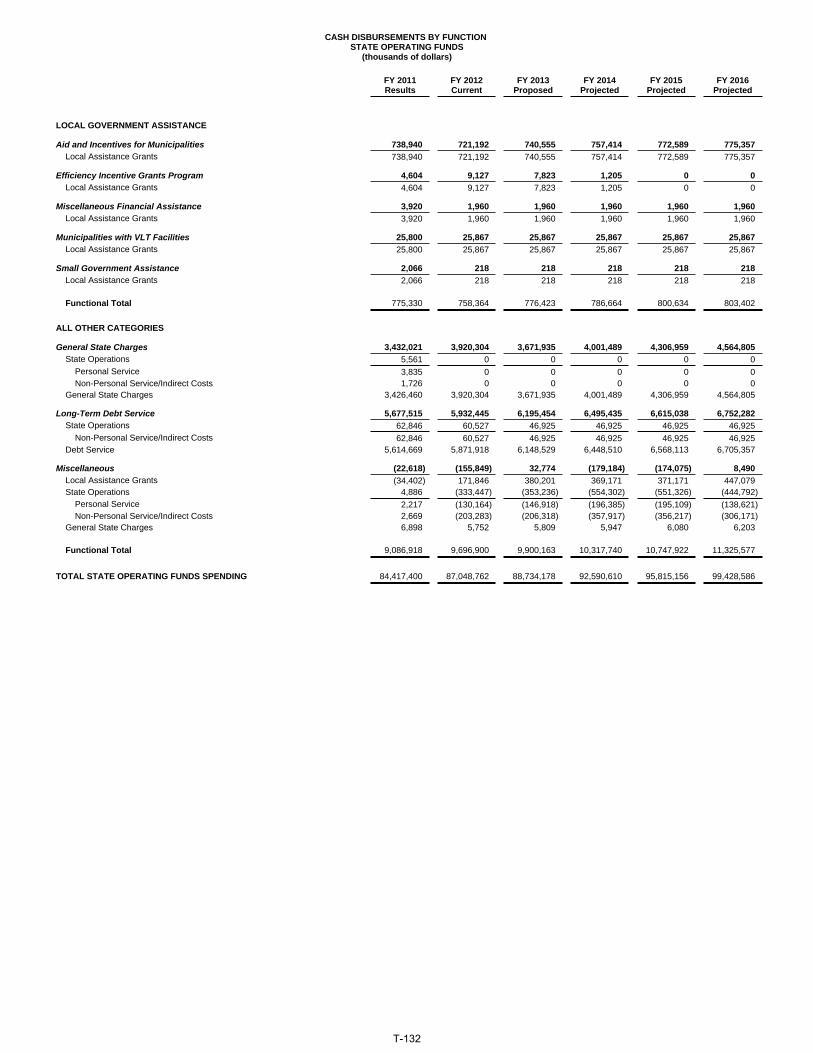
CASH DISBURSEMENTS BY FUNCTION STATE OPERATING FUNDS
(thousands of dollars)
FY 2011Results
FY 2012Current
FY 2013Proposed
FY 2014Projected
FY 2015Projected
FY 2016Projected
LOCAL GOVERNMENT ASSISTANCE
Aid and Incentives for Municipalities 738,940 721,192 740,555 757,414 772,589 775,357 Local Assistance Grants 738,940 721,192 740,555 757,414 772,589 775,357
Efficiency Incentive Grants Program 4,604 9,127 7,823 1,205 0 0 Local Assistance Grants 4,604 9,127 7,823 1,205 0 0
Miscellaneous Financial Assistance 3,920 1,960 1,960 1,960 1,960 1,960 Local Assistance Grants 3,920 1,960 1,960 1,960 1,960 1,960
Municipalities with VLT Facilities 25,800 25,867 25,867 25,867 25,867 25,867 Local Assistance Grants 25,800 25,867 25,867 25,867 25,867 25,867
Small Government Assistance 2,066 218 218 218 218 218 Local Assistance Grants 2,066 218 218 218 218 218
Functional Total 775,330 758,364 776,423 786,664 800,634 803,402
ALL OTHER CATEGORIES
General State Charges 3,432,021 3,920,304 3,671,935 4,001,489 4,306,959 4,564,805 State Operations 5,561 0 0 0 0 0 Personal Service 3,835 0 0 0 0 0 Non-Personal Service/Indirect Costs 1,726 0 0 0 0 0 General State Charges 3,426,460 3,920,304 3,671,935 4,001,489 4,306,959 4,564,805
Long-Term Debt Service 5,677,515 5,932,445 6,195,454 6,495,435 6,615,038 6,752,282 State Operations 62,846 60,527 46,925 46,925 46,925 46,925 Non-Personal Service/Indirect Costs 62,846 60,527 46,925 46,925 46,925 46,925 Debt Service 5,614,669 5,871,918 6,148,529 6,448,510 6,568,113 6,705,357
Miscellaneous (22,618) (155,849) 32,774 (179,184) (174,075) 8,490 Local Assistance Grants (34,402) 171,846 380,201 369,171 371,171 447,079 State Operations 4,886 (333,447) (353,236) (554,302) (551,326) (444,792) Personal Service 2,217 (130,164) (146,918) (196,385) (195,109) (138,621) Non-Personal Service/Indirect Costs 2,669 (203,283) (206,318) (357,917) (356,217) (306,171) General State Charges 6,898 5,752 5,809 5,947 6,080 6,203
Functional Total 9,086,918 9,696,900 9,900,163 10,317,740 10,747,922 11,325,577
TOTAL STATE OPERATING FUNDS SPENDING 84,417,400 87,048,762 88,734,178 92,590,610 95,815,156 99,428,586
T-132
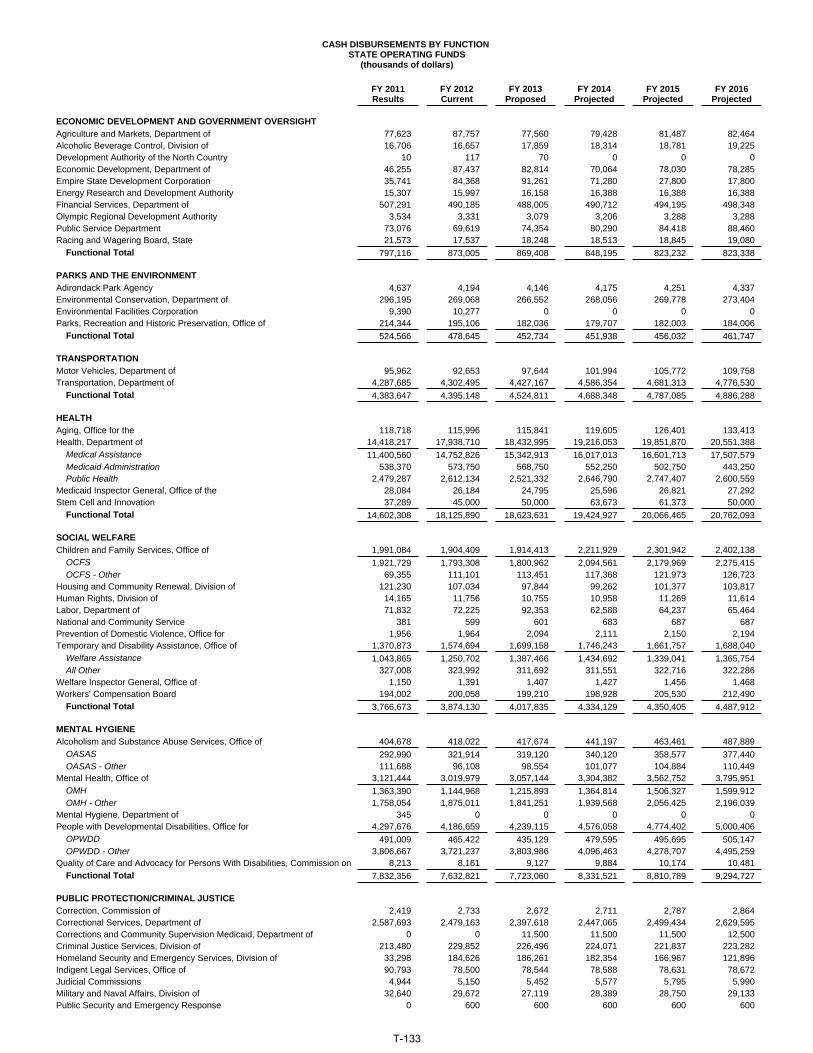
CASH DISBURSEMENTS BY FUNCTION STATE OPERATING FUNDS
(thousands of dollars)
FY 2011Results
FY 2012Current
FY 2013Proposed
FY 2014Projected
FY 2015Projected
FY 2016Projected
ECONOMIC DEVELOPMENT AND GOVERNMENT OVERSIGHTAgriculture and Markets, Department of 77,623 87,757 77,560 79,428 81,487 82,464Alcoholic Beverage Control, Division of 16,706 16,657 17,859 18,314 18,781 19,225Development Authority of the North Country 10 117 70 0 0 0Economic Development, Department of 46,255 87,437 82,814 70,064 78,030 78,285Empire State Development Corporation 35,741 84,368 91,261 71,280 27,800 17,800Energy Research and Development Authority 15,307 15,997 16,158 16,388 16,388 16,388Financial Services, Department of 507,291 490,185 488,005 490,712 494,195 498,348Olympic Regional Development Authority 3,534 3,331 3,079 3,206 3,288 3,288Public Service Department 73,076 69,619 74,354 80,290 84,418 88,460Racing and Wagering Board, State 21,573 17,537 18,248 18,513 18,845 19,080 Functional Total 797,116 873,005 869,408 848,195 823,232 823,338
PARKS AND THE ENVIRONMENTAdirondack Park Agency 4,637 4,194 4,146 4,175 4,251 4,337Environmental Conservation, Department of 296,195 269,068 266,552 268,056 269,778 273,404Environmental Facilities Corporation 9,390 10,277 0 0 0 0Parks, Recreation and Historic Preservation, Office of 214,344 195,106 182,036 179,707 182,003 184,006 Functional Total 524,566 478,645 452,734 451,938 456,032 461,747
TRANSPORTATIONMotor Vehicles, Department of 95,962 92,653 97,644 101,994 105,772 109,758Transportation, Department of 4,287,685 4,302,495 4,427,167 4,586,354 4,681,313 4,776,530 Functional Total 4,383,647 4,395,148 4,524,811 4,688,348 4,787,085 4,886,288
HEALTHAging, Office for the 118,718 115,996 115,841 119,605 126,401 133,413Health, Department of 14,418,217 17,938,710 18,432,995 19,216,053 19,851,870 20,551,388 Medical Assistance 11,400,560 14,752,826 15,342,913 16,017,013 16,601,713 17,507,579 Medicaid Administration 538,370 573,750 568,750 552,250 502,750 443,250 Public Health 2,479,287 2,612,134 2,521,332 2,646,790 2,747,407 2,600,559Medicaid Inspector General, Office of the 28,084 26,184 24,795 25,596 26,821 27,292Stem Cell and Innovation 37,289 45,000 50,000 63,673 61,373 50,000 Functional Total 14,602,308 18,125,890 18,623,631 19,424,927 20,066,465 20,762,093
SOCIAL WELFAREChildren and Family Services, Office of 1,991,084 1,904,409 1,914,413 2,211,929 2,301,942 2,402,138 OCFS 1,921,729 1,793,308 1,800,962 2,094,561 2,179,969 2,275,415 OCFS - Other 69,355 111,101 113,451 117,368 121,973 126,723Housing and Community Renewal, Division of 121,230 107,034 97,844 99,262 101,377 103,817Human Rights, Division of 14,165 11,756 10,755 10,958 11,269 11,614Labor, Department of 71,832 72,225 92,353 62,588 64,237 65,464National and Community Service 381 599 601 683 687 687Prevention of Domestic Violence, Office for 1,956 1,964 2,094 2,111 2,150 2,194Temporary and Disability Assistance, Office of 1,370,873 1,574,694 1,699,158 1,746,243 1,661,757 1,688,040 Welfare Assistance 1,043,865 1,250,702 1,387,466 1,434,692 1,339,041 1,365,754 All Other 327,008 323,992 311,692 311,551 322,716 322,286Welfare Inspector General, Office of 1,150 1,391 1,407 1,427 1,456 1,468Workers' Compensation Board 194,002 200,058 199,210 198,928 205,530 212,490 Functional Total 3,766,673 3,874,130 4,017,835 4,334,129 4,350,405 4,487,912
MENTAL HYGIENEAlcoholism and Substance Abuse Services, Office of 404,678 418,022 417,674 441,197 463,461 487,889 OASAS 292,990 321,914 319,120 340,120 358,577 377,440 OASAS - Other 111,688 96,108 98,554 101,077 104,884 110,449Mental Health, Office of 3,121,444 3,019,979 3,057,144 3,304,382 3,562,752 3,795,951 OMH 1,363,390 1,144,968 1,215,893 1,364,814 1,506,327 1,599,912 OMH - Other 1,758,054 1,875,011 1,841,251 1,939,568 2,056,425 2,196,039Mental Hygiene, Department of 345 0 0 0 0 0People with Developmental Disabilities, Office for 4,297,676 4,186,659 4,239,115 4,576,058 4,774,402 5,000,406 OPWDD 491,009 465,422 435,129 479,595 495,695 505,147 OPWDD - Other 3,806,667 3,721,237 3,803,986 4,096,463 4,278,707 4,495,259Quality of Care and Advocacy for Persons With Disabilities, Commission on 8,213 8,161 9,127 9,884 10,174 10,481 Functional Total 7,832,356 7,632,821 7,723,060 8,331,521 8,810,789 9,294,727
PUBLIC PROTECTION/CRIMINAL JUSTICECorrection, Commission of 2,419 2,733 2,672 2,711 2,787 2,864Correctional Services, Department of 2,587,693 2,479,163 2,397,618 2,447,065 2,499,434 2,629,595Corrections and Community Supervision Medicaid, Department of 0 0 11,500 11,500 11,500 12,500Criminal Justice Services, Division of 213,480 229,852 226,496 224,071 221,837 223,282Homeland Security and Emergency Services, Division of 33,298 184,626 186,261 182,354 166,967 121,896Indigent Legal Services, Office of 90,793 78,500 78,544 78,588 78,631 78,672Judicial Commissions 4,944 5,150 5,452 5,577 5,795 5,990Military and Naval Affairs, Division of 32,640 29,672 27,119 28,389 28,750 29,133Public Security and Emergency Response 0 600 600 600 600 600
T-133

CASH DISBURSEMENTS BY FUNCTION STATE OPERATING FUNDS
(thousands of dollars)
FY 2011Results
FY 2012Current
FY 2013Proposed
FY 2014Projected
FY 2015Projected
FY 2016Projected
State Police, Division of 677,826 676,962 670,849 673,519 680,091 694,075Statewide Financial System 9,070 40,638 50,201 51,525 52,826 54,164Statewide Wireless Network 28,253 0 0 0 0 0Victim Services, Office of 34,594 34,582 34,741 34,931 35,156 35,397 Functional Total 3,715,010 3,762,478 3,692,053 3,740,830 3,784,374 3,888,168
HIGHER EDUCATIONCity University of New York 1,306,312 1,345,551 1,397,809 1,457,385 1,521,706 1,591,473Higher Education - Miscellaneous 370 355 1,300 1,300 1,300 1,300Higher Education Services Corporation, New York State 889,588 1,012,153 1,035,044 1,088,021 1,103,725 1,117,935State University Construction Fund 18,915 26,172 0 0 0 0State University of New York 5,880,864 6,125,584 6,238,714 6,409,928 6,607,672 6,775,990 Functional Total 8,096,049 8,509,815 8,672,867 8,956,634 9,234,403 9,486,698
EDUCATIONArts, Council on the 45,173 36,158 36,053 36,055 36,101 36,151Education, Department of 26,717,031 24,849,251 25,371,985 26,465,982 27,521,428 28,647,437 School Aid 21,848,300 19,677,129 20,002,148 20,814,906 21,612,532 22,557,521 STAR Property Tax Relief 3,234,014 3,292,520 3,322,067 3,508,375 3,690,726 3,792,568 Special Education Categorical Programs 924,218 1,181,271 1,357,636 1,455,616 1,529,216 1,604,116 All Other 710,499 698,331 690,134 687,085 688,954 693,232 Functional Total 26,762,204 24,885,409 25,408,038 26,502,037 27,557,529 28,683,588
GENERAL GOVERNMENTBudget, Division of the 33,825 36,345 37,260 38,767 41,458 42,664Civil Service, Department of 17,896 15,323 14,904 17,311 17,775 18,179Deferred Compensation Board 681 774 796 823 858 867Elections, State Board of 6,186 7,372 7,649 5,179 35,316 5,462Employee Relations, Office of 3,000 2,760 2,688 2,710 2,786 2,869General Services, Office of 128,633 130,630 149,884 140,381 135,345 138,371Inspector General, Office of the 5,703 5,493 6,610 6,717 6,970 7,196Labor Management Committees 32,335 35,300 30,470 33,074 35,189 38,316Lottery, Division of the 162,910 173,905 164,890 169,076 173,058 173,456Public Employment Relations Board 3,988 3,884 3,731 3,857 3,804 3,896Public Integrity, Commission on 3,794 3,401 4,016 4,061 4,175 4,295Regulatory Reform, Governor's Office of 1,653 0 0 0 0 0State, Department of 75,478 67,659 64,738 60,147 62,133 63,054Tax Appeals, Division of 3,134 3,057 3,101 2,813 2,894 2,948Taxation and Finance, Department of 441,466 404,678 415,599 418,545 429,888 436,603Technology, Office for 22,902 24,544 23,780 22,091 24,691 24,303Veterans' Affairs, Division of 14,069 13,642 13,436 12,949 13,155 13,383 Functional Total 957,653 928,767 943,552 938,501 989,495 975,862
ELECTED OFFICIALSAudit and Control, Department of 171,821 174,170 173,479 175,736 179,315 183,489Executive Chamber 12,880 13,926 13,578 13,836 14,773 15,185Judiciary 2,540,268 2,546,823 2,546,998 2,679,944 2,805,004 2,934,500Law, Department of 169,761 173,046 176,139 177,667 183,089 188,749Legislature 222,536 218,795 218,795 221,349 223,945 226,583Lieutenant Governor, Office of the 304 630 614 614 665 680 Functional Total 3,117,570 3,127,390 3,129,603 3,269,146 3,406,791 3,549,186
LOCAL GOVERNMENT ASSISTANCEAid and Incentives for Municipalities 738,940 721,192 740,555 757,414 772,589 775,357Efficiency Incentive Grants Program 4,604 9,127 7,823 1,205 0 0Miscellaneous Financial Assistance 3,920 1,960 1,960 1,960 1,960 1,960Municipalities with VLT Facilities 25,800 25,867 25,867 25,867 25,867 25,867Small Government Assistance 2,066 218 218 218 218 218 Functional Total 775,330 758,364 776,423 786,664 800,634 803,402
ALL OTHER CATEGORIESGeneral State Charges 3,432,021 3,920,304 3,671,935 4,001,489 4,306,959 4,564,805Long-Term Debt Service 5,677,515 5,932,445 6,195,454 6,495,435 6,615,038 6,752,282Miscellaneous (22,618) (155,849) 32,774 (179,184) (174,075) 8,490 Functional Total 9,086,918 9,696,900 9,900,163 10,317,740 10,747,922 11,325,577
TOTAL STATE OPERATING FUNDS SPENDING 84,417,400 87,048,762 88,734,178 92,590,610 95,815,156 99,428,586
GSC: Agency disbursements include grants to local governments, state operations and general state charges, which is a departure from prior Financial plan publications. In prior reports, general state charges were excluded from agency spending totals.
T-134

CASH DISBURSEMENTS BY FUNCTION STATE OPERATING FUNDS
LOCAL ASSISTANCE GRANTS(thousands of dollars)
FY 2011Results
FY 2012Current
FY 2013Proposed
FY 2014Projected
FY 2015Projected
FY 2016Projected
ECONOMIC DEVELOPMENT AND GOVERNMENT OVERSIGHTAgriculture and Markets, Department of 15,014 26,358 23,413 23,095 23,095 23,095Development Authority of the North Country 10 117 70 0 0 0Economic Development, Department of 25,790 52,620 60,390 47,409 54,772 54,772Empire State Development Corporation 35,741 84,368 91,261 71,280 27,800 17,800Energy Research and Development Authority 9,157 9,234 9,234 9,234 9,234 9,234Financial Services, Department of 228,152 218,832 216,952 216,952 216,952 216,952Public Service Department 0 500 500 500 500 500 Functional Total 313,864 392,029 401,820 368,470 332,353 322,353
PARKS AND THE ENVIRONMENTEnvironmental Conservation, Department of 2,835 6,802 5,425 4,802 4,802 4,802Parks, Recreation and Historic Preservation, Office of 16,124 16,566 13,012 7,700 7,700 7,700 Functional Total 18,959 23,368 18,437 12,502 12,502 12,502
TRANSPORTATIONTransportation, Department of 4,253,828 4,257,399 4,398,264 4,556,412 4,650,412 4,744,612 Functional Total 4,253,828 4,257,399 4,398,264 4,556,412 4,650,412 4,744,612
HEALTHAging, Office for the 117,041 113,860 114,104 117,794 124,498 131,443Health, Department of 13,813,299 17,299,894 17,777,683 18,509,539 19,121,693 19,815,023 Medical Assistance 11,377,313 14,706,471 15,290,058 15,960,658 16,545,858 17,451,724 Medicaid Administration 538,370 573,750 568,750 552,250 502,750 443,250 Public Health 1,897,616 2,019,673 1,918,875 1,996,631 2,073,085 1,920,049 Functional Total 13,930,340 17,413,754 17,891,787 18,627,333 19,246,191 19,946,466
SOCIAL WELFAREChildren and Family Services, Office of 1,667,489 1,597,313 1,581,516 1,887,087 1,990,187 2,093,572 OCFS 1,598,134 1,486,212 1,468,065 1,769,719 1,868,214 1,966,849 OCFS - Other 69,355 111,101 113,451 117,368 121,973 126,723Housing and Community Renewal, Division of 44,018 37,967 29,951 29,951 29,951 29,951Labor, Department of 11,237 9,439 28,212 100 100 100National and Community Service 0 350 350 350 350 350Prevention of Domestic Violence, Office for 666 685 685 685 685 685Temporary and Disability Assistance, Office of 1,202,339 1,412,677 1,491,959 1,536,585 1,440,934 1,469,047 Welfare Assistance 1,043,865 1,250,702 1,387,466 1,434,692 1,339,041 1,365,754 All Other 158,474 161,975 104,493 101,893 101,893 103,293 Functional Total 2,925,749 3,058,431 3,132,673 3,454,758 3,462,207 3,593,705
MENTAL HYGIENEAlcoholism and Substance Abuse Services, Office of 295,455 314,502 316,007 336,036 352,656 369,858 OASAS 246,366 281,822 283,327 303,356 319,976 337,178 OASAS - Other 49,089 32,680 32,680 32,680 32,680 32,680Mental Health, Office of 1,106,185 1,107,341 1,099,856 1,247,311 1,381,277 1,485,554 OMH 682,773 700,999 715,261 834,300 941,444 1,013,408 OMH - Other 423,412 406,342 384,595 413,011 439,833 472,146People with Developmental Disabilities, Office for 2,175,594 2,157,890 2,159,362 2,385,813 2,495,896 2,566,714 OPWDD 497,629 465,246 434,953 479,414 495,514 504,966 OPWDD - Other 1,677,965 1,692,644 1,724,409 1,906,399 2,000,382 2,061,748Quality of Care and Advocacy for Persons With Disabilities, Commission on 623 620 620 620 620 620 Functional Total 3,577,857 3,580,353 3,575,845 3,969,780 4,230,449 4,422,746
PUBLIC PROTECTION/CRIMINAL JUSTICECorrectional Services, Department of 10,386 6,086 6,051 6,000 6,000 6,000Corrections and Community Supervision Medicaid, Department of 0 0 11,500 11,500 11,500 12,500Criminal Justice Services, Division of 150,003 159,770 156,081 152,061 152,061 152,061Homeland Security and Emergency Services, Division of 17,552 130,101 136,641 144,436 132,461 86,220Indigent Legal Services, Office of 65,769 77,000 77,000 77,000 77,000 77,000Military and Naval Affairs, Division of 3,659 745 867 850 850 850Victim Services, Office of 29,185 28,182 28,182 28,182 28,182 28,182 Functional Total 276,554 401,884 416,322 420,029 408,054 362,813
HIGHER EDUCATIONCity University of New York 1,182,813 1,202,263 1,271,312 1,329,217 1,391,978 1,460,122Higher Education Services Corporation, New York State 813,707 923,861 950,933 1,001,349 1,014,412 1,025,891State University of New York 472,818 478,855 439,315 438,537 438,537 438,537 Functional Total 2,469,338 2,604,979 2,661,560 2,769,103 2,844,927 2,924,550
EDUCATIONArts, Council on the 40,479 31,733 31,933 31,933 31,933 31,933
T-135
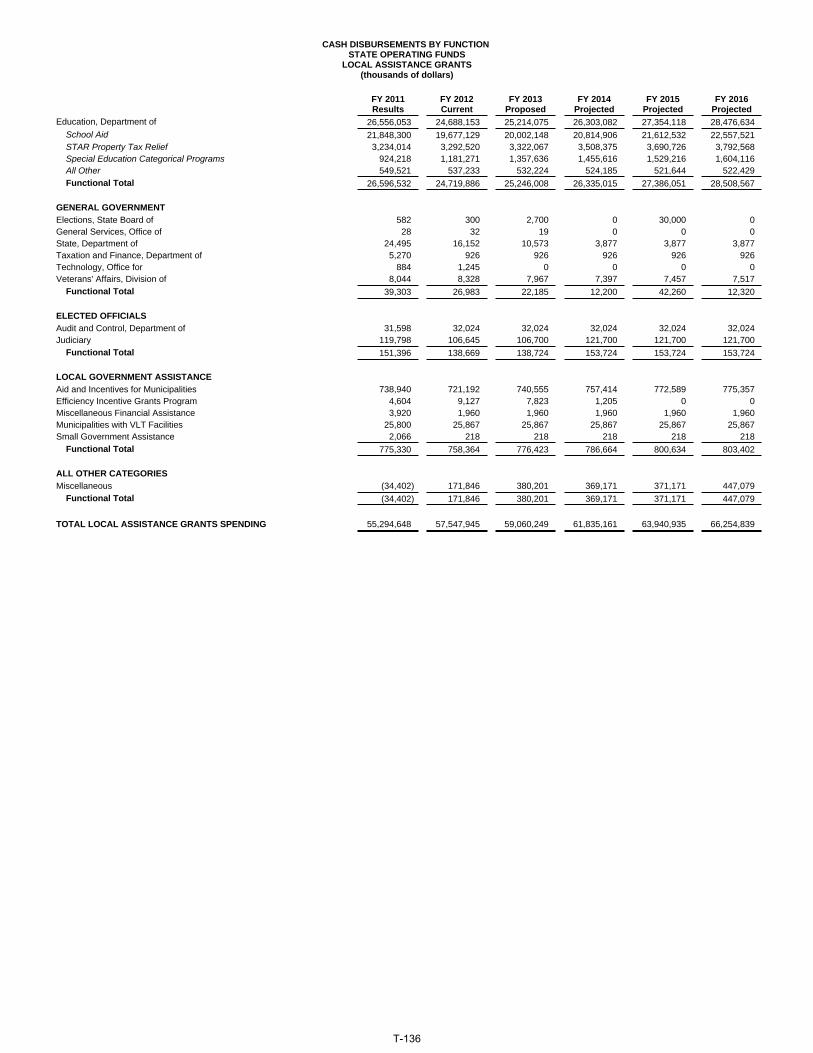
CASH DISBURSEMENTS BY FUNCTION STATE OPERATING FUNDS
LOCAL ASSISTANCE GRANTS(thousands of dollars)
FY 2011Results
FY 2012Current
FY 2013Proposed
FY 2014Projected
FY 2015Projected
FY 2016Projected
Education, Department of 26,556,053 24,688,153 25,214,075 26,303,082 27,354,118 28,476,634 School Aid 21,848,300 19,677,129 20,002,148 20,814,906 21,612,532 22,557,521 STAR Property Tax Relief 3,234,014 3,292,520 3,322,067 3,508,375 3,690,726 3,792,568 Special Education Categorical Programs 924,218 1,181,271 1,357,636 1,455,616 1,529,216 1,604,116 All Other 549,521 537,233 532,224 524,185 521,644 522,429 Functional Total 26,596,532 24,719,886 25,246,008 26,335,015 27,386,051 28,508,567
GENERAL GOVERNMENTElections, State Board of 582 300 2,700 0 30,000 0General Services, Office of 28 32 19 0 0 0State, Department of 24,495 16,152 10,573 3,877 3,877 3,877Taxation and Finance, Department of 5,270 926 926 926 926 926Technology, Office for 884 1,245 0 0 0 0Veterans' Affairs, Division of 8,044 8,328 7,967 7,397 7,457 7,517 Functional Total 39,303 26,983 22,185 12,200 42,260 12,320
ELECTED OFFICIALSAudit and Control, Department of 31,598 32,024 32,024 32,024 32,024 32,024Judiciary 119,798 106,645 106,700 121,700 121,700 121,700 Functional Total 151,396 138,669 138,724 153,724 153,724 153,724
LOCAL GOVERNMENT ASSISTANCEAid and Incentives for Municipalities 738,940 721,192 740,555 757,414 772,589 775,357Efficiency Incentive Grants Program 4,604 9,127 7,823 1,205 0 0Miscellaneous Financial Assistance 3,920 1,960 1,960 1,960 1,960 1,960Municipalities with VLT Facilities 25,800 25,867 25,867 25,867 25,867 25,867Small Government Assistance 2,066 218 218 218 218 218 Functional Total 775,330 758,364 776,423 786,664 800,634 803,402
ALL OTHER CATEGORIESMiscellaneous (34,402) 171,846 380,201 369,171 371,171 447,079 Functional Total (34,402) 171,846 380,201 369,171 371,171 447,079
TOTAL LOCAL ASSISTANCE GRANTS SPENDING 55,294,648 57,547,945 59,060,249 61,835,161 63,940,935 66,254,839
T-136
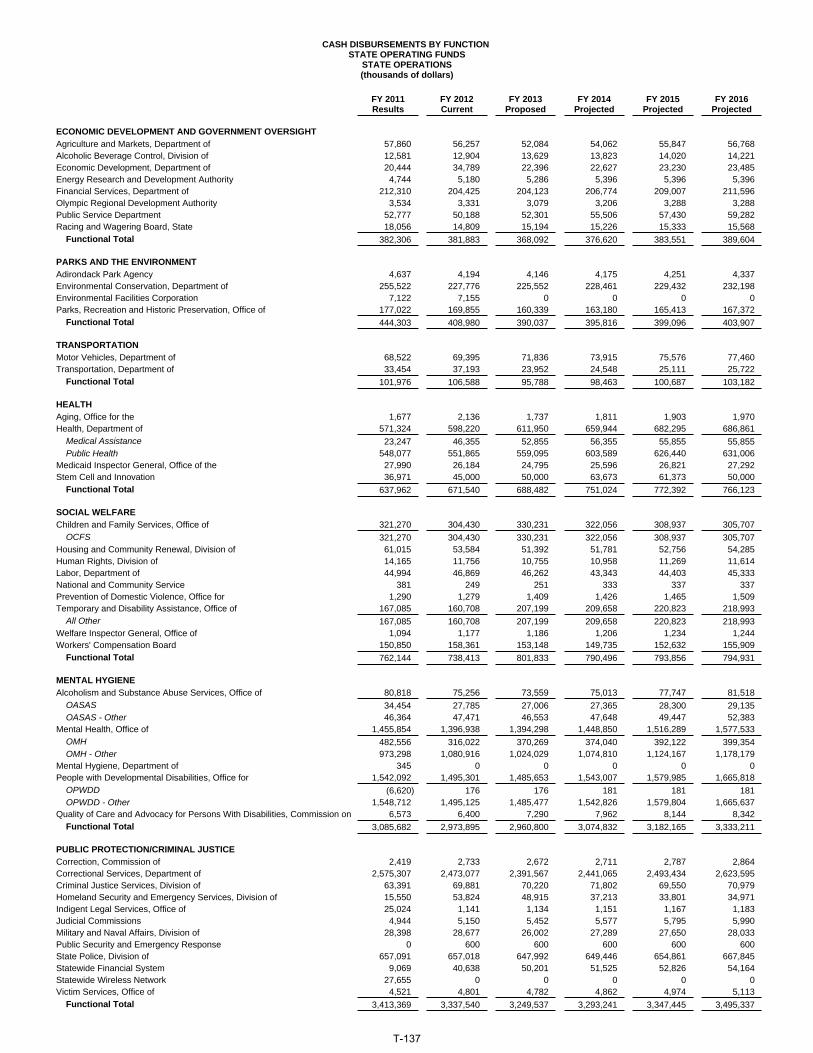
CASH DISBURSEMENTS BY FUNCTION STATE OPERATING FUNDS
STATE OPERATIONS(thousands of dollars)
FY 2011Results
FY 2012Current
FY 2013Proposed
FY 2014Projected
FY 2015Projected
FY 2016Projected
ECONOMIC DEVELOPMENT AND GOVERNMENT OVERSIGHTAgriculture and Markets, Department of 57,860 56,257 52,084 54,062 55,847 56,768Alcoholic Beverage Control, Division of 12,581 12,904 13,629 13,823 14,020 14,221Economic Development, Department of 20,444 34,789 22,396 22,627 23,230 23,485Energy Research and Development Authority 4,744 5,180 5,286 5,396 5,396 5,396Financial Services, Department of 212,310 204,425 204,123 206,774 209,007 211,596Olympic Regional Development Authority 3,534 3,331 3,079 3,206 3,288 3,288Public Service Department 52,777 50,188 52,301 55,506 57,430 59,282Racing and Wagering Board, State 18,056 14,809 15,194 15,226 15,333 15,568 Functional Total 382,306 381,883 368,092 376,620 383,551 389,604
PARKS AND THE ENVIRONMENTAdirondack Park Agency 4,637 4,194 4,146 4,175 4,251 4,337Environmental Conservation, Department of 255,522 227,776 225,552 228,461 229,432 232,198Environmental Facilities Corporation 7,122 7,155 0 0 0 0Parks, Recreation and Historic Preservation, Office of 177,022 169,855 160,339 163,180 165,413 167,372 Functional Total 444,303 408,980 390,037 395,816 399,096 403,907
TRANSPORTATIONMotor Vehicles, Department of 68,522 69,395 71,836 73,915 75,576 77,460Transportation, Department of 33,454 37,193 23,952 24,548 25,111 25,722 Functional Total 101,976 106,588 95,788 98,463 100,687 103,182
HEALTHAging, Office for the 1,677 2,136 1,737 1,811 1,903 1,970Health, Department of 571,324 598,220 611,950 659,944 682,295 686,861 Medical Assistance 23,247 46,355 52,855 56,355 55,855 55,855 Public Health 548,077 551,865 559,095 603,589 626,440 631,006Medicaid Inspector General, Office of the 27,990 26,184 24,795 25,596 26,821 27,292Stem Cell and Innovation 36,971 45,000 50,000 63,673 61,373 50,000 Functional Total 637,962 671,540 688,482 751,024 772,392 766,123
SOCIAL WELFAREChildren and Family Services, Office of 321,270 304,430 330,231 322,056 308,937 305,707 OCFS 321,270 304,430 330,231 322,056 308,937 305,707Housing and Community Renewal, Division of 61,015 53,584 51,392 51,781 52,756 54,285Human Rights, Division of 14,165 11,756 10,755 10,958 11,269 11,614Labor, Department of 44,994 46,869 46,262 43,343 44,403 45,333National and Community Service 381 249 251 333 337 337Prevention of Domestic Violence, Office for 1,290 1,279 1,409 1,426 1,465 1,509Temporary and Disability Assistance, Office of 167,085 160,708 207,199 209,658 220,823 218,993 All Other 167,085 160,708 207,199 209,658 220,823 218,993Welfare Inspector General, Office of 1,094 1,177 1,186 1,206 1,234 1,244Workers' Compensation Board 150,850 158,361 153,148 149,735 152,632 155,909 Functional Total 762,144 738,413 801,833 790,496 793,856 794,931
MENTAL HYGIENEAlcoholism and Substance Abuse Services, Office of 80,818 75,256 73,559 75,013 77,747 81,518 OASAS 34,454 27,785 27,006 27,365 28,300 29,135 OASAS - Other 46,364 47,471 46,553 47,648 49,447 52,383Mental Health, Office of 1,455,854 1,396,938 1,394,298 1,448,850 1,516,289 1,577,533 OMH 482,556 316,022 370,269 374,040 392,122 399,354 OMH - Other 973,298 1,080,916 1,024,029 1,074,810 1,124,167 1,178,179Mental Hygiene, Department of 345 0 0 0 0 0People with Developmental Disabilities, Office for 1,542,092 1,495,301 1,485,653 1,543,007 1,579,985 1,665,818 OPWDD (6,620) 176 176 181 181 181 OPWDD - Other 1,548,712 1,495,125 1,485,477 1,542,826 1,579,804 1,665,637Quality of Care and Advocacy for Persons With Disabilities, Commission on 6,573 6,400 7,290 7,962 8,144 8,342 Functional Total 3,085,682 2,973,895 2,960,800 3,074,832 3,182,165 3,333,211
PUBLIC PROTECTION/CRIMINAL JUSTICECorrection, Commission of 2,419 2,733 2,672 2,711 2,787 2,864Correctional Services, Department of 2,575,307 2,473,077 2,391,567 2,441,065 2,493,434 2,623,595Criminal Justice Services, Division of 63,391 69,881 70,220 71,802 69,550 70,979Homeland Security and Emergency Services, Division of 15,550 53,824 48,915 37,213 33,801 34,971Indigent Legal Services, Office of 25,024 1,141 1,134 1,151 1,167 1,183Judicial Commissions 4,944 5,150 5,452 5,577 5,795 5,990Military and Naval Affairs, Division of 28,398 28,677 26,002 27,289 27,650 28,033Public Security and Emergency Response 0 600 600 600 600 600State Police, Division of 657,091 657,018 647,992 649,446 654,861 667,845Statewide Financial System 9,069 40,638 50,201 51,525 52,826 54,164Statewide Wireless Network 27,655 0 0 0 0 0Victim Services, Office of 4,521 4,801 4,782 4,862 4,974 5,113 Functional Total 3,413,369 3,337,540 3,249,537 3,293,241 3,347,445 3,495,337
T-137

CASH DISBURSEMENTS BY FUNCTION STATE OPERATING FUNDS
STATE OPERATIONS(thousands of dollars)
FY 2011Results
FY 2012Current
FY 2013Proposed
FY 2014Projected
FY 2015Projected
FY 2016Projected
HIGHER EDUCATIONCity University of New York 117,099 136,747 119,812 121,335 122,895 124,518Higher Education - Miscellaneous 255 220 1,201 1,201 1,201 1,201Higher Education Services Corporation, New York State 61,052 74,876 68,980 70,309 71,976 73,821State University Construction Fund 14,438 18,579 0 0 0 0State University of New York 4,880,006 5,147,969 5,298,470 5,454,949 5,620,644 5,788,962 Functional Total 5,072,850 5,378,391 5,488,463 5,647,794 5,816,716 5,988,502
EDUCATIONArts, Council on the 4,694 4,425 4,120 4,122 4,168 4,218Education, Department of 131,572 131,312 127,577 129,941 131,823 133,609 All Other 131,572 131,312 127,577 129,941 131,823 133,609 Functional Total 136,266 135,737 131,697 134,063 135,991 137,827
GENERAL GOVERNMENTBudget, Division of the 32,081 34,266 34,963 36,117 38,584 39,570Civil Service, Department of 17,677 15,104 14,736 17,143 17,603 18,003Deferred Compensation Board 519 598 605 615 633 642Elections, State Board of 5,604 7,072 4,949 5,179 5,316 5,462Employee Relations, Office of 3,000 2,760 2,688 2,710 2,786 2,869General Services, Office of 127,315 128,454 147,964 138,379 133,201 136,087Inspector General, Office of the 5,703 5,493 6,610 6,717 6,970 7,196Labor Management Committees 32,335 35,300 30,470 33,074 35,189 38,316Lottery, Division of the 152,955 162,440 151,835 155,197 159,080 159,478Public Employment Relations Board 3,988 3,884 3,731 3,857 3,804 3,896Public Integrity, Commission on 3,794 3,401 4,016 4,061 4,175 4,295Regulatory Reform, Governor's Office of 1,653 0 0 0 0 0State, Department of 41,797 43,770 45,282 46,581 47,676 48,348Tax Appeals, Division of 3,134 3,057 3,101 2,813 2,894 2,948Taxation and Finance, Department of 412,940 384,894 393,151 394,799 405,915 412,630Technology, Office for 22,018 22,799 23,280 21,591 24,191 23,803Veterans' Affairs, Division of 6,025 5,314 5,469 5,552 5,698 5,866 Functional Total 872,538 858,606 872,850 874,385 893,715 909,409
ELECTED OFFICIALSAudit and Control, Department of 138,841 139,405 139,394 142,190 145,658 149,721Executive Chamber 12,880 13,926 13,578 13,836 14,773 15,185Judiciary 1,868,890 1,833,880 1,855,900 1,914,414 1,999,952 2,095,494Law, Department of 161,877 161,965 162,109 162,564 166,796 171,368Legislature 222,536 218,795 218,795 221,349 223,945 226,583Lieutenant Governor, Office of the 304 630 614 614 665 680 Functional Total 2,405,328 2,368,601 2,390,390 2,454,967 2,551,789 2,659,031
ALL OTHER CATEGORIESGeneral State Charges 5,561 0 0 0 0 0Long-Term Debt Service 62,846 60,527 46,925 46,925 46,925 46,925Miscellaneous 4,886 (333,447) (353,236) (554,302) (551,326) (444,792) Functional Total 73,293 (272,920) (306,311) (507,377) (504,401) (397,867)
TOTAL STATE OPERATIONS SPENDING 17,388,017 17,087,254 17,131,658 17,384,324 17,873,002 18,583,197
T-138

CASH DISBURSEMENTS BY FUNCTION STATE OPERATING FUNDS
PERSONAL SERVICE(thousands of dollars)
FY 2011Results
FY 2012Current
FY 2013Proposed
FY 2014Projected
FY 2015Projected
FY 2016Projected
ECONOMIC DEVELOPMENT AND GOVERNMENT OVERSIGHTAgriculture and Markets, Department of 31,416 28,640 28,468 29,678 30,751 31,409Alcoholic Beverage Control, Division of 8,512 7,833 8,185 8,246 8,308 8,370Economic Development, Department of 13,906 11,227 12,704 13,087 13,424 13,679Energy Research and Development Authority 2,894 3,365 3,432 3,501 3,501 3,501Financial Services, Department of 152,126 134,149 133,847 136,495 138,669 141,191Olympic Regional Development Authority 2,890 2,485 2,485 2,522 2,548 2,548Public Service Department 41,801 39,513 41,705 44,591 46,220 47,964Racing and Wagering Board, State 12,062 9,335 9,059 9,058 9,133 9,368 Functional Total 265,607 236,547 239,885 247,178 252,554 258,030
PARKS AND THE ENVIRONMENTAdirondack Park Agency 4,234 3,753 3,791 3,820 3,896 3,982Environmental Conservation, Department of 186,181 167,335 167,518 169,375 172,285 175,164Environmental Facilities Corporation 6,060 6,185 0 0 0 0Parks, Recreation and Historic Preservation, Office of 135,297 124,181 123,296 126,137 127,735 129,694 Functional Total 331,772 301,454 294,605 299,332 303,916 308,840
TRANSPORTATIONMotor Vehicles, Department of 51,578 48,547 49,937 51,560 52,689 54,020Transportation, Department of 10,853 9,820 9,706 9,957 10,199 10,469 Functional Total 62,431 58,367 59,643 61,517 62,888 64,489
HEALTHAging, Office for the 1,641 1,954 1,555 1,619 1,701 1,768Health, Department of 289,860 280,827 286,801 309,239 321,530 327,176 Medical Assistance 500 500 500 500 500 500 Public Health 289,360 280,327 286,301 308,739 321,030 326,676Medicaid Inspector General, Office of the 20,818 19,768 18,379 18,850 19,725 20,196Stem Cell and Innovation 534 0 0 0 0 0 Functional Total 312,853 302,549 306,735 329,708 342,956 349,140
SOCIAL WELFAREChildren and Family Services, Office of 192,793 178,802 189,959 175,169 164,108 162,323 OCFS 192,793 178,802 189,959 175,169 164,108 162,323Housing and Community Renewal, Division of 46,367 41,490 40,890 41,148 41,986 43,395Human Rights, Division of 12,932 10,652 9,841 9,927 10,207 10,522Labor, Department of 32,161 27,801 27,571 27,930 28,620 29,292National and Community Service 304 208 210 292 295 295Prevention of Domestic Violence, Office for 1,098 1,133 1,313 1,324 1,356 1,389Temporary and Disability Assistance, Office of 62,305 52,327 84,922 86,979 91,656 94,056 All Other 62,305 52,327 84,922 86,979 91,656 94,056Welfare Inspector General, Office of 434 701 701 721 738 748Workers' Compensation Board 89,052 87,031 89,130 90,328 92,301 94,633 Functional Total 437,446 400,145 444,537 433,818 431,267 436,653
MENTAL HYGIENEAlcoholism and Substance Abuse Services, Office of 59,596 56,126 54,868 56,344 58,560 61,815 OASAS 25,103 17,464 17,198 17,575 18,255 18,846 OASAS - Other 34,493 38,662 37,670 38,769 40,305 42,969Mental Health, Office of 1,145,258 1,102,070 1,104,515 1,135,076 1,183,479 1,242,948 OMH 405,776 252,055 290,845 291,573 310,013 316,935 OMH - Other 739,482 850,015 813,670 843,503 873,466 926,013People with Developmental Disabilities, Office for 1,168,196 1,125,656 1,122,650 1,166,568 1,192,852 1,268,545 OPWDD - Other 1,168,196 1,125,656 1,122,650 1,166,568 1,192,852 1,268,545Quality of Care and Advocacy for Persons With Disabilities, Commission on 5,430 5,247 6,070 6,681 6,834 6,999 Functional Total 2,378,480 2,289,099 2,288,103 2,364,669 2,441,725 2,580,307
PUBLIC PROTECTION/CRIMINAL JUSTICECorrection, Commission of 2,082 2,319 2,398 2,414 2,481 2,548Correctional Services, Department of 2,043,633 1,958,633 1,919,183 1,949,125 1,981,019 2,089,740Criminal Justice Services, Division of 34,806 32,672 33,419 33,864 34,703 35,666Homeland Security and Emergency Services, Division of 6,531 15,280 15,395 15,540 16,056 16,637Indigent Legal Services, Office of 8 750 794 802 810 818Judicial Commissions 3,723 3,791 4,093 4,124 4,237 4,357Military and Naval Affairs, Division of 19,260 16,722 16,679 16,821 17,034 17,265Public Security and Emergency Response 0 600 600 600 600 600State Police, Division of 582,393 564,450 568,537 568,523 572,436 580,410Statewide Financial System 3,977 9,139 10,814 10,895 10,977 11,060Statewide Wireless Network 8,076 0 0 0 0 0Victim Services, Office of 3,761 3,764 3,866 3,931 4,026 4,148 Functional Total 2,708,250 2,608,120 2,575,778 2,606,639 2,644,379 2,763,249
T-139

CASH DISBURSEMENTS BY FUNCTION STATE OPERATING FUNDS
PERSONAL SERVICE(thousands of dollars)
FY 2011Results
FY 2012Current
FY 2013Proposed
FY 2014Projected
FY 2015Projected
FY 2016Projected
HIGHER EDUCATIONCity University of New York 85,732 96,651 85,125 85,763 86,406 87,055Higher Education - Miscellaneous 221 175 198 198 198 198Higher Education Services Corporation, New York State 32,756 32,134 30,166 30,554 31,247 32,058State University Construction Fund 12,562 15,544 0 0 0 0State University of New York 3,239,364 3,251,226 3,340,878 3,437,772 3,550,082 3,664,050 Functional Total 3,370,635 3,395,730 3,456,367 3,554,287 3,667,933 3,783,361
EDUCATIONArts, Council on the 3,098 2,300 2,298 2,300 2,346 2,396Education, Department of 90,078 83,525 83,466 85,059 86,510 87,989 All Other 90,078 83,525 83,466 85,059 86,510 87,989 Functional Total 93,176 85,825 85,764 87,359 88,856 90,385
GENERAL GOVERNMENTBudget, Division of the 24,430 23,915 24,961 25,768 27,287 28,166Civil Service, Department of 16,153 13,650 13,247 15,359 15,714 16,109Deferred Compensation Board 374 390 392 396 408 417Elections, State Board of 4,205 4,104 4,144 4,254 4,370 4,495Employee Relations, Office of 2,909 2,625 2,551 2,570 2,646 2,728General Services, Office of 56,079 48,664 51,886 51,859 52,985 54,378Inspector General, Office of the 5,519 4,990 6,083 6,129 6,301 6,485Labor Management Committees 9,872 5,500 5,500 5,504 6,119 6,366Lottery, Division of the 21,057 21,738 24,864 25,029 25,495 25,893Public Employment Relations Board 3,456 3,182 3,290 3,119 3,046 3,138Public Integrity, Commission on 3,017 2,651 3,166 3,190 3,282 3,380Regulatory Reform, Governor's Office of 1,537 0 0 0 0 0State, Department of 31,270 29,124 31,340 32,307 33,039 33,700Tax Appeals, Division of 2,776 2,736 2,900 2,601 2,673 2,727Taxation and Finance, Department of 323,767 297,866 301,881 300,966 309,755 316,470Technology, Office for 11,208 10,851 13,786 13,795 14,121 14,464Veterans' Affairs, Division of 5,570 4,875 5,050 5,123 5,259 5,416 Functional Total 523,199 476,861 495,041 497,969 512,500 524,332
ELECTED OFFICIALSAudit and Control, Department of 110,320 103,442 108,671 109,385 112,012 115,214Executive Chamber 10,963 10,695 11,338 11,495 12,238 12,589Judiciary 1,525,120 1,463,935 1,468,250 1,514,284 1,561,492 1,618,742Law, Department of 111,750 107,411 110,920 110,913 113,920 117,232Legislature 174,096 165,284 165,284 166,524 167,773 169,031Lieutenant Governor, Office of the 281 480 480 494 515 543 Functional Total 1,932,530 1,851,247 1,864,943 1,913,095 1,967,950 2,033,351
ALL OTHER CATEGORIESGeneral State Charges 3,835 0 0 0 0 0Miscellaneous 2,217 (130,164) (146,918) (196,385) (195,109) (138,621) Functional Total 6,052 (130,164) (146,918) (196,385) (195,109) (138,621)
TOTAL PERSONAL SERVICE SPENDING 12,422,431 11,875,780 11,964,483 12,199,186 12,521,815 13,053,516
T-140

CASH DISBURSEMENTS BY FUNCTION STATE OPERATING FUNDS
NON-PERSONAL SERVICE/INDIRECT COSTS(thousands of dollars)
FY 2011Results
FY 2012Current
FY 2013Proposed
FY 2014Projected
FY 2015Projected
FY 2016Projected
ECONOMIC DEVELOPMENT AND GOVERNMENT OVERSIGHTAgriculture and Markets, Department of 26,444 27,617 23,616 24,384 25,096 25,359Alcoholic Beverage Control, Division of 4,069 5,071 5,444 5,577 5,712 5,851Economic Development, Department of 6,538 23,562 9,692 9,540 9,806 9,806Energy Research and Development Authority 1,850 1,815 1,854 1,895 1,895 1,895Financial Services, Department of 60,184 70,276 70,276 70,279 70,338 70,405Olympic Regional Development Authority 644 846 594 684 740 740Public Service Department 10,976 10,675 10,596 10,915 11,210 11,318Racing and Wagering Board, State 5,994 5,474 6,135 6,168 6,200 6,200 Functional Total 116,699 145,336 128,207 129,442 130,997 131,574
PARKS AND THE ENVIRONMENTAdirondack Park Agency 403 441 355 355 355 355Environmental Conservation, Department of 69,341 60,441 58,034 59,086 57,147 57,034Environmental Facilities Corporation 1,062 970 0 0 0 0Parks, Recreation and Historic Preservation, Office of 41,725 45,674 37,043 37,043 37,678 37,678 Functional Total 112,531 107,526 95,432 96,484 95,180 95,067
TRANSPORTATIONMotor Vehicles, Department of 16,944 20,848 21,899 22,355 22,887 23,440Transportation, Department of 22,601 27,373 14,246 14,591 14,912 15,253 Functional Total 39,545 48,221 36,145 36,946 37,799 38,693
HEALTHAging, Office for the 36 182 182 192 202 202Health, Department of 281,464 317,393 325,149 350,705 360,765 359,685 Medical Assistance 22,747 45,855 52,355 55,855 55,355 55,355 Public Health 258,717 271,538 272,794 294,850 305,410 304,330Medicaid Inspector General, Office of the 7,172 6,416 6,416 6,746 7,096 7,096Stem Cell and Innovation 36,437 45,000 50,000 63,673 61,373 50,000 Functional Total 325,109 368,991 381,747 421,316 429,436 416,983
SOCIAL WELFAREChildren and Family Services, Office of 128,477 125,628 140,272 146,887 144,829 143,384 OCFS 128,477 125,628 140,272 146,887 144,829 143,384Housing and Community Renewal, Division of 14,648 12,094 10,502 10,633 10,770 10,890Human Rights, Division of 1,233 1,104 914 1,031 1,062 1,092Labor, Department of 12,833 19,068 18,691 15,413 15,783 16,041National and Community Service 77 41 41 41 42 42Prevention of Domestic Violence, Office for 192 146 96 102 109 120Temporary and Disability Assistance, Office of 104,780 108,381 122,277 122,679 129,167 124,937 All Other 104,780 108,381 122,277 122,679 129,167 124,937Welfare Inspector General, Office of 660 476 485 485 496 496Workers' Compensation Board 61,798 71,330 64,018 59,407 60,331 61,276 Functional Total 324,698 338,268 357,296 356,678 362,589 358,278
MENTAL HYGIENEAlcoholism and Substance Abuse Services, Office of 21,222 19,130 18,691 18,669 19,187 19,703 OASAS 9,351 10,321 9,808 9,790 10,045 10,289 OASAS - Other 11,871 8,809 8,883 8,879 9,142 9,414Mental Health, Office of 310,596 294,868 289,783 313,774 332,810 334,585 OMH 76,780 63,967 79,424 82,467 82,109 82,419 OMH - Other 233,816 230,901 210,359 231,307 250,701 252,166Mental Hygiene, Department of 345 0 0 0 0 0People with Developmental Disabilities, Office for 373,896 369,645 363,003 376,439 387,133 397,273 OPWDD (6,620) 176 176 181 181 181 OPWDD - Other 380,516 369,469 362,827 376,258 386,952 397,092Quality of Care and Advocacy for Persons With Disabilities, Commission on 1,143 1,153 1,220 1,281 1,310 1,343 Functional Total 707,202 684,796 672,697 710,163 740,440 752,904
PUBLIC PROTECTION/CRIMINAL JUSTICECorrection, Commission of 337 414 274 297 306 316Correctional Services, Department of 531,674 514,444 472,384 491,940 512,415 533,855Criminal Justice Services, Division of 28,585 37,209 36,801 37,938 34,847 35,313Homeland Security and Emergency Services, Division of 9,019 38,544 33,520 21,673 17,745 18,334Indigent Legal Services, Office of 25,016 391 340 349 357 365Judicial Commissions 1,221 1,359 1,359 1,453 1,558 1,633Military and Naval Affairs, Division of 9,138 11,955 9,323 10,468 10,616 10,768State Police, Division of 74,698 92,568 79,455 80,923 82,425 87,435Statewide Financial System 5,092 31,499 39,387 40,630 41,849 43,104Statewide Wireless Network 19,579 0 0 0 0 0Victim Services, Office of 760 1,037 916 931 948 965 Functional Total 705,119 729,420 673,759 686,602 703,066 732,088
T-141

CASH DISBURSEMENTS BY FUNCTION STATE OPERATING FUNDS
NON-PERSONAL SERVICE/INDIRECT COSTS(thousands of dollars)
FY 2011Results
FY 2012Current
FY 2013Proposed
FY 2014Projected
FY 2015Projected
FY 2016Projected
HIGHER EDUCATIONCity University of New York 31,367 40,096 34,687 35,572 36,489 37,463Higher Education - Miscellaneous 34 45 1,003 1,003 1,003 1,003Higher Education Services Corporation, New York State 28,296 42,742 38,814 39,755 40,729 41,763State University Construction Fund 1,876 3,035 0 0 0 0State University of New York 1,640,642 1,896,743 1,957,592 2,017,177 2,070,562 2,124,912 Functional Total 1,702,215 1,982,661 2,032,096 2,093,507 2,148,783 2,205,141
EDUCATIONArts, Council on the 1,596 2,125 1,822 1,822 1,822 1,822Education, Department of 41,494 47,787 44,111 44,882 45,313 45,620 All Other 41,494 47,787 44,111 44,882 45,313 45,620 Functional Total 43,090 49,912 45,933 46,704 47,135 47,442
GENERAL GOVERNMENTBudget, Division of the 7,651 10,351 10,002 10,349 11,297 11,404Civil Service, Department of 1,524 1,454 1,489 1,784 1,889 1,894Deferred Compensation Board 145 208 213 219 225 225Elections, State Board of 1,399 2,968 805 925 946 967Employee Relations, Office of 91 135 137 140 140 141General Services, Office of 71,236 79,790 96,078 86,520 80,216 81,709Inspector General, Office of the 184 503 527 588 669 711Labor Management Committees 22,463 29,800 24,970 27,570 29,070 31,950Lottery, Division of the 131,898 140,702 126,971 130,168 133,585 133,585Public Employment Relations Board 532 702 441 738 758 758Public Integrity, Commission on 777 750 850 871 893 915Regulatory Reform, Governor's Office of 116 0 0 0 0 0State, Department of 10,527 14,646 13,942 14,274 14,637 14,648Tax Appeals, Division of 358 321 201 212 221 221Taxation and Finance, Department of 89,173 87,028 91,270 93,833 96,160 96,160Technology, Office for 10,810 11,948 9,494 7,796 10,070 9,339Veterans' Affairs, Division of 455 439 419 429 439 450 Functional Total 349,339 381,745 377,809 376,416 381,215 385,077
ELECTED OFFICIALSAudit and Control, Department of 28,521 35,963 30,723 32,805 33,646 34,507Executive Chamber 1,917 3,231 2,240 2,341 2,535 2,596Judiciary 343,770 369,945 387,650 400,130 438,460 476,752Law, Department of 50,127 54,554 51,189 51,651 52,876 54,136Legislature 48,440 53,511 53,511 54,825 56,172 57,552Lieutenant Governor, Office of the 23 150 134 120 150 137 Functional Total 472,798 517,354 525,447 541,872 583,839 625,680
ALL OTHER CATEGORIESGeneral State Charges 1,726 0 0 0 0 0Long-Term Debt Service 62,846 60,527 46,925 46,925 46,925 46,925Miscellaneous 2,669 (203,283) (206,318) (357,917) (356,217) (306,171) Functional Total 67,241 (142,756) (159,393) (310,992) (309,292) (259,246)
TOTAL NON-PERSONAL SERVICE/INDIRECT COSTS SPENDING 4,965,586 5,211,474 5,167,175 5,185,138 5,351,187 5,529,681
T-142

CASH DISBURSEMENTS BY FUNCTION STATE OPERATING FUNDSGENERAL STATE CHARGES
(thousands of dollars)
FY 2011Results
FY 2012Current
FY 2013Proposed
FY 2014Projected
FY 2015Projected
FY 2016Projected
ECONOMIC DEVELOPMENT AND GOVERNMENT OVERSIGHTAgriculture and Markets, Department of 4,749 5,142 2,063 2,271 2,545 2,601Alcoholic Beverage Control, Division of 4,125 3,753 4,230 4,491 4,761 5,004Economic Development, Department of 21 28 28 28 28 28Energy Research and Development Authority 1,406 1,583 1,638 1,758 1,758 1,758Financial Services, Department of 66,829 66,928 66,930 66,986 68,236 69,800Public Service Department 20,299 18,931 21,553 24,284 26,488 28,678Racing and Wagering Board, State 3,517 2,728 3,054 3,287 3,512 3,512 Functional Total 100,946 99,093 99,496 103,105 107,328 111,381
PARKS AND THE ENVIRONMENTEnvironmental Conservation, Department of 37,838 34,490 35,575 34,793 35,544 36,404Environmental Facilities Corporation 2,268 3,122 0 0 0 0Parks, Recreation and Historic Preservation, Office of 2,627 3,685 3,685 3,827 3,890 3,934 Functional Total 42,733 41,297 39,260 38,620 39,434 40,338
TRANSPORTATIONMotor Vehicles, Department of 27,440 23,258 25,808 28,079 30,196 32,298Transportation, Department of 403 7,903 4,951 5,394 5,790 6,196 Functional Total 27,843 31,161 30,759 33,473 35,986 38,494
HEALTHHealth, Department of 33,594 40,596 43,362 46,570 47,882 49,504 Public Health 33,594 40,596 43,362 46,570 47,882 49,504Medicaid Inspector General, Office of the 94 0 0 0 0 0Stem Cell and Innovation 318 0 0 0 0 0 Functional Total 34,006 40,596 43,362 46,570 47,882 49,504
SOCIAL WELFAREChildren and Family Services, Office of 2,325 2,666 2,666 2,786 2,818 2,859 OCFS 2,325 2,666 2,666 2,786 2,818 2,859Housing and Community Renewal, Division of 16,197 15,483 16,501 17,530 18,670 19,581Labor, Department of 15,601 15,917 17,879 19,145 19,734 20,031Temporary and Disability Assistance, Office of 1,449 1,309 0 0 0 0 All Other 1,449 1,309 0 0 0 0Welfare Inspector General, Office of 56 214 221 221 222 224Workers' Compensation Board 43,152 41,697 46,062 49,193 52,898 56,581 Functional Total 78,780 77,286 83,329 88,875 94,342 99,276
MENTAL HYGIENEAlcoholism and Substance Abuse Services, Office of 28,405 28,264 28,108 30,148 33,058 36,513 OASAS 12,170 12,307 8,787 9,399 10,301 11,127 OASAS - Other 16,235 15,957 19,321 20,749 22,757 25,386Mental Health, Office of 559,405 515,700 562,990 608,221 665,186 732,864 OMH 198,061 127,947 130,363 156,474 172,761 187,150 OMH - Other 361,344 387,753 432,627 451,747 492,425 545,714People with Developmental Disabilities, Office for 579,990 533,468 594,100 647,238 698,521 767,874 OPWDD - Other 579,990 533,468 594,100 647,238 698,521 767,874Quality of Care and Advocacy for Persons With Disabilities, Commission on 1,017 1,141 1,217 1,302 1,410 1,519 Functional Total 1,168,817 1,078,573 1,186,415 1,286,909 1,398,175 1,538,770
PUBLIC PROTECTION/CRIMINAL JUSTICECorrectional Services, Department of 2,000 0 0 0 0 0Criminal Justice Services, Division of 86 201 195 208 226 242Homeland Security and Emergency Services, Division of 196 701 705 705 705 705Indigent Legal Services, Office of 0 359 410 437 464 489Military and Naval Affairs, Division of 583 250 250 250 250 250State Police, Division of 20,735 19,944 22,857 24,073 25,230 26,230Statewide Financial System 1 0 0 0 0 0Statewide Wireless Network 598 0 0 0 0 0Victim Services, Office of 888 1,599 1,777 1,887 2,000 2,102 Functional Total 25,087 23,054 26,194 27,560 28,875 30,018
HIGHER EDUCATIONCity University of New York 6,400 6,541 6,685 6,833 6,833 6,833Higher Education - Miscellaneous 115 135 99 99 99 99Higher Education Services Corporation, New York State 14,829 13,416 15,131 16,363 17,337 18,223State University Construction Fund 4,477 7,593 0 0 0 0State University of New York 528,040 498,760 500,929 516,442 548,491 548,491 Functional Total 553,861 526,445 522,844 539,737 572,760 573,646
T-143

CASH DISBURSEMENTS BY FUNCTION STATE OPERATING FUNDSGENERAL STATE CHARGES
(thousands of dollars)
FY 2011Results
FY 2012Current
FY 2013Proposed
FY 2014Projected
FY 2015Projected
FY 2016Projected
EDUCATIONEducation, Department of 29,406 29,786 30,333 32,959 35,487 37,194 All Other 29,406 29,786 30,333 32,959 35,487 37,194 Functional Total 29,406 29,786 30,333 32,959 35,487 37,194
GENERAL GOVERNMENTBudget, Division of the 1,744 2,079 2,297 2,650 2,874 3,094Civil Service, Department of 219 219 168 168 172 176Deferred Compensation Board 162 176 191 208 225 225General Services, Office of 1,290 2,144 1,901 2,002 2,144 2,284Lottery, Division of the 9,955 11,465 13,055 13,879 13,978 13,978State, Department of 9,186 7,752 8,898 9,704 10,595 10,844Taxation and Finance, Department of 23,256 18,858 21,522 22,820 23,047 23,047Technology, Office for 0 500 500 500 500 500 Functional Total 45,812 43,193 48,532 51,931 53,535 54,148
ELECTED OFFICIALSAudit and Control, Department of 1,382 2,741 2,061 1,522 1,633 1,744Judiciary 551,580 606,298 584,398 643,830 683,352 717,306Law, Department of 7,884 11,081 14,030 15,103 16,293 17,381 Functional Total 560,846 620,120 600,489 660,455 701,278 736,431
ALL OTHER CATEGORIESGeneral State Charges 3,426,460 3,920,304 3,671,935 4,001,489 4,306,959 4,564,805Miscellaneous 6,898 5,752 5,809 5,947 6,080 6,203 Functional Total 3,433,358 3,926,056 3,677,744 4,007,436 4,313,039 4,571,008
TOTAL GENERAL STATE CHARGES SPENDING 6,101,495 6,536,660 6,388,757 6,917,630 7,428,121 7,880,208
T-144

CASH DISBURSEMENTS BY FUNCTION STATE OPERATING FUNDS
CAPITAL PROJECTS(thousands of dollars)
FY 2011Results
FY 2012Current
FY 2013Proposed
FY 2014Projected
FY 2015Projected
FY 2016Projected
PARKS AND THE ENVIRONMENTParks, Recreation and Historic Preservation, Office of 18,571 5,000 5,000 5,000 5,000 5,000 Functional Total 18,571 5,000 5,000 5,000 5,000 5,000
GENERAL GOVERNMENTState, Department of 0 (15) (15) (15) (15) (15) Functional Total 0 (15) (15) (15) (15) (15)
TOTAL CAPITAL PROJECTS SPENDING 18,571 4,985 4,985 4,985 4,985 4,985
T-145

CASH DISBURSEMENTS BY FUNCTION CAPITAL PROJECTS FUNDS
(thousands of dollars)
FY 2011Results
FY 2012Current
FY 2013Proposed
FY 2014Projected
FY 2015Projected
FY 2016Projected
ECONOMIC DEVELOPMENT AND GOVERNMENT OVERSIGHTAgriculture and Markets, Department of 5,205 19,214 14,506 9,277 7,330 3,500Economic Development Capital 30,190 19,600 12,500 12,500 5,000 5,000Economic Development, Department of 57,695 46,174 29,381 32,645 19,859 15,000Empire State Development Corporation 895,913 814,971 417,065 567,602 607,103 439,492Energy Research and Development Authority 16,403 13,600 13,200 14,790 14,790 14,790Regional Economic Development Program 5,248 5,900 2,500 2,500 1,500 1,500Strategic Investment Program 3,561 4,000 5,000 5,000 5,000 5,000 Functional Total 1,014,215 923,459 494,152 644,314 660,582 484,282
PARKS AND THE ENVIRONMENTEnvironmental Conservation, Department of 671,782 722,126 556,892 507,631 480,559 446,102Environmental Facilities Corporation 356 343 0 0 0 0Hudson River Park Trust 15,216 6,400 3,816 0 0 0Parks, Recreation and Historic Preservation, Office of 40,592 38,798 90,341 63,627 50,940 37,228 Functional Total 727,946 767,667 651,049 571,258 531,499 483,330
TRANSPORTATIONMetropolitan Transportation Authority 216,912 194,500 333,600 183,600 183,600 328,571Motor Vehicles, Department of 204,814 184,707 186,693 194,948 202,058 209,772Thruway Authority, New York State 1,478 1,800 1,800 1,800 1,800 1,800Transportation, Department of 3,680,311 3,430,815 3,649,270 3,748,659 3,509,494 3,127,206 Functional Total 4,103,515 3,811,822 4,171,363 4,129,007 3,896,952 3,667,349
HEALTHHealth, Department of 286,445 503,058 437,223 338,796 88,907 88,333 Public Health 286,445 503,058 437,223 338,796 88,907 88,333 Functional Total 286,445 503,058 437,223 338,796 88,907 88,333
SOCIAL WELFAREChildren and Family Services, Office of 21,023 20,900 20,900 20,900 20,914 20,931 OCFS 21,023 20,900 20,900 20,900 20,914 20,931Housing and Community Renewal, Division of 96,570 83,635 83,635 83,577 85,229 90,231Temporary and Disability Assistance, Office of 45,000 45,000 40,000 30,000 30,000 30,000 All Other 45,000 45,000 40,000 30,000 30,000 30,000 Functional Total 162,593 149,535 144,535 134,477 136,143 141,162
MENTAL HYGIENEAlcoholism and Substance Abuse Services, Office of 43,218 56,757 57,819 57,819 126,773 126,773 OASAS 43,218 56,757 57,819 57,819 126,773 126,773Mental Health, Office of 129,125 134,090 134,090 142,109 217,191 217,294 OMH 129,125 134,090 134,090 142,109 217,191 217,294People with Developmental Disabilities, Office for 24,369 42,079 49,099 43,099 43,099 43,099 OPWDD 24,369 42,079 49,099 43,099 43,099 43,099 Functional Total 196,712 232,926 241,008 243,027 387,063 387,166
PUBLIC PROTECTION/CRIMINAL JUSTICECorrectional Services, Department of 216,232 244,250 253,265 259,677 265,710 271,860Homeland Security and Emergency Services, Division of 2,416 17,000 8,000 6,000 7,000 0Military and Naval Affairs, Division of 23,746 22,652 27,041 26,996 43,507 41,607Public Security and Emergency Response 535 0 0 0 0 0State Police, Division of 14,597 35,827 43,400 17,874 11,065 11,065 Functional Total 257,526 319,729 331,706 310,547 327,282 324,532
HIGHER EDUCATIONCity University of New York 9,601 34,705 52,127 53,066 44,725 39,958Higher Education Facilities Capital Matching Grants Program 33,834 45,100 29,492 0 0 0State University of New York 852,555 1,031,825 1,094,337 1,073,679 1,198,663 1,122,584 Functional Total 895,990 1,111,630 1,175,956 1,126,745 1,243,388 1,162,542
EDUCATIONEducation, Department of 13,398 29,743 43,404 43,884 32,400 37,400 All Other 13,398 29,743 43,404 43,884 32,400 37,400 Functional Total 13,398 29,743 43,404 43,884 32,400 37,400
GENERAL GOVERNMENTGeneral Services, Office of 61,188 78,847 62,613 59,309 69,883 69,883State, Department of 1,373 4,904 0 0 0 0Technology, Office for 4,085 1,016 0 0 0 0 Functional Total 66,646 84,767 62,613 59,309 69,883 69,883
T-146

CASH DISBURSEMENTS BY FUNCTION CAPITAL PROJECTS FUNDS
(thousands of dollars)
FY 2011Results
FY 2012Current
FY 2013Proposed
FY 2014Projected
FY 2015Projected
FY 2016Projected
ELECTED OFFICIALSJudiciary 9,640 3,835 0 0 0 0 Functional Total 9,640 3,835 0 0 0 0
ALL OTHER CATEGORIESMiscellaneous 109,953 140,000 91,000 90,000 80,000 40,000 Functional Total 109,953 140,000 91,000 90,000 80,000 40,000
TOTAL CAPITAL PROJECTS FUNDS SPENDING 7,844,579 8,078,171 7,844,009 7,691,364 7,454,099 6,885,979
T-147

CASH DISBURSEMENTS BY FUNCTION ALL GOVERNMENTAL FUNDS
(thousands of dollars)
FY 2011Results
FY 2012Current
FY 2013Proposed
FY 2014Projected
FY 2015Projected
FY 2016Projected
ECONOMIC DEVELOPMENT AND GOVERNMENT OVERSIGHT
Agriculture and Markets, Department of 96,013 119,592 104,951 101,743 102,260 99,429 Local Assistance Grants 15,014 26,358 23,413 23,095 23,095 23,095 State Operations 70,045 67,949 63,821 65,844 67,914 68,849 Personal Service 33,711 30,795 30,666 31,920 33,049 33,720 Non-Personal Service/Indirect Costs 36,334 37,154 33,155 33,924 34,865 35,129 General State Charges 5,749 6,071 3,211 3,527 3,921 3,985 Capital Projects 5,205 19,214 14,506 9,277 7,330 3,500
Alcoholic Beverage Control, Division of 16,706 16,657 17,859 18,314 18,781 19,225 State Operations 12,581 12,904 13,629 13,823 14,020 14,221 Personal Service 8,512 7,833 8,185 8,246 8,308 8,370 Non-Personal Service/Indirect Costs 4,069 5,071 5,444 5,577 5,712 5,851 General State Charges 4,125 3,753 4,230 4,491 4,761 5,004
Development Authority of the North Country 10 117 70 0 0 0 Local Assistance Grants 10 117 70 0 0 0
Economic Development Capital 30,190 19,600 12,500 12,500 5,000 5,000 Local Assistance Grants 30,617 0 0 0 0 0 Capital Projects (427) 19,600 12,500 12,500 5,000 5,000
Economic Development, Department of 103,950 158,222 136,806 127,874 98,234 93,630 Local Assistance Grants 75,494 76,986 84,756 72,329 54,872 54,872 State Operations 20,444 35,034 22,641 22,872 23,475 23,730 Personal Service 13,906 11,227 12,704 13,087 13,424 13,679 Non-Personal Service/Indirect Costs 6,538 23,807 9,937 9,785 10,051 10,051 General State Charges 21 28 28 28 28 28 Capital Projects 7,991 46,174 29,381 32,645 19,859 15,000
Empire State Development Corporation 931,654 899,339 508,326 638,882 634,903 457,292 Local Assistance Grants 926,844 752,868 430,761 526,280 499,900 371,460 Capital Projects 4,810 146,471 77,565 112,602 135,003 85,832
Energy Research and Development Authority 31,710 29,597 29,358 31,178 31,178 31,178 Local Assistance Grants 9,157 9,234 9,234 9,234 9,234 9,234 State Operations 4,744 5,180 5,286 5,396 5,396 5,396 Personal Service 2,894 3,365 3,432 3,501 3,501 3,501 Non-Personal Service/Indirect Costs 1,850 1,815 1,854 1,895 1,895 1,895 General State Charges 1,406 1,583 1,638 1,758 1,758 1,758 Capital Projects 16,403 13,600 13,200 14,790 14,790 14,790
Financial Services, Department of 507,393 490,185 488,005 490,712 494,195 498,348 Local Assistance Grants 228,152 218,832 216,952 216,952 216,952 216,952 State Operations 212,412 204,425 204,123 206,774 209,007 211,596 Personal Service 152,126 134,149 133,847 136,495 138,669 141,191 Non-Personal Service/Indirect Costs 60,286 70,276 70,276 70,279 70,338 70,405 General State Charges 66,829 66,928 66,930 66,986 68,236 69,800
Olympic Regional Development Authority 3,534 3,331 3,079 3,206 3,288 3,288 State Operations 3,534 3,331 3,079 3,206 3,288 3,288 Personal Service 2,890 2,485 2,485 2,522 2,548 2,548 Non-Personal Service/Indirect Costs 644 846 594 684 740 740
Public Service Department 75,288 72,008 77,031 82,744 86,953 91,042 Local Assistance Grants 0 500 500 500 500 500 State Operations 54,403 51,930 54,176 57,200 59,151 61,032 Personal Service 43,289 40,939 43,266 46,003 47,658 49,431 Non-Personal Service/Indirect Costs 11,114 10,991 10,910 11,197 11,493 11,601 General State Charges 20,885 19,578 22,355 25,044 27,302 29,510
Racing and Wagering Board, State 21,573 17,537 18,248 18,513 18,845 19,080 State Operations 18,056 14,809 15,194 15,226 15,333 15,568 Personal Service 12,062 9,335 9,059 9,058 9,133 9,368 Non-Personal Service/Indirect Costs 5,994 5,474 6,135 6,168 6,200 6,200 General State Charges 3,517 2,728 3,054 3,287 3,512 3,512
Regional Economic Development Program 5,248 5,900 2,500 2,500 1,500 1,500 Local Assistance Grants 5,248 0 0 0 0 0 Capital Projects 0 5,900 2,500 2,500 1,500 1,500
Strategic Investment Program 3,561 4,000 5,000 5,000 5,000 5,000 Capital Projects 3,561 4,000 5,000 5,000 5,000 5,000
Functional Total 1,826,830 1,836,085 1,403,733 1,533,166 1,500,137 1,324,012
PARKS AND THE ENVIRONMENT
Adirondack Park Agency 4,718 4,544 4,496 4,525 4,601 4,687 State Operations 4,718 4,544 4,496 4,525 4,601 4,687
T-148

CASH DISBURSEMENTS BY FUNCTION ALL GOVERNMENTAL FUNDS
(thousands of dollars)
FY 2011Results
FY 2012Current
FY 2013Proposed
FY 2014Projected
FY 2015Projected
FY 2016Projected
Personal Service 4,234 3,753 3,791 3,820 3,896 3,982 Non-Personal Service/Indirect Costs 484 791 705 705 705 705
Environmental Conservation, Department of 1,024,255 1,040,630 872,880 825,278 800,609 770,490 Local Assistance Grants 369,290 351,802 188,875 149,802 149,802 149,802 State Operations 302,256 267,401 265,177 268,187 269,598 272,808 Personal Service 210,874 191,404 191,587 193,545 196,895 200,218 Non-Personal Service/Indirect Costs 91,382 75,997 73,590 74,642 72,703 72,590 General State Charges 47,382 44,301 45,386 44,658 45,650 46,778 Capital Projects 305,327 377,126 373,442 362,631 335,559 301,102
Environmental Facilities Corporation 9,746 10,620 0 0 0 0 State Operations 7,122 7,155 0 0 0 0 Personal Service 6,060 6,185 0 0 0 0 Non-Personal Service/Indirect Costs 1,062 970 0 0 0 0 General State Charges 2,268 3,122 0 0 0 0 Capital Projects 356 343 0 0 0 0
Hudson River Park Trust 15,216 6,400 3,816 0 0 0 Capital Projects 15,216 6,400 3,816 0 0 0
Parks, Recreation and Historic Preservation, Office of 260,277 237,777 276,250 247,215 236,981 225,297 Local Assistance Grants 18,960 17,836 14,282 8,970 8,970 8,970 State Operations 180,237 171,950 162,434 165,280 167,560 169,535 Personal Service 136,484 125,191 124,306 127,152 128,772 130,747 Non-Personal Service/Indirect Costs 43,753 46,759 38,128 38,128 38,788 38,788 General State Charges 2,719 4,193 4,193 4,338 4,511 4,564 Capital Projects 58,361 43,798 95,341 68,627 55,940 42,228
Functional Total 1,314,212 1,299,971 1,157,442 1,077,018 1,042,191 1,000,474
TRANSPORTATION
Metropolitan Transportation Authority 216,912 194,500 333,600 183,600 183,600 328,571 Local Assistance Grants 216,912 194,500 183,600 183,600 183,600 18,571 Capital Projects 0 0 150,000 0 0 310,000
Motor Vehicles, Department of 320,322 299,400 303,560 316,288 327,324 339,175 Local Assistance Grants 15,734 17,800 14,800 14,800 14,800 14,800 State Operations 71,816 73,114 75,636 77,782 79,538 81,521 Personal Service 52,897 49,750 51,180 52,820 53,981 55,348 Non-Personal Service/Indirect Costs 18,919 23,364 24,456 24,962 25,557 26,173 General State Charges 27,958 23,779 26,431 28,758 30,928 33,082 Capital Projects 204,814 184,707 186,693 194,948 202,058 209,772
Thruway Authority, New York State 1,478 1,800 1,800 1,800 1,800 1,800 Local Assistance Grants 1,478 0 0 0 0 0 Capital Projects 0 1,800 1,800 1,800 1,800 1,800
Transportation, Department of 8,017,474 7,782,761 8,126,657 8,385,651 8,241,819 7,955,140 Local Assistance Grants 4,892,214 4,876,767 5,039,349 5,206,264 5,313,709 5,356,763 State Operations 40,374 44,089 31,540 32,310 33,050 33,854 Personal Service 15,310 14,031 14,748 15,109 15,463 15,856 Non-Personal Service/Indirect Costs 25,064 30,058 16,792 17,201 17,587 17,998 General State Charges 2,519 10,355 7,480 8,167 8,760 9,365 Capital Projects 3,082,367 2,851,550 3,048,288 3,138,910 2,886,300 2,555,158
Functional Total 8,556,186 8,278,461 8,765,617 8,887,339 8,754,543 8,624,686
HEALTH
Aging, Office for the 232,453 215,627 216,894 220,668 227,593 234,751 Local Assistance Grants 222,625 205,629 206,873 210,563 217,267 224,212 State Operations 9,828 9,763 9,786 9,870 10,091 10,304 Personal Service 8,323 8,563 8,586 8,660 8,871 9,084 Non-Personal Service/Indirect Costs 1,505 1,200 1,200 1,210 1,220 1,220 General State Charges 0 235 235 235 235 235
Health, Department of 43,795,710 44,206,646 44,462,918 47,088,645 51,478,546 54,703,043
Medical Assistance 38,624,934 38,603,469 38,969,467 41,540,259 46,117,846 49,588,436 Local Assistance Grants 38,601,687 38,557,114 38,916,612 41,483,904 46,061,991 49,532,581 State Operations 23,247 46,355 52,855 56,355 55,855 55,855 Personal Service 500 500 500 500 500 500 Non-Personal Service/Indirect Costs 22,747 45,855 52,355 55,855 55,355 55,355
Medicaid Administration 956,269 1,147,500 1,160,500 1,151,400 1,077,200 958,200 Local Assistance Grants 956,269 1,147,500 1,160,500 1,151,400 1,077,200 958,200
Public Health 4,214,507 4,455,677 4,332,951 4,396,986 4,283,500 4,156,407 Local Assistance Grants 3,396,015 3,643,922 3,511,293 3,527,475 3,388,217 3,253,043 State Operations 750,575 734,653 741,790 786,385 810,281 816,044
T-149

CASH DISBURSEMENTS BY FUNCTION ALL GOVERNMENTAL FUNDS
(thousands of dollars)
FY 2011Results
FY 2012Current
FY 2013Proposed
FY 2014Projected
FY 2015Projected
FY 2016Projected
Personal Service 346,059 334,794 340,675 363,207 376,487 383,269 Non-Personal Service/Indirect Costs 404,516 399,859 401,115 423,178 433,794 432,775 General State Charges 60,449 63,602 66,368 69,626 71,502 73,820 Capital Projects 7,468 13,500 13,500 13,500 13,500 13,500
Medicaid Inspector General, Office of the 66,843 69,019 66,241 67,525 70,221 71,464 State Operations 57,844 58,281 55,503 56,776 59,241 60,200 Personal Service 41,629 39,536 36,758 37,700 39,442 40,375 Non-Personal Service/Indirect Costs 16,215 18,745 18,745 19,076 19,799 19,825 General State Charges 8,999 10,738 10,738 10,749 10,980 11,264
Stem Cell and Innovation 37,289 45,000 50,000 63,673 61,373 50,000 State Operations 36,971 45,000 50,000 63,673 61,373 50,000 Personal Service 534 0 0 0 0 0 Non-Personal Service/Indirect Costs 36,437 45,000 50,000 63,673 61,373 50,000 General State Charges 318 0 0 0 0 0
Functional Total 44,132,295 44,536,292 44,796,053 47,440,511 51,837,733 55,059,258
SOCIAL WELFARE
Children and Family Services, Office of 3,144,866 3,024,432 2,970,334 3,265,351 3,358,033 3,459,237
OCFS 3,075,511 2,913,331 2,856,883 3,147,983 3,236,060 3,332,514 Local Assistance Grants 2,640,673 2,483,964 2,402,865 2,704,519 2,803,014 2,901,649 State Operations 404,378 395,888 420,539 410,847 400,087 397,487 Personal Service 220,446 205,854 219,041 202,734 192,493 191,326 Non-Personal Service/Indirect Costs 183,932 190,034 201,498 208,113 207,594 206,161 General State Charges 12,215 12,579 12,579 11,717 12,059 12,478 Capital Projects 18,245 20,900 20,900 20,900 20,900 20,900
OCFS - Other 69,355 111,101 113,451 117,368 121,973 126,723 Local Assistance Grants 69,355 111,101 113,451 117,368 121,973 126,723
Housing and Community Renewal, Division of 403,244 409,986 242,763 244,516 248,823 256,543 Local Assistance Grants 308,912 324,450 161,923 161,863 163,515 168,515 State Operations 71,483 63,770 58,650 59,184 60,437 62,297 Personal Service 55,025 48,646 45,921 46,246 47,286 48,987 Non-Personal Service/Indirect Costs 16,458 15,124 12,729 12,938 13,151 13,310 General State Charges 19,849 18,766 19,190 20,467 21,869 22,727 Capital Projects 3,000 3,000 3,000 3,002 3,002 3,004
Human Rights, Division of 19,139 18,169 17,638 18,004 18,392 18,891 State Operations 18,092 15,639 14,726 14,938 15,395 15,871 Personal Service 14,686 13,206 12,571 12,666 13,038 13,451 Non-Personal Service/Indirect Costs 3,406 2,433 2,155 2,272 2,357 2,420 General State Charges 1,047 2,530 2,912 3,066 2,997 3,020
Labor, Department of 710,215 698,875 701,800 654,217 659,897 665,903 Local Assistance Grants 195,795 211,631 220,932 183,347 183,347 183,347 State Operations 407,013 349,291 327,630 313,755 318,846 324,555 Personal Service 249,256 216,606 199,425 194,086 198,807 204,258 Non-Personal Service/Indirect Costs 157,757 132,685 128,205 119,669 120,039 120,297 General State Charges 107,407 137,953 153,238 157,115 157,704 158,001
National and Community Service 24,731 14,599 14,601 14,687 14,909 14,909 Local Assistance Grants 0 350 350 350 350 350 State Operations 24,731 14,249 14,251 14,337 14,559 14,559 Personal Service 661 562 564 650 657 657 Non-Personal Service/Indirect Costs 24,070 13,687 13,687 13,687 13,902 13,902
Prevention of Domestic Violence, Office for 1,946 1,964 2,094 2,111 2,153 2,202 Local Assistance Grants 666 685 685 685 685 685 State Operations 1,280 1,279 1,409 1,426 1,468 1,517 Personal Service 1,088 1,133 1,313 1,324 1,359 1,397 Non-Personal Service/Indirect Costs 192 146 96 102 109 120
Temporary and Disability Assistance, Office of 5,278,082 5,393,494 5,321,639 5,188,582 5,107,121 5,137,774
Welfare Assistance 3,717,714 3,875,611 3,971,946 3,847,622 3,751,971 3,778,684 Local Assistance Grants 3,717,714 3,875,611 3,971,946 3,847,622 3,751,971 3,778,684
All Other 1,560,368 1,517,883 1,349,693 1,340,960 1,355,150 1,359,090 Local Assistance Grants 1,183,687 1,119,225 949,743 937,143 937,143 938,543 State Operations 329,230 345,229 355,827 359,354 373,034 375,574 Personal Service 166,482 162,250 168,368 171,424 178,551 183,643 Non-Personal Service/Indirect Costs 162,748 182,979 187,459 187,930 194,483 191,931 General State Charges 47,451 53,429 44,123 44,463 44,973 44,973
Welfare Inspector General, Office of 1,150 1,391 1,407 1,427 1,456 1,468 State Operations 1,094 1,177 1,186 1,206 1,234 1,244 Personal Service 434 701 701 721 738 748
T-150

CASH DISBURSEMENTS BY FUNCTION ALL GOVERNMENTAL FUNDS
(thousands of dollars)
FY 2011Results
FY 2012Current
FY 2013Proposed
FY 2014Projected
FY 2015Projected
FY 2016Projected
Non-Personal Service/Indirect Costs 660 476 485 485 496 496 General State Charges 56 214 221 221 222 224
Workers' Compensation Board 198,709 203,590 202,742 202,552 209,154 216,114 State Operations 155,557 161,893 156,680 153,359 156,256 159,533 Personal Service 89,052 87,031 89,130 90,328 92,301 94,633 Non-Personal Service/Indirect Costs 66,505 74,862 67,550 63,031 63,955 64,900 General State Charges 43,152 41,697 46,062 49,193 52,898 56,581
Functional Total 9,782,082 9,766,500 9,475,018 9,591,447 9,619,938 9,773,041
MENTAL HYGIENE
Alcoholism and Substance Abuse Services, Office of 600,042 587,549 593,417 617,158 707,869 732,555
OASAS 488,354 491,441 494,863 516,081 602,985 622,106 Local Assistance Grants 434,709 434,581 438,936 455,649 541,336 558,538 State Operations 39,783 35,585 34,429 34,843 35,357 36,287 Personal Service 29,054 23,536 22,810 23,236 23,468 24,111 Non-Personal Service/Indirect Costs 10,729 12,049 11,619 11,607 11,889 12,176 General State Charges 12,184 12,307 11,618 12,393 13,209 14,198 Capital Projects 1,678 8,968 9,880 13,196 13,083 13,083
OASAS - Other 111,688 96,108 98,554 101,077 104,884 110,449 Local Assistance Grants 49,089 32,680 32,680 32,680 32,680 32,680 State Operations 46,364 47,471 46,553 47,648 49,447 52,383 Personal Service 34,493 38,662 37,670 38,769 40,305 42,969 Non-Personal Service/Indirect Costs 11,871 8,809 8,883 8,879 9,142 9,414 General State Charges 16,235 15,957 19,321 20,749 22,757 25,386
Developmental Disabilities Planning Council 2,894 4,200 4,200 4,200 4,200 4,199 State Operations 2,894 3,580 3,665 3,551 3,489 3,441 Personal Service 1,190 1,197 1,197 1,211 1,230 1,253 Non-Personal Service/Indirect Costs 1,704 2,383 2,468 2,340 2,259 2,188 General State Charges 0 620 535 649 711 758
Mental Health, Office of 3,332,889 3,205,185 3,243,181 3,498,473 3,831,941 4,065,257
OMH 1,574,835 1,330,174 1,401,930 1,558,905 1,775,516 1,869,218 Local Assistance Grants 823,456 807,657 822,711 949,741 1,131,885 1,203,849 State Operations 483,127 316,750 370,996 374,777 392,859 400,091 Personal Service 405,883 252,633 291,423 292,157 310,597 317,519 Non-Personal Service/Indirect Costs 77,244 64,117 79,573 82,620 82,262 82,572 General State Charges 198,566 128,197 130,653 156,789 173,092 187,495 Capital Projects 69,686 77,570 77,570 77,598 77,680 77,783
OMH - Other 1,758,054 1,875,011 1,841,251 1,939,568 2,056,425 2,196,039 Local Assistance Grants 423,412 406,342 384,595 413,011 439,833 472,146 State Operations 973,298 1,080,916 1,024,029 1,074,810 1,124,167 1,178,179 Personal Service 739,482 850,015 813,670 843,503 873,466 926,013 Non-Personal Service/Indirect Costs 233,816 230,901 210,359 231,307 250,701 252,166 General State Charges 361,344 387,753 432,627 451,747 492,425 545,714
Mental Hygiene, Department of 345 0 0 0 0 0 State Operations 345 0 0 0 0 0 Non-Personal Service/Indirect Costs 345 0 0 0 0 0
People with Developmental Disabilities, Office for 4,334,649 4,282,256 4,321,890 4,653,708 4,852,052 5,078,056
OPWDD 527,982 561,019 517,904 557,245 573,345 582,797 Local Assistance Grants 502,659 468,725 438,832 483,293 499,393 508,845 State Operations 1,686 53,632 33,782 34,658 34,658 34,658 Personal Service 42 116 116 116 116 116 Non-Personal Service/Indirect Costs 1,644 53,516 33,666 34,542 34,542 34,542 General State Charges 19 62 70 74 74 74 Capital Projects 23,618 38,600 45,220 39,220 39,220 39,220
OPWDD - Other 3,806,667 3,721,237 3,803,986 4,096,463 4,278,707 4,495,259 Local Assistance Grants 1,677,965 1,692,644 1,724,409 1,906,399 2,000,382 2,061,748 State Operations 1,548,712 1,495,125 1,485,477 1,542,826 1,579,804 1,665,637 Personal Service 1,168,196 1,125,656 1,122,650 1,166,568 1,192,852 1,268,545 Non-Personal Service/Indirect Costs 380,516 369,469 362,827 376,258 386,952 397,092 General State Charges 579,990 533,468 594,100 647,238 698,521 767,874
Quality of Care and Advocacy for Persons With Disabilities, Commission on 14,708 15,030 16,196 17,206 17,728 18,283 Local Assistance Grants 623 620 620 620 620 620 State Operations 12,393 12,536 13,540 14,378 14,716 15,089 Personal Service 7,012 6,895 7,731 8,392 8,587 8,799 Non-Personal Service/Indirect Costs 5,381 5,641 5,809 5,986 6,129 6,290 General State Charges 1,692 1,874 2,036 2,208 2,392 2,574
Functional Total 8,285,527 8,094,220 8,178,884 8,790,745 9,413,790 9,898,350
T-151

CASH DISBURSEMENTS BY FUNCTION ALL GOVERNMENTAL FUNDS
(thousands of dollars)
FY 2011Results
FY 2012Current
FY 2013Proposed
FY 2014Projected
FY 2015Projected
FY 2016Projected
PUBLIC PROTECTION/CRIMINAL JUSTICE
Correction, Commission of 2,419 2,733 2,672 2,711 2,787 2,864 State Operations 2,419 2,733 2,672 2,711 2,787 2,864 Personal Service 2,082 2,319 2,398 2,414 2,481 2,548 Non-Personal Service/Indirect Costs 337 414 274 297 306 316
Correctional Services, Department of 2,834,565 2,751,310 2,679,488 2,736,082 2,794,809 2,931,180 Local Assistance Grants 10,624 6,086 6,051 6,000 6,000 6,000 State Operations 2,604,952 2,499,559 2,418,757 2,468,990 2,521,684 2,651,905 Personal Service 2,072,488 1,983,905 1,945,131 1,975,773 2,007,958 2,116,739 Non-Personal Service/Indirect Costs 532,464 515,654 473,626 493,217 513,726 535,166 General State Charges 2,757 1,415 1,415 1,415 1,415 1,415 Capital Projects 216,232 244,250 253,265 259,677 265,710 271,860
Corrections and Community Supervision Medicaid, Department of 0 0 11,500 11,500 11,500 12,500 Local Assistance Grants 0 0 11,500 11,500 11,500 12,500
Criminal Justice Services, Division of 269,469 286,904 282,021 254,827 252,756 254,386 Local Assistance Grants 186,974 197,570 194,020 170,861 170,861 170,861 State Operations 82,243 88,933 87,606 83,557 81,450 83,043 Personal Service 45,227 43,172 42,053 39,117 40,100 41,226 Non-Personal Service/Indirect Costs 37,016 45,761 45,553 44,440 41,350 41,817 General State Charges 252 401 395 409 445 482
Homeland Security and Emergency Services, Division of 360,463 516,376 585,011 583,124 568,837 516,885 Local Assistance Grants 326,323 428,872 511,412 523,207 511,232 464,991 State Operations 28,612 66,887 61,978 50,296 46,984 48,273 Personal Service 12,781 21,531 21,646 21,811 22,427 23,127 Non-Personal Service/Indirect Costs 15,831 45,356 40,332 28,485 24,557 25,146 General State Charges 3,112 3,617 3,621 3,621 3,621 3,621 Capital Projects 2,416 17,000 8,000 6,000 7,000 0
Indigent Legal Services, Office of 90,793 78,500 78,544 78,588 78,631 78,672 Local Assistance Grants 65,769 77,000 77,000 77,000 77,000 77,000 State Operations 25,024 1,141 1,134 1,151 1,167 1,183 Personal Service 8 750 794 802 810 818 Non-Personal Service/Indirect Costs 25,016 391 340 349 357 365 General State Charges 0 359 410 437 464 489
Judicial Commissions 4,944 5,150 5,452 5,577 5,795 5,990 State Operations 4,944 5,150 5,452 5,577 5,795 5,990 Personal Service 3,723 3,791 4,093 4,124 4,237 4,357 Non-Personal Service/Indirect Costs 1,221 1,359 1,359 1,453 1,558 1,633
Military and Naval Affairs, Division of 99,704 93,223 95,059 96,473 113,465 112,159 Local Assistance Grants 3,825 745 867 850 850 850 State Operations 63,905 63,077 60,402 61,878 62,359 62,953 Personal Service 41,684 38,868 38,825 39,156 39,489 39,931 Non-Personal Service/Indirect Costs 22,221 24,209 21,577 22,722 22,870 23,022 General State Charges 8,228 6,749 6,749 6,749 6,749 6,749 Capital Projects 23,746 22,652 27,041 26,996 43,507 41,607
Public Security and Emergency Response 535 600 600 600 600 600 State Operations 0 600 600 600 600 600 Personal Service 0 600 600 600 600 600 Capital Projects 535 0 0 0 0 0
State Police, Division of 715,440 720,339 721,849 699,043 698,856 712,840 State Operations 679,514 664,568 655,592 657,096 662,561 675,545 Personal Service 590,458 569,500 573,637 573,673 577,636 585,610 Non-Personal Service/Indirect Costs 89,056 95,068 81,955 83,423 84,925 89,935 General State Charges 21,329 19,944 22,857 24,073 25,230 26,230 Capital Projects 14,597 35,827 43,400 17,874 11,065 11,065
Statewide Financial System 9,070 40,638 50,201 51,525 52,826 54,164 State Operations 9,069 40,638 50,201 51,525 52,826 54,164 Personal Service 3,977 9,139 10,814 10,895 10,977 11,060 Non-Personal Service/Indirect Costs 5,092 31,499 39,387 40,630 41,849 43,104 General State Charges 1 0 0 0 0 0
Statewide Wireless Network 28,253 0 0 0 0 0 State Operations 27,655 0 0 0 0 0 Personal Service 8,076 0 0 0 0 0 Non-Personal Service/Indirect Costs 19,579 0 0 0 0 0 General State Charges 598 0 0 0 0 0
Victim Services, Office of 69,522 67,038 67,197 67,402 67,690 68,010 Local Assistance Grants 62,560 58,310 58,310 58,310 58,310 58,310 State Operations 6,074 6,803 6,784 6,879 7,054 7,272 Personal Service 4,950 5,264 5,366 5,446 5,604 5,805
T-152

CASH DISBURSEMENTS BY FUNCTION ALL GOVERNMENTAL FUNDS
(thousands of dollars)
FY 2011Results
FY 2012Current
FY 2013Proposed
FY 2014Projected
FY 2015Projected
FY 2016Projected
Non-Personal Service/Indirect Costs 1,124 1,539 1,418 1,433 1,450 1,467 General State Charges 888 1,925 2,103 2,213 2,326 2,428
Functional Total 4,485,177 4,562,811 4,579,594 4,587,452 4,648,552 4,750,250
HIGHER EDUCATION
City University of New York 1,348,692 1,380,256 1,449,936 1,510,451 1,566,431 1,631,431 Local Assistance Grants 1,215,592 1,202,263 1,271,312 1,329,217 1,391,978 1,460,122 State Operations 117,099 136,747 119,812 121,335 122,895 124,518 Personal Service 85,732 96,651 85,125 85,763 86,406 87,055 Non-Personal Service/Indirect Costs 31,367 40,096 34,687 35,572 36,489 37,463 General State Charges 6,400 6,541 6,685 6,833 6,833 6,833 Capital Projects 9,601 34,705 52,127 53,066 44,725 39,958
Higher Education - Miscellaneous 370 355 1,300 1,300 1,300 1,300 State Operations 255 220 1,201 1,201 1,201 1,201 Personal Service 221 175 198 198 198 198 Non-Personal Service/Indirect Costs 34 45 1,003 1,003 1,003 1,003 General State Charges 115 135 99 99 99 99
Higher Education Facilities Capital Matching Grants Program 33,834 45,100 29,492 0 0 0 Local Assistance Grants 34,266 35,100 20,492 0 0 0 Capital Projects (432) 10,000 9,000 0 0 0
Higher Education Services Corporation, New York State 956,654 1,024,754 1,042,096 1,095,073 1,110,777 1,124,987 Local Assistance Grants 872,756 923,861 950,933 1,001,349 1,014,412 1,025,891 State Operations 69,013 87,108 75,613 76,942 78,609 80,454 Personal Service 32,916 32,970 31,002 31,390 32,083 32,894 Non-Personal Service/Indirect Costs 36,097 54,138 44,611 45,552 46,526 47,560 General State Charges 14,885 13,785 15,550 16,782 17,756 18,642
State University Construction Fund 18,915 26,172 0 0 0 0 State Operations 14,438 18,579 0 0 0 0 Personal Service 12,562 15,544 0 0 0 0 Non-Personal Service/Indirect Costs 1,876 3,035 0 0 0 0 General State Charges 4,477 7,593 0 0 0 0
State University of New York 7,142,170 7,400,266 7,575,903 7,726,459 8,049,187 8,141,426 Local Assistance Grants 562,529 486,796 447,256 446,478 446,478 446,478 State Operations 5,199,205 5,382,832 5,533,330 5,689,809 5,855,504 6,023,822 Personal Service 3,248,683 3,258,458 3,348,107 3,445,001 3,557,311 3,671,279 Non-Personal Service/Indirect Costs 1,950,522 2,124,374 2,185,223 2,244,808 2,298,193 2,352,543 General State Charges 528,116 498,813 500,980 516,493 548,542 548,542 Capital Projects 852,320 1,031,825 1,094,337 1,073,679 1,198,663 1,122,584
Functional Total 9,500,635 9,876,903 10,098,727 10,333,283 10,727,695 10,899,144
EDUCATION
Arts, Council on the 46,018 36,678 36,573 36,575 36,621 36,671 Local Assistance Grants 41,324 32,153 32,353 32,353 32,353 32,353 State Operations 4,694 4,525 4,220 4,222 4,268 4,318 Personal Service 3,098 2,300 2,298 2,300 2,346 2,396 Non-Personal Service/Indirect Costs 1,596 2,225 1,922 1,922 1,922 1,922
Education, Department of 32,821,070 29,824,913 29,280,756 30,458,850 31,353,094 32,394,787
School Aid 26,487,723 23,331,298 22,844,673 23,500,406 24,262,532 25,266,021 Local Assistance Grants 26,487,723 23,331,298 22,844,673 23,500,406 24,262,532 25,266,021
STAR Property Tax Relief 3,234,014 3,292,520 3,322,067 3,508,375 3,690,726 3,792,568 Local Assistance Grants 3,234,014 3,292,520 3,322,067 3,508,375 3,690,726 3,792,568
Special Education Categorical Programs 2,159,415 2,149,928 1,997,636 2,135,616 2,244,216 2,340,616 Local Assistance Grants 2,159,415 2,149,928 1,997,636 2,135,616 2,244,216 2,340,616
All Other 939,918 1,051,167 1,116,380 1,314,453 1,155,620 995,582 Local Assistance Grants 588,174 656,119 680,289 800,033 704,640 604,369 State Operations 282,877 319,216 334,127 406,561 348,905 280,712 Personal Service 175,944 166,632 166,828 168,752 171,262 172,475 Non-Personal Service/Indirect Costs 106,933 152,584 167,299 237,809 177,643 108,237 General State Charges 64,236 64,924 72,560 77,975 83,675 87,101 Capital Projects 4,631 10,908 29,404 29,884 18,400 23,400
Functional Total 32,867,088 29,861,591 29,317,329 30,495,425 31,389,715 32,431,458
GENERAL GOVERNMENT
Budget, Division of the 33,825 36,345 37,260 38,767 41,458 42,664 State Operations 32,081 34,266 34,963 36,117 38,584 39,570 Personal Service 24,430 23,915 24,961 25,768 27,287 28,166
T-153
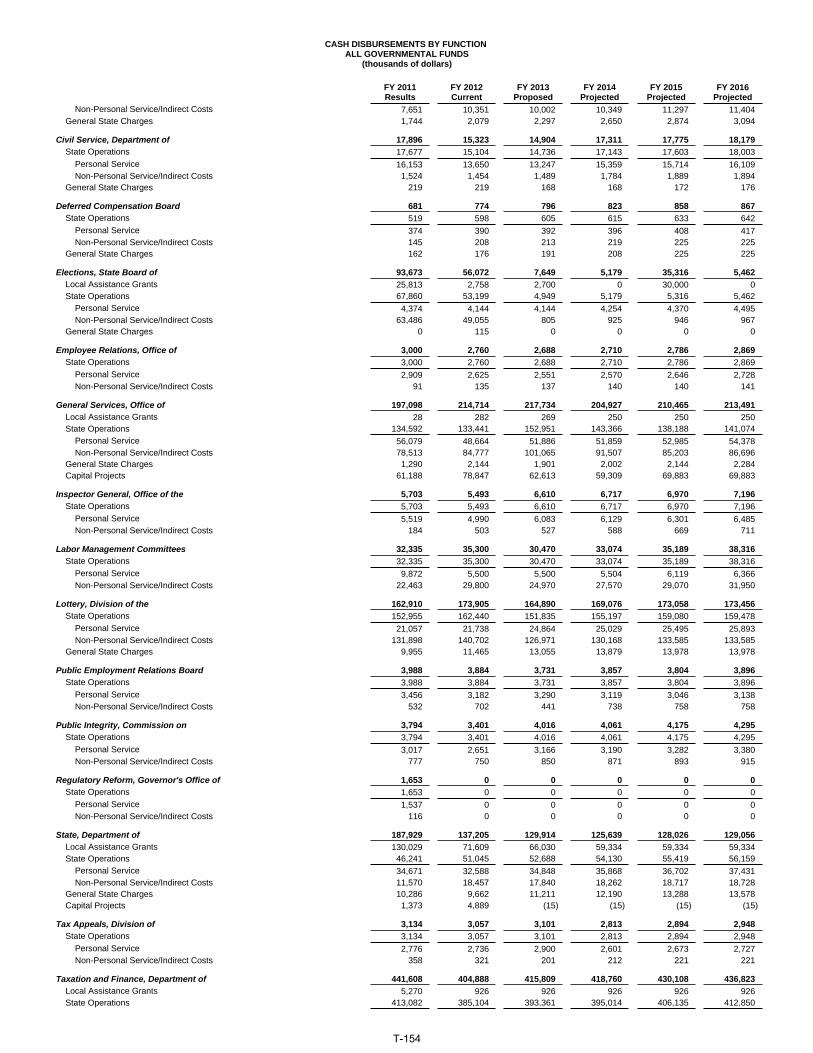
CASH DISBURSEMENTS BY FUNCTION ALL GOVERNMENTAL FUNDS
(thousands of dollars)
FY 2011Results
FY 2012Current
FY 2013Proposed
FY 2014Projected
FY 2015Projected
FY 2016Projected
Non-Personal Service/Indirect Costs 7,651 10,351 10,002 10,349 11,297 11,404 General State Charges 1,744 2,079 2,297 2,650 2,874 3,094
Civil Service, Department of 17,896 15,323 14,904 17,311 17,775 18,179 State Operations 17,677 15,104 14,736 17,143 17,603 18,003 Personal Service 16,153 13,650 13,247 15,359 15,714 16,109 Non-Personal Service/Indirect Costs 1,524 1,454 1,489 1,784 1,889 1,894 General State Charges 219 219 168 168 172 176
Deferred Compensation Board 681 774 796 823 858 867 State Operations 519 598 605 615 633 642 Personal Service 374 390 392 396 408 417 Non-Personal Service/Indirect Costs 145 208 213 219 225 225 General State Charges 162 176 191 208 225 225
Elections, State Board of 93,673 56,072 7,649 5,179 35,316 5,462 Local Assistance Grants 25,813 2,758 2,700 0 30,000 0 State Operations 67,860 53,199 4,949 5,179 5,316 5,462 Personal Service 4,374 4,144 4,144 4,254 4,370 4,495 Non-Personal Service/Indirect Costs 63,486 49,055 805 925 946 967 General State Charges 0 115 0 0 0 0
Employee Relations, Office of 3,000 2,760 2,688 2,710 2,786 2,869 State Operations 3,000 2,760 2,688 2,710 2,786 2,869 Personal Service 2,909 2,625 2,551 2,570 2,646 2,728 Non-Personal Service/Indirect Costs 91 135 137 140 140 141
General Services, Office of 197,098 214,714 217,734 204,927 210,465 213,491 Local Assistance Grants 28 282 269 250 250 250 State Operations 134,592 133,441 152,951 143,366 138,188 141,074 Personal Service 56,079 48,664 51,886 51,859 52,985 54,378 Non-Personal Service/Indirect Costs 78,513 84,777 101,065 91,507 85,203 86,696 General State Charges 1,290 2,144 1,901 2,002 2,144 2,284 Capital Projects 61,188 78,847 62,613 59,309 69,883 69,883
Inspector General, Office of the 5,703 5,493 6,610 6,717 6,970 7,196 State Operations 5,703 5,493 6,610 6,717 6,970 7,196 Personal Service 5,519 4,990 6,083 6,129 6,301 6,485 Non-Personal Service/Indirect Costs 184 503 527 588 669 711
Labor Management Committees 32,335 35,300 30,470 33,074 35,189 38,316 State Operations 32,335 35,300 30,470 33,074 35,189 38,316 Personal Service 9,872 5,500 5,500 5,504 6,119 6,366 Non-Personal Service/Indirect Costs 22,463 29,800 24,970 27,570 29,070 31,950
Lottery, Division of the 162,910 173,905 164,890 169,076 173,058 173,456 State Operations 152,955 162,440 151,835 155,197 159,080 159,478 Personal Service 21,057 21,738 24,864 25,029 25,495 25,893 Non-Personal Service/Indirect Costs 131,898 140,702 126,971 130,168 133,585 133,585 General State Charges 9,955 11,465 13,055 13,879 13,978 13,978
Public Employment Relations Board 3,988 3,884 3,731 3,857 3,804 3,896 State Operations 3,988 3,884 3,731 3,857 3,804 3,896 Personal Service 3,456 3,182 3,290 3,119 3,046 3,138 Non-Personal Service/Indirect Costs 532 702 441 738 758 758
Public Integrity, Commission on 3,794 3,401 4,016 4,061 4,175 4,295 State Operations 3,794 3,401 4,016 4,061 4,175 4,295 Personal Service 3,017 2,651 3,166 3,190 3,282 3,380 Non-Personal Service/Indirect Costs 777 750 850 871 893 915
Regulatory Reform, Governor's Office of 1,653 0 0 0 0 0 State Operations 1,653 0 0 0 0 0 Personal Service 1,537 0 0 0 0 0 Non-Personal Service/Indirect Costs 116 0 0 0 0 0
State, Department of 187,929 137,205 129,914 125,639 128,026 129,056 Local Assistance Grants 130,029 71,609 66,030 59,334 59,334 59,334 State Operations 46,241 51,045 52,688 54,130 55,419 56,159 Personal Service 34,671 32,588 34,848 35,868 36,702 37,431 Non-Personal Service/Indirect Costs 11,570 18,457 17,840 18,262 18,717 18,728 General State Charges 10,286 9,662 11,211 12,190 13,288 13,578 Capital Projects 1,373 4,889 (15) (15) (15) (15)
Tax Appeals, Division of 3,134 3,057 3,101 2,813 2,894 2,948 State Operations 3,134 3,057 3,101 2,813 2,894 2,948 Personal Service 2,776 2,736 2,900 2,601 2,673 2,727 Non-Personal Service/Indirect Costs 358 321 201 212 221 221
Taxation and Finance, Department of 441,608 404,888 415,809 418,760 430,108 436,823 Local Assistance Grants 5,270 926 926 926 926 926 State Operations 413,082 385,104 393,361 395,014 406,135 412,850
T-154

CASH DISBURSEMENTS BY FUNCTION ALL GOVERNMENTAL FUNDS
(thousands of dollars)
FY 2011Results
FY 2012Current
FY 2013Proposed
FY 2014Projected
FY 2015Projected
FY 2016Projected
Personal Service 323,769 297,866 301,881 300,966 309,755 316,470 Non-Personal Service/Indirect Costs 89,313 87,238 91,480 94,048 96,380 96,380 General State Charges 23,256 18,858 21,522 22,820 23,047 23,047
Technology, Office for 31,341 25,560 23,780 22,091 24,691 24,303 Local Assistance Grants 2,086 1,245 0 0 0 0 State Operations 26,372 22,799 23,280 21,591 24,191 23,803 Personal Service 11,208 10,851 13,786 13,795 14,121 14,464 Non-Personal Service/Indirect Costs 15,164 11,948 9,494 7,796 10,070 9,339 General State Charges 0 500 500 500 500 500 Capital Projects 2,883 1,016 0 0 0 0
Veterans' Affairs, Division of 15,368 15,282 15,096 14,631 14,865 15,121 Local Assistance Grants 8,044 8,328 7,967 7,397 7,457 7,517 State Operations 6,893 6,604 6,779 6,884 7,058 7,254 Personal Service 6,232 5,625 5,807 5,890 6,041 6,212 Non-Personal Service/Indirect Costs 661 979 972 994 1,017 1,042 General State Charges 431 350 350 350 350 350
Functional Total 1,235,936 1,133,963 1,078,448 1,070,436 1,132,438 1,118,942
ELECTED OFFICIALS
Audit and Control, Department of 171,821 174,170 173,479 175,736 179,315 183,489 Local Assistance Grants 31,598 32,024 32,024 32,024 32,024 32,024 State Operations 138,841 139,405 139,394 142,190 145,658 149,721 Personal Service 110,320 103,442 108,671 109,385 112,012 115,214 Non-Personal Service/Indirect Costs 28,521 35,963 30,723 32,805 33,646 34,507 General State Charges 1,382 2,741 2,061 1,522 1,633 1,744
Executive Chamber 12,880 13,926 13,578 13,836 14,773 15,185 State Operations 12,880 13,926 13,578 13,836 14,773 15,185 Personal Service 10,963 10,695 11,338 11,495 12,238 12,589 Non-Personal Service/Indirect Costs 1,917 3,231 2,240 2,341 2,535 2,596
Judiciary 2,555,700 2,558,158 2,554,498 2,687,444 2,812,504 2,942,000 Local Assistance Grants 119,798 106,645 106,700 121,700 121,700 121,700 State Operations 1,874,663 1,841,380 1,863,400 1,921,914 2,007,452 2,102,994 Personal Service 1,526,975 1,463,935 1,468,250 1,514,284 1,561,492 1,618,742 Non-Personal Service/Indirect Costs 347,688 377,445 395,150 407,630 445,960 484,252 General State Charges 551,599 606,298 584,398 643,830 683,352 717,306 Capital Projects 9,640 3,835 0 0 0 0
Law, Department of 200,712 205,797 212,348 214,252 220,287 226,829 State Operations 185,050 187,648 189,710 190,541 195,195 200,423 Personal Service 129,276 123,659 130,394 130,602 133,947 137,628 Non-Personal Service/Indirect Costs 55,774 63,989 59,316 59,939 61,248 62,795 General State Charges 15,662 18,149 22,638 23,711 25,092 26,406
Legislature 222,536 218,795 218,795 221,349 223,945 226,583 State Operations 222,536 218,795 218,795 221,349 223,945 226,583 Personal Service 174,096 165,284 165,284 166,524 167,773 169,031 Non-Personal Service/Indirect Costs 48,440 53,511 53,511 54,825 56,172 57,552
Lieutenant Governor, Office of the 304 630 614 614 665 680 State Operations 304 630 614 614 665 680 Personal Service 281 480 480 494 515 543 Non-Personal Service/Indirect Costs 23 150 134 120 150 137
Functional Total 3,163,953 3,171,476 3,173,312 3,313,231 3,451,489 3,594,766
LOCAL GOVERNMENT ASSISTANCE
Aid and Incentives for Municipalities 738,940 721,192 740,555 757,414 772,589 775,357 Local Assistance Grants 738,940 721,192 740,555 757,414 772,589 775,357
Efficiency Incentive Grants Program 4,604 9,127 7,823 1,205 0 0 Local Assistance Grants 4,604 9,127 7,823 1,205 0 0
Miscellaneous Financial Assistance 3,920 1,960 1,960 1,960 1,960 1,960 Local Assistance Grants 3,920 1,960 1,960 1,960 1,960 1,960
Municipalities with VLT Facilities 25,800 25,867 25,867 25,867 25,867 25,867 Local Assistance Grants 25,800 25,867 25,867 25,867 25,867 25,867
Small Government Assistance 2,066 218 218 218 218 218 Local Assistance Grants 2,066 218 218 218 218 218
Functional Total 775,330 758,364 776,423 786,664 800,634 803,402
T-155

CASH DISBURSEMENTS BY FUNCTION ALL GOVERNMENTAL FUNDS
(thousands of dollars)
FY 2011Results
FY 2012Current
FY 2013Proposed
FY 2014Projected
FY 2015Projected
FY 2016Projected
ALL OTHER CATEGORIES
General State Charges 3,432,021 3,920,304 3,671,935 4,001,489 4,306,959 4,564,805 State Operations 5,561 0 0 0 0 0 Personal Service 3,835 0 0 0 0 0 Non-Personal Service/Indirect Costs 1,726 0 0 0 0 0 General State Charges 3,426,460 3,920,304 3,671,935 4,001,489 4,306,959 4,564,805
Long-Term Debt Service 5,677,515 5,932,445 6,195,454 6,495,435 6,615,038 6,752,282 State Operations 62,846 60,527 46,925 46,925 46,925 46,925 Non-Personal Service/Indirect Costs 62,846 60,527 46,925 46,925 46,925 46,925 Debt Service 5,614,669 5,871,918 6,148,529 6,448,510 6,568,113 6,705,357
Miscellaneous (209,841) (294,849) (157,226) (370,184) (375,075) (232,510) Local Assistance Grants (326,844) (107,154) 99,201 88,171 90,171 166,079 State Operations 4,886 (333,447) (353,236) (554,302) (551,326) (444,792) Personal Service 2,217 (130,164) (146,918) (196,385) (195,109) (138,621) Non-Personal Service/Indirect Costs 2,669 (203,283) (206,318) (357,917) (356,217) (306,171) General State Charges 6,898 5,752 5,809 5,947 6,080 6,203 Capital Projects 105,219 140,000 91,000 90,000 80,000 40,000
Functional Total 8,899,695 9,557,900 9,710,163 10,126,740 10,546,922 11,084,577
TOTAL ALL GOVERNMENTAL FUNDS SPENDING 134,824,946 132,734,537 132,510,743 138,033,457 144,865,777 150,362,360
T-156

CASH DISBURSEMENTS BY FUNCTION ALL GOVERNMENTAL FUNDS
(thousands of dollars)
FY 2011Results
FY 2012Current
FY 2013Proposed
FY 2014Projected
FY 2015Projected
FY 2016Projected
ECONOMIC DEVELOPMENT AND GOVERNMENT OVERSIGHTAgriculture and Markets, Department of 96,013 119,592 104,951 101,743 102,260 99,429Alcoholic Beverage Control, Division of 16,706 16,657 17,859 18,314 18,781 19,225Development Authority of the North Country 10 117 70 0 0 0Economic Development Capital 30,190 19,600 12,500 12,500 5,000 5,000Economic Development, Department of 103,950 158,222 136,806 127,874 98,234 93,630Empire State Development Corporation 931,654 899,339 508,326 638,882 634,903 457,292Energy Research and Development Authority 31,710 29,597 29,358 31,178 31,178 31,178Financial Services, Department of 507,393 490,185 488,005 490,712 494,195 498,348Olympic Regional Development Authority 3,534 3,331 3,079 3,206 3,288 3,288Public Service Department 75,288 72,008 77,031 82,744 86,953 91,042Racing and Wagering Board, State 21,573 17,537 18,248 18,513 18,845 19,080Regional Economic Development Program 5,248 5,900 2,500 2,500 1,500 1,500Strategic Investment Program 3,561 4,000 5,000 5,000 5,000 5,000 Functional Total 1,826,830 1,836,085 1,403,733 1,533,166 1,500,137 1,324,012
PARKS AND THE ENVIRONMENTAdirondack Park Agency 4,718 4,544 4,496 4,525 4,601 4,687Environmental Conservation, Department of 1,024,255 1,040,630 872,880 825,278 800,609 770,490Environmental Facilities Corporation 9,746 10,620 0 0 0 0Hudson River Park Trust 15,216 6,400 3,816 0 0 0Parks, Recreation and Historic Preservation, Office of 260,277 237,777 276,250 247,215 236,981 225,297 Functional Total 1,314,212 1,299,971 1,157,442 1,077,018 1,042,191 1,000,474
TRANSPORTATIONMetropolitan Transportation Authority 216,912 194,500 333,600 183,600 183,600 328,571Motor Vehicles, Department of 320,322 299,400 303,560 316,288 327,324 339,175Thruway Authority, New York State 1,478 1,800 1,800 1,800 1,800 1,800Transportation, Department of 8,017,474 7,782,761 8,126,657 8,385,651 8,241,819 7,955,140 Functional Total 8,556,186 8,278,461 8,765,617 8,887,339 8,754,543 8,624,686
HEALTHAging, Office for the 232,453 215,627 216,894 220,668 227,593 234,751Health, Department of 43,795,710 44,206,646 44,462,918 47,088,645 51,478,546 54,703,043 Medical Assistance 38,624,934 38,603,469 38,969,467 41,540,259 46,117,846 49,588,436 Medicaid Administration 956,269 1,147,500 1,160,500 1,151,400 1,077,200 958,200 Public Health 4,214,507 4,455,677 4,332,951 4,396,986 4,283,500 4,156,407Medicaid Inspector General, Office of the 66,843 69,019 66,241 67,525 70,221 71,464Stem Cell and Innovation 37,289 45,000 50,000 63,673 61,373 50,000 Functional Total 44,132,295 44,536,292 44,796,053 47,440,511 51,837,733 55,059,258
SOCIAL WELFAREChildren and Family Services, Office of 3,144,866 3,024,432 2,970,334 3,265,351 3,358,033 3,459,237 OCFS 3,075,511 2,913,331 2,856,883 3,147,983 3,236,060 3,332,514 OCFS - Other 69,355 111,101 113,451 117,368 121,973 126,723Housing and Community Renewal, Division of 403,244 409,986 242,763 244,516 248,823 256,543Human Rights, Division of 19,139 18,169 17,638 18,004 18,392 18,891Labor, Department of 710,215 698,875 701,800 654,217 659,897 665,903National and Community Service 24,731 14,599 14,601 14,687 14,909 14,909Prevention of Domestic Violence, Office for 1,946 1,964 2,094 2,111 2,153 2,202Temporary and Disability Assistance, Office of 5,278,082 5,393,494 5,321,639 5,188,582 5,107,121 5,137,774 Welfare Assistance 3,717,714 3,875,611 3,971,946 3,847,622 3,751,971 3,778,684 All Other 1,560,368 1,517,883 1,349,693 1,340,960 1,355,150 1,359,090Welfare Inspector General, Office of 1,150 1,391 1,407 1,427 1,456 1,468Workers' Compensation Board 198,709 203,590 202,742 202,552 209,154 216,114 Functional Total 9,782,082 9,766,500 9,475,018 9,591,447 9,619,938 9,773,041
MENTAL HYGIENEAlcoholism and Substance Abuse Services, Office of 600,042 587,549 593,417 617,158 707,869 732,555 OASAS 488,354 491,441 494,863 516,081 602,985 622,106 OASAS - Other 111,688 96,108 98,554 101,077 104,884 110,449Developmental Disabilities Planning Council 2,894 4,200 4,200 4,200 4,200 4,199Mental Health, Office of 3,332,889 3,205,185 3,243,181 3,498,473 3,831,941 4,065,257 OMH 1,574,835 1,330,174 1,401,930 1,558,905 1,775,516 1,869,218 OMH - Other 1,758,054 1,875,011 1,841,251 1,939,568 2,056,425 2,196,039Mental Hygiene, Department of 345 0 0 0 0 0People with Developmental Disabilities, Office for 4,334,649 4,282,256 4,321,890 4,653,708 4,852,052 5,078,056 OPWDD 527,982 561,019 517,904 557,245 573,345 582,797 OPWDD - Other 3,806,667 3,721,237 3,803,986 4,096,463 4,278,707 4,495,259Quality of Care and Advocacy for Persons With Disabilities, Commission on 14,708 15,030 16,196 17,206 17,728 18,283 Functional Total 8,285,527 8,094,220 8,178,884 8,790,745 9,413,790 9,898,350
PUBLIC PROTECTION/CRIMINAL JUSTICECorrection, Commission of 2,419 2,733 2,672 2,711 2,787 2,864Correctional Services, Department of 2,834,565 2,751,310 2,679,488 2,736,082 2,794,809 2,931,180Corrections and Community Supervision Medicaid, Department of 0 0 11,500 11,500 11,500 12,500Criminal Justice Services, Division of 269,469 286,904 282,021 254,827 252,756 254,386
T-157

CASH DISBURSEMENTS BY FUNCTION ALL GOVERNMENTAL FUNDS
(thousands of dollars)
FY 2011Results
FY 2012Current
FY 2013Proposed
FY 2014Projected
FY 2015Projected
FY 2016Projected
Homeland Security and Emergency Services, Division of 360,463 516,376 585,011 583,124 568,837 516,885Indigent Legal Services, Office of 90,793 78,500 78,544 78,588 78,631 78,672Judicial Commissions 4,944 5,150 5,452 5,577 5,795 5,990Military and Naval Affairs, Division of 99,704 93,223 95,059 96,473 113,465 112,159Public Security and Emergency Response 535 600 600 600 600 600State Police, Division of 715,440 720,339 721,849 699,043 698,856 712,840Statewide Financial System 9,070 40,638 50,201 51,525 52,826 54,164Statewide Wireless Network 28,253 0 0 0 0 0Victim Services, Office of 69,522 67,038 67,197 67,402 67,690 68,010 Functional Total 4,485,177 4,562,811 4,579,594 4,587,452 4,648,552 4,750,250
HIGHER EDUCATIONCity University of New York 1,348,692 1,380,256 1,449,936 1,510,451 1,566,431 1,631,431Higher Education - Miscellaneous 370 355 1,300 1,300 1,300 1,300Higher Education Facilities Capital Matching Grants Program 33,834 45,100 29,492 0 0 0Higher Education Services Corporation, New York State 956,654 1,024,754 1,042,096 1,095,073 1,110,777 1,124,987State University Construction Fund 18,915 26,172 0 0 0 0State University of New York 7,142,170 7,400,266 7,575,903 7,726,459 8,049,187 8,141,426 Functional Total 9,500,635 9,876,903 10,098,727 10,333,283 10,727,695 10,899,144
EDUCATIONArts, Council on the 46,018 36,678 36,573 36,575 36,621 36,671Education, Department of 32,821,070 29,824,913 29,280,756 30,458,850 31,353,094 32,394,787 School Aid 26,487,723 23,331,298 22,844,673 23,500,406 24,262,532 25,266,021 STAR Property Tax Relief 3,234,014 3,292,520 3,322,067 3,508,375 3,690,726 3,792,568 Special Education Categorical Programs 2,159,415 2,149,928 1,997,636 2,135,616 2,244,216 2,340,616 All Other 939,918 1,051,167 1,116,380 1,314,453 1,155,620 995,582 Functional Total 32,867,088 29,861,591 29,317,329 30,495,425 31,389,715 32,431,458
GENERAL GOVERNMENTBudget, Division of the 33,825 36,345 37,260 38,767 41,458 42,664Civil Service, Department of 17,896 15,323 14,904 17,311 17,775 18,179Deferred Compensation Board 681 774 796 823 858 867Elections, State Board of 93,673 56,072 7,649 5,179 35,316 5,462Employee Relations, Office of 3,000 2,760 2,688 2,710 2,786 2,869General Services, Office of 197,098 214,714 217,734 204,927 210,465 213,491Inspector General, Office of the 5,703 5,493 6,610 6,717 6,970 7,196Labor Management Committees 32,335 35,300 30,470 33,074 35,189 38,316Lottery, Division of the 162,910 173,905 164,890 169,076 173,058 173,456Public Employment Relations Board 3,988 3,884 3,731 3,857 3,804 3,896Public Integrity, Commission on 3,794 3,401 4,016 4,061 4,175 4,295Regulatory Reform, Governor's Office of 1,653 0 0 0 0 0State, Department of 187,929 137,205 129,914 125,639 128,026 129,056Tax Appeals, Division of 3,134 3,057 3,101 2,813 2,894 2,948Taxation and Finance, Department of 441,608 404,888 415,809 418,760 430,108 436,823Technology, Office for 31,341 25,560 23,780 22,091 24,691 24,303Veterans' Affairs, Division of 15,368 15,282 15,096 14,631 14,865 15,121 Functional Total 1,235,936 1,133,963 1,078,448 1,070,436 1,132,438 1,118,942
ELECTED OFFICIALSAudit and Control, Department of 171,821 174,170 173,479 175,736 179,315 183,489Executive Chamber 12,880 13,926 13,578 13,836 14,773 15,185Judiciary 2,555,700 2,558,158 2,554,498 2,687,444 2,812,504 2,942,000Law, Department of 200,712 205,797 212,348 214,252 220,287 226,829Legislature 222,536 218,795 218,795 221,349 223,945 226,583Lieutenant Governor, Office of the 304 630 614 614 665 680 Functional Total 3,163,953 3,171,476 3,173,312 3,313,231 3,451,489 3,594,766
LOCAL GOVERNMENT ASSISTANCEAid and Incentives for Municipalities 738,940 721,192 740,555 757,414 772,589 775,357Efficiency Incentive Grants Program 4,604 9,127 7,823 1,205 0 0Miscellaneous Financial Assistance 3,920 1,960 1,960 1,960 1,960 1,960Municipalities with VLT Facilities 25,800 25,867 25,867 25,867 25,867 25,867Small Government Assistance 2,066 218 218 218 218 218 Functional Total 775,330 758,364 776,423 786,664 800,634 803,402
ALL OTHER CATEGORIESGeneral State Charges 3,432,021 3,920,304 3,671,935 4,001,489 4,306,959 4,564,805Long-Term Debt Service 5,677,515 5,932,445 6,195,454 6,495,435 6,615,038 6,752,282Miscellaneous (209,841) (294,849) (157,226) (370,184) (375,075) (232,510) Functional Total 8,899,695 9,557,900 9,710,163 10,126,740 10,546,922 11,084,577
TOTAL ALL GOVERNMENTAL FUNDS SPENDING 134,824,946 132,734,537 132,510,743 138,033,457 144,865,777 150,362,360
GSC: Agency disbursements include grants to local governments, state operations and general state charges, which is a departure from prior Financial plan publications. In prior reports, general state charges were excluded from agency spending totals.
T-158

CASH DISBURSEMENTS BY FUNCTION ALL GOVERNMENTAL FUNDSLOCAL ASSISTANCE GRANTS
(thousands of dollars)
FY 2011Results
FY 2012Current
FY 2013Proposed
FY 2014Projected
FY 2015Projected
FY 2016Projected
ECONOMIC DEVELOPMENT AND GOVERNMENT OVERSIGHTAgriculture and Markets, Department of 15,014 26,358 23,413 23,095 23,095 23,095Development Authority of the North Country 10 117 70 0 0 0Economic Development Capital 30,617 0 0 0 0 0Economic Development, Department of 75,494 76,986 84,756 72,329 54,872 54,872Empire State Development Corporation 926,844 752,868 430,761 526,280 499,900 371,460Energy Research and Development Authority 9,157 9,234 9,234 9,234 9,234 9,234Financial Services, Department of 228,152 218,832 216,952 216,952 216,952 216,952Public Service Department 0 500 500 500 500 500Regional Economic Development Program 5,248 0 0 0 0 0 Functional Total 1,290,536 1,084,895 765,686 848,390 804,553 676,113
PARKS AND THE ENVIRONMENTEnvironmental Conservation, Department of 369,290 351,802 188,875 149,802 149,802 149,802Parks, Recreation and Historic Preservation, Office of 18,960 17,836 14,282 8,970 8,970 8,970 Functional Total 388,250 369,638 203,157 158,772 158,772 158,772
TRANSPORTATIONMetropolitan Transportation Authority 216,912 194,500 183,600 183,600 183,600 18,571Motor Vehicles, Department of 15,734 17,800 14,800 14,800 14,800 14,800Thruway Authority, New York State 1,478 0 0 0 0 0Transportation, Department of 4,892,214 4,876,767 5,039,349 5,206,264 5,313,709 5,356,763 Functional Total 5,126,338 5,089,067 5,237,749 5,404,664 5,512,109 5,390,134
HEALTHAging, Office for the 222,625 205,629 206,873 210,563 217,267 224,212Health, Department of 42,953,971 43,348,536 43,588,405 46,162,779 50,527,408 53,743,824 Medical Assistance 38,601,687 38,557,114 38,916,612 41,483,904 46,061,991 49,532,581 Medicaid Administration 956,269 1,147,500 1,160,500 1,151,400 1,077,200 958,200 Public Health 3,396,015 3,643,922 3,511,293 3,527,475 3,388,217 3,253,043 Functional Total 43,176,596 43,554,165 43,795,278 46,373,342 50,744,675 53,968,036
SOCIAL WELFAREChildren and Family Services, Office of 2,710,028 2,595,065 2,516,316 2,821,887 2,924,987 3,028,372 OCFS 2,640,673 2,483,964 2,402,865 2,704,519 2,803,014 2,901,649 OCFS - Other 69,355 111,101 113,451 117,368 121,973 126,723Housing and Community Renewal, Division of 308,912 324,450 161,923 161,863 163,515 168,515Labor, Department of 195,795 211,631 220,932 183,347 183,347 183,347National and Community Service 0 350 350 350 350 350Prevention of Domestic Violence, Office for 666 685 685 685 685 685Temporary and Disability Assistance, Office of 4,901,401 4,994,836 4,921,689 4,784,765 4,689,114 4,717,227 Welfare Assistance 3,717,714 3,875,611 3,971,946 3,847,622 3,751,971 3,778,684 All Other 1,183,687 1,119,225 949,743 937,143 937,143 938,543 Functional Total 8,116,802 8,127,017 7,821,895 7,952,897 7,961,998 8,098,496
MENTAL HYGIENEAlcoholism and Substance Abuse Services, Office of 483,798 467,261 471,616 488,329 574,016 591,218 OASAS 434,709 434,581 438,936 455,649 541,336 558,538 OASAS - Other 49,089 32,680 32,680 32,680 32,680 32,680Mental Health, Office of 1,246,868 1,213,999 1,207,306 1,362,752 1,571,718 1,675,995 OMH 823,456 807,657 822,711 949,741 1,131,885 1,203,849 OMH - Other 423,412 406,342 384,595 413,011 439,833 472,146People with Developmental Disabilities, Office for 2,180,624 2,161,369 2,163,241 2,389,692 2,499,775 2,570,593 OPWDD 502,659 468,725 438,832 483,293 499,393 508,845 OPWDD - Other 1,677,965 1,692,644 1,724,409 1,906,399 2,000,382 2,061,748Quality of Care and Advocacy for Persons With Disabilities, Commission on 623 620 620 620 620 620 Functional Total 3,911,913 3,843,249 3,842,783 4,241,393 4,646,129 4,838,426
PUBLIC PROTECTION/CRIMINAL JUSTICECorrectional Services, Department of 10,624 6,086 6,051 6,000 6,000 6,000Corrections and Community Supervision Medicaid, Department of 0 0 11,500 11,500 11,500 12,500Criminal Justice Services, Division of 186,974 197,570 194,020 170,861 170,861 170,861Homeland Security and Emergency Services, Division of 326,323 428,872 511,412 523,207 511,232 464,991Indigent Legal Services, Office of 65,769 77,000 77,000 77,000 77,000 77,000Military and Naval Affairs, Division of 3,825 745 867 850 850 850Victim Services, Office of 62,560 58,310 58,310 58,310 58,310 58,310 Functional Total 656,075 768,583 859,160 847,728 835,753 790,512
HIGHER EDUCATIONCity University of New York 1,215,592 1,202,263 1,271,312 1,329,217 1,391,978 1,460,122Higher Education Facilities Capital Matching Grants Program 34,266 35,100 20,492 0 0 0Higher Education Services Corporation, New York State 872,756 923,861 950,933 1,001,349 1,014,412 1,025,891State University of New York 562,529 486,796 447,256 446,478 446,478 446,478 Functional Total 2,685,143 2,648,020 2,689,993 2,777,044 2,852,868 2,932,491
T-159

CASH DISBURSEMENTS BY FUNCTION ALL GOVERNMENTAL FUNDSLOCAL ASSISTANCE GRANTS
(thousands of dollars)
FY 2011Results
FY 2012Current
FY 2013Proposed
FY 2014Projected
FY 2015Projected
FY 2016Projected
EDUCATIONArts, Council on the 41,324 32,153 32,353 32,353 32,353 32,353Education, Department of 32,469,326 29,429,865 28,844,665 29,944,430 30,902,114 32,003,574 School Aid 26,487,723 23,331,298 22,844,673 23,500,406 24,262,532 25,266,021 STAR Property Tax Relief 3,234,014 3,292,520 3,322,067 3,508,375 3,690,726 3,792,568 Special Education Categorical Programs 2,159,415 2,149,928 1,997,636 2,135,616 2,244,216 2,340,616 All Other 588,174 656,119 680,289 800,033 704,640 604,369 Functional Total 32,510,650 29,462,018 28,877,018 29,976,783 30,934,467 32,035,927
GENERAL GOVERNMENTElections, State Board of 25,813 2,758 2,700 0 30,000 0General Services, Office of 28 282 269 250 250 250State, Department of 130,029 71,609 66,030 59,334 59,334 59,334Taxation and Finance, Department of 5,270 926 926 926 926 926Technology, Office for 2,086 1,245 0 0 0 0Veterans' Affairs, Division of 8,044 8,328 7,967 7,397 7,457 7,517 Functional Total 171,270 85,148 77,892 67,907 97,967 68,027
ELECTED OFFICIALSAudit and Control, Department of 31,598 32,024 32,024 32,024 32,024 32,024Judiciary 119,798 106,645 106,700 121,700 121,700 121,700 Functional Total 151,396 138,669 138,724 153,724 153,724 153,724
LOCAL GOVERNMENT ASSISTANCEAid and Incentives for Municipalities 738,940 721,192 740,555 757,414 772,589 775,357Efficiency Incentive Grants Program 4,604 9,127 7,823 1,205 0 0Miscellaneous Financial Assistance 3,920 1,960 1,960 1,960 1,960 1,960Municipalities with VLT Facilities 25,800 25,867 25,867 25,867 25,867 25,867Small Government Assistance 2,066 218 218 218 218 218 Functional Total 775,330 758,364 776,423 786,664 800,634 803,402
ALL OTHER CATEGORIESMiscellaneous (326,844) (107,154) 99,201 88,171 90,171 166,079 Functional Total (326,844) (107,154) 99,201 88,171 90,171 166,079
TOTAL LOCAL ASSISTANCE GRANTS SPENDING 98,633,455 95,821,679 95,184,959 99,677,479 105,593,820 110,080,139
T-160

CASH DISBURSEMENTS BY FUNCTION ALL GOVERNMENTAL FUNDS
STATE OPERATIONS(thousands of dollars)
FY 2011Results
FY 2012Current
FY 2013Proposed
FY 2014Projected
FY 2015Projected
FY 2016Projected
ECONOMIC DEVELOPMENT AND GOVERNMENT OVERSIGHTAgriculture and Markets, Department of 70,045 67,949 63,821 65,844 67,914 68,849Alcoholic Beverage Control, Division of 12,581 12,904 13,629 13,823 14,020 14,221Economic Development, Department of 20,444 35,034 22,641 22,872 23,475 23,730Energy Research and Development Authority 4,744 5,180 5,286 5,396 5,396 5,396Financial Services, Department of 212,412 204,425 204,123 206,774 209,007 211,596Olympic Regional Development Authority 3,534 3,331 3,079 3,206 3,288 3,288Public Service Department 54,403 51,930 54,176 57,200 59,151 61,032Racing and Wagering Board, State 18,056 14,809 15,194 15,226 15,333 15,568 Functional Total 396,219 395,562 381,949 390,341 397,584 403,680
PARKS AND THE ENVIRONMENTAdirondack Park Agency 4,718 4,544 4,496 4,525 4,601 4,687Environmental Conservation, Department of 302,256 267,401 265,177 268,187 269,598 272,808Environmental Facilities Corporation 7,122 7,155 0 0 0 0Parks, Recreation and Historic Preservation, Office of 180,237 171,950 162,434 165,280 167,560 169,535 Functional Total 494,333 451,050 432,107 437,992 441,759 447,030
TRANSPORTATIONMotor Vehicles, Department of 71,816 73,114 75,636 77,782 79,538 81,521Transportation, Department of 40,374 44,089 31,540 32,310 33,050 33,854 Functional Total 112,190 117,203 107,176 110,092 112,588 115,375
HEALTHAging, Office for the 9,828 9,763 9,786 9,870 10,091 10,304Health, Department of 773,822 781,008 794,645 842,740 866,136 871,899 Medical Assistance 23,247 46,355 52,855 56,355 55,855 55,855 Public Health 750,575 734,653 741,790 786,385 810,281 816,044Medicaid Inspector General, Office of the 57,844 58,281 55,503 56,776 59,241 60,200Stem Cell and Innovation 36,971 45,000 50,000 63,673 61,373 50,000 Functional Total 878,465 894,052 909,934 973,059 996,841 992,403
SOCIAL WELFAREChildren and Family Services, Office of 404,378 395,888 420,539 410,847 400,087 397,487 OCFS 404,378 395,888 420,539 410,847 400,087 397,487Housing and Community Renewal, Division of 71,483 63,770 58,650 59,184 60,437 62,297Human Rights, Division of 18,092 15,639 14,726 14,938 15,395 15,871Labor, Department of 407,013 349,291 327,630 313,755 318,846 324,555National and Community Service 24,731 14,249 14,251 14,337 14,559 14,559Prevention of Domestic Violence, Office for 1,280 1,279 1,409 1,426 1,468 1,517Temporary and Disability Assistance, Office of 329,230 345,229 355,827 359,354 373,034 375,574 All Other 329,230 345,229 355,827 359,354 373,034 375,574Welfare Inspector General, Office of 1,094 1,177 1,186 1,206 1,234 1,244Workers' Compensation Board 155,557 161,893 156,680 153,359 156,256 159,533 Functional Total 1,412,858 1,348,415 1,350,898 1,328,406 1,341,316 1,352,637
MENTAL HYGIENEAlcoholism and Substance Abuse Services, Office of 86,147 83,056 80,982 82,491 84,804 88,670 OASAS 39,783 35,585 34,429 34,843 35,357 36,287 OASAS - Other 46,364 47,471 46,553 47,648 49,447 52,383Developmental Disabilities Planning Council 2,894 3,580 3,665 3,551 3,489 3,441Mental Health, Office of 1,456,425 1,397,666 1,395,025 1,449,587 1,517,026 1,578,270 OMH 483,127 316,750 370,996 374,777 392,859 400,091 OMH - Other 973,298 1,080,916 1,024,029 1,074,810 1,124,167 1,178,179Mental Hygiene, Department of 345 0 0 0 0 0People with Developmental Disabilities, Office for 1,550,398 1,548,757 1,519,259 1,577,484 1,614,462 1,700,295 OPWDD 1,686 53,632 33,782 34,658 34,658 34,658 OPWDD - Other 1,548,712 1,495,125 1,485,477 1,542,826 1,579,804 1,665,637Quality of Care and Advocacy for Persons With Disabilities, Commission on 12,393 12,536 13,540 14,378 14,716 15,089 Functional Total 3,108,602 3,045,595 3,012,471 3,127,491 3,234,497 3,385,765
PUBLIC PROTECTION/CRIMINAL JUSTICECorrection, Commission of 2,419 2,733 2,672 2,711 2,787 2,864Correctional Services, Department of 2,604,952 2,499,559 2,418,757 2,468,990 2,521,684 2,651,905Criminal Justice Services, Division of 82,243 88,933 87,606 83,557 81,450 83,043Homeland Security and Emergency Services, Division of 28,612 66,887 61,978 50,296 46,984 48,273Indigent Legal Services, Office of 25,024 1,141 1,134 1,151 1,167 1,183Judicial Commissions 4,944 5,150 5,452 5,577 5,795 5,990Military and Naval Affairs, Division of 63,905 63,077 60,402 61,878 62,359 62,953Public Security and Emergency Response 0 600 600 600 600 600State Police, Division of 679,514 664,568 655,592 657,096 662,561 675,545Statewide Financial System 9,069 40,638 50,201 51,525 52,826 54,164Statewide Wireless Network 27,655 0 0 0 0 0
T-161

CASH DISBURSEMENTS BY FUNCTION ALL GOVERNMENTAL FUNDS
STATE OPERATIONS(thousands of dollars)
FY 2011Results
FY 2012Current
FY 2013Proposed
FY 2014Projected
FY 2015Projected
FY 2016Projected
Victim Services, Office of 6,074 6,803 6,784 6,879 7,054 7,272 Functional Total 3,534,411 3,440,089 3,351,178 3,390,260 3,445,267 3,593,792
HIGHER EDUCATIONCity University of New York 117,099 136,747 119,812 121,335 122,895 124,518Higher Education - Miscellaneous 255 220 1,201 1,201 1,201 1,201Higher Education Services Corporation, New York State 69,013 87,108 75,613 76,942 78,609 80,454State University Construction Fund 14,438 18,579 0 0 0 0State University of New York 5,199,205 5,382,832 5,533,330 5,689,809 5,855,504 6,023,822 Functional Total 5,400,010 5,625,486 5,729,956 5,889,287 6,058,209 6,229,995
EDUCATIONArts, Council on the 4,694 4,525 4,220 4,222 4,268 4,318Education, Department of 282,877 319,216 334,127 406,561 348,905 280,712 All Other 282,877 319,216 334,127 406,561 348,905 280,712 Functional Total 287,571 323,741 338,347 410,783 353,173 285,030
GENERAL GOVERNMENTBudget, Division of the 32,081 34,266 34,963 36,117 38,584 39,570Civil Service, Department of 17,677 15,104 14,736 17,143 17,603 18,003Deferred Compensation Board 519 598 605 615 633 642Elections, State Board of 67,860 53,199 4,949 5,179 5,316 5,462Employee Relations, Office of 3,000 2,760 2,688 2,710 2,786 2,869General Services, Office of 134,592 133,441 152,951 143,366 138,188 141,074Inspector General, Office of the 5,703 5,493 6,610 6,717 6,970 7,196Labor Management Committees 32,335 35,300 30,470 33,074 35,189 38,316Lottery, Division of the 152,955 162,440 151,835 155,197 159,080 159,478Public Employment Relations Board 3,988 3,884 3,731 3,857 3,804 3,896Public Integrity, Commission on 3,794 3,401 4,016 4,061 4,175 4,295Regulatory Reform, Governor's Office of 1,653 0 0 0 0 0State, Department of 46,241 51,045 52,688 54,130 55,419 56,159Tax Appeals, Division of 3,134 3,057 3,101 2,813 2,894 2,948Taxation and Finance, Department of 413,082 385,104 393,361 395,014 406,135 412,850Technology, Office for 26,372 22,799 23,280 21,591 24,191 23,803Veterans' Affairs, Division of 6,893 6,604 6,779 6,884 7,058 7,254 Functional Total 951,879 918,495 886,763 888,468 908,025 923,815
ELECTED OFFICIALSAudit and Control, Department of 138,841 139,405 139,394 142,190 145,658 149,721Executive Chamber 12,880 13,926 13,578 13,836 14,773 15,185Judiciary 1,874,663 1,841,380 1,863,400 1,921,914 2,007,452 2,102,994Law, Department of 185,050 187,648 189,710 190,541 195,195 200,423Legislature 222,536 218,795 218,795 221,349 223,945 226,583Lieutenant Governor, Office of the 304 630 614 614 665 680 Functional Total 2,434,274 2,401,784 2,425,491 2,490,444 2,587,688 2,695,586
ALL OTHER CATEGORIESGeneral State Charges 5,561 0 0 0 0 0Long-Term Debt Service 62,846 60,527 46,925 46,925 46,925 46,925Miscellaneous 4,886 (333,447) (353,236) (554,302) (551,326) (444,792) Functional Total 73,293 (272,920) (306,311) (507,377) (504,401) (397,867)
TOTAL STATE OPERATIONS SPENDING 19,084,105 18,688,552 18,619,959 18,929,246 19,372,546 20,027,241
T-162

CASH DISBURSEMENTS BY FUNCTION ALL GOVERNMENTAL FUNDS
PERSONAL SERVICE(thousands of dollars)
FY 2011Results
FY 2012Current
FY 2013Proposed
FY 2014Projected
FY 2015Projected
FY 2016Projected
ECONOMIC DEVELOPMENT AND GOVERNMENT OVERSIGHTAgriculture and Markets, Department of 33,711 30,795 30,666 31,920 33,049 33,720Alcoholic Beverage Control, Division of 8,512 7,833 8,185 8,246 8,308 8,370Economic Development, Department of 13,906 11,227 12,704 13,087 13,424 13,679Energy Research and Development Authority 2,894 3,365 3,432 3,501 3,501 3,501Financial Services, Department of 152,126 134,149 133,847 136,495 138,669 141,191Olympic Regional Development Authority 2,890 2,485 2,485 2,522 2,548 2,548Public Service Department 43,289 40,939 43,266 46,003 47,658 49,431Racing and Wagering Board, State 12,062 9,335 9,059 9,058 9,133 9,368 Functional Total 269,390 240,128 243,644 250,832 256,290 261,808
PARKS AND THE ENVIRONMENTAdirondack Park Agency 4,234 3,753 3,791 3,820 3,896 3,982Environmental Conservation, Department of 210,874 191,404 191,587 193,545 196,895 200,218Environmental Facilities Corporation 6,060 6,185 0 0 0 0Parks, Recreation and Historic Preservation, Office of 136,484 125,191 124,306 127,152 128,772 130,747 Functional Total 357,652 326,533 319,684 324,517 329,563 334,947
TRANSPORTATIONMotor Vehicles, Department of 52,897 49,750 51,180 52,820 53,981 55,348Transportation, Department of 15,310 14,031 14,748 15,109 15,463 15,856 Functional Total 68,207 63,781 65,928 67,929 69,444 71,204
HEALTHAging, Office for the 8,323 8,563 8,586 8,660 8,871 9,084Health, Department of 346,559 335,294 341,175 363,707 376,987 383,769 Medical Assistance 500 500 500 500 500 500 Public Health 346,059 334,794 340,675 363,207 376,487 383,269Medicaid Inspector General, Office of the 41,629 39,536 36,758 37,700 39,442 40,375Stem Cell and Innovation 534 0 0 0 0 0 Functional Total 397,045 383,393 386,519 410,067 425,300 433,228
SOCIAL WELFAREChildren and Family Services, Office of 220,446 205,854 219,041 202,734 192,493 191,326 OCFS 220,446 205,854 219,041 202,734 192,493 191,326Housing and Community Renewal, Division of 55,025 48,646 45,921 46,246 47,286 48,987Human Rights, Division of 14,686 13,206 12,571 12,666 13,038 13,451Labor, Department of 249,256 216,606 199,425 194,086 198,807 204,258National and Community Service 661 562 564 650 657 657Prevention of Domestic Violence, Office for 1,088 1,133 1,313 1,324 1,359 1,397Temporary and Disability Assistance, Office of 166,482 162,250 168,368 171,424 178,551 183,643 All Other 166,482 162,250 168,368 171,424 178,551 183,643Welfare Inspector General, Office of 434 701 701 721 738 748Workers' Compensation Board 89,052 87,031 89,130 90,328 92,301 94,633 Functional Total 797,130 735,989 737,034 720,179 725,230 739,100
MENTAL HYGIENEAlcoholism and Substance Abuse Services, Office of 63,547 62,198 60,480 62,005 63,773 67,080 OASAS 29,054 23,536 22,810 23,236 23,468 24,111 OASAS - Other 34,493 38,662 37,670 38,769 40,305 42,969Developmental Disabilities Planning Council 1,190 1,197 1,197 1,211 1,230 1,253Mental Health, Office of 1,145,365 1,102,648 1,105,093 1,135,660 1,184,063 1,243,532 OMH 405,883 252,633 291,423 292,157 310,597 317,519 OMH - Other 739,482 850,015 813,670 843,503 873,466 926,013People with Developmental Disabilities, Office for 1,168,238 1,125,772 1,122,766 1,166,684 1,192,968 1,268,661 OPWDD 42 116 116 116 116 116 OPWDD - Other 1,168,196 1,125,656 1,122,650 1,166,568 1,192,852 1,268,545Quality of Care and Advocacy for Persons With Disabilities, Commission on 7,012 6,895 7,731 8,392 8,587 8,799 Functional Total 2,385,352 2,298,710 2,297,267 2,373,952 2,450,621 2,589,325
PUBLIC PROTECTION/CRIMINAL JUSTICECorrection, Commission of 2,082 2,319 2,398 2,414 2,481 2,548Correctional Services, Department of 2,072,488 1,983,905 1,945,131 1,975,773 2,007,958 2,116,739Criminal Justice Services, Division of 45,227 43,172 42,053 39,117 40,100 41,226Homeland Security and Emergency Services, Division of 12,781 21,531 21,646 21,811 22,427 23,127Indigent Legal Services, Office of 8 750 794 802 810 818Judicial Commissions 3,723 3,791 4,093 4,124 4,237 4,357Military and Naval Affairs, Division of 41,684 38,868 38,825 39,156 39,489 39,931Public Security and Emergency Response 0 600 600 600 600 600State Police, Division of 590,458 569,500 573,637 573,673 577,636 585,610Statewide Financial System 3,977 9,139 10,814 10,895 10,977 11,060Statewide Wireless Network 8,076 0 0 0 0 0Victim Services, Office of 4,950 5,264 5,366 5,446 5,604 5,805 Functional Total 2,785,454 2,678,839 2,645,357 2,673,811 2,712,319 2,831,821
T-163

CASH DISBURSEMENTS BY FUNCTION ALL GOVERNMENTAL FUNDS
PERSONAL SERVICE(thousands of dollars)
FY 2011Results
FY 2012Current
FY 2013Proposed
FY 2014Projected
FY 2015Projected
FY 2016Projected
HIGHER EDUCATIONCity University of New York 85,732 96,651 85,125 85,763 86,406 87,055Higher Education - Miscellaneous 221 175 198 198 198 198Higher Education Services Corporation, New York State 32,916 32,970 31,002 31,390 32,083 32,894State University Construction Fund 12,562 15,544 0 0 0 0State University of New York 3,248,683 3,258,458 3,348,107 3,445,001 3,557,311 3,671,279 Functional Total 3,380,114 3,403,798 3,464,432 3,562,352 3,675,998 3,791,426
EDUCATIONArts, Council on the 3,098 2,300 2,298 2,300 2,346 2,396Education, Department of 175,944 166,632 166,828 168,752 171,262 172,475 All Other 175,944 166,632 166,828 168,752 171,262 172,475 Functional Total 179,042 168,932 169,126 171,052 173,608 174,871
GENERAL GOVERNMENTBudget, Division of the 24,430 23,915 24,961 25,768 27,287 28,166Civil Service, Department of 16,153 13,650 13,247 15,359 15,714 16,109Deferred Compensation Board 374 390 392 396 408 417Elections, State Board of 4,374 4,144 4,144 4,254 4,370 4,495Employee Relations, Office of 2,909 2,625 2,551 2,570 2,646 2,728General Services, Office of 56,079 48,664 51,886 51,859 52,985 54,378Inspector General, Office of the 5,519 4,990 6,083 6,129 6,301 6,485Labor Management Committees 9,872 5,500 5,500 5,504 6,119 6,366Lottery, Division of the 21,057 21,738 24,864 25,029 25,495 25,893Public Employment Relations Board 3,456 3,182 3,290 3,119 3,046 3,138Public Integrity, Commission on 3,017 2,651 3,166 3,190 3,282 3,380Regulatory Reform, Governor's Office of 1,537 0 0 0 0 0State, Department of 34,671 32,588 34,848 35,868 36,702 37,431Tax Appeals, Division of 2,776 2,736 2,900 2,601 2,673 2,727Taxation and Finance, Department of 323,769 297,866 301,881 300,966 309,755 316,470Technology, Office for 11,208 10,851 13,786 13,795 14,121 14,464Veterans' Affairs, Division of 6,232 5,625 5,807 5,890 6,041 6,212 Functional Total 527,433 481,115 499,306 502,297 516,945 528,859
ELECTED OFFICIALSAudit and Control, Department of 110,320 103,442 108,671 109,385 112,012 115,214Executive Chamber 10,963 10,695 11,338 11,495 12,238 12,589Judiciary 1,526,975 1,463,935 1,468,250 1,514,284 1,561,492 1,618,742Law, Department of 129,276 123,659 130,394 130,602 133,947 137,628Legislature 174,096 165,284 165,284 166,524 167,773 169,031Lieutenant Governor, Office of the 281 480 480 494 515 543 Functional Total 1,951,911 1,867,495 1,884,417 1,932,784 1,987,977 2,053,747
ALL OTHER CATEGORIESGeneral State Charges 3,835 0 0 0 0 0Miscellaneous 2,217 (130,164) (146,918) (196,385) (195,109) (138,621) Functional Total 6,052 (130,164) (146,918) (196,385) (195,109) (138,621)
TOTAL PERSONAL SERVICE SPENDING 13,104,782 12,518,549 12,565,796 12,793,387 13,128,186 13,671,715
T-164

CASH DISBURSEMENTS BY FUNCTION ALL GOVERNMENTAL FUNDS
NON-PERSONAL SERVICE/INDIRECT COSTS(thousands of dollars)
FY 2011Results
FY 2012Current
FY 2013Proposed
FY 2014Projected
FY 2015Projected
FY 2016Projected
ECONOMIC DEVELOPMENT AND GOVERNMENT OVERSIGHTAgriculture and Markets, Department of 36,334 37,154 33,155 33,924 34,865 35,129Alcoholic Beverage Control, Division of 4,069 5,071 5,444 5,577 5,712 5,851Economic Development, Department of 6,538 23,807 9,937 9,785 10,051 10,051Energy Research and Development Authority 1,850 1,815 1,854 1,895 1,895 1,895Financial Services, Department of 60,286 70,276 70,276 70,279 70,338 70,405Olympic Regional Development Authority 644 846 594 684 740 740Public Service Department 11,114 10,991 10,910 11,197 11,493 11,601Racing and Wagering Board, State 5,994 5,474 6,135 6,168 6,200 6,200 Functional Total 126,829 155,434 138,305 139,509 141,294 141,872
PARKS AND THE ENVIRONMENTAdirondack Park Agency 484 791 705 705 705 705Environmental Conservation, Department of 91,382 75,997 73,590 74,642 72,703 72,590Environmental Facilities Corporation 1,062 970 0 0 0 0Parks, Recreation and Historic Preservation, Office of 43,753 46,759 38,128 38,128 38,788 38,788 Functional Total 136,681 124,517 112,423 113,475 112,196 112,083
TRANSPORTATIONMotor Vehicles, Department of 18,919 23,364 24,456 24,962 25,557 26,173Transportation, Department of 25,064 30,058 16,792 17,201 17,587 17,998 Functional Total 43,983 53,422 41,248 42,163 43,144 44,171
HEALTHAging, Office for the 1,505 1,200 1,200 1,210 1,220 1,220Health, Department of 427,263 445,714 453,470 479,033 489,149 488,130 Medical Assistance 22,747 45,855 52,355 55,855 55,355 55,355 Public Health 404,516 399,859 401,115 423,178 433,794 432,775Medicaid Inspector General, Office of the 16,215 18,745 18,745 19,076 19,799 19,825Stem Cell and Innovation 36,437 45,000 50,000 63,673 61,373 50,000 Functional Total 481,420 510,659 523,415 562,992 571,541 559,175
SOCIAL WELFAREChildren and Family Services, Office of 183,932 190,034 201,498 208,113 207,594 206,161 OCFS 183,932 190,034 201,498 208,113 207,594 206,161Housing and Community Renewal, Division of 16,458 15,124 12,729 12,938 13,151 13,310Human Rights, Division of 3,406 2,433 2,155 2,272 2,357 2,420Labor, Department of 157,757 132,685 128,205 119,669 120,039 120,297National and Community Service 24,070 13,687 13,687 13,687 13,902 13,902Prevention of Domestic Violence, Office for 192 146 96 102 109 120Temporary and Disability Assistance, Office of 162,748 182,979 187,459 187,930 194,483 191,931 All Other 162,748 182,979 187,459 187,930 194,483 191,931Welfare Inspector General, Office of 660 476 485 485 496 496Workers' Compensation Board 66,505 74,862 67,550 63,031 63,955 64,900 Functional Total 615,728 612,426 613,864 608,227 616,086 613,537
MENTAL HYGIENEAlcoholism and Substance Abuse Services, Office of 22,600 20,858 20,502 20,486 21,031 21,590 OASAS 10,729 12,049 11,619 11,607 11,889 12,176 OASAS - Other 11,871 8,809 8,883 8,879 9,142 9,414Developmental Disabilities Planning Council 1,704 2,383 2,468 2,340 2,259 2,188Mental Health, Office of 311,060 295,018 289,932 313,927 332,963 334,738 OMH 77,244 64,117 79,573 82,620 82,262 82,572 OMH - Other 233,816 230,901 210,359 231,307 250,701 252,166Mental Hygiene, Department of 345 0 0 0 0 0People with Developmental Disabilities, Office for 382,160 422,985 396,493 410,800 421,494 431,634 OPWDD 1,644 53,516 33,666 34,542 34,542 34,542 OPWDD - Other 380,516 369,469 362,827 376,258 386,952 397,092Quality of Care and Advocacy for Persons With Disabilities, Commission on 5,381 5,641 5,809 5,986 6,129 6,290 Functional Total 723,250 746,885 715,204 753,539 783,876 796,440
PUBLIC PROTECTION/CRIMINAL JUSTICECorrection, Commission of 337 414 274 297 306 316Correctional Services, Department of 532,464 515,654 473,626 493,217 513,726 535,166Criminal Justice Services, Division of 37,016 45,761 45,553 44,440 41,350 41,817Homeland Security and Emergency Services, Division of 15,831 45,356 40,332 28,485 24,557 25,146Indigent Legal Services, Office of 25,016 391 340 349 357 365Judicial Commissions 1,221 1,359 1,359 1,453 1,558 1,633Military and Naval Affairs, Division of 22,221 24,209 21,577 22,722 22,870 23,022State Police, Division of 89,056 95,068 81,955 83,423 84,925 89,935Statewide Financial System 5,092 31,499 39,387 40,630 41,849 43,104Statewide Wireless Network 19,579 0 0 0 0 0Victim Services, Office of 1,124 1,539 1,418 1,433 1,450 1,467 Functional Total 748,957 761,250 705,821 716,449 732,948 761,971
T-165

CASH DISBURSEMENTS BY FUNCTION ALL GOVERNMENTAL FUNDS
NON-PERSONAL SERVICE/INDIRECT COSTS(thousands of dollars)
FY 2011Results
FY 2012Current
FY 2013Proposed
FY 2014Projected
FY 2015Projected
FY 2016Projected
HIGHER EDUCATIONCity University of New York 31,367 40,096 34,687 35,572 36,489 37,463Higher Education - Miscellaneous 34 45 1,003 1,003 1,003 1,003Higher Education Services Corporation, New York State 36,097 54,138 44,611 45,552 46,526 47,560State University Construction Fund 1,876 3,035 0 0 0 0State University of New York 1,950,522 2,124,374 2,185,223 2,244,808 2,298,193 2,352,543 Functional Total 2,019,896 2,221,688 2,265,524 2,326,935 2,382,211 2,438,569
EDUCATIONArts, Council on the 1,596 2,225 1,922 1,922 1,922 1,922Education, Department of 106,933 152,584 167,299 237,809 177,643 108,237 All Other 106,933 152,584 167,299 237,809 177,643 108,237 Functional Total 108,529 154,809 169,221 239,731 179,565 110,159
GENERAL GOVERNMENTBudget, Division of the 7,651 10,351 10,002 10,349 11,297 11,404Civil Service, Department of 1,524 1,454 1,489 1,784 1,889 1,894Deferred Compensation Board 145 208 213 219 225 225Elections, State Board of 63,486 49,055 805 925 946 967Employee Relations, Office of 91 135 137 140 140 141General Services, Office of 78,513 84,777 101,065 91,507 85,203 86,696Inspector General, Office of the 184 503 527 588 669 711Labor Management Committees 22,463 29,800 24,970 27,570 29,070 31,950Lottery, Division of the 131,898 140,702 126,971 130,168 133,585 133,585Public Employment Relations Board 532 702 441 738 758 758Public Integrity, Commission on 777 750 850 871 893 915Regulatory Reform, Governor's Office of 116 0 0 0 0 0State, Department of 11,570 18,457 17,840 18,262 18,717 18,728Tax Appeals, Division of 358 321 201 212 221 221Taxation and Finance, Department of 89,313 87,238 91,480 94,048 96,380 96,380Technology, Office for 15,164 11,948 9,494 7,796 10,070 9,339Veterans' Affairs, Division of 661 979 972 994 1,017 1,042 Functional Total 424,446 437,380 387,457 386,171 391,080 394,956
ELECTED OFFICIALSAudit and Control, Department of 28,521 35,963 30,723 32,805 33,646 34,507Executive Chamber 1,917 3,231 2,240 2,341 2,535 2,596Judiciary 347,688 377,445 395,150 407,630 445,960 484,252Law, Department of 55,774 63,989 59,316 59,939 61,248 62,795Legislature 48,440 53,511 53,511 54,825 56,172 57,552Lieutenant Governor, Office of the 23 150 134 120 150 137 Functional Total 482,363 534,289 541,074 557,660 599,711 641,839
ALL OTHER CATEGORIESGeneral State Charges 1,726 0 0 0 0 0Long-Term Debt Service 62,846 60,527 46,925 46,925 46,925 46,925Miscellaneous 2,669 (203,283) (206,318) (357,917) (356,217) (306,171) Functional Total 67,241 (142,756) (159,393) (310,992) (309,292) (259,246)
TOTAL NON-PERSONAL SERVICE/INDIRECT COSTS SPENDING 5,979,323 6,170,003 6,054,163 6,135,859 6,244,360 6,355,526
T-166

CASH DISBURSEMENTS BY FUNCTION ALL GOVERNMENTAL FUNDSGENERAL STATE CHARGES
(thousands of dollars)
FY 2011Results
FY 2012Current
FY 2013Proposed
FY 2014Projected
FY 2015Projected
FY 2016Projected
ECONOMIC DEVELOPMENT AND GOVERNMENT OVERSIGHTAgriculture and Markets, Department of 5,749 6,071 3,211 3,527 3,921 3,985Alcoholic Beverage Control, Division of 4,125 3,753 4,230 4,491 4,761 5,004Economic Development, Department of 21 28 28 28 28 28Energy Research and Development Authority 1,406 1,583 1,638 1,758 1,758 1,758Financial Services, Department of 66,829 66,928 66,930 66,986 68,236 69,800Public Service Department 20,885 19,578 22,355 25,044 27,302 29,510Racing and Wagering Board, State 3,517 2,728 3,054 3,287 3,512 3,512 Functional Total 102,532 100,669 101,446 105,121 109,518 113,597
PARKS AND THE ENVIRONMENTEnvironmental Conservation, Department of 47,382 44,301 45,386 44,658 45,650 46,778Environmental Facilities Corporation 2,268 3,122 0 0 0 0Parks, Recreation and Historic Preservation, Office of 2,719 4,193 4,193 4,338 4,511 4,564 Functional Total 52,369 51,616 49,579 48,996 50,161 51,342
TRANSPORTATIONMotor Vehicles, Department of 27,958 23,779 26,431 28,758 30,928 33,082Transportation, Department of 2,519 10,355 7,480 8,167 8,760 9,365 Functional Total 30,477 34,134 33,911 36,925 39,688 42,447
HEALTHAging, Office for the 0 235 235 235 235 235Health, Department of 60,449 63,602 66,368 69,626 71,502 73,820 Public Health 60,449 63,602 66,368 69,626 71,502 73,820Medicaid Inspector General, Office of the 8,999 10,738 10,738 10,749 10,980 11,264Stem Cell and Innovation 318 0 0 0 0 0 Functional Total 69,766 74,575 77,341 80,610 82,717 85,319
SOCIAL WELFAREChildren and Family Services, Office of 12,215 12,579 12,579 11,717 12,059 12,478 OCFS 12,215 12,579 12,579 11,717 12,059 12,478Housing and Community Renewal, Division of 19,849 18,766 19,190 20,467 21,869 22,727Human Rights, Division of 1,047 2,530 2,912 3,066 2,997 3,020Labor, Department of 107,407 137,953 153,238 157,115 157,704 158,001Temporary and Disability Assistance, Office of 47,451 53,429 44,123 44,463 44,973 44,973 All Other 47,451 53,429 44,123 44,463 44,973 44,973Welfare Inspector General, Office of 56 214 221 221 222 224Workers' Compensation Board 43,152 41,697 46,062 49,193 52,898 56,581 Functional Total 231,177 267,168 278,325 286,242 292,722 298,004
MENTAL HYGIENEAlcoholism and Substance Abuse Services, Office of 28,419 28,264 30,939 33,142 35,966 39,584 OASAS 12,184 12,307 11,618 12,393 13,209 14,198 OASAS - Other 16,235 15,957 19,321 20,749 22,757 25,386Developmental Disabilities Planning Council 0 620 535 649 711 758Mental Health, Office of 559,910 515,950 563,280 608,536 665,517 733,209 OMH 198,566 128,197 130,653 156,789 173,092 187,495 OMH - Other 361,344 387,753 432,627 451,747 492,425 545,714People with Developmental Disabilities, Office for 580,009 533,530 594,170 647,312 698,595 767,948 OPWDD 19 62 70 74 74 74 OPWDD - Other 579,990 533,468 594,100 647,238 698,521 767,874Quality of Care and Advocacy for Persons With Disabilities, Commission on 1,692 1,874 2,036 2,208 2,392 2,574 Functional Total 1,170,030 1,080,238 1,190,960 1,291,847 1,403,181 1,544,073
PUBLIC PROTECTION/CRIMINAL JUSTICECorrectional Services, Department of 2,757 1,415 1,415 1,415 1,415 1,415Criminal Justice Services, Division of 252 401 395 409 445 482Homeland Security and Emergency Services, Division of 3,112 3,617 3,621 3,621 3,621 3,621Indigent Legal Services, Office of 0 359 410 437 464 489Military and Naval Affairs, Division of 8,228 6,749 6,749 6,749 6,749 6,749State Police, Division of 21,329 19,944 22,857 24,073 25,230 26,230Statewide Financial System 1 0 0 0 0 0Statewide Wireless Network 598 0 0 0 0 0Victim Services, Office of 888 1,925 2,103 2,213 2,326 2,428 Functional Total 37,165 34,410 37,550 38,917 40,250 41,414
HIGHER EDUCATIONCity University of New York 6,400 6,541 6,685 6,833 6,833 6,833Higher Education - Miscellaneous 115 135 99 99 99 99Higher Education Services Corporation, New York State 14,885 13,785 15,550 16,782 17,756 18,642State University Construction Fund 4,477 7,593 0 0 0 0State University of New York 528,116 498,813 500,980 516,493 548,542 548,542 Functional Total 553,993 526,867 523,314 540,207 573,230 574,116
T-167

CASH DISBURSEMENTS BY FUNCTION ALL GOVERNMENTAL FUNDSGENERAL STATE CHARGES
(thousands of dollars)
FY 2011Results
FY 2012Current
FY 2013Proposed
FY 2014Projected
FY 2015Projected
FY 2016Projected
EDUCATIONEducation, Department of 64,236 64,924 72,560 77,975 83,675 87,101 All Other 64,236 64,924 72,560 77,975 83,675 87,101 Functional Total 64,236 64,924 72,560 77,975 83,675 87,101
GENERAL GOVERNMENTBudget, Division of the 1,744 2,079 2,297 2,650 2,874 3,094Civil Service, Department of 219 219 168 168 172 176Deferred Compensation Board 162 176 191 208 225 225Elections, State Board of 0 115 0 0 0 0General Services, Office of 1,290 2,144 1,901 2,002 2,144 2,284Lottery, Division of the 9,955 11,465 13,055 13,879 13,978 13,978State, Department of 10,286 9,662 11,211 12,190 13,288 13,578Taxation and Finance, Department of 23,256 18,858 21,522 22,820 23,047 23,047Technology, Office for 0 500 500 500 500 500Veterans' Affairs, Division of 431 350 350 350 350 350 Functional Total 47,343 45,568 51,195 54,767 56,578 57,232
ELECTED OFFICIALSAudit and Control, Department of 1,382 2,741 2,061 1,522 1,633 1,744Judiciary 551,599 606,298 584,398 643,830 683,352 717,306Law, Department of 15,662 18,149 22,638 23,711 25,092 26,406 Functional Total 568,643 627,188 609,097 669,063 710,077 745,456
ALL OTHER CATEGORIESGeneral State Charges 3,426,460 3,920,304 3,671,935 4,001,489 4,306,959 4,564,805Miscellaneous 6,898 5,752 5,809 5,947 6,080 6,203 Functional Total 3,433,358 3,926,056 3,677,744 4,007,436 4,313,039 4,571,008
TOTAL GENERAL STATE CHARGES SPENDING 6,361,089 6,833,413 6,703,022 7,238,106 7,754,836 8,211,109
T-168

CASH DISBURSEMENTS BY FUNCTION ALL GOVERNMENTAL FUNDS
CAPITAL PROJECTS(thousands of dollars)
FY 2011Results
FY 2012Current
FY 2013Proposed
FY 2014Projected
FY 2015Projected
FY 2016Projected
ECONOMIC DEVELOPMENT AND GOVERNMENT OVERSIGHTAgriculture and Markets, Department of 5,205 19,214 14,506 9,277 7,330 3,500Economic Development Capital (427) 19,600 12,500 12,500 5,000 5,000Economic Development, Department of 7,991 46,174 29,381 32,645 19,859 15,000Empire State Development Corporation 4,810 146,471 77,565 112,602 135,003 85,832Energy Research and Development Authority 16,403 13,600 13,200 14,790 14,790 14,790Regional Economic Development Program 0 5,900 2,500 2,500 1,500 1,500Strategic Investment Program 3,561 4,000 5,000 5,000 5,000 5,000 Functional Total 37,543 254,959 154,652 189,314 188,482 130,622
PARKS AND THE ENVIRONMENTEnvironmental Conservation, Department of 305,327 377,126 373,442 362,631 335,559 301,102Environmental Facilities Corporation 356 343 0 0 0 0Hudson River Park Trust 15,216 6,400 3,816 0 0 0Parks, Recreation and Historic Preservation, Office of 58,361 43,798 95,341 68,627 55,940 42,228 Functional Total 379,260 427,667 472,599 431,258 391,499 343,330
TRANSPORTATIONMetropolitan Transportation Authority 0 0 150,000 0 0 310,000Motor Vehicles, Department of 204,814 184,707 186,693 194,948 202,058 209,772Thruway Authority, New York State 0 1,800 1,800 1,800 1,800 1,800Transportation, Department of 3,082,367 2,851,550 3,048,288 3,138,910 2,886,300 2,555,158 Functional Total 3,287,181 3,038,057 3,386,781 3,335,658 3,090,158 3,076,730
HEALTHHealth, Department of 7,468 13,500 13,500 13,500 13,500 13,500 Public Health 7,468 13,500 13,500 13,500 13,500 13,500 Functional Total 7,468 13,500 13,500 13,500 13,500 13,500
SOCIAL WELFAREChildren and Family Services, Office of 18,245 20,900 20,900 20,900 20,900 20,900 OCFS 18,245 20,900 20,900 20,900 20,900 20,900Housing and Community Renewal, Division of 3,000 3,000 3,000 3,002 3,002 3,004 Functional Total 21,245 23,900 23,900 23,902 23,902 23,904
MENTAL HYGIENEAlcoholism and Substance Abuse Services, Office of 1,678 8,968 9,880 13,196 13,083 13,083 OASAS 1,678 8,968 9,880 13,196 13,083 13,083Mental Health, Office of 69,686 77,570 77,570 77,598 77,680 77,783 OMH 69,686 77,570 77,570 77,598 77,680 77,783People with Developmental Disabilities, Office for 23,618 38,600 45,220 39,220 39,220 39,220 OPWDD 23,618 38,600 45,220 39,220 39,220 39,220 Functional Total 94,982 125,138 132,670 130,014 129,983 130,086
PUBLIC PROTECTION/CRIMINAL JUSTICECorrectional Services, Department of 216,232 244,250 253,265 259,677 265,710 271,860Homeland Security and Emergency Services, Division of 2,416 17,000 8,000 6,000 7,000 0Military and Naval Affairs, Division of 23,746 22,652 27,041 26,996 43,507 41,607Public Security and Emergency Response 535 0 0 0 0 0State Police, Division of 14,597 35,827 43,400 17,874 11,065 11,065 Functional Total 257,526 319,729 331,706 310,547 327,282 324,532
HIGHER EDUCATIONCity University of New York 9,601 34,705 52,127 53,066 44,725 39,958Higher Education Facilities Capital Matching Grants Program (432) 10,000 9,000 0 0 0State University of New York 852,320 1,031,825 1,094,337 1,073,679 1,198,663 1,122,584 Functional Total 861,489 1,076,530 1,155,464 1,126,745 1,243,388 1,162,542
EDUCATIONEducation, Department of 4,631 10,908 29,404 29,884 18,400 23,400 All Other 4,631 10,908 29,404 29,884 18,400 23,400 Functional Total 4,631 10,908 29,404 29,884 18,400 23,400
GENERAL GOVERNMENTGeneral Services, Office of 61,188 78,847 62,613 59,309 69,883 69,883State, Department of 1,373 4,889 (15) (15) (15) (15)Technology, Office for 2,883 1,016 0 0 0 0 Functional Total 65,444 84,752 62,598 59,294 69,868 69,868
ELECTED OFFICIALSJudiciary 9,640 3,835 0 0 0 0 Functional Total 9,640 3,835 0 0 0 0
T-169

CASH DISBURSEMENTS BY FUNCTION ALL GOVERNMENTAL FUNDS
CAPITAL PROJECTS(thousands of dollars)
FY 2011Results
FY 2012Current
FY 2013Proposed
FY 2014Projected
FY 2015Projected
FY 2016Projected
ALL OTHER CATEGORIESMiscellaneous 105,219 140,000 91,000 90,000 80,000 40,000 Functional Total 105,219 140,000 91,000 90,000 80,000 40,000
TOTAL CAPITAL PROJECTS SPENDING 5,131,628 5,518,975 5,854,274 5,740,116 5,576,462 5,338,514
T-170

CASH DISBURSEMENTS BY FUNCTION STATE FUNDS
(thousands of dollars)
FY 2011Results
FY 2012Current
FY 2013Proposed
FY 2014Projected
FY 2015Projected
FY 2016Projected
ECONOMIC DEVELOPMENT AND GOVERNMENT OVERSIGHTAgriculture and Markets, Department of 82,828 106,971 92,066 88,705 88,817 85,964Alcoholic Beverage Control, Division of 16,706 16,657 17,859 18,314 18,781 19,225Development Authority of the North Country 10 117 70 0 0 0Economic Development Capital 30,190 19,600 12,500 12,500 5,000 5,000Economic Development, Department of 103,950 133,611 112,195 102,709 97,889 93,285Empire State Development Corporation 931,654 899,339 508,326 638,882 634,903 457,292Energy Research and Development Authority 31,710 29,597 29,358 31,178 31,178 31,178Financial Services, Department of 507,291 490,185 488,005 490,712 494,195 498,348Olympic Regional Development Authority 3,534 3,331 3,079 3,206 3,288 3,288Public Service Department 73,076 69,619 74,354 80,290 84,418 88,460Racing and Wagering Board, State 21,573 17,537 18,248 18,513 18,845 19,080Regional Economic Development Program 5,248 5,900 2,500 2,500 1,500 1,500Strategic Investment Program 3,561 4,000 5,000 5,000 5,000 5,000 Functional Total 1,811,331 1,796,464 1,363,560 1,492,509 1,483,814 1,307,620
PARKS AND THE ENVIRONMENTAdirondack Park Agency 4,637 4,194 4,146 4,175 4,251 4,337Environmental Conservation, Department of 662,504 688,694 682,494 673,185 647,795 616,919Environmental Facilities Corporation 9,746 10,620 0 0 0 0Hudson River Park Trust 15,216 6,400 3,816 0 0 0Parks, Recreation and Historic Preservation, Office of 253,619 231,104 269,577 240,534 230,143 218,434 Functional Total 945,722 941,012 960,033 917,894 882,189 839,690
TRANSPORTATIONMetropolitan Transportation Authority 216,912 194,500 333,600 183,600 183,600 328,571Motor Vehicles, Department of 300,776 277,360 284,337 296,942 307,830 319,530Thruway Authority, New York State 1,478 1,800 1,800 1,800 1,800 1,800Transportation, Department of 6,287,184 6,334,824 6,572,006 6,760,174 6,802,200 6,792,647 Functional Total 6,806,350 6,808,484 7,191,743 7,242,516 7,295,430 7,442,548
HEALTHAging, Office for the 118,718 115,996 115,841 119,605 126,401 133,413Health, Department of 14,607,760 18,352,650 18,781,100 19,465,731 19,865,370 20,564,888 Medical Assistance 11,400,560 14,752,826 15,342,913 16,017,013 16,601,713 17,507,579 Medicaid Administration 538,370 573,750 568,750 552,250 502,750 443,250 Public Health 2,668,830 3,026,074 2,869,437 2,896,468 2,760,907 2,614,059Medicaid Inspector General, Office of the 28,084 26,184 24,795 25,596 26,821 27,292Stem Cell and Innovation 37,289 45,000 50,000 63,673 61,373 50,000 Functional Total 14,791,851 18,539,830 18,971,736 19,674,605 20,079,965 20,775,593
SOCIAL WELFAREChildren and Family Services, Office of 2,012,107 1,925,309 1,935,313 2,232,829 2,322,856 2,423,069 OCFS 1,942,752 1,814,208 1,821,862 2,115,461 2,200,883 2,296,346 OCFS - Other 69,355 111,101 113,451 117,368 121,973 126,723Housing and Community Renewal, Division of 214,800 187,669 178,479 179,837 183,604 191,044Human Rights, Division of 14,165 11,756 10,755 10,958 11,269 11,614Labor, Department of 71,832 72,225 92,353 62,588 64,237 65,464National and Community Service 381 599 601 683 687 687Prevention of Domestic Violence, Office for 1,956 1,964 2,094 2,111 2,150 2,194Temporary and Disability Assistance, Office of 1,415,873 1,619,694 1,739,158 1,776,243 1,691,757 1,718,040 Welfare Assistance 1,043,865 1,250,702 1,387,466 1,434,692 1,339,041 1,365,754 All Other 372,008 368,992 351,692 341,551 352,716 352,286Welfare Inspector General, Office of 1,150 1,391 1,407 1,427 1,456 1,468Workers' Compensation Board 194,002 200,058 199,210 198,928 205,530 212,490 Functional Total 3,926,266 4,020,665 4,159,370 4,465,604 4,483,546 4,626,070
MENTAL HYGIENEAlcoholism and Substance Abuse Services, Office of 447,896 474,779 475,493 499,016 590,234 614,662 OASAS 336,208 378,671 376,939 397,939 485,350 504,213 OASAS - Other 111,688 96,108 98,554 101,077 104,884 110,449Mental Health, Office of 3,250,569 3,154,069 3,191,234 3,446,491 3,779,943 4,013,245 OMH 1,492,515 1,279,058 1,349,983 1,506,923 1,723,518 1,817,206 OMH - Other 1,758,054 1,875,011 1,841,251 1,939,568 2,056,425 2,196,039Mental Hygiene, Department of 345 0 0 0 0 0People with Developmental Disabilities, Office for 4,322,045 4,228,738 4,288,214 4,619,157 4,817,501 5,043,505 OPWDD 515,378 507,501 484,228 522,694 538,794 548,246 OPWDD - Other 3,806,667 3,721,237 3,803,986 4,096,463 4,278,707 4,495,259Quality of Care and Advocacy for Persons With Disabilities, Commission on 8,213 8,161 9,127 9,884 10,174 10,481 Functional Total 8,029,068 7,865,747 7,964,068 8,574,548 9,197,852 9,681,893
PUBLIC PROTECTION/CRIMINAL JUSTICECorrection, Commission of 2,419 2,733 2,672 2,711 2,787 2,864Correctional Services, Department of 2,803,925 2,723,413 2,650,883 2,706,742 2,765,144 2,901,455Corrections and Community Supervision Medicaid, Department of 0 0 11,500 11,500 11,500 12,500Criminal Justice Services, Division of 213,480 229,852 226,496 224,071 221,837 223,282
T-171

CASH DISBURSEMENTS BY FUNCTION STATE FUNDS
(thousands of dollars)
FY 2011Results
FY 2012Current
FY 2013Proposed
FY 2014Projected
FY 2015Projected
FY 2016Projected
Homeland Security and Emergency Services, Division of 35,714 201,626 194,261 188,354 173,967 121,896Indigent Legal Services, Office of 90,793 78,500 78,544 78,588 78,631 78,672Judicial Commissions 4,944 5,150 5,452 5,577 5,795 5,990Military and Naval Affairs, Division of 39,023 34,962 36,798 38,023 42,895 41,378Public Security and Emergency Response 496 600 600 600 600 600State Police, Division of 692,423 712,789 714,249 691,393 691,156 705,140Statewide Financial System 9,070 40,638 50,201 51,525 52,826 54,164Statewide Wireless Network 28,253 0 0 0 0 0Victim Services, Office of 34,594 34,582 34,741 34,931 35,156 35,397 Functional Total 3,955,134 4,064,845 4,006,397 4,034,015 4,082,294 4,183,338
HIGHER EDUCATIONCity University of New York 1,315,913 1,380,256 1,449,936 1,510,451 1,566,431 1,631,431Higher Education - Miscellaneous 370 355 1,300 1,300 1,300 1,300Higher Education Facilities Capital Matching Grants Program 33,834 45,100 29,492 0 0 0Higher Education Services Corporation, New York State 889,588 1,012,153 1,035,044 1,088,021 1,103,725 1,117,935State University Construction Fund 18,915 26,172 0 0 0 0State University of New York 6,733,419 7,157,409 7,333,051 7,483,607 7,806,335 7,898,574 Functional Total 8,992,039 9,621,445 9,848,823 10,083,379 10,477,791 10,649,240
EDUCATIONArts, Council on the 45,173 36,158 36,053 36,055 36,101 36,151Education, Department of 26,730,429 24,878,994 25,415,389 26,509,866 27,553,828 28,684,837 School Aid 21,848,300 19,677,129 20,002,148 20,814,906 21,612,532 22,557,521 STAR Property Tax Relief 3,234,014 3,292,520 3,322,067 3,508,375 3,690,726 3,792,568 Special Education Categorical Programs 924,218 1,181,271 1,357,636 1,455,616 1,529,216 1,604,116 All Other 723,897 728,074 733,538 730,969 721,354 730,632 Functional Total 26,775,602 24,915,152 25,451,442 26,545,921 27,589,929 28,720,988
GENERAL GOVERNMENTBudget, Division of the 33,825 36,345 37,260 38,767 41,458 42,664Civil Service, Department of 17,896 15,323 14,904 17,311 17,775 18,179Deferred Compensation Board 681 774 796 823 858 867Elections, State Board of 6,186 7,372 7,649 5,179 35,316 5,462Employee Relations, Office of 3,000 2,760 2,688 2,710 2,786 2,869General Services, Office of 189,821 209,477 212,497 199,690 205,228 208,254Inspector General, Office of the 5,703 5,493 6,610 6,717 6,970 7,196Labor Management Committees 32,335 35,300 30,470 33,074 35,189 38,316Lottery, Division of the 162,910 173,905 164,890 169,076 173,058 173,456Public Employment Relations Board 3,988 3,884 3,731 3,857 3,804 3,896Public Integrity, Commission on 3,794 3,401 4,016 4,061 4,175 4,295Regulatory Reform, Governor's Office of 1,653 0 0 0 0 0State, Department of 76,851 72,563 64,738 60,147 62,133 63,054Tax Appeals, Division of 3,134 3,057 3,101 2,813 2,894 2,948Taxation and Finance, Department of 441,466 404,678 415,599 418,545 429,888 436,603Technology, Office for 26,987 25,560 23,780 22,091 24,691 24,303Veterans' Affairs, Division of 14,069 13,642 13,436 12,949 13,155 13,383 Functional Total 1,024,299 1,013,534 1,006,165 997,810 1,059,378 1,045,745
ELECTED OFFICIALSAudit and Control, Department of 171,821 174,170 173,479 175,736 179,315 183,489Executive Chamber 12,880 13,926 13,578 13,836 14,773 15,185Judiciary 2,549,908 2,550,658 2,546,998 2,679,944 2,805,004 2,934,500Law, Department of 169,761 173,046 176,139 177,667 183,089 188,749Legislature 222,536 218,795 218,795 221,349 223,945 226,583Lieutenant Governor, Office of the 304 630 614 614 665 680 Functional Total 3,127,210 3,131,225 3,129,603 3,269,146 3,406,791 3,549,186
LOCAL GOVERNMENT ASSISTANCEAid and Incentives for Municipalities 738,940 721,192 740,555 757,414 772,589 775,357Efficiency Incentive Grants Program 4,604 9,127 7,823 1,205 0 0Miscellaneous Financial Assistance 3,920 1,960 1,960 1,960 1,960 1,960Municipalities with VLT Facilities 25,800 25,867 25,867 25,867 25,867 25,867Small Government Assistance 2,066 218 218 218 218 218 Functional Total 775,330 758,364 776,423 786,664 800,634 803,402
ALL OTHER CATEGORIESGeneral State Charges 3,432,021 3,920,304 3,671,935 4,001,489 4,306,959 4,564,805Long-Term Debt Service 5,677,515 5,932,445 6,195,454 6,495,435 6,615,038 6,752,282Miscellaneous 49,061 (40,849) 98,774 (89,184) (94,075) 48,490 Functional Total 9,158,597 9,811,900 9,966,163 10,407,740 10,827,922 11,365,577
TOTAL STATE FUNDS SPENDING 90,118,799 93,288,667 94,795,526 98,492,351 101,667,535 104,990,890
T-172

CASH DISBURSEMENTS BY FUNCTION STATE FUNDS
LOCAL ASSISTANCE GRANTS(thousands of dollars)
FY 2011Results
FY 2012Current
FY 2013Proposed
FY 2014Projected
FY 2015Projected
FY 2016Projected
ECONOMIC DEVELOPMENT AND GOVERNMENT OVERSIGHTAgriculture and Markets, Department of 15,014 26,358 23,413 23,095 23,095 23,095Development Authority of the North Country 10 117 70 0 0 0Economic Development Capital 30,617 0 0 0 0 0Economic Development, Department of 75,494 52,620 60,390 47,409 54,772 54,772Empire State Development Corporation 926,844 752,868 430,761 526,280 499,900 371,460Energy Research and Development Authority 9,157 9,234 9,234 9,234 9,234 9,234Financial Services, Department of 228,152 218,832 216,952 216,952 216,952 216,952Public Service Department 0 500 500 500 500 500Regional Economic Development Program 5,248 0 0 0 0 0 Functional Total 1,290,536 1,060,529 741,320 823,470 804,453 676,013
PARKS AND THE ENVIRONMENTEnvironmental Conservation, Department of 70,523 61,802 60,425 59,802 59,802 59,802Parks, Recreation and Historic Preservation, Office of 16,933 16,566 13,012 7,700 7,700 7,700 Functional Total 87,456 78,368 73,437 67,502 67,502 67,502
TRANSPORTATIONMetropolitan Transportation Authority 216,912 194,500 183,600 183,600 183,600 18,571Thruway Authority, New York State 1,478 0 0 0 0 0Transportation, Department of 4,266,828 4,302,324 4,465,000 4,638,374 4,741,238 4,825,299 Functional Total 4,485,218 4,496,824 4,648,600 4,821,974 4,924,838 4,843,870
HEALTHAging, Office for the 117,041 113,860 114,104 117,794 124,498 131,443Health, Department of 13,995,374 17,700,334 18,112,288 18,745,717 19,121,693 19,815,023 Medical Assistance 11,377,313 14,706,471 15,290,058 15,960,658 16,545,858 17,451,724 Medicaid Administration 538,370 573,750 568,750 552,250 502,750 443,250 Public Health 2,079,691 2,420,113 2,253,480 2,232,809 2,073,085 1,920,049 Functional Total 14,112,415 17,814,194 18,226,392 18,863,511 19,246,191 19,946,466
SOCIAL WELFAREChildren and Family Services, Office of 1,670,267 1,597,313 1,581,516 1,887,087 1,990,187 2,093,572 OCFS 1,600,912 1,486,212 1,468,065 1,769,719 1,868,214 1,966,849 OCFS - Other 69,355 111,101 113,451 117,368 121,973 126,723Housing and Community Renewal, Division of 137,588 118,602 110,586 110,526 112,178 117,178Labor, Department of 11,237 9,439 28,212 100 100 100National and Community Service 0 350 350 350 350 350Prevention of Domestic Violence, Office for 666 685 685 685 685 685Temporary and Disability Assistance, Office of 1,247,339 1,457,677 1,531,959 1,566,585 1,470,934 1,499,047 Welfare Assistance 1,043,865 1,250,702 1,387,466 1,434,692 1,339,041 1,365,754 All Other 203,474 206,975 144,493 131,893 131,893 133,293 Functional Total 3,067,097 3,184,066 3,253,308 3,565,333 3,574,434 3,710,932
MENTAL HYGIENEAlcoholism and Substance Abuse Services, Office of 336,995 362,291 363,946 380,659 466,346 483,548 OASAS 287,906 329,611 331,266 347,979 433,666 450,868 OASAS - Other 49,089 32,680 32,680 32,680 32,680 32,680Mental Health, Office of 1,165,624 1,163,861 1,156,376 1,311,822 1,520,788 1,625,065 OMH 742,212 757,519 771,781 898,811 1,080,955 1,152,919 OMH - Other 423,412 406,342 384,595 413,011 439,833 472,146People with Developmental Disabilities, Office for 2,176,345 2,161,369 2,163,241 2,389,692 2,499,775 2,570,593 OPWDD 498,380 468,725 438,832 483,293 499,393 508,845 OPWDD - Other 1,677,965 1,692,644 1,724,409 1,906,399 2,000,382 2,061,748Quality of Care and Advocacy for Persons With Disabilities, Commission on 623 620 620 620 620 620 Functional Total 3,679,587 3,688,141 3,684,183 4,082,793 4,487,529 4,679,826
PUBLIC PROTECTION/CRIMINAL JUSTICECorrectional Services, Department of 10,386 6,086 6,051 6,000 6,000 6,000Corrections and Community Supervision Medicaid, Department of 0 0 11,500 11,500 11,500 12,500Criminal Justice Services, Division of 150,003 159,770 156,081 152,061 152,061 152,061Homeland Security and Emergency Services, Division of 17,552 130,101 136,641 144,436 132,461 86,220Indigent Legal Services, Office of 65,769 77,000 77,000 77,000 77,000 77,000Military and Naval Affairs, Division of 3,659 745 867 850 850 850Victim Services, Office of 29,185 28,182 28,182 28,182 28,182 28,182 Functional Total 276,554 401,884 416,322 420,029 408,054 362,813
HIGHER EDUCATIONCity University of New York 1,182,813 1,202,263 1,271,312 1,329,217 1,391,978 1,460,122Higher Education Facilities Capital Matching Grants Program 34,266 35,100 20,492 0 0 0Higher Education Services Corporation, New York State 813,707 923,861 950,933 1,001,349 1,014,412 1,025,891State University of New York 473,053 478,855 439,315 438,537 438,537 438,537 Functional Total 2,503,839 2,640,079 2,682,052 2,769,103 2,844,927 2,924,550
T-173

CASH DISBURSEMENTS BY FUNCTION STATE FUNDS
LOCAL ASSISTANCE GRANTS(thousands of dollars)
FY 2011Results
FY 2012Current
FY 2013Proposed
FY 2014Projected
FY 2015Projected
FY 2016Projected
EDUCATIONArts, Council on the 40,479 31,733 31,933 31,933 31,933 31,933Education, Department of 26,564,820 24,706,988 25,228,075 26,317,082 27,368,118 28,490,634 School Aid 21,848,300 19,677,129 20,002,148 20,814,906 21,612,532 22,557,521 STAR Property Tax Relief 3,234,014 3,292,520 3,322,067 3,508,375 3,690,726 3,792,568 Special Education Categorical Programs 924,218 1,181,271 1,357,636 1,455,616 1,529,216 1,604,116 All Other 558,288 556,068 546,224 538,185 535,644 536,429 Functional Total 26,605,299 24,738,721 25,260,008 26,349,015 27,400,051 28,522,567
GENERAL GOVERNMENTElections, State Board of 582 300 2,700 0 30,000 0General Services, Office of 28 32 19 0 0 0State, Department of 24,495 16,152 10,573 3,877 3,877 3,877Taxation and Finance, Department of 5,270 926 926 926 926 926Technology, Office for 2,086 1,245 0 0 0 0Veterans' Affairs, Division of 8,044 8,328 7,967 7,397 7,457 7,517 Functional Total 40,505 26,983 22,185 12,200 42,260 12,320
ELECTED OFFICIALSAudit and Control, Department of 31,598 32,024 32,024 32,024 32,024 32,024Judiciary 119,798 106,645 106,700 121,700 121,700 121,700 Functional Total 151,396 138,669 138,724 153,724 153,724 153,724
LOCAL GOVERNMENT ASSISTANCEAid and Incentives for Municipalities 738,940 721,192 740,555 757,414 772,589 775,357Efficiency Incentive Grants Program 4,604 9,127 7,823 1,205 0 0Miscellaneous Financial Assistance 3,920 1,960 1,960 1,960 1,960 1,960Municipalities with VLT Facilities 25,800 25,867 25,867 25,867 25,867 25,867Small Government Assistance 2,066 218 218 218 218 218 Functional Total 775,330 758,364 776,423 786,664 800,634 803,402
ALL OTHER CATEGORIESMiscellaneous (33,259) 171,846 380,201 369,171 371,171 447,079 Functional Total (33,259) 171,846 380,201 369,171 371,171 447,079
TOTAL LOCAL ASSISTANCE GRANTS SPENDING 57,041,973 59,198,668 60,303,155 63,084,489 65,125,768 67,151,064
T-174

CASH DISBURSEMENTS BY FUNCTION STATE FUNDS
STATE OPERATIONS(thousands of dollars)
FY 2011Results
FY 2012Current
FY 2013Proposed
FY 2014Projected
FY 2015Projected
FY 2016Projected
ECONOMIC DEVELOPMENT AND GOVERNMENT OVERSIGHTAgriculture and Markets, Department of 57,860 56,257 52,084 54,062 55,847 56,768Alcoholic Beverage Control, Division of 12,581 12,904 13,629 13,823 14,020 14,221Economic Development, Department of 20,444 34,789 22,396 22,627 23,230 23,485Energy Research and Development Authority 4,744 5,180 5,286 5,396 5,396 5,396Financial Services, Department of 212,310 204,425 204,123 206,774 209,007 211,596Olympic Regional Development Authority 3,534 3,331 3,079 3,206 3,288 3,288Public Service Department 52,777 50,188 52,301 55,506 57,430 59,282Racing and Wagering Board, State 18,056 14,809 15,194 15,226 15,333 15,568 Functional Total 382,306 381,883 368,092 376,620 383,551 389,604
PARKS AND THE ENVIRONMENTAdirondack Park Agency 4,637 4,194 4,146 4,175 4,251 4,337Environmental Conservation, Department of 255,522 227,776 225,552 228,461 229,432 232,198Environmental Facilities Corporation 7,122 7,155 0 0 0 0Parks, Recreation and Historic Preservation, Office of 177,022 169,855 160,339 163,180 165,413 167,372 Functional Total 444,303 408,980 390,037 395,816 399,096 403,907
TRANSPORTATIONMotor Vehicles, Department of 68,522 69,395 71,836 73,915 75,576 77,460Transportation, Department of 33,454 37,193 23,952 24,548 25,111 25,722 Functional Total 101,976 106,588 95,788 98,463 100,687 103,182
HEALTHAging, Office for the 1,677 2,136 1,737 1,811 1,903 1,970Health, Department of 571,324 598,220 611,950 659,944 682,295 686,861 Medical Assistance 23,247 46,355 52,855 56,355 55,855 55,855 Public Health 548,077 551,865 559,095 603,589 626,440 631,006Medicaid Inspector General, Office of the 27,990 26,184 24,795 25,596 26,821 27,292Stem Cell and Innovation 36,971 45,000 50,000 63,673 61,373 50,000 Functional Total 637,962 671,540 688,482 751,024 772,392 766,123
SOCIAL WELFAREChildren and Family Services, Office of 321,270 304,430 330,231 322,056 308,946 305,727 OCFS 321,270 304,430 330,231 322,056 308,946 305,727Housing and Community Renewal, Division of 61,015 53,584 51,392 51,781 52,756 54,285Human Rights, Division of 14,165 11,756 10,755 10,958 11,269 11,614Labor, Department of 44,994 46,869 46,262 43,343 44,403 45,333National and Community Service 381 249 251 333 337 337Prevention of Domestic Violence, Office for 1,290 1,279 1,409 1,426 1,465 1,509Temporary and Disability Assistance, Office of 167,085 160,708 207,199 209,658 220,823 218,993 All Other 167,085 160,708 207,199 209,658 220,823 218,993Welfare Inspector General, Office of 1,094 1,177 1,186 1,206 1,234 1,244Workers' Compensation Board 150,850 158,361 153,148 149,735 152,632 155,909 Functional Total 762,144 738,413 801,833 790,496 793,865 794,951
MENTAL HYGIENEAlcoholism and Substance Abuse Services, Office of 80,818 75,256 73,559 75,013 77,747 81,518 OASAS 34,454 27,785 27,006 27,365 28,300 29,135 OASAS - Other 46,364 47,471 46,553 47,648 49,447 52,383Mental Health, Office of 1,455,854 1,396,938 1,394,298 1,448,850 1,516,289 1,577,533 OMH 482,556 316,022 370,269 374,040 392,122 399,354 OMH - Other 973,298 1,080,916 1,024,029 1,074,810 1,124,167 1,178,179Mental Hygiene, Department of 345 0 0 0 0 0People with Developmental Disabilities, Office for 1,542,092 1,495,301 1,485,653 1,543,007 1,579,985 1,665,818 OPWDD (6,620) 176 176 181 181 181 OPWDD - Other 1,548,712 1,495,125 1,485,477 1,542,826 1,579,804 1,665,637Quality of Care and Advocacy for Persons With Disabilities, Commission on 6,573 6,400 7,290 7,962 8,144 8,342 Functional Total 3,085,682 2,973,895 2,960,800 3,074,832 3,182,165 3,333,211
PUBLIC PROTECTION/CRIMINAL JUSTICECorrection, Commission of 2,419 2,733 2,672 2,711 2,787 2,864Correctional Services, Department of 2,575,307 2,473,077 2,391,567 2,441,065 2,493,434 2,623,595Criminal Justice Services, Division of 63,391 69,881 70,220 71,802 69,550 70,979Homeland Security and Emergency Services, Division of 15,550 53,824 48,915 37,213 33,801 34,971Indigent Legal Services, Office of 25,024 1,141 1,134 1,151 1,167 1,183Judicial Commissions 4,944 5,150 5,452 5,577 5,795 5,990Military and Naval Affairs, Division of 28,398 28,677 26,002 27,289 27,650 28,033Public Security and Emergency Response 0 600 600 600 600 600State Police, Division of 657,091 657,018 647,992 649,446 654,861 667,845Statewide Financial System 9,069 40,638 50,201 51,525 52,826 54,164Statewide Wireless Network 27,655 0 0 0 0 0Victim Services, Office of 4,521 4,801 4,782 4,862 4,974 5,113 Functional Total 3,413,369 3,337,540 3,249,537 3,293,241 3,347,445 3,495,337
T-175

CASH DISBURSEMENTS BY FUNCTION STATE FUNDS
STATE OPERATIONS(thousands of dollars)
FY 2011Results
FY 2012Current
FY 2013Proposed
FY 2014Projected
FY 2015Projected
FY 2016Projected
HIGHER EDUCATIONCity University of New York 117,099 136,747 119,812 121,335 122,895 124,518Higher Education - Miscellaneous 255 220 1,201 1,201 1,201 1,201Higher Education Services Corporation, New York State 61,052 74,876 68,980 70,309 71,976 73,821State University Construction Fund 14,438 18,579 0 0 0 0State University of New York 4,880,006 5,147,969 5,298,470 5,454,949 5,620,644 5,788,962 Functional Total 5,072,850 5,378,391 5,488,463 5,647,794 5,816,716 5,988,502
EDUCATIONArts, Council on the 4,694 4,425 4,120 4,122 4,168 4,218Education, Department of 131,572 131,312 127,577 129,941 131,823 133,609 All Other 131,572 131,312 127,577 129,941 131,823 133,609 Functional Total 136,266 135,737 131,697 134,063 135,991 137,827
GENERAL GOVERNMENTBudget, Division of the 32,081 34,266 34,963 36,117 38,584 39,570Civil Service, Department of 17,677 15,104 14,736 17,143 17,603 18,003Deferred Compensation Board 519 598 605 615 633 642Elections, State Board of 5,604 7,072 4,949 5,179 5,316 5,462Employee Relations, Office of 3,000 2,760 2,688 2,710 2,786 2,869General Services, Office of 127,315 128,454 147,964 138,379 133,201 136,087Inspector General, Office of the 5,703 5,493 6,610 6,717 6,970 7,196Labor Management Committees 32,335 35,300 30,470 33,074 35,189 38,316Lottery, Division of the 152,955 162,440 151,835 155,197 159,080 159,478Public Employment Relations Board 3,988 3,884 3,731 3,857 3,804 3,896Public Integrity, Commission on 3,794 3,401 4,016 4,061 4,175 4,295Regulatory Reform, Governor's Office of 1,653 0 0 0 0 0State, Department of 41,797 43,770 45,282 46,581 47,676 48,348Tax Appeals, Division of 3,134 3,057 3,101 2,813 2,894 2,948Taxation and Finance, Department of 412,940 384,894 393,151 394,799 405,915 412,630Technology, Office for 22,018 22,799 23,280 21,591 24,191 23,803Veterans' Affairs, Division of 6,025 5,314 5,469 5,552 5,698 5,866 Functional Total 872,538 858,606 872,850 874,385 893,715 909,409
ELECTED OFFICIALSAudit and Control, Department of 138,841 139,405 139,394 142,190 145,658 149,721Executive Chamber 12,880 13,926 13,578 13,836 14,773 15,185Judiciary 1,868,890 1,833,880 1,855,900 1,914,414 1,999,952 2,095,494Law, Department of 161,877 161,965 162,109 162,564 166,796 171,368Legislature 222,536 218,795 218,795 221,349 223,945 226,583Lieutenant Governor, Office of the 304 630 614 614 665 680 Functional Total 2,405,328 2,368,601 2,390,390 2,454,967 2,551,789 2,659,031
ALL OTHER CATEGORIESGeneral State Charges 5,561 0 0 0 0 0Long-Term Debt Service 62,846 60,527 46,925 46,925 46,925 46,925Miscellaneous 4,886 (333,447) (353,236) (554,302) (551,326) (444,792) Functional Total 73,293 (272,920) (306,311) (507,377) (504,401) (397,867)
TOTAL STATE OPERATIONS SPENDING 17,388,017 17,087,254 17,131,658 17,384,324 17,873,011 18,583,217
T-176

CASH DISBURSEMENTS BY FUNCTION STATE FUNDS
PERSONAL SERVICE(thousands of dollars)
FY 2011Results
FY 2012Current
FY 2013Proposed
FY 2014Projected
FY 2015Projected
FY 2016Projected
ECONOMIC DEVELOPMENT AND GOVERNMENT OVERSIGHTAgriculture and Markets, Department of 31,416 28,640 28,468 29,678 30,751 31,409Alcoholic Beverage Control, Division of 8,512 7,833 8,185 8,246 8,308 8,370Economic Development, Department of 13,906 11,227 12,704 13,087 13,424 13,679Energy Research and Development Authority 2,894 3,365 3,432 3,501 3,501 3,501Financial Services, Department of 152,126 134,149 133,847 136,495 138,669 141,191Olympic Regional Development Authority 2,890 2,485 2,485 2,522 2,548 2,548Public Service Department 41,801 39,513 41,705 44,591 46,220 47,964Racing and Wagering Board, State 12,062 9,335 9,059 9,058 9,133 9,368 Functional Total 265,607 236,547 239,885 247,178 252,554 258,030
PARKS AND THE ENVIRONMENTAdirondack Park Agency 4,234 3,753 3,791 3,820 3,896 3,982Environmental Conservation, Department of 186,181 167,335 167,518 169,375 172,285 175,164Environmental Facilities Corporation 6,060 6,185 0 0 0 0Parks, Recreation and Historic Preservation, Office of 135,297 124,181 123,296 126,137 127,735 129,694 Functional Total 331,772 301,454 294,605 299,332 303,916 308,840
TRANSPORTATIONMotor Vehicles, Department of 51,578 48,547 49,937 51,560 52,689 54,020Transportation, Department of 10,853 9,820 9,706 9,957 10,199 10,469 Functional Total 62,431 58,367 59,643 61,517 62,888 64,489
HEALTHAging, Office for the 1,641 1,954 1,555 1,619 1,701 1,768Health, Department of 289,860 280,827 286,801 309,239 321,530 327,176 Medical Assistance 500 500 500 500 500 500 Public Health 289,360 280,327 286,301 308,739 321,030 326,676Medicaid Inspector General, Office of the 20,818 19,768 18,379 18,850 19,725 20,196Stem Cell and Innovation 534 0 0 0 0 0 Functional Total 312,853 302,549 306,735 329,708 342,956 349,140
SOCIAL WELFAREChildren and Family Services, Office of 192,793 178,802 189,959 175,169 164,117 162,342 OCFS 192,793 178,802 189,959 175,169 164,117 162,342Housing and Community Renewal, Division of 46,367 41,490 40,890 41,148 41,986 43,395Human Rights, Division of 12,932 10,652 9,841 9,927 10,207 10,522Labor, Department of 32,161 27,801 27,571 27,930 28,620 29,292National and Community Service 304 208 210 292 295 295Prevention of Domestic Violence, Office for 1,098 1,133 1,313 1,324 1,356 1,389Temporary and Disability Assistance, Office of 62,305 52,327 84,922 86,979 91,656 94,056 All Other 62,305 52,327 84,922 86,979 91,656 94,056Welfare Inspector General, Office of 434 701 701 721 738 748Workers' Compensation Board 89,052 87,031 89,130 90,328 92,301 94,633 Functional Total 437,446 400,145 444,537 433,818 431,276 436,672
MENTAL HYGIENEAlcoholism and Substance Abuse Services, Office of 59,596 56,126 54,868 56,344 58,560 61,815 OASAS 25,103 17,464 17,198 17,575 18,255 18,846 OASAS - Other 34,493 38,662 37,670 38,769 40,305 42,969Mental Health, Office of 1,145,258 1,102,070 1,104,515 1,135,076 1,183,479 1,242,948 OMH 405,776 252,055 290,845 291,573 310,013 316,935 OMH - Other 739,482 850,015 813,670 843,503 873,466 926,013People with Developmental Disabilities, Office for 1,168,196 1,125,656 1,122,650 1,166,568 1,192,852 1,268,545 OPWDD - Other 1,168,196 1,125,656 1,122,650 1,166,568 1,192,852 1,268,545Quality of Care and Advocacy for Persons With Disabilities, Commission on 5,430 5,247 6,070 6,681 6,834 6,999 Functional Total 2,378,480 2,289,099 2,288,103 2,364,669 2,441,725 2,580,307
PUBLIC PROTECTION/CRIMINAL JUSTICECorrection, Commission of 2,082 2,319 2,398 2,414 2,481 2,548Correctional Services, Department of 2,043,633 1,958,633 1,919,183 1,949,125 1,981,019 2,089,740Criminal Justice Services, Division of 34,806 32,672 33,419 33,864 34,703 35,666Homeland Security and Emergency Services, Division of 6,531 15,280 15,395 15,540 16,056 16,637Indigent Legal Services, Office of 8 750 794 802 810 818Judicial Commissions 3,723 3,791 4,093 4,124 4,237 4,357Military and Naval Affairs, Division of 19,260 16,722 16,679 16,821 17,034 17,265Public Security and Emergency Response 0 600 600 600 600 600State Police, Division of 582,393 564,450 568,537 568,523 572,436 580,410Statewide Financial System 3,977 9,139 10,814 10,895 10,977 11,060Statewide Wireless Network 8,076 0 0 0 0 0Victim Services, Office of 3,761 3,764 3,866 3,931 4,026 4,148 Functional Total 2,708,250 2,608,120 2,575,778 2,606,639 2,644,379 2,763,249
T-177

CASH DISBURSEMENTS BY FUNCTION STATE FUNDS
PERSONAL SERVICE(thousands of dollars)
FY 2011Results
FY 2012Current
FY 2013Proposed
FY 2014Projected
FY 2015Projected
FY 2016Projected
HIGHER EDUCATIONCity University of New York 85,732 96,651 85,125 85,763 86,406 87,055Higher Education - Miscellaneous 221 175 198 198 198 198Higher Education Services Corporation, New York State 32,756 32,134 30,166 30,554 31,247 32,058State University Construction Fund 12,562 15,544 0 0 0 0State University of New York 3,239,364 3,251,226 3,340,878 3,437,772 3,550,082 3,664,050 Functional Total 3,370,635 3,395,730 3,456,367 3,554,287 3,667,933 3,783,361
EDUCATIONArts, Council on the 3,098 2,300 2,298 2,300 2,346 2,396Education, Department of 90,078 83,525 83,466 85,059 86,510 87,989 All Other 90,078 83,525 83,466 85,059 86,510 87,989 Functional Total 93,176 85,825 85,764 87,359 88,856 90,385
GENERAL GOVERNMENTBudget, Division of the 24,430 23,915 24,961 25,768 27,287 28,166Civil Service, Department of 16,153 13,650 13,247 15,359 15,714 16,109Deferred Compensation Board 374 390 392 396 408 417Elections, State Board of 4,205 4,104 4,144 4,254 4,370 4,495Employee Relations, Office of 2,909 2,625 2,551 2,570 2,646 2,728General Services, Office of 56,079 48,664 51,886 51,859 52,985 54,378Inspector General, Office of the 5,519 4,990 6,083 6,129 6,301 6,485Labor Management Committees 9,872 5,500 5,500 5,504 6,119 6,366Lottery, Division of the 21,057 21,738 24,864 25,029 25,495 25,893Public Employment Relations Board 3,456 3,182 3,290 3,119 3,046 3,138Public Integrity, Commission on 3,017 2,651 3,166 3,190 3,282 3,380Regulatory Reform, Governor's Office of 1,537 0 0 0 0 0State, Department of 31,270 29,124 31,340 32,307 33,039 33,700Tax Appeals, Division of 2,776 2,736 2,900 2,601 2,673 2,727Taxation and Finance, Department of 323,767 297,866 301,881 300,966 309,755 316,470Technology, Office for 11,208 10,851 13,786 13,795 14,121 14,464Veterans' Affairs, Division of 5,570 4,875 5,050 5,123 5,259 5,416 Functional Total 523,199 476,861 495,041 497,969 512,500 524,332
ELECTED OFFICIALSAudit and Control, Department of 110,320 103,442 108,671 109,385 112,012 115,214Executive Chamber 10,963 10,695 11,338 11,495 12,238 12,589Judiciary 1,525,120 1,463,935 1,468,250 1,514,284 1,561,492 1,618,742Law, Department of 111,750 107,411 110,920 110,913 113,920 117,232Legislature 174,096 165,284 165,284 166,524 167,773 169,031Lieutenant Governor, Office of the 281 480 480 494 515 543 Functional Total 1,932,530 1,851,247 1,864,943 1,913,095 1,967,950 2,033,351
ALL OTHER CATEGORIESGeneral State Charges 3,835 0 0 0 0 0Miscellaneous 2,217 (130,164) (146,918) (196,385) (195,109) (138,621) Functional Total 6,052 (130,164) (146,918) (196,385) (195,109) (138,621)
TOTAL PERSONAL SERVICE SPENDING 12,422,431 11,875,780 11,964,483 12,199,186 12,521,824 13,053,535
T-178

CASH DISBURSEMENTS BY FUNCTION STATE FUNDS
NON-PERSONAL SERVICE/INDIRECT COSTS(thousands of dollars)
FY 2011Results
FY 2012Current
FY 2013Proposed
FY 2014Projected
FY 2015Projected
FY 2016Projected
ECONOMIC DEVELOPMENT AND GOVERNMENT OVERSIGHTAgriculture and Markets, Department of 26,444 27,617 23,616 24,384 25,096 25,359Alcoholic Beverage Control, Division of 4,069 5,071 5,444 5,577 5,712 5,851Economic Development, Department of 6,538 23,562 9,692 9,540 9,806 9,806Energy Research and Development Authority 1,850 1,815 1,854 1,895 1,895 1,895Financial Services, Department of 60,184 70,276 70,276 70,279 70,338 70,405Olympic Regional Development Authority 644 846 594 684 740 740Public Service Department 10,976 10,675 10,596 10,915 11,210 11,318Racing and Wagering Board, State 5,994 5,474 6,135 6,168 6,200 6,200 Functional Total 116,699 145,336 128,207 129,442 130,997 131,574
PARKS AND THE ENVIRONMENTAdirondack Park Agency 403 441 355 355 355 355Environmental Conservation, Department of 69,341 60,441 58,034 59,086 57,147 57,034Environmental Facilities Corporation 1,062 970 0 0 0 0Parks, Recreation and Historic Preservation, Office of 41,725 45,674 37,043 37,043 37,678 37,678 Functional Total 112,531 107,526 95,432 96,484 95,180 95,067
TRANSPORTATIONMotor Vehicles, Department of 16,944 20,848 21,899 22,355 22,887 23,440Transportation, Department of 22,601 27,373 14,246 14,591 14,912 15,253 Functional Total 39,545 48,221 36,145 36,946 37,799 38,693
HEALTHAging, Office for the 36 182 182 192 202 202Health, Department of 281,464 317,393 325,149 350,705 360,765 359,685 Medical Assistance 22,747 45,855 52,355 55,855 55,355 55,355 Public Health 258,717 271,538 272,794 294,850 305,410 304,330Medicaid Inspector General, Office of the 7,172 6,416 6,416 6,746 7,096 7,096Stem Cell and Innovation 36,437 45,000 50,000 63,673 61,373 50,000 Functional Total 325,109 368,991 381,747 421,316 429,436 416,983
SOCIAL WELFAREChildren and Family Services, Office of 128,477 125,628 140,272 146,887 144,829 143,385 OCFS 128,477 125,628 140,272 146,887 144,829 143,385Housing and Community Renewal, Division of 14,648 12,094 10,502 10,633 10,770 10,890Human Rights, Division of 1,233 1,104 914 1,031 1,062 1,092Labor, Department of 12,833 19,068 18,691 15,413 15,783 16,041National and Community Service 77 41 41 41 42 42Prevention of Domestic Violence, Office for 192 146 96 102 109 120Temporary and Disability Assistance, Office of 104,780 108,381 122,277 122,679 129,167 124,937 All Other 104,780 108,381 122,277 122,679 129,167 124,937Welfare Inspector General, Office of 660 476 485 485 496 496Workers' Compensation Board 61,798 71,330 64,018 59,407 60,331 61,276 Functional Total 324,698 338,268 357,296 356,678 362,589 358,279
MENTAL HYGIENEAlcoholism and Substance Abuse Services, Office of 21,222 19,130 18,691 18,669 19,187 19,703 OASAS 9,351 10,321 9,808 9,790 10,045 10,289 OASAS - Other 11,871 8,809 8,883 8,879 9,142 9,414Mental Health, Office of 310,596 294,868 289,783 313,774 332,810 334,585 OMH 76,780 63,967 79,424 82,467 82,109 82,419 OMH - Other 233,816 230,901 210,359 231,307 250,701 252,166Mental Hygiene, Department of 345 0 0 0 0 0People with Developmental Disabilities, Office for 373,896 369,645 363,003 376,439 387,133 397,273 OPWDD (6,620) 176 176 181 181 181 OPWDD - Other 380,516 369,469 362,827 376,258 386,952 397,092Quality of Care and Advocacy for Persons With Disabilities, Commission on 1,143 1,153 1,220 1,281 1,310 1,343 Functional Total 707,202 684,796 672,697 710,163 740,440 752,904
PUBLIC PROTECTION/CRIMINAL JUSTICECorrection, Commission of 337 414 274 297 306 316Correctional Services, Department of 531,674 514,444 472,384 491,940 512,415 533,855Criminal Justice Services, Division of 28,585 37,209 36,801 37,938 34,847 35,313Homeland Security and Emergency Services, Division of 9,019 38,544 33,520 21,673 17,745 18,334Indigent Legal Services, Office of 25,016 391 340 349 357 365Judicial Commissions 1,221 1,359 1,359 1,453 1,558 1,633Military and Naval Affairs, Division of 9,138 11,955 9,323 10,468 10,616 10,768State Police, Division of 74,698 92,568 79,455 80,923 82,425 87,435Statewide Financial System 5,092 31,499 39,387 40,630 41,849 43,104Statewide Wireless Network 19,579 0 0 0 0 0Victim Services, Office of 760 1,037 916 931 948 965 Functional Total 705,119 729,420 673,759 686,602 703,066 732,088
T-179

CASH DISBURSEMENTS BY FUNCTION STATE FUNDS
NON-PERSONAL SERVICE/INDIRECT COSTS(thousands of dollars)
FY 2011Results
FY 2012Current
FY 2013Proposed
FY 2014Projected
FY 2015Projected
FY 2016Projected
HIGHER EDUCATIONCity University of New York 31,367 40,096 34,687 35,572 36,489 37,463Higher Education - Miscellaneous 34 45 1,003 1,003 1,003 1,003Higher Education Services Corporation, New York State 28,296 42,742 38,814 39,755 40,729 41,763State University Construction Fund 1,876 3,035 0 0 0 0State University of New York 1,640,642 1,896,743 1,957,592 2,017,177 2,070,562 2,124,912 Functional Total 1,702,215 1,982,661 2,032,096 2,093,507 2,148,783 2,205,141
EDUCATIONArts, Council on the 1,596 2,125 1,822 1,822 1,822 1,822Education, Department of 41,494 47,787 44,111 44,882 45,313 45,620 All Other 41,494 47,787 44,111 44,882 45,313 45,620 Functional Total 43,090 49,912 45,933 46,704 47,135 47,442
GENERAL GOVERNMENTBudget, Division of the 7,651 10,351 10,002 10,349 11,297 11,404Civil Service, Department of 1,524 1,454 1,489 1,784 1,889 1,894Deferred Compensation Board 145 208 213 219 225 225Elections, State Board of 1,399 2,968 805 925 946 967Employee Relations, Office of 91 135 137 140 140 141General Services, Office of 71,236 79,790 96,078 86,520 80,216 81,709Inspector General, Office of the 184 503 527 588 669 711Labor Management Committees 22,463 29,800 24,970 27,570 29,070 31,950Lottery, Division of the 131,898 140,702 126,971 130,168 133,585 133,585Public Employment Relations Board 532 702 441 738 758 758Public Integrity, Commission on 777 750 850 871 893 915Regulatory Reform, Governor's Office of 116 0 0 0 0 0State, Department of 10,527 14,646 13,942 14,274 14,637 14,648Tax Appeals, Division of 358 321 201 212 221 221Taxation and Finance, Department of 89,173 87,028 91,270 93,833 96,160 96,160Technology, Office for 10,810 11,948 9,494 7,796 10,070 9,339Veterans' Affairs, Division of 455 439 419 429 439 450 Functional Total 349,339 381,745 377,809 376,416 381,215 385,077
ELECTED OFFICIALSAudit and Control, Department of 28,521 35,963 30,723 32,805 33,646 34,507Executive Chamber 1,917 3,231 2,240 2,341 2,535 2,596Judiciary 343,770 369,945 387,650 400,130 438,460 476,752Law, Department of 50,127 54,554 51,189 51,651 52,876 54,136Legislature 48,440 53,511 53,511 54,825 56,172 57,552Lieutenant Governor, Office of the 23 150 134 120 150 137 Functional Total 472,798 517,354 525,447 541,872 583,839 625,680
ALL OTHER CATEGORIESGeneral State Charges 1,726 0 0 0 0 0Long-Term Debt Service 62,846 60,527 46,925 46,925 46,925 46,925Miscellaneous 2,669 (203,283) (206,318) (357,917) (356,217) (306,171) Functional Total 67,241 (142,756) (159,393) (310,992) (309,292) (259,246)
TOTAL NON-PERSONAL SERVICE/INDIRECT COSTS SPENDING 4,965,586 5,211,474 5,167,175 5,185,138 5,351,187 5,529,682
T-180

CASH DISBURSEMENTS BY FUNCTION STATE FUNDS
GENERAL STATE CHARGES(thousands of dollars)
FY 2011Results
FY 2012Current
FY 2013Proposed
FY 2014Projected
FY 2015Projected
FY 2016Projected
ECONOMIC DEVELOPMENT AND GOVERNMENT OVERSIGHTAgriculture and Markets, Department of 4,749 5,142 2,063 2,271 2,545 2,601Alcoholic Beverage Control, Division of 4,125 3,753 4,230 4,491 4,761 5,004Economic Development, Department of 21 28 28 28 28 28Energy Research and Development Authority 1,406 1,583 1,638 1,758 1,758 1,758Financial Services, Department of 66,829 66,928 66,930 66,986 68,236 69,800Public Service Department 20,299 18,931 21,553 24,284 26,488 28,678Racing and Wagering Board, State 3,517 2,728 3,054 3,287 3,512 3,512 Functional Total 100,946 99,093 99,496 103,105 107,328 111,381
PARKS AND THE ENVIRONMENTEnvironmental Conservation, Department of 37,838 34,490 35,575 34,793 35,544 36,404Environmental Facilities Corporation 2,268 3,122 0 0 0 0Parks, Recreation and Historic Preservation, Office of 2,627 3,685 3,685 3,827 3,890 3,934 Functional Total 42,733 41,297 39,260 38,620 39,434 40,338
TRANSPORTATIONMotor Vehicles, Department of 27,440 23,258 25,808 28,079 30,196 32,298Transportation, Department of 403 7,903 4,951 5,394 5,790 6,196 Functional Total 27,843 31,161 30,759 33,473 35,986 38,494
HEALTHHealth, Department of 33,594 40,596 43,362 46,570 47,882 49,504 Public Health 33,594 40,596 43,362 46,570 47,882 49,504Medicaid Inspector General, Office of the 94 0 0 0 0 0Stem Cell and Innovation 318 0 0 0 0 0 Functional Total 34,006 40,596 43,362 46,570 47,882 49,504
SOCIAL WELFAREChildren and Family Services, Office of 2,325 2,666 2,666 2,786 2,823 2,870 OCFS 2,325 2,666 2,666 2,786 2,823 2,870Housing and Community Renewal, Division of 16,197 15,483 16,501 17,530 18,670 19,581Labor, Department of 15,601 15,917 17,879 19,145 19,734 20,031Temporary and Disability Assistance, Office of 1,449 1,309 0 0 0 0 All Other 1,449 1,309 0 0 0 0Welfare Inspector General, Office of 56 214 221 221 222 224Workers' Compensation Board 43,152 41,697 46,062 49,193 52,898 56,581 Functional Total 78,780 77,286 83,329 88,875 94,347 99,287
MENTAL HYGIENEAlcoholism and Substance Abuse Services, Office of 28,405 28,264 28,108 30,148 33,058 36,513 OASAS 12,170 12,307 8,787 9,399 10,301 11,127 OASAS - Other 16,235 15,957 19,321 20,749 22,757 25,386Mental Health, Office of 559,405 515,700 562,990 608,221 665,186 732,864 OMH 198,061 127,947 130,363 156,474 172,761 187,150 OMH - Other 361,344 387,753 432,627 451,747 492,425 545,714People with Developmental Disabilities, Office for 579,990 533,468 594,100 647,238 698,521 767,874 OPWDD - Other 579,990 533,468 594,100 647,238 698,521 767,874Quality of Care and Advocacy for Persons With Disabilities, Commission on 1,017 1,141 1,217 1,302 1,410 1,519 Functional Total 1,168,817 1,078,573 1,186,415 1,286,909 1,398,175 1,538,770
PUBLIC PROTECTION/CRIMINAL JUSTICECorrectional Services, Department of 2,000 0 0 0 0 0Criminal Justice Services, Division of 86 201 195 208 226 242Homeland Security and Emergency Services, Division of 196 701 705 705 705 705Indigent Legal Services, Office of 0 359 410 437 464 489Military and Naval Affairs, Division of 583 250 250 250 250 250State Police, Division of 20,735 19,944 22,857 24,073 25,230 26,230Statewide Financial System 1 0 0 0 0 0Statewide Wireless Network 598 0 0 0 0 0Victim Services, Office of 888 1,599 1,777 1,887 2,000 2,102 Functional Total 25,087 23,054 26,194 27,560 28,875 30,018
HIGHER EDUCATIONCity University of New York 6,400 6,541 6,685 6,833 6,833 6,833Higher Education - Miscellaneous 115 135 99 99 99 99Higher Education Services Corporation, New York State 14,829 13,416 15,131 16,363 17,337 18,223State University Construction Fund 4,477 7,593 0 0 0 0State University of New York 528,040 498,760 500,929 516,442 548,491 548,491 Functional Total 553,861 526,445 522,844 539,737 572,760 573,646
T-181

CASH DISBURSEMENTS BY FUNCTION STATE FUNDS
GENERAL STATE CHARGES(thousands of dollars)
FY 2011Results
FY 2012Current
FY 2013Proposed
FY 2014Projected
FY 2015Projected
FY 2016Projected
EDUCATIONEducation, Department of 29,406 29,786 30,333 32,959 35,487 37,194 All Other 29,406 29,786 30,333 32,959 35,487 37,194 Functional Total 29,406 29,786 30,333 32,959 35,487 37,194
GENERAL GOVERNMENTBudget, Division of the 1,744 2,079 2,297 2,650 2,874 3,094Civil Service, Department of 219 219 168 168 172 176Deferred Compensation Board 162 176 191 208 225 225General Services, Office of 1,290 2,144 1,901 2,002 2,144 2,284Lottery, Division of the 9,955 11,465 13,055 13,879 13,978 13,978State, Department of 9,186 7,752 8,898 9,704 10,595 10,844Taxation and Finance, Department of 23,256 18,858 21,522 22,820 23,047 23,047Technology, Office for 0 500 500 500 500 500 Functional Total 45,812 43,193 48,532 51,931 53,535 54,148
ELECTED OFFICIALSAudit and Control, Department of 1,382 2,741 2,061 1,522 1,633 1,744Judiciary 551,580 606,298 584,398 643,830 683,352 717,306Law, Department of 7,884 11,081 14,030 15,103 16,293 17,381 Functional Total 560,846 620,120 600,489 660,455 701,278 736,431
ALL OTHER CATEGORIESGeneral State Charges 3,426,460 3,920,304 3,671,935 4,001,489 4,306,959 4,564,805Miscellaneous 6,898 5,752 5,809 5,947 6,080 6,203 Functional Total 3,433,358 3,926,056 3,677,744 4,007,436 4,313,039 4,571,008
TOTAL GENERAL STATE CHARGES SPENDING 6,101,495 6,536,660 6,388,757 6,917,630 7,428,126 7,880,219
T-182

CASH DISBURSEMENTS BY FUNCTION STATE FUNDS
CAPITAL PROJECTS(thousands of dollars)
FY 2011Results
FY 2012Current
FY 2013Proposed
FY 2014Projected
FY 2015Projected
FY 2016Projected
ECONOMIC DEVELOPMENT AND GOVERNMENT OVERSIGHTAgriculture and Markets, Department of 5,205 19,214 14,506 9,277 7,330 3,500Economic Development Capital (427) 19,600 12,500 12,500 5,000 5,000Economic Development, Department of 7,991 46,174 29,381 32,645 19,859 15,000Empire State Development Corporation 4,810 146,471 77,565 112,602 135,003 85,832Energy Research and Development Authority 16,403 13,600 13,200 14,790 14,790 14,790Regional Economic Development Program 0 5,900 2,500 2,500 1,500 1,500Strategic Investment Program 3,561 4,000 5,000 5,000 5,000 5,000 Functional Total 37,543 254,959 154,652 189,314 188,482 130,622
PARKS AND THE ENVIRONMENTEnvironmental Conservation, Department of 298,621 364,626 360,942 350,129 323,017 288,515Environmental Facilities Corporation 356 343 0 0 0 0Hudson River Park Trust 15,216 6,400 3,816 0 0 0Parks, Recreation and Historic Preservation, Office of 57,037 40,998 92,541 65,827 53,140 39,428 Functional Total 371,230 412,367 457,299 415,956 376,157 327,943
TRANSPORTATIONMetropolitan Transportation Authority 0 0 150,000 0 0 310,000Motor Vehicles, Department of 204,814 184,707 186,693 194,948 202,058 209,772Thruway Authority, New York State 0 1,800 1,800 1,800 1,800 1,800Transportation, Department of 1,986,499 1,987,404 2,078,103 2,091,858 2,030,061 1,935,430 Functional Total 2,191,313 2,173,911 2,416,596 2,288,606 2,233,919 2,457,002
HEALTHHealth, Department of 7,468 13,500 13,500 13,500 13,500 13,500 Public Health 7,468 13,500 13,500 13,500 13,500 13,500 Functional Total 7,468 13,500 13,500 13,500 13,500 13,500
SOCIAL WELFAREChildren and Family Services, Office of 18,245 20,900 20,900 20,900 20,900 20,900 OCFS 18,245 20,900 20,900 20,900 20,900 20,900 Functional Total 18,245 20,900 20,900 20,900 20,900 20,900
MENTAL HYGIENEAlcoholism and Substance Abuse Services, Office of 1,678 8,968 9,880 13,196 13,083 13,083 OASAS 1,678 8,968 9,880 13,196 13,083 13,083Mental Health, Office of 69,686 77,570 77,570 77,598 77,680 77,783 OMH 69,686 77,570 77,570 77,598 77,680 77,783People with Developmental Disabilities, Office for 23,618 38,600 45,220 39,220 39,220 39,220 OPWDD 23,618 38,600 45,220 39,220 39,220 39,220 Functional Total 94,982 125,138 132,670 130,014 129,983 130,086
PUBLIC PROTECTION/CRIMINAL JUSTICECorrectional Services, Department of 216,232 244,250 253,265 259,677 265,710 271,860Homeland Security and Emergency Services, Division of 2,416 17,000 8,000 6,000 7,000 0Military and Naval Affairs, Division of 6,383 5,290 9,679 9,634 14,145 12,245Public Security and Emergency Response 496 0 0 0 0 0State Police, Division of 14,597 35,827 43,400 17,874 11,065 11,065 Functional Total 240,124 302,367 314,344 293,185 297,920 295,170
HIGHER EDUCATIONCity University of New York 9,601 34,705 52,127 53,066 44,725 39,958Higher Education Facilities Capital Matching Grants Program (432) 10,000 9,000 0 0 0State University of New York 852,320 1,031,825 1,094,337 1,073,679 1,198,663 1,122,584 Functional Total 861,489 1,076,530 1,155,464 1,126,745 1,243,388 1,162,542
EDUCATIONEducation, Department of 4,631 10,908 29,404 29,884 18,400 23,400 All Other 4,631 10,908 29,404 29,884 18,400 23,400 Functional Total 4,631 10,908 29,404 29,884 18,400 23,400
GENERAL GOVERNMENTGeneral Services, Office of 61,188 78,847 62,613 59,309 69,883 69,883State, Department of 1,373 4,889 (15) (15) (15) (15)Technology, Office for 2,883 1,016 0 0 0 0 Functional Total 65,444 84,752 62,598 59,294 69,868 69,868
ELECTED OFFICIALSJudiciary 9,640 3,835 0 0 0 0 Functional Total 9,640 3,835 0 0 0 0
T-183

CASH DISBURSEMENTS BY FUNCTION STATE FUNDS
CAPITAL PROJECTS(thousands of dollars)
FY 2011Results
FY 2012Current
FY 2013Proposed
FY 2014Projected
FY 2015Projected
FY 2016Projected
ALL OTHER CATEGORIESMiscellaneous 70,536 115,000 66,000 90,000 80,000 40,000 Functional Total 70,536 115,000 66,000 90,000 80,000 40,000
TOTAL CAPITAL PROJECTS SPENDING 3,972,645 4,594,167 4,823,427 4,657,398 4,672,517 4,671,033
T-184

CASH DISBURSEMENTS BY FUNCTION SPECIAL REVENUE STATE FUNDS
LOCAL ASSISTANCE GRANTS(thousands of dollars)
FY 2011Results
FY 2012Current
FY 2013Proposed
FY 2014Projected
FY 2015Projected
FY 2016Projected
ECONOMIC DEVELOPMENT AND GOVERNMENT OVERSIGHTEnergy Research and Development Authority 9,157 9,234 9,234 9,234 9,234 9,234Financial Services, Department of 217,007 218,832 216,952 216,952 216,952 216,952Public Service Department 0 500 500 500 500 500 Functional Total 226,164 228,566 226,686 226,686 226,686 226,686
PARKS AND THE ENVIRONMENTEnvironmental Conservation, Department of 410 0 0 0 0 0Parks, Recreation and Historic Preservation, Office of 5,099 4,850 4,850 4,850 4,850 4,850 Functional Total 5,509 4,850 4,850 4,850 4,850 4,850
TRANSPORTATIONTransportation, Department of 4,156,790 4,158,435 4,299,961 4,458,861 4,552,861 4,647,061 Functional Total 4,156,790 4,158,435 4,299,961 4,458,861 4,552,861 4,647,061
HEALTHAging, Office for the 7 0 0 0 0 0Health, Department of 5,686,816 6,367,364 6,650,486 6,882,880 7,096,304 6,883,345 Medical Assistance 4,437,075 5,012,352 5,390,817 5,560,366 5,734,441 5,700,424 Public Health 1,249,741 1,355,012 1,259,669 1,322,514 1,361,863 1,182,921 Functional Total 5,686,823 6,367,364 6,650,486 6,882,880 7,096,304 6,883,345
SOCIAL WELFAREChildren and Family Services, Office of 3,966 1,600 850 850 850 850 OCFS 3,966 1,600 850 850 850 850Housing and Community Renewal, Division of 712 852 852 852 852 852Labor, Department of 123 100 100 100 100 100Temporary and Disability Assistance, Office of 6,140 9,700 4,000 0 0 0 All Other 6,140 9,700 4,000 0 0 0 Functional Total 10,941 12,252 5,802 1,802 1,802 1,802
MENTAL HYGIENEAlcoholism and Substance Abuse Services, Office of 153,359 281,270 282,996 303,356 319,976 337,178 OASAS 153,359 281,270 282,996 303,356 319,976 337,178Mental Health, Office of 567,032 675,445 714,929 834,300 941,444 1,013,408 OMH 567,032 675,445 714,929 834,300 941,444 1,013,408People with Developmental Disabilities, Office for 617,736 720,916 709,809 769,124 786,539 795,991 OPWDD 378,577 463,660 434,003 479,414 495,514 504,966 OPWDD - Other 239,159 257,256 275,806 289,710 291,025 291,025Quality of Care and Advocacy for Persons With Disabilities, Commission on 394 450 450 450 450 450 Functional Total 1,338,521 1,678,081 1,708,184 1,907,230 2,048,409 2,147,027
PUBLIC PROTECTION/CRIMINAL JUSTICECriminal Justice Services, Division of 22,628 36,055 36,055 36,055 36,055 36,055Homeland Security and Emergency Services, Division of 0 45,598 61,298 81,998 81,998 81,998Indigent Legal Services, Office of 65,769 77,000 77,000 77,000 77,000 77,000Military and Naval Affairs, Division of 2,934 0 0 0 0 0Victim Services, Office of 29,185 28,182 28,182 28,182 28,182 28,182 Functional Total 120,516 186,835 202,535 223,235 223,235 223,235
HIGHER EDUCATIONHigher Education Services Corporation, New York State 22,200 16,000 32,000 16,000 0 0 Functional Total 22,200 16,000 32,000 16,000 0 0
EDUCATIONArts, Council on the 0 98 98 98 98 98Education, Department of 6,391,597 6,187,943 6,382,703 6,572,233 6,759,618 6,863,460 School Aid 3,142,995 2,884,000 3,053,000 3,056,800 3,062,000 3,064,000 STAR Property Tax Relief 3,234,014 3,292,520 3,322,067 3,508,375 3,690,726 3,792,568 All Other 14,588 11,423 7,636 7,058 6,892 6,892 Functional Total 6,391,597 6,188,041 6,382,801 6,572,331 6,759,716 6,863,558
GENERAL GOVERNMENTState, Department of 4,813 539 539 539 539 539 Functional Total 4,813 539 539 539 539 539
ELECTED OFFICIALSJudiciary 114,914 104,200 104,200 104,200 104,200 104,200 Functional Total 114,914 104,200 104,200 104,200 104,200 104,200
T-185

CASH DISBURSEMENTS BY FUNCTION SPECIAL REVENUE STATE FUNDS
LOCAL ASSISTANCE GRANTS(thousands of dollars)
FY 2011Results
FY 2012Current
FY 2013Proposed
FY 2014Projected
FY 2015Projected
FY 2016Projected
ALL OTHER CATEGORIESMiscellaneous 10,321 88,078 39,319 43,289 45,289 45,289 Functional Total 10,321 88,078 39,319 43,289 45,289 45,289
TOTAL LOCAL ASSISTANCE GRANTS SPENDING 18,089,109 19,033,241 19,657,363 20,441,903 21,063,891 21,147,592
T-186

CASH DISBURSEMENTS BY FUNCTION SPECIAL REVENUE STATE FUNDS
PERSONAL SERVICE(thousands of dollars)
FY 2011Results
FY 2012Current
FY 2013Proposed
FY 2014Projected
FY 2015Projected
FY 2016Projected
ECONOMIC DEVELOPMENT AND GOVERNMENT OVERSIGHTAgriculture and Markets, Department of 9,887 9,757 3,930 4,035 4,214 4,305Alcoholic Beverage Control, Division of 8,512 7,833 8,185 8,246 8,308 8,370Economic Development, Department of 43 168 103 103 103 103Energy Research and Development Authority 2,894 3,365 3,432 3,501 3,501 3,501Financial Services, Department of 151,988 134,149 133,847 136,495 138,669 141,191Public Service Department 41,801 39,513 41,705 44,591 46,220 47,964Racing and Wagering Board, State 12,062 9,335 9,059 9,058 9,133 9,368 Functional Total 227,187 204,120 200,261 206,029 210,148 214,802
PARKS AND THE ENVIRONMENTEnvironmental Conservation, Department of 97,997 90,076 92,633 91,406 93,189 94,725Environmental Facilities Corporation 6,060 6,185 0 0 0 0Parks, Recreation and Historic Preservation, Office of 26,130 24,258 28,009 29,013 29,522 29,954 Functional Total 130,187 120,519 120,642 120,419 122,711 124,679
TRANSPORTATIONMotor Vehicles, Department of 51,578 48,547 49,937 51,560 52,689 54,020Transportation, Department of 10,853 9,820 9,706 9,957 10,199 10,469 Functional Total 62,431 58,367 59,643 61,517 62,888 64,489
HEALTHHealth, Department of 228,838 228,835 229,316 238,880 244,666 247,342 Public Health 228,838 228,835 229,316 238,880 244,666 247,342Medicaid Inspector General, Office of the 3,888 3,700 3,700 3,700 3,700 3,700Stem Cell and Innovation 534 0 0 0 0 0 Functional Total 233,260 232,535 233,016 242,580 248,366 251,042
SOCIAL WELFAREChildren and Family Services, Office of 29,104 32,107 4,195 3,962 4,060 4,125 OCFS 29,104 32,107 4,195 3,962 4,060 4,125Housing and Community Renewal, Division of 34,795 32,699 31,411 31,684 32,224 33,213Labor, Department of 31,852 27,801 27,571 27,930 28,620 29,292Temporary and Disability Assistance, Office of 48,211 54,478 0 0 0 0 All Other 48,211 54,478 0 0 0 0Welfare Inspector General, Office of 108 408 408 414 420 423Workers' Compensation Board 89,052 87,031 89,130 90,328 92,301 94,633 Functional Total 233,122 234,524 152,715 154,318 157,625 161,686
MENTAL HYGIENEAlcoholism and Substance Abuse Services, Office of 59,596 56,126 54,868 56,344 58,560 61,815 OASAS 25,103 17,464 17,198 17,575 18,255 18,846 OASAS - Other 34,493 38,662 37,670 38,769 40,305 42,969Mental Health, Office of 1,145,091 1,102,070 1,104,515 1,135,076 1,183,479 1,242,948 OMH 405,609 252,055 290,845 291,573 310,013 316,935 OMH - Other 739,482 850,015 813,670 843,503 873,466 926,013People with Developmental Disabilities, Office for 1,168,196 1,125,656 1,122,650 1,166,568 1,192,852 1,268,545 OPWDD - Other 1,168,196 1,125,656 1,122,650 1,166,568 1,192,852 1,268,545Quality of Care and Advocacy for Persons With Disabilities, Commission on 2,202 2,338 2,356 2,422 2,492 2,567 Functional Total 2,375,085 2,286,190 2,284,389 2,360,410 2,437,383 2,575,875
PUBLIC PROTECTION/CRIMINAL JUSTICECriminal Justice Services, Division of 314 376 379 383 389 396Homeland Security and Emergency Services, Division of 334 9,383 9,645 9,730 9,982 10,271Indigent Legal Services, Office of 8 750 794 802 810 818Military and Naval Affairs, Division of 1,570 935 935 949 957 971State Police, Division of 161,378 164,236 51,194 51,870 52,049 52,060Statewide Financial System 3,977 9,139 10,814 10,895 10,977 11,060Statewide Wireless Network 8,076 0 0 0 0 0Victim Services, Office of 3,761 3,764 3,866 3,931 4,026 4,148 Functional Total 179,418 188,583 77,627 78,560 79,190 79,724
HIGHER EDUCATIONCity University of New York 85,732 96,651 85,125 85,763 86,406 87,055Higher Education - Miscellaneous 221 175 198 198 198 198Higher Education Services Corporation, New York State 32,756 32,134 30,166 30,554 31,247 32,058State University Construction Fund 12,562 15,544 0 0 0 0State University of New York 2,478,960 2,591,000 2,935,974 3,437,772 3,550,082 3,664,050 Functional Total 2,610,231 2,735,504 3,051,463 3,554,287 3,667,933 3,783,361
T-187
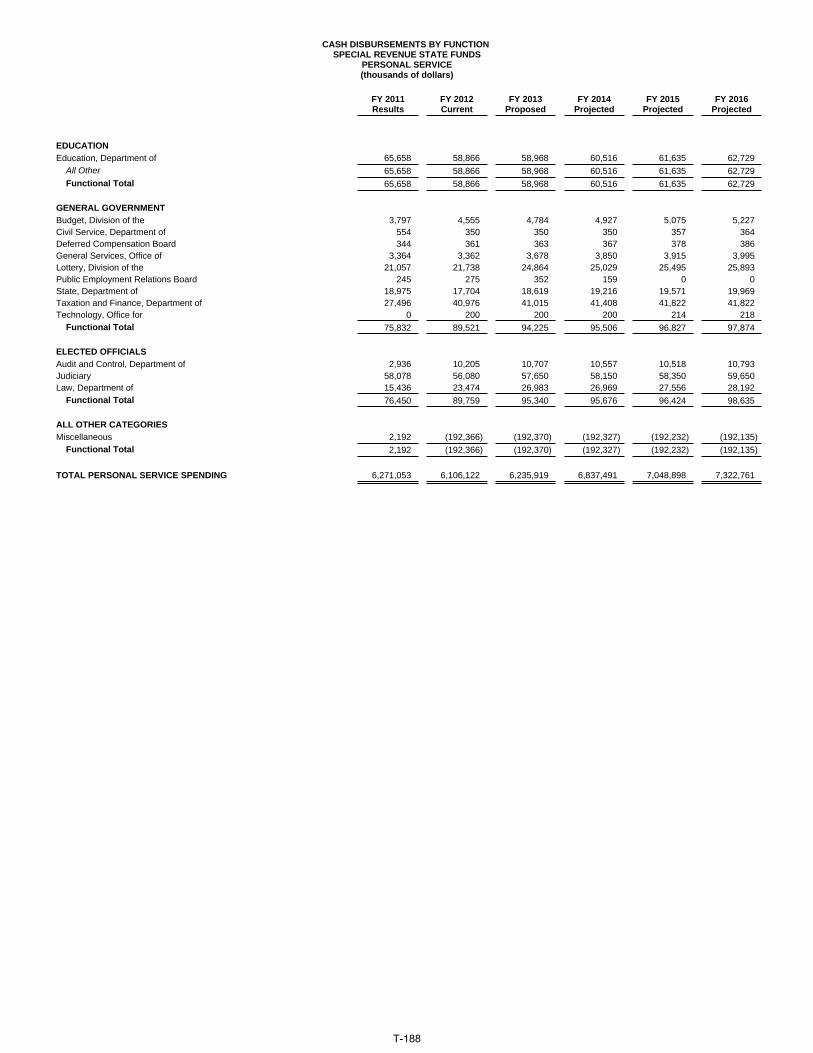
CASH DISBURSEMENTS BY FUNCTION SPECIAL REVENUE STATE FUNDS
PERSONAL SERVICE(thousands of dollars)
FY 2011Results
FY 2012Current
FY 2013Proposed
FY 2014Projected
FY 2015Projected
FY 2016Projected
EDUCATIONEducation, Department of 65,658 58,866 58,968 60,516 61,635 62,729 All Other 65,658 58,866 58,968 60,516 61,635 62,729 Functional Total 65,658 58,866 58,968 60,516 61,635 62,729
GENERAL GOVERNMENTBudget, Division of the 3,797 4,555 4,784 4,927 5,075 5,227Civil Service, Department of 554 350 350 350 357 364Deferred Compensation Board 344 361 363 367 378 386General Services, Office of 3,364 3,362 3,678 3,850 3,915 3,995Lottery, Division of the 21,057 21,738 24,864 25,029 25,495 25,893Public Employment Relations Board 245 275 352 159 0 0State, Department of 18,975 17,704 18,619 19,216 19,571 19,969Taxation and Finance, Department of 27,496 40,976 41,015 41,408 41,822 41,822Technology, Office for 0 200 200 200 214 218 Functional Total 75,832 89,521 94,225 95,506 96,827 97,874
ELECTED OFFICIALSAudit and Control, Department of 2,936 10,205 10,707 10,557 10,518 10,793Judiciary 58,078 56,080 57,650 58,150 58,350 59,650Law, Department of 15,436 23,474 26,983 26,969 27,556 28,192 Functional Total 76,450 89,759 95,340 95,676 96,424 98,635
ALL OTHER CATEGORIESMiscellaneous 2,192 (192,366) (192,370) (192,327) (192,232) (192,135) Functional Total 2,192 (192,366) (192,370) (192,327) (192,232) (192,135)
TOTAL PERSONAL SERVICE SPENDING 6,271,053 6,106,122 6,235,919 6,837,491 7,048,898 7,322,761
T-188

CASH DISBURSEMENTS BY FUNCTION SPECIAL REVENUE STATE FUNDS
NON-PERSONAL SERVICE/INDIRECT COSTS(thousands of dollars)
FY 2011Results
FY 2012Current
FY 2013Proposed
FY 2014Projected
FY 2015Projected
FY 2016Projected
ECONOMIC DEVELOPMENT AND GOVERNMENT OVERSIGHTAgriculture and Markets, Department of 20,236 19,986 17,511 17,551 17,950 17,953Alcoholic Beverage Control, Division of 4,069 5,071 5,444 5,577 5,712 5,851Economic Development, Department of 573 1,748 1,847 1,847 1,847 1,847Energy Research and Development Authority 1,850 1,815 1,854 1,895 1,895 1,895Financial Services, Department of 60,184 70,276 70,276 70,279 70,338 70,405Olympic Regional Development Authority 63 326 150 150 150 150Public Service Department 10,976 10,675 10,596 10,915 11,210 11,318Racing and Wagering Board, State 5,994 5,474 6,135 6,168 6,200 6,200 Functional Total 103,945 115,371 113,813 114,382 115,302 115,619
PARKS AND THE ENVIRONMENTEnvironmental Conservation, Department of 53,955 46,663 48,080 49,132 47,193 47,080Environmental Facilities Corporation 1,062 970 0 0 0 0Parks, Recreation and Historic Preservation, Office of 29,927 36,574 29,171 29,171 29,806 29,806 Functional Total 84,944 84,207 77,251 78,303 76,999 76,886
TRANSPORTATIONMotor Vehicles, Department of 16,944 20,848 21,899 22,355 22,887 23,440Transportation, Department of 20,747 25,718 12,591 12,936 13,257 13,598 Functional Total 37,691 46,566 34,490 35,291 36,144 37,038
HEALTHAging, Office for the 1 1 1 1 1 1Health, Department of 152,885 175,769 169,943 177,499 181,059 179,979 Public Health 152,885 175,769 169,943 177,499 181,059 179,979Medicaid Inspector General, Office of the 7 0 0 0 0 0Stem Cell and Innovation 36,437 45,000 50,000 63,673 61,373 50,000 Functional Total 189,330 220,770 219,944 241,173 242,433 229,980
SOCIAL WELFAREChildren and Family Services, Office of 26,892 34,183 35,083 35,181 36,026 36,027 OCFS 26,892 34,183 35,083 35,181 36,026 36,027Housing and Community Renewal, Division of 6,807 5,072 4,934 5,059 5,180 5,235Labor, Department of 12,740 19,068 18,691 15,413 15,783 16,041Prevention of Domestic Violence, Office for 28 2 2 2 2 2Temporary and Disability Assistance, Office of 60,268 68,520 200 200 200 200 All Other 60,268 68,520 200 200 200 200Welfare Inspector General, Office of 660 476 485 485 496 496Workers' Compensation Board 61,798 71,330 64,018 59,407 60,331 61,276 Functional Total 169,193 198,651 123,413 115,747 118,018 119,277
MENTAL HYGIENEAlcoholism and Substance Abuse Services, Office of 21,222 19,130 18,691 18,669 19,187 19,703 OASAS 9,351 10,321 9,808 9,790 10,045 10,289 OASAS - Other 11,871 8,809 8,883 8,879 9,142 9,414Mental Health, Office of 310,512 294,068 288,983 312,974 332,010 333,785 OMH 76,696 63,167 78,624 81,667 81,309 81,619 OMH - Other 233,816 230,901 210,359 231,307 250,701 252,166Mental Hygiene, Department of 345 0 0 0 0 0People with Developmental Disabilities, Office for 373,896 369,645 363,003 376,439 387,133 397,273 OPWDD (6,620) 176 176 181 181 181 OPWDD - Other 380,516 369,469 362,827 376,258 386,952 397,092Quality of Care and Advocacy for Persons With Disabilities, Commission on 166 278 277 282 288 296 Functional Total 706,141 683,121 670,954 708,364 738,618 751,057
PUBLIC PROTECTION/CRIMINAL JUSTICECorrectional Services, Department of 1,055 1,704 1,569 1,569 1,569 1,569Criminal Justice Services, Division of 6,901 18,960 18,710 15,213 15,217 15,222Homeland Security and Emergency Services, Division of 2,701 38,544 33,520 21,673 17,745 18,334Indigent Legal Services, Office of 25,016 391 340 349 357 365Military and Naval Affairs, Division of 5,600 6,033 3,536 4,536 4,536 4,536State Police, Division of 31,745 59,168 42,805 30,371 30,436 30,446Statewide Financial System 5,092 31,499 39,387 40,630 41,849 43,104Statewide Wireless Network 19,579 0 0 0 0 0Victim Services, Office of 760 1,037 916 931 948 965 Functional Total 98,449 157,336 140,783 115,272 112,657 114,541
HIGHER EDUCATIONCity University of New York 31,367 40,096 34,687 35,572 36,489 37,463Higher Education - Miscellaneous 34 45 1,003 1,003 1,003 1,003Higher Education Services Corporation, New York State 30,778 42,742 38,814 39,755 40,729 41,763State University Construction Fund 1,876 3,035 0 0 0 0
T-189

CASH DISBURSEMENTS BY FUNCTION SPECIAL REVENUE STATE FUNDS
NON-PERSONAL SERVICE/INDIRECT COSTS(thousands of dollars)
FY 2011Results
FY 2012Current
FY 2013Proposed
FY 2014Projected
FY 2015Projected
FY 2016Projected
State University of New York 1,371,819 1,639,320 1,784,867 2,017,177 2,070,562 2,124,912 Functional Total 1,435,874 1,725,238 1,859,371 2,093,507 2,148,783 2,205,141
EDUCATIONEducation, Department of 25,468 29,027 26,275 25,546 25,977 26,284 All Other 25,468 29,027 26,275 25,546 25,977 26,284 Functional Total 25,468 29,027 26,275 25,546 25,977 26,284
GENERAL GOVERNMENTBudget, Division of the 5,356 9,076 8,629 9,260 10,040 10,102Civil Service, Department of 731 766 811 1,111 1,211 1,211Deferred Compensation Board 62 185 189 194 199 199Elections, State Board of 90 1,896 0 0 0 0Employee Relations, Office of 0 54 56 58 58 58General Services, Office of 4,519 8,740 4,381 4,509 4,665 4,759Inspector General, Office of the 70 87 87 87 87 87Labor Management Committees 92 300 300 300 300 300Lottery, Division of the 131,898 140,702 126,971 130,168 133,585 133,585Public Employment Relations Board 83 300 39 43 43 43State, Department of 6,021 10,711 11,330 11,516 11,737 11,748Taxation and Finance, Department of 24,397 28,598 28,601 29,302 29,982 29,982Technology, Office for 0 3,300 1,086 86 100 100 Functional Total 173,319 204,715 182,480 186,634 192,007 192,174
ELECTED OFFICIALSAudit and Control, Department of 313 5,544 5,069 6,485 6,643 6,804Judiciary 18,022 47,300 48,650 48,650 48,650 48,950Law, Department of 35,828 40,117 39,212 39,375 40,293 41,239Legislature 796 950 950 950 950 950 Functional Total 54,959 93,911 93,881 95,460 96,536 97,943
ALL OTHER CATEGORIESMiscellaneous 1,145 (203,494) (281,530) (283,129) (276,429) (276,383) Functional Total 1,145 (203,494) (281,530) (283,129) (276,429) (276,383)
TOTAL NON-PERSONAL SERVICE/INDIRECT COSTS SPENDING 3,080,458 3,355,419 3,261,125 3,526,550 3,627,045 3,689,557
T-190

CASH DISBURSEMENTS BY FUNCTION SPECIAL REVENUE STATE FUNDS
GENERAL STATE CHARGES(thousands of dollars)
FY 2011Results
FY 2012Current
FY 2013Proposed
FY 2014Projected
FY 2015Projected
FY 2016Projected
ECONOMIC DEVELOPMENT AND GOVERNMENT OVERSIGHTAgriculture and Markets, Department of 4,749 5,142 2,063 2,271 2,545 2,601Alcoholic Beverage Control, Division of 4,125 3,753 4,230 4,491 4,761 5,004Economic Development, Department of 21 28 28 28 28 28Energy Research and Development Authority 1,406 1,583 1,638 1,758 1,758 1,758Financial Services, Department of 66,829 66,928 66,930 66,986 68,236 69,800Public Service Department 20,299 18,931 21,553 24,284 26,488 28,678Racing and Wagering Board, State 3,517 2,728 3,054 3,287 3,512 3,512 Functional Total 100,946 99,093 99,496 103,105 107,328 111,381
PARKS AND THE ENVIRONMENTEnvironmental Conservation, Department of 37,838 34,490 35,575 34,793 35,544 36,404Environmental Facilities Corporation 2,268 3,122 0 0 0 0Parks, Recreation and Historic Preservation, Office of 2,627 3,685 3,685 3,827 3,890 3,934 Functional Total 42,733 41,297 39,260 38,620 39,434 40,338
TRANSPORTATIONMotor Vehicles, Department of 27,440 23,258 25,808 28,079 30,196 32,298Transportation, Department of 403 7,903 4,951 5,394 5,790 6,196 Functional Total 27,843 31,161 30,759 33,473 35,986 38,494
HEALTHHealth, Department of 33,594 40,596 43,362 46,570 47,882 49,504 Public Health 33,594 40,596 43,362 46,570 47,882 49,504Medicaid Inspector General, Office of the 94 0 0 0 0 0Stem Cell and Innovation 318 0 0 0 0 0 Functional Total 34,006 40,596 43,362 46,570 47,882 49,504
SOCIAL WELFAREChildren and Family Services, Office of 2,325 2,666 2,666 2,786 2,818 2,859 OCFS 2,325 2,666 2,666 2,786 2,818 2,859Housing and Community Renewal, Division of 16,197 15,483 16,501 17,530 18,670 19,581Labor, Department of 15,601 15,917 17,879 19,145 19,734 20,031Temporary and Disability Assistance, Office of 1,449 1,309 0 0 0 0 All Other 1,449 1,309 0 0 0 0Welfare Inspector General, Office of 56 214 221 221 222 224Workers' Compensation Board 43,152 41,697 46,062 49,193 52,898 56,581 Functional Total 78,780 77,286 83,329 88,875 94,342 99,276
MENTAL HYGIENEAlcoholism and Substance Abuse Services, Office of 28,405 28,264 28,108 30,148 33,058 36,513 OASAS 12,170 12,307 8,787 9,399 10,301 11,127 OASAS - Other 16,235 15,957 19,321 20,749 22,757 25,386Mental Health, Office of 559,405 515,700 562,990 608,221 665,186 732,864 OMH 198,061 127,947 130,363 156,474 172,761 187,150 OMH - Other 361,344 387,753 432,627 451,747 492,425 545,714People with Developmental Disabilities, Office for 579,990 533,468 594,100 647,238 698,521 767,874 OPWDD - Other 579,990 533,468 594,100 647,238 698,521 767,874Quality of Care and Advocacy for Persons With Disabilities, Commission on 1,017 1,141 1,217 1,302 1,410 1,519 Functional Total 1,168,817 1,078,573 1,186,415 1,286,909 1,398,175 1,538,770
PUBLIC PROTECTION/CRIMINAL JUSTICECriminal Justice Services, Division of 86 201 195 208 226 242Homeland Security and Emergency Services, Division of 196 701 705 705 705 705Indigent Legal Services, Office of 0 359 410 437 464 489Military and Naval Affairs, Division of 583 250 250 250 250 250State Police, Division of 20,735 19,944 22,857 24,073 25,230 26,230Statewide Financial System 1 0 0 0 0 0Statewide Wireless Network 598 0 0 0 0 0Victim Services, Office of 888 1,599 1,777 1,887 2,000 2,102 Functional Total 23,087 23,054 26,194 27,560 28,875 30,018
HIGHER EDUCATIONCity University of New York 6,400 6,541 6,685 6,833 6,833 6,833Higher Education - Miscellaneous 115 135 99 99 99 99Higher Education Services Corporation, New York State 14,829 13,416 15,131 16,363 17,337 18,223State University Construction Fund 4,477 7,593 0 0 0 0State University of New York 319,122 300,705 302,874 318,387 350,436 350,436 Functional Total 344,943 328,390 324,789 341,682 374,705 375,591
T-191

CASH DISBURSEMENTS BY FUNCTION SPECIAL REVENUE STATE FUNDS
GENERAL STATE CHARGES(thousands of dollars)
FY 2011Results
FY 2012Current
FY 2013Proposed
FY 2014Projected
FY 2015Projected
FY 2016Projected
EDUCATIONEducation, Department of 27,881 27,876 30,333 32,959 35,487 37,194 All Other 27,881 27,876 30,333 32,959 35,487 37,194 Functional Total 27,881 27,876 30,333 32,959 35,487 37,194
GENERAL GOVERNMENTBudget, Division of the 1,744 2,079 2,297 2,650 2,874 3,094Civil Service, Department of 219 219 168 168 172 176Deferred Compensation Board 162 176 191 208 225 225General Services, Office of 1,290 2,144 1,901 2,002 2,144 2,284Lottery, Division of the 9,955 11,465 13,055 13,879 13,978 13,978State, Department of 9,186 7,752 8,898 9,704 10,595 10,844Taxation and Finance, Department of 23,256 18,858 21,522 22,820 23,047 23,047Technology, Office for 0 500 500 500 500 500 Functional Total 45,812 43,193 48,532 51,931 53,535 54,148
ELECTED OFFICIALSAudit and Control, Department of 1,382 2,741 2,061 1,522 1,633 1,744Judiciary 9,343 23,798 24,498 24,498 24,598 25,098Law, Department of 7,884 11,081 14,030 15,103 16,293 17,381 Functional Total 18,609 37,620 40,589 41,123 42,524 44,223
ALL OTHER CATEGORIESMiscellaneous 1,067 1,332 1,389 1,527 1,660 1,783 Functional Total 1,067 1,332 1,389 1,527 1,660 1,783
TOTAL GENERAL STATE CHARGES SPENDING 1,914,524 1,829,471 1,954,447 2,094,334 2,259,933 2,420,720
T-192

CASH DISBURSEMENTS BY FUNCTION SPECIAL REVENUE FEDERAL FUNDS
LOCAL ASSISTANCE GRANTS(thousands of dollars)
FY 2011Results
FY 2012Current
FY 2013Proposed
FY 2014Projected
FY 2015Projected
FY 2016Projected
ECONOMIC DEVELOPMENT AND GOVERNMENT OVERSIGHTEconomic Development, Department of 0 24,366 24,366 24,920 100 100 Functional Total 0 24,366 24,366 24,920 100 100
PARKS AND THE ENVIRONMENTParks, Recreation and Historic Preservation, Office of 2,034 1,270 1,270 1,270 1,270 1,270 Functional Total 2,034 1,270 1,270 1,270 1,270 1,270
TRANSPORTATIONMotor Vehicles, Department of 15,734 17,800 14,800 14,800 14,800 14,800Transportation, Department of 40,442 40,103 40,103 40,103 40,103 40,103 Functional Total 56,176 57,903 54,903 54,903 54,903 54,903
HEALTHAging, Office for the 105,584 91,769 92,769 92,769 92,769 92,769Health, Department of 28,861,695 25,559,084 25,386,999 27,327,944 31,330,308 33,853,968 Medical Assistance 27,224,374 23,850,643 23,626,554 25,523,246 29,516,133 32,080,857 Medicaid Administration 417,899 573,750 591,750 599,150 574,450 514,950 Public Health 1,219,422 1,134,691 1,168,695 1,205,548 1,239,725 1,258,161 Functional Total 28,967,279 25,650,853 25,479,768 27,420,713 31,423,077 33,946,737
SOCIAL WELFAREChildren and Family Services, Office of 1,039,761 997,752 934,800 934,800 934,800 934,800 OCFS 1,039,761 997,752 934,800 934,800 934,800 934,800Housing and Community Renewal, Division of 171,324 205,848 51,337 51,337 51,337 51,337Labor, Department of 184,558 202,192 192,720 183,247 183,247 183,247Temporary and Disability Assistance, Office of 3,654,062 3,537,159 3,389,730 3,218,180 3,218,180 3,218,180 Welfare Assistance 2,673,849 2,624,909 2,584,480 2,412,930 2,412,930 2,412,930 All Other 980,213 912,250 805,250 805,250 805,250 805,250 Functional Total 5,049,705 4,942,951 4,568,587 4,387,564 4,387,564 4,387,564
MENTAL HYGIENEAlcoholism and Substance Abuse Services, Office of 146,803 104,970 107,670 107,670 107,670 107,670 OASAS 146,803 104,970 107,670 107,670 107,670 107,670Mental Health, Office of 81,244 50,138 50,930 50,930 50,930 50,930 OMH 81,244 50,138 50,930 50,930 50,930 50,930People with Developmental Disabilities, Office for 4,279 0 0 0 0 0 OPWDD 4,279 0 0 0 0 0 Functional Total 232,326 155,108 158,600 158,600 158,600 158,600
PUBLIC PROTECTION/CRIMINAL JUSTICECorrectional Services, Department of 238 0 0 0 0 0Criminal Justice Services, Division of 36,971 37,800 37,939 18,800 18,800 18,800Homeland Security and Emergency Services, Division of 308,771 298,771 374,771 378,771 378,771 378,771Military and Naval Affairs, Division of 166 0 0 0 0 0Victim Services, Office of 33,375 30,128 30,128 30,128 30,128 30,128 Functional Total 379,521 366,699 442,838 427,699 427,699 427,699
HIGHER EDUCATIONCity University of New York 32,779 0 0 0 0 0Higher Education Services Corporation, New York State 59,049 0 0 0 0 0State University of New York 89,476 7,941 7,941 7,941 7,941 7,941 Functional Total 181,304 7,941 7,941 7,941 7,941 7,941
EDUCATIONArts, Council on the 845 420 420 420 420 420Education, Department of 5,904,506 4,722,877 3,616,590 3,627,348 3,533,996 3,512,940 School Aid 4,639,423 3,654,169 2,842,525 2,685,500 2,650,000 2,708,500 Special Education Categorical Programs 1,235,197 968,657 640,000 680,000 715,000 736,500 All Other 29,886 100,051 134,065 261,848 168,996 67,940 Functional Total 5,905,351 4,723,297 3,617,010 3,627,768 3,534,416 3,513,360
GENERAL GOVERNMENTElections, State Board of 25,231 2,458 0 0 0 0General Services, Office of 0 250 250 250 250 250State, Department of 105,534 55,457 55,457 55,457 55,457 55,457 Functional Total 130,765 58,165 55,707 55,707 55,707 55,707
ALL OTHER CATEGORIESMiscellaneous (297,176) (279,000) (281,000) (281,000) (281,000) (281,000) Functional Total (297,176) (279,000) (281,000) (281,000) (281,000) (281,000)
TOTAL LOCAL ASSISTANCE GRANTS SPENDING 40,607,285 35,709,553 34,129,990 35,886,085 39,770,277 42,272,881
T-193

CASH DISBURSEMENTS BY FUNCTION SPECIAL REVENUE FEDERAL FUNDS
PERSONAL SERVICE(thousands of dollars)
FY 2011Results
FY 2012Current
FY 2013Proposed
FY 2014Projected
FY 2015Projected
FY 2016Projected
ECONOMIC DEVELOPMENT AND GOVERNMENT OVERSIGHTAgriculture and Markets, Department of 2,295 2,155 2,198 2,242 2,298 2,311Public Service Department 1,488 1,426 1,561 1,412 1,438 1,467 Functional Total 3,783 3,581 3,759 3,654 3,736 3,778
PARKS AND THE ENVIRONMENTEnvironmental Conservation, Department of 24,693 24,069 24,069 24,170 24,610 25,054Parks, Recreation and Historic Preservation, Office of 1,187 1,010 1,010 1,015 1,037 1,053 Functional Total 25,880 25,079 25,079 25,185 25,647 26,107
TRANSPORTATIONMotor Vehicles, Department of 1,319 1,203 1,243 1,260 1,292 1,328Transportation, Department of 4,457 4,211 5,042 5,152 5,264 5,387 Functional Total 5,776 5,414 6,285 6,412 6,556 6,715
HEALTHAging, Office for the 6,682 6,609 7,031 7,041 7,170 7,316Health, Department of 56,699 54,467 54,374 54,468 55,457 56,593 Public Health 56,699 54,467 54,374 54,468 55,457 56,593Medicaid Inspector General, Office of the 20,811 19,768 18,379 18,850 19,717 20,179 Functional Total 84,192 80,844 79,784 80,359 82,344 84,088
SOCIAL WELFAREChildren and Family Services, Office of 27,653 27,052 29,082 27,565 28,376 28,984 OCFS 27,653 27,052 29,082 27,565 28,376 28,984Housing and Community Renewal, Division of 8,658 7,156 5,031 5,098 5,300 5,592Human Rights, Division of 1,754 2,554 2,730 2,739 2,831 2,929Labor, Department of 217,095 188,805 171,854 166,156 170,187 174,966National and Community Service 357 354 354 358 362 362Prevention of Domestic Violence, Office for (10) 0 0 0 3 8Temporary and Disability Assistance, Office of 104,177 109,923 83,446 84,445 86,895 89,587 All Other 104,177 109,923 83,446 84,445 86,895 89,587 Functional Total 359,684 335,844 292,497 286,361 293,954 302,428
MENTAL HYGIENEAlcoholism and Substance Abuse Services, Office of 3,951 6,072 5,612 5,661 5,213 5,265 OASAS 3,951 6,072 5,612 5,661 5,213 5,265Developmental Disabilities Planning Council 1,190 1,197 1,197 1,211 1,230 1,253Mental Health, Office of 107 578 578 584 584 584 OMH 107 578 578 584 584 584People with Developmental Disabilities, Office for 42 116 116 116 116 116 OPWDD 42 116 116 116 116 116Quality of Care and Advocacy for Persons With Disabilities, Commission on 1,582 1,648 1,661 1,711 1,753 1,800 Functional Total 6,872 9,611 9,164 9,283 8,896 9,018
PUBLIC PROTECTION/CRIMINAL JUSTICECorrectional Services, Department of 28,855 25,272 25,948 26,648 26,939 26,999Criminal Justice Services, Division of 10,421 10,500 8,634 5,253 5,397 5,560Homeland Security and Emergency Services, Division of 6,250 6,251 6,251 6,271 6,371 6,490Military and Naval Affairs, Division of 22,424 22,146 22,146 22,335 22,455 22,666State Police, Division of 8,065 5,050 5,100 5,150 5,200 5,200Victim Services, Office of 1,189 1,500 1,500 1,515 1,578 1,657 Functional Total 77,204 70,719 69,579 67,172 67,940 68,572
HIGHER EDUCATIONHigher Education Services Corporation, New York State 160 836 836 836 836 836State University of New York 9,319 7,232 7,229 7,229 7,229 7,229 Functional Total 9,479 8,068 8,065 8,065 8,065 8,065
EDUCATIONEducation, Department of 85,866 83,107 83,362 83,693 84,752 84,486 All Other 85,866 83,107 83,362 83,693 84,752 84,486 Functional Total 85,866 83,107 83,362 83,693 84,752 84,486
GENERAL GOVERNMENTElections, State Board of 169 40 0 0 0 0State, Department of 3,401 3,464 3,508 3,561 3,663 3,731Taxation and Finance, Department of 2 0 0 0 0 0Veterans' Affairs, Division of 662 750 757 767 782 796 Functional Total 4,234 4,254 4,265 4,328 4,445 4,527
T-194

CASH DISBURSEMENTS BY FUNCTION SPECIAL REVENUE FEDERAL FUNDS
PERSONAL SERVICE(thousands of dollars)
FY 2011Results
FY 2012Current
FY 2013Proposed
FY 2014Projected
FY 2015Projected
FY 2016Projected
ELECTED OFFICIALSJudiciary 1,855 0 0 0 0 0Law, Department of 17,526 16,248 19,474 19,689 20,027 20,396 Functional Total 19,381 16,248 19,474 19,689 20,027 20,396
TOTAL PERSONAL SERVICE SPENDING 682,351 642,769 601,313 594,201 606,362 618,180
T-195

CASH DISBURSEMENTS BY FUNCTION SPECIAL REVENUE FEDERAL FUNDS
NON-PERSONAL SERVICE/INDIRECT COSTS(thousands of dollars)
FY 2011Results
FY 2012Current
FY 2013Proposed
FY 2014Projected
FY 2015Projected
FY 2016Projected
ECONOMIC DEVELOPMENT AND GOVERNMENT OVERSIGHTAgriculture and Markets, Department of 9,890 9,537 9,539 9,540 9,769 9,770Economic Development, Department of 0 245 245 245 245 245Financial Services, Department of 102 0 0 0 0 0Public Service Department 138 316 314 282 283 283 Functional Total 10,130 10,098 10,098 10,067 10,297 10,298
PARKS AND THE ENVIRONMENTAdirondack Park Agency 81 350 350 350 350 350Environmental Conservation, Department of 22,041 15,556 15,556 15,556 15,556 15,556Parks, Recreation and Historic Preservation, Office of 2,028 1,085 1,085 1,085 1,110 1,110 Functional Total 24,150 16,991 16,991 16,991 17,016 17,016
TRANSPORTATIONMotor Vehicles, Department of 1,975 2,516 2,557 2,607 2,670 2,733Transportation, Department of 2,463 2,685 2,546 2,610 2,675 2,745 Functional Total 4,438 5,201 5,103 5,217 5,345 5,478
HEALTHAging, Office for the 1,469 1,018 1,018 1,018 1,018 1,018Health, Department of 145,799 128,321 128,321 128,328 128,384 128,445 Public Health 145,799 128,321 128,321 128,328 128,384 128,445Medicaid Inspector General, Office of the 9,043 12,329 12,329 12,330 12,703 12,729 Functional Total 156,311 141,668 141,668 141,676 142,105 142,192
SOCIAL WELFAREChildren and Family Services, Office of 55,455 64,406 61,226 61,226 62,765 62,776 OCFS 55,455 64,406 61,226 61,226 62,765 62,776Housing and Community Renewal, Division of 1,810 3,030 2,227 2,305 2,381 2,420Human Rights, Division of 2,173 1,329 1,241 1,241 1,295 1,328Labor, Department of 144,924 113,617 109,514 104,256 104,256 104,256National and Community Service 23,993 13,646 13,646 13,646 13,860 13,860Temporary and Disability Assistance, Office of 57,968 74,598 65,182 65,251 65,316 66,994 All Other 57,968 74,598 65,182 65,251 65,316 66,994Workers' Compensation Board 4,707 3,532 3,532 3,624 3,624 3,624 Functional Total 291,030 274,158 256,568 251,549 253,497 255,258
MENTAL HYGIENEAlcoholism and Substance Abuse Services, Office of 1,378 1,728 1,811 1,817 1,844 1,887 OASAS 1,378 1,728 1,811 1,817 1,844 1,887Developmental Disabilities Planning Council 1,704 2,383 2,468 2,340 2,259 2,188Mental Health, Office of 464 150 149 153 153 153 OMH 464 150 149 153 153 153People with Developmental Disabilities, Office for 8,264 53,340 33,490 34,361 34,361 34,361 OPWDD 8,264 53,340 33,490 34,361 34,361 34,361Quality of Care and Advocacy for Persons With Disabilities, Commission on 4,238 4,488 4,589 4,705 4,819 4,947 Functional Total 16,048 62,089 42,507 43,376 43,436 43,536
PUBLIC PROTECTION/CRIMINAL JUSTICECorrectional Services, Department of 790 1,210 1,242 1,277 1,311 1,311Criminal Justice Services, Division of 8,431 8,552 8,752 6,502 6,503 6,504Homeland Security and Emergency Services, Division of 6,812 6,812 6,812 6,812 6,812 6,812Military and Naval Affairs, Division of 13,083 12,254 12,254 12,254 12,254 12,254State Police, Division of 14,358 2,500 2,500 2,500 2,500 2,500Victim Services, Office of 364 502 502 502 502 502 Functional Total 43,838 31,830 32,062 29,847 29,882 29,883
HIGHER EDUCATIONHigher Education Services Corporation, New York State 7,801 11,396 5,797 5,797 5,797 5,797State University of New York 309,880 227,631 227,631 227,631 227,631 227,631 Functional Total 317,681 239,027 233,428 233,428 233,428 233,428
EDUCATIONArts, Council on the 0 100 100 100 100 100Education, Department of 65,439 104,797 123,188 192,927 132,330 62,617 All Other 65,439 104,797 123,188 192,927 132,330 62,617 Functional Total 65,439 104,897 123,288 193,027 132,430 62,717
GENERAL GOVERNMENTElections, State Board of 62,087 46,087 0 0 0 0General Services, Office of 7,277 4,987 4,987 4,987 4,987 4,987State, Department of 1,043 3,811 3,898 3,988 4,080 4,080
T-196

CASH DISBURSEMENTS BY FUNCTION SPECIAL REVENUE FEDERAL FUNDS
NON-PERSONAL SERVICE/INDIRECT COSTS(thousands of dollars)
FY 2011Results
FY 2012Current
FY 2013Proposed
FY 2014Projected
FY 2015Projected
FY 2016Projected
Taxation and Finance, Department of 140 210 210 215 220 220Technology, Office for 4,354 0 0 0 0 0Veterans' Affairs, Division of 206 540 553 565 578 592 Functional Total 75,107 55,635 9,648 9,755 9,865 9,879
ELECTED OFFICIALSJudiciary 3,918 7,500 7,500 7,500 7,500 7,500Law, Department of 5,647 9,435 8,127 8,288 8,372 8,659 Functional Total 9,565 16,935 15,627 15,788 15,872 16,159
TOTAL NON-PERSONAL SERVICE/INDIRECT COSTS SPENDING 1,013,737 958,529 886,988 950,721 893,173 825,844
T-197

CASH DISBURSEMENTS BY FUNCTION SPECIAL REVENUE FEDERAL FUNDS
GENERAL STATE CHARGES(thousands of dollars)
FY 2011Results
FY 2012Current
FY 2013Proposed
FY 2014Projected
FY 2015Projected
FY 2016Projected
ECONOMIC DEVELOPMENT AND GOVERNMENT OVERSIGHTAgriculture and Markets, Department of 1,000 929 1,148 1,256 1,376 1,384Public Service Department 586 647 802 760 814 832 Functional Total 1,586 1,576 1,950 2,016 2,190 2,216
PARKS AND THE ENVIRONMENTEnvironmental Conservation, Department of 9,544 9,811 9,811 9,865 10,106 10,374Parks, Recreation and Historic Preservation, Office of 92 508 508 511 621 630 Functional Total 9,636 10,319 10,319 10,376 10,727 11,004
TRANSPORTATIONMotor Vehicles, Department of 518 521 623 679 732 784Transportation, Department of 2,116 2,452 2,529 2,773 2,970 3,169 Functional Total 2,634 2,973 3,152 3,452 3,702 3,953
HEALTHAging, Office for the 0 235 235 235 235 235Health, Department of 26,855 23,006 23,006 23,056 23,620 24,316 Public Health 26,855 23,006 23,006 23,056 23,620 24,316Medicaid Inspector General, Office of the 8,905 10,738 10,738 10,749 10,980 11,264 Functional Total 35,760 33,979 33,979 34,040 34,835 35,815
SOCIAL WELFAREChildren and Family Services, Office of 9,890 9,913 9,913 8,931 9,236 9,608 OCFS 9,890 9,913 9,913 8,931 9,236 9,608Housing and Community Renewal, Division of 3,652 3,283 2,689 2,937 3,199 3,146Human Rights, Division of 1,047 2,530 2,912 3,066 2,997 3,020Labor, Department of 91,806 122,036 135,359 137,970 137,970 137,970Temporary and Disability Assistance, Office of 46,002 52,120 44,123 44,463 44,973 44,973 All Other 46,002 52,120 44,123 44,463 44,973 44,973 Functional Total 152,397 189,882 194,996 197,367 198,375 198,717
MENTAL HYGIENEAlcoholism and Substance Abuse Services, Office of 14 0 2,831 2,994 2,908 3,071 OASAS 14 0 2,831 2,994 2,908 3,071Developmental Disabilities Planning Council 0 620 535 649 711 758Mental Health, Office of 505 250 290 315 331 345 OMH 505 250 290 315 331 345People with Developmental Disabilities, Office for 19 62 70 74 74 74 OPWDD 19 62 70 74 74 74Quality of Care and Advocacy for Persons With Disabilities, Commission on 675 733 819 906 982 1,055 Functional Total 1,213 1,665 4,545 4,938 5,006 5,303
PUBLIC PROTECTION/CRIMINAL JUSTICECorrectional Services, Department of 757 1,415 1,415 1,415 1,415 1,415Criminal Justice Services, Division of 166 200 200 201 219 240Homeland Security and Emergency Services, Division of 2,916 2,916 2,916 2,916 2,916 2,916Military and Naval Affairs, Division of 7,645 6,499 6,499 6,499 6,499 6,499State Police, Division of 594 0 0 0 0 0Victim Services, Office of 0 326 326 326 326 326 Functional Total 12,078 11,356 11,356 11,357 11,375 11,396
HIGHER EDUCATIONHigher Education Services Corporation, New York State 56 369 419 419 419 419State University of New York 76 53 51 51 51 51 Functional Total 132 422 470 470 470 470
EDUCATIONEducation, Department of 34,830 35,138 42,227 45,016 48,188 49,907 All Other 34,830 35,138 42,227 45,016 48,188 49,907 Functional Total 34,830 35,138 42,227 45,016 48,188 49,907
GENERAL GOVERNMENTElections, State Board of 0 115 0 0 0 0State, Department of 1,100 1,910 2,313 2,486 2,693 2,734Veterans' Affairs, Division of 431 350 350 350 350 350 Functional Total 1,531 2,375 2,663 2,836 3,043 3,084
ELECTED OFFICIALSJudiciary 19 0 0 0 0 0Law, Department of 7,778 7,068 8,608 8,608 8,799 9,025 Functional Total 7,797 7,068 8,608 8,608 8,799 9,025
TOTAL GENERAL STATE CHARGES SPENDING 259,594 296,753 314,265 320,476 326,710 330,890
T-198

Sending Agency Fund / Account Account NameFY 2012 Current
FY 2013 Proposed
FY 2014 Projected
FY 2015 Projected
FY 2016 Projected
RBTF - Dedicated PIT in excess of Debt Service 8,069,103 8,284,079 8,820,384 8,985,877 9,194,282
LGAC - Dedicated Sales Tax in excess of Debt Service 2,430,132 2,466,014 2,589,963 2,717,192 2,843,095
CWCA - Real EDOS Transfer Tax in excess of Debt Service 396,988 474,073 559,518 635,587 710,630
Total All Other Transfers 1,092,820 989,254 878,138 785,714 775,560CQCAPD 020.D1 Disab Tech Asst 51 181 51 51 51 SED OTH 050.01 Tuition Reimb 23 23 23 23 23 SED OTH 050.02 Prop Vocational Sch 297 297 297 297 297 SED OTH 052.01 Local Govt Record 782 782 782 782 782 DOCCS 059.01 Alcohol&Substance 19 - - - - AGRIC & MARKETS 261.00 Fed USDA/FNS - 450 450 450 450 TADA OTH 261.00 Fed USDA/FNS - 30,000 30,000 30,000 30,000 AGRIC & MARKETS 265.00 Federal HHS - 50 50 50 50 TADA OTH 265.00 Federal HHS 41,000 163,600 153,600 91,600 91,600 OCFS 265.00 Federal HHS 2,500 28,670 28,670 28,670 28,670 OMH 265.00 Federal HHS 210 171 13 20 6 OCFS 267.00 Fed Education - 900 900 900 900 ENCON 301.48 Waste Tire Mgt/Recycle 5,946 5,946 5,946 - - ENCON 301.49 Oil & Gas Acct 48 48 48 48 48 ENCON 301.BJ Indirect Charge 523 523 523 523 523 ENCON 301.S4 Encon Magazine 131 131 131 131 131 ENCON 301.XB Mined Land Reclamation 1,700 1,700 1,700 1,700 1,700 ENCON 303.03 Oil Spill - DEC 574 574 574 574 574 LABOR 305.01 OSH Trng & Educ 866 866 866 866 866 LABOR 305.02 OSHA Inspection 2,188 2,188 2,188 2,188 2,188 OCFS 307.01 Equip Loan Fund 7 7 7 7 7 ENCON 312.00 Hazardous Waste 34,750 28,750 28,750 28,750 28,750 DOT 313.02 Metro Mass Tran 10,008 - - - - DMV 314.02 Mobile Source - 30 30 30 30 OGS 323.15 Design & Construction 6,000 - - - - FPSRF 339.00 State Special Revenue 64,628 - - - - DOH 339.03 S P A R C S 885 885 885 885 885 OPWDD 339.05 OPWDD Provider 7,041 6,189 6,189 - - DOS 339.07 Fire Prev/Code 14,810 14,810 14,810 14,810 14,810 MENTAL HYGIENE 339.10 Mental Hygiene 290,846 - - - - MENTAL HYGIENE 339.13 M H Patient Inc 60,942 - - - - DOH 339.26 Cert of Need 1,086 1,086 1,086 1,086 1,086 DOH 339.28 Retir Community 2 2 2 2 2 LABOR 339.30 DOL Fee Penalty 8,372 8,372 8,372 8,372 8,372 PARKS 339.39 I Love NY Water 64 64 64 64 64 DOT 339.42 Transportation Surplus Property 803 803 803 803 803 DOH 339.44 Hosp & Nurs Mgt 376 376 376 376 376 OTDA 339.48 ODTA Training Contract - 1,010 - - - OTDA 339.50 ODTA Training Mgmt - 65 - - - OASAS 339.51 Methadone Registry Services - 242 248 254 260 HSES 339.61 Radiology 1,350 1,350 1,350 1,350 1,350 DCJS 339.62 Crim Justice Improvement 22,052 26,852 22,000 19,000 19,000 DOS 339.72 NY Fire Academy 247 247 247 247 247 DOH 339.81 Envir.Lab.Fee 183 183 183 183 183 OCFS 339.88 Train Mgmt Evaluation 488 488 488 488 488 DOH 339.95 Radio Hlth Protect 216 216 216 216 216 SED OTH 339.A4 Teacher Certif 693 861 861 861 861 BANKING/DFR 339.A5 Banking Dept 2,413 2,413 2,413 2,413 2,413 DED 339.A7 Econ Devel Asst 92 - - - - DMV 339.AE Motorcycle Safety 5 6 6 6 6 DOS 339.AG Business Licens 40,546 39,960 37,710 37,710 37,710 OTDA 339.AX Child Support Revenue - 75 - - - DOH 339.B4 Radon Detct Dev 2 2 2 2 2 DOS 339.B8 Fire Protection 13 13 13 13 13 LABOR 339.BA Public Work Enforce 2,930 2,930 2,930 2,930 2,930 RACING 339.BJ Bell Jar Collection 202 202 202 202 202 TAX 339.BK Ind & Util Service 441 441 441 441 441 DOS 339.CM Reg Manufactured Housing - 100 100 100 100 DOB 339.CR Reven Arrearage 22,554 22,554 22,554 22,554 22,554 DOCCS 339.CT Cell Phone Tower 900 - - - - DOCCS 339.CU Spec Conserv 109 - - - - OCFS 339.CY Central Registry 4,822 4,822 4,822 4,822 4,822
General Fund Transfers From Other Funds(thousands of dollars)
T-199

Sending Agency Fund / Account Account NameFY 2012 Current
FY 2013 Proposed
FY 2014 Projected
FY 2015 Projected
FY 2016 Projected
General Fund Transfers From Other Funds(thousands of dollars)
AG&MKTS 339.CZ Plant Industry 35 35 35 35 35 TAX 339.DC Investment Services 541 541 541 541 541 OPWDD 339.DH OMRDD Day Services - 40,000 40,000 40,000 40,000 ECON DEV 339.DO DED Marketing 131 131 131 131 131 DOS 339.DQ Tug Hill Admin 10 10 10 10 10 SED OTH 339.E5 Armory Rental Acct 2,777 2,777 2,777 2,777 2,777 CQCAPD 339.EC Fedl Salary Sharing 62 62 62 62 62 OASAS 339.EJ Credential Services - 935 959 987 1,013 CIV SVC 339.ER Exam & Misc Rev 1,566 1,566 1,566 1,566 1,566 DOH 339.FP Funeral 8 8 8 8 8 TAX 339.G3 Local Services 26 26 26 26 26 DMV 339.H7 DMV-Compulsory 15,368 15,368 15,368 15,368 15,368 DOH 339.HQ Adlt Hme Qlty Enhance 21 21 21 21 21 DMV 339.IC Accid Prevent Course 606 606 606 606 606 DOH 339.J1 Local Public Hlth 5 5 5 5 5 DOH 339.J6 EPIC Premium Acct 94,625 52,000 - - - DOH 339.JA Vital Records Mgmt 2,252 2,252 2,252 2,252 2,252 HLTH MEDICAL 339.JA CHCCDP Transfer 24,373 - - - - OCFS 339.K1 Hwy Rev/Social Security Admin 50 50 50 50 50 DOH 339.L2 Asst Living Res Quality 9 9 9 9 9 OTDA 339.L7 OTDA Income - 1,348 - - - HSES 339.LZ Pub Safe Commun 20,000 20,000 - - - ECON DEV 339.P4 Procure Opportunity News 100 100 100 100 100 AG&MKTS 339.PD Pet Dealer 7 7 7 7 7 ABO 339.PO Auth Budget Office 39 39 39 39 39 DOH 339.PS Patient Safety 73 73 73 73 73 DOH 339.Q2 Helen Hayes Hospital 7,710 7,710 7,710 7,710 7,710 DOH 339.Q3 NYC Veterans 1,692 1,692 1,692 1,692 1,692 DOH 339.Q4 NYS Home for Veterans 1,172 1,172 1,172 1,172 1,172 DOH 339.Q5 Western NY Veterans Home 992 992 992 992 992 DOH 339.Q6 Montrose DOS Veterans Home 765 765 765 765 765 AG&MKTS 339.R4 Motor Fuel Quality 565 765 765 765 765 AG&MKTS 339.R5 Weights Measure 37 67 67 67 67 DOB 339.ST Systems & Technology 833 833 833 833 833 PARKS 339.T2 Parks&Recreation Patron Services 3,402 903 903 903 903 SED OTH 339.TM Teacher Education Accreditation 14 21 21 21 21 TSCR 339.TS TSCR Account 92,371 104,011 104,011 104,011 104,011 PUB SVC 339.US Undrgrnd Safety Training 175 175 175 175 175 AG&MKTS 339.XX A&M-Aggregated 89 139 139 139 139 OCFS 339.YF Yth Fac PerDiem 82,885 152,416 138,746 121,672 111,534 OGS 339.YL OGS Bldg Admin 1,000 1,000 1,000 1,000 1,000 OGS 339.YN OGS Standards & Purchase Acct 5,000 3,000 3,000 3,000 3,000 OMH 343.00 Mental Hygiene 136 58 80 53 28 SUNY 345.09 L I Vets Home 884 884 884 884 884 SUNY 345.10 SUNY General IFR 22,000 22,000 22,000 22,000 22,000 SUNY 345.22 SUNY Hospitals 39,619 41,130 39,211 40,993 40,993 OASAS 346.00 Subst Abuse Srv - 200 - - - DOS 349.01 Lake George Park 197 197 197 197 197 OMH 353.00 MH & MR Community 68 23 32 21 12 DCJS 354.01 MVTIFA 4,000 - - - - DSP 354.02 Motor Vehicle Enforcement - 100,800 100,800 100,800 100,800 ENCON 355.01 Great Lakes Protection 60 60 60 60 60 SED OTH 365.01 Vocatl Rehabil - 32 32 32 32 ORDA 385.01 Lake Placid Train 23 23 23 23 23 LABOR 482.01 UI Special Interest & Penalty 6,711 6,711 3,211 3,211 3,211
11,989,043 12,213,420 12,848,003 13,124,370 13,523,567
T-200

Receiving Agency Fund / Account Account Name FY 2012 Current FY 2013 Proposed FY 2014 Projected FY 2015 Projected FY 2016
Projected
Total Transfers to Debt Service Funds 1,539,016 1,610,245 1,680,716 1,611,380 1,584,741DEBT SVC 311 Genl Debt Servc 1,539,016 1,610,245 1,680,716 1,611,380 1,584,741
Total Transfers to Capital Projects Funds 790,031 1,057,784 1,256,512 1,381,431 1,276,465CAP PROJ 002.00 CPF 255,328 429,413 570,207 674,702 567,568 OMH 002.00 CPF 33,570 33,570 33,570 33,570 33,570 OPWDD 002.00 CPF 35,579 35,579 35,579 35,579 35,579 OASAS 002.00 CPF 11,597 12,207 11,560 18,039 18,039 DOT 002.00 CPF - 3,000 - - - CAP PROJ 002.CC CPF - Auth Bond 1,230 1,000 1,000 1,000 1,000 DOT 072.00 DHBTF 452,727 543,015 604,596 618,541 620,709
Total Transfers to State Share Medicaid 2,909,867 2,899,705 2,691,677 2,546,206 2,446,206DMH 339.10 Mental Hygiene 2,909,867 2,899,705 2,691,677 2,546,206 2,446,206
Total All Other Transfers 888,862 1,600,064 3,107,153 4,119,570 4,617,487FPADJ 020.00 Combined Expendable Trust 57,560 91,697 73,325 73,325 73,325 OCFS 020.78 WB Hoyt Memoria 622 622 622 622 622 DOH 020.AA Alzheimers Disease Assist 250 250 250 250 250 DOH 020.BD Breast Cancer Res & Educ 650 650 650 650 650 DOH 020.PR ProDOS Cancer 150 150 150 150 150 SED GSPS 160.03 Education - New 128,000 41,000 - - - SED GSPS 160.06 VLT - Education 10,000 15,000 - - - DOT 225.01 Mobility Tax Trust 24,500 279,440 331,690 333,750 333,750 OMH 265.00 Federal HHS 1 - 13 36 36 OMH 267.00 Fed Education - 1 - - - DMH 304.00 M. Health Services - - - 91,542 - DOT 313.01 Pub Tran Systms 12,000 12,000 12,000 12,000 12,000 DOT 313.02 Metro Mass Tran 19,100 19,100 19,100 19,100 19,100 DHCR 316.00 Housing Debt 1,000 1,000 1,000 1,000 1,000 DOH 319.00 DOH Income Fund 16,079 16,079 16,079 16,079 16,079 TAX 334.12 Banking Service 60,561 57,476 65,481 65,481 65,481 OFT 334.3 Cent Tech Svcs. 3,775 24,000 52,000 20,000 10,000 OPWDD 339.05 OPWDD Provider - - - 1,476 1,476 MENTAL HYGIENE 339.10 Mental Hygiene 1,875 52,783 560,982 936,772 1,253,932 MENTAL HYGIENE 339.13 M H Patient Inc - 19,181 398,900 953,898 1,226,690 DOH 339.AW Spinal Injury 1,575 - - - - DCJS 339.CA Crimes Against 16,000 16,000 16,000 16,000 16,000 SED OTH 339.D9 Batavia School 810 755 755 755 755 ABC 339.DB Alcohol Beverag 17,224 17,373 18,951 19,851 19,851 SED OTH 339.E6 Rome School 1,100 705 705 705 705 FMS 339.FM FMS Account 36,000 50,000 55,200 55,200 55,200 DMV 339.GE Federal-Seized - 12 - - - DOH 339.QC Quality of Care 1,500 2,500 - - - SCI 339.SR ES Stem Cell Trust - - 13,673 11,373 - DM & NA 339.U2 Recruitment Inc 1,087 2,087 2,087 2,087 2,087 Agric & Markets 339.XX A&M-Aggregated - 100 100 100 100 JUDICIAR 340.AA CFIA Undistrib 104,300 106,000 107,100 108,100 109,000 OMH 343.00 Mental Hygiene - 48 - - - SUNY 345.11 S U Inc Offset 8,318 8,318 8,318 8,318 8,318 SUNY 345.12 Gen Rev Offset - 389,762 975,964 994,992 1,014,872 SUNY 345.22 SUNY Hosp Operations 288,175 288,175 288,175 288,175 288,175 SUNY 345.31 SUNY Stabilization 10,455 - - - - OMH 353.00 MH & MR Community 18 17 - - - JUDICIAR 368.01 NYCCC Operat Offset 8,594 8,700 8,800 8,700 8,800 ILS 390.01 Indigent Legal 40,000 40,000 40,000 40,000 40,000 CIV SVC 396.00 Health Ins Intrnl Service 7,843 7,843 7,843 7,843 7,843 CIV SVC 396.01 CS EBD Admin Reim 240 240 240 240 240 DOCCS 397.00 Corr Industries 9,500 9,500 9,500 9,500 9,500 DOCCS 399.CC Correction Facility Cap Improv - 21,500 21,500 21,500 21,500
6,127,776 7,167,798 8,736,058 9,658,587 9,924,899
General Fund Transfers To Other Funds(thousands of dollars)
T-201

GEN
ERA
L FU
ND
FY 2
012
(mill
ions
of d
olla
rs)
Tax
Com
mun
ityD
ebt
G
ener
alSt
abili
zatio
nC
ontin
genc
yPr
ojec
ts
Rai
ny D
ayR
educ
tion
Fund
Res
erve
Fun
dR
eser
ve F
und
Fund
Res
erve
Fun
dR
eser
ve F
und
Elim
inat
ions
Tota
l
Ope
ning
fund
bal
ance
01,
031
2113
617
513
01,
376
Rec
eipt
s:Ta
xes
41,9
200
00
00
041
,920
Mis
cella
neou
s re
ceip
ts3,
244
00
00
00
3,24
4Fe
dera
l gra
nts
600
00
00
060
T
otal
rece
ipts
45,2
240
00
00
045
,224
Dis
burs
emen
ts:
Gra
nts
to lo
cal g
over
nmen
ts38
,430
00
850
00
38,5
15S
tate
ope
ratio
ns7,
565
00
00
00
7,56
5G
ener
al S
tate
cha
rges
4,70
70
00
00
04,
707
Deb
t ser
vice
00
00
00
00
Cap
ital p
roje
cts
00
00
00
00
T
otal
dis
burs
emen
ts50
,702
00
850
00
50,7
87
Oth
er fi
nanc
ing
sour
ces
(use
s):
Tran
sfer
s fro
m o
ther
fund
s42
,230
00
010
00
(30,
340)
11,9
90Tr
ansf
ers
to o
ther
fund
s(3
6,46
8)0
00
00
30,3
40(6
,128
)B
ond
and
note
pro
ceed
s0
00
00
00
0
Net
oth
er fi
nanc
ing
sour
ces
(use
s)5,
762
00
010
00
05,
862
Cha
nge
in fu
nd b
alan
ce28
40
0(8
5)10
00
029
9
Clo
sing
fund
bal
ance
284
1,03
121
5127
513
01,
675 .
CA
SH C
OM
BIN
ING
STA
TEM
ENT
T-202

019
020
023
024
025
050
052
053
054
059
061
Ope
ning
Fun
d B
alan
ce2,
222
61,5
788,
187
163
724,
658
2,79
10
4,25
519
159,
230
Rec
eipt
s:
Taxe
s0
00
00
00
3,29
2,52
00
01,
189,
000
Mis
cella
neou
s R
ecei
pts
140
(37,
104)
7,50
029
030
03,
375
9,50
00
40
4,17
0,24
1Fe
dera
l Gra
nts
00
00
00
00
00
0
Tota
l Rec
eipt
s14
0(3
7,10
4)7,
500
290
300
3,37
59,
500
3,29
2,52
04
05,
359,
241
Dis
burs
emen
ts:
Gra
nts
to L
ocal
Gov
ernm
ents
06,
654
6,70
00
00
6,25
93,
292,
520
2,32
10
5,17
3,51
1S
tate
Ope
ratio
ns14
05,
315
1,32
041
419
23,
390
2,36
60
495
059
,954
Gen
eral
Sta
te C
harg
es0
623
382
141
7169
977
10
00
6,41
2D
ebt S
ervi
ce0
00
00
00
00
00
Cap
italP
roje
cts
05
000
00
00
00
00
0
CAS
H C
OM
BIN
ING
STA
TEM
ENT
SPEC
IAL
REV
ENU
E FU
ND
SFY
201
2(th
ousa
nds
of d
olla
rs)
Cap
ital P
roje
cts
05,
000
00
00
00
00
0
Tota
l Dis
burs
emen
ts14
017
,592
8,40
255
526
34,
089
9,39
63,
292,
520
2,81
60
5,23
9,87
7
Oth
er F
inan
cing
Sou
rces
(Use
s):
Tran
sfer
s fro
m O
ther
Fun
ds0
59,2
320
300
00
00
00
0Tr
ansf
ers
to O
ther
Fun
ds0
(51)
0(6
)0
(320
)(1
,959
)0
0(1
9)(2
78,5
91)
Bon
d &
Not
e P
roce
eds
00
00
00
00
00
0
Net
Oth
er F
inan
cing
Sou
rces
(Use
s)0
59,1
810
294
0(3
20)
(1,9
59)
00
(19)
(278
,591
)
Cha
nge
in F
und
Bal
ance
04,
485
(902
)29
37(1
,034
)(1
,855
)0
(2,8
12)
(19)
(159
,227
)
Clo
sing
Fun
d B
alan
ce2,
222
66,0
637,
285
192
109
3,62
493
60
1,44
30
3
T-203

Ope
ning
Fun
d B
alan
ce
Rec
eipt
s:
Taxe
sM
isce
llane
ous
Rec
eipt
sFe
dera
l Gra
nts
Tota
l Rec
eipt
s
Dis
burs
emen
ts:
Gra
nts
to L
ocal
Gov
ernm
ents
Sta
te O
pera
tions
Gen
eral
Sta
te C
harg
esD
ebt S
ervi
ceC
apita
lPro
ject
s
073
160
221
225
261
265
267
269
290
300
301
93,7
2835
,025
18,9
7668
,984
(425
)7,
774
(206
,186
)0
143,
436
1,57
2(3
0,66
2)
460,
800
00
1,52
0,00
00
00
00
00
193,
167
2,93
3,57
122
,341
192,
690
98,9
0050
,101
2,84
60
(23,
181)
10,3
1884
,000
00
650
01,
772,
303
33,6
49,2
194,
502,
767
59,0
0799
0,69
90
0
653,
967
2,93
3,57
122
,991
1,71
2,69
01,
871,
203
33,6
99,3
204,
505,
613
59,0
0796
7,51
810
,318
84,0
00
673,
946
2,88
4,00
00
1,75
2,20
01,
770,
250
29,0
36,4
713,
983,
785
55,6
0765
9,34
40
00
162,
440
21,5
560
62,1
9650
4,02
247
0,63
62,
832
259,
372
7,90
571
,541
011
,465
00
10,0
4591
,926
37,0
1256
835
,199
1,84
516
,639
00
00
00
00
00
00
00
00
00
00
00
CAS
H C
OM
BIN
ING
STA
TEM
ENT
SPEC
IAL
REV
ENU
E FU
ND
SFY
201
2(th
ousa
nds
of d
olla
rs)
Cap
ital P
roje
cts
Tota
l Dis
burs
emen
ts
Oth
er F
inan
cing
Sou
rces
(Use
s):
Tran
sfer
s fro
m O
ther
Fun
dsTr
ansf
ers
to O
ther
Fun
dsB
ond
& N
ote
Pro
ceed
s
Net
Oth
er F
inan
cing
Sou
rces
(Use
s)
Cha
nge
in F
und
Bal
ance
Clo
sing
Fun
d B
alan
ce
00
00
00
00
00
0
673,
946
3,05
7,90
521
,556
1,75
2,20
01,
842,
491
29,6
32,4
194,
491,
433
59,0
0795
3,91
59,
750
88,1
80
013
8,00
00
24,5
000
10
050
00
20,5
840
00
0(2
8,71
2)(4
,067
,902
)(1
4,18
0)0
(14,
103)
(78)
(14,
162)
00
00
00
00
00
0
013
8,00
00
24,5
00(2
8,71
2)(4
,067
,901
)(1
4,18
0)0
(13,
603)
(78)
6,42
2
(19,
979)
13,6
661,
435
(15,
010)
0(1
,000
)0
00
490
2,24
2
73,7
4948
,691
20,4
1153
,974
(425
)6,
774
(206
,186
)0
143,
436
2,06
2(2
8,42
0)
T-204
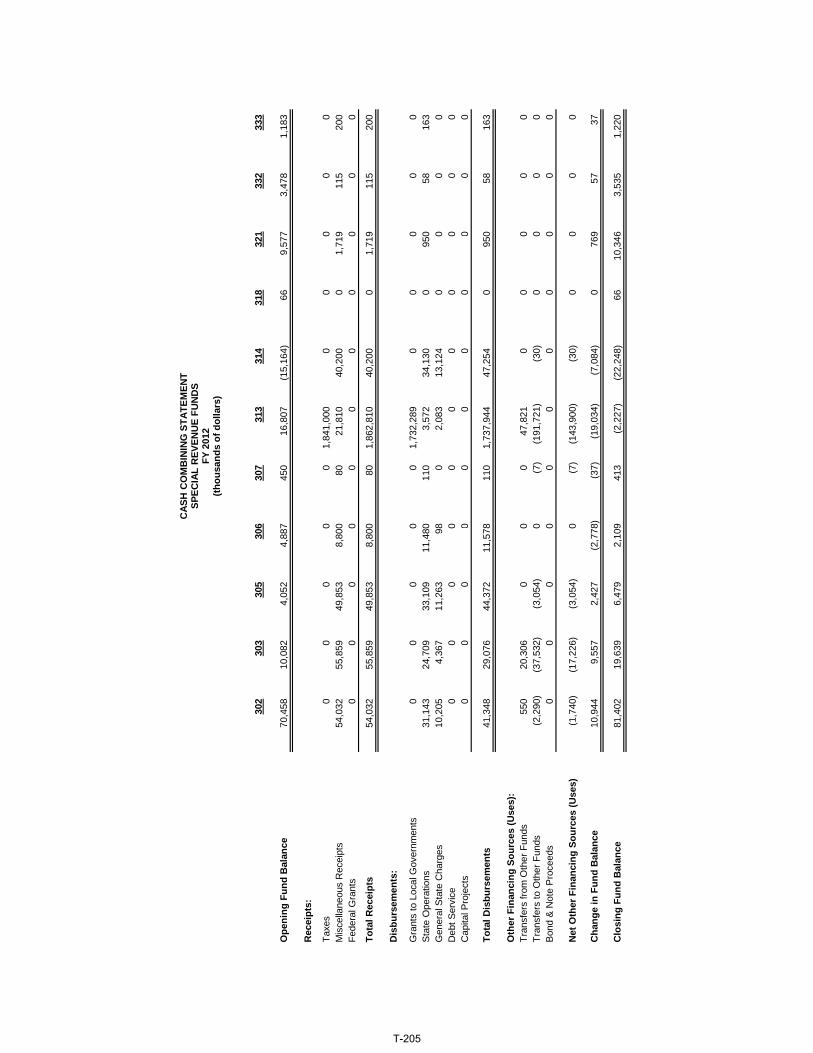
Ope
ning
Fun
d B
alan
ce
Rec
eipt
s:
Taxe
sM
isce
llane
ous
Rec
eipt
sFe
dera
l Gra
nts
Tota
l Rec
eipt
s
Dis
burs
emen
ts:
Gra
nts
to L
ocal
Gov
ernm
ents
Sta
te O
pera
tions
Gen
eral
Sta
te C
harg
esD
ebt S
ervi
ceC
apita
lPro
ject
s
302
303
305
306
307
313
314
318
321
332
333
70,4
5810
,082
4,05
24,
887
450
16,8
07(1
5,16
4)66
9,57
73,
478
1,18
3
00
00
01,
841,
000
00
00
054
,032
55,8
5949
,853
8,80
080
21,8
1040
,200
01,
719
115
200
00
00
00
00
00
0
54,0
3255
,859
49,8
538,
800
801,
862,
810
40,2
000
1,71
911
520
0
00
00
01,
732,
289
00
00
031
,143
24,7
0933
,109
11,4
8011
03,
572
34,1
300
950
5816
310
,205
4,36
711
,263
980
2,08
313
,124
00
00
00
00
00
00
00
00
00
00
00
00
00
CAS
H C
OM
BIN
ING
STA
TEM
ENT
SPEC
IAL
REV
ENU
E FU
ND
SFY
201
2(th
ousa
nds
of d
olla
rs)
Cap
ital P
roje
cts
Tota
l Dis
burs
emen
ts
Oth
er F
inan
cing
Sou
rces
(Use
s):
Tran
sfer
s fro
m O
ther
Fun
dsTr
ansf
ers
to O
ther
Fun
dsB
ond
& N
ote
Pro
ceed
s
Net
Oth
er F
inan
cing
Sou
rces
(Use
s)
Cha
nge
in F
und
Bal
ance
Clo
sing
Fun
d B
alan
ce
00
00
00
00
00
0
41,3
4829
,076
44,3
7211
,578
110
1,73
7,94
447
,254
095
058
163
550
20,3
060
00
47,8
210
00
00
(2,2
90)
(37,
532)
(3,0
54)
0(7
)(1
91,7
21)
(30)
00
00
00
00
00
00
00
0
(1,7
40)
(17,
226)
(3,0
54)
0(7
)(1
43,9
00)
(30)
00
00
10,9
449,
557
2,42
7(2
,778
)(3
7)(1
9,03
4)(7
,084
)0
769
5737
81,4
0219
,639
6,47
92,
109
413
(2,2
27)
(22,
248)
6610
,346
3,53
51,
220
T-205
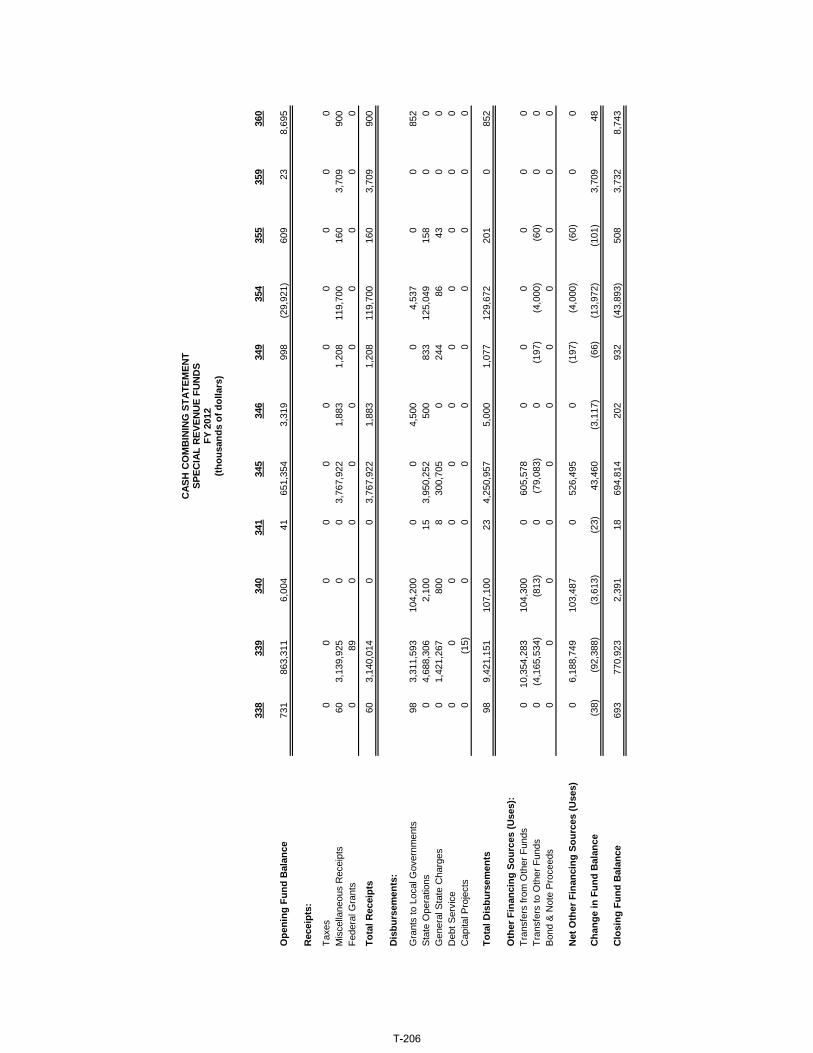
Ope
ning
Fun
d B
alan
ce
Rec
eipt
s:
Taxe
sM
isce
llane
ous
Rec
eipt
sFe
dera
l Gra
nts
Tota
l Rec
eipt
s
Dis
burs
emen
ts:
Gra
nts
to L
ocal
Gov
ernm
ents
Sta
te O
pera
tions
Gen
eral
Sta
te C
harg
esD
ebt S
ervi
ceC
apita
lPro
ject
s
338
339
340
341
345
346
349
354
355
359
360
731
863,
311
6,00
441
651,
354
3,31
999
8(2
9,92
1)60
923
8,69
5
00
00
00
00
00
060
3,13
9,92
50
03,
767,
922
1,88
31,
208
119,
700
160
3,70
990
00
890
00
00
00
00
603,
140,
014
00
3,76
7,92
21,
883
1,20
811
9,70
016
03,
709
900
983,
311,
593
104,
200
00
4,50
00
4,53
70
085
20
4,68
8,30
62,
100
153,
950,
252
500
833
125,
049
158
00
01,
421,
267
800
830
0,70
50
244
8643
00
00
00
00
00
00
00
(15)
00
00
00
00
0
CAS
H C
OM
BIN
ING
STA
TEM
ENT
SPEC
IAL
REV
ENU
E FU
ND
SFY
201
2(th
ousa
nds
of d
olla
rs)
Cap
ital P
roje
cts
Tota
l Dis
burs
emen
ts
Oth
er F
inan
cing
Sou
rces
(Use
s):
Tran
sfer
s fro
m O
ther
Fun
dsTr
ansf
ers
to O
ther
Fun
dsB
ond
& N
ote
Pro
ceed
s
Net
Oth
er F
inan
cing
Sou
rces
(Use
s)
Cha
nge
in F
und
Bal
ance
Clo
sing
Fun
d B
alan
ce
0(1
5)0
00
00
00
00
989,
421,
151
107,
100
234,
250,
957
5,00
01,
077
129,
672
201
085
2
010
,354
,283
104,
300
060
5,57
80
00
00
00
(4,1
65,5
34)
(813
)0
(79,
083)
0(1
97)
(4,0
00)
(60)
00
00
00
00
00
00
0
06,
188,
749
103,
487
052
6,49
50
(197
)(4
,000
)(6
0)0
0
(38)
(92,
388)
(3,6
13)
(23)
43,4
60(3
,117
)(6
6)(1
3,97
2)(1
01)
3,70
948
693
770,
923
2,39
118
694,
814
202
932
(43,
893)
508
3,73
28,
743
T-206

Ope
ning
Fun
d B
alan
ce
Rec
eipt
s:
Taxe
sM
isce
llane
ous
Rec
eipt
sFe
dera
l Gra
nts
Tota
l Rec
eipt
s
Dis
burs
emen
ts:
Gra
nts
to L
ocal
Gov
ernm
ents
Sta
te O
pera
tions
Gen
eral
Sta
te C
harg
esD
ebt S
ervi
ceC
apita
lPro
ject
s
362
365
366
368
369
377
385
390
480
482
(2,3
28)
121
(5,2
20)
(11,
851)
2,67
710
1,56
316
6,61
965
,496
5,24
3
00
00
00
00
00
3,06
811
77,
960
18,1
9125
,000
151,
990
210
73,0
003,
000
9,60
00
00
00
00
038
0,36
10
3,06
811
77,
960
18,1
9125
,000
151,
990
210
73,0
0038
3,36
19,
600
061
00
00
077
,000
14,2
000
3,42
547
6,18
622
,800
16,6
0013
6,74
716
326
,141
255,
986
5,76
70
02,
940
10,9
004,
500
6,54
10
359
113,
175
890
00
00
00
00
00
00
00
00
00
00
CAS
H C
OM
BIN
ING
STA
TEM
ENT
SPEC
IAL
REV
ENU
E FU
ND
SFY
201
2(th
ousa
nds
of d
olla
rs)
Cap
ital P
roje
cts
Tota
l Dis
burs
emen
ts
Oth
er F
inan
cing
Sou
rces
(Use
s):
Tran
sfer
s fro
m O
ther
Fun
dsTr
ansf
ers
to O
ther
Fun
dsB
ond
& N
ote
Pro
ceed
s
Net
Oth
er F
inan
cing
Sou
rces
(Use
s)
Cha
nge
in F
und
Bal
ance
Clo
sing
Fun
d B
alan
ce
00
00
00
00
00
3,42
510
89,
126
33,7
0021
,100
143,
288
163
103,
500
383,
361
6,65
7
00
08,
594
00
040
,000
00
00
00
00
(23)
00
(6,7
11)
00
00
00
00
00
00
08,
594
00
(23)
40,0
000
(6,7
11)
(357
)9
(1,1
66)
(6,9
15)
3,90
08,
702
249,
500
0(3
,768
)
(2,6
85)
130
(6,3
86)
(18,
766)
6,57
711
0,26
540
16,1
1965
,496
1,47
5
T-207

Ope
ning
Fun
d B
alan
ce
Rec
eipt
s:
Taxe
sM
isce
llane
ous
Rec
eipt
sFe
dera
l Gra
nts
Tota
l Rec
eipt
s
Dis
burs
emen
ts:
Gra
nts
to L
ocal
Gov
ernm
ents
Sta
te O
pera
tions
Gen
eral
Sta
te C
harg
esD
ebt S
ervi
ceC
apita
lPro
ject
s
484
486
SRO
Sub
Tota
lEl
imin
atio
nsFi
nanc
ial P
lan
5844
70
2,14
9,27
80
2,14
9,27
8
00
08,
303,
320
08,
303,
320
00
015
,279
,270
015
,279
,270
8,28
423
6,69
40
41,6
01,0
730
41,6
01,0
73
8,28
423
6,69
40
65,1
83,6
630
65,1
83,6
63
018
9,89
60
54,7
42,7
940
54,7
42,7
948,
284
37,9
700
11,0
62,8
390
11,0
62,8
390
8,82
80
2,12
6,22
40
2,12
6,22
40
00
00
00
00
498
50
498
5
CAS
H C
OM
BIN
ING
STA
TEM
ENT
SPEC
IAL
REV
ENU
E FU
ND
SFY
201
2(th
ousa
nds
of d
olla
rs)
Cap
ital P
roje
cts
Tota
l Dis
burs
emen
ts
Oth
er F
inan
cing
Sou
rces
(Use
s):
Tran
sfer
s fro
m O
ther
Fun
dsTr
ansf
ers
to O
ther
Fun
dsB
ond
& N
ote
Pro
ceed
s
Net
Oth
er F
inan
cing
Sou
rces
(Use
s)
Cha
nge
in F
und
Bal
ance
Clo
sing
Fun
d B
alan
ce
00
04,
985
04,
985
8,28
423
6,69
40
67,9
36,8
420
67,9
36,8
42
00
011
,424
,549
(4,1
72,7
92)
7,25
1,75
70
00
(8,9
11,1
38)
4,17
2,79
2(4
,738
,346
)0
00
00
0
00
02,
514,
411
02,
514,
411
00
0(2
39,7
68)
0(2
39,7
68)
5844
70
1,90
8,51
00
1,90
8,51
0
T-208

Fund
O
peni
ng
Mis
c.
Fede
ral
Bon
d
Tran
sfer
s
Tota
l In
dire
ct
UI
Tran
sfer
s
Tota
l C
losi
ng
Acc
ount
Bal
ance
Taxe
s R
ecei
pts
Gra
nts
Proc
eeds
From
Rec
eipt
sLo
cal
PS
NPS
C
osts
Ben
efits
GSC
s D
ebt
Cap
ital
ToD
isb.
Bal
ance
019.
00-M
ent H
yg G
ifts
2,22
00
140
00
014
00
014
00
00
00
014
02,
220
020.
00-C
ombi
ned
Exp
Tr
(35)
0(5
7,52
5)0
057
,560
350
00
00
00
00
00
020.
01-P
lant
ing
Fiel
ds1,
146
035
00
00
350
020
947
70
940
00
357
1,13
902
0.03
-Cha
mbe
rs R
esto
r1
00
00
00
00
00
00
00
00
102
0.06
-Ani
mal
Dis
ease
510
510
00
510
046
00
00
00
4656
020.
20-D
OC
S G
ift &
Don
710
50
00
50
05
00
00
00
571
020.
22-H
elen
Hay
es H
sp68
00
00
00
00
00
00
00
00
6802
0.23
-Oxf
ord
Don
atio
n10
80
220
00
220
073
00
00
00
7357
020.
25-D
onat
-St.A
lban
s5
00
00
00
00
00
00
00
00
502
0.28
-CV
B G
ifts
& B
eq50
05
00
05
00
80
00
00
08
4702
0.29
-DC
JS -
MU
NY
Pol
10
250
00
250
025
00
00
00
251
020.
30-D
onat
ions
-Bat
av27
010
00
010
00
190
00
00
019
1802
0.33
-Mon
trose
Don
ati
105
00
00
00
00
00
00
00
00
105
020.
36-IB
R G
enet
ic C
ou47
010
50
00
105
00
105
00
00
00
105
4702
0.3A
-Tec
h Tr
ansf
er21
053
00
053
00
500
00
00
050
2402
0.49
-Spe
c E
vent
s49
00
472
00
047
20
031
10
00
00
031
165
102
0.62
-L.M
. Jos
epht
hal
520
30
00
30
02
00
00
00
253
020.
63-R
PM
I Grn
t & B
eq14
00
00
00
00
00
00
00
00
1402
0.64
-S U
Res
tric
Cur
120
00
00
00
10
00
00
00
111
020.
69-C
BV
H V
end
Sta
nd72
70
1,10
90
00
1,10
90
5187
90
021
50
00
1,14
569
102
0.76
-RP
MI S
choe
llkpf
10
00
00
00
00
00
00
00
01
020.
77-D
MN
A M
ilita
ry12
01
00
01
00
10
00
00
01
1202
0.78
-WB
Hoy
t Mem
oria
4,04
50
110
00
622
732
1,50
00
00
00
00
01,
500
3,27
702
0.79
-CB
VH
Gift
& B
eq17
80
60
00
60
015
00
00
00
1516
902
0.82
-St T
rans
m M
oney
15,7
550
8,00
00
00
8,00
00
093
00
00
00
093
022
,825
020.
83-H
uman
Rgh
ts D
is(3
)0
00
00
00
00
00
00
00
0(3
)02
0.A
7-Y
outh
Gra
nts
&
340
050
00
050
060
80
02
00
070
320
020.
AA
-Alz
heim
ers
Dis
1,35
30
00
025
025
00
053
20
00
00
053
21,
071
020.
AB
-Loc
al G
ov C
omm
142
012
00
012
00
70
00
00
07
147
020.
AH
-Pro
stat
e/Te
stic
323
040
00
040
00
60
00
00
06
357
020.
AR
-Aut
ism
Aw
are
&
580
100
00
100
00
00
00
00
068
020.
AU
-Em
erge
ncy
Ser
v8,
128
02,
688
00
02,
688
3,99
812
63
50
610
00
4,19
36,
623
020.
B1-
Bat
avia
-Cha
rlot
359
020
00
020
00
230
00
00
023
356
020.
B3-
Rom
e-G
ifts
And
2
020
00
020
00
190
00
00
019
302
0.B
4-D
FY R
ec &
Wel
fr(1
)0
00
00
00
00
00
00
00
0(1
)02
0.B
8-D
AA
A G
rnts
And
(2)
00
00
00
00
00
00
00
00
(2)
020.
BD
-Br C
an R
es &
Ed
8,26
00
400
065
069
00
187
613
00
00
00
800
8,15
002
0.C
E-C
omm
unity
Rel
at1
010
00
00
100
00
00
00
00
00
101
020.
D1-
Dis
ab T
ech
Ass
t13
90
155
00
015
50
5822
30
280
051
162
132
020.
E1-
Mis
sng
Chi
ldre
n84
60
340
00
034
00
237
133
70
115
00
049
269
402
0.E
5-D
MN
A Y
outh
Pro
g32
010
00
010
00
100
00
00
010
3202
0.E
C-E
rie C
anal
Mus
e5
00
00
00
00
00
00
00
00
502
0.F1
-Wom
en V
et M
onum
150
00
00
00
00
00
00
00
00
150
020.
FF-F
ord
Foun
datio
n(1
)0
00
00
00
00
00
00
00
0(1
)02
0.G
B-G
rant
s an
d B
equ
120
10
00
10
01
00
00
00
112
020.
GW
-CC
F G
rts &
Beq
s95
087
00
087
025
541
09
00
089
9302
0.H
H-O
MH
Gra
nt &
Beq
469
020
00
020
00
200
00
00
020
469
020.
LP-L
ife P
ass
It on
318
020
00
00
200
00
00
00
00
00
518
020.
MG
-Mis
c. G
ifts
Acc
11,9
970
4,00
00
00
4,00
00
00
00
00
5,00
00
5,00
010
,997
020.
MS
-Mul
tiple
Scl
ero
180
00
00
00
00
00
00
00
018
020.
PM
-Par
ole
Ofc
r Mem
430
00
00
00
00
00
00
00
043
020.
PR
-Pro
stat
e C
ance
r2,
345
00
00
150
150
00
00
00
00
00
2,49
502
0.P
T-P
ercy
T P
hilli
p40
00
00
00
00
00
00
00
00
4002
0.R
P-A
ging
Gra
nts
An
(1)
01
00
01
00
10
00
00
01
(1)
020.
RW
-RW
Joh
nson
Fou
n(5
)0
00
00
00
00
00
00
00
0(5
)02
0.X
K-G
rant
s A
ccou
nt1,
225
02,
000
00
02,
000
1,15
611
725
03
099
00
01,
625
1,60
002
0.ZS
-Gra
nts
159
030
00
00
300
00
00
00
00
00
459
020.
ZZ-D
onat
ed F
unds
1,77
70
00
00
00
00
00
00
00
01,
777
023.
00-N
Y In
t Law
yers
8,18
70
7,50
00
00
7,50
06,
700
688
582
500
382
00
08,
402
7,28
502
4.00
-NY
S A
rchv
s P
tne
164
029
00
030
059
00
289
116
90
141
00
656
119
302
5.C
P-C
hild
Per
form
er73
030
00
00
300
012
464
40
710
00
263
110
050.
01-T
uitio
n R
eim
b2,
266
037
50
00
375
00
250
00
00
023
273
2,36
805
0.02
-Pro
p V
oc S
ch S
u2,
391
03,
000
00
03,
000
01,
468
1,62
547
069
90
029
74,
136
1,25
505
2.01
-Loc
Gov
t Rec
ord
2,78
90
9,50
00
00
9,50
06,
259
2,02
027
868
077
10
01,
959
11,3
5593
405
3.00
-Sch
Tax
Rel
ief
(1)
3,29
2,52
00
00
03,
292,
520
3,29
2,52
00
00
00
00
03,
292,
520
(1)
054.
01-C
htr S
ch S
ti A
c4,
254
04
00
04
2,32
10
495
00
00
00
2,81
61,
442
056.
01-G
reen
way
Com
mun
(1)
00
00
00
00
00
00
00
00
(1)
056.
02-G
reen
way
Her
it1
00
00
00
00
00
00
00
00
105
9.01
-Alc
ohol
&S
ubst
A19
00
00
00
00
00
00
00
1919
0
CA
SH C
OM
BIN
ING
STA
TEM
ENT
BY
AC
CO
UN
TSP
ECIA
L R
EVEN
UE
OTH
ER F
UN
DS
(EXC
LUD
ING
FU
ND
339
)FY
201
2(T
hous
ands
of D
olla
rs)
T-209

Fund
O
peni
ng
Mis
c.
Fede
ral
Bon
d
Tran
sfer
s
Tota
l In
dire
ct
UI
Tran
sfer
s
Tota
l C
losi
ng
Acc
ount
Bal
ance
Taxe
s R
ecei
pts
Gra
nts
Proc
eeds
From
Rec
eipt
sLo
cal
PS
NPS
C
osts
Ben
efits
GSC
s D
ebt
Cap
ital
ToD
isb.
Bal
ance
CA
SH C
OM
BIN
ING
STA
TEM
ENT
BY
AC
CO
UN
TSP
ECIA
L R
EVEN
UE
OTH
ER F
UN
DS
(EXC
LUD
ING
FU
ND
339
)FY
201
2(T
hous
ands
of D
olla
rs)
061.
01-T
obac
co C
ntr &
41
00
00
00
02,
111
406
680
1,08
20
050
34,
170
(4,1
29)
061.
02-H
ealth
Car
e S
rv9,
992
00
00
00
120,
108
00
00
640
00
120,
172
(110
,180
)06
1.03
-Med
icai
d Fr
aud
118
00
00
00
056
250
30
330
00
342
(224
)06
1.04
-Med
ical
Ass
ist.
437
00
00
00
3,35
1,15
21,
521
4,14
249
078
00
00
3,35
7,64
4(3
,357
,207
)06
1.05
-Enh
ance
d C
om4
00
00
00
00
00
00
00
00
406
1.06
-LTC
Ins
Res
Acc
(1)
00
00
00
00
00
00
00
00
(1)
061.
07-H
CR
A P
rogr
am24
,229
00
00
00
469,
593
023
,334
00
00
00
492,
927
(468
,698
)06
1.09
-HC
RA
Tra
nsiti
on(2
)0
00
00
00
00
00
00
00
0(2
)06
1.22
-EM
S T
rain
ing
3,39
10
00
00
00
2,81
413
,339
950
1,43
50
066
718
,350
(14,
959)
061.
29-C
hild
Hea
lth In
(44,
912)
00
00
00
319,
544
1,28
55,
219
310
687
00
394
327,
160
(372
,072
)06
1.99
-HC
RA
Und
istri
bu15
3,71
61,
189,
000
4,17
0,24
10
00
5,35
9,24
10
00
00
00
027
5,95
627
5,95
65,
237,
001
061.
AF-
Hos
pita
l Bas
ed
302
00
00
00
11,2
040
00
00
00
011
,204
(10,
902)
061.
AH
-Ad
Hom
e R
es C
o 24
00
00
00
600
00
00
00
060
(36)
061.
BO
-Prim
ary
Car
e In
225
00
00
00
049
00
160
243
00
125
874
(649
)06
1.D
N-P
rov
Col
l Mon
it53
80
00
00
00
2,09
820
466
01,
042
00
492
3,90
2(3
,364
)06
1.H
3-P
ilot H
ealth
In37
40
00
00
00
1,05
894
340
520
00
286
1,99
2(1
,618
)06
1.IN
-Indi
gent
Car
e23
,721
00
00
00
791,
500
00
00
00
00
791,
500
(767
,779
)06
1.J6
-EP
IC P
rem
ium
(13,
350)
00
00
00
110,
350
00
00
00
00
110,
350
(123
,700
)06
1.LB
-Hea
lth O
ccup
De
176
00
00
00
077
280
270
397
00
129
1,40
5(1
,229
)06
1.LC
-Mat
ern
& C
h H
IV1
00
00
00
00
00
00
00
00
106
1.LE
-Hea
lth C
are
Del
203
00
00
00
026
617
90
129
00
3946
0(2
57)
068.
01-D
ispr
o S
h M
ed
00
00
00
00
00
00
00
00
00
073.
01-T
rans
it A
utho
ri54
,126
359,
930
150,
070
00
051
0,00
052
8,80
00
00
00
00
052
8,80
035
,326
073.
02-R
ailro
ad A
ccou
n9,
553
63,5
2026
,407
00
089
,927
93,5
000
00
00
00
093
,500
5,98
007
3.03
-DM
TF30
,047
37,3
5016
,690
00
054
,040
51,6
460
00
00
00
051
,646
32,4
4116
0.03
-Edu
catio
n - N
ew0
02,
072,
000
00
128,
000
2,20
0,00
02,
200,
000
00
00
00
00
2,20
0,00
00
160.
04-S
tate
Lot
tery
18,5
260
170,
371
00
017
0,37
10
18,4
1213
3,15
860
60
9,70
40
00
161,
880
27,0
1716
0.05
-VLT
- A
dmin
16,4
980
17,2
000
00
17,2
000
3,32
66,
828
110
01,
761
00
012
,025
21,6
7316
0.06
-VLT
- E
duca
tion
40
674,
000
00
10,0
0068
4,00
068
4,00
00
00
00
00
068
4,00
04
221.
00-C
omb
Stu
dent
Ln
18,9
760
22,3
4165
00
022
,991
00
21,5
560
00
00
021
,556
20,4
1122
5.01
-Mob
ility
Tax
Tr
50,8
951,
396,
000
9,60
00
024
,500
1,43
0,10
01,
441,
200
00
00
00
00
1,44
1,20
039
,795
225.
02-M
TA A
id T
rust
18,0
8712
4,00
018
3,09
00
00
307,
090
311,
000
00
00
00
00
311,
000
14,1
7730
0.01
-E F
C A
dmin
Acc
2,18
30
6,01
80
00
6,01
80
3,65
065
00
01,
845
00
06,
145
2,05
630
0.02
-Enc
on A
dmin
Acc
(612
)0
4,30
00
00
4,30
00
3,59
69
00
00
078
3,68
35
301.
01-E
nCon
Ene
rgy
Ef
290
00
00
00
00
00
00
00
029
301.
12-E
nCon
-Sei
zed
As
10
200
00
200
00
00
00
00
021
301.
48-W
st T
ire M
gt/R
e4,
480
024
,000
00
024
,000
07,
150
6,05
422
80
3,30
00
05,
946
22,6
785,
802
301.
49-O
il &
Gas
Acc
ou14
60
480
00
480
00
00
00
048
4814
630
1.52
-Mar
ine/
Coa
stal
83
013
00
013
00
00
00
00
00
9630
1.B
J-In
dire
ct C
harg
e4,
006
00
00
10,5
8410
,584
01,
462
5,36
961
073
10
052
38,
146
6,44
430
1.F7
-Haz
ardo
us S
ub B
(61)
035
00
00
350
017
933
80
111
00
033
1(4
2)30
1.G
8-S
-Are
a La
ndfil
l20
00
00
00
00
00
00
00
00
2030
1.H
4-U
tility
Env
ir R
10
00
00
00
00
00
00
00
01
301.
IC-F
ed In
dire
ct R
(452
)0
300
010
,000
10,0
300
7,78
930
20
00
00
08,
091
1,48
730
1.K
5-Lo
w L
evel
Rad
io(5
,278
)0
4,72
00
00
4,72
00
1,74
011
655
083
80
033
03,
079
(3,6
37)
301.
K6-
Rec
reat
ion
Acc
o(7
,275
)0
15,2
000
00
15,2
000
9,75
82,
816
193
01,
088
00
255
14,1
10(6
,185
)30
1.P
S-P
ublic
Saf
ety
R23
00
00
00
00
00
00
00
00
2330
1.R
9-S
EQ
R R
evie
w(4
3)0
10
00
10
01
00
00
00
1(4
3)30
1.S
4-E
ncon
Mag
azin
e13
60
705
00
070
50
031
40
00
00
131
445
396
301.
S5-
Env
ironm
ent E
nf(2
7,20
4)0
28,0
000
00
28,0
000
14,9
432,
524
500
06,
417
00
3,11
527
,499
(26,
703)
301.
S6-
Nat
ural
Res
ourc
(19,
149)
04,
000
00
04,
000
03,
693
397
130
01,
857
00
400
6,47
7(2
1,62
6)30
1.S
7-To
wn
Of R
iver
he17
00
00
00
00
00
00
00
00
1730
1.TV
-ATV
DE
SF
00
00
00
00
00
00
00
00
00
301.
W8-
US
T-Tr
ust R
ecov
360
120
00
120
00
00
00
00
048
301.
XB
-Min
ed L
and
Rec
l10
40
4,51
00
00
4,51
00
1,87
711
761
084
90
01,
700
4,60
410
301.
ZZ-M
onito
rs-A
ggre
19,7
100
2,39
10
00
2,39
10
3,09
749
381
01,
448
00
1,71
46,
833
15,2
6830
2.00
-Con
serv
atio
n21
,074
048
,042
00
550
48,5
920
18,7
679,
728
500
09,
344
00
1,74
040
,079
29,5
87
T-210

Fund
O
peni
ng
Mis
c.
Fede
ral
Bon
d
Tran
sfer
s
Tota
l In
dire
ct
UI
Tran
sfer
s
Tota
l C
losi
ng
Acc
ount
Bal
ance
Taxe
s R
ecei
pts
Gra
nts
Proc
eeds
From
Rec
eipt
sLo
cal
PS
NPS
C
osts
Ben
efits
GSC
s D
ebt
Cap
ital
ToD
isb.
Bal
ance
CA
SH C
OM
BIN
ING
STA
TEM
ENT
BY
AC
CO
UN
TSP
ECIA
L R
EVEN
UE
OTH
ER F
UN
DS
(EXC
LUD
ING
FU
ND
339
)FY
201
2(T
hous
ands
of D
olla
rs)
302.
02-M
arin
e R
esou
rce
2,05
90
3,30
00
00
3,30
00
1,19
871
672
084
10
00
2,82
72,
532
302.
03-M
igra
tory
Bird
208
010
00
010
00
450
00
00
045
173
302.
04-L
icen
se G
uide
115
055
00
055
043
61
019
00
069
101
302.
06-F
ish
And
Gam
e T
46,3
980
2,50
00
00
2,50
00
00
00
00
055
055
048
,348
302.
07-S
urf C
lam
/Qua
ho32
00
550
00
550
1429
00
10
00
4433
130
2.08
-Hab
itat A
ccou
nt27
50
450
00
450
024
00
00
00
2429
630
2.09
-Ven
ison
Don
atio
100
250
00
250
00
00
00
00
035
303.
01-O
il S
pill
- DA
C2
012
10
070
582
60
523
223
170
255
00
01,
018
(190
)30
3.02
-Oil
Sp
Rel
ocat
n4
038
00
301
339
020
620
60
930
00
325
1830
3.03
-Oil
Spi
ll - D
EC
(2)
00
00
19,3
0019
,300
010
,132
747
231
04,
019
00
3,52
618
,655
643
303.
04-O
il S
pill
- DA
C10
,079
042
,000
00
042
,000
00
12,6
040
00
00
20,3
0632
,910
19,1
6930
3.05
-Lic
ense
Fee
Sur
(1)
013
,700
00
013
,700
00
00
00
00
13,7
0013
,700
(1)
305.
01-O
SH
Trn
g &
Edu
c3,
778
024
,177
00
024
,177
09,
000
7,65
030
80
5,18
40
086
623
,008
4,94
730
5.02
-OS
HA
Insp
ectio
n27
30
25,6
760
00
25,6
760
10,5
875,
203
361
06,
079
00
2,18
824
,418
1,53
130
6.01
-Clie
nt P
rote
ctn
4,88
90
8,80
00
00
8,80
00
580
10,9
000
098
00
011
,578
2,11
130
7.01
-Equ
ip L
oan
Fund
451
080
00
080
00
110
00
00
07
117
414
313.
01-P
ub T
ran
Sys
tms
1,86
958
,100
410
00
28,7
2187
,231
87,0
9956
236
430
039
00
00
88,4
4565
531
3.02
-Met
ro M
ass
Tran
14,8
281,
782,
900
21,4
000
019
,100
1,82
3,40
01,
645,
190
2,25
624
111
90
1,69
30
019
1,72
11,
841,
220
(2,9
92)
313.
03-U
rban
Mas
s Tr
an10
60
00
00
00
00
00
00
00
010
631
4.01
-Ope
ratn
g P
erm
it(1
2,17
3)0
8,20
00
00
8,20
00
5,16
41,
907
205
03,
891
00
011
,167
(15,
140)
314.
02-M
obile
Sou
rce
(2,9
93)
032
,000
00
032
,000
019
,272
6,99
458
80
9,23
30
030
36,1
17(7
,110
)31
8.01
-Hou
sing
Res
erve
660
00
00
00
00
00
00
00
066
321.
01-L
egis
l Com
p R
&D
9,51
90
1,71
70
00
1,71
70
095
00
00
00
095
010
,286
321.
02-D
emog
raph
ics/
Re
580
20
00
20
00
00
00
00
060
332.
01-B
rum
mer
Aw
ard
400
60
00
60
06
00
00
00
640
332.
02-W
illia
m V
orce
F22
90
00
00
00
00
00
00
00
022
933
2.03
-Roc
ky P
ocan
tico
200
110
00
011
00
051
00
00
00
5179
332.
04-O
MR
Non
expn
d Tr
740
(1)
00
0(1
)0
01
00
00
00
172
332.
05-R
ocke
felle
r Tru
3,00
00
00
00
00
00
00
00
00
03,
000
332.
08-H
elen
Hay
es H
os15
00
00
00
00
00
00
00
00
1533
2.10
-Cun
ning
ham
Fun
d10
00
00
00
00
00
00
00
00
010
033
3.00
-Win
tr S
ports
Ed
1,18
30
200
00
020
00
016
30
00
00
016
31,
220
335.
00-N
ys M
usic
al In
s1
00
00
00
00
00
00
00
00
133
8.01
-Arts
Cap
ital R
e73
10
600
00
6098
00
00
00
00
9869
334
0.A
A-C
FIA
Und
istri
b6,
004
00
00
104,
300
104,
300
104,
200
2,00
010
00
080
00
081
310
7,91
32,
391
341.
04-D
FY-N
YC
Sum
mer
42
00
00
00
015
00
08
00
023
1934
5.09
-L I
Vet
s H
ome
5,66
50
40,1
930
00
40,1
930
24,2
1516
,764
00
00
088
441
,863
3,99
534
5.10
-S U
Gen
l IFR
462,
960
070
0,79
40
015
070
0,94
40
145,
682
425,
266
00
7,10
70
022
,000
600,
055
563,
849
345.
11-S
U In
c O
ffset
(52,
436)
0(2
,900
)0
024
,898
21,9
980
00
00
00
00
0(3
0,43
8)34
5.12
-Gen
Rev
Offs
et17
,074
01,
358,
129
00
2,90
01,
361,
029
01,
156,
059
202,
066
00
00
00
1,35
8,12
519
,978
345.
22-S
U H
osp
Ops
50,4
400
1,65
4,50
40
056
7,17
52,
221,
679
01,
069,
125
745,
301
00
293,
598
00
56,1
992,
164,
223
107,
896
345.
31-S
UN
Y S
tabi
lizat
5,79
00
00
010
,455
10,4
550
249
1,07
60
00
00
01,
325
14,9
2034
5.46
-S U
Hos
p S
pons
d73
,331
034
,818
00
034
,818
030
,691
8,27
30
00
00
038
,964
69,1
8534
5.47
-SU
NY
Tui
tion
Re
88,5
310
(17,
616)
00
0(1
7,61
6)0
49,8
5575
,630
00
00
00
125,
485
(54,
570)
345.
97-B
ridge
Pro
gram
20
00
00
00
00
00
00
00
02
346.
00-S
ubst
Abu
se S
rv3,
317
01,
883
00
01,
883
4,50
00
500
00
00
00
5,00
020
034
9.01
-Lk
Geo
rge
Par
k99
80
1,20
80
00
1,20
80
563
250
200
244
00
197
1,27
493
235
4.01
-MV
TIFA
4,69
10
4,70
00
00
4,70
04,
537
139
46
086
00
4,00
08,
772
619
354.
02-S
t Pol
ice
MV
En
(34,
612)
011
5,00
00
00
115,
000
011
9,80
05,
100
00
00
00
124,
900
(44,
512)
355.
01-G
reat
Lak
es P
ro60
70
160
00
016
00
8570
30
430
060
261
506
359.
01-R
even
ue M
axim
iz1,
577
00
00
00
00
00
00
00
00
1,57
735
9.02
-Loc
al M
axim
izat
10
00
00
00
00
00
00
00
01
359.
03-D
OH
Fed
Rev
Max
(1,5
55)
03,
709
00
03,
709
00
00
00
00
00
2,15
436
0.00
-Hou
sing
Dev
elop
8,69
50
900
00
090
085
20
00
00
00
085
28,
743
362.
01-D
OT
Com
m V
eh S
a(2
,328
)0
3,06
80
00
3,06
80
2,95
447
10
00
00
03,
425
(2,6
85)
365.
01-V
ocat
l Reh
abil
123
011
70
00
117
610
470
00
00
010
813
236
6.01
-Drin
king
Wat
er12
80
1,70
00
00
1,70
00
1,23
521
00
063
30
00
2,07
8(2
50)
366.
02-D
rink
Wat
er D
OH
(5,3
47)
06,
260
00
06,
260
04,
208
384
149
02,
307
00
07,
048
(6,1
35)
368.
01-N
YC
CC
Ope
rat O
f(1
1,85
2)0
18,1
910
08,
594
26,7
850
19,7
003,
100
00
10,9
000
00
33,7
00(1
8,76
7)36
9.01
-Jud
Dat
a P
roc
O2,
677
025
,000
00
025
,000
016
,600
00
04,
500
00
021
,100
6,57
737
7.A
1-C
UN
Y S
tabi
lizn
10
00
00
00
00
00
00
00
01
377.
ZX-C
UN
Y T
uitn
Rei
m37
,783
042
,940
00
042
,940
042
,633
306
00
00
00
42,9
3937
,784
377.
ZY-C
UN
Y In
c R
eim
b63
,780
010
9,05
00
00
109,
050
054
,018
39,7
900
06,
541
00
010
0,34
972
,481
385.
01-L
k P
laci
d Tr
ain
160
210
00
021
00
016
30
00
00
2318
640
390.
01-In
dige
nt L
egal
6,
618
073
,000
00
40,0
0011
3,00
077
,000
750
25,3
6823
035
90
00
103,
500
16,1
1848
2.01
-UI S
p In
t & P
en5,
244
09,
600
00
09,
600
01,
629
4,08
157
089
00
06,
711
13,3
681,
476
T-211

Fund
O
peni
ng
Mis
c.
Fede
ral
Bon
d
Tran
sfer
s
Tota
l In
dire
ct
UI
Tran
sfer
s
Tota
l C
losi
ng
Acc
ount
Bal
ance
Taxe
s R
ecei
pts
Gra
nts
Proc
eeds
From
Rec
eipt
sLo
cal
PS
NPS
C
osts
Ben
efits
GSC
s D
ebt
Cap
ital
ToD
isb.
Bal
ance
339.
01-A
dopt
Info
Reg
i(1
)0
500
00
500
00
00
00
00
049
339.
02-A
rticl
e V
II In
t1,
483
050
00
00
500
500
00
00
00
00
500
1,48
333
9.03
-S P
A R
C S
(47)
07,
127
00
1,46
48,
591
03,
690
782
127
02,
016
00
885
7,50
01,
044
339.
05-O
PW
DD
Pro
vide
r 1,
152
00
00
338,
196
338,
196
331,
155
00
00
00
07,
041
338,
196
1,15
233
9.07
-Fire
Pre
v/C
ode
00
14,8
100
00
14,8
100
00
00
00
014
,810
14,8
100
339.
08-N
YS
Tw
y P
olic
e(1
,186
)0
51,1
630
00
51,1
630
32,7
040
1,37
30
15,9
000
00
49,9
770
339.
09-D
MV
Sei
z A
sset
s28
90
500
00
500
017
50
00
00
017
516
433
9.10
-Men
tal H
ygie
ne18
,581
00
00
5,59
5,23
45,
595,
234
1,05
3,40
381
0,05
219
8,42
622
,462
034
1,21
30
03,
174,
103
5,59
9,65
914
,156
339.
11-In
s G
enl O
pern
s(2
2)0
00
00
00
00
00
00
00
0(2
2)33
9.13
-M H
Pat
ient
Inc
10,8
810
00
03,
186,
247
3,18
6,24
724
6,86
51,
473,
089
409,
213
46,5
830
735,
968
00
274,
529
3,18
6,24
710
,881
339.
15-F
in C
ntrl
Boa
rd(6
68)
03,
330
00
03,
330
01,
657
813
510
809
00
03,
330
(668
)33
9.16
-Reg
of R
acin
g(6
,187
)0
9,40
00
00
9,40
00
4,79
13,
900
200
050
00
00
9,39
1(6
,178
)33
9.17
-Tri
St R
eg P
lan
(3,4
62)
00
00
15,0
4115
,041
04,
170
7,18
434
40
3,34
30
00
15,0
41(3
,462
)33
9.18
-S U
Con
str F
und
740
27,1
110
00
27,1
110
15,5
442,
552
483
07,
593
00
026
,172
1,01
333
9.20
-Qua
lity
Car
e4,
883
05,
700
00
97,8
6310
3,56
37,
288
65,5
5033
,922
00
00
00
106,
760
1,68
633
9.21
-Nur
ses
Aid
e R
eg1,
119
05,
254
00
05,
254
052
03,
296
160
264
00
04,
096
2,27
733
9.22
-Em
erg
Med
Srv
s(1
)0
00
00
00
00
00
00
00
0(1
)33
9.23
-Sei
zed
Ass
ets
838
050
00
050
00
238
00
00
00
238
650
339.
24-C
hild
Car
e &
Pr
249
070
00
070
100
00
00
00
00
100
219
339.
25-C
yber
Sec
Upg
r1,
682
01,
500
00
01,
500
00
1,54
80
00
00
01,
548
1,63
433
9.26
-Cer
t of N
eed
15,2
790
6,24
20
00
6,24
20
2,56
983
688
01,
406
00
1,08
65,
985
15,5
3633
9.27
-Lob
byin
g E
nfor
c4
00
00
00
00
00
00
00
00
433
9.28
-Ret
ir C
omm
unity
529
074
00
074
025
11
012
00
241
562
339.
29-C
hild
Hlth
Ins
10
00
00
00
00
00
00
00
01
339.
2C-O
HR
D S
t Mat
ch2,
558
02,
000
00
02,
000
00
2,00
00
00
00
02,
000
2,55
833
9.30
-DO
L Fe
e P
enal
ty5,
869
021
,950
00
021
,950
04,
970
784
178
02,
854
00
8,37
217
,158
10,6
6133
9.31
-Edu
c M
useu
m1
090
00
00
900
056
120
019
017
90
013
91,
098
(197
)33
9.32
-Ns
Hm
Rec
eivs
hp2,
807
025
00
025
00
00
00
00
00
2,83
233
9.35
-3rd
Par
ty H
lth44
70
1,25
00
00
1,25
00
1,25
00
00
00
00
1,25
044
733
9.36
-Boa
ting
Noi
se L
20
00
00
00
00
00
00
00
02
339.
37-I
Love
NY
Wat
er1
092
10
00
921
00
00
00
00
00
922
339.
38-S
umm
er S
ch A
rts21
30
00
00
00
00
00
00
00
021
333
9.39
-I Lo
ve N
Y W
ater
338
024
50
00
245
0(1
2)25
20
80
064
8749
633
9.41
-Sno
wm
obile
5,78
00
11,4
000
00
11,4
004,
850
102
355
80
610
00
5,37
611
,804
339.
42-T
r Sur
plus
Pro
p3,
568
02,
200
00
02,
200
00
322
00
00
080
31,
125
4,64
333
9.44
-Hos
p &
Nur
s M
gt2,
016
033
,345
00
033
,345
014
,960
434
186
01,
289
00
376
17,2
4518
,116
339.
45-W
ater
shed
Prtn
r(4
)0
00
00
00
00
00
00
00
0(4
)33
9.46
-Wor
ld U
niv
Gam
e3
00
00
00
00
00
00
00
00
333
9.47
-S U
Dor
m R
eim
b(4
)0
00
026
1,41
126
1,41
10
115,
123
143,
388
00
00
02,
900
261,
411
(4)
339.
48-O
DTA
Tra
in C
ont
2,01
00
00
09,
000
9,00
00
010
,000
00
00
00
10,0
001,
010
339.
49-O
DTA
Sta
te M
atc
238
00
00
00
00
00
00
00
00
238
339.
50-O
DTA
Trn
g M
gmt
154
075
00
00
750
051
941
200
259
00
083
965
339.
51-M
etha
done
Reg
is73
015
50
00
155
00
228
00
00
00
228
033
9.60
-Ene
rgy
Res
earc
h(1
)0
15,9
970
00
15,9
979,
234
3,36
51,
221
594
01,
583
00
015
,997
(1)
339.
61-R
adio
logy
2,21
50
6,00
00
02,
215
8,21
53,
000
1,00
055
735
043
80
03,
565
8,59
51,
835
339.
62-C
rim J
us Im
prov
21,2
000
53,0
000
00
53,0
0029
,400
3,33
872
310
20
1,59
90
022
,052
57,2
1416
,986
339.
65-F
arm
Pro
d In
sp-
270
1,75
00
00
1,75
00
1,63
713
950
096
40
0(1
85)
2,60
5(8
28)
339.
68-F
ngrp
rnt I
D T
ec6,
902
012
,850
00
012
,850
00
18,7
500
00
00
018
,750
1,00
233
9.72
-NY
Fire
Aca
dem
y44
60
468
00
046
80
182
279
10
60
024
771
519
933
9.77
-Tra
n Fe
es P
erm
s(1
)0
00
00
00
00
00
00
00
0(1
)33
9.79
-OP
DV
Tra
inin
g54
07
00
07
00
10
00
00
01
6033
9.81
-Env
ir.La
b.Fe
e A
543
03,
700
00
03,
700
01,
942
435
610
975
00
183
3,59
664
733
9.85
-Ins
St L
Adm
1,13
80
104,
292
00
010
4,29
216
,000
32,1
3440
,152
2,59
00
13,4
160
00
104,
292
1,13
833
9.86
-Hea
lth S
ervi
ces
310
00
00
00
00
00
00
00
031
339.
88-T
rain
Mgm
t Eva
l1,
647
03,
000
00
03,
000
01,
446
616
680
1,05
10
048
83,
669
978
339.
90-C
lin L
ab R
efrn
c(2
0,56
6)0
18,0
590
00
18,0
59(1
10)
7,79
83,
293
265
04,
249
00
015
,495
(18,
002)
339.
91-M
WB
D C
ertif
icat
00
00
00
00
00
00
00
00
00
339.
93-P
ub E
mp
Rel
Brd
845
086
00
086
027
530
00
00
00
057
535
633
9.94
-WIC
CV
L M
onet
ry0
02,
000
00
02,
000
00
00
00
00
00
2,00
033
9.95
-Rad
io H
lth P
rot
2,97
70
2,79
30
00
2,79
30
2,12
617
372
01,
160
00
216
3,74
72,
023
339.
99-C
ons
Food
Indu
s57
40
6,82
60
00
6,82
60
4,91
159
916
70
2,62
50
010
08,
402
(1,0
02)
339.
A2-
MM
IA(1
)0
00
00
00
00
00
00
00
0(1
)
CA
SH C
OM
BIN
ING
STA
TEM
ENT
BY
AC
CO
UN
TM
ISC
ELLA
NEO
US
SPEC
IAL
REV
ENU
E FU
ND
(339
)FY
201
2(T
hous
ands
of D
olla
rs)
T-212

Fund
O
peni
ng
Mis
c.
Fede
ral
Bon
d
Tran
sfer
s
Tota
l In
dire
ct
UI
Tran
sfer
s
Tota
l C
losi
ng
Acc
ount
Bal
ance
Taxe
s R
ecei
pts
Gra
nts
Proc
eeds
From
Rec
eipt
sLo
cal
PS
NPS
C
osts
Ben
efits
GSC
s D
ebt
Cap
ital
ToD
isb.
Bal
ance
CA
SH C
OM
BIN
ING
STA
TEM
ENT
BY
AC
CO
UN
TM
ISC
ELLA
NEO
US
SPEC
IAL
REV
ENU
E FU
ND
(339
)FY
201
2(T
hous
ands
of D
olla
rs)
339.
A3-
Edu
catn
Lib
rary
127
065
00
065
00
670
00
00
067
125
339.
A4-
Teac
her C
ertif
2,70
70
6,80
00
00
6,80
00
3,13
477
297
01,
388
00
1,32
76,
718
2,78
933
9.A
5-B
anki
ng D
eptm
nt16
,787
083
,578
00
083
,578
043
,642
13,7
691,
353
021
,682
00
2,41
382
,859
17,5
0633
9.A
6-C
able
TV
Acc
nt8,
708
02,
955
00
02,
955
01,
617
209
490
775
00
02,
650
9,01
333
9.A
7-E
con
Dev
el A
sst
412
049
20
00
492
065
335
00
00
092
492
412
339.
A9-
Fin
Svc
s S
eize
d21
30
500
00
500
050
00
00
00
5021
333
9.A
C-N
on-Iv
d W
age
Wi
(58)
00
00
00
00
00
00
00
00
(58)
339.
AD
-OD
D E
arne
d R
evn
283
00
00
00
00
00
00
00
00
283
339.
AE
-Mot
orcy
cle
Sfty
2,58
40
2,00
00
00
2,00
00
841,
237
30
400
05
1,36
93,
215
339.
AF-
Hos
p G
rant
s2
00
00
00
00
00
00
00
00
233
9.A
G-B
usin
ess
Lice
ns39
10
73,2
500
00
73,2
5053
916
,233
9,40
544
30
7,02
10
(15)
40,5
4674
,172
(531
)33
9.A
H-In
dir C
ost R
eco
432
00
00
21,4
3721
,437
010
,666
4,85
00
05,
110
00
020
,626
1,24
333
9.A
I-Hig
h S
choo
l Equ
956
022
50
00
225
00
469
00
00
00
469
712
339.
AJ-
Arti
cle
X In
ter
10
00
00
00
00
00
00
00
01
339.
AK
-Ins
Vou
cher
Pro
20
00
00
00
00
00
00
00
02
339.
AL-
OTD
A P
rogr
am29
00
00
00
00
200
00
00
00
200
(171
)33
9.A
M-H
lth C
are
Adv
is1
00
00
00
00
00
00
00
00
133
9.A
N-D
isas
Pre
p C
onf
240
10
00
10
01
00
00
00
124
339.
AP
-Adm
inis
tratio
n10
,019
013
,588
00
2,63
516
,223
07,
168
380
250
03,
948
00
011
,746
14,4
9633
9.A
Q-R
ail S
afet
y In
s1,
272
066
90
00
669
044
144
200
325
00
083
01,
111
339.
AR
-Fed
l Adm
in R
eim
2,28
50
130
00
27,8
6227
,992
027
,992
00
00
00
027
,992
2,28
533
9.A
S-Q
ualit
y A
ssur
an1
00
00
00
00
00
00
00
00
133
9.A
U-A
band
oned
Pro
p 0
017
,141
00
017
,141
07,
204
4,56
311
10
1,28
30
00
13,1
613,
980
339.
AV
-Sei
zed
Ass
ets
120
20
00
20
00
00
00
00
014
339.
AW
-Spi
nal I
njur
y7,
098
00
00
1,57
51,
575
024
73,
523
80
124
00
03,
902
4,77
133
9.A
X-C
hild
Sup
p R
ev7,
412
00
00
00
02,
040
4,14
710
00
1,05
00
00
7,33
775
339.
AY
-Mul
t Age
n Tr
ain
22,4
220
00
032
,000
32,0
000
2,28
629
,187
830
1,25
10
00
32,8
0721
,615
339.
AZ-
Dep
t Law
-Sei
zed
2,52
90
600
00
060
00
02,
000
00
00
00
2,00
01,
129
339.
B2-
DM
NA
-Sei
z A
sset
844
020
00
00
200
00
191
00
00
00
191
853
339.
B3-
Crit
ical
Infra
s1,
443
01,
998
00
01,
998
033
01,
459
130
196
00
01,
998
1,44
333
9.B
4-R
adon
Det
ct D
ev29
60
(7)
00
0(7
)0
010
00
00
02
1227
733
9.B
6-In
sura
nce
Dep
t18
6,88
20
407,
504
00
040
7,50
421
7,98
290
,507
50,9
613,
163
045
,246
00
040
7,85
918
6,52
733
9.B
7-W
orke
rs C
omp
Bd
33,6
990
189,
605
00
018
9,60
50
87,0
3168
,676
2,65
40
41,6
970
00
200,
058
23,2
4633
9.B
8-Fi
re P
rote
ctio
n92
025
00
025
00
00
00
00
1313
104
339.
B9-
Con
f Fee
Acc
t6
05
00
05
00
300
00
00
030
(19)
339.
BA
-Pub
lic W
ork
Enf
1,30
10
6,14
80
00
6,14
80
1,49
132
652
083
90
02,
930
5,63
81,
811
339.
BB
-Ass
et F
orfe
itur
562
040
60
00
406
00
685
00
00
00
685
283
339.
BF-
VE
SID
SS
1,61
00
2,50
00
00
2,50
01,
626
203
06
010
00
041
1,97
62,
134
339.
BI-T
rn M
tls R
egis
t58
06
00
06
00
240
00
00
024
4033
9.B
J-B
ell J
ar C
olle
c1
02,
100
00
02,
100
064
134
019
027
50
020
21,
477
624
339.
BK
-Ind
& U
til S
erv
1,41
60
3,07
00
00
3,07
00
1,51
50
730
764
00
441
2,79
31,
693
339.
BO
-Prim
ary
Car
e In
20
00
00
00
00
00
00
00
02
339.
BU
-Lan
d U
tiliz
atio
(1)
00
00
00
00
00
00
00
00
(1)
339.
BW
-Asb
esto
s Tr
ning
(106
)0
319
00
031
90
349
144
065
00
043
2(2
19)
339.
BZ-
IMP
R P
Tax
Adm
30
00
00
00
00
00
00
00
03
339.
C2-
Jone
s B
ch T
heat
10
00
00
00
00
00
00
00
01
339.
C3-
Pub
lic S
ervi
ce35
,543
072
,353
00
1072
,363
037
,896
9,26
11,
156
018
,156
00
1066
,479
41,4
2733
9.C
4-A
tty L
icen
sing
9,23
40
35,0
000
00
35,0
000
17,2
008,
200
00
7,50
00
00
32,9
0011
,334
339.
C9-
DS
S P
rov
Rec
ovs
186
03,
700
00
03,
700
03,
700
00
00
00
03,
700
186
339.
CA
-Crim
es A
gain
st
9,84
50
00
016
,000
16,0
0016
,000
00
00
00
00
16,0
009,
845
339.
CB
-FS
Rei
nves
tmen
t(1
)0
00
00
00
00
00
00
00
0(1
)33
9.C
D-D
ayca
re E
arne
d0
00
00
00
00
00
00
00
00
033
9.C
E-C
amp
Sm
ith B
ill33
019
70
00
197
013
19
50
470
00
192
3833
9.C
F-C
igar
ette
Fire
0
050
00
00
500
00
320
00
00
00
320
180
339.
CG
-Tec
h &
Sci
entif
(1)
00
00
00
00
00
00
00
00
(1)
339.
CL-
Com
m F
eed
Lic
214
00
00
00
00
00
00
00
00
214
339.
CM
-Reg
Man
u H
sg23
020
00
00
200
043
00
00
00
043
180
339.
CO
-Col
lege
Sav
ings
1,69
80
813
00
081
30
175
3015
013
50
00
355
2,15
633
9.C
Q-D
isco
ver Q
ueen
s8
00
00
00
00
00
00
00
00
833
9.C
R-R
even
Arr
eara
ge28
,284
025
,000
00
025
,000
01,
870
6,43
250
078
30
024
,380
33,5
1519
,769
339.
CS
-Pro
vide
r Ass
ess
8,82
10
00
00
00
00
00
00
00
08,
821
339.
CT-
Cel
l Pho
ne T
owe
713
018
70
00
187
00
00
00
00
900
900
0
T-213

Fund
O
peni
ng
Mis
c.
Fede
ral
Bon
d
Tran
sfer
s
Tota
l In
dire
ct
UI
Tran
sfer
s
Tota
l C
losi
ng
Acc
ount
Bal
ance
Taxe
s R
ecei
pts
Gra
nts
Proc
eeds
From
Rec
eipt
sLo
cal
PS
NPS
C
osts
Ben
efits
GSC
s D
ebt
Cap
ital
ToD
isb.
Bal
ance
CA
SH C
OM
BIN
ING
STA
TEM
ENT
BY
AC
CO
UN
TM
ISC
ELLA
NEO
US
SPEC
IAL
REV
ENU
E FU
ND
(339
)FY
201
2(T
hous
ands
of D
olla
rs)
339.
CU
-Spe
c C
onse
rv A
c11
00
00
00
00
00
00
00
010
910
91
339.
CY
-Cen
tral R
egis
ty31
90
5,01
70
00
5,01
70
900
200
590
04,
822
4,99
134
533
9.C
Z-P
lant
Indu
stry
254
050
00
00
500
037
30
110
182
00
1558
117
333
9.D
1-Fo
od S
tp R
ec F
r(1
)0
00
00
00
00
00
00
00
0(1
)33
9.D
4-Fo
od S
tp R
ec F
r5
00
00
00
00
00
00
00
00
533
9.D
9-B
atav
ia S
choo
l(6
,839
)0
9,60
00
081
010
,410
05,
919
591
177
02,
855
00
09,
542
(5,9
71)
339.
DB
-Alc
ohol
Bev
erag
3,91
00
00
017
,224
17,2
240
7,83
34,
832
239
03,
753
00
016
,657
4,47
733
9.D
C-In
vest
men
t Ser
v(6
17)
03,
406
00
03,
406
02,
025
665
620
970
00
541
4,26
3(1
,474
)33
9.D
D-D
rive
out D
iabe
480
60
00
60
00
00
00
00
054
339.
DF-
Kee
p K
ids
Dru
g 41
09
00
09
00
00
00
00
00
5033
9.D
H-O
MR
DD
Day
Srv
s(1
,106
)0
41,1
060
00
41,1
0640
,000
00
00
00
00
40,0
000
339.
DI-O
SD
C F
inan
Ove
r(1
,000
)0
5,80
20
00
5,80
20
2,47
854
387
01,
203
00
04,
311
491
339.
DK
-Sen
ate
Rec
ycla
b44
30
200
00
200
00
00
00
00
046
333
9.D
L-M
edic
aid
Frau
d43
,776
012
,725
00
012
,725
05,
758
2,74
216
70
2,58
40
00
11,2
5145
,250
339.
DM
-EA
D M
etal
lurg
l1
06
00
06
00
00
00
00
00
733
9.D
N-F
ines
Pen
altie
s(1
)0
00
00
00
00
00
00
00
0(1
)33
9.D
O-D
ED
Mar
ketin
g A
4,97
70
1,51
00
00
1,51
00
631,
276
20
280
013
11,
500
4,98
733
9.D
Q-T
ug H
ill A
dmin
600
380
00
380
293
00
00
010
4256
339.
DS
-Set
tlem
ent E
nf76
50
900
00
090
085
00
500
00
00
090
076
533
9.D
T-In
dian
Gam
ing
(96,
990)
07,
441
00
07,
441
012
,681
2,51
049
80
5,99
70
00
21,6
86(1
11,2
35)
339.
DX
-NY
S F
LEX
Spe
nd6
030
00
00
300
00
300
00
00
00
300
633
9.D
Z-In
tere
st A
sses
s1
00
00
00
00
00
00
00
00
133
9.E
1-C
rime
Vic
tims
B13
054
00
054
00
540
00
00
054
1333
9.E
2-C
onfe
renc
e&S
ign
107
035
00
035
00
350
00
00
035
107
339.
E3-
Ofc
of P
rofe
ssi
7,19
30
47,2
640
00
47,2
640
17,6
228,
605
537
08,
443
00
5,86
141
,068
13,3
8933
9.E
4-E
duc
Ass
essm
ent
2,57
60
00
00
00
02,
572
00
00
00
2,57
24
339.
E5-
Arm
ory
Ren
tal A
1,01
60
1,82
50
00
1,82
50
804
1,00
127
020
30
00
2,03
580
633
9.E
6-R
ome
Sch
ool
(198
)0
9,60
00
01,
100
10,7
000
5,04
768
614
90
2,43
10
00
8,31
32,
189
339.
E7-
Uni
f Com
mer
c C
d(1
)0
00
00
00
00
00
00
00
0(1
)33
9.E
8-S
eize
d A
sset
s(4
,576
)0
8,72
50
00
8,72
50
019
,725
00
00
00
19,7
25(1
5,57
6)33
9.E
9-Tr
af A
djud
icat
n(4
,972
)0
41,5
000
00
41,5
000
20,1
479,
359
614
09,
652
00
039
,772
(3,2
44)
339.
EA
-Bus
& L
icen
Srv
10
00
00
00
00
00
00
00
01
339.
EB
-Ant
itrus
t Enf
or(1
)0
00
00
00
00
00
00
00
0(1
)33
9.E
C-F
ed S
alar
y S
har
2,49
00
00
03,
910
3,91
039
02,
280
145
780
1,11
30
062
4,06
82,
332
339.
ED
-Coo
k/C
hill
Acc
o18
00
2,10
00
00
2,10
00
02,
100
00
00
00
2,10
018
033
9.E
E-M
ap R
even
ue1
00
00
00
00
00
00
00
00
133
9.E
F-TA
P S
ys R
edes
gn(1
)0
00
00
00
00
00
00
00
0(1
)33
9.E
G-C
lient
Not
ices
1,27
70
00
02,
000
2,00
00
2,36
591
20
00
00
03,
277
033
9.E
J-C
rede
ntia
l Srv
s43
088
20
00
882
060
90
190
251
00
4692
50
339.
EK
-Sei
zed
Ass
ets
430
00
00
00
00
00
00
00
043
339.
EM
-NY
C A
sses
smen
t27
,737
080
,077
00
080
,077
036
,881
24,5
531,
420
016
,799
00
079
,653
28,1
6133
9.E
N-C
ultu
ral E
duca
t(1
4,45
1)0
28,7
500
00
28,7
500
12,1
095,
609
369
05,
801
00
2,11
926
,007
(11,
708)
339.
EP
-Dis
tanc
e Le
arn
10
00
00
00
00
00
00
00
01
339.
ER
-Exa
m &
Mis
c R
ev3,
305
03,
150
00
03,
150
035
075
016
021
90
01,
566
2,90
13,
554
339.
ES
-Eat
ing
Dis
orde
r0
01,
000
00
01,
000
00
00
00
00
00
1,00
033
9.F1
-Tra
ns R
egul
Acc
9,84
90
4,80
00
00
4,80
00
1,95
834
388
01,
758
00
04,
147
10,5
0233
9.F2
-Con
s P
rot A
cct
1,12
20
910
00
910
109
300
50
400
00
454
759
339.
F6-L
c O
n S
olid
Was
(1)
01
00
01
00
00
00
00
00
033
9.F9
-OE
R N
AS
DE
R11
70
240
00
240
030
00
00
00
3011
133
9.FA
-Fin
Aid
Aud
it1
00
00
00
00
00
00
00
00
133
9.FC
-Fos
tr C
are
Sav
i(1
)0
00
00
00
00
00
00
00
0(1
)33
9.FH
-8th
Air
Forc
e H
20
00
00
00
00
00
00
00
02
339.
FL-F
ed L
iabi
lity
350
00
00
00
00
00
00
00
035
339.
FM-F
MS
Acc
ount
5,33
60
100
036
,000
36,0
100
9,13
931
,499
00
00
00
40,6
3870
833
9.FP
-Fun
eral
790
099
50
00
995
023
214
80
117
00
837
91,
406
339.
FS-F
SH
RP
910
00
025
0,00
025
0,00
025
0,00
00
00
00
00
025
0,00
091
339.
G1-
Edu
c A
rchi
ves
182
015
00
015
00
730
00
00
073
124
339.
G3-
Loca
l Ser
vice
s37
00
1,10
00
00
1,10
00
555
030
032
50
026
936
534
339.
G7-
DO
T-A
ccid
ent D
a4,
611
015
,000
00
015
,000
031
513
,075
190
295
00
013
,704
5,90
733
9.G
A-A
dult
She
lter
4,59
70
00
00
00
00
00
00
00
04,
597
339.
GB
-QA
A E
arne
d R
ev42
60
00
00
00
00
00
00
00
042
633
9.G
C-F
amily
Pre
s S
vc1,
641
060
00
060
00
00
00
00
00
1,70
1
T-214

Fund
O
peni
ng
Mis
c.
Fede
ral
Bon
d
Tran
sfer
s
Tota
l In
dire
ct
UI
Tran
sfer
s
Tota
l C
losi
ng
Acc
ount
Bal
ance
Taxe
s R
ecei
pts
Gra
nts
Proc
eeds
From
Rec
eipt
sLo
cal
PS
NPS
C
osts
Ben
efits
GSC
s D
ebt
Cap
ital
ToD
isb.
Bal
ance
CA
SH C
OM
BIN
ING
STA
TEM
ENT
BY
AC
CO
UN
TM
ISC
ELLA
NEO
US
SPEC
IAL
REV
ENU
E FU
ND
(339
)FY
201
2(T
hous
ands
of D
olla
rs)
339.
GD
-Ele
ctro
nic
Ben
e2,
738
00
00
11,0
0011
,000
9,70
00
00
00
00
09,
700
4,03
833
9.G
E-F
eder
al-S
eize
d 29
00
00
00
00
880
00
00
088
(59)
339.
H2-
DH
CR
Mor
tgag
e S
(858
)0
7,86
10
00
7,86
10
3,91
820
111
90
1,91
30
00
6,15
185
233
9.H
3-P
ilot H
ealth
In1
00
00
00
00
00
00
00
00
133
9.H
5-Tr
iple
Pre
scr F
(2)
00
00
00
00
00
00
00
00
(2)
339.
H6-
OM
H-R
esea
rch
OH
690
2,84
80
00
2,84
80
102
2,74
60
00
00
02,
848
6933
9.H
7-D
MV
-Com
puls
ory
1,69
60
27,6
000
00
27,6
000
8,88
51,
416
271
04,
257
00
15,3
6830
,197
(901
)33
9.H
9-P
rof M
edic
Con
d8,
502
026
,089
00
026
,089
012
,299
4,99
744
40
6,97
90
00
24,7
199,
872
339.
HC
-Hw
ay C
onst
& M
a1,
005
026
00
00
260
00
125
00
00
00
125
1,14
033
9.H
I-Hou
sing
Indi
rec
956
03,
050
00
03,
050
02,
020
339
600
984
00
03,
403
603
339.
HQ
-Adl
t Hm
e Q
lty E
569
065
00
00
650
00
276
00
00
021
297
922
339.
HR
-Hom
eles
s H
sg1
00
00
00
00
00
00
00
00
133
9.IA
-CO
CO
T2
00
00
00
00
00
00
00
00
233
9.IC
-Acc
id P
reve
nt C
260
01,
000
00
01,
000
015
998
50
760
060
694
431
633
9.IG
-IG S
zd A
sset
s81
085
00
085
00
870
00
00
087
7933
9.IM
-Leg
Svc
s A
ssis
t3,
856
013
,600
00
013
,600
14,3
000
00
00
00
014
,300
3,15
633
9.J1
-Loc
Pub
Hlth
2,85
50
950
00
095
00
115
2012
065
00
521
73,
588
339.
J2-L
ocal
Dis
t Tra
i39
00
800
00
080
00
074
40
00
00
074
444
633
9.J4
-Vot
ing
Mac
h E
xa13
60
830
00
830
019
60
00
00
019
623
339.
J5-D
HC
R H
CA
App
lic1,
303
02,
244
00
02,
244
01,
174
348
360
573
00
02,
131
1,41
633
9.J6
-EP
IC P
rem
ium
Ac
94,0
140
143,
500
00
014
3,50
066
,940
1,68
612
,014
780
1,24
50
094
,625
176,
588
60,9
2633
9.J7
-Dru
g E
nfor
ce T
a83
00
00
00
00
00
00
00
00
8333
9.JA
-Vita
l Rec
Mgm
t1,
706
04,
356
00
04,
356
01,
198
7137
059
10
02,
252
4,14
91,
913
339.
JB-C
HC
CD
P T
rans
fer
24,3
730
00
00
00
00
00
00
024
,373
24,3
730
339.
JD-P
robl
m S
olv
Cou
192
00
00
00
00
00
00
00
00
192
339.
JE-T
obac
co E
nfor
ce17
00
00
00
00
00
00
00
00
1733
9.K
1-H
wy
Rev
/Soc
Sec
1,34
90
406
00
040
60
039
80
00
00
5044
81,
307
339.
K2-
Equ
ip R
epai
r(1
)0
00
00
00
00
00
00
00
0(1
)33
9.K
3-C
atas
troph
ic H
l1
00
00
00
00
00
00
00
00
133
9.K
A-P
rimar
y H
lth C
r(1
)0
00
00
00
00
00
00
00
0(1
)33
9.K
B-C
onfe
renc
e &
Sp
(1)
00
00
00
00
00
00
00
00
(1)
339.
L2-A
sst L
ivin
g R
es12
90
950
00
9595
00
00
00
09
104
120
339.
L4-O
CFS
Pro
gram
2,75
30
100
00
010
00
142
00
071
00
021
32,
640
339.
L5-A
dult
Cys
t Fib
r(1
)0
00
00
00
00
00
00
00
0(1
)33
9.L7
-OTD
A In
com
e A
cc35
,902
00
00
68,1
0068
,100
049
,554
53,1
000
00
00
010
2,65
41,
348
339.
L8-D
OS
Lic
ensi
ng(1
)0
00
00
00
00
00
00
00
0(1
)33
9.LB
-Hea
lth O
ccup
De
10
00
00
00
00
00
00
00
01
339.
LC-M
ater
n C
hld
Hiv
20
00
00
00
00
00
00
00
02
339.
LF-D
isab
il D
eter
ms
90
00
00
00
00
00
00
00
09
339.
LG-O
MR
DD
-Jt C
linic
460
162
00
016
220
80
00
00
00
020
80
339.
LH-S
peci
al M
edic
al1
00
00
00
00
00
00
00
00
133
9.LI
-Liti
gatio
n S
ett
9,26
40
56,2
170
00
56,2
170
17,1
6834
,345
524
08,
225
00
060
,262
5,21
933
9.LJ
-Ani
mal
Pop
ulat
i71
60
1,05
00
00
1,05
00
01,
000
00
00
00
1,00
076
633
9.LL
-Lov
e Y
our L
ibra
320
60
00
60
00
00
00
00
038
339.
LW-L
ocal
Wire
less
210
00
00
00
00
00
00
00
021
339.
LZ-P
ub S
afe
Com
mun
47,4
750
114,
245
00
011
4,24
538
,600
7,94
568
,114
00
500
00
22,8
4113
8,00
023
,720
339.
MC
-Cub
a La
ke M
gmt
188
020
00
00
200
00
184
00
00
00
184
204
339.
MH
-St J
ustic
e In
st69
00
00
00
00
00
00
00
00
6933
9.M
R-M
ed R
eim
b A
cct
(1)
01,
500
00
01,
500
1,50
00
00
00
00
01,
500
(1)
339.
NG
-Low
Inc
Hou
sing
1,25
90
2,72
30
00
2,72
30
1,02
50
310
500
00
01,
556
2,42
633
9.N
H-P
rovi
der 9
002
00
00
00
00
00
00
00
00
233
9.N
Y-N
ew Y
ork
Ale
rt1,
918
03,
084
00
03,
084
00
3,10
00
00
00
03,
100
1,90
233
9.P
4-P
rocu
re O
p N
ews
1,02
10
275
00
027
50
4013
50
00
00
100
275
1,02
133
9.P
5-C
VB
Res
titut
ion
804
057
60
00
576
042
615
00
00
00
057
680
433
9.P
6-E
FC C
orp
Adm
in(4
7)0
1,88
70
00
1,88
70
1,30
011
00
064
40
00
2,05
4(2
14)
339.
PC
-Foo
d P
rod
Ctr
814
01,
000
00
01,
000
00
1,00
00
00
00
01,
000
814
339.
PD
-Pet
Dea
ler
410
320
00
320
530
20
260
00
81(8
)33
9.P
O-A
uth
Bdg
t Offc
e37
30
1,87
70
01,
826
3,70
30
727
250
280
447
00
391,
491
2,58
533
9.P
S-P
atie
nt S
afet
y 19
70
500
00
050
00
038
80
00
00
7346
123
633
9.Q
2-H
elen
Hay
es H
os3,
245
011
50
067
,278
67,3
930
32,8
2923
,480
125
00
00
7,71
064
,144
6,49
433
9.Q
3-N
YC
Vet
eran
s3,
091
035
00
033
,792
34,1
420
14,8
368,
652
600
6,87
20
01,
692
32,1
125,
121
339.
Q4-
NY
S H
ome-
Vet
era
2,52
90
120
00
21,9
0022
,020
015
,310
6,89
775
00
00
1,17
223
,454
1,09
5
T-215

Fund
O
peni
ng
Mis
c.
Fede
ral
Bon
d
Tran
sfer
s
Tota
l In
dire
ct
UI
Tran
sfer
s
Tota
l C
losi
ng
Acc
ount
Bal
ance
Taxe
s R
ecei
pts
Gra
nts
Proc
eeds
From
Rec
eipt
sLo
cal
PS
NPS
C
osts
Ben
efits
GSC
s D
ebt
Cap
ital
ToD
isb.
Bal
ance
CA
SH C
OM
BIN
ING
STA
TEM
ENT
BY
AC
CO
UN
TM
ISC
ELLA
NEO
US
SPEC
IAL
REV
ENU
E FU
ND
(339
)FY
201
2(T
hous
ands
of D
olla
rs)
339.
Q5-
WN
Y V
ets
Hom
e(2
87)
055
00
15,6
2215
,677
08,
034
3,48
040
00
00
992
12,5
462,
844
339.
Q6-
Mon
trose
S V
H3,
981
030
00
21,5
8121
,611
015
,897
6,01
470
00
00
765
22,7
462,
846
339.
Q9-
DO
H H
ospi
tal H
o3,
334
00
00
144,
751
144,
751
00
00
00
00
141,
754
141,
754
6,33
133
9.Q
A-S
pec
Ene
rgy
Adm
(2)
00
00
00
00
00
00
00
00
(2)
339.
QC
-Qua
lity
of C
are
1,16
60
1,33
40
01,
500
2,83
40
01,
541
00
00
00
1,54
12,
459
339.
QE
-C &
F Q
ual E
nha
140
00
00
00
00
00
00
00
014
339.
R4-
Mot
or F
uel Q
ual
1,51
40
2,94
70
00
2,94
70
882
1,91
727
043
20
031
73,
575
886
339.
R5-
Wei
ghts
Mea
sure
284
040
00
00
400
022
770
70
111
00
5046
521
933
9.R
7-D
efer
Com
p A
dm(1
43)
082
00
00
820
036
117
411
017
60
00
722
(45)
339.
R9-
Haz
ard
Aba
tem
en30
010
00
00
100
100
00
00
00
00
100
3033
9.R
D-E
duca
tion
Sta
ts17
00
089
00
890
037
00
00
00
3722
233
9.R
F-R
eal E
stat
e Fi
n4,
426
01,
000
00
01,
000
054
884
170
272
00
092
14,
505
339.
RR
-NY
C R
ent R
ev(9
,052
)0
36,7
670
00
36,7
670
24,0
593,
189
734
011
,267
00
039
,249
(11,
534)
339.
S1-
Med
icai
d In
com
e(8
82)
00
00
00
00
00
00
00
00
(882
)33
9.S
8-R
ent R
even
ue(3
65)
085
00
00
850
050
30
150
246
00
076
4(2
79)
339.
S9-
Airp
ort S
ecur
it24
80
00
00
00
00
00
00
00
024
833
9.S
A-C
SFP
Sal
vage
Ac
130
00
00
00
00
00
00
00
013
339.
SR
-ES
Ste
m C
ell T
r5,
599
00
00
45,0
0045
,000
00
45,0
000
00
00
045
,000
5,59
933
9.S
S-D
OT
Sig
n S
hop
(1)
00
00
00
00
00
00
00
00
(1)
339.
ST-
Sys
tem
s &
Tec
h3,
372
07,
300
00
07,
300
02,
685
2,51
183
01,
296
00
833
7,40
83,
264
339.
T2-O
PR
Pat
ron
Ser
v10
,055
067
,494
00
067
,494
023
,959
36,0
790
03,
522
00
3,40
266
,962
10,5
8733
9.T5
-Tra
ns A
viat
n2,
908
03,
660
00
03,
660
011
83,
393
70
990
00
3,61
72,
951
339.
TM-T
each
er E
d A
ccr
700
860
00
860
037
00
00
014
5110
533
9.TN
-Tra
inin
g A
cade
m53
010
00
010
00
100
00
00
010
5333
9.TR
-Tax
Rev
Arr
ear
(1,7
66)
02,
700
00
02,
700
00
1,79
50
00
00
01,
795
(861
)33
9.TS
-TS
CR
Acc
ount
53,3
320
125,
512
00
012
5,51
231
,378
00
00
00
092
,371
123,
749
55,0
9533
9.TW
-Sta
tew
ide
Gam
in1
00
00
00
00
00
00
00
00
133
9.U
2-R
ecru
itmen
t Inc
3,00
20
390
01,
087
1,12
60
01,
686
00
00
00
1,68
62,
442
339.
UR
-ULT
VI R
AD
IA D
EV
450
00
00
00
00
00
00
00
045
339.
US
-Und
rgrn
d S
fty T
209
011
00
00
110
00
00
00
00
175
175
144
339.
VF-
Vol
Fire
Rec
&R
e74
00
00
00
00
00
00
00
00
7433
9.V
M-H
AV
A M
atch
2,90
00
00
00
00
01,
700
00
00
00
1,70
01,
200
339.
VR
-VR
SS
20
00
00
00
00
00
00
00
02
339.
W4-
Occ
Hlth
Clin
ic4,
487
09,
000
00
09,
000
052
29,
327
500
100
00
09,
999
3,48
833
9.W
6-C
rim B
ack
Che
ck37
70
00
00
00
00
00
00
00
037
733
9.W
E-M
edic
aid
Trai
n0
0(1
,000
)0
00
(1,0
00)
00
00
00
00
00
(1,0
00)
339.
WK
-SR
-Con
nect
ions
10
00
00
00
00
00
00
00
01
339.
WR
-NY
S W
ater
Res
cu4
00
00
00
00
00
00
00
00
433
9.W
W-O
WIG
Adm
Rei
mb
3,14
10
240
01,
500
1,52
40
408
458
180
214
00
01,
098
3,56
733
9.W
Z-D
urab
le M
edic
al0
037
60
00
376
00
00
00
00
00
376
339.
XE
-Win
e In
dust
ry
50
00
00
00
00
00
00
0(1
1)(1
1)16
339.
XX
-A&
M-A
ggre
gate
d5,
378
015
,044
00
112
15,1
560
1,67
415
,900
510
802
00
2918
,456
2,07
833
9.Y
7-A
ssem
bly
Rec
yc61
90
400
00
400
00
00
00
00
065
933
9.Y
D-S
ales
Tax
Re
Fe8
00
00
00
00
00
00
00
00
833
9.Y
F-Y
th F
ac P
erD
iem
10
115,
417
00
011
5,41
70
00
00
00
082
,885
82,8
8532
,533
339.
YL-
OG
S B
ldg
Adm
in3,
011
08,
890
00
08,
890
02,
600
2,94
182
01,
301
00
1,00
07,
924
3,97
733
9.Y
N-O
GS
Std
& P
urch
5,54
10
5,63
60
00
5,63
60
762
5,16
953
084
30
05,
000
11,8
27(6
50)
339.
YP
-Equ
itabl
e S
hari
2,31
30
00
00
00
00
00
00
00
02,
313
339.
YV
-Pro
vide
r Ass
ess
10
869,
700
00
086
9,70
086
9,70
00
00
00
00
086
9,70
01
339.
YX
-HE
P68
00
00
00
00
300
00
00
00
300
(232
)33
9.Z1
-Fed
Indi
rect
Re
142
00
00
00
00
00
00
00
00
142
339.
Z3-M
HP
IA O
MR
NP
S(1
)0
00
00
00
00
00
00
00
0(1
)33
9.Z6
-Hum
an R
ight
s A
c(2
)0
00
00
00
00
00
00
00
0(2
)33
9.ZM
-Lic
ense
Pla
te0
00
00
00
00
00
00
00
00
033
9.ZR
-Milk
Pro
duce
rs(1
)0
00
00
00
00
00
00
00
0(1
)33
9.ZT
-FH
PE
P0
00
00
00
00
00
00
00
00
033
9.ZV
-S T
A R
esea
rch
(19)
00
00
00
00
00
00
00
00
(19)
339.
ZW-D
OC
S A
sset
For
f11
00
140
00
140
014
00
00
00
1411
0
T-216

002
072
074
075
076
077
078
079
080
101
105
109
Ope
ning
Fun
d B
alan
ce0
11,8
5410
2,22
23,
149
(23,
642)
1454
,143
(392
)88
164
200
3,39
1
Rec
eipt
s:
Taxe
s0
1,21
4,20
00
00
011
9,10
00
00
00
Mis
cella
neou
s R
ecei
pts
2,15
8,94
31,
323,
088
01,
800
33,2
850
14,4
000
00
00
Fede
ral G
rant
s0
5,35
90
00
00
00
00
0
Tota
l Rec
eipt
s2,
158,
943
2,54
2,64
70
1,80
033
,285
013
3,50
00
00
00
Dis
burs
emen
ts:
Gra
nts
to L
ocal
Gov
ernm
ents
1,28
8,05
244
,925
00
00
00
00
00
Sta
te O
pera
tions
00
00
00
00
00
00
Gen
eral
Sta
te C
harg
es0
00
00
00
00
00
0D
ebt S
ervi
ce0
00
00
00
00
00
0C
apita
lPro
ject
s1
858
239
196
079
345
000
180
034
248
017
320
034
30
00
0
CAS
H C
OM
BIN
ING
STA
TEM
ENT
CAP
ITAL
PR
OJE
CTS
FU
ND
SFY
201
2(th
ousa
nds
of d
olla
rs)
Cap
ital P
roje
cts
1,85
8,23
91,
960,
793
45,0
001,
800
34,2
480
173,
200
343
00
00
Tota
l Dis
burs
emen
ts3,
146,
291
2,00
5,71
845
,000
1,80
034
,248
017
3,20
034
30
00
0
Oth
er F
inan
cing
Sou
rces
(Use
s):
Tran
sfer
s fro
m O
ther
Fun
ds1,
013,
958
811,
124
45,0
000
00
034
30
00
0Tr
ansf
ers
to O
ther
Fun
ds(2
0,88
0)(1
,390
,904
)0
0(1
,506
)0
00
0(2
5)(6
00)
(100
)B
ond
& N
ote
Pro
ceed
s0
00
00
00
00
2560
010
0
Net
Oth
er F
inan
cing
Sou
rces
(Use
s)99
3,07
8(5
79,7
80)
45,0
000
(1,5
06)
00
343
00
00
Cha
nge
in F
und
Bal
ance
5,73
0(4
2,85
1)0
0(2
,469
)0
(39,
700)
00
00
0
Clo
sing
Fun
d B
alan
ce5,
730
(30,
997)
102,
222
3,14
9(2
6,11
1)14
14,4
43(3
92)
8816
420
03,
391
T-217

Ope
ning
Fun
d B
alan
ce
Rec
eipt
s:
Taxe
sM
isce
llane
ous
Rec
eipt
sFe
dera
l Gra
nts
Tota
l Rec
eipt
s
Dis
burs
emen
ts:
Gra
nts
to L
ocal
Gov
ernm
ents
Sta
te O
pera
tions
Gen
eral
Sta
te C
harg
esD
ebt S
ervi
ceC
apita
lPro
ject
s
115
121
123
124
126
127
291
310
312
327
357
3,25
222
7,88
64,
291
885
2,65
720
,185
(80,
322)
893
(102
,107
)50
4(3
,468
)
00
00
00
00
00
00
00
00
00
1011
5,95
40
19,0
000
00
00
02,
196,
616
00
00
00
00
00
2,19
6,61
610
115,
954
019
,000
00
00
00
912,
458
00
00
00
00
00
00
00
00
00
00
00
00
00
00
00
00
00
00
00
00
00
092
480
810
116
271
019
000
CAS
H C
OM
BIN
ING
STA
TEM
ENT
CAP
ITAL
PRO
JEC
TS F
UN
DS
FY 2
012
(thou
sand
s of
dol
lars
)
Cap
ital P
roje
cts
Tota
l Dis
burs
emen
ts
Oth
er F
inan
cing
Sou
rces
(Use
s):
Tran
sfer
s fro
m O
ther
Fun
dsTr
ansf
ers
to O
ther
Fun
dsB
ond
& N
ote
Pro
ceed
s
Net
Oth
er F
inan
cing
Sou
rces
(Use
s)
Cha
nge
in F
und
Bal
ance
Clo
sing
Fun
d B
alan
ce
00
00
00
924,
808
1011
6,27
10
19,0
00
00
00
00
1,83
7,26
610
116,
271
019
,000
00
00
00
00
13,7
000
0(1
,500
)(4
15,8
46)
(1,0
00)
(4,0
00)
(2,0
00)
(50,
343)
(353
,326
)0
(34,
750)
00
1,50
041
5,74
61,
000
4,00
02,
000
50,3
430
00
00
0(1
00)
00
00
(353
,326
)0
(21,
050)
00
0(1
00)
00
00
6,02
40
(21,
367)
00
3,25
222
7,78
64,
291
885
2,65
720
,185
(74,
298)
893
(123
,474
)50
4(3
,468
)
T-218
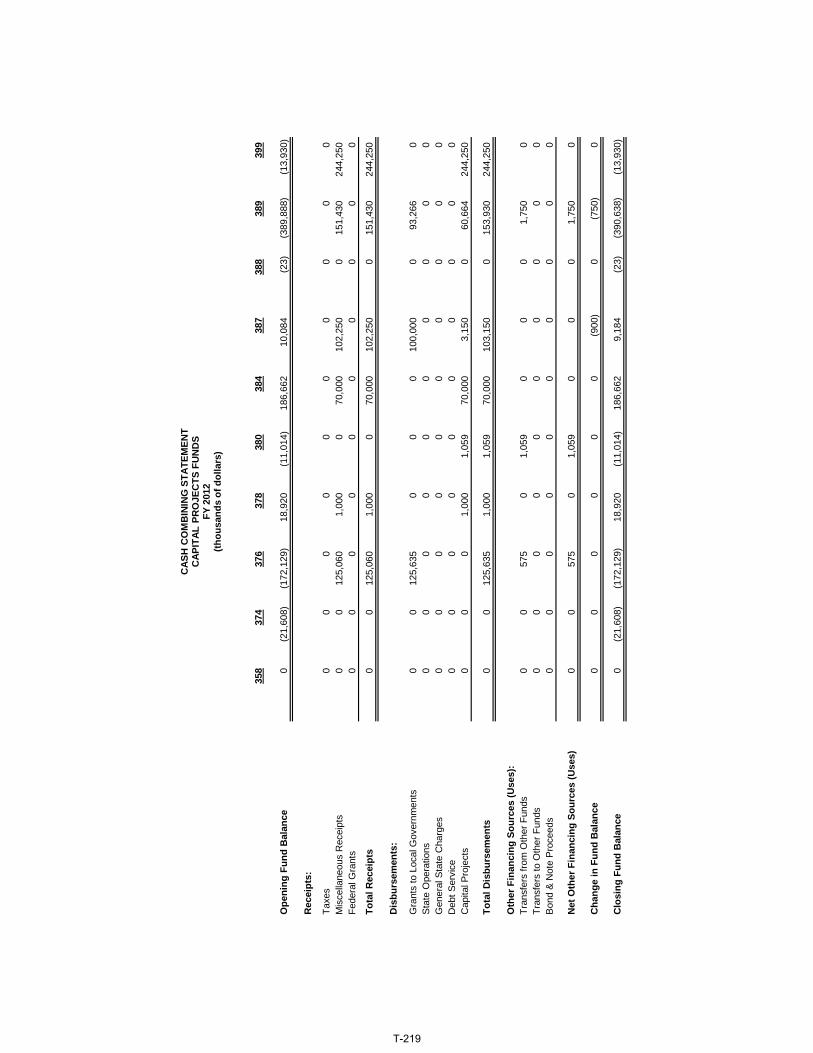
Ope
ning
Fun
d B
alan
ce
Rec
eipt
s:
Taxe
sM
isce
llane
ous
Rec
eipt
sFe
dera
l Gra
nts
Tota
l Rec
eipt
s
Dis
burs
emen
ts:
Gra
nts
to L
ocal
Gov
ernm
ents
Sta
te O
pera
tions
Gen
eral
Sta
te C
harg
esD
ebt S
ervi
ceC
apita
lPro
ject
s
358
374
376
378
380
384
387
388
389
399
0(2
1,60
8)(1
72,1
29)
18,9
20(1
1,01
4)18
6,66
210
,084
(23)
(389
,888
)(1
3,93
0)
00
00
00
00
00
00
125,
060
1,00
00
70,0
0010
2,25
00
151,
430
244,
250
00
00
00
00
00
00
125,
060
1,00
00
70,0
0010
2,25
00
151,
430
244,
250
00
125,
635
00
010
0,00
00
93,2
660
00
00
00
00
00
00
00
00
00
00
00
00
00
00
00
00
01
000
105
970
000
315
00
6066
424
425
0
CAS
H C
OM
BIN
ING
STA
TEM
ENT
CAP
ITAL
PRO
JEC
TS F
UN
DS
FY 2
012
(thou
sand
s of
dol
lars
)
Cap
ital P
roje
cts
Tota
l Dis
burs
emen
ts
Oth
er F
inan
cing
Sou
rces
(Use
s):
Tran
sfer
s fro
m O
ther
Fun
dsTr
ansf
ers
to O
ther
Fun
dsB
ond
& N
ote
Pro
ceed
s
Net
Oth
er F
inan
cing
Sou
rces
(Use
s)
Cha
nge
in F
und
Bal
ance
Clo
sing
Fun
d B
alan
ce
00
01,
000
1,05
970
,000
3,15
00
60,6
6424
4,25
0
00
125,
635
1,00
01,
059
70,0
0010
3,15
00
153,
930
244,
250
00
575
01,
059
00
01,
750
00
00
00
00
00
00
00
00
00
00
0
00
575
01,
059
00
01,
750
0
00
00
00
(900
)0
(750
)0
0(2
1,60
8)(1
72,1
29)
18,9
20(1
1,01
4)18
6,66
29,
184
(23)
(390
,638
)(1
3,93
0)
T-219

Ope
ning
Fun
d B
alan
ce
Rec
eipt
s:
Taxe
sM
isce
llane
ous
Rec
eipt
sFe
dera
l Gra
nts
Tota
l Rec
eipt
s
Dis
burs
emen
ts:
Gra
nts
to L
ocal
Gov
ernm
ents
Sta
te O
pera
tions
Gen
eral
Sta
te C
harg
esD
ebt S
ervi
ceC
apita
lPro
ject
s
CPO
Sub
Tota
lEl
imin
atio
nsFi
nanc
ial P
lan
0(1
67,0
79)
0(1
67,0
79)
01,
333,
300
01,
333,
300
14,
360,
471
04,
360,
471
02,
201,
975
02,
201,
975
17,
895,
746
07,
895,
746
02,
564,
336
02,
564,
336
00
00
00
00
00
00
05
513
835
05
513
835
CAS
H C
OM
BIN
ING
STA
TEM
ENT
CAP
ITAL
PRO
JEC
TS F
UN
DS
FY 2
012
(thou
sand
s of
dol
lars
)
Cap
ital P
roje
cts
Tota
l Dis
burs
emen
ts
Oth
er F
inan
cing
Sou
rces
(Use
s):
Tran
sfer
s fro
m O
ther
Fun
dsTr
ansf
ers
to O
ther
Fun
dsB
ond
& N
ote
Pro
ceed
s
Net
Oth
er F
inan
cing
Sou
rces
(Use
s)
Cha
nge
in F
und
Bal
ance
Clo
sing
Fun
d B
alan
ce
05,
513,
835
05,
513,
835
08,
078,
171
08,
078,
171
01,
887,
509
(837
,538
)1,
049,
971
0(2
,276
,780
)83
7,53
8(1
,439
,242
)0
475,
314
047
5,31
4
086
,043
086
,043
1(9
6,38
2)0
(96,
382)
1(2
63,4
61)
0(2
63,4
61)
T-220

064
304
311
316
319
330
361
364
Sub
Tota
lEl
imin
atio
nsFi
nanc
ial P
lan
Ope
ning
Fun
d B
alan
ce0
119,
999
00
33,1
0530
0,89
80
045
4,00
20
454,
002
Rec
eipt
s:
Taxe
s0
09,
666,
250
00
050
0,90
02,
808,
674
12,9
75,8
240
12,9
75,8
24M
isce
llane
ous
Rec
eipt
s0
325,
017
013
,386
127,
830
482,
097
050
094
8,83
00
948,
830
Fede
ral G
rant
s0
078
,803
00
00
078
,803
078
,803
Tota
l Rec
eipt
s0
325,
017
9,74
5,05
313
,386
127,
830
482,
097
500,
900
2,80
9,17
414
,003
,457
014
,003
,457
Dis
burs
emen
ts:
Gra
nts
to L
ocal
Gov
ernm
ents
00
00
00
00
00
0S
tate
Ope
ratio
ns0
6,08
538
,418
01,
680
8,43
50
5,90
960
,527
060
,527
Gen
eral
Sta
te C
harg
es0
00
00
00
00
00
Deb
t Ser
vice
031
5,77
55,
055,
697
14,3
8628
,805
84,1
220
373,
133
5,87
1,91
80
5,87
1,91
8C
apita
l Pro
ject
s0
00
00
00
00
00
Tota
l Dis
burs
emen
ts0
321,
860
5,09
4,11
514
,386
30,4
8592
,557
037
9,04
25,
932,
445
05,
932,
445
Oth
er F
inan
cing
Sou
rces
(Use
s):
Tran
sfer
s fro
m O
ther
Fun
ds0
3,24
7,18
83,
418,
165
1,00
042
,069
00
06,
708,
422
(203
,200
)6,
505,
222
Tran
sfer
s to
Oth
er F
unds
0(3
,214
,243
)(8
,069
,103
)0
(163
,170
)(3
06,5
61)
(500
,900
)(2
,430
,132
)(1
4,68
4,10
9)20
3,20
0(1
4,48
0,90
9)B
ond
& N
ote
Pro
ceed
s0
00
00
00
00
00
Net
Oth
er F
inan
cing
Sou
rces
(Use
s)0
32,9
45(4
,650
,938
)1,
000
(121
,101
)(3
06,5
61)
(500
,900
)(2
,430
,132
)(7
,975
,687
)0
(7,9
75,6
87)
Cha
nge
in F
und
Bal
ance
036
,102
00
(23,
756)
82,9
790
095
,325
095
,325
Clo
sing
Fun
d B
alan
ce0
156,
101
00
9,34
938
3,87
70
054
9,32
70
549,
327
CA
SH C
OM
BIN
ING
STA
TEM
ENT
DEB
T SE
RVI
CE
FY 2
012
(thou
sand
s of
dol
lars
)
T-221

Fund
O
peni
ng
Mis
c.
Fede
ral
Bon
d
Tran
sfer
s
Tota
l To
tal
Tran
sfer
s
Tota
l C
losi
ng
Acc
ount
Bal
ance
Taxe
s R
ecei
pts
Gra
nts
Proc
eeds
From
Rec
eipt
sLo
cal
Stat
e O
psG
SCs
Deb
t C
apita
l To
Dis
b.B
alan
ce
323.
14-A
dmin
Sup
port
20
00
00
00
00
00
00
232
3.15
-Des
ign
& C
onst
r35
,615
059
,419
00
059
,419
046
,073
14,4
130
06,
000
66,4
8628
,548
323.
22-B
room
e S
t Mas
te(1
)0
00
00
00
00
00
00
(1)
323.
XX
-Mis
c C
entrl
Srv
420
00
00
00
00
00
00
4232
3.ZX
-OG
S E
xec
Dire
ct(3
5,24
3)0
183,
596
00
018
3,59
60
95,3
1672
60
085
,177
181,
219
(32,
866)
323.
ZY-O
GS
Bld
g A
dmin
4,90
90
17,8
030
00
17,8
030
12,3
201,
239
00
013
,559
9,15
332
3.ZZ
-OG
S S
td &
Pur
ch(1
0,55
0)0
18,3
720
00
18,3
720
16,5
051,
915
00
018
,420
(10,
598)
334.
01-T
rans
Prn
t Sho
p15
00
00
00
00
00
00
015
334.
02-E
duc-
Arc
hive
s R
1,65
60
1,50
00
00
1,50
00
946
256
00
01,
202
1,95
433
4.03
-Civ
il R
ecov
er(2
)0
00
00
00
00
00
00
(2)
334.
04-P
ublic
Fin
ancn
g(1
)0
00
00
00
00
00
00
(1)
334.
05-F
edl S
ingl
e A
ud1,
801
01,
500
00
01,
500
01,
500
00
00
1,50
01,
801
334.
07-Q
uick
Cop
y C
ent
1,15
80
600
00
060
00
561
770
00
638
1,12
033
4.09
-CS
Adm
inis
trat
4,58
00
5,96
30
00
5,96
30
5,80
71,
609
00
07,
416
3,12
733
4.10
-EH
S O
ccup
Hlth
(112
)0
870
00
087
00
1,03
727
10
00
1,30
8(5
50)
334.
12-B
anki
ng S
ervi
ce(4
)0
3,97
40
060
,561
64,5
350
64,5
310
00
064
,531
033
4.13
-Per
sonn
el M
gmt
290
00
00
00
00
00
00
2933
4.14
-Cul
t Res
ourc
es(1
,256
)0
7,32
90
00
7,32
90
4,39
267
70
027
65,
345
728
334.
17-N
eigh
bor W
ork
P0
07,
300
00
07,
300
07,
200
00
00
7,20
010
033
4.17
-Nei
ghbo
r Wor
k P
(6,3
62)
00
00
00
00
00
00
0(6
,362
)33
4.18
-Aut
o/P
rint C
hgb
4,64
90
16,5
000
00
16,5
000
12,5
974,
047
00
016
,644
4,50
533
4.20
-NY
T A
ccou
nt20
,675
088
,033
00
088
,033
086
,391
4,20
20
00
90,5
9318
,115
334.
23-S
tate
Dat
a C
tr11
,456
011
6,20
60
00
116,
206
010
4,94
110
,296
00
011
5,23
712
,425
334.
24-H
uman
Srv
s Te
le6,
969
028
,485
00
028
,485
025
,599
4,55
30
00
30,1
525,
302
334.
26-O
MR
DD
Cop
y C
tr95
80
00
00
00
00
00
00
958
334.
27-In
trusi
on D
etec
100
1,52
80
00
1,52
80
1,35
00
00
01,
350
188
334.
28-D
om V
iole
nce
Gr
(308
)0
703
00
070
30
703
00
00
703
(308
)33
4.29
-Sta
tew
ide
Trai
n7
00
00
00
00
00
00
07
334.
30-C
ent T
ech
Svc
s.(4
9)0
2,50
00
03,
775
6,27
50
5,87
539
80
00
6,27
3(4
7)33
4.X
X-M
isc
Intl
Ser
v(1
17)
00
00
00
00
00
00
0(1
17)
334.
ZV-L
earn
ing
Mgm
t S1,
731
016
00
00
160
01,
278
620
00
1,34
055
134
3.00
-Men
tal H
ygie
ne34
90
1,96
70
00
1,96
70
2,12
336
20
013
62,
621
(305
)34
7.00
-DFY
Voc
Edu
catn
540
250
00
250
00
00
00
7939
4.00
-Joi
nt L
abor
-Mgt
2,18
90
2,00
00
00
2,00
00
1,24
640
80
00
1,65
42,
535
395.
04-E
x D
ir In
tl A
ud(1
,431
)0
1,55
00
00
1,55
00
1,34
052
80
00
1,86
8(1
,749
)39
6.00
-Hea
lth In
s In
tr(1
3,50
0)0
14,1
210
07,
843
21,9
640
13,1
024,
875
00
017
,977
(9,5
13)
396.
01-C
S E
BD
Adm
Rei
m(3
,375
)0
4,50
00
024
04,
740
02,
575
894
00
03,
469
(2,1
04)
397.
00-C
orr I
ndus
tries
2,42
10
48,0
000
09,
500
57,5
000
47,9
349,
566
00
057
,500
2,42
1
CA
SH C
OM
BIN
ING
STA
TEM
ENT
BY
AC
CO
UN
TIN
TER
NA
L SE
RVI
CES
FY 2
012
(Tho
usan
ds o
f Dol
lars
)
T-222

Fund
O
peni
ng
Mis
c.
Fede
ral
Bon
d
Tran
sfer
s
Tota
l To
tal
Tran
sfer
s
Tota
l C
losi
ng
Acc
ount
Bal
ance
Taxe
s R
ecei
pts
Gra
nts
Proc
eeds
From
Rec
eipt
sLo
cal
Stat
e O
psG
SCs
Deb
t C
apita
l To
Dis
b.B
alan
ce
324.
00-D
FY C
omm
issa
ry19
70
120
00
012
00
120
00
00
120
197
325.
00-S
tate
Fai
r Rec
e3,
307
018
,500
00
018
,500
016
,798
2,47
10
00
19,2
692,
538
326.
00-D
OC
S C
omm
issa
ry3,
134
037
,327
00
037
,327
037
,277
00
00
37,2
773,
184
331.
01-P
ublic
atio
ns16
05
00
05
05
00
00
516
331.
02-D
FY P
rodu
cts
(1)
00
00
00
00
00
00
0(1
)33
1.03
-Agi
ng E
nter
pris
00
20
00
20
20
00
02
033
1.04
-Map
s A
nd D
emog
r13
01
00
01
00
00
00
014
331.
06-E
mpi
re S
t Gam
es1
02
00
02
03
00
00
30
331.
07-D
SS
Trn
g M
atrls
171
024
00
024
00
00
00
019
533
1.21
-Arts
Oxf
ord
Vet
10
10
00
10
10
00
01
133
1.31
-TR
AID
Ser
vice
s10
010
00
010
010
00
00
1010
331.
55-C
onve
ntio
n C
tr25
30
1,17
20
00
1,17
20
716
296
00
01,
012
413
331.
AA
-DO
CS
Em
pl M
ess
184
01,
256
00
01,
256
01,
009
130
00
01,
139
301
331.
DD
-Ass
et P
rese
rvat
410
140
00
140
170
00
017
3833
1.FM
-Far
m P
rogr
am76
90
412
00
041
20
412
00
00
412
769
331.
NY
-NY
-Ale
rt0
01,
000
00
01,
000
01,
000
00
00
1,00
00
331.
ZZ-D
DP
C P
ub A
cct
00
100
00
100
100
00
010
035
1.00
-OM
H S
helt
Wks
hs1,
787
02,
200
00
02,
200
02,
200
00
00
2,20
01,
787
352.
00-M
R S
hel W
rksh
op1,
089
095
00
00
950
01,
050
00
00
1,05
098
935
3.00
-MH
& M
R C
omm
uni
2,60
80
2,20
00
018
2,21
80
1,56
214
80
068
1,77
83,
048
353.
32-M
R C
omm
unity
St
980
660
00
066
00
552
108
00
066
098
450.
01-IE
A /
Sta
te F
ai(1
)0
00
00
00
00
00
00
(1)
481.
00-U
I B
enef
it Fn
d(1
98,4
97)
3,77
5,00
00
25,0
000
03,
800,
000
03,
800,
000
00
00
3,80
0,00
0(1
98,4
97)
481.
01-In
tere
st A
sses
s18
40
150,
000
00
015
0,00
00
96,0
000
00
096
,000
54,1
8448
1.FS
-Fed
eral
Stim
ulu
204,
545
00
2,75
0,00
00
02,
750,
000
02,
750,
000
00
00
2,75
0,00
020
4,54
5
CA
SH C
OM
BIN
ING
STA
TEM
ENT
BY
AC
CO
UN
TEN
TER
PRIS
EFY
201
2(T
hous
ands
of D
olla
rs)
T-223

GEN
ERA
L FU
ND
FY 2
013
(mill
ions
of d
olla
rs)
Tax
Com
mun
ityD
ebt
G
ener
alSt
abili
zatio
nC
ontin
genc
yPr
ojec
ts
Rai
ny D
ayR
educ
tion
Fund
Res
erve
Fun
dR
eser
ve F
und
Fund
Res
erve
Fun
dR
eser
ve F
und
Elim
inat
ions
Tota
l
Ope
ning
fund
bal
ance
284
1,03
121
5127
513
01,
675
Rec
eipt
s:Ta
xes
43,3
730
00
00
043
,373
Mis
cella
neou
s re
ceip
ts3,
069
00
00
00
3,06
9Fe
dera
l gra
nts
600
00
00
060
T
otal
rece
ipts
46,5
020
00
00
046
,502
Dis
burs
emen
ts:
Gra
nts
to lo
cal g
over
nmen
ts39
,352
00
510
00
39,4
03S
tate
ope
ratio
ns7,
588
00
00
00
7,58
8G
ener
al S
tate
cha
rges
4,43
40
00
00
04,
434
Deb
t ser
vice
00
00
00
00
Cap
ital p
roje
cts
00
00
00
00
T
otal
dis
burs
emen
ts51
,374
00
510
00
51,4
25
Oth
er fi
nanc
ing
sour
ces
(use
s):
Tran
sfer
s fro
m o
ther
fund
s42
,453
00
00
0(3
0,24
0)12
,213
Tran
sfer
s to
oth
er fu
nds
(37,
407)
00
00
030
,240
(7,1
67)
Bon
d an
d no
te p
roce
eds
00
00
00
00
N
et o
ther
fina
ncin
g so
urce
s (u
ses)
5,04
60
00
00
05,
046
Cha
nge
in fu
nd b
alan
ce17
40
0(5
1)0
00
123
Clo
sing
fund
bal
ance
458
1,03
121
027
513
01,
798 .
CA
SH C
OM
BIN
ING
STA
TEM
ENT
T-224

019
020
023
024
025
050
052
053
054
059
061
Ope
ning
Fun
d B
alan
ce2,
222
66,0
637,
285
192
109
3,62
493
60
1,44
30
3
Rec
eipt
s:
Taxe
s0
00
00
00
3,32
2,06
70
01,
222,
000
Mis
cella
neou
s R
ecei
pts
140
(71,
485)
7,50
029
030
03,
375
9,50
00
00
4,80
6,72
5Fe
dera
l Gra
nts
00
00
00
00
00
0
Tota
l Rec
eipt
s14
0(7
1,48
5)7,
500
290
300
3,37
59,
500
3,32
2,06
70
06,
028,
725
Dis
burs
emen
ts:
Gra
nts
to L
ocal
Gov
ernm
ents
05,
904
7,00
00
00
4,56
93,
322,
067
224
05,
637,
473
Sta
te O
pera
tions
140
5,23
61,
336
420
189
2,42
62,
405
01,
218
070
,104
Gen
eral
Sta
te C
harg
es0
637
382
157
8278
188
90
00
7,34
2D
ebt S
ervi
ce0
00
00
00
00
00
Cap
italP
roje
cts
05
000
00
00
00
00
0
CAS
H C
OM
BIN
ING
STA
TEM
ENT
SPEC
IAL
REV
ENU
E FU
ND
SFY
201
3(th
ousa
nds
of d
olla
rs)
Cap
ital P
roje
cts
05,
000
00
00
00
00
0
Tota
l Dis
burs
emen
ts14
016
,777
8,71
857
727
13,
207
7,86
33,
322,
067
1,44
20
5,71
4,91
9
Oth
er F
inan
cing
Sou
rces
(Use
s):
Tran
sfer
s fro
m O
ther
Fun
ds0
93,3
690
300
00
00
00
0Tr
ansf
ers
to O
ther
Fun
ds0
(181
)0
(7)
0(3
20)
(1,9
67)
00
0(3
13,8
06)
Bon
d &
Not
e P
roce
eds
00
00
00
00
00
0
Net
Oth
er F
inan
cing
Sou
rces
(Use
s)0
93,1
880
293
0(3
20)
(1,9
67)
00
0(3
13,8
06)
Cha
nge
in F
und
Bal
ance
04,
926
(1,2
18)
629
(152
)(3
30)
0(1
,442
)0
0
Clo
sing
Fun
d B
alan
ce2,
222
70,9
896,
067
198
138
3,47
260
60
10
3
T-225
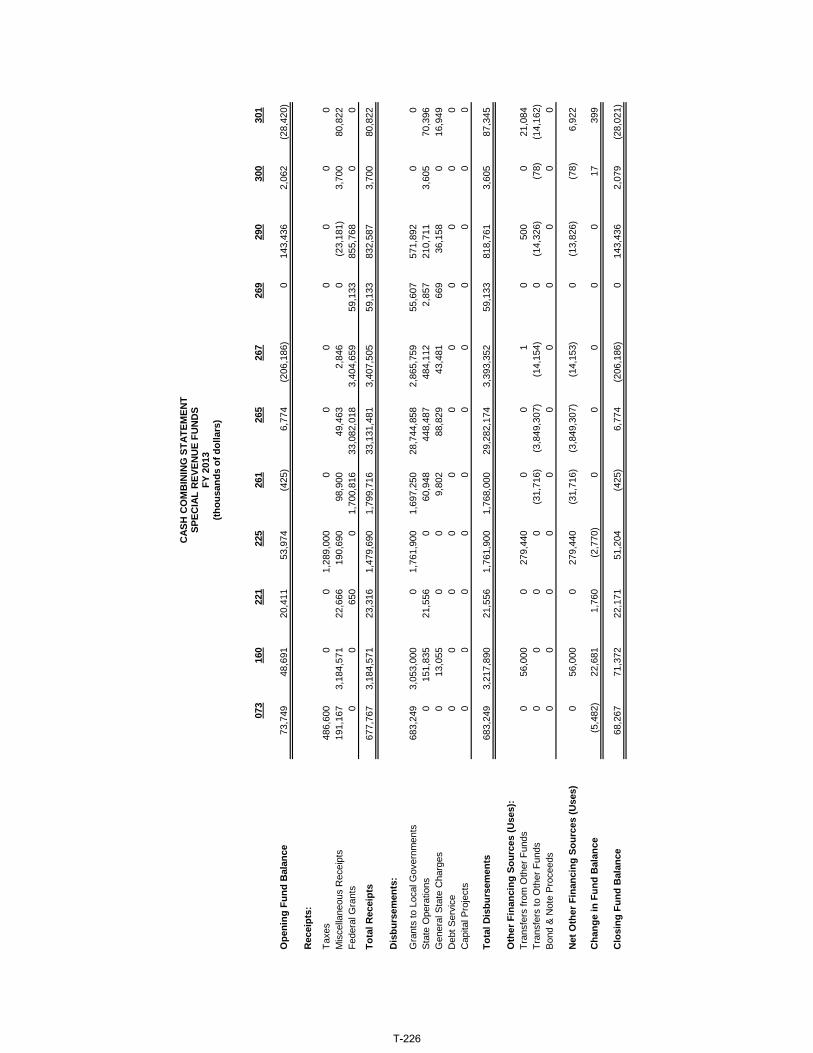
Ope
ning
Fun
d B
alan
ce
Rec
eipt
s:
Taxe
sM
isce
llane
ous
Rec
eipt
sFe
dera
l Gra
nts
Tota
l Rec
eipt
s
Dis
burs
emen
ts:
Gra
nts
to L
ocal
Gov
ernm
ents
Sta
te O
pera
tions
Gen
eral
Sta
te C
harg
esD
ebt S
ervi
ceC
apita
lPro
ject
s
073
160
221
225
261
265
267
269
290
300
301
73,7
4948
,691
20,4
1153
,974
(425
)6,
774
(206
,186
)0
143,
436
2,06
2(2
8,42
0)
486,
600
00
1,28
9,00
00
00
00
00
191,
167
3,18
4,57
122
,666
190,
690
98,9
0049
,463
2,84
60
(23,
181)
3,70
080
,822
00
650
01,
700,
816
33,0
82,0
183,
404,
659
59,1
3385
5,76
80
0
677,
767
3,18
4,57
123
,316
1,47
9,69
01,
799,
716
33,1
31,4
813,
407,
505
59,1
3383
2,58
73,
700
80,8
22
683,
249
3,05
3,00
00
1,76
1,90
01,
697,
250
28,7
44,8
582,
865,
759
55,6
0757
1,89
20
00
151,
835
21,5
560
60,9
4844
8,48
748
4,11
22,
857
210,
711
3,60
570
,396
013
,055
00
9,80
288
,829
43,4
8166
936
,158
016
,949
00
00
00
00
00
00
00
00
00
00
00
CAS
H C
OM
BIN
ING
STA
TEM
ENT
SPEC
IAL
REV
ENU
E FU
ND
SFY
201
3(th
ousa
nds
of d
olla
rs)
Cap
ital P
roje
cts
Tota
l Dis
burs
emen
ts
Oth
er F
inan
cing
Sou
rces
(Use
s):
Tran
sfer
s fro
m O
ther
Fun
dsTr
ansf
ers
to O
ther
Fun
dsB
ond
& N
ote
Pro
ceed
s
Net
Oth
er F
inan
cing
Sou
rces
(Use
s)
Cha
nge
in F
und
Bal
ance
Clo
sing
Fun
d B
alan
ce
00
00
00
00
00
0
683,
249
3,21
7,89
021
,556
1,76
1,90
01,
768,
000
29,2
82,1
743,
393,
352
59,1
3381
8,76
13,
605
87,3
45
056
,000
027
9,44
00
01
050
00
21,0
840
00
0(3
1,71
6)(3
,849
,307
)(1
4,15
4)0
(14,
326)
(78)
(14,
162)
00
00
00
00
00
0
056
,000
027
9,44
0(3
1,71
6)(3
,849
,307
)(1
4,15
3)0
(13,
826)
(78)
6,92
2
(5,4
82)
22,6
811,
760
(2,7
70)
00
00
017
399
68,2
6771
,372
22,1
7151
,204
(425
)6,
774
(206
,186
)0
143,
436
2,07
9(2
8,02
1)
T-226

Ope
ning
Fun
d B
alan
ce
Rec
eipt
s:
Taxe
sM
isce
llane
ous
Rec
eipt
sFe
dera
l Gra
nts
Tota
l Rec
eipt
s
Dis
burs
emen
ts:
Gra
nts
to L
ocal
Gov
ernm
ents
Sta
te O
pera
tions
Gen
eral
Sta
te C
harg
esD
ebt S
ervi
ceC
apita
lPro
ject
s
302
303
305
306
307
313
314
318
321
332
333
81,4
0219
,639
6,47
92,
109
413
(2,2
27)
(22,
248)
6610
,346
3,53
51,
220
00
00
01,
927,
300
00
00
053
,032
55,8
7551
,695
8,00
080
21,8
1040
,000
01,
719
115
750
00
00
00
00
00
53,0
3255
,875
51,6
958,
000
801,
949,
110
40,0
000
1,71
911
575
00
00
01,
854,
812
00
00
037
,697
24,7
2832
,606
12,8
0011
23,
513
33,2
710
950
5875
13,0
924,
386
12,5
1898
01,
457
11,9
670
00
00
00
00
00
00
00
00
00
00
00
00
0
CAS
H C
OM
BIN
ING
STA
TEM
ENT
SPEC
IAL
REV
ENU
E FU
ND
SFY
201
3(th
ousa
nds
of d
olla
rs)
Cap
ital P
roje
cts
Tota
l Dis
burs
emen
ts
Oth
er F
inan
cing
Sou
rces
(Use
s):
Tran
sfer
s fro
m O
ther
Fun
dsTr
ansf
ers
to O
ther
Fun
dsB
ond
& N
ote
Pro
ceed
s
Net
Oth
er F
inan
cing
Sou
rces
(Use
s)
Cha
nge
in F
und
Bal
ance
Clo
sing
Fun
d B
alan
ce
00
00
00
00
00
0
50,7
8929
,114
45,1
2412
,898
112
1,85
9,78
245
,238
095
058
75
550
20,3
060
3,75
00
31,1
000
00
00
(2,2
90)
(37,
532)
(3,0
54)
0(7
)0
(30)
00
00
00
00
00
00
00
0
(1,7
40)
(17,
226)
(3,0
54)
3,75
0(7
)31
,100
(30)
00
00
503
9,53
53,
517
(1,1
48)
(39)
120,
428
(5,2
68)
076
957
0
81,9
0529
,174
9,99
696
137
411
8,20
1(2
7,51
6)66
11,1
153,
592
1,22
0
T-227

Ope
ning
Fun
d B
alan
ce
Rec
eipt
s:
Taxe
sM
isce
llane
ous
Rec
eipt
sFe
dera
l Gra
nts
Tota
l Rec
eipt
s
Dis
burs
emen
ts:
Gra
nts
to L
ocal
Gov
ernm
ents
Sta
te O
pera
tions
Gen
eral
Sta
te C
harg
esD
ebt S
ervi
ceC
apita
lPro
ject
s
338
339
340
341
345
346
349
354
355
359
360
693
770,
923
2,39
118
694,
814
202
932
(43,
893)
508
3,73
28,
743
01
00
00
00
00
060
2,80
1,12
80
04,
058,
738
01,
208
119,
700
160
3,70
990
00
890
00
00
00
00
602,
801,
218
00
4,05
8,73
80
1,20
811
9,70
016
03,
709
900
983,
140,
417
104,
200
00
00
4,53
70
085
20
4,36
7,64
52,
100
154,
439,
886
086
29,
248
158
00
01,
537,
546
600
830
2,87
40
259
7243
00
00
00
00
00
00
00
(15)
00
00
00
00
0
CAS
H C
OM
BIN
ING
STA
TEM
ENT
SPEC
IAL
REV
ENU
E FU
ND
SFY
201
3(th
ousa
nds
of d
olla
rs)
Cap
ital P
roje
cts
Tota
l Dis
burs
emen
ts
Oth
er F
inan
cing
Sou
rces
(Use
s):
Tran
sfer
s fro
m O
ther
Fun
dsTr
ansf
ers
to O
ther
Fun
dsB
ond
& N
ote
Pro
ceed
s
Net
Oth
er F
inan
cing
Sou
rces
(Use
s)
Cha
nge
in F
und
Bal
ance
Clo
sing
Fun
d B
alan
ce
0(1
5)0
00
00
00
00
989,
045,
593
106,
900
234,
742,
760
01,
121
13,8
5720
10
852
010
,021
,569
106,
000
098
6,88
50
00
00
00
(3,7
95,4
42)
(374
)0
(80,
594)
(200
)(1
97)
(100
,800
)(6
0)0
00
00
00
00
00
00
06,
226,
127
105,
626
090
6,29
1(2
00)
(197
)(1
00,8
00)
(60)
00
(38)
(17,
248)
(1,2
74)
(23)
222,
269
(200
)(1
10)
5,04
3(1
01)
3,70
948
655
753,
675
1,11
7(5
)91
7,08
32
822
(38,
850)
407
7,44
18,
791
T-228

Ope
ning
Fun
d B
alan
ce
Rec
eipt
s:
Taxe
sM
isce
llane
ous
Rec
eipt
sFe
dera
l Gra
nts
Tota
l Rec
eipt
s
Dis
burs
emen
ts:
Gra
nts
to L
ocal
Gov
ernm
ents
Sta
te O
pera
tions
Gen
eral
Sta
te C
harg
esD
ebt S
ervi
ceC
apita
lPro
ject
s
362
365
366
368
369
377
385
390
480
482
(2,6
85)
130
(6,3
86)
(18,
766)
6,57
711
0,26
540
16,1
1965
,496
1,47
5
00
00
00
00
00
3,06
811
76,
665
25,0
0026
,000
162,
766
8573
,000
3,00
09,
600
00
00
00
00
377,
693
0
3,06
811
76,
665
25,0
0026
,000
162,
766
8573
,000
380,
693
9,60
0
061
00
00
077
,000
14,2
000
3,43
747
4,99
823
,400
16,8
0011
9,81
275
26,1
3423
9,72
75,
751
00
2,66
79,
600
7,90
06,
685
041
012
6,76
699
10
00
00
00
00
00
00
00
00
00
0
CAS
H C
OM
BIN
ING
STA
TEM
ENT
SPEC
IAL
REV
ENU
E FU
ND
SFY
201
3(th
ousa
nds
of d
olla
rs)
Cap
ital P
roje
cts
Tota
l Dis
burs
emen
ts
Oth
er F
inan
cing
Sou
rces
(Use
s):
Tran
sfer
s fro
m O
ther
Fun
dsTr
ansf
ers
to O
ther
Fun
dsB
ond
& N
ote
Pro
ceed
s
Net
Oth
er F
inan
cing
Sou
rces
(Use
s)
Cha
nge
in F
und
Bal
ance
Clo
sing
Fun
d B
alan
ce
00
00
00
00
00
3,43
710
87,
665
33,0
0024
,700
126,
497
7510
3,54
438
0,69
36,
742
00
08,
700
00
040
,000
00
0(3
2)0
00
0(2
3)0
0(6
,711
)0
00
00
00
00
0
0(3
2)0
8,70
00
0(2
3)40
,000
0(6
,711
)
(369
)(2
3)(1
,000
)70
01,
300
36,2
69(1
3)9,
456
0(3
,853
)
(3,0
54)
107
(7,3
86)
(18,
066)
7,87
714
6,53
427
25,5
7565
,496
(2,3
78)
T-229

Ope
ning
Fun
d B
alan
ce
Rec
eipt
s:
Taxe
sM
isce
llane
ous
Rec
eipt
sFe
dera
l Gra
nts
Tota
l Rec
eipt
s
Dis
burs
emen
ts:
Gra
nts
to L
ocal
Gov
ernm
ents
Sta
te O
pera
tions
Gen
eral
Sta
te C
harg
esD
ebt S
ervi
ceC
apita
lPro
ject
s
484
486
SRO
Sub
Tota
lEl
imin
atio
nsFi
nanc
ial P
lan
5844
70
1,90
8,51
00
1,90
8,51
0
00
08,
246,
968
08,
246,
968
00
016
,085
,294
016
,085
,294
8,10
522
2,33
80
39,7
12,2
690
39,7
12,2
69
8,10
522
2,33
80
64,0
44,5
310
64,0
44,5
31
018
0,42
40
53,7
87,3
530
53,7
87,3
538,
105
33,3
540
10,9
85,3
450
10,9
85,3
450
8,56
00
2,26
7,71
20
2,26
7,71
20
00
00
00
00
498
50
498
5
CAS
H C
OM
BIN
ING
STA
TEM
ENT
SPEC
IAL
REV
ENU
E FU
ND
SFY
201
3(th
ousa
nds
of d
olla
rs)
Cap
ital P
roje
cts
Tota
l Dis
burs
emen
ts
Oth
er F
inan
cing
Sou
rces
(Use
s):
Tran
sfer
s fro
m O
ther
Fun
dsTr
ansf
ers
to O
ther
Fun
dsB
ond
& N
ote
Pro
ceed
s
Net
Oth
er F
inan
cing
Sou
rces
(Use
s)
Cha
nge
in F
und
Bal
ance
Clo
sing
Fun
d B
alan
ce
00
04,
985
04,
985
8,10
522
2,33
80
67,0
45,3
950
67,0
45,3
95
00
011
,669
,554
(3,9
57,9
19)
7,71
1,63
50
00
(8,2
67,3
70)
3,95
7,91
9(4
,309
,451
)0
00
00
0
00
03,
403,
184
03,
403,
184
00
040
2,32
00
402,
320
5844
70
2,31
0,83
00
2,31
0,83
0
T-230

Fund
O
peni
ng
Mis
c.
Fede
ral
Bon
d
Tran
sfer
s
Tota
l In
dire
ct
UI
Tran
sfer
s
Tota
l C
losi
ng
Acc
ount
Bal
ance
Taxe
s R
ecei
pts
Gra
nts
Proc
eeds
From
Rec
eipt
sLo
cal
PS
NPS
C
osts
Ben
efits
GSC
s D
ebt
Cap
ital
ToD
isb.
Bal
ance
019.
00-M
ent H
yg G
ifts
2,22
00
140
00
014
00
014
00
00
00
014
02,
220
020.
00-C
ombi
ned
Exp
Tr
00
(91,
697)
00
91,6
970
00
00
00
00
00
002
0.01
-Pla
ntin
g Fi
elds
1,13
90
350
00
035
00
209
477
094
00
035
71,
132
020.
03-C
ham
bers
Res
tor
10
00
00
00
00
00
00
00
01
020.
06-A
nim
al D
isea
se56
051
00
051
00
460
00
00
046
6102
0.20
-DO
CS
Gift
& D
on71
05
00
05
00
50
00
00
05
7102
0.22
-Hel
en H
ayes
Hsp
680
00
00
00
00
00
00
00
068
020.
23-O
xfor
d D
onat
ion
570
220
00
220
073
00
00
00
736
020.
25-D
onat
-St.A
lban
s5
00
00
00
00
00
00
00
00
502
0.28
-CV
B G
ifts
& B
eq47
05
00
05
00
80
00
00
08
4402
0.29
-DC
JS -
MU
NY
Pol
10
250
00
250
025
00
00
00
251
020.
30-D
onat
ions
-Bat
av18
010
00
010
00
190
00
00
019
902
0.33
-Mon
trose
Don
ati
105
00
00
00
00
00
00
00
00
105
020.
36-IB
R G
enet
ic C
ou47
010
50
00
105
00
105
00
00
00
105
4702
0.3A
-Tec
h Tr
ansf
er24
050
00
050
00
500
00
00
050
2402
0.49
-Spe
c E
vent
s65
10
357
00
035
70
020
40
00
00
020
480
402
0.62
-L.M
. Jos
epht
hal
530
30
00
30
02
00
00
00
254
020.
63-R
PM
I Grn
t & B
eq14
00
00
00
00
00
00
00
00
1402
0.64
-S U
Res
tric
Cur
110
00
00
00
00
00
00
00
011
020.
69-C
BV
H V
end
Sta
nd69
10
1,10
90
00
1,10
90
5189
90
021
50
00
1,16
563
502
0.76
-RP
MI S
choe
llkpf
10
00
00
00
00
00
00
00
01
020.
77-D
MN
A M
ilita
ry12
01
00
01
00
10
00
00
01
1202
0.78
-WB
Hoy
t Mem
oria
3,27
70
00
062
262
275
00
00
00
00
075
03,
149
020.
79-C
BV
H G
ift &
Beq
169
05
00
05
00
150
00
00
015
159
020.
82-S
t Tra
nsm
Mon
ey22
,825
08,
000
00
08,
000
00
930
00
00
00
930
29,8
9502
0.83
-Hum
an R
ghts
Dis
(3)
00
00
00
00
00
00
00
00
(3)
020.
A7-
You
th G
rant
s &
32
00
500
00
500
619
00
20
00
7229
802
0.A
A-A
lzhe
imer
s D
is1,
071
00
00
250
250
00
532
00
00
00
532
789
020.
AB
-Loc
al G
ov C
omm
147
012
00
012
00
70
00
00
07
152
020.
AH
-Pro
stat
e/Te
stic
357
040
00
040
00
60
00
00
06
391
020.
AR
-Aut
ism
Aw
are
&
680
100
00
100
00
00
00
00
078
020.
AU
-Em
erge
ncy
Ser
v6,
623
02,
688
00
02,
688
3,99
812
63
50
650
00
4,19
75,
114
020.
B1-
Bat
avia
-Cha
rlot
356
020
00
020
00
230
00
00
023
353
020.
B3-
Rom
e-G
ifts
And
3
020
00
020
00
190
00
00
019
402
0.B
4-D
FY R
ec &
Wel
fr(1
)0
00
00
00
00
00
00
00
0(1
)02
0.B
8-D
AA
A G
rnts
And
(2)
00
00
00
00
00
00
00
00
(2)
020.
BD
-Br C
an R
es &
Ed
8,15
00
400
065
069
00
187
613
00
00
00
800
8,04
002
0.C
E-C
omm
unity
Rel
at10
10
100
00
010
00
00
00
00
00
020
102
0.D
1-D
isab
Tec
h A
sst
132
015
50
00
155
059
233
030
00
181
296
(9)
020.
E1-
Mis
sng
Chi
ldre
n69
40
360
00
036
00
239
136
60
123
00
050
455
002
0.E
5-D
MN
A Y
outh
Pro
g32
010
00
010
00
100
00
00
010
3202
0.E
C-E
rie C
anal
Mus
e5
00
00
00
00
00
00
00
00
502
0.F1
-Wom
en V
et M
onum
150
00
00
00
00
00
00
00
00
150
020.
FF-F
ord
Foun
datio
n(1
)0
00
00
00
00
00
00
00
0(1
)02
0.G
B-G
rant
s an
d B
equ
120
10
00
10
01
00
00
00
112
020.
GW
-CC
F G
rts &
Beq
s93
087
00
087
025
551
09
00
090
9002
0.H
H-O
MH
Gra
nt &
Beq
469
020
00
020
00
200
00
00
020
469
020.
LP-L
ife P
ass
It on
518
020
00
00
200
00
00
00
00
00
718
020.
MG
-Mis
c. G
ifts
Acc
10,9
970
4,00
00
00
4,00
00
00
00
00
5,00
00
5,00
09,
997
020.
MS
-Mul
tiple
Scl
ero
180
00
00
00
00
00
00
00
018
020.
PM
-Par
ole
Ofc
r Mem
430
00
00
00
00
00
00
00
043
020.
PR
-Pro
stat
e C
ance
r2,
495
00
00
150
150
00
00
00
00
00
2,64
502
0.P
T-P
ercy
T P
hilli
p40
00
00
00
00
00
00
00
00
4002
0.R
P-A
ging
Gra
nts
An
(1)
01
00
01
00
10
00
00
01
(1)
020.
RW
-RW
Joh
nson
Fou
n(5
)0
00
00
00
00
00
00
00
0(5
)02
0.X
K-G
rant
s A
ccou
nt1,
600
02,
000
00
02,
000
1,15
611
725
03
099
00
01,
625
1,97
502
0.ZS
-Gra
nts
459
030
00
00
300
00
00
00
00
00
759
020.
ZZ-D
onat
ed F
unds
1,77
70
00
00
00
00
00
00
00
01,
777
023.
00-N
Y In
t Law
yers
7,28
50
7,50
00
00
7,50
07,
000
704
582
500
382
00
08,
718
6,06
702
4.00
-NY
S A
rchv
s P
tne
193
029
00
030
059
00
292
119
90
157
00
758
419
902
5.C
P-C
hild
Per
form
er11
00
300
00
030
00
123
624
082
00
027
113
905
0.01
-Tui
tion
Rei
mb
2,36
80
375
00
037
50
025
00
00
00
2327
32,
470
050.
02-P
rop
Voc
Sch
Su
1,25
50
3,00
00
00
3,00
00
1,48
764
148
078
10
029
73,
254
1,00
105
2.01
-Loc
Gov
t Rec
ord
934
09,
500
00
09,
500
4,56
92,
047
288
700
889
00
1,96
79,
830
604
053.
00-S
ch T
ax R
elie
f(1
)3,
322,
067
00
00
3,32
2,06
73,
322,
067
00
00
00
00
3,32
2,06
7(1
)05
4.01
-Cht
r Sch
Sti
Ac
1,44
20
00
00
022
40
1,21
80
00
00
01,
442
005
6.01
-Gre
enw
ay C
omm
un(1
)0
00
00
00
00
00
00
00
0(1
)05
6.02
-Gre
enw
ay H
erit
10
00
00
00
00
00
00
00
01
061.
01-T
obac
co C
ntr &
(4
,129
)0
00
00
00
2,12
740
968
01,
246
00
503
4,35
3(8
,482
)
CA
SH C
OM
BIN
ING
STA
TEM
ENT
BY
AC
CO
UN
TSP
ECIA
L R
EVEN
UE
OTH
ER F
UN
DS
(EXC
LUD
ING
FU
ND
339
)FY
201
3(T
hous
ands
of D
olla
rs)
T-231

Fund
O
peni
ng
Mis
c.
Fede
ral
Bon
d
Tran
sfer
s
Tota
l In
dire
ct
UI
Tran
sfer
s
Tota
l C
losi
ng
Acc
ount
Bal
ance
Taxe
s R
ecei
pts
Gra
nts
Proc
eeds
From
Rec
eipt
sLo
cal
PS
NPS
C
osts
Ben
efits
GSC
s D
ebt
Cap
ital
ToD
isb.
Bal
ance
CA
SH C
OM
BIN
ING
STA
TEM
ENT
BY
AC
CO
UN
TSP
ECIA
L R
EVEN
UE
OTH
ER F
UN
DS
(EXC
LUD
ING
FU
ND
339
)FY
201
3(T
hous
ands
of D
olla
rs)
061.
02-H
ealth
Car
e S
rv(1
10,1
80)
00
00
00
119,
643
00
00
640
00
119,
707
(229
,887
)06
1.03
-Med
icai
d Fr
aud
(224
)0
00
00
00
5726
33
040
00
036
3(5
87)
061.
04-M
edic
al A
ssis
t.(3
,357
,207
)0
00
00
03,
768,
517
1,53
24,
254
490
897
00
03,
775,
249
(7,1
32,4
56)
061.
05-E
nhan
ced
Com
40
00
00
00
00
00
00
00
04
061.
06-L
TC In
s R
es A
cc(1
)0
00
00
00
00
00
00
00
0(1
)06
1.07
-HC
RA
Pro
gram
(468
,698
)0
00
00
048
2,42
70
23,3
340
00
00
050
5,76
1(9
74,4
59)
061.
09-H
CR
A T
rans
ition
(2)
00
00
00
00
00
00
00
00
(2)
061.
22-E
MS
Tra
inin
g(1
4,95
9)0
00
00
00
2,83
413
,712
960
1,64
10
066
718
,950
(33,
909)
061.
29-C
hild
Hea
lth In
(372
,072
)0
00
00
034
5,75
11,
298
5,41
532
081
80
039
435
3,70
8(7
25,7
80)
061.
99-H
CR
A U
ndis
tribu
5,23
7,00
11,
222,
000
4,80
6,72
50
00
6,02
8,72
50
00
00
00
031
1,17
131
1,17
110
,954
,555
061.
AF-
Hos
pita
l Bas
ed
(10,
902)
00
00
00
11,1
750
00
00
00
011
,175
(22,
077)
061.
AH
-Ad
Hom
e R
es C
o (3
6)0
00
00
060
00
00
00
00
60(9
6)06
1.B
O-P
rimar
y C
are
In(6
49)
00
00
00
049
30
160
274
00
125
908
(1,5
57)
061.
DN
-Pro
v C
oll M
onit
(3,3
64)
00
00
00
02,
111
209
670
1,17
60
049
24,
055
(7,4
19)
061.
H3-
Pilo
t Hea
lth In
(1,6
18)
00
00
00
01,
064
9634
058
60
028
62,
066
(3,6
84)
061.
IN-In
dige
nt C
are
(767
,779
)0
00
00
079
1,50
00
00
00
00
079
1,50
0(1
,559
,279
)06
1.J6
-EP
IC P
rem
ium
(123
,700
)0
00
00
011
8,40
02,
250
7,10
00
00
00
012
7,75
0(2
51,4
50)
061.
LB-H
ealth
Occ
up D
e(1
,229
)0
00
00
00
778
8227
045
70
012
91,
473
(2,7
02)
061.
LC-M
ater
n &
Ch
HIV
10
00
00
00
00
00
00
00
01
061.
LE-H
ealth
Car
e D
el(2
57)
00
00
00
026
817
90
143
00
3947
6(7
33)
068.
01-D
ispr
o S
h M
ed
00
00
00
00
00
00
00
00
00
073.
01-T
rans
it A
utho
ri35
,326
379,
725
148,
394
00
052
8,11
953
0,00
00
00
00
00
053
0,00
033
,445
073.
02-R
ailro
ad A
ccou
n5,
980
67,5
5026
,158
00
093
,708
93,5
000
00
00
00
093
,500
6,18
807
3.03
-DM
TF32
,441
39,3
2516
,615
00
055
,940
59,7
490
00
00
00
059
,749
28,6
3216
0.03
-Edu
catio
n - N
ew0
02,
176,
000
00
41,0
002,
217,
000
2,21
7,00
00
00
00
00
02,
217,
000
016
0.04
-Sta
te L
otte
ry27
,017
017
0,37
10
00
170,
371
021
,377
120,
452
606
011
,044
00
015
3,47
943
,909
160.
05-V
LT -
Adm
in21
,673
017
,200
00
017
,200
03,
487
5,80
311
00
2,01
10
00
11,4
1127
,462
160.
06-V
LT -
Edu
catio
n4
082
1,00
00
015
,000
836,
000
836,
000
00
00
00
00
836,
000
422
1.00
-Com
b S
tude
nt L
n20
,411
022
,666
650
00
23,3
160
021
,556
00
00
00
21,5
5622
,171
225.
01-M
obili
ty T
ax T
r39
,795
1,16
0,00
09,
600
00
279,
440
1,44
9,04
01,
451,
900
00
00
00
00
1,45
1,90
036
,935
225.
02-M
TA A
id T
rust
14,1
7712
9,00
018
1,09
00
00
310,
090
310,
000
00
00
00
00
310,
000
14,2
6730
0.01
-E F
C A
dmin
Acc
2,05
60
00
00
00
00
00
00
00
02,
056
300.
02-E
ncon
Adm
in A
cc5
03,
700
00
03,
700
03,
596
90
00
00
783,
683
2230
1.01
-EnC
on E
nerg
y E
f29
00
00
00
00
00
00
00
00
2930
1.12
-EnC
on-S
eize
d A
s21
020
00
020
00
00
00
00
00
4130
1.48
-Wst
Tire
Mgt
/Re
5,80
20
24,0
000
00
24,0
000
10,1
504,
054
228
04,
726
00
5,94
625
,104
4,69
830
1.49
-Oil
& G
as A
ccou
146
010
80
00
108
00
980
00
00
4814
610
830
1.52
-Mar
ine/
Coa
stal
96
013
00
013
00
00
00
00
00
109
301.
BJ-
Indi
rect
Cha
rge
6,44
40
00
010
,584
10,5
840
1,46
24,
869
610
731
00
523
7,64
69,
382
301.
F7-H
azar
dous
Sub
B(4
2)0
350
00
035
00
179
338
011
10
00
331
(23)
301.
G8-
S-A
rea
Land
fill
200
00
00
00
00
00
00
00
020
301.
H4-
Util
ity E
nvir
R1
00
00
00
00
00
00
00
00
130
1.IC
-Fed
Indi
rect
R1,
487
040
00
10,5
0010
,540
08,
161
302
00
00
00
8,46
33,
564
301.
K5-
Low
Lev
el R
adio
(3,6
37)
02,
772
00
02,
772
01,
758
133
550
884
00
330
3,16
0(4
,025
)30
1.K
6-R
ecre
atio
n A
cco
(6,1
85)
015
,200
00
015
,200
09,
758
3,41
619
30
1,08
80
025
514
,710
(5,6
95)
301.
PS
-Pub
lic S
afet
y R
230
00
00
00
00
00
00
00
023
301.
R9-
SE
QR
Rev
iew
(43)
01
00
01
00
10
00
00
01
(43)
301.
S4-
Enc
on M
agaz
ine
396
070
50
00
705
00
314
00
00
013
144
565
630
1.S
5-E
nviro
nmen
t Enf
(26,
703)
027
,000
00
027
,000
013
,443
3,02
450
00
6,15
90
03,
115
26,2
41(2
5,94
4)30
1.S
6-N
atur
al R
esou
rc(2
1,62
6)0
4,00
00
00
4,00
00
1,94
339
713
00
953
00
400
3,82
3(2
1,44
9)30
1.S
7-To
wn
Of R
iver
he17
00
00
00
00
00
00
00
00
1730
1.TV
-ATV
DE
SF
00
00
00
00
00
00
00
00
00
301.
W8-
US
T-Tr
ust R
ecov
480
120
00
120
00
00
00
00
060
301.
XB
-Min
ed L
and
Rec
l10
04,
210
00
04,
210
01,
877
117
610
849
00
1,70
04,
604
(384
)30
1.ZZ
-Mon
itors
-Agg
re15
,268
02,
391
00
02,
391
03,
097
493
810
1,44
80
01,
714
6,83
310
,826
302.
00-C
onse
rvat
ion
29,5
870
48,0
420
055
048
,592
022
,902
11,7
4790
00
12,4
310
01,
740
49,7
2028
,459
302.
02-M
arin
e R
esou
rce
2,53
20
2,30
00
00
2,30
00
1,19
871
672
064
10
00
2,62
72,
205
T-232

Fund
O
peni
ng
Mis
c.
Fede
ral
Bon
d
Tran
sfer
s
Tota
l In
dire
ct
UI
Tran
sfer
s
Tota
l C
losi
ng
Acc
ount
Bal
ance
Taxe
s R
ecei
pts
Gra
nts
Proc
eeds
From
Rec
eipt
sLo
cal
PS
NPS
C
osts
Ben
efits
GSC
s D
ebt
Cap
ital
ToD
isb.
Bal
ance
CA
SH C
OM
BIN
ING
STA
TEM
ENT
BY
AC
CO
UN
TSP
ECIA
L R
EVEN
UE
OTH
ER F
UN
DS
(EXC
LUD
ING
FU
ND
339
)FY
201
3(T
hous
ands
of D
olla
rs)
302.
03-M
igra
tory
Bird
173
010
00
010
00
450
00
00
045
138
302.
04-L
icen
se G
uide
101
055
00
055
043
61
019
00
069
8730
2.06
-Fis
h A
nd G
ame
T48
,348
02,
500
00
02,
500
00
00
00
00
550
550
50,2
9830
2.07
-Sur
f Cla
m/Q
uaho
331
055
00
055
014
290
01
00
044
342
302.
08-H
abita
t Acc
ount
296
045
00
045
00
240
00
00
024
317
302.
09-V
enis
on D
onat
io35
025
00
025
00
00
00
00
00
6030
3.01
-Oil
Spi
ll - D
AC
(190
)0
121
00
705
826
052
822
618
026
00
00
1,03
2(3
96)
303.
02-O
il S
p R
eloc
atn
180
540
030
135
50
211
256
010
70
00
349
2430
3.03
-Oil
Spi
ll - D
EC
643
00
00
19,3
0019
,300
010
,132
747
231
04,
019
00
3,52
618
,655
1,28
830
3.04
-Oil
Spi
ll - D
AC
19,1
690
42,0
000
00
42,0
000
012
,604
00
00
020
,306
32,9
1028
,259
303.
05-L
icen
se F
ee S
ur(1
)0
13,7
000
00
13,7
000
00
00
00
013
,700
13,7
00(1
)30
5.01
-OS
H T
rng
& E
duc
4,94
70
24,8
100
00
24,8
100
8,94
17,
431
316
05,
490
00
866
23,0
446,
713
305.
02-O
SH
A In
spec
tion
1,53
10
26,8
850
00
26,8
850
10,4
925,
055
371
07,
028
00
2,18
825
,134
3,28
230
6.01
-Clie
nt P
rote
ctn
2,11
10
8,00
00
03,
750
11,7
500
550
12,2
500
098
00
012
,898
963
307.
01-E
quip
Loa
n Fu
nd41
40
800
00
800
011
20
00
00
711
937
531
3.01
-Pub
Tra
n S
ystm
s65
583
,355
410
00
12,0
0095
,765
93,0
9957
137
315
029
50
00
94,3
532,
067
313.
02-M
etro
Mas
s Tr
an(2
,992
)1,
843,
945
21,4
000
019
,100
1,88
4,44
51,
761,
713
2,24
824
660
01,
162
00
01,
765,
429
116,
024
313.
03-U
rban
Mas
s Tr
an10
60
00
00
00
00
00
00
00
010
631
4.01
-Ope
ratn
g P
erm
it(1
5,14
0)0
8,00
00
00
8,00
00
3,46
42,
207
205
01,
825
00
07,
701
(14,
841)
314.
02-M
obile
Sou
rce
(7,1
10)
032
,000
00
032
,000
019
,624
7,24
352
80
10,1
420
030
37,5
67(1
2,67
7)31
8.01
-Hou
sing
Res
erve
660
00
00
00
00
00
00
00
066
321.
01-L
egis
l Com
p R
&D
10,2
860
1,71
70
00
1,71
70
095
00
00
00
095
011
,053
321.
02-D
emog
raph
ics/
Re
600
20
00
20
00
00
00
00
062
332.
01-B
rum
mer
Aw
ard
400
60
00
60
06
00
00
00
640
332.
02-W
illia
m V
orce
F22
90
00
00
00
00
00
00
00
022
933
2.03
-Roc
ky P
ocan
tico
790
110
00
011
00
051
00
00
00
5113
833
2.04
-OM
R N
onex
pnd
Tr72
0(1
)0
00
(1)
00
10
00
00
01
7033
2.05
-Roc
kefe
ller T
ru3,
000
00
00
00
00
00
00
00
00
3,00
033
2.08
-Hel
en H
ayes
Hos
150
00
00
00
00
00
00
00
015
332.
10-C
unni
ngha
m F
und
100
00
00
00
00
00
00
00
00
100
333.
00-W
intr
Spo
rts E
d1,
220
075
00
075
00
750
00
00
075
1,22
033
5.00
-Nys
Mus
ical
Ins
10
00
00
00
00
00
00
00
01
338.
01-A
rts C
apita
l Re
693
060
00
060
980
00
00
00
098
655
340.
AA
-CFI
A U
ndis
trib
2,39
10
00
010
6,00
010
6,00
010
4,20
02,
000
100
00
600
00
374
107,
274
1,11
734
1.04
-DFY
-NY
C S
umm
er
190
00
00
00
150
00
80
00
23(4
)34
5.09
-L I
Vet
s H
ome
3,99
50
40,8
280
00
40,8
280
24,3
9717
,183
00
00
088
442
,464
2,35
934
5.10
-S U
Gen
l IFR
563,
849
071
3,58
00
015
071
3,73
00
140,
905
425,
266
00
6,74
10
022
,000
594,
912
682,
667
345.
11-S
U In
c O
ffset
(30,
438)
0(2
,900
)0
024
,898
21,9
980
00
00
00
00
0(8
,440
)34
5.12
-Gen
Rev
Offs
et19
,978
01,
411,
299
00
392,
662
1,80
3,96
10
1,49
6,11
933
2,47
40
00
00
01,
828,
593
(4,6
54)
345.
22-S
U H
osp
Ops
107,
896
01,
878,
556
00
569,
175
2,44
7,73
10
1,07
7,14
376
3,93
40
029
6,13
30
057
,710
2,19
4,92
036
0,70
734
5.31
-SU
NY
Sta
biliz
at14
,920
00
00
00
024
91,
076
00
00
00
1,32
513
,595
345.
46-S
U H
osp
Spo
nsd
69,1
850
35,1
820
00
35,1
820
30,9
212,
469
00
00
00
33,3
9070
,977
345.
47-S
UN
Y T
uitio
n R
e(5
4,57
0)0
(17,
807)
00
0(1
7,80
7)0
50,2
2977
,521
00
00
00
127,
750
(200
,127
)34
5.97
-Brid
ge P
rogr
am2
00
00
00
00
00
00
00
00
234
6.00
-Sub
st A
buse
Srv
200
00
00
00
00
00
00
00
200
200
034
9.01
-Lk
Geo
rge
Par
k93
20
1,20
80
00
1,20
80
592
250
200
259
00
197
1,31
882
235
4.01
-MV
TIFA
619
04,
700
00
04,
700
4,53
714
04
40
720
00
4,75
756
235
4.02
-St P
olic
e M
V E
n(4
4,51
2)0
115,
000
00
011
5,00
00
4,00
05,
100
00
00
010
0,80
010
9,90
0(3
9,41
2)35
5.01
-Gre
at L
akes
Pro
506
016
00
00
160
085
703
043
00
6026
140
535
9.01
-Rev
enue
Max
imiz
1,57
70
00
00
00
00
00
00
00
01,
577
359.
02-L
ocal
Max
imiz
at1
00
00
00
00
00
00
00
00
135
9.03
-DO
H F
ed R
ev M
ax2,
154
03,
709
00
03,
709
00
00
00
00
00
5,86
336
0.00
-Hou
sing
Dev
elop
8,74
30
900
00
090
085
20
00
00
00
085
28,
791
362.
01-D
OT
Com
m V
eh S
a(2
,685
)0
3,06
80
00
3,06
80
2,95
448
30
00
00
03,
437
(3,0
54)
365.
01-V
ocat
l Reh
abil
132
011
70
00
117
610
470
00
00
3214
010
936
6.01
-Drin
king
Wat
er(2
50)
00
00
00
00
00
00
00
00
(250
)36
6.02
-Drin
k W
ater
DO
H(6
,135
)0
6,66
50
00
6,66
50
4,34
550
315
00
2,66
70
00
7,66
5(7
,135
)36
8.01
-NY
CC
C O
pera
t Of
(18,
767)
025
,000
00
8,70
033
,700
019
,700
3,70
00
09,
600
00
033
,000
(18,
067)
369.
01-J
ud D
ata
Pro
c O
6,57
70
26,0
000
00
26,0
000
16,8
000
00
7,90
00
00
24,7
007,
877
377.
A1-
CU
NY
Sta
biliz
n1
00
00
00
00
00
00
00
00
137
7.ZX
-CU
NY
Tui
tn R
eim
37,7
840
43,6
920
00
43,6
920
42,6
6330
60
00
00
042
,969
38,5
0737
7.ZY
-CU
NY
Inc
Rei
mb
72,4
810
119,
074
00
011
9,07
40
42,4
6234
,381
00
6,68
50
00
83,5
2810
8,02
738
5.01
-Lk
Pla
cid
Trai
n40
085
00
085
00
750
00
00
2398
2739
0.01
-Indi
gent
Leg
al
16,1
180
73,0
000
040
,000
113,
000
77,0
0079
425
,319
210
410
00
010
3,54
425
,574
482.
01-U
I Sp
Int &
Pen
1,47
60
9,60
00
00
9,60
00
1,61
44,
079
580
991
00
6,71
113
,453
(2,3
77)
T-233

Fund
O
peni
ng
Mis
c.
Fede
ral
Bon
d
Tran
sfer
s
Tota
l In
dire
ct
UI
Tran
sfer
s
Tota
l C
losi
ng
Acc
ount
Bal
ance
Taxe
s R
ecei
pts
Gra
nts
Proc
eeds
From
Rec
eipt
sLo
cal
PS
NPS
C
osts
Ben
efits
GSC
s D
ebt
Cap
ital
ToD
isb.
Bal
ance
339.
01-A
dopt
Info
Reg
i49
050
00
050
00
00
00
00
00
9933
9.02
-Arti
cle
VII
Int
1,48
30
500
00
050
050
00
00
00
00
050
01,
483
339.
03-S
P A
R C
S1,
044
07,
509
00
1,46
48,
973
03,
648
966
128
02,
324
00
885
7,95
12,
066
339.
05-O
PW
DD
Pro
vide
r 1,
152
00
00
334,
097
334,
097
327,
908
00
00
00
06,
189
334,
097
1,15
233
9.07
-Fire
Pre
v/C
ode
00
14,8
100
00
14,8
100
00
00
00
014
,810
14,8
100
339.
08-N
YS
Tw
y P
olic
e0
055
,263
00
055
,263
035
,700
096
30
18,6
000
00
55,2
630
339.
09-D
MV
Sei
z A
sset
s16
40
500
00
500
017
80
00
00
017
836
339.
10-M
enta
l Hyg
iene
14,1
560
00
05,
660,
424
5,66
0,42
41,
116,
375
925,
031
258,
415
25,8
520
471,
482
00
2,84
5,25
95,
642,
414
32,1
6633
9.11
-Ins
Gen
l Ope
rns
(22)
00
00
00
00
00
00
00
00
(22)
339.
13-M
H P
atie
nt In
c10
,881
00
00
2,96
5,63
22,
965,
632
261,
951
1,35
6,90
034
3,28
637
,712
071
3,71
60
023
7,37
32,
950,
938
25,5
7533
9.15
-Fin
Cnt
rl B
oard
(668
)0
3,45
50
00
3,45
50
1,63
484
144
085
00
00
3,36
9(5
82)
339.
16-R
eg o
f Rac
ing
(6,1
78)
09,
637
00
09,
637
04,
361
4,52
820
00
500
00
09,
589
(6,1
30)
339.
17-T
ri S
t Reg
Pla
n(3
,462
)0
00
013
,810
13,8
100
4,20
77,
338
154
02,
110
00
013
,809
(3,4
61)
339.
18-S
U C
onst
r Fun
d1,
013
00
00
00
00
00
00
00
00
1,01
333
9.20
-Qua
lity
Car
e1,
686
05,
700
00
97,8
6310
3,56
37,
288
65,5
4933
,923
00
00
00
106,
760
(1,5
11)
339.
21-N
urse
s A
ide
Reg
2,27
70
5,37
10
00
5,37
10
528
3,47
817
030
40
00
4,32
73,
321
339.
22-E
mer
g M
ed S
rvs
(1)
00
00
00
00
00
00
00
00
(1)
339.
23-S
eize
d A
sset
s65
00
500
00
500
023
80
00
00
023
846
233
9.24
-Chi
ld C
are
& P
r21
90
700
00
7010
00
00
00
00
010
018
933
9.25
-Cyb
er S
ec U
pgr
1,63
40
1,50
00
00
1,50
00
01,
548
00
00
00
1,54
81,
586
339.
26-C
ert o
f Nee
d15
,536
06,
516
00
06,
516
02,
653
987
890
1,61
90
01,
086
6,43
415
,618
339.
27-L
obby
ing
Enf
orc
40
00
00
00
00
00
00
00
04
339.
28-R
etir
Com
mun
ity56
20
760
00
760
252
10
140
02
4459
433
9.29
-Chi
ld H
lth In
s1
00
00
00
00
00
00
00
00
133
9.2C
-OH
RD
St M
atch
2,55
80
2,00
00
00
2,00
00
02,
046
00
00
00
2,04
62,
512
339.
30-D
OL
Fee
Pen
alty
10,6
610
21,9
500
00
21,9
500
4,92
476
418
00
3,31
00
08,
372
17,5
5015
,061
339.
31-E
duc
Mus
eum
(197
)0
900
00
090
00
568
256
220
218
00
140
1,20
4(5
01)
339.
32-N
s H
m R
ecei
vshp
2,83
20
250
00
250
00
00
00
00
02,
857
339.
35-3
rd P
arty
Hlth
447
01,
250
00
01,
250
01,
251
00
00
00
01,
251
446
339.
36-B
oatin
g N
oise
L2
00
00
00
00
00
00
00
00
233
9.37
-I Lo
ve N
Y W
ater
922
092
10
00
921
00
00
00
00
00
1,84
333
9.38
-Sum
mer
Sch
Arts
213
00
00
00
00
00
00
00
00
213
339.
39-I
Love
NY
Wat
er49
60
245
00
024
50
(12)
252
08
00
6487
654
339.
41-S
now
mob
ile11
,804
011
,400
00
011
,400
4,85
010
335
59
062
00
05,
379
17,8
2533
9.42
-Tr S
urpl
us P
rop
4,64
30
2,20
00
00
2,20
00
034
40
00
00
803
1,14
75,
696
339.
44-H
osp
& N
urs
Mgt
18,1
160
34,6
970
00
34,6
970
15,1
6678
619
00
2,51
30
037
619
,031
33,7
8233
9.45
-Wat
ersh
ed P
rtnr
(4)
00
00
00
00
00
00
00
00
(4)
339.
46-W
orld
Uni
v G
ame
30
00
00
00
00
00
00
00
03
339.
47-S
U D
orm
Rei
mb
(4)
00
00
266,
523
266,
523
011
6,01
114
3,38
80
00
00
2,90
026
2,29
94,
220
339.
48-O
DTA
Tra
in C
ont
1,01
00
00
00
00
00
00
00
01,
010
1,01
00
339.
49-O
DTA
Sta
te M
atc
238
00
00
00
00
00
00
00
00
238
339.
50-O
DTA
Trn
g M
gmt
650
00
00
00
00
00
00
065
650
339.
51-M
etha
done
Reg
is0
024
20
00
242
00
00
00
00
242
242
033
9.60
-Ene
rgy
Res
earc
h(1
)0
16,1
580
00
16,1
589,
234
3,43
21,
260
594
01,
638
00
016
,158
(1)
339.
61-R
adio
logy
1,83
50
6,00
00
00
6,00
03,
000
1,00
055
735
043
80
01,
350
6,38
01,
455
339.
62-C
rim J
us Im
prov
16,9
860
53,0
000
00
53,0
0029
,400
3,43
961
193
01,
777
00
26,8
5262
,172
7,81
433
9.65
-Far
m P
rod
Insp
-(8
28)
01,
750
00
01,
750
01,
670
142
510
861
00
(185
)2,
539
(1,6
17)
339.
68-F
ngrp
rnt I
D T
ec1,
002
012
,850
00
012
,850
00
18,5
000
00
00
018
,500
(4,6
48)
339.
72-N
Y F
ire A
cade
my
199
046
80
00
468
018
227
91
06
00
247
715
(48)
339.
77-T
ran
Fees
Per
ms
(1)
00
00
00
00
00
00
00
00
(1)
339.
79-O
PD
V T
rain
ing
600
70
00
70
01
00
00
00
166
339.
81-E
nvir.
Lab.
Fee
A64
70
3,70
00
00
3,70
00
1,99
950
661
01,
122
00
183
3,87
147
633
9.85
-Ins
St L
Adm
1,13
80
107,
670
00
010
7,67
032
,000
30,1
6636
,069
2,74
50
15,1
310
00
116,
111
(7,3
03)
339.
86-H
ealth
Ser
vice
s31
00
00
00
00
00
00
00
00
3133
9.88
-Tra
in M
gmt E
val
978
03,
000
00
03,
000
01,
502
633
680
1,05
10
048
83,
742
236
339.
90-C
lin L
ab R
efrn
c(1
8,00
2)0
18,0
590
00
18,0
59(1
10)
8,04
82,
562
267
04,
891
00
015
,658
(15,
601)
339.
91-M
WB
D C
ertif
icat
00
00
00
00
00
00
00
00
00
339.
93-P
ub E
mp
Rel
Brd
356
086
00
086
035
239
00
00
00
391
5133
9.94
-WIC
CV
L M
onet
ry2,
000
02,
000
00
02,
000
00
00
00
00
00
4,00
033
9.95
-Rad
io H
lth P
rot
2,02
30
2,98
90
00
2,98
90
2,10
123
073
01,
335
00
216
3,95
51,
057
339.
99-C
ons
Food
Indu
s(1
,002
)0
00
00
00
00
00
00
00
0(1
,002
)33
9.A
2-M
MIA
(1)
00
00
00
00
00
00
00
00
(1)
CA
SH C
OM
BIN
ING
STA
TEM
ENT
BY
AC
CO
UN
TM
ISC
ELLA
NEO
US
SPEC
IAL
REV
ENU
E FU
ND
(339
)FY
201
3(T
hous
ands
of D
olla
rs)
T-234

Fund
O
peni
ng
Mis
c.
Fede
ral
Bon
d
Tran
sfer
s
Tota
l In
dire
ct
UI
Tran
sfer
s
Tota
l C
losi
ng
Acc
ount
Bal
ance
Taxe
s R
ecei
pts
Gra
nts
Proc
eeds
From
Rec
eipt
sLo
cal
PS
NPS
C
osts
Ben
efits
GSC
s D
ebt
Cap
ital
ToD
isb.
Bal
ance
CA
SH C
OM
BIN
ING
STA
TEM
ENT
BY
AC
CO
UN
TM
ISC
ELLA
NEO
US
SPEC
IAL
REV
ENU
E FU
ND
(339
)FY
201
3(T
hous
ands
of D
olla
rs)
339.
A3-
Edu
catn
Lib
rary
125
065
00
065
00
680
00
00
068
122
339.
A4-
Teac
her C
ertif
2,78
90
8,80
00
00
8,80
00
3,16
779
110
00
1,54
40
01,
501
7,10
34,
486
339.
A5-
Ban
king
Dep
tmnt
17,5
060
83,5
780
00
83,5
780
43,5
4413
,769
1,35
30
21,6
840
02,
413
82,7
6318
,321
339.
A6-
Cab
le T
V A
ccnt
9,01
30
2,87
50
00
2,87
50
1,72
421
446
089
10
00
2,87
59,
013
339.
A7-
Eco
n D
evel
Ass
t41
20
00
00
00
00
00
00
00
041
233
9.A
9-Fi
n S
vcs
Sei
zed
213
050
00
050
00
500
00
00
050
213
339.
AC
-Non
-Ivd
Wag
e W
i(5
8)0
00
00
00
00
00
00
00
0(5
8)33
9.A
D-O
DD
Ear
ned
Rev
n28
30
00
00
00
00
00
00
00
028
333
9.A
E-M
otor
cycl
e S
fty3,
215
02,
000
00
02,
000
085
1,51
72
044
00
61,
654
3,56
133
9.A
F-H
osp
Gra
nts
20
00
00
00
00
00
00
00
02
339.
AG
-Bus
ines
s Li
cens
(531
)0
75,3
000
00
75,3
0053
916
,803
10,2
0946
00
8,03
10
(15)
39,9
6075
,987
(1,2
18)
339.
AH
-Indi
r Cos
t Rec
o1,
243
00
00
21,5
3921
,539
010
,004
4,85
00
05,
170
00
020
,024
2,75
833
9.A
I-Hig
h S
choo
l Equ
712
022
50
00
225
00
225
00
00
00
225
712
339.
AJ-
Arti
cle
X In
ter
10
00
00
00
00
00
00
00
01
339.
AK
-Ins
Vou
cher
Pro
20
00
00
00
00
00
00
00
02
339.
AL-
OTD
A P
rogr
am(1
71)
00
00
00
00
200
00
00
00
200
(371
)33
9.A
M-H
lth C
are
Adv
is1
00
00
00
00
00
00
00
00
133
9.A
N-D
isas
Pre
p C
onf
240
10
00
10
01
00
00
00
124
339.
AP
-Adm
inis
tratio
n14
,496
014
,188
00
2,63
516
,823
07,
087
641
252
04,
554
00
012
,534
18,7
8533
9.A
Q-R
ail S
afet
y In
s1,
111
066
90
00
669
043
245
120
223
00
071
21,
068
339.
AR
-Fed
l Adm
in R
eim
2,28
50
130
00
992
1,12
20
00
00
00
00
03,
407
339.
AS
-Qua
lity
Ass
uran
10
00
00
00
00
00
00
00
01
339.
AU
-Aba
ndon
ed P
rop
3,98
00
16,3
350
00
16,3
350
7,50
04,
516
560
428
00
012
,500
7,81
533
9.A
V-S
eize
d A
sset
s14
02
00
02
00
00
00
00
00
1633
9.A
W-S
pina
l Inj
ury
4,77
10
00
00
00
244
1,34
18
014
30
00
1,73
63,
035
339.
AX
-Chi
ld S
upp
Rev
750
00
00
00
00
00
00
075
750
339.
AY
-Mul
t Age
n Tr
ain
21,6
150
00
032
,000
32,0
000
2,30
729
,858
830
1,25
10
00
33,4
9920
,116
339.
AZ-
Dep
t Law
-Sei
zed
1,12
90
2,30
00
00
2,30
00
300
2,23
68
015
60
00
2,70
072
933
9.B
2-D
MN
A-S
eiz
Ass
et85
30
200
00
020
00
019
50
00
00
019
585
833
9.B
3-C
ritic
al In
fras
1,44
30
1,99
80
00
1,99
80
330
1,45
913
019
60
00
1,99
81,
443
339.
B4-
Rad
on D
etct
Dev
277
0(7
)0
00
(7)
00
110
00
00
213
257
339.
B6-
Insu
ranc
e D
ept
186,
527
140
7,50
30
00
407,
504
216,
102
90,3
0350
,961
3,16
30
45,2
460
00
405,
775
188,
256
339.
B7-
Wor
kers
Com
p B
d23
,246
020
0,96
30
00
200,
963
089
,130
61,6
202,
398
046
,062
00
019
9,21
024
,999
339.
B8-
Fire
Pro
tect
ion
104
025
00
025
00
00
00
00
1313
116
339.
B9-
Con
f Fee
Acc
t(1
9)0
50
00
50
031
00
00
00
31(4
5)33
9.B
A-P
ublic
Wor
k E
nf1,
811
06,
148
00
06,
148
01,
477
318
530
978
00
2,93
05,
756
2,20
333
9.B
B-A
sset
For
feitu
r28
30
550
00
055
00
055
00
00
00
055
028
333
9.B
F-V
ES
ID S
S2,
134
02,
500
00
02,
500
1,62
620
50
60
112
00
411,
990
2,64
433
9.B
I-Trn
Mtls
Reg
ist
400
60
00
60
025
00
00
00
2521
339.
BJ-
Bel
l Jar
Col
lec
624
02,
100
00
02,
100
064
934
820
035
80
020
21,
577
1,14
733
9.B
K-In
d &
Util
Ser
v1,
693
03,
075
00
03,
075
01,
535
074
083
70
044
12,
887
1,88
133
9.B
O-P
rimar
y C
are
In2
00
00
00
00
00
00
00
00
233
9.B
U-L
and
Util
izat
io(1
)0
00
00
00
00
00
00
00
0(1
)33
9.B
W-A
sbes
tos
Trni
ng(2
19)
033
00
00
330
033
817
40
750
00
434
(323
)33
9.B
Z-IM
P R
P T
ax A
dm3
00
00
00
00
00
00
00
00
333
9.C
2-Jo
nes
Bch
The
at1
00
00
00
00
00
00
00
00
133
9.C
3-P
ublic
Ser
vice
41,4
270
73,8
870
010
73,8
970
39,9
819,
261
1,07
50
20,6
620
010
70,9
8944
,335
339.
C4-
Atty
Lic
ensi
ng11
,334
037
,000
00
037
,000
018
,600
7,60
00
06,
300
00
3,75
036
,250
12,0
8433
9.C
9-D
SS
Pro
v R
ecov
s18
60
3,70
00
00
3,70
00
3,70
00
00
00
00
3,70
018
633
9.C
A-C
rimes
Aga
inst
9,
845
00
00
16,0
0016
,000
16,0
000
00
00
00
016
,000
9,84
533
9.C
B-F
S R
einv
estm
ent
(1)
00
00
00
00
00
00
00
00
(1)
339.
CD
-Day
care
Ear
ned
00
00
00
00
00
00
00
00
00
339.
CE
-Cam
p S
mith
Bill
380
197
00
019
70
131
94
047
00
019
144
339.
CF-
Cig
aret
te F
ire
180
050
00
00
500
00
320
00
00
00
320
360
339.
CG
-Tec
h &
Sci
entif
(1)
00
00
00
00
00
00
00
00
(1)
339.
CL-
Com
m F
eed
Lic
214
00
00
00
00
00
00
00
00
214
339.
CM
-Reg
Man
u H
sg18
00
200
00
020
00
00
00
00
010
010
028
033
9.C
O-C
olle
ge S
avin
gs2,
156
081
30
00
813
019
898
518
099
00
01,
300
1,66
933
9.C
Q-D
isco
ver Q
ueen
s8
00
00
00
00
00
00
00
00
833
9.C
R-R
even
Arr
eara
ge19
,769
025
,000
00
025
,000
02,
106
5,97
554
01,
000
00
24,3
8033
,515
11,2
5433
9.C
S-P
rovi
der A
sses
s8,
821
00
00
00
00
00
00
00
00
8,82
133
9.C
U-S
pec
Con
serv
Ac
10
00
00
00
00
00
00
00
01
T-235

Fund
O
peni
ng
Mis
c.
Fede
ral
Bon
d
Tran
sfer
s
Tota
l In
dire
ct
UI
Tran
sfer
s
Tota
l C
losi
ng
Acc
ount
Bal
ance
Taxe
s R
ecei
pts
Gra
nts
Proc
eeds
From
Rec
eipt
sLo
cal
PS
NPS
C
osts
Ben
efits
GSC
s D
ebt
Cap
ital
ToD
isb.
Bal
ance
CA
SH C
OM
BIN
ING
STA
TEM
ENT
BY
AC
CO
UN
TM
ISC
ELLA
NEO
US
SPEC
IAL
REV
ENU
E FU
ND
(339
)FY
201
3(T
hous
ands
of D
olla
rs)
339.
CY
-Cen
tral R
egis
ty34
50
5,01
70
00
5,01
70
910
200
590
04,
822
4,99
237
033
9.C
Z-P
lant
Indu
stry
173
025
30
00
253
038
00
120
205
00
1561
2(1
86)
339.
D1-
Food
Stp
Rec
Fr
(1)
00
00
00
00
00
00
00
00
(1)
339.
D4-
Food
Stp
Rec
Fr
50
00
00
00
00
00
00
00
05
339.
D9-
Bat
avia
Sch
ool
(5,9
71)
09,
600
00
755
10,3
550
5,97
759
218
20
3,17
60
00
9,92
7(5
,543
)33
9.D
B-A
lcoh
ol B
ever
ag4,
477
00
00
17,3
7317
,373
08,
185
5,22
422
00
4,23
00
00
17,8
593,
991
339.
DC
-Inve
stm
ent S
erv
(1,4
74)
03,
406
00
03,
406
02,
025
665
620
1,13
60
054
14,
429
(2,4
97)
339.
DD
-Driv
e ou
t Dia
be54
06
00
06
00
00
00
00
00
6033
9.D
F-K
eep
Kid
s D
rug
500
90
00
90
00
00
00
00
059
339.
DH
-OM
RD
D D
ay S
rvs
00
40,0
000
00
40,0
000
00
00
00
040
,000
40,0
000
339.
DI-O
SD
C F
inan
Ove
r49
10
4,92
30
00
4,92
30
2,67
917
479
01,
373
00
04,
305
1,10
933
9.D
K-S
enat
e R
ecyc
lab
463
020
00
020
00
00
00
00
00
483
339.
DL-
Med
icai
d Fr
aud
45,2
500
13,0
850
00
13,0
850
5,97
02,
456
162
03,
104
00
011
,692
46,6
4333
9.D
M-E
AD
Met
allu
rgl
70
60
00
60
00
00
00
00
013
339.
DN
-Fin
es P
enal
ties
(1)
00
00
00
00
00
00
00
00
(1)
339.
DO
-DE
D M
arke
ting
A4,
987
01,
944
00
01,
944
063
1,71
02
028
00
131
1,93
44,
997
339.
DQ
-Tug
Hill
Adm
in56
038
00
038
029
30
00
00
1042
5233
9.D
S-S
ettle
men
t Enf
765
090
00
00
900
850
050
00
00
00
900
765
339.
DT-
Indi
an G
amin
g(1
11,2
35)
07,
742
00
07,
742
012
,589
2,56
349
40
6,45
30
00
22,0
99(1
25,5
92)
339.
DX
-NY
S F
LEX
Spe
nd6
030
00
00
300
00
300
00
00
00
300
633
9.D
Z-In
tere
st A
sses
s1
00
00
00
00
00
00
00
00
133
9.E
1-C
rime
Vic
tims
B13
054
00
054
00
540
00
00
054
1333
9.E
2-C
onfe
renc
e&S
ign
107
035
00
035
00
350
00
00
035
107
339.
E3-
Ofc
of P
rofe
ssi
13,3
890
48,2
720
00
48,2
720
18,4
148,
911
495
09,
516
00
5,99
943
,335
18,3
2633
9.E
4-E
duc
Ass
essm
ent
40
00
00
00
00
00
00
00
04
339.
E5-
Arm
ory
Ren
tal A
806
01,
825
00
01,
825
080
41,
001
270
203
00
02,
035
596
339.
E6-
Rom
e S
choo
l2,
189
09,
600
00
705
10,3
050
5,09
468
815
30
2,68
40
00
8,61
93,
875
339.
E7-
Uni
f Com
mer
c C
d(1
)0
00
00
00
00
00
00
00
0(1
)33
9.E
8-S
eize
d A
sset
s(1
5,57
6)0
8,72
50
043
8,76
80
08,
725
00
00
00
8,72
5(1
5,53
3)33
9.E
9-Tr
af A
djud
icat
n(3
,244
)0
41,5
000
00
41,5
000
20,6
619,
579
556
010
,678
00
041
,474
(3,2
18)
339.
EA
-Bus
& L
icen
Srv
10
00
00
00
00
00
00
00
01
339.
EB
-Ant
itrus
t Enf
or(1
)0
00
00
00
00
00
00
00
0(1
)33
9.E
C-F
ed S
alar
y S
har
2,33
20
00
02,
700
2,70
039
02,
297
148
720
1,18
70
062
4,15
687
633
9.E
D-C
ook/
Chi
ll A
cco
180
02,
100
00
02,
100
00
2,10
00
00
00
02,
100
180
339.
EE
-Map
Rev
enue
10
00
00
00
00
00
00
00
01
339.
EF-
TAP
Sys
Red
esgn
(1)
00
00
00
00
00
00
00
00
(1)
339.
EG
-Clie
nt N
otic
es0
00
00
00
00
00
00
00
00
033
9.E
J-C
rede
ntia
l Srv
s0
094
80
00
948
00
00
00
00
948
948
033
9.E
K-S
eize
d A
sset
s43
00
00
00
00
00
00
00
4343
033
9.E
M-N
YC
Ass
essm
ent
28,1
610
80,0
770
00
80,0
770
36,8
8124
,553
1,42
00
19,1
920
00
82,0
4626
,192
339.
EN
-Cul
tura
l Edu
cat
(11,
708)
028
,750
00
028
,750
011
,888
5,60
932
00
6,14
40
02,
081
26,0
42(9
,000
)33
9.E
P-D
ista
nce
Lear
n1
00
00
00
00
00
00
00
00
133
9.E
R-E
xam
& M
isc
Rev
3,55
40
3,15
00
00
3,15
00
350
800
110
168
00
1,56
62,
895
3,80
933
9.E
S-E
atin
g D
isor
der
1,00
00
1,00
00
00
1,00
00
00
00
00
00
02,
000
339.
F1-T
rans
Reg
ul A
cc10
,502
04,
800
00
04,
800
02,
131
350
570
1,10
10
00
3,63
911
,663
339.
F2-C
ons
Pro
t Acc
t75
90
910
00
910
236
958
010
60
00
445
405
339.
F6-L
c O
n S
olid
Was
00
10
00
10
00
00
00
00
01
339.
F9-O
ER
NA
SD
ER
111
024
00
024
00
310
00
00
031
104
339.
FA-F
in A
id A
udit
10
00
00
00
00
00
00
00
01
339.
FC-F
ostr
Car
e S
avi
(1)
00
00
00
00
00
00
00
00
(1)
339.
FH-8
th A
ir Fo
rce
H2
00
00
00
00
00
00
00
00
233
9.FL
-Fed
Lia
bilit
y35
00
00
00
00
00
00
00
00
3533
9.FM
-FM
S A
ccou
nt70
80
00
050
,000
50,0
000
10,8
1439
,387
00
00
00
50,2
0150
733
9.FP
-Fun
eral
1,40
60
1,01
50
00
1,01
50
239
208
013
50
08
410
2,01
133
9.FS
-FS
HR
P91
00
00
175,
000
175,
000
175,
000
00
00
00
00
175,
000
9133
9.G
1-E
duc
Arc
hive
s12
40
150
00
150
075
00
00
00
7564
339.
G3-
Loca
l Ser
vice
s53
40
1,10
00
00
1,10
00
574
032
035
70
026
989
645
339.
G7-
DO
T-A
ccid
ent D
a5,
907
00
00
00
00
00
00
00
5,91
15,
911
(4)
339.
GA
-Adu
lt S
helte
r4,
597
00
00
00
00
00
00
00
00
4,59
733
9.G
B-Q
AA
Ear
ned
Rev
426
00
00
00
00
00
00
00
00
426
339.
GC
-Fam
ily P
res
Svc
1,70
10
600
00
600
00
00
00
00
01,
761
339.
GD
-Ele
ctro
nic
Ben
e4,
038
00
00
00
4,00
00
00
00
00
04,
000
38
T-236

Fund
O
peni
ng
Mis
c.
Fede
ral
Bon
d
Tran
sfer
s
Tota
l In
dire
ct
UI
Tran
sfer
s
Tota
l C
losi
ng
Acc
ount
Bal
ance
Taxe
s R
ecei
pts
Gra
nts
Proc
eeds
From
Rec
eipt
sLo
cal
PS
NPS
C
osts
Ben
efits
GSC
s D
ebt
Cap
ital
ToD
isb.
Bal
ance
CA
SH C
OM
BIN
ING
STA
TEM
ENT
BY
AC
CO
UN
TM
ISC
ELLA
NEO
US
SPEC
IAL
REV
ENU
E FU
ND
(339
)FY
201
3(T
hous
ands
of D
olla
rs)
339.
GE
-Fed
eral
-Sei
zed
(59)
00
00
1212
00
900
00
00
090
(137
)33
9.H
2-D
HC
R M
ortg
age
S85
20
7,96
00
00
7,96
00
3,89
616
311
20
1,90
30
00
6,07
42,
738
339.
H3-
Pilo
t Hea
lth In
10
00
00
00
00
00
00
00
01
339.
H5-
Trip
le P
resc
r F(2
)0
00
00
00
00
00
00
00
0(2
)33
9.H
6-O
MH
-Res
earc
h O
H69
02,
848
00
02,
848
010
22,
746
00
00
00
2,84
869
339.
H7-
DM
V-C
ompu
lsor
y(9
01)
027
,600
00
027
,600
09,
416
1,55
125
30
4,86
60
015
,368
31,4
54(4
,755
)33
9.H
9-P
rof M
edic
Con
d9,
872
027
,201
00
027
,201
012
,331
5,82
544
80
6,14
70
00
24,7
5112
,322
339.
HC
-Hw
ay C
onst
& M
a1,
140
026
00
00
260
00
128
00
00
00
128
1,27
233
9.H
I-Hou
sing
Indi
rec
603
03,
050
00
03,
050
02,
086
302
620
1,01
90
00
3,46
918
433
9.H
Q-A
dlt H
me
Qlty
E92
20
657
00
065
70
029
30
00
00
2131
41,
265
339.
HR
-Hom
eles
s H
sg1
00
00
00
00
00
00
00
00
133
9.IA
-CO
CO
T2
00
00
00
00
00
00
00
00
233
9.IC
-Acc
id P
reve
nt C
316
01,
000
00
01,
000
015
139
84
078
00
606
1,23
779
339.
IG-IG
Szd
Ass
ets
790
850
00
850
087
00
00
00
8777
339.
IM-L
eg S
vcs
Ass
ist
3,15
60
13,6
000
00
13,6
0014
,300
00
00
00
00
14,3
002,
456
339.
J1-L
oc P
ub H
lth3,
588
095
00
00
950
011
824
120
650
05
224
4,31
433
9.J2
-Loc
al D
ist T
rai
446
080
00
00
800
00
761
00
00
00
761
485
339.
J4-V
otin
g M
ach
Exa
230
00
00
00
00
00
00
00
023
339.
J5-D
HC
R H
CA
App
lic1,
416
02,
395
00
02,
395
01,
183
320
360
578
00
02,
117
1,69
433
9.J6
-EP
IC P
rem
ium
Ac
60,9
260
12,6
000
00
12,6
000
00
00
00
052
,000
52,0
0021
,526
339.
J7-D
rug
Enf
orce
Ta
830
00
00
00
00
00
00
00
083
339.
JA-V
ital R
ec M
gmt
1,91
30
4,45
70
00
4,45
70
1,18
110
137
068
00
02,
252
4,25
12,
119
339.
JD-P
robl
m S
olv
Cou
192
00
00
00
00
00
00
00
00
192
339.
JE-T
obac
co E
nfor
ce17
00
00
00
00
00
00
00
00
1733
9.K
1-H
wy
Rev
/Soc
Sec
1,30
70
406
00
040
60
040
80
00
00
5045
81,
255
339.
K2-
Equ
ip R
epai
r(1
)0
00
00
00
00
00
00
00
0(1
)33
9.K
3-C
atas
troph
ic H
l1
00
00
00
00
00
00
00
00
133
9.K
A-P
rimar
y H
lth C
r(1
)0
00
00
00
00
00
00
00
0(1
)33
9.K
B-C
onfe
renc
e &
Sp
(1)
00
00
00
00
00
00
00
00
(1)
339.
L2-A
sst L
ivin
g R
es12
00
950
00
9595
00
00
00
09
104
111
339.
L4-O
CFS
Pro
gram
2,64
00
100
00
010
00
143
115
00
710
00
329
2,41
133
9.L5
-Adu
lt C
yst F
ibr
(1)
00
00
00
00
00
00
00
00
(1)
339.
L7-O
TDA
Inco
me
Acc
1,34
80
00
00
00
00
00
00
01,
348
1,34
80
339.
L8-D
OS
Lic
ensi
ng(1
)0
00
00
00
00
00
00
00
0(1
)33
9.LB
-Hea
lth O
ccup
De
10
00
00
00
00
00
00
00
01
339.
LC-M
ater
n C
hld
Hiv
20
00
00
00
00
00
00
00
02
339.
LF-D
isab
il D
eter
ms
90
00
00
00
00
00
00
00
09
339.
LG-O
MR
DD
-Jt C
linic
00
00
00
00
00
00
00
00
00
339.
LH-S
peci
al M
edic
al1
00
00
00
00
00
00
00
00
133
9.LI
-Liti
gatio
n S
ett
5,21
90
66,2
140
00
66,2
140
19,9
6432
,527
538
010
,380
00
063
,409
8,02
433
9.LJ
-Ani
mal
Pop
ulat
i76
60
1,05
00
00
1,05
00
01,
000
00
00
00
1,00
081
633
9.LL
-Lov
e Y
our L
ibra
380
60
00
60
00
00
00
00
044
339.
LW-L
ocal
Wire
less
210
00
00
00
00
00
00
00
021
339.
LZ-P
ub S
afe
Com
mun
23,7
200
115,
388
00
011
5,38
854
,300
8,20
755
,886
00
500
00
20,0
0013
8,89
321
533
9.M
C-C
uba
Lake
Mgm
t20
40
200
00
020
00
019
10
00
00
019
121
333
9.M
H-S
t Jus
tice
Inst
690
00
00
00
00
00
00
00
069
339.
MR
-Med
Rei
mb
Acc
t(1
)0
1,50
00
00
1,50
01,
500
00
00
00
00
1,50
0(1
)33
9.N
G-L
ow In
c H
ousi
ng2,
426
02,
758
00
02,
758
01,
070
(40)
320
522
00
01,
584
3,60
033
9.N
H-P
rovi
der 9
002
00
00
00
00
00
00
00
00
233
9.N
Y-N
ew Y
ork
Ale
rt1,
902
03,
084
00
03,
084
00
1,10
00
00
00
01,
100
3,88
633
9.P
4-P
rocu
re O
p N
ews
1,02
10
275
00
027
50
4013
50
00
00
100
275
1,02
133
9.P
5-C
VB
Res
titut
ion
804
057
70
00
577
042
715
00
00
00
057
780
433
9.P
6-E
FC C
orp
Adm
in(2
14)
00
00
00
00
00
00
00
00
(214
)33
9.P
C-F
ood
Pro
d C
tr81
40
1,00
00
00
1,00
00
01,
000
00
00
00
1,00
081
433
9.P
D-P
et D
eale
r(8
)0
320
00
320
00
00
00
00
024
339.
PO
-Aut
h B
dgt O
ffce
2,58
50
1,98
90
01,
826
3,81
50
959
250
280
502
00
391,
778
4,62
233
9.P
S-P
atie
nt S
afet
y 23
60
500
00
050
00
040
30
00
00
7347
626
033
9.Q
2-H
elen
Hay
es H
os6,
494
011
50
066
,381
66,4
960
33,3
9919
,323
133
00
00
7,71
060
,565
12,4
2533
9.Q
3-N
YC
Vet
eran
s5,
121
035
00
032
,907
33,2
570
14,5
4610
,983
630
6,87
20
01,
692
34,1
564,
222
339.
Q4-
NY
S H
ome-
Vet
era
1,09
50
120
00
23,5
7123
,691
014
,624
7,16
979
00
00
1,17
223
,044
1,74
233
9.Q
5-W
NY
Vet
s H
ome
2,84
40
550
012
,247
12,3
020
8,23
23,
142
810
00
099
212
,447
2,69
933
9.Q
6-M
ontro
se S
V H
2,84
60
300
023
,832
23,8
620
15,2
916,
509
111
00
00
765
22,6
764,
032
T-237

Fund
O
peni
ng
Mis
c.
Fede
ral
Bon
d
Tran
sfer
s
Tota
l In
dire
ct
UI
Tran
sfer
s
Tota
l C
losi
ng
Acc
ount
Bal
ance
Taxe
s R
ecei
pts
Gra
nts
Proc
eeds
From
Rec
eipt
sLo
cal
PS
NPS
C
osts
Ben
efits
GSC
s D
ebt
Cap
ital
ToD
isb.
Bal
ance
CA
SH C
OM
BIN
ING
STA
TEM
ENT
BY
AC
CO
UN
TM
ISC
ELLA
NEO
US
SPEC
IAL
REV
ENU
E FU
ND
(339
)FY
201
3(T
hous
ands
of D
olla
rs)
339.
Q9-
DO
H H
ospi
tal H
o6,
331
00
00
145,
739
145,
739
00
00
00
00
141,
732
141,
732
10,3
3833
9.Q
A-S
pec
Ene
rgy
Adm
(2)
00
00
00
00
00
00
00
00
(2)
339.
QC
-Qua
lity
of C
are
2,45
90
1,34
20
02,
500
3,84
20
01,
609
00
00
00
1,60
94,
692
339.
QE
-C &
F Q
ual E
nha
140
00
00
00
00
00
00
00
014
339.
R4-
Mot
or F
uel Q
ual
886
02,
962
00
02,
962
090
01,
305
280
485
00
317
3,03
581
333
9.R
5-W
eigh
ts M
easu
re21
90
410
00
041
00
232
727
012
50
050
486
143
339.
R7-
Def
er C
omp
Adm
(45)
082
00
00
820
036
317
811
019
10
00
743
3233
9.R
9-H
azar
d A
bate
men
300
100
00
010
010
00
00
00
00
010
030
339.
RD
-Edu
catio
n S
tats
222
00
890
089
00
380
00
00
038
273
339.
RF-
Rea
l Est
ate
Fin
4,50
50
1,00
00
00
1,00
00
749
1,02
819
039
00
00
2,18
63,
319
339.
RR
-NY
C R
ent R
ev(1
1,53
4)0
38,8
440
00
38,8
440
22,6
683,
228
703
012
,205
00
038
,804
(11,
494)
339.
S1-
Med
icai
d In
com
e(8
82)
00
00
00
00
00
00
00
00
(882
)33
9.S
8-R
ent R
even
ue(2
79)
085
00
00
850
050
80
160
274
00
079
8(2
27)
339.
S9-
Airp
ort S
ecur
it24
80
00
00
00
00
00
00
00
024
833
9.S
A-C
SFP
Sal
vage
Ac
130
00
00
00
00
00
00
00
013
339.
SR
-ES
Ste
m C
ell T
r5,
599
00
00
50,0
0050
,000
00
50,0
000
00
00
050
,000
5,59
933
9.S
S-D
OT
Sig
n S
hop
(1)
00
00
00
00
00
00
00
00
(1)
339.
ST-
Sys
tem
s &
Tec
h3,
264
07,
300
00
07,
300
02,
678
2,51
783
01,
297
00
833
7,40
83,
156
339.
T2-O
PR
Pat
ron
Ser
v10
,587
059
,520
00
059
,520
027
,709
28,6
750
03,
521
00
903
60,8
089,
299
339.
T5-T
rans
Avi
atn
2,95
10
3,66
00
00
3,66
00
117
3,46
63
060
00
03,
646
2,96
533
9.TM
-Tea
cher
Ed
Acc
r10
50
860
00
860
037
00
00
021
5813
333
9.TN
-Tra
inin
g A
cade
m53
010
00
010
00
100
00
00
010
5333
9.TR
-Tax
Rev
Arr
ear
(861
)0
2,70
00
00
2,70
00
01,
795
00
00
00
1,79
544
339.
TS-T
SC
R A
ccou
nt55
,095
012
9,27
70
00
129,
277
32,3
190
00
00
00
104,
011
136,
330
48,0
4233
9.TW
-Sta
tew
ide
Gam
in1
00
00
00
00
00
00
00
00
133
9.U
2-R
ecru
itmen
t Inc
2,44
20
390
02,
087
2,12
60
01,
186
00
00
00
1,18
63,
382
339.
UR
-ULT
VI R
AD
IA D
EV
450
00
00
00
00
00
00
00
045
339.
US
-Und
rgrn
d S
fty T
144
011
00
00
110
00
00
00
00
175
175
7933
9.V
F-V
ol F
ire R
ec&
Re
740
00
00
00
00
00
00
00
074
339.
VM
-HA
VA
Mat
ch1,
200
00
00
00
00
00
00
00
00
1,20
033
9.V
R-V
RS
S2
00
00
00
00
00
00
00
00
233
9.W
4-O
cc H
lth C
linic
3,48
80
9,00
00
00
9,00
00
534
9,60
750
010
00
00
10,2
912,
197
339.
W6-
Crim
Bac
k C
heck
377
00
00
00
00
00
00
00
00
377
339.
WE
-Med
icai
d Tr
ain
(1,0
00)
0(1
,000
)0
00
(1,0
00)
00
00
00
00
00
(2,0
00)
339.
WK
-SR
-Con
nect
ions
10
00
00
00
00
00
00
00
01
339.
WR
-NY
S W
ater
Res
cu4
00
00
00
00
00
00
00
00
433
9.W
W-O
WIG
Adm
Rei
mb
3,56
70
240
01,
500
1,52
40
408
458
270
221
00
01,
114
3,97
733
9.W
Z-D
urab
le M
edic
al37
60
376
00
037
60
00
00
00
00
075
233
9.X
E-W
ine
Indu
stry
16
00
00
00
00
00
00
00
(11)
(11)
2733
9.X
X-A
&M
-Agg
rega
ted
2,07
80
15,0
440
0(5
98)
14,4
460
748
14,8
2523
038
70
079
16,0
6246
233
9.Y
7-A
ssem
bly
Rec
yc65
90
400
00
400
00
00
00
00
069
933
9.Y
D-S
ales
Tax
Re
Fe8
00
00
00
00
00
00
00
00
833
9.Y
F-Y
th F
ac P
erD
iem
32,5
330
152,
416
00
015
2,41
60
00
00
00
015
2,41
615
2,41
632
,533
339.
YL-
OG
S B
ldg
Adm
in3,
977
08,
890
00
08,
890
02,
957
3,03
680
01,
528
00
1,00
08,
601
4,26
633
9.Y
N-O
GS
Std
& P
urch
(650
)0
5,63
60
00
5,63
60
721
851
190
373
00
3,00
04,
964
2233
9.Y
P-E
quita
ble
Sha
ri2,
313
00
00
00
00
00
00
00
00
2,31
333
9.Y
V-P
rovi
der A
sses
s1
083
0,80
00
00
830,
800
830,
800
00
00
00
00
830,
800
133
9.Y
X-H
EP
(232
)0
00
00
00
030
00
00
00
030
0(5
32)
339.
Z1-F
ed In
dire
ct R
e14
20
00
00
00
00
00
00
00
014
233
9.Z3
-MH
PIA
OM
R N
PS
(1)
00
00
00
00
00
00
00
00
(1)
339.
Z6-H
uman
Rig
hts
Ac
(2)
00
00
00
00
00
00
00
00
(2)
339.
ZM-L
icen
se P
late
00
00
00
00
00
00
00
00
00
339.
ZR-M
ilk P
rodu
cers
(1)
00
00
00
00
00
00
00
00
(1)
339.
ZT-F
HP
EP
00
00
00
00
00
00
00
00
00
339.
ZV-S
T A
Res
earc
h(1
9)0
00
00
00
00
00
00
00
0(1
9)33
9.ZW
-DO
CS
Ass
et F
orf
110
014
00
014
00
140
00
00
014
110
T-238

002
072
074
075
076
077
078
079
080
101
105
109
Ope
ning
Fun
d B
alan
ce5,
730
(30,
997)
102,
222
3,14
9(2
6,11
1)14
14,4
43(3
92)
8816
420
03,
391
Rec
eipt
s:
Taxe
s0
1,28
1,90
00
00
011
9,10
00
00
00
Mis
cella
neou
s R
ecei
pts
1,75
4,49
01,
464,
505
01,
800
86,5
420
14,4
000
00
00
Fede
ral G
rant
s0
5,35
90
00
00
00
00
0
Tota
l Rec
eipt
s1,
754,
490
2,75
1,76
40
1,80
086
,542
013
3,50
00
00
00
Dis
burs
emen
ts:
Gra
nts
to L
ocal
Gov
ernm
ents
936,
859
66,7
360
00
00
00
00
0S
tate
Ope
ratio
ns0
00
00
00
00
00
0G
ener
al S
tate
Cha
rges
00
00
00
00
00
00
Deb
t Ser
vice
00
00
00
00
00
00
Cap
italP
roje
cts
192
086
42
101
419
4660
01
800
8579
10
133
500
00
00
0
CAS
H C
OM
BIN
ING
STA
TEM
ENT
CAP
ITAL
PR
OJE
CTS
FU
ND
SFY
201
3(th
ousa
nds
of d
olla
rs)
Cap
ital P
roje
cts
1,92
0,86
42,
101,
419
46,6
001,
800
85,7
910
133,
500
00
00
0
Tota
l Dis
burs
emen
ts2,
857,
723
2,16
8,15
546
,600
1,80
085
,791
013
3,50
00
00
00
Oth
er F
inan
cing
Sou
rces
(Use
s):
Tran
sfer
s fro
m O
ther
Fun
ds1,
121,
669
872,
140
46,6
000
00
034
30
00
0Tr
ansf
ers
to O
ther
Fun
ds(1
7,43
6)(1
,455
,749
)0
0(7
51)
00
00
(25)
(600
)(1
00)
Bon
d &
Not
e P
roce
eds
00
00
00
00
025
600
100
Net
Oth
er F
inan
cing
Sou
rces
(Use
s)1,
104,
233
(583
,609
)46
,600
0(7
51)
00
343
00
00
Cha
nge
in F
und
Bal
ance
1,00
00
00
00
034
30
00
0
Clo
sing
Fun
d B
alan
ce6,
730
(30,
997)
102,
222
3,14
9(2
6,11
1)14
14,4
43(4
9)88
164
200
3,39
1
T-239

Ope
ning
Fun
d B
alan
ce
Rec
eipt
s:
Taxe
sM
isce
llane
ous
Rec
eipt
sFe
dera
l Gra
nts
Tota
l Rec
eipt
s
Dis
burs
emen
ts:
Gra
nts
to L
ocal
Gov
ernm
ents
Sta
te O
pera
tions
Gen
eral
Sta
te C
harg
esD
ebt S
ervi
ceC
apita
lPro
ject
s
115
121
123
124
126
127
291
310
312
327
357
3,25
222
7,78
64,
291
885
2,65
720
,185
(74,
298)
893
(123
,474
)50
4(3
,468
)
00
00
00
00
00
00
00
00
00
1011
2,25
00
19,0
000
00
00
02,
079,
699
00
00
00
00
00
2,07
9,69
910
112,
250
019
,000
00
00
00
751,
814
00
00
00
00
00
00
00
00
00
00
00
00
00
00
00
00
00
00
00
00
00
01
030
847
1011
256
70
1900
0
CAS
H C
OM
BIN
ING
STA
TEM
ENT
CAP
ITAL
PRO
JEC
TS F
UN
DS
FY 2
013
(thou
sand
s of
dol
lars
)
Cap
ital P
roje
cts
Tota
l Dis
burs
emen
ts
Oth
er F
inan
cing
Sou
rces
(Use
s):
Tran
sfer
s fro
m O
ther
Fun
dsTr
ansf
ers
to O
ther
Fun
dsB
ond
& N
ote
Pro
ceed
s
Net
Oth
er F
inan
cing
Sou
rces
(Use
s)
Cha
nge
in F
und
Bal
ance
Clo
sing
Fun
d B
alan
ce
00
00
00
1,03
0,84
710
112,
567
019
,000
00
00
00
1,78
2,66
110
112,
567
019
,000
00
00
00
00
13,7
000
0(1
,500
)(3
40,7
49)
(1,0
00)
(4,0
00)
(2,0
00)
(50,
343)
(319
,580
)0
(28,
750)
00
1,50
034
0,74
91,
000
4,00
02,
000
50,3
430
00
00
00
00
00
(319
,580
)0
(15,
050)
00
00
00
00
(22,
542)
0(1
5,36
7)0
0
3,25
222
7,78
64,
291
885
2,65
720
,185
(96,
840)
893
(138
,841
)50
4(3
,468
)
T-240

Ope
ning
Fun
d B
alan
ce
Rec
eipt
s:
Taxe
sM
isce
llane
ous
Rec
eipt
sFe
dera
l Gra
nts
Tota
l Rec
eipt
s
Dis
burs
emen
ts:
Gra
nts
to L
ocal
Gov
ernm
ents
Sta
te O
pera
tions
Gen
eral
Sta
te C
harg
esD
ebt S
ervi
ceC
apita
lPro
ject
s
358
374
376
378
380
384
387
388
389
399
0(2
1,60
8)(1
72,1
29)
18,9
20(1
1,01
4)18
6,66
29,
184
(23)
(390
,638
)(1
3,93
0)
00
00
00
00
00
00
120,
060
1,00
00
70,0
0027
,500
020
1,89
323
1,76
50
00
00
00
00
0
00
120,
060
1,00
00
70,0
0027
,500
020
1,89
323
1,76
5
00
120,
635
00
025
,000
093
,676
00
00
00
00
00
00
00
00
00
00
00
00
00
00
00
00
00
100
00
7000
04
900
067
726
253
265
CAS
H C
OM
BIN
ING
STA
TEM
ENT
CAP
ITAL
PRO
JEC
TS F
UN
DS
FY 2
013
(thou
sand
s of
dol
lars
)
Cap
ital P
roje
cts
Tota
l Dis
burs
emen
ts
Oth
er F
inan
cing
Sou
rces
(Use
s):
Tran
sfer
s fro
m O
ther
Fun
dsTr
ansf
ers
to O
ther
Fun
dsB
ond
& N
ote
Pro
ceed
s
Net
Oth
er F
inan
cing
Sou
rces
(Use
s)
Cha
nge
in F
und
Bal
ance
Clo
sing
Fun
d B
alan
ce
00
01,
000
070
,000
4,90
00
67,7
2625
3,26
5
00
120,
635
1,00
00
70,0
0029
,900
016
1,40
225
3,26
5
00
575
00
00
01,
750
21,5
000
00
00
00
00
00
00
00
00
00
0
00
575
00
00
01,
750
21,5
00
00
00
00
(2,4
00)
042
,241
0
0(2
1,60
8)(1
72,1
29)
18,9
20(1
1,01
4)18
6,66
26,
784
(23)
(348
,397
)(1
3,93
0)
T-241

Ope
ning
Fun
d B
alan
ce
Rec
eipt
s:
Taxe
sM
isce
llane
ous
Rec
eipt
sFe
dera
l Gra
nts
Tota
l Rec
eipt
s
Dis
burs
emen
ts:
Gra
nts
to L
ocal
Gov
ernm
ents
Sta
te O
pera
tions
Gen
eral
Sta
te C
harg
esD
ebt S
ervi
ceC
apita
lPro
ject
s
CPO
Sub
Tota
lEl
imin
atio
nsFi
nanc
ial P
lan
1(2
63,4
61)
0(2
63,4
61)
01,
401,
000
01,
401,
000
14,
105,
216
04,
105,
216
02,
085,
058
02,
085,
058
17,
591,
274
07,
591,
274
01,
994,
720
01,
994,
720
00
00
00
00
00
00
05
849
289
05
849
289
CAS
H C
OM
BIN
ING
STA
TEM
ENT
CAP
ITAL
PRO
JEC
TS F
UN
DS
FY 2
013
(thou
sand
s of
dol
lars
)
Cap
ital P
roje
cts
Tota
l Dis
burs
emen
ts
Oth
er F
inan
cing
Sou
rces
(Use
s):
Tran
sfer
s fro
m O
ther
Fun
dsTr
ansf
ers
to O
ther
Fun
dsB
ond
& N
ote
Pro
ceed
s
Net
Oth
er F
inan
cing
Sou
rces
(Use
s)
Cha
nge
in F
und
Bal
ance
Clo
sing
Fun
d B
alan
ce
05,
849,
289
05,
849,
289
07,
844,
009
07,
844,
009
02,
078,
277
(726
,199
)1,
352,
078
0(2
,222
,583
)72
6,19
9(1
,496
,384
)0
400,
317
040
0,31
7
025
6,01
10
256,
011
13,
276
03,
276
2(2
60,1
85)
0(2
60,1
85)
T-242

064
304
311
316
319
330
361
364
Sub
Tota
lEl
imin
atio
nsFi
nanc
ial P
lan
Ope
ning
Fun
d B
alan
ce0
156,
101
00
9,34
938
3,87
70
054
9,32
70
549,
327
Rec
eipt
s:
Taxe
s0
010
,077
,750
00
057
0,90
02,
863,
475
13,5
12,1
250
13,5
12,1
25M
isce
llane
ous
Rec
eipt
s0
351,
523
011
,003
127,
830
505,
204
050
099
6,06
00
996,
060
Fede
ral G
rant
s0
078
,803
00
00
078
,803
078
,803
Tota
l Rec
eipt
s0
351,
523
10,1
56,5
5311
,003
127,
830
505,
204
570,
900
2,86
3,97
514
,586
,988
014
,586
,988
Dis
burs
emen
ts:
Gra
nts
to L
ocal
Gov
ernm
ents
00
00
00
00
00
0S
tate
Ope
ratio
ns0
6,08
523
,631
01,
555
10,1
100
5,54
446
,925
046
,925
Gen
eral
Sta
te C
harg
es0
00
00
00
00
00
Deb
t Ser
vice
032
9,33
45,
284,
458
12,0
0328
,184
102,
134
039
2,41
66,
148,
529
06,
148,
529
Cap
ital P
roje
cts
00
00
00
00
00
0
Tota
l Dis
burs
emen
ts0
335,
419
5,30
8,08
912
,003
29,7
3911
2,24
40
397,
960
6,19
5,45
40
6,19
5,45
4
Oth
er F
inan
cing
Sou
rces
(Use
s):
Tran
sfer
s fro
m O
ther
Fun
ds0
3,04
1,88
23,
435,
614
1,00
042
,069
00
06,
520,
565
(225
,245
)6,
295,
320
Tran
sfer
s to
Oth
er F
unds
0(3
,036
,957
)(8
,284
,079
)0
(162
,945
)(3
13,2
73)
(570
,900
)(2
,466
,014
)(1
4,83
4,16
8)22
5,24
5(1
4,60
8,92
3)B
ond
& N
ote
Pro
ceed
s0
00
00
00
00
00
Net
Oth
er F
inan
cing
Sou
rces
(Use
s)0
4,92
5(4
,848
,465
)1,
000
(120
,876
)(3
13,2
73)
(570
,900
)(2
,466
,014
)(8
,313
,603
)0
(8,3
13,6
03)
Cha
nge
in F
und
Bal
ance
021
,029
(1)
0(2
2,78
5)79
,687
01
77,9
310
77,9
31
Clo
sing
Fun
d B
alan
ce0
177,
130
(1)
0(1
3,43
6)46
3,56
40
162
7,25
80
627,
258
CA
SH C
OM
BIN
ING
STA
TEM
ENT
DEB
T SE
RVI
CE
FY 2
013
(thou
sand
s of
dol
lars
)
T-243

Fund
O
peni
ng
Mis
c.
Fede
ral
Bon
d
Tran
sfer
s
Tota
l To
tal
Tran
sfer
s
Tota
l C
losi
ng
Acc
ount
Bal
ance
Taxe
s R
ecei
pts
Gra
nts
Proc
eeds
From
Rec
eipt
sLo
cal
Stat
e O
psG
SCs
Deb
t C
apita
l To
Dis
b.B
alan
ce
323.
14-A
dmin
Sup
port
20
00
00
00
00
00
00
232
3.15
-Des
ign
& C
onst
r28
,548
060
,288
00
060
,288
043
,652
13,8
490
00
57,5
0131
,335
323.
22-B
room
e S
t Mas
te(1
)0
00
00
00
00
00
00
(1)
323.
XX
-Mis
c C
entrl
Srv
420
00
00
00
00
00
00
4232
3.ZW
-Ent
erpr
ise
Con
t0
050
0,00
00
00
500,
000
049
9,69
031
00
00
500,
000
032
3.ZX
-OG
S E
xec
Dire
ct(3
2,86
6)0
189,
472
00
018
9,47
20
97,9
761,
047
00
88,6
6218
7,68
5(3
1,07
9)32
3.ZY
-OG
S B
ldg
Adm
in9,
153
023
,322
00
023
,322
017
,199
914
00
018
,113
14,3
6232
3.ZZ
-OG
S S
td &
Pur
ch(1
0,59
8)0
18,7
200
00
18,7
200
15,0
411,
206
00
016
,247
(8,1
25)
334.
01-T
rans
Prn
t Sho
p15
00
00
00
00
00
00
015
334.
02-E
duc-
Arc
hive
s R
1,95
40
1,50
00
00
1,50
00
961
303
00
01,
264
2,19
033
4.03
-Civ
il R
ecov
er(2
)0
00
00
00
00
00
00
(2)
334.
04-P
ublic
Fin
ancn
g(1
)0
00
00
00
00
00
00
(1)
334.
05-F
edl S
ingl
e A
ud1,
801
01,
500
00
01,
500
01,
500
00
00
1,50
01,
801
334.
07-Q
uick
Cop
y C
ent
1,12
00
600
00
060
00
562
770
00
639
1,08
133
4.09
-CS
Adm
inis
trat
3,12
70
5,96
30
00
5,96
30
5,89
51,
750
00
07,
645
1,44
533
4.10
-EH
S O
ccup
Hlth
(550
)0
870
00
087
00
1,05
129
40
00
1,34
5(1
,025
)33
4.12
-Ban
king
Ser
vice
00
3,97
40
057
,476
61,4
500
61,4
500
00
061
,450
033
4.13
-Per
sonn
el M
gmt
290
00
00
00
00
00
00
2933
4.14
-Cul
t Res
ourc
es72
80
7,32
90
00
7,32
90
4,56
175
40
027
85,
593
2,46
433
4.17
-Nei
ghbo
r Wor
k P
100
07,
300
00
07,
300
07,
200
00
00
7,20
020
033
4.17
-Nei
ghbo
r Wor
k P
(6,3
62)
00
00
00
00
00
00
0(6
,362
)33
4.18
-Aut
o/P
rint C
hgb
4,50
50
16,5
000
00
16,5
000
12,2
354,
178
00
016
,413
4,59
233
4.20
-NY
T A
ccou
nt18
,115
088
,938
00
088
,938
086
,044
4,59
10
00
90,6
3516
,418
334.
23-S
tate
Dat
a C
tr12
,425
011
8,19
90
00
118,
199
010
4,92
011
,482
00
011
6,40
214
,222
334.
24-H
uman
Srv
s Te
le5,
302
027
,339
00
027
,339
025
,727
5,15
30
00
30,8
801,
761
334.
26-O
MR
DD
Cop
y C
tr95
80
00
00
00
00
00
00
958
334.
27-In
trusi
on D
etec
188
01,
528
00
01,
528
01,
350
00
00
1,35
036
633
4.28
-Dom
Vio
lenc
e G
r(3
08)
075
00
00
750
075
00
00
075
0(3
08)
334.
29-S
tate
wid
e Tr
ain
70
00
00
00
00
00
00
733
4.30
-Cen
t Tec
h S
vcs.
(47)
03,
000
00
24,0
0027
,000
026
,520
478
00
026
,998
(45)
334.
XX
-Mis
c In
tl S
erv
(117
)0
00
00
00
00
00
00
(117
)33
4.ZV
-Lea
rnin
g M
gmt S
551
02,
060
00
02,
060
02,
021
519
00
02,
540
7134
3.00
-Men
tal H
ygie
ne(3
05)
01,
967
00
482,
015
02,
131
550
00
582,
739
(1,0
29)
347.
00-D
FY V
oc E
duca
tn79
025
00
025
00
00
00
010
439
4.00
-Joi
nt L
abor
-Mgt
2,53
50
2,00
00
00
2,00
00
1,26
244
20
00
1,70
42,
831
395.
04-E
x D
ir In
tl A
ud(1
,749
)0
1,55
00
00
1,55
00
2,49
41,
030
00
03,
524
(3,7
23)
396.
00-H
ealth
Ins
Intr
(9,5
13)
014
,121
00
7,84
321
,964
013
,254
5,30
40
00
18,5
58(6
,107
)39
6.01
-CS
EB
D A
dm R
eim
(2,1
04)
04,
500
00
240
4,74
00
2,60
797
20
00
3,57
9(9
43)
397.
00-C
orr I
ndus
tries
2,42
10
49,0
000
09,
500
58,5
000
48,8
119,
689
00
058
,500
2,42
1
CA
SH C
OM
BIN
ING
STA
TEM
ENT
BY
AC
CO
UN
TIN
TER
NA
L SE
RVI
CES
FY 2
013
(Tho
usan
ds o
f Dol
lars
)
T-244

Fund
O
peni
ng
Mis
c.
Fede
ral
Bon
d
Tran
sfer
s
Tota
l To
tal
Tran
sfer
s
Tota
l C
losi
ng
Acc
ount
Bal
ance
Taxe
s R
ecei
pts
Gra
nts
Proc
eeds
From
Rec
eipt
sLo
cal
Stat
e O
psG
SCs
Deb
t C
apita
l To
Dis
b.B
alan
ce
324.
00-D
FY C
omm
issa
ry19
70
120
00
012
00
120
00
00
120
197
325.
00-S
tate
Fai
r Rec
e2,
538
018
,500
00
018
,500
016
,912
2,71
60
00
19,6
281,
410
326.
00-D
OC
S C
omm
issa
ry3,
184
037
,347
00
037
,347
037
,267
00
00
37,2
673,
264
331.
01-P
ublic
atio
ns16
05
00
05
05
00
00
516
331.
02-D
FY P
rodu
cts
(1)
00
00
00
00
00
00
0(1
)33
1.03
-Agi
ng E
nter
pris
00
20
00
20
20
00
02
033
1.04
-Map
s A
nd D
emog
r14
01
00
01
00
00
00
015
331.
07-D
SS
Trn
g M
atrls
195
024
00
024
00
00
00
021
933
1.21
-Arts
Oxf
ord
Vet
10
10
00
10
10
00
01
133
1.31
-TR
AID
Ser
vice
s10
010
00
010
010
00
00
1010
331.
55-C
onve
ntio
n C
tr41
30
1,17
20
00
1,17
20
684
297
00
098
160
433
1.A
A-D
OC
S E
mpl
Mes
s30
10
1,25
60
00
1,25
60
1,03
514
40
00
1,17
937
833
1.D
D-A
sset
Pre
serv
at38
014
00
014
017
00
00
1735
331.
FM-F
arm
Pro
gram
769
042
20
00
422
042
20
00
042
276
933
1.N
Y-N
Y-A
lert
00
1,00
00
00
1,00
00
1,00
00
00
01,
000
033
1.ZZ
-DD
PC
Pub
Acc
t0
010
00
010
010
00
00
100
351.
00-O
MH
She
lt W
kshs
1,78
70
2,20
00
00
2,20
00
2,20
00
00
02,
200
1,78
735
2.00
-MR
She
l Wrk
shop
989
095
00
00
950
01,
050
00
00
1,05
088
935
3.00
-MH
& M
R C
omm
uni
3,04
80
2,20
00
017
2,21
70
1,56
521
70
023
1,80
53,
460
353.
32-M
R C
omm
unity
St
980
660
00
066
00
552
108
00
066
098
450.
01-IE
A /
Sta
te F
ai(1
)0
00
00
00
00
00
00
(1)
481.
00-U
I B
enef
it Fn
d(1
98,4
97)
3,33
1,00
00
25,0
000
03,
356,
000
03,
356,
000
00
00
3,35
6,00
0(1
98,4
97)
481.
01-In
tere
st A
sses
s54
,184
015
0,00
00
00
150,
000
014
7,00
00
00
014
7,00
057
,184
481.
FS-F
eder
al S
timul
u20
4,54
50
020
0,00
00
020
0,00
00
200,
000
00
00
200,
000
204,
545
CA
SH C
OM
BIN
ING
STA
TEM
ENT
BY
AC
CO
UN
TEN
TER
PRIS
EFY
201
3(T
hous
ands
of D
olla
rs)
T-245

GEN
ERA
L FU
ND
CA
SH T
O A
PPR
OPR
IATI
ON
TA
BLE
NEW
, REA
PPR
OPR
IATI
ON
S A
ND
DEF
ICIE
NC
Y A
PPR
OPR
IATI
ON
SFY
201
1 R
ESU
LTS
(thou
sand
s of
dol
lars
)
Stat
e O
pera
tions
Cas
hA
ppro
pria
tion
Cas
hA
ppro
pria
tion
ECO
NO
MIC
DEV
ELO
PMEN
TA
gric
ultu
re &
Mar
kets
,Dep
artm
ent o
f14
,448
35,5
7927
,737
47,9
31C
onsu
mer
Pro
tect
ion
Boa
rd, S
tate
00
1,93
92,
508
Eco
nom
ic D
evel
opm
ent,D
epar
tmen
t of
316
3,96
217
,616
21,9
41H
ousi
ng a
nd C
omm
unity
Ren
ewal
,Div
isio
n of
39,4
7675
,361
19,4
1323
,930
Insu
ranc
e, S
tate
Dep
artm
ent
11,1
450
138
150
Em
pire
Sta
te D
evel
opm
ent C
orpo
ratio
n29
,209
399,
175
023
,040
Oly
mpi
c R
egio
nal
Dev
elop
men
t Aut
horit
y0
03,
471
5,22
2R
egio
nal
Eco
nom
ic D
evel
opm
ent
09,
475
00
Scie
nce
Tech
nolo
gy a
nd I
nnov
atio
n, F
ound
atio
n (N
YSTA
R)23
,153
224,
912
2,21
22,
851
FU
NC
TIO
NA
L TO
TAL
117,
747
748,
464
72,5
2612
7,57
3
PAR
KS
AN
D T
HE
ENVI
RO
NM
ENT
Adi
rond
ack
Par
k A
genc
y4,
637
5,11
9E
nviro
nmen
tal
Con
serv
atio
n, D
epar
tmen
t of
1,55
812
,293
103,
570
129,
280
Par
ks, R
ecre
atio
n an
d H
isto
ric P
rese
rvat
ion,
Offi
ce o
f2,
404
6,54
412
0,96
513
1,84
9
FUN
CTI
ON
AL
TO
TAL
3,96
218
,837
229,
172
266,
248
TRA
NSP
OR
TATI
ON
Tr
ansp
orta
tion,
Dep
artm
ent o
f96
,005
100,
226
1,85
498
5
FUN
CTI
ON
AL
TO
TAL
96,0
0510
0,22
61,
854
985
HEA
LTH
& S
OC
IAL
WEL
FAR
EA
ging
, Offi
ce fo
r the
10
9,14
212
6,89
71,
676
2,94
8C
hild
ren
& F
amily
Ser
vice
s,O
ffice
of
1,64
0,04
12,
204,
931
265,
274
341,
827
Hea
lth, D
epar
tmen
t of
8,11
5,78
312
,738
,107
189,
601
356,
669
Hum
an R
ight
s, D
ivis
ion
of
00
14,1
6514
,522
Labo
r, D
epar
tmen
t of
8,30
715
,449
250
Med
icai
d In
spec
tor G
ener
al0
024
,095
33,2
74P
reve
ntio
n of
Dom
estic
Vio
lenc
e 66
668
51,
262
1,36
5Te
mpo
rary
and
Dis
abili
ty A
ssis
tanc
e, O
ffice
of
1,19
6,07
31,
307,
136
58,6
0610
3,65
7W
elfa
re In
spec
tor G
ener
al0
032
642
0
FUN
CTI
ON
AL
TO
TAL
11,0
70,0
1216
,393
,205
555,
030
854,
682
Loca
l Ass
ista
nce
T-246

GEN
ERA
L FU
ND
CA
SH T
O A
PPR
OPR
IATI
ON
TA
BLE
NEW
, REA
PPR
OPR
IATI
ON
S A
ND
DEF
ICIE
NC
Y A
PPR
OPR
IATI
ON
SFY
201
1 R
ESU
LTS
(thou
sand
s of
dol
lars
)
Stat
e O
pera
tions
Cas
hA
ppro
pria
tion
Cas
hA
ppro
pria
tion
Loca
l Ass
ista
nce
MEN
TAL
HYG
IEN
EA
lcoh
ol a
nd S
ubst
ance
Abu
se S
ervi
ces,
Offi
ce o
f 14
1,61
914
9,54
70
0M
enta
l Hea
lth, O
ffice
of
538,
058
564,
389
251
800
Peo
ple
with
Dev
elop
men
tal D
isab
ilitie
s, O
ffice
of
1,55
6,55
11,
602,
745
00
Qua
lity
of C
are
for t
he M
enta
lly D
isab
led,
Com
mis
sion
on
229
170
4,20
55,
466
FU
NC
TIO
NA
L T
OTA
L2,
236,
457
2,31
6,85
14,
456
6,26
6
PUB
LIC
PR
OTE
CTI
ON
Cor
rect
iona
l S
ervi
ces,
Dep
artm
ent o
f69
6,14
52,
408,
100
2,51
1,71
3C
orre
ctio
n, C
omm
issi
on o
f0
02,
419
2,97
5C
rimin
al J
ustic
e S
ervi
ces,
Div
isio
n of
11
5,99
122
9,36
056
,161
59,8
45H
omel
and
Sec
urity
17,5
5219
3,30
012
,515
11,9
49Ju
dici
al C
omm
issi
ons
00
4,94
45,
474
Mili
tary
and
Nav
al A
ffairs
, Div
isio
n of
68
477
521
,228
17,1
05P
arol
e, D
ivis
ion
of10
,196
12,0
1616
6,15
216
5,93
1P
roba
tiona
l and
Cor
rect
iona
l A
ltern
ativ
es, D
ivis
ion
of
117
015
0S
tate
Pol
ice,
Div
isio
n of
00
463,
968
475,
225
FU
NC
TIO
NA
L T
OTA
L14
4,60
944
1,59
63,
135,
502
3,25
0,21
7
EDU
CA
TIO
N
Arts
, Cou
ncil
on th
e39
,671
40,7
814,
694
4,83
8C
ity U
nive
rsity
of N
ew Y
ork
1,18
2,51
31,
216,
362
00
Edu
catio
n, D
epar
tmen
t of
20,1
49,0
7118
,363
,813
40,4
4642
,564
Hig
her E
duca
tion
Ser
vice
s C
orpo
ratio
n79
1,50
785
8,72
5(2
,482
)41
,163
Sta
te U
nive
rsity
of N
ew Y
ork
472,
164
503,
803
1,02
9,22
72,
297,
110
FU
NC
TIO
NA
L T
OTA
L22
,634
,926
20,9
83,4
841,
071,
885
2,38
5,67
5
T-247

GEN
ERA
L FU
ND
CA
SH T
O A
PPR
OPR
IATI
ON
TA
BLE
NEW
, REA
PPR
OPR
IATI
ON
S A
ND
DEF
ICIE
NC
Y A
PPR
OPR
IATI
ON
SFY
201
1 R
ESU
LTS
(thou
sand
s of
dol
lars
)
Stat
e O
pera
tions
Cas
hA
ppro
pria
tion
Cas
hA
ppro
pria
tion
Loca
l Ass
ista
nce
GEN
ERA
L G
OVE
RN
MEN
TA
udit
and
Con
trol,
Dep
artm
ent o
f31
,598
32,0
2513
5,59
214
1,45
7B
udge
t, D
ivis
ion
of0
022
,928
34,4
77C
ivil
Ser
vice
, Dep
artm
ent o
f 0
016
,392
18,5
93E
lect
ions
, Sta
te B
oard
of
582
3,90
05,
514
6,13
5E
mpl
oyee
Rel
atio
ns, O
ffice
of
00
3,00
03,
290
Exe
cutiv
e C
ham
ber
00
12,8
8019
,838
Gen
eral
Ser
vice
s, O
ffice
of
00
119,
432
143,
106
Insp
ecto
r Gen
eral
, Offi
ce o
f the
0
05,
633
6,13
8La
w, D
epar
tmen
t of
00
110,
613
112,
641
Lieu
tena
nt G
over
nor,
Offi
ce o
f the
0
030
470
0P
ublic
and
Priv
ate
Em
ploy
ee R
elat
ions
Boa
rd
00
3,66
03,
968
Pub
lic In
tegr
ity, C
omm
issi
on o
n 0
03,
794
4,30
8R
egul
ator
y R
efor
m, G
over
nor's
Offi
ce o
f0
01,
653
2,35
0S
tate
, Dep
artm
ent o
f 6,
963
13,4
9614
,862
21,0
81Ta
xatio
n a
nd F
inan
ce, D
epar
tmen
t of
5,27
012
,325
361,
047
377,
366
Tax
App
eals
, Div
isio
n of
0
03,
134
3,05
3Te
chno
logy
, Offi
ce fo
r88
42,
500
22,0
1830
,558
Vet
eran
Affa
irs,D
ivis
ion
of
6,55
87,
946
6,02
56,
451
FU
NC
TIO
NA
L T
OTA
L51
,855
72,1
9284
8,48
193
5,51
0
ALL
OTH
ER C
ATE
GO
RIE
SJu
dici
ary
4,88
420
,000
1,79
2,79
02,
455,
202
Legi
slat
ure
00
221,
740
217,
845
Loca
l Gov
ernm
ent A
ssis
tanc
e94
5,33
099
9,12
10
0
FUN
CTI
ON
AL
TO
TAL
950,
214
1,01
9,12
12,
014,
530
2,67
3,04
7
NO
TE 1
: C
ash
disb
urse
men
ts c
an v
ary
from
ava
ilabl
e ap
prop
riatio
ns fo
r a p
artic
ular
Fin
anci
al p
lan
cate
gory
due
to in
tra-y
ear t
rans
fers
or s
ubal
loca
tion,
cha
nges
in th
e am
ount
and
tim
ing
of
carr
y-ou
t spe
ndin
g ac
ross
yea
rs, a
nd th
e us
e of
age
ncy
appr
opria
tion
inte
rcha
nge
auth
oriz
atio
n. A
ppro
pria
tion
amou
nts
incl
ude
new
app
ropr
iatio
n au
thor
ity, r
eapp
ropr
iatio
ns, a
nd o
ther
app
ropr
iatio
n am
endm
ents
, but
doe
s no
t inc
lude
car
ry-in
aut
horit
y fro
m p
rior y
ears
whi
ch is
sub
ject
to la
pse.
T-248

GEN
ERA
L FU
ND
CA
SH T
O A
PPR
OPR
IATI
ON
TA
BLE
NEW
, REA
PPR
OPR
IATI
ON
S A
ND
DEF
ICIE
NC
Y A
PPR
OPR
IATI
ON
SFY
201
2 C
UR
REN
T(th
ousa
nds
of d
olla
rs)
Stat
e O
pera
tions
Cas
hA
ppro
pria
tion
Cas
hA
ppro
pria
tion
ECO
NO
MIC
DEV
ELO
PMEN
TA
gric
ultu
re &
Mar
kets
,Dep
artm
ent o
f25
,598
29,3
3826
,514
44,8
40E
cono
mic
Dev
elop
men
t,Dep
artm
ent o
f 50
,303
48,9
0132
,873
37,6
48H
ousi
ng a
nd C
omm
unity
Ren
ewal
,Div
isio
n of
36,4
1558
,684
15,8
1321
,537
Em
pire
Sta
te D
evel
opm
ent C
orpo
ratio
n74
,886
459,
896
00
Oly
mpi
c R
egio
nal
Dev
elop
men
t Aut
horit
y0
03,
005
4,70
0R
egio
nal
Eco
nom
ic D
evel
opm
ent
05,
159
00
Scie
nce
Tech
nolo
gy a
nd I
nnov
atio
n, F
ound
atio
n (N
YSTA
R)0
00
150
FU
NC
TIO
NA
L TO
TAL
187,
202
601,
978
78,2
0510
8,87
5
PAR
KS
AN
D T
HE
ENVI
RO
NM
ENT
Adi
rond
ack
Par
k A
genc
y4,
194
4,60
7E
nviro
nmen
tal
Con
serv
atio
n, D
epar
tmen
t of
4,80
25,
107
91,0
3711
8,71
5P
arks
, Rec
reat
ion
and
His
toric
Pre
serv
atio
n, O
ffice
of
2,85
03,
020
109,
023
119,
461
FU
NC
TIO
NA
L T
OTA
L7,
652
8,12
720
4,25
424
2,78
3
TRA
NSP
OR
TATI
ON
Tr
ansp
orta
tion,
Dep
artm
ent o
f97
,709
97,5
511,
655
0
FUN
CTI
ON
AL
TO
TAL
97,7
0997
,551
1,65
50
HEA
LTH
& S
OC
IAL
WEL
FAR
EA
ging
, Offi
ce fo
r the
10
9,17
212
1,66
12,
135
2,47
4C
hild
ren
& F
amily
Ser
vice
s,O
ffice
of
1,58
3,30
52,
174,
226
238,
140
334,
808
Hea
lth, D
epar
tmen
t of
10,9
25,8
9314
,413
,646
193,
616
279,
615
Hum
an R
ight
s, D
ivis
ion
of
00
11,7
5613
,070
Labo
r, D
epar
tmen
t of
6,92
858
,995
00
Med
icai
d In
spec
tor G
ener
al0
022
,484
29,5
77P
reve
ntio
n of
Dom
estic
Vio
lenc
e 68
568
51,
277
1,36
5Te
mpo
rary
and
Dis
abili
ty A
ssis
tanc
e, O
ffice
of
1,40
2,97
71,
386,
349
37,7
1098
,019
Wel
fare
Insp
ecto
r Gen
eral
00
293
378
FU
NC
TIO
NA
L T
OTA
L14
,028
,960
18,1
55,5
6250
7,41
175
9,30
6
Loca
l Ass
ista
nce
T-249

GEN
ERA
L FU
ND
CA
SH T
O A
PPR
OPR
IATI
ON
TA
BLE
NEW
, REA
PPR
OPR
IATI
ON
S A
ND
DEF
ICIE
NC
Y A
PPR
OPR
IATI
ON
SFY
201
2 C
UR
REN
T(th
ousa
nds
of d
olla
rs)
Stat
e O
pera
tions
Cas
hA
ppro
pria
tion
Cas
hA
ppro
pria
tion
Loca
l Ass
ista
nce
MEN
TAL
HYG
IEN
EA
lcoh
ol a
nd S
ubst
ance
Abu
se S
ervi
ces,
Offi
ce o
f 32
,680
36,8
790
0M
enta
l Hea
lth, O
ffice
of
431,
342
420,
982
800
800
Peo
ple
with
Dev
elop
men
tal D
isab
ilitie
s, O
ffice
of
1,43
5,38
81,
430,
365
00
Qua
lity
of C
are
for P
eopl
e w
ith D
isib
ilitie
s, C
omm
issi
on o
n17
017
03,
784
4,92
2
FUN
CTI
ON
AL
TO
TAL
1,89
9,58
01,
888,
396
4,58
45,
722
PUB
LIC
PR
OTE
CTI
ON
Cor
rect
iona
l S
ervi
ces,
Dep
artm
ent o
f6,
000
13,0
242,
471,
373
2,41
8,61
4C
orre
ctio
n, C
omm
issi
on o
f0
02,
733
2,97
5C
rimin
al J
ustic
e S
ervi
ces,
Div
isio
n of
11
7,00
623
6,18
850
,545
53,8
61H
omel
and
Sec
urity
84,5
0319
3,60
05,
897
10,7
54Ju
dici
al C
omm
issi
ons
00
5,15
05,
452
Mili
tary
and
Nav
al A
ffairs
, Div
isio
n of
72
594
021
,709
15,3
94S
tate
Pol
ice,
Div
isio
n of
00
434,
214
422,
174
FU
NC
TIO
NA
L T
OTA
L20
8,23
444
3,75
22,
991,
621
2,92
9,22
4
EDU
CA
TIO
N
Arts
, Cou
ncil
on th
e31
,635
51,5
434,
425
4,57
4C
ity U
nive
rsity
of N
ew Y
ork
1,20
1,70
31,
208,
362
00
Edu
catio
n, D
epar
tmen
t of
18,4
90,3
2619
,489
,367
43,4
1938
,309
Hig
her E
duca
tion
Ser
vice
s C
orpo
ratio
n90
7,86
196
5,06
60
2,50
0S
tate
Uni
vers
ity o
f New
Yor
k47
7,83
144
5,27
191
7,64
92,
194,
233
FU
NC
TIO
NA
L T
OTA
L21
,109
,356
22,1
59,6
0996
5,49
32,
239,
616
T-250

GEN
ERA
L FU
ND
CA
SH T
O A
PPR
OPR
IATI
ON
TA
BLE
NEW
, REA
PPR
OPR
IATI
ON
S A
ND
DEF
ICIE
NC
Y A
PPR
OPR
IATI
ON
SFY
201
2 C
UR
REN
T(th
ousa
nds
of d
olla
rs)
Stat
e O
pera
tions
Cas
hA
ppro
pria
tion
Cas
hA
ppro
pria
tion
Loca
l Ass
ista
nce
GEN
ERA
L G
OVE
RN
MEN
TA
udit
and
Con
trol,
Dep
artm
ent o
f32
,024
32,0
2512
3,65
612
5,80
1B
udge
t, D
ivis
ion
of0
020
,635
29,0
54C
ivil
Ser
vice
, Dep
artm
ent o
f 0
013
,988
16,7
34E
lect
ions
, Sta
te B
oard
of
300
3,70
05,
176
5,52
1E
mpl
oyee
Rel
atio
ns, O
ffice
of
00
2,70
62,
961
Exe
cutiv
e C
ham
ber
00
13,9
2617
,854
Gen
eral
Ser
vice
s, O
ffice
of
00
116,
352
128,
912
Insp
ecto
r Gen
eral
, Offi
ce o
f the
0
05,
406
5,52
4La
w, D
epar
tmen
t of
00
98,3
7410
1,38
1Li
eute
nant
Gov
erno
r, O
ffice
of t
he
00
630
630
Pub
lic a
nd P
rivat
e E
mpl
oyee
Rel
atio
ns B
oard
0
03,
309
3,57
1P
ublic
Inte
grity
, Com
mis
sion
on
00
3,40
13,
878
Sta
te, D
epar
tmen
t of
4,43
70
15,3
5521
,154
Taxa
tion
and
Fin
ance
, Dep
artm
ent o
f 92
692
631
5,32
031
0,68
2Ta
x A
ppea
ls, D
ivis
ion
of
00
3,05
73,
021
Tech
nolo
gy, O
ffice
for
1,24
51,
530
19,2
9927
,502
Vet
eran
Affa
irs,D
ivis
ion
of
7,27
78,
176
5,31
46,
306
FU
NC
TIO
NA
L T
OTA
L46
,209
46,3
5776
5,90
481
0,48
6
ALL
OTH
ER C
ATE
GO
RIE
SJu
dici
ary
2,44
517
,446
1,73
0,50
02,
352,
332
Legi
slat
ure
00
217,
845
217,
845
Loca
l Gov
ernm
ent A
ssis
tanc
e92
8,36
41,
038,
001
00
FU
NC
TIO
NA
L T
OTA
L93
0,80
91,
055,
447
1,94
8,34
52,
570,
177
NO
TE 1
: C
ash
disb
urse
men
ts c
an v
ary
from
ava
ilabl
e ap
prop
riatio
ns fo
r a p
artic
ular
Fin
anci
al p
lan
cate
gory
due
to in
tra-y
ear t
rans
fers
or s
ubal
loca
tion,
cha
nges
in th
e am
ount
and
tim
ing
of
carr
y-ou
t spe
ndin
g ac
ross
yea
rs, a
nd th
e us
e of
age
ncy
appr
opria
tion
inte
rcha
nge
auth
oriz
atio
n. A
ppro
pria
tion
amou
nts
incl
ude
new
app
ropr
iatio
n au
thor
ity, r
eapp
ropr
iatio
ns, a
nd o
ther
app
ropr
iatio
n am
endm
ents
, but
doe
s no
t inc
lude
car
ry-in
aut
horit
y fro
m p
rior y
ears
whi
ch is
sub
ject
to la
pse.
NO
TE 2
: N
ot re
flect
ed in
this
tabl
e ar
e th
e po
rtion
s of
Loc
al A
ssis
tanc
e ap
prop
riatio
n au
thor
ity e
xten
ded
thro
ugh
2012
-13
for E
duca
tion
and
Hea
lth, w
hich
are
rela
ted
to th
e m
ulti-
year
spe
ndin
g ca
ps fo
r S
choo
l Aid
and
Med
icai
d sp
endi
ng.
Cer
tain
pro
visi
ons
are
incl
uded
in th
e en
acte
d le
gisl
atio
n to
rest
rict s
pend
ing
for t
hese
pro
gram
s.
T-251

GEN
ERA
L FU
ND
CA
SH T
O A
PPR
OPR
IATI
ON
TA
BLE
NEW
, REA
PPR
OPR
IATI
ON
S A
ND
DEF
ICIE
NC
Y A
PPR
OPR
IATI
ON
SFY
201
3 PR
OPO
SED
(thou
sand
s of
dol
lars
)
Stat
e O
pera
tions
Cas
hA
ppro
pria
tion
Cas
hA
ppro
pria
tion
ECO
NO
MIC
DEV
ELO
PMEN
TA
gric
ultu
re &
Mar
kets
,Dep
artm
ent o
f22
,958
37,6
6930
,643
51,2
53E
cono
mic
Dev
elop
men
t,Dep
artm
ent o
f 59
,002
214,
640
20,4
4641
,659
Hou
sing
and
Com
mun
ity R
enew
al,D
ivis
ion
of29
,099
46,7
8615
,047
18,5
79E
mpi
re S
tate
Dev
elop
men
t Cor
pora
tion
85,5
8038
7,29
10
0O
lym
pic
Reg
iona
l D
evel
opm
ent A
utho
rity
00
2,92
94,
583
Reg
iona
l E
cono
mic
Dev
elop
men
t0
5,15
90
0
FUN
CTI
ON
AL
TOTA
L19
6,63
969
1,54
569
,065
116,
074
PAR
KS
AN
D T
HE
ENVI
RO
NM
ENT
Adi
rond
ack
Par
k A
genc
y4,
146
4,50
2E
nviro
nmen
tal
Con
serv
atio
n, D
epar
tmen
t of
4,80
24,
873
84,8
3911
6,97
8P
arks
, Rec
reat
ion
and
His
toric
Pre
serv
atio
n, O
ffice
of
2,85
03,
657
103,
159
116,
494
FU
NC
TIO
NA
L T
OTA
L7,
652
8,53
019
2,14
423
7,97
4
TRA
NSP
OR
TATI
ON
Tr
ansp
orta
tion,
Dep
artm
ent o
f97
,551
97,5
511,
655
0
FUN
CTI
ON
AL
TO
TAL
97,5
5197
,551
1,65
50
HEA
LTH
& S
OC
IAL
WEL
FAR
EA
ging
, Offi
ce fo
r the
11
1,29
512
0,86
01,
736
2,85
1C
hild
ren
& F
amily
Ser
vice
s,O
ffice
of
1,57
2,17
02,
313,
861
290,
953
371,
097
Hea
lth, D
epar
tmen
t of
11,1
23,2
2143
,950
,912
212,
691
262,
799
Hum
an R
ight
s, D
ivis
ion
of
00
10,7
5512
,744
Labo
r, D
epar
tmen
t of
26,6
6734
,762
00
Med
icai
d In
spec
tor G
ener
al0
021
,095
28,4
61P
reve
ntio
n of
Dom
estic
Vio
lenc
e 68
51,
074
1,40
71,
525
Tem
pora
ry a
nd D
isab
ility
Ass
ista
nce,
Offi
ce o
f1,
487,
959
1,76
0,65
820
6,99
924
4,71
2W
elfa
re In
spec
tor G
ener
al0
029
334
9
FUN
CTI
ON
AL
TO
TAL
14,3
21,9
9748
,182
,127
745,
929
924,
538
Loca
l Ass
ista
nce
T-252

GEN
ERA
L FU
ND
CA
SH T
O A
PPR
OPR
IATI
ON
TA
BLE
NEW
, REA
PPR
OPR
IATI
ON
S A
ND
DEF
ICIE
NC
Y A
PPR
OPR
IATI
ON
SFY
201
3 PR
OPO
SED
(thou
sand
s of
dol
lars
)
Stat
e O
pera
tions
Cas
hA
ppro
pria
tion
Cas
hA
ppro
pria
tion
Loca
l Ass
ista
nce
MEN
TAL
HYG
IEN
EA
lcoh
ol a
nd S
ubst
ance
Abu
se S
ervi
ces,
Offi
ce o
f 32
,680
36,8
780
0M
enta
l Hea
lth, O
ffice
of
384,
595
420,
982
800
796
Peo
ple
with
Dev
elop
men
tal D
isab
ilitie
s, O
ffice
of
1,44
8,60
31,
662,
830
00
Qua
lity
of C
are
for P
eopl
e w
ith D
isib
ilitie
s, C
omm
issi
on o
n17
017
04,
657
6,36
6
FUN
CTI
ON
AL
TO
TAL
1,86
6,04
82,
120,
860
5,45
77,
162
PUB
LIC
PR
OTE
CTI
ON
Cor
rect
iona
l S
ervi
ces,
Dep
artm
ent o
f17
,500
26,9
502,
389,
998
2,50
4,18
7C
orre
ctio
n, C
omm
issi
on o
f0
02,
672
2,91
5C
rimin
al J
ustic
e S
ervi
ces,
Div
isio
n of
11
6,00
620
7,83
351
,131
54,5
77H
omel
and
Sec
urity
75,3
4327
6,91
15,
750
5,76
6Ju
dici
al C
omm
issi
ons
00
5,45
25,
452
Mili
tary
and
Nav
al A
ffairs
, Div
isio
n of
85
01,
051
21,5
3123
,382
Sta
te P
olic
e, D
ivis
ion
of0
055
4,59
355
7,93
2
FUN
CTI
ON
AL
TO
TAL
209,
699
512,
745
3,03
1,12
73,
154,
211
EDU
CA
TIO
N
Arts
, Cou
ncil
on th
e31
,635
60,5
224,
320
4,11
9C
ity U
nive
rsity
of N
ew Y
ork
1,27
0,97
61,
295,
977
00
Edu
catio
n, D
epar
tmen
t of
18,8
25,4
5036
,482
,275
42,3
3442
,640
Hig
her E
duca
tion
Ser
vice
s C
orpo
ratio
n91
8,93
399
3,75
70
0S
tate
Uni
vers
ity o
f New
Yor
k43
8,70
143
8,13
057
7,62
91,
362,
456
FU
NC
TIO
NA
L T
OTA
L21
,485
,695
39,2
70,6
6162
4,28
31,
409,
215
T-253

GEN
ERA
L FU
ND
CA
SH T
O A
PPR
OPR
IATI
ON
TA
BLE
NEW
, REA
PPR
OPR
IATI
ON
S A
ND
DEF
ICIE
NC
Y A
PPR
OPR
IATI
ON
SFY
201
3 PR
OPO
SED
(thou
sand
s of
dol
lars
)
Stat
e O
pera
tions
Cas
hA
ppro
pria
tion
Cas
hA
ppro
pria
tion
Loca
l Ass
ista
nce
GEN
ERA
L G
OVE
RN
MEN
TA
udit
and
Con
trol,
Dep
artm
ent o
f32
,024
32,0
2512
3,61
812
5,34
5B
udge
t, D
ivis
ion
of0
021
,550
28,5
62C
ivil
Ser
vice
, Dep
artm
ent o
f 0
013
,575
15,7
10E
lect
ions
, Sta
te B
oard
of
2,70
02,
900
4,94
95,
305
Em
ploy
ee R
elat
ions
, Offi
ce o
f 0
02,
632
2,96
1E
xecu
tive
Cha
mbe
r0
013
,578
17,8
54G
ener
al S
ervi
ces,
Offi
ce o
f 0
013
9,90
514
9,63
2In
spec
tor G
ener
al, O
ffice
of t
he
00
6,52
36,
660
Law
, Dep
artm
ent o
f 0
095
,914
98,8
46Li
eute
nant
Gov
erno
r, O
ffice
of t
he
00
614
630
Pub
lic a
nd P
rivat
e E
mpl
oyee
Rel
atio
ns B
oard
0
03,
340
3,40
9P
ublic
Inte
grity
, Com
mis
sion
on
00
4,01
64,
100
Sta
te, D
epar
tmen
t of
3,33
83,
338
15,3
3321
,070
Taxa
tion
and
Fin
ance
, Dep
artm
ent o
f 92
692
632
3,53
533
0,53
6Ta
x A
ppea
ls, D
ivis
ion
of
00
3,10
13,
121
Tech
nolo
gy, O
ffice
for
00
21,9
9427
,502
Vet
eran
Affa
irs,D
ivis
ion
of
7,33
79,
396
5,46
95,
806
FU
NC
TIO
NA
L T
OTA
L46
,325
48,5
8579
9,64
684
7,04
9
ALL
OTH
ER C
ATE
GO
RIE
SJu
dici
ary
2,50
017
,446
1,74
9,60
02,
340,
024
Legi
slat
ure
00
217,
845
217,
845
Loca
l Gov
ernm
ent A
ssis
tanc
e94
6,42
31,
069,
389
00
FU
NC
TIO
NA
L T
OTA
L94
8,92
31,
086,
835
1,96
7,44
52,
557,
869
NO
TE 1
: C
ash
disb
urse
men
ts c
an v
ary
from
ava
ilabl
e ap
prop
riatio
ns fo
r a p
artic
ular
Fin
anci
al p
lan
cate
gory
due
to in
tra-y
ear t
rans
fers
or s
ubal
loca
tion,
cha
nges
in th
e am
ount
and
tim
ing
of
carr
y-ou
t spe
ndin
g ac
ross
yea
rs, a
nd th
e us
e of
age
ncy
appr
opria
tion
inte
rcha
nge
auth
oriz
atio
n. A
ppro
pria
tion
amou
nts
incl
ude
new
app
ropr
iatio
n au
thor
ity, r
eapp
ropr
iatio
ns, a
nd o
ther
app
ropr
iatio
n am
endm
ents
, but
doe
s no
t inc
lude
car
ry-in
aut
horit
y fro
m p
rior y
ears
whi
ch is
sub
ject
to la
pse.
NO
TE 2
: N
ot re
flect
ed in
this
tabl
e ar
e th
e po
rtion
s of
Loc
al A
ssis
tanc
e ap
prop
riatio
n au
thor
ity e
xten
ded
thro
ugh
2012
-13
for E
duca
tion
and
Hea
lth, w
hich
are
rela
ted
to th
e m
ulti-
year
spe
ndin
g ca
ps fo
r S
choo
l Aid
and
Med
icai
d sp
endi
ng.
Cer
tain
pro
visi
ons
are
incl
uded
in th
e en
acte
d le
gisl
atio
n to
rest
rict s
pend
ing
for t
hese
pro
gram
s.
T-254

Mid-Year Change Current
Revenues:Taxes:
Personal income tax 25,043 (313) 24,730User taxes and fees 8,989 84 9,073Business taxes 6,114 (4) 6,110Other taxes 1,025 160 1,185
Miscellaneous revenues 6,626 284 6,910Federal grants 60 0 60
Total revenues 47,857 211 48,068
Expenditures:Grants to local governments 41,575 (19) 41,556State operations 11,070 222 11,292General State charges 5,468 55 5,523Debt service 0 0 0Capital projects 0 0 0
Total expenditures 58,113 258 58,371
Other financing sources (uses):Transfers from other funds 14,775 102 14,877Transfers to other funds (5,791) (95) (5,886)Proceeds from financing arrangements/ 0 0 advance refundings 374 (22) 352
Net other financing sources (uses) 9,358 (15) 9,343
Operating Surplus/(Deficit) (898) (62) (960)
GAAP FINANCIAL PLAN GENERAL FUND
FY 2012(millions of dollars)
T-255

FY 2013 Proposed
Revenues:Taxes:
Personal income tax 24,730 26,761 2,031User taxes and fees 9,073 9,352 279Business taxes 6,110 5,978 (132)Other taxes 1,185 1,139 (46)
Miscellaneous revenues 6,910 6,942 32Federal grants 60 60 0
Total revenues 48,068 50,232 2,164
Expenditures:Grants to local governments 41,556 42,049 493State operations 11,292 11,865 573General State charges 5,523 5,888 365Debt service 0 0 0Capital projects 0 0 0
Total expenditures 58,371 59,802 1,431
Other financing sources (uses):Transfers from other funds 14,877 15,036 159Transfers to other funds (5,886) (6,058) (172)Proceeds from financing arrangements/ advance refundings 352 377 25
Net other financing sources (uses) 9,343 9,355 12
(Excess) deficiency of revenues and other financing sources over expenditures and other financing uses (960) (215) 745
Accumulated Surplus/(Deficit) (2,969) (3,184) (215)
FY 2012 Current
Annual Change
GAAP FINANCIAL PLAN GENERAL FUND
FY 2012 and FY 2013(millions of dollars)
T-256
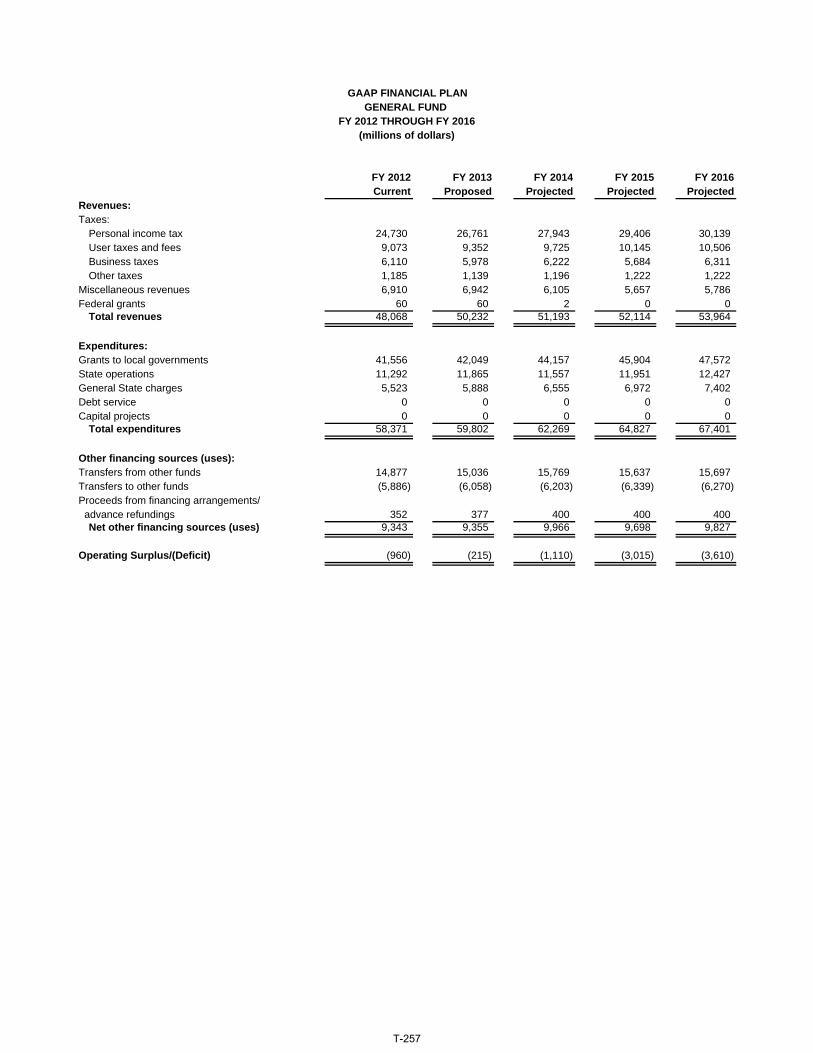
FY 2012 FY 2013 FY 2014 FY 2015 FY 2016Current Proposed Projected Projected Projected
Revenues:Taxes:
Personal income tax 24,730 26,761 27,943 29,406 30,139User taxes and fees 9,073 9,352 9,725 10,145 10,506Business taxes 6,110 5,978 6,222 5,684 6,311Other taxes 1,185 1,139 1,196 1,222 1,222
Miscellaneous revenues 6,910 6,942 6,105 5,657 5,786Federal grants 60 60 2 0 0
Total revenues 48,068 50,232 51,193 52,114 53,964
Expenditures:Grants to local governments 41,556 42,049 44,157 45,904 47,572State operations 11,292 11,865 11,557 11,951 12,427General State charges 5,523 5,888 6,555 6,972 7,402Debt service 0 0 0 0 0Capital projects 0 0 0 0 0
Total expenditures 58,371 59,802 62,269 64,827 67,401
Other financing sources (uses):Transfers from other funds 14,877 15,036 15,769 15,637 15,697Transfers to other funds (5,886) (6,058) (6,203) (6,339) (6,270)Proceeds from financing arrangements/ advance refundings 352 377 400 400 400
Net other financing sources (uses) 9,343 9,355 9,966 9,698 9,827
Operating Surplus/(Deficit) (960) (215) (1,110) (3,015) (3,610)
GAAP FINANCIAL PLAN GENERAL FUND
FY 2012 THROUGH FY 2016(millions of dollars)
T-257

ALL
FU
ND
SFY
201
2(m
illio
ns o
f dol
lars
)
Spec
ial
Cap
ital
Deb
tG
ener
alR
even
uePr
ojec
tsSe
rvic
e(M
EMO
)Fu
ndFu
nds
Fund
sFu
nds
Tota
lR
even
ues:
Taxe
s41
,098
8,31
31,
333
13,0
0063
,744
Pub
lic H
ealth
/Pat
ient
fees
04,
170
045
34,
623
Mis
cella
neou
s re
venu
es
6,91
01,
135
946
109,
001
Fede
ral g
rant
s60
46,4
062,
202
7948
,747
Tota
l rev
enue
s 48
,068
60,0
244,
481
13,5
4212
6,11
5
Expe
nditu
res:
Gra
nts
to lo
cal g
over
nmen
ts
41,5
5656
,323
2,57
20
100,
451
Sta
te o
pera
tions
11
,292
1,76
30
5313
,108
Gen
eral
Sta
te c
harg
es
5,52
337
80
05,
901
Deb
t ser
vice
0
00
4,74
94,
749
Cap
ital p
roje
cts
05
5,77
70
5,78
2To
tal e
xpen
ditu
res
58,3
7158
,469
8,34
94,
802
129,
991
Oth
er fi
nanc
ing
sour
ces
(use
s):
Tran
sfer
s fro
m o
ther
fund
s 14
,877
2,31
41,
005
6,50
524
,701
Tran
sfer
s to
oth
er fu
nds
(5,8
86)
(3,8
04)
(1,4
39)
(15,
213)
(26,
342)
Pro
ceed
s of
gen
eral
obl
igat
ion
bond
s0
047
50
475
Pro
ceed
s fro
m fi
nanc
ing
arra
ngem
ents
/ a
dvan
ce re
fund
ings
352
03,
650
04,
002
Net
oth
er fi
nanc
ing
sour
ces
(use
s)9,
343
(1,4
90)
3,69
1(8
,708
)2,
836
Ope
ratin
g Su
rplu
s/(D
efic
it)(9
60)
65(1
77)
32(1
,040
)
GA
AP
FIN
AN
CIA
L PL
AN
T-258

ALL
FU
ND
SFY
201
3(m
illio
ns o
f dol
lars
)
Spec
ial
Cap
ital
Deb
tG
ener
alR
even
uePr
ojec
tsSe
rvic
e(M
EMO
)Fu
ndFu
nds
Fund
sFu
nds
Tota
lR
even
ues:
Taxe
s43
,230
8,25
21,
401
13,5
1566
,398
Pub
lic H
ealth
/Pat
ient
fees
04,
807
047
95,
286
Mis
cella
neou
s re
venu
es
6,94
21,
055
980
118,
988
Fede
ral g
rant
s60
44,7
462,
085
7946
,970
Tota
l rev
enue
s 50
,232
58,8
604,
466
14,0
8412
7,64
2
Expe
nditu
res:
Gra
nts
to lo
cal g
over
nmen
ts
42,0
4955
,546
2,00
30
99,5
98S
tate
ope
ratio
ns
11,8
651,
562
037
13,4
64G
ener
al S
tate
cha
rges
5,
888
413
00
6,30
1D
ebt s
ervi
ce
00
04,
992
4,99
2C
apita
l pro
ject
s0
56,
133
06,
138
Tota
l exp
endi
ture
s 59
,802
57,5
268,
136
5,02
913
0,49
3
Oth
er fi
nanc
ing
sour
ces
(use
s):
Tran
sfer
s fro
m o
ther
fund
s 15
,036
2,79
91,
305
6,29
525
,435
Tran
sfer
s to
oth
er fu
nds
(6,0
58)
(3,7
35)
(1,4
96)
(15,
350)
(26,
639)
Pro
ceed
s of
gen
eral
obl
igat
ion
bond
s0
040
00
400
Pro
ceed
s fro
m fi
nanc
ing
arra
ngem
ents
/ a
dvan
ce re
fund
ings
377
03,
611
03,
988
Net
oth
er fi
nanc
ing
sour
ces
(use
s)9,
355
(936
)3,
820
(9,0
55)
3,18
4
Ope
ratin
g Su
rplu
s/(D
efic
it)(2
15)
398
150
033
3
GA
AP
FIN
AN
CIA
L PL
AN
T-259

Fede
ral
Gen
eral
Oth
erG
ener
alSp
ecia
lO
blig
atio
nG
over
nmen
tal
Fund
Rev
enue
Deb
t Ser
vice
Fund
sEl
imin
atio
nsTo
tal
Rev
enue
s:Ta
xes:
Per
sona
l inc
ome
tax
24,7
300
9,76
53,
194
037
,689
Use
r tax
es a
nd fe
es9,
073
00
5,58
00
14,6
53B
usin
ess
taxe
s6,
110
00
2,05
50
8,16
5O
ther
taxe
s1,
185
00
2,05
20
3,23
7P
ublic
Hea
lth/P
atie
nt fe
es0
00
4,62
30
4,62
3M
isce
llane
ous
rece
ipts
6,91
013
20
1,95
90
9,00
1Fe
dera
l gra
nts
6046
,405
792,
203
048
,747
Tota
l rev
enue
s48
,068
46,5
379,
844
21,6
660
126,
115
Expe
nditu
res:
Gra
nts
to lo
cal g
over
nmen
ts
41,5
5640
,872
018
,023
010
0,45
1S
tate
ope
ratio
ns11
,292
1,26
938
509
013
,108
Gen
eral
Sta
te c
harg
es5,
523
283
095
05,
901
Deb
t ser
vice
00
4,01
773
20
4,74
9C
apita
l pro
ject
s0
00
5,78
20
5,78
2To
tal e
xpen
ditu
res
58,3
7142
,424
4,05
525
,141
012
9,99
1
Oth
er fi
nanc
ing
sour
ces
(use
s):
Tran
sfer
s fro
m o
ther
fund
s14
,877
03,
418
6,40
6(1
9,73
1)4,
970
Tran
sfer
s to
oth
er fu
nds
(5,8
86)
(4,1
13)
(9,1
27)
(7,2
16)
19,7
31(6
,611
)P
roce
eds
of G
ener
al o
blig
atio
n bo
nds
00
047
50
475
Pro
ceed
s fro
m fi
nanc
ing
arra
ngem
ents
/ a
dvan
ce re
fund
ings
352
00
3,65
00
4,00
2N
et o
ther
fina
ncin
g so
urce
s (u
ses)
9,34
3(4
,113
)(5
,709
)3,
315
02,
836
Ope
ratin
g Su
rplu
s/(D
efic
it)(9
60)
080
(160
)0
(1,0
40)
GA
AP
FIN
AN
CIA
L PL
AN
(mill
ions
of d
olla
rs)
Maj
or F
unds
ALL
FU
ND
SFY
201
2
T-260

Fede
ral
Gen
eral
Oth
erG
ener
alSp
ecia
lO
blig
atio
nG
over
nmen
tal
Fund
Rev
enue
Deb
t Ser
vice
Fund
sEl
imin
atio
nsTo
tal
Rev
enue
s:Ta
xes:
Per
sona
l inc
ome
tax
26,7
610
10,0
783,
322
040
,161
Use
r tax
es a
nd fe
es9,
352
00
5,74
20
15,0
94B
usin
ess
taxe
s5,
978
00
2,17
60
8,15
4O
ther
taxe
s1,
139
00
1,85
00
2,98
9P
ublic
Hea
lth/P
atie
nt fe
es0
00
5,28
60
5,28
6M
isce
llane
ous
rece
ipts
6,94
213
10
1,91
50
8,98
8Fe
dera
l gra
nts
6044
,516
792,
315
046
,970
Tota
l rev
enue
s50
,232
44,6
4710
,157
22,6
060
127,
642
Expe
nditu
res:
Gra
nts
to lo
cal g
over
nmen
ts
42,0
4939
,293
018
,256
099
,598
Sta
te o
pera
tions
11,8
651,
156
2441
90
13,4
64G
ener
al S
tate
cha
rges
5,88
830
00
113
06,
301
Deb
t ser
vice
00
4,23
076
20
4,99
2C
apita
l pro
ject
s0
00
6,13
80
6,13
8To
tal e
xpen
ditu
res
59,8
0240
,749
4,25
425
,688
013
0,49
3
Oth
er fi
nanc
ing
sour
ces
(use
s):
Tran
sfer
s fro
m o
ther
fund
s15
,036
03,
436
6,96
3(2
0,31
2)5,
123
Tran
sfer
s to
oth
er fu
nds
(6,0
58)
(3,8
98)
(9,3
39)
(7,3
44)
20,3
12(6
,327
)P
roce
eds
of G
ener
al o
blig
atio
n bo
nds
00
040
00
400
Pro
ceed
s fro
m fi
nanc
ing
arra
ngem
ents
/ a
dvan
ce re
fund
ings
377
00
3,61
10
3,98
8N
et o
ther
fina
ncin
g so
urce
s (u
ses)
9,35
5(3
,898
)(5
,903
)3,
630
03,
184
Ope
ratin
g Su
rplu
s/(D
efic
it)(2
15)
00
548
033
3
GA
AP
FIN
AN
CIA
L PL
AN
(mill
ions
of d
olla
rs)
Maj
or F
unds
ALL
FU
ND
SFY
201
3
T-261

001
003
007
166
013
008
323
325
326
331
Rec
eipt
s:P
erso
nal i
ncom
e ta
x0
24,7
300
00
00
00
0U
ser t
axes
and
fees
09,
073
00
00
00
00
Bus
ines
s ta
xes
06,
110
00
00
00
00
Oth
er ta
xes
01,
185
00
00
00
00
Mis
cella
neou
s re
ceip
ts0
3,15
90
700
00
279
1837
4Fe
dera
l gra
nts
060
00
00
00
00
T
otal
rece
ipts
044
,317
070
00
027
918
374
Dis
burs
emen
ts:
Gra
nts
to lo
cal g
over
nmen
ts38
,159
085
00
00
00
0S
tate
ope
ratio
ns0
6,96
50
500
017
017
374
Gen
eral
Sta
te c
harg
es0
3,39
40
650
00
182
00
Deb
t ser
vice
00
00
00
00
00
Cap
ital p
roje
cts
00
00
00
00
00
T
otal
dis
burs
emen
ts38
,159
10,3
5985
700
00
188
1937
4
Oth
er fi
nanc
ing
sour
ces
(use
s):
Tran
sfer
s fro
m o
ther
fund
s0
11,8
310
00
100
00
00
Tran
sfer
s to
oth
er fu
nds
(4,3
01)
(4,5
60)
00
00
(91)
00
0P
roce
eds
from
fina
ncin
g ar
rang
emen
ts/a
dvan
ce re
fund
ings
352
00
00
00
00
0
Net
oth
er fi
nanc
ing
sour
ces
(use
s)(3
,949
)7,
271
00
010
0(9
1)0
00
Ope
ratin
g Su
rplu
s/(D
efic
it)(4
2,10
8)41
,229
(85)
00
100
0(1
)0
0
GA
AP
CO
MB
ININ
G S
TATE
MEN
T G
ENER
AL
FUN
D
(mill
ions
of d
olla
rs)
FY 2
012
T-262
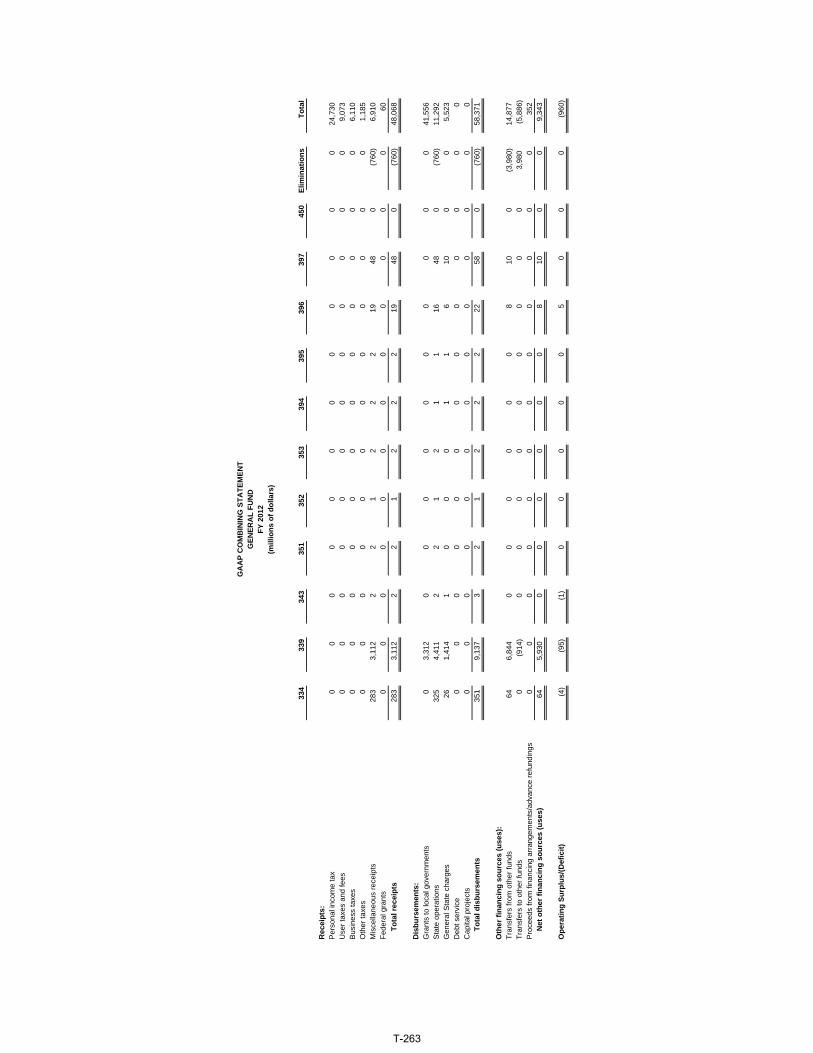
334
339
343
351
352
353
394
395
396
397
450
Elim
inat
ions
Tota
l
Rec
eipt
s:P
erso
nal i
ncom
e ta
x0
00
00
00
00
00
024
,730
Use
r tax
es a
nd fe
es0
00
00
00
00
00
09,
073
Bus
ines
s ta
xes
00
00
00
00
00
00
6,11
0O
ther
taxe
s0
00
00
00
00
00
01,
185
Mis
cella
neou
s re
ceip
ts28
33,
112
22
12
22
1948
0(7
60)
6,91
0Fe
dera
l gra
nts
00
00
00
00
00
00
60
Tot
al re
ceip
ts28
33,
112
22
12
22
1948
0(7
60)
48,0
68
Dis
burs
emen
ts:
Gra
nts
to lo
cal g
over
nmen
ts0
3,31
20
00
00
00
00
041
,556
Sta
te o
pera
tions
325
4,41
12
21
21
116
480
(760
)11
,292
Gen
eral
Sta
te c
harg
es26
1,41
41
00
01
16
100
05,
523
Deb
t ser
vice
00
00
00
00
00
00
0C
apita
l pro
ject
s0
00
00
00
00
00
00
T
otal
dis
burs
emen
ts35
19,
137
32
12
22
2258
0(7
60)
58,3
71
Oth
er fi
nanc
ing
sour
ces
(use
s):
Tran
sfer
s fro
m o
ther
fund
s64
6,84
40
00
00
08
100
(3,9
80)
14,8
77Tr
ansf
ers
to o
ther
fund
s0
(914
)0
00
00
00
00
3,98
0(5
,886
)P
roce
eds
from
fina
ncin
g ar
rang
emen
ts/a
dvan
ce re
fund
ings
00
00
00
00
00
00
352
N
et o
ther
fina
ncin
g so
urce
s (u
ses)
645,
930
00
00
00
810
00
9,34
3
Ope
ratin
g Su
rplu
s/(D
efic
it)(4
)(9
5)(1
)0
00
00
50
00
(960
)
GA
AP
CO
MB
ININ
G S
TATE
MEN
TG
ENER
AL
FUN
D
(mill
ions
of d
olla
rs)
FY 2
012
T-263

001
003
007
166
013
008
323
325
326
331
Rec
eipt
s:P
erso
nal i
ncom
e ta
x0
26,7
610
00
00
00
0U
ser t
axes
and
fees
09,
352
00
00
00
00
Bus
ines
s ta
xes
05,
978
00
00
00
00
Oth
er ta
xes
01,
139
00
00
00
00
Mis
cella
neou
s re
ceip
ts0
2,98
50
700
00
792
1837
4Fe
dera
l gra
nts
060
00
00
00
00
T
otal
rece
ipts
046
,275
070
00
079
218
374
Dis
burs
emen
ts:
Gra
nts
to lo
cal g
over
nmen
ts38
,858
051
00
00
00
0S
tate
ope
ratio
ns0
7,31
70
500
067
417
374
Gen
eral
Sta
te c
harg
es0
3,63
20
650
00
172
00
Deb
t ser
vice
00
00
00
00
00
Cap
ital p
roje
cts
00
00
00
00
00
T
otal
dis
burs
emen
ts38
,858
10,9
4951
700
00
691
1937
4
Oth
er fi
nanc
ing
sour
ces
(use
s):
Tran
sfer
s fro
m o
ther
fund
s0
12,1
390
00
00
00
0Tr
ansf
ers
to o
ther
fund
s(4
,329
)(4
,804
)0
00
0(8
9)0
00
Pro
ceed
s fro
m fi
nanc
ing
arra
ngem
ents
/adv
ance
refu
ndin
gs37
70
00
00
00
00
N
et o
ther
fina
ncin
g so
urce
s (u
ses)
(3,9
52)
7,33
50
00
0(8
9)0
00
Ope
ratin
g Su
rplu
s/(D
efic
it)(4
2,81
0)42
,661
(51)
00
012
(1)
00
GA
AP
CO
MB
ININ
G S
TATE
MEN
T G
ENER
AL
FUN
D
(mill
ions
of d
olla
rs)
FY 2
013
T-264

334
339
343
351
352
353
394
395
396
397
450
Elim
inat
ions
Tota
l
Rec
eipt
s:P
erso
nal i
ncom
e ta
x0
00
00
00
00
00
026
,761
Use
r tax
es a
nd fe
es0
00
00
00
00
00
09,
352
Bus
ines
s ta
xes
00
00
00
00
00
00
5,97
8O
ther
taxe
s0
00
00
00
00
00
01,
139
Mis
cella
neou
s re
ceip
ts28
72,
801
22
12
21
1949
0(7
60)
6,94
2Fe
dera
l gra
nts
00
00
00
00
00
00
60
Tot
al re
ceip
ts28
72,
801
22
12
21
1949
0(7
60)
50,2
32
Dis
burs
emen
ts:
Gra
nts
to lo
cal g
over
nmen
ts0
3,14
00
00
00
00
00
042
,049
Sta
te o
pera
tions
343
4,10
82
21
21
216
490
(760
)11
,865
Gen
eral
Sta
te c
harg
es29
1,53
91
00
01
16
100
05,
888
Deb
t ser
vice
00
00
00
00
00
00
0C
apita
l pro
ject
s0
00
00
00
00
00
00
T
otal
dis
burs
emen
ts37
28,
787
32
12
23
2259
0(7
60)
59,8
02
Oth
er fi
nanc
ing
sour
ces
(use
s):
Tran
sfer
s fro
m o
ther
fund
s81
6,53
70
00
00
08
100
(3,7
39)
15,0
36Tr
ansf
ers
to o
ther
fund
s0
(575
)0
00
00
00
00
3,73
9(6
,058
)P
roce
eds
from
fina
ncin
g ar
rang
emen
ts/a
dvan
ce re
fund
ings
00
00
00
00
00
00
377
N
et o
ther
fina
ncin
g so
urce
s (u
ses)
815,
962
00
00
00
810
00
9,35
5
Ope
ratin
g Su
rplu
s/(D
efic
it)(4
)(2
4)(1
)0
00
0(2
)5
00
0(2
15)
GA
AP
CO
MB
ININ
G S
TATE
MEN
TG
ENER
AL
FUN
D
(mill
ions
of d
olla
rs)
FY 2
013
T-265

(mill
ions
of d
olla
rs)
Pers
pect
ive
Entit
yD
iffer
ence
Diff
eren
ceC
ash
Spec
ial
Cas
hC
hang
esG
AA
PFi
nanc
ial
Rev
enue
Oth
erB
asis
inEl
imin
-In
traf
und
Rec
lass
-Fi
nanc
ial
Plan
Fund
sFu
nds
Subt
otal
Acc
rual
sat
ions
Elim
inat
ions
ifica
tion
Plan
Rec
eipt
s/R
even
ues:
Taxe
s:P
erso
nal i
ncom
e ta
x 25
,705
00
25,7
05(9
75)
00
024
,730
Use
r tax
es a
nd fe
es
9,13
50
09,
135
(62)
00
09,
073
Bus
ines
s ta
xes
5,86
80
05,
868
242
00
06,
110
Oth
er ta
xes
1,21
20
01,
212
(27)
00
01,
185
Mis
cella
neou
s re
ceip
ts3,
244
3,13
969
97,
082
055
5(7
60)
336,
910
Fede
ral G
rant
s60
00
600
00
060
Tota
l rec
eipt
s/re
venu
es45
,224
3,13
969
949
,062
(822
)55
5(7
60)
3348
,068
Dis
burs
emen
ts/e
xpen
ditu
res:
Gra
nts
to lo
cal g
over
nmen
ts
38,5
153,
312
041
,827
613
00
(884
)41
,556
Sta
te o
pera
tions
7,
565
4,68
862
912
,882
51(3
9)(7
60)
(842
)11
,292
Gen
eral
Sta
te c
harg
es
4,70
71,
421
656,
193
2259
40
(1,2
86)
5,52
3D
ebt s
ervi
ce
00
00
00
00
0C
apita
l pro
ject
s0
00
00
00
00
Tota
l dis
burs
emen
ts/e
xpen
ditu
res
50,7
879,
421
694
60,9
0268
655
5(7
60)
(3,0
12)
58,3
71
Oth
er fi
nanc
ing
sour
ces
(use
s):
Tran
sfer
s fro
m o
ther
fund
s 11
,990
7,10
682
19,1
780
(3,9
80)
0(3
21)
14,8
77Tr
ansf
ers
to o
ther
fund
s (6
,128
)(9
17)
(92)
(7,1
37)
(5)
3,98
00
(2,7
24)
(5,8
86)
Pro
ceed
s fro
m fi
nanc
ing
arra
ngem
ents
/ a
dvan
ce re
fund
ings
00
00
352
00
035
2N
et o
ther
fina
ncin
g so
urce
s (u
ses)
5,86
26,
189
(10)
12,0
4134
70
0(3
,045
)9,
343
Exce
ss (d
efic
ienc
y) o
f rev
enue
s a
nd o
ther
fina
ncin
g so
urce
s o
ver e
xpen
ditu
res
and
othe
r f
inan
cing
use
s29
9(9
3)(5
)20
1(1
,161
)0
00
(960
)
(Incr
ease
)/dec
reas
e in
rese
rves
(299
)0
0(2
99)
299
00
00
Ope
ratin
g Su
rplu
s/(D
efic
it)0
(93)
(5)
(98)
(862
)0
00
(960
)
CA
SH T
O G
AA
P C
ON
VER
SIO
N T
AB
LEG
ENER
AL
FUN
DFY
201
2
T-266

Estim
ated
Cas
hC
UN
YSU
NY
MSS
RF
LOTT
ERY
Food
R
ecla
ssR
ecla
ssIn
terf
und
Syst
emEs
timat
ed G
AA
PD
isbu
rsem
ents
(Fun
d 37
7) (
Fund
345
) (F
und
339)
(Fun
d 16
0)St
amps
Publ
ic H
ealth
SUN
YA
ctiv
ityA
ccru
als
Expe
nditu
res
Rec
eipt
s/R
even
ues:
Tax
es8,
303
00
00
00
00
108,
313
Mis
cella
neou
s re
ceip
ts15
,279
(152
)(3
,768
)(3
,139
)(2
,934
)0
(4,1
70)
00
191,
135
Pub
lic H
ealth
00
00
00
4,17
00
00
4,17
0 F
eder
al G
rant
s41
,601
00
00
5,33
90
(324
)0
(210
)46
,406
T
otal
rece
ipts
/reve
nues
65,1
83(1
52)
(3,7
68)
(3,1
39)
(2,9
34)
5,33
90
(324
)0
(181
)60
,024
Dis
burs
emen
ts/e
xpen
ditu
res:
Gra
nts
to lo
cal g
over
nmen
ts
54,7
430
0(3
,311
)(4
6)5,
339
00
0(4
02)
56,3
23 S
tate
ope
ratio
ns
11,0
63(1
37)
(3,9
50)
(4,6
88)
(163
)0
0(3
13)
0(4
9)1,
763
Gen
eral
Sta
te c
harg
es
2,12
60
(301
)(1
,421
)(1
1)0
00
0(1
5)37
8 C
apita
l pro
ject
s5
00
00
00
00
05
T
otal
dis
burs
emen
ts/e
xpen
ditu
res
67,9
37(1
37)
(4,2
51)
(9,4
20)
(220
)5,
339
0(3
13)
0(4
66)
58,4
69
Oth
er fi
nanc
ing
sour
ces
(use
s):
Tr
ansf
ers
from
oth
er fu
nds
7,25
20
(589
)(7
,105
)2,
700
00
056
02,
314
Tr
ansf
ers
to o
ther
fund
s (4
,738
)0
6291
70
00
11(5
6)0
(3,8
04)
N
et o
ther
fina
ncin
g so
urce
s (u
ses)
2,51
40
(527
)(6
,188
)2,
700
00
110
0(1
,490
)
Ope
ratin
g Su
rplu
s/(D
efic
it)(2
40)
(15)
(44)
93(1
4)0
00
028
565
(mill
ions
of d
olla
rs)
CA
SH T
O G
AA
P C
ON
VER
SIO
N T
AB
LESP
ECIA
L R
EVEN
UE
FUN
DS
FY 2
012
T-267

Estim
ated
Cas
h S
UN
Y R
ehab
SUN
Y C
apita
l S
UN
Y/C
UN
YA
ppro
pria
ted
Off-
Bud
get
Rec
lass
Syst
emEs
timat
ed G
AA
PD
isbu
rsem
ents
(Fu
nd 0
74)
(Fun
d 38
4) (F
und
002)
Loan
sC
apita
lPr
ocee
dsA
ccru
als
Expe
nditu
res
Rec
eipt
s/R
even
ues:
Tax
es1,
333
00
00
00
01,
333
Mis
cella
neou
s re
ceip
ts4,
360
0(7
0)(9
15)
(13)
0(2
,490
)74
946
Fed
eral
Gra
nts
2,20
20
00
00
00
2,20
2
Tot
al re
ceip
ts/re
venu
es7,
895
0(7
0)(9
15)
(13)
0(2
,490
)74
4,48
1
Dis
burs
emen
ts/e
xpen
ditu
res:
Gra
nts
to lo
cal g
over
nmen
ts
2,56
40
00
00
82,
572
Cap
ital p
roje
cts
5,51
4(4
5)(7
0)(9
52)
(13)
1,18
00
163
5,77
7
T
otal
dis
burs
emen
ts/e
xpen
ditu
res
8,07
8(4
5)(7
0)(9
52)
(13)
1,18
00
171
8,34
9
Oth
er fi
nanc
ing
sour
ces
(use
s):
Tr
ansf
ers
from
oth
er fu
nds
1,05
0(4
5)0
00
00
01,
005
Tr
ansf
ers
to o
ther
fund
s (1
,439
)0
00
00
00
(1,4
39)
Pro
ceed
s of
GO
Bon
ds47
50
00
00
00
475
Pro
ceed
s fro
m F
inan
cing
Arr
aang
emen
ts/
A
dvan
ce R
efun
ding
s0
00
00
1,16
02,
490
03,
650
N
et o
ther
fina
ncin
g so
urce
s (u
ses)
86(4
5)0
00
1,16
02,
490
03,
691
Ope
ratin
g Su
rplu
s/(D
efic
it)(9
7)0
037
0(2
0)0
(97)
(177
)
(mill
ions
of d
olla
rs)
CA
SH T
O G
AA
P C
ON
VER
SIO
N T
AB
LEC
API
TAL
PRO
JEC
TS F
UN
DFY
201
2
T-268
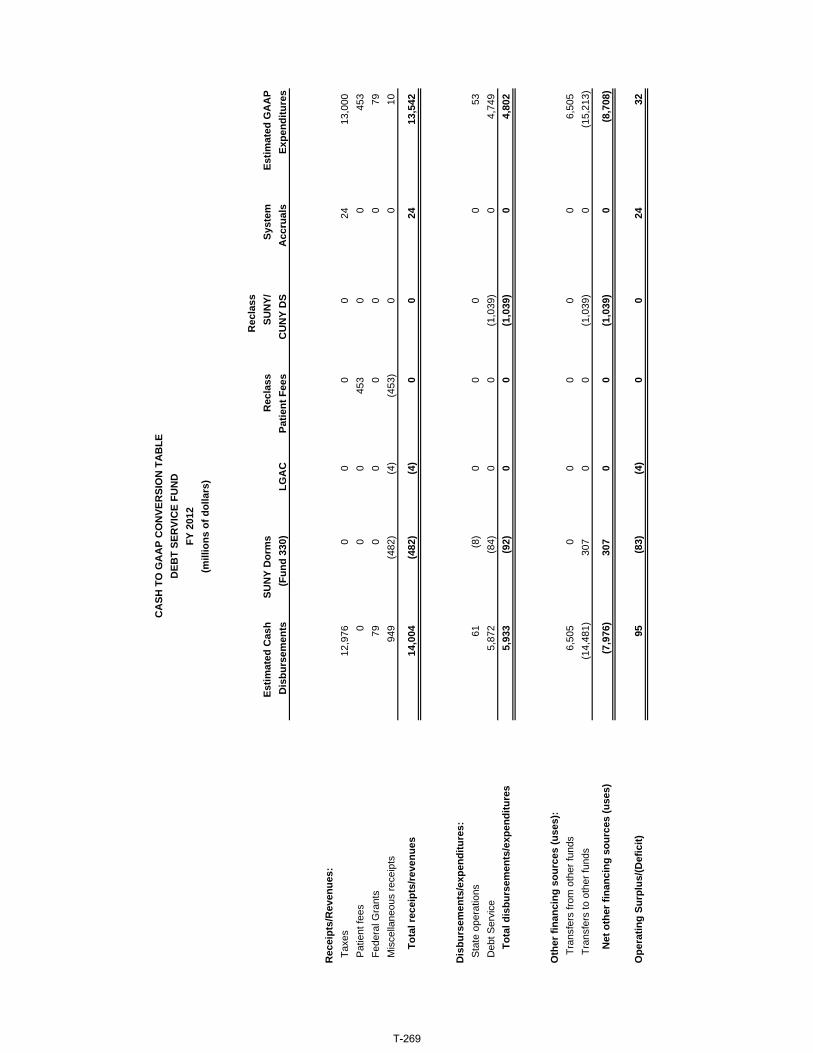
Rec
lass
Estim
ated
Cas
h S
UN
Y D
orm
sR
ecla
ssSU
NY/
Syst
emEs
timat
ed G
AA
PD
isbu
rsem
ents
(Fun
d 33
0)
LG
AC
Patie
nt F
ees
CU
NY
DS
Acc
rual
sEx
pend
iture
s
Rec
eipt
s/R
even
ues:
Tax
es12
,976
00
00
2413
,000
Pat
ient
fees
00
045
30
045
3 F
eder
al G
rant
s79
00
00
079
Mis
cella
neou
s re
ceip
ts94
9(4
82)
(4)
(453
)0
010
T
otal
rece
ipts
/reve
nues
14,0
04(4
82)
(4)
00
2413
,542
Dis
burs
emen
ts/e
xpen
ditu
res:
Sta
te o
pera
tions
61
(8)
00
00
53 D
ebt S
ervi
ce5,
872
(84)
00
(1,0
39)
04,
749
T
otal
dis
burs
emen
ts/e
xpen
ditu
res
5,93
3(9
2)0
0(1
,039
)0
4,80
2
Oth
er fi
nanc
ing
sour
ces
(use
s):
Tr
ansf
ers
from
oth
er fu
nds
6,50
50
00
00
6,50
5
Tran
sfer
s to
oth
er fu
nds
(14,
481)
307
00
(1,0
39)
0(1
5,21
3)
N
et o
ther
fina
ncin
g so
urce
s (u
ses)
(7,9
76)
307
00
(1,0
39)
0(8
,708
)
Ope
ratin
g Su
rplu
s/(D
efic
it)95
(83)
(4)
00
2432
(mill
ions
of d
olla
rs)
CA
SH T
O G
AA
P C
ON
VER
SIO
N T
AB
LED
EBT
SER
VIC
E FU
ND
FY 2
012
T-269

(mill
ions
of d
olla
rs)
Pers
pect
ive
Entit
yD
iffer
ence
Diff
eren
ceC
ash
Spec
ial
Cas
hC
hang
esG
AA
PFi
nanc
ial
Rev
enue
Oth
erB
asis
inEl
imin
-In
traf
und
Rec
lass
-Fi
nanc
ial
Plan
Fund
sFu
nds
Subt
otal
Acc
rual
sat
ions
Elim
inat
ions
ifica
tion
Plan
Rec
eipt
s/R
even
ues:
Taxe
s:P
erso
nal i
ncom
e ta
x 26
,911
00
26,9
11(1
50)
00
026
,761
Use
r tax
es a
nd fe
es
9,34
10
09,
341
110
00
9,35
2B
usin
ess
taxe
s 5,
977
00
5,97
71
00
05,
978
Oth
er ta
xes
1,14
40
01,
144
(5)
00
01,
139
Mis
cella
neou
s re
ceip
ts3,
069
2,80
11,
218
7,08
80
555
(760
)59
6,94
2Fe
dera
l Gra
nts
600
060
00
00
60To
tal r
ecei
pts/
reve
nues
46,5
022,
801
1,21
850
,521
(143
)55
5(7
60)
5950
,232
Dis
burs
emen
ts/e
xpen
ditu
res:
Gra
nts
to lo
cal g
over
nmen
ts
39,4
033,
140
042
,543
521
00
(1,0
15)
42,0
49S
tate
ope
ratio
ns
7,58
84,
368
1,15
013
,106
45(3
9)(7
60)
(487
)11
,865
Gen
eral
Sta
te c
harg
es
4,43
41,
539
686,
041
(9)
594
0(7
38)
5,88
8D
ebt s
ervi
ce
00
00
00
00
0C
apita
l pro
ject
s0
00
00
00
00
Tota
l dis
burs
emen
ts/e
xpen
ditu
res
51,4
259,
047
1,21
861
,690
557
555
(760
)(2
,240
)59
,802
Oth
er fi
nanc
ing
sour
ces
(use
s):
Tran
sfer
s fro
m o
ther
fund
s 12
,213
6,79
099
19,1
020
(3,7
39)
0(3
27)
15,0
36Tr
ansf
ers
to o
ther
fund
s (7
,167
)(5
64)
(89)
(7,8
20)
(5)
3,73
90
(1,9
72)
(6,0
58)
Pro
ceed
s fro
m fi
nanc
ing
arra
ngem
ents
/ a
dvan
ce re
fund
ings
00
00
377
00
037
7N
et o
ther
fina
ncin
g so
urce
s (u
ses)
5,04
66,
226
1011
,282
372
00
(2,2
99)
9,35
5
Exce
ss (d
efic
ienc
y) o
f rev
enue
s a
nd o
ther
fina
ncin
g so
urce
s o
ver e
xpen
ditu
res
and
othe
r f
inan
cing
use
s12
3(2
0)10
113
(328
)0
00
(215
)
(Incr
ease
)/dec
reas
e in
rese
rves
(123
)0
0(1
23)
123
00
00
Ope
ratin
g Su
rplu
s/(D
efic
it)0
(20)
10(1
0)(2
05)
00
0(2
15)
CA
SH T
O G
AA
P C
ON
VER
SIO
N T
AB
LEG
ENER
AL
FUN
DFY
201
3
T-270

Estim
ated
Cas
hC
UN
YSU
NY
MSS
RF
LOTT
ERY
Food
R
ecla
ssR
ecla
ssIn
terf
und
Syst
emEs
timat
ed G
AA
PD
isbu
rsem
ents
(Fun
d 37
7) (
Fund
345
) (F
und
339)
(Fun
d 16
0)St
amps
Publ
ic H
ealth
SUN
YA
ctiv
ityA
ccru
als
Expe
nditu
res
Rec
eipt
s/R
even
ues:
Tax
es8,
247
00
00
00
00
58,
252
Mis
cella
neou
s re
ceip
ts16
,085
(163
)(4
,059
)(2
,816
)(3
,185
)0
(4,8
07)
00
01,
055
Pub
lic H
ealth
00
00
00
4,80
70
00
4,80
7 F
eder
al G
rant
s39
,712
00
00
5,33
90
(324
)0
1944
,746
T
otal
rece
ipts
/reve
nues
64,0
44(1
63)
(4,0
59)
(2,8
16)
(3,1
85)
5,33
90
(324
)0
2458
,860
Dis
burs
emen
ts/e
xpen
ditu
res:
Gra
nts
to lo
cal g
over
nmen
ts
53,7
870
0(3
,140
)(2
15)
5,33
90
00
(225
)55
,546
Sta
te o
pera
tions
10
,985
(120
)(4
,440
)(4
,368
)(1
52)
00
(313
)0
(30)
1,56
2 G
ener
al S
tate
cha
rges
2,
268
0(3
03)
(1,5
38)
(13)
00
00
(1)
413
Cap
ital p
roje
cts
50
00
00
00
00
5
T
otal
dis
burs
emen
ts/e
xpen
ditu
res
67,0
45(1
20)
(4,7
43)
(9,0
46)
(380
)5,
339
0(3
13)
0(2
56)
57,5
26
Oth
er fi
nanc
ing
sour
ces
(use
s):
Tr
ansf
ers
from
oth
er fu
nds
7,71
20
(970
)(6
,790
)2,
782
00
065
02,
799
Tr
ansf
ers
to o
ther
fund
s (4
,309
)0
6456
40
00
11(6
5)0
(3,7
35)
N
et o
ther
fina
ncin
g so
urce
s (u
ses)
3,40
30
(906
)(6
,226
)2,
782
00
110
0(9
36)
Ope
ratin
g Su
rplu
s/(D
efic
it)40
2(4
3)(2
22)
4(2
3)0
00
028
039
8
(mill
ions
of d
olla
rs)
CA
SH T
O G
AA
P C
ON
VER
SIO
N T
AB
LESP
ECIA
L R
EVEN
UE
FUN
DS
FY 2
013
T-271

Estim
ated
Cas
h S
UN
Y R
ehab
SUN
Y C
apita
l S
UN
Y/C
UN
YA
ppro
pria
ted
Off-
Bud
get
Rec
lass
Syst
emEs
timat
ed G
AA
PD
isbu
rsem
ents
(Fu
nd 0
74)
(Fun
d 38
4) (F
und
002)
Loan
sC
apita
lPr
ocee
dsA
ccru
als
Expe
nditu
res
Rec
eipt
s/R
even
ues:
Tax
es1,
401
00
00
00
01,
401
Mis
cella
neou
s re
ceip
ts4,
105
0(7
0)(9
49)
(11)
0(2
,169
)74
980
Fed
eral
Gra
nts
2,08
50
00
00
00
2,08
5
Tot
al re
ceip
ts/re
venu
es7,
591
0(7
0)(9
49)
(11)
0(2
,169
)74
4,46
6
Dis
burs
emen
ts/e
xpen
ditu
res:
Gra
nts
to lo
cal g
over
nmen
ts
1,99
50
00
00
82,
003
Cap
ital p
roje
cts
5,84
9(4
7)(7
0)(1
,030
)(1
1)1,
279
016
36,
133
T
otal
dis
burs
emen
ts/e
xpen
ditu
res
7,84
4(4
7)(7
0)(1
,030
)(1
1)1,
279
017
18,
136
Oth
er fi
nanc
ing
sour
ces
(use
s):
Tr
ansf
ers
from
oth
er fu
nds
1,35
2(4
7)0
00
00
01,
305
Tr
ansf
ers
to o
ther
fund
s (1
,496
)0
00
00
00
(1,4
96)
Pro
ceed
s of
GO
Bon
ds40
00
00
00
00
400
Pro
ceed
s fro
m F
inan
cing
Arr
aang
emen
ts/
A
dvan
ce R
efun
ding
s0
00
00
1,44
22,
169
03,
611
N
et o
ther
fina
ncin
g so
urce
s (u
ses)
256
(47)
00
01,
442
2,16
90
3,82
0
Ope
ratin
g Su
rplu
s/(D
efic
it)3
00
810
163
0(9
7)15
0
(mill
ions
of d
olla
rs)
CA
SH T
O G
AA
P C
ON
VER
SIO
N T
AB
LEC
API
TAL
PRO
JEC
TS F
UN
DFY
201
3
T-272

Rec
lass
Estim
ated
Cas
h S
UN
Y D
orm
sR
ecla
ssSU
NY/
Syst
emEs
timat
ed G
AA
PD
isbu
rsem
ents
(Fun
d 33
0)
LG
AC
Patie
nt F
ees
CU
NY
DS
Acc
rual
sEx
pend
iture
s
Rec
eipt
s/R
even
ues:
Tax
es13
,512
00
00
313
,515
Pat
ient
fees
00
047
90
047
9 F
eder
al G
rant
s79
00
00
079
Mis
cella
neou
s re
ceip
ts99
6(5
05)
(1)
(479
)0
011
T
otal
rece
ipts
/reve
nues
14,5
87(5
05)
(1)
00
314
,084
Dis
burs
emen
ts/e
xpen
ditu
res:
Sta
te o
pera
tions
47
(10)
00
00
37 D
ebt S
ervi
ce6,
149
(102
)0
0(1
,055
)0
4,99
2
Tot
al d
isbu
rsem
ents
/exp
endi
ture
s 6,
196
(112
)0
0(1
,055
)0
5,02
9
Oth
er fi
nanc
ing
sour
ces
(use
s):
Tr
ansf
ers
from
oth
er fu
nds
6,29
50
00
00
6,29
5
Tran
sfer
s to
oth
er fu
nds
(14,
609)
314
00
(1,0
55)
0(1
5,35
0)
N
et o
ther
fina
ncin
g so
urce
s (u
ses)
(8,3
14)
314
00
(1,0
55)
0(9
,055
)
Ope
ratin
g Su
rplu
s/(D
efic
it)77
(79)
(1)
00
30
(mill
ions
of d
olla
rs)
CA
SH T
O G
AA
P C
ON
VER
SIO
N T
AB
LED
EBT
SER
VIC
E FU
ND
FY 2
013
T-273

STATE OF NEW YORK APPENDIX LIST OF JOINT CUSTODY FUNDS
FUND NUMBER
FUND NAME
FUND CLASSIFICATION
001 Local Assistance Account General 002 State Capital Projects Capital Projects 003 State Operations Account General 004 Tax Stabilization Reserve General 005 Contingency Reserve General 006 Universal Pre-Kindergarten Reserve General 007 Community Projects General 008 Rainy Day Reserve Fund General 013 Attica State Employee Victims’ General 017 Refund Reserve Account General 019 Mental Health Gift and Donations Special Revenue 020 Combined Expendable Trust Special Revenue 021 Agriculture Producers’ Security Private Purpose Trust 022 Milk Producers’ Security Private Purpose Trust 023 New York Interest on Lawyer Account (IOLA) Special Revenue 024 New York State Archives Partnership Trust Special Revenue 025 Child Performer’s Protection Special Revenue 050 Tuition Reimbursement Special Revenue 052 New York State Local Government Records
Management Improvement
Special Revenue 053 School Tax Relief Special Revenue 054 Charter Schools Stimulus Special Revenue 055 Not-For-Profit Short-Term Revolving Loan Special Revenue 056 Hudson River Valley Greenway Special Revenue 059 Rehabilitative Alcohol and Substance Abuse Treatment Special Revenue 061 Health Care Reform Act Resources Special Revenue 064 Debt Reduction Reserve Debt Service 065 State University Construction Fund Educational
Facilities Payment
Debt Service 072 Dedicated Highway and Bridge Trust Capital Projects 073 Dedicated Mass Transportation Trust Special Revenue 074 State University Residence Halls Rehabilitation and
Repair
Capital Projects 075 New York State Canal System Development Capital Projects 076 State Park Infrastructure Capital Projects 077 Passenger Facility Charge Capital Projects 078 Environmental Protection Capital Projects 079 Clean Water/Clean Air Implementation Capital Projects 080 Hudson River Park Capital Projects 101 Energy Conservation Thru Improved Transportation
Bond
Capital Projects 103 Park and Recreation Land Acquisition Bond Capital Projects 105 Pure Waters Bond Capital Projects 106 Outdoor Recreation Development Bond Capital Projects 109 Transportation Capital Facilities Bond Capital Projects 115 Environmental Quality Protection Bond Act (1972) Capital Projects 118 Rail Preservation and Development Bond Capital Projects
T-274

STATE OF NEW YORK APPENDIX LIST OF JOINT CUSTODY FUNDS
FUND NUMBER
FUND NAME
FUND CLASSIFICATION
119 State Housing Bond Capital Projects 121 Rebuild and Renew New York Transportation Bond Capital Projects 123 Transportation Infrastructure Renewal Bond Capital Projects 124 Environmental Quality Bond Act (1986) Capital Projects 126 Accelerated Capacity and Transportation Improvements
Bond
Capital Projects 127 Clean Water/Clean Air Bond Capital Projects 129 Not-For-Profit School Capital Facilities Financing
Reserve
Agency 130 School Capital Facilities Financing Reserve Agency 135 Child Performer’s Holding Agency 136 Child Performer's Holding Agency 137 Child Performer's Holding Agency 152 Employees Health Insurance Agency 153 Social Security Contribution Agency 154 Employee Payroll Withholding Agency 160 State Lottery Special Revenue 162 Employees Dental Insurance Agency 163 Management Confidential Group Insurance Agency 165 Lottery Prize Agency 166 Fringe Benefit Escrow General 167 Health Insurance Reserve Receipts Agency 169 Miscellaneous New York State Agency Agency 174 State Aid and Local Assistance Revenue Withhold Fund Agency 175 Elderly Pharmaceutical Insurance Coverage (EPIC)
Escrow
Agency 176 CUNY Senior College Operating Agency 179 Medicaid Management Information System (MMIS)
Escrow
Agency 221 Combined Student Loan Special Revenue 225 MTA Financial Assistance Fund Special Revenue 261 Federal USDA/Food and Nutrition Services Special Revenue 265 Federal Health and Human Services Special Revenue 267 Federal Education Special Revenue 269 Federal Block Grants Special Revenue 290 Federal Miscellaneous Operating Grants Special Revenue 291 Federal Capital Projects Capital Projects 300 Sewage Treatment Program Management and
Administration
Special Revenue 301 ENCon Special Revenue Special Revenue 302 Conservation Special Revenue 303 Environmental Protection and Oil Spill Compensation Special Revenue 304 Mental Health Services Debt Service 305 Training and Education Program on Occupational
Safety and Health
Special Revenue 306 Lawyers’ Fund For Client Protection Special Revenue 307 Equipment Loan Fund for the Disabled Special Revenue
T-275

STATE OF NEW YORK APPENDIX LIST OF JOINT CUSTODY FUNDS
FUND NUMBER
FUND NAME
FUND CLASSIFICATION
309 Special Education Agency 310 Forest Preserve Expansion Capital Projects 311 General Debt Service Debt Service 312 Hazardous Waste Remedial Capital Projects 313 Mass Transportation Operating Assistance Special Revenue 314 Clean Air Special Revenue 315 Grade Crossing Elimination Debt Service Debt Service 316 Housing Debt Debt Service 317 Pine Barrens Capital Projects 318 New York State Infrastructure Trust Special Revenue 319 Department of Health Income Debt Service 321 Legislative Computer Services Special Revenue 322 Lake Champlain Bridges Capital Projects 323 Centralized Services Internal Service 324 Youth Commissary Enterprise 325 State Exposition Special Enterprise 326 Correctional Services Commissary Enterprise 327 Suburban Transportation Capital Projects 328 Biodiversity Stewardship and Research Special Revenue 330 State University Dormitory Income Debt Service 331 Agency Enterprise Enterprise 332 Combined Non-Expendable Trust Special Revenue 333 Winter Sports Education Trust Special Revenue 334 Agency Internal Service Internal Service 335 Musical Instrument Revolving Special Revenue 337 Rural Housing Assistance Special Revenue 338 Arts Capital Revolving Special Revenue 339 Miscellaneous State Special Revenue Special Revenue 340 Court Facilities Incentive Aid Special Revenue 341 Employment Training Special Revenue 342 Homeless Housing and Assistance Special Revenue 343 Mental Hygiene Revolving Internal Service 344 State University Revenue Collection Agency 345 State University Income Special Revenue 346 Chemical Dependence Service Special Revenue 347 Youth Vocational Education Internal Service 348 Tobacco Revenue Guarantee General 349 Lake George Park Trust Special Revenue 351 Sheltered Workshop Enterprise 352 Patient Workshop Enterprise 353 Mental Hygiene Community Stores Enterprise 354 State Police and Motor Vehicle Law Enforcement and
Motor Vehicle Theft and Insurance Fraud Prevention
Special Revenue 355 New York Great Lakes Protection Special Revenue 357 Division For Youth Facilities Improvement Capital Projects 358 Youth Centers Facility Capital Projects 359 Federal Revenue Maximization Contract Special Revenue
T-276

STATE OF NEW YORK APPENDIX LIST OF JOINT CUSTODY FUNDS
FUND NUMBER
FUND NAME
FUND CLASSIFICATION
360 Housing Development Special Revenue 361 Clean Water/Clean Air Debt Service 362 NYSDOT Commercial Vehicle Safety Program Special Revenue 364 Local Government Assistance Tax Debt Service 365 Vocational Rehabilitation Special Revenue 366 Drinking Water Program Management and
Administration
Special Revenue 368 New York City County Clerks’ Operations Offset Special Revenue 369 Judiciary Data Processing Offset Special Revenue 374 Housing Assistance Capital Projects 376 Housing Program Capital Projects 377 City University Tuition Reimbursement (CUTRA) Special Revenue 378 Natural Resource Damages Capital Projects 380 Department of Transportation Engineering Services Capital Projects 382 State University Federal Direct Lending Agency 383 Supplemental Jury Facilities Special Revenue 384 State University Capital Projects Capital Projects 385 US Olympic Committee/Lake Placid Olympic Training Special Revenue 387 Miscellaneous Capital Projects Capital Projects 388 City University of New York Capital Projects Capital Projects 389 Mental Hygiene Facilities Capital Improvement Capital Projects 390 Indigent Legal Services Special Revenue 394 Joint Labor and Management Administration Internal Service 395 Audit and Control Revolving Internal Service 396 Health Insurance Revolving Internal Service 397 Correctional Industries Revolving Internal Service 399 Correctional Facilities Capital Improvement Capital Projects 400 Common Retirement - Administration Pension Trust 450 Industrial Exhibit Authority Enterprise 480 Unemployment Insurance Administration Special Revenue 481 Unemployment Insurance Benefit Enterprise 482 Unemployment Insurance Interest and Penalty Special Revenue 484 Unemployment Insurance Occupational Training Special Revenue 486 Federal Employment and Training Grants Special Revenue
T-277

APPENDIX
STATE OF NEW YORK FUND STRUCTURE
GOVERNMENTAL
GENERAL SPECIAL REVENUE DEBT SERVICE CAPITAL PROJECTS
STATE FEDERAL STATE FEDERAL
PROPRIETARY
ENTERPRISE INTERNAL SERVICES
FIDUCIARY
PRIVATE PURPOSE TRUST PENSION TRUST AGENCY
T-278