2011-12 EXECUTIVE BUDGET
472
Transcript of 2011-12 EXECUTIVE BUDGET


1
2011-12 EXECUTIVE BUDGET
AGENCY PRESENTATIONS
CONTENTS Adirondack Park Agency ....................................................................................................4 Aging, State Office for the ..................................................................................................8 Agriculture and Markets, Department of ..........................................................................13 Alcoholic Beverage Control, Division of .........................................................................18 Arts, Council on the ..........................................................................................................21 Audit and Control, Department of ....................................................................................26 Budget, Division of the .....................................................................................................32 City University of New York ............................................................................................35 Civil Service, Department of ............................................................................................40 Corrections and Community Supervision, Department of ................................................44 Criminal Justice Services, Division of ..............................................................................51 Developmental Disabilities Planning Council ..................................................................58 Economic Development, Department of ...........................................................................61 Education Department, State ............................................................................................67 Elections, State Board of ...................................................................................................84 Empire State Development Corporation ...........................................................................87 Employee Relations, Office of ..........................................................................................91 Energy Research and Development Authority, New York State ......................................94 Environmental Conservation, Department of ...................................................................97 Environmental Facilities Corporation .............................................................................107 Executive Chamber .........................................................................................................111 Lieutenant Governor, Office of the .............................................................................113 Family Assistance, Department of Children and Family Services, Office of .....................................................................115 Temporary and Disability Assistance, Office of .........................................................124 Financial Regulation, Department of ..............................................................................131 General Services, Office of .............................................................................................135 Health, Department of .....................................................................................................141 Medicaid Inspector General, Office of the ..................................................................154 Higher Education Services Corporation .........................................................................157 Homeland Security and Emergency Services, Division of .............................................163 Housing and Community Renewal, Division of .............................................................170 Housing Finance Agency ............................................................................................177 Mortgage Agency, State of New York ........................................................................178 Hudson River Park Trust ................................................................................................181 Human Rights, Division of .............................................................................................182
2
Indigent Legal Services, Office of ..................................................................................185 Inspector General, Office of the State .............................................................................188 Interest on Lawyer Account ............................................................................................191 Judicial Commissions .....................................................................................................194 Labor, Department of ......................................................................................................197 Law, Department of ........................................................................................................203 Lottery, Division of the ...................................................................................................208 Mental Hygiene, Department of .....................................................................................211 Alcoholism and Substance Abuse Services, Office of ................................................212 Mental Health, Office of .............................................................................................216 People with Developmental Disabilities, Office for ...................................................222 Metropolitan Transportation Authority ...........................................................................228 Military and Naval Affairs, Division of ..........................................................................231 Motor Vehicles, Department of ......................................................................................235 Olympic Regional Development Authority ....................................................................240 Parks, Recreation and Historic Preservation, Office of ..................................................243 Public Authorities, New York State ................................................................................249 Public Employment Relations Board ..............................................................................263 Public Integrity, Commission on ....................................................................................267 Public Service, Department of ........................................................................................270 Quality of Care and Advocacy for Persons with Disabilities, Commission on ..............273 Racing and Wagering Board, State .................................................................................279 Regulatory Reform, Governor’s Office of ......................................................................282 Science, Technology, and Innovation, Foundation for ....................................................284 State, Department of .......................................................................................................287 State Police, Division of .................................................................................................292 State University of New York .........................................................................................296 State University Construction Fund ............................................................................302 Statewide Financial System ............................................................................................304 Taxation and Finance, Department of .............................................................................306 Tax Appeals, Division of ............................................................................................312 Technology, Office for ....................................................................................................315 Thruway Authority ..........................................................................................................318 Transportation, Department of ........................................................................................319 Veterans’ Affairs, Division of .........................................................................................328 Welfare Inspector General, Office of ...............................................................................333 Workers’ Compensation Board .......................................................................................336 MISCELLANEOUS Collective Bargaining ..................................................................................................339 Community Projects ....................................................................................................340 Community Service Provider Assistance Program .....................................................340

3
Deferred Compensation ...............................................................................................341 General State Charges .................................................................................................343 Green Thumb ...............................................................................................................346 Greenway Heritage Conservancy of the Hudson River Valley ...................................347 Health Insurance Contingency Reserve ......................................................................348 Health Insurance Reserve Receipts Fund ....................................................................348 Higher Education .........................................................................................................349 Higher Education Facilities Capital Matching Grants Program ..................................350 Homeland Security ......................................................................................................351 Hudson River Valley Greenway Communities Council .............................................352 Insurance and Securities Funds Reserve Guarantee ....................................................354 Local Government Assistance .....................................................................................355 National and Community Services ..............................................................................358 New York Power Authority Asset Transfer ................................................................361 Payment to the City Of New York ..............................................................................361 Racing Reform Program ..............................................................................................362 Reserve for Federal Audit Disallowances ...................................................................362 Roosevelt Island Operating Corporation .....................................................................363 Special Emergency Appropriation ..............................................................................364 Special Federal Emergency Appropriation .................................................................364 Special Pay Bill ...........................................................................................................364 State Equipment Financing Program ...........................................................................366 Tribal State Compact Revenue ....................................................................................366 Workers’ Compensation Reserve ................................................................................367 World Trade Center .....................................................................................................367 State Debt Service ...........................................................................................................369 Appropriations requested by the Judiciary and the Legislature Commentary of the Governor on the Judiciary ...........................................................376 Judiciary ......................................................................................................................377 Legislature ...................................................................................................................392 Statewide Summary Information Appropriations .............................................................................................................412 Consulting Service Contracts ......................................................................................427 User’s Guide ...................................................................................................................436

4
ADIRONDACK PARK AGENCY MISSION The Adirondack Park Agency was established in 1971 to “ensure the optimum overall conservation, protection, development and use of the unique scenic, aesthetic, wildlife, recreational, open space, ecological and natural resources of the Adirondack Park.” The Park itself was created in 1892 and contains six million acres of publicly and privately owned lands. ORGANIZATION AND STAFFING The Adirondack Park Agency is governed by an 11-member board, including the Commissioners of Environmental Conservation, Economic Development and the Secretary of State. The other members, five of whom must be Park residents, are nominated by the Governor and confirmed by the Senate. The principal functions of the Agency are:
Reviewing and ensuring adherence to the State Land Master Plan through collaborative working relationships with the Department of Environmental Conservation and the Office of Parks, Recreation and Historic Preservation, and development of Unit Management and recreational use plans;
Reviewing and issuing permits for private and State land-use projects, consistent with the Adirondack Park Private Land Use and Development Plan, and for certain activities on or near fresh water wetlands, pursuant to the 1975 Freshwater Wetlands Act;
Helping local governments develop land use plans and providing technical expertise; and
Administering the State’s Wild, Scenic and Recreational River Act. The Adirondack Park Agency’s responsibilities are carried out by the following divisions: Planning, which handles local, regional and State land use policy issues; Counsel’s Office, which provides legal advice to all Agency functions and oversees jurisdictional determinations and enforcement functions; Regulatory, which performs the Agency’s permitting function; Resource Analysis, which conducts scientific research and makes ecological and adverse impact assessments of land use proposals; Economic Services, which assists project sponsors in the review process; and Local Government Services, which provides technical expertise and assistance to communities. BUDGET HIGHLIGHTS The Executive Budget recommends $5.8 million All Funds ($4.6 million General Fund; $700,000 Federal funds; $500,000 Capital Funds) for the Adirondack Park Agency. This reflects a $512,000 decrease (-10 percent) from 2010-11 levels. Spending reductions are achieved as the result of reflecting the full-year value of the conveyance of two Agency Visitor Interpretative Centers: one in Newcomb, Essex County, which was successfully transferred to the State University of New York’s College of Environmental Science and Forestry on July 1, 2010; and one in Paul Smiths, Franklin County, which was successfully transferred to Paul Smith’s College of Arts and Sciences on December 31, 2010. The Executive Budget reduces each agency’s General Fund State Operations

ADIRONDACK PARK
5
budget by 10 percent. These savings are intended to be achieved through administrative efficiencies in non-personal service and negotiated workforce savings that minimize layoffs to the extent possible. The budget will support the Agency’s core regulatory functions and continue to fund the Adirondack Park Local Government Review Board (LGRB). The LGRB serves as a liaison between the APA and the counties and communities within the Adirondack Park, and monitors the administration and enforcement of the Adirondack Park Land Use and Development Plan. PROGRAM HIGHLIGHTS Since its inception, the Agency has worked to achieve a balance between strong environmental protection and sustainable economic development opportunities for the residents of the Adirondack Park. The Agency’s priorities for the future include continued updating of the Agency’s rules and regulations, facilitating the development of land use plans by local governments, providing local governments with technical expertise and training, working toward completing Unit Management Plans for the State lands of the Adirondack Park and improving private and State land resource data base information to better protect the resources of the Adirondack Park.
ALL FUNDS APPROPRIATIONS
(dollars)
Category Available
2010-11
AppropriationsRecommended
2011-12 Change
ReappropriationsRecommended
2011-12State Operations 5,819,000 5,307,000 (512,000) 1,005,000 Aid To Localities 0 0 0 0 Capital Projects 500,000 500,000 0 500,000 Total 6,319,000 5,807,000 (512,000) 1,505,000
ALL FUND TYPES
PROJECTED LEVELS OF EMPLOYMENT BY PROGRAM FILLED ANNUAL SALARIED POSITIONS
Full-Time Equivalent Positions (FTE)
Program
2010-11Estimated FTEs
03/31/11
2011-12Estimated FTEs
03/31/12 FTE ChangeAdministration
General Fund 56 56 0 Total 56 56 0
The above table does not reflect layoffs that may be necessary in the absence of negotiated workforce savings.
STATE OPERATIONS
ALL FUNDS FINANCIAL REQUIREMENTS BY FUND TYPE APPROPRIATIONS
(dollars)
Fund Type Available
2010-11Recommended
2011-12 ChangeGeneral Fund 5,119,000 4,607,000 (512,000) Special Revenue Funds - Federal 700,000 700,000 0 Total 5,819,000 5,307,000 (512,000)

ADIRONDACK PARK
6
STATE OPERATIONS ALL FUNDS FINANCIAL REQUIREMENTS BY PROGRAM
APPROPRIATIONS (dollars)
Program Available
2010-11Recommended
2011-12 ChangeAdministration
General Fund 5,119,000 4,607,000 (512,000) Special Revenue Funds - Federal 700,000 700,000 0
Total 5,819,000 5,307,000 (512,000)
STATE OPERATIONS - GENERAL FUND
SUMMARY OF PERSONAL SERVICE APPROPRIATIONS AND CHANGES 2011-12 RECOMMENDED
(dollars)
Total Personal Service Regular
(Annual Salaried) Program Amount Change Amount ChangeAdministration 4,224,000 (512,000) 4,133,000 (487,000) Total 4,224,000 (512,000) 4,133,000 (487,000)
Temporary Service
(Nonannual Salaried) Holiday/Overtime Pay
Program Amount Change Amount ChangeAdministration 90,000 (20,000) 1,000 (5,000) Total 90,000 (20,000) 1,000 (5,000)
STATE OPERATIONS - GENERAL FUND
SUMMARY OF NONPERSONAL SERVICE AND MAINTENANCE UNDISTRIBUTED APPROPRIATIONS AND CHANGES
2011-12 RECOMMENDED (dollars)
Total Supplies and Materials Program Amount Change Amount ChangeAdministration 383,000 0 88,000 0 Total 383,000 0 88,000 0 Travel Contractual Services Program Amount Change Amount ChangeAdministration 37,000 0 220,000 0 Total 37,000 0 220,000 0 Equipment Program Amount Change Administration 38,000 0 Total 38,000 0
STATE OPERATIONS - OTHER THAN GENERAL FUND
SUMMARY OF APPROPRIATIONS AND CHANGES 2011-12 RECOMMENDED
(dollars) Total Nonpersonal Service Program Amount Change Amount ChangeAdministration 700,000 0 700,000 0 Total 700,000 0 700,000 0

ADIRONDACK PARK
7
CAPITAL PROJECTS ALL FUNDS FINANCIAL REQUIREMENTS BY PROGRAM
APPROPRIATIONS (dollars)
Comprehensive Construction Program Available
2010-11Recommended
2011-12 Change Reappropriations
2011-12Maintenance & Improvement of Existing Facilities
Fiduciary Funds - Miscellaneous Gifts Account 500,000 500,000 0 500,000 Total 500,000 500,000 0 500,000

8
STATE OFFICE FOR THE AGING MISSION The New York State Office for the Aging (SOFA) is responsible for promoting, coordinating and administering State, Federal and local programs and services for 3.7 million New Yorkers aged 60 or older. The Office provides leadership and direction to 59 Area Agencies on Aging, as well as to numerous other local programs and providers that comprise the network of services to the aged. ORGANIZATION AND STAFFING The State Office for the Aging is headed by a Director, appointed by the Governor and subject to Senate confirmation, and is composed of four divisions: Executive, Finance and Administration, Policy, Management and Public Information and Community Service. Approximately 18 percent of Office operations are funded by the General Fund and 82 percent are financed by Federal grants and other revenue sources. BUDGET HIGHLIGHTS The Executive Budget recommends $238.2 million All Funds ($111.9 million General Fund, $126.3 million Other Funds) for the State Office for the Aging. This is an overall decrease of $5.2 million All Funds (-2.2 percent) ($1.9 million General Fund decrease, $3.3 million Special Revenue Funds decrease) from the 2010-11 budget. This change reflects the elimination of certain lower priority programs, administrative reductions, and the end of Federal funds associated with the American Reinvestment and Recovery Act of 2009. The Executive Budget reduces each agency’s General Fund State Operations budget by 10 percent. These savings are intended to be achieved through administrative efficiencies in non-personal service and negotiated workforce savings that minimize layoffs to the extent possible. Major Executive Budget actions include the elimination of discrete funding for the Community Empowerment Initiative, Congregate Services Initiative, EAC/Nassau Respite Program, Elderly Abuse Education and Outreach Program, Enriched Social Adult Day Centers Program, Foster Grandparent Program, Long Term Care Senior Respite, NY Foundation Home Sharing, Patients’ Rights Hotline and Advocacy, Regional Caregivers Centers for Excellence, and the Retired and Senior Volunteer Program. However, these purposes would be eligible for funding through a new local competitive performance grant program established in the Executive Budget, which is intended to support priority initiatives that address emerging or ongoing matters affecting older adults and pursuing innovations in assisting older adults. PROGRAM HIGHLIGHTS The full array of programs offered through the Office for the Aging is aimed at keeping seniors independent as long as possible with the assistance of family and other informal caregivers, as well as through the limited use of formal support services. These community-based services help keep people healthy, in their homes and out of hospitals and nursing homes.

AGING
9
COMMUNITY BASED LONG TERM CARE SERVICES The 2011-12 Executive Budget continues funding for the Office’s community-based service programs, including Community Services for the Elderly (CSE), Naturally Occurring Retirement Communities (NORCs), Neighborhood NORCs, Respite services and operational funding for transportation providers. The Executive Budget also preserves core funding for the Expanded In-home Services for the Elderly Program (EISEP). EISEP provides non-medical in-home services, case management, respite and ancillary services to the frail elderly, most of whom are low-income but not eligible for Medicaid. Recipients are required to cost-share, based on their annual income level, for received EISEP program services. EISEP is expected to serve nearly 50,000 persons in 2011-12. NUTRITION SERVICES Through a combination of State tax dollars and Federal grants, the State annually provides over 25 million congregate and home-delivered meals, as well as other nutritional services primarily to non-institutionalized, frail, older adults. These older adults are at risk of malnutrition because they are no longer able to obtain an adequate diet without assistance. The Office receives $41 million from Federal grants in support of congregate and home-delivered meals and another $17 million to support the purchase of food. The 2011-12 Executive Budget continues funding for the Supplemental Nutrition Assistance Program (SNAP), the State counterpoint to the Federal programs, at $21.4 million. ASSISTANCE TO CAREGIVERS Family members and other informal caregivers provide an estimated 80 percent of long-term care for older New Yorkers; sustaining this cost-effective, individualized support system for seniors is a key objective of the aging service system. The State Office for the Aging’s 17 Caregiver Resource Centers assist caregivers through training programs, support groups, counseling and linkages to other community services. The $13.5 million Federal Caregivers Program provides respite, training and counseling for caregivers, as well as other services that support an elderly person’s ability to maximize their independence. VOLUNTEER ADVOCACY The Long-Term Care Ombudsman Program (LTCOP) supports the statewide advocacy of more than 1,000 trained volunteers on behalf of the approximately 162,000 residents of New York State’s nursing homes, adult care facilities and assisted living residences. Under the LTCOP, volunteers, working in collaboration with community agencies, receive, investigate and resolve a wide range of concerns and complaints regarding conditions and treatment in long-term care facilities, with the goal of ensuring the quality of life for residents.

AGING
10
ALL FUNDS APPROPRIATIONS
(dollars)
Category Available
2010-11
AppropriationsRecommended
2011-12 Change
ReappropriationsRecommended
2011-12State Operations 14,350,400 13,810,600 (539,800) 15,537,000 Aid To Localities 229,128,000 224,419,000 (4,709,000) 138,522,000 Capital Projects 0 0 0 0 Total 243,478,400 238,229,600 (5,248,800) 154,059,000
ALL FUND TYPES
PROJECTED LEVELS OF EMPLOYMENT BY PROGRAM FILLED ANNUAL SALARIED POSITIONS
Full-Time Equivalent Positions (FTE)
Program
2010-11Estimated FTEs
03/31/11
2011-12Estimated FTEs
03/31/12 FTE ChangeAdministration and Grants Management
General Fund 23 23 0 Special Revenue Funds - Federal 97 97 0 Special Revenue Funds - Other 1 1 0
Total 121 121 0
The above table does not reflect layoffs that may be necessary in the absence of negotiated workforce savings.
STATE OPERATIONS
ALL FUNDS FINANCIAL REQUIREMENTS BY FUND TYPE APPROPRIATIONS
(dollars)
Fund Type Available
2010-11Recommended
2011-12 ChangeGeneral Fund 2,748,400 2,473,600 (274,800) Special Revenue Funds - Federal 11,252,000 10,987,000 (265,000) Special Revenue Funds - Other 250,000 250,000 0 Enterprise Funds 100,000 100,000 0 Total 14,350,400 13,810,600 (539,800)
STATE OPERATIONS
ALL FUNDS FINANCIAL REQUIREMENTS BY PROGRAM APPROPRIATIONS
(dollars)
Program Available
2010-11Recommended
2011-12 ChangeAdministration and Grants Management
General Fund 2,748,400 2,473,600 (274,800) Special Revenue Funds - Federal 11,252,000 10,987,000 (265,000) Special Revenue Funds - Other 250,000 250,000 0 Enterprise Funds 100,000 100,000 0
Total 14,350,400 13,810,600 (539,800)

AGING
11
STATE OPERATIONS - GENERAL FUND SUMMARY OF PERSONAL SERVICE APPROPRIATIONS AND CHANGES
2011-12 RECOMMENDED (dollars)
Total Personal Service Regular
(Annual Salaried) Program Amount Change Amount ChangeAdministration and Grants Management 2,120,000 (235,500) 2,113,400 (234,800) Total 2,120,000 (235,500) 2,113,400 (234,800)
Holiday/Overtime Pay
(Annual Salaried) Program Amount Change Administration and Grants Management 6,600 (700) Total 6,600 (700)
STATE OPERATIONS - GENERAL FUND
SUMMARY OF NONPERSONAL SERVICE AND MAINTENANCE UNDISTRIBUTED APPROPRIATIONS AND CHANGES
2011-12 RECOMMENDED (dollars)
Total Supplies and Materials Program Amount Change Amount ChangeAdministration and Grants Management 353,600 (39,300) 43,500 (4,800) Total 353,600 (39,300) 43,500 (4,800) Travel Contractual Services Program Amount Change Amount ChangeAdministration and Grants Management 82,900 (9,200) 205,100 (22,800) Total 82,900 (9,200) 205,100 (22,800) Equipment Program Amount Change Administration and Grants Management 22,100 (2,500) Total 22,100 (2,500)
STATE OPERATIONS - OTHER THAN GENERAL FUND
SUMMARY OF APPROPRIATIONS AND CHANGES 2011-12 RECOMMENDED
(dollars) Total Personal Service Program Amount Change Amount ChangeAdministration and Grants Management 11,337,000 (265,000) 8,497,000 160,000 Total 11,337,000 (265,000) 8,497,000 160,000 Nonpersonal Service Maintenance Undistributed Program Amount Change Amount ChangeAdministration and Grants Management 2,840,000 190,000 0 (615,000) Total 2,840,000 190,000 0 (615,000)

AGING
12
AID TO LOCALITIES ALL FUNDS FINANCIAL REQUIREMENTS BY FUND TYPE
APPROPRIATIONS (dollars)
Fund Type Available
2010-11Recommended
2011-12 ChangeGeneral Fund 111,163,000 109,454,000 (1,709,000) Special Revenue Funds - Federal 116,985,000 113,985,000 (3,000,000) Special Revenue Funds - Other 980,000 980,000 0 Total 229,128,000 224,419,000 (4,709,000) Adjustments: Recommended Deficiency
Aging, Office for the Special Revenue Funds - Federal (3,000,000)
Appropriated 2010-11 226,128,000
AID TO LOCALITIES ALL FUNDS FINANCIAL REQUIREMENTS BY PROGRAM
APPROPRIATIONS (dollars)
Program Available
2010-11Recommended
2011-12 ChangeCommunity Services
General Fund 111,163,000 109,454,000 (1,709,000) Special Revenue Funds - Federal 116,985,000 113,985,000 (3,000,000) Special Revenue Funds - Other 980,000 980,000 0
Total 229,128,000 224,419,000 (4,709,000)

13
DEPARTMENT OF AGRICULTURE AND MARKETS
MISSION The Department of Agriculture and Markets is charged with fostering a competitive and safe New York food and agricultural industry for the benefit of producers and consumers. The Department encourages the growth and economic health of the State’s agricultural and food industry and conducts various inspections and testing programs to enforce laws on food safety, animal and plant health, and accuracy of labeling. The Department also acts to preserve agricultural resources and improve soil and water quality, and operates the annual State Fair near Syracuse. ORGANIZATION AND STAFFING The agency is run by a Commissioner, who is appointed by the Governor subject to confirmation by the Senate. The Department is headquartered in Albany and maintains four regional offices in Buffalo, Syracuse, Rochester and Brooklyn. The Department of Agriculture and Markets’ operating programs are funded by tax dollars from the General Fund, fees, Federal grants and other funds. BUDGET HIGHLIGHTS The Executive Budget recommends $162.6 million All Funds ($40.2 million General Fund; $46.6 million Special Revenue Fund; $75.8 Other Funds) for the Department of Agriculture and Markets. This is a decrease of $9.3 million All Funds (-5.7 percent) from the 2010-11 budget. The change reflects a 10 percent year-to-year reduction in General Fund spending for State operations, as well as reductions to local initiatives and capital projects. The State operations reduction will be achieved by realizing the full year value of personnel reductions completed in 2010-11, and savings through agency redesign and increased efficiencies. The Executive Budget reduces each agency’s General Fund State Operations budget by 10 percent. These savings are intended to be achieved through administrative efficiencies in non-personal service and negotiated workforce savings that minimize layoffs to the extent possible. The Executive Budget recommends $1 million, a reduction of $750,000 from 2010-11 levels, for capital projects to maintain, repair, and rehabilitate the State Fair’s 19 major buildings and other structures, and $2 million for a capital special revenue fund to continue support for development of private partnerships at the State Fair, unchanged from 2010-11. The Executive Budget recommends $13.8 million from the General Fund for local assistance programs that provide services to the State’s agricultural community. Funding for the Agribusiness Child Development program (Migrant Childcare) and the New York State Veterinary Diagnostic Laboratory will remain at 2010-11 levels. Funding for various entities that provide research, education and promotional support for agricultural activities would be reduced by $2 million and restructured into a $1.2 million competitive program that will award grants to projects that produce the best outcomes for the agricultural industry. Continued Federal appropriation authority will allow the

AGRICULTURE AND MARKETS
14
Department to apply for Federal grants to fund Federal nutrition programs for senior citizens, animal health initiatives and food safety programs, including essential funding for the State Food Laboratory. PROGRAM HIGHLIGHTS The Agricultural Business Services program promotes the agricultural economy of the State and fosters the responsible use of resources to preserve agricultural land and the environment. These purposes are carried out through six divisions which:
Inspect and test livestock, poultry, and plants to control and eradicate diseases that can both cause severe economic losses for farmers and present a public health hazard;
Oversee the activities of county soil and water conservation districts, direct the agricultural non-point source pollution control and farmland preservation grant programs, establish agricultural districts, administer agricultural product market orders and the Federal Farmers Market Nutrition Program for low-income families, and collect and disseminate statistical agricultural information; and
Exercise a variety of statutorily required activities involving the pricing and marketing of milk and milk products, and the licensing and bonding of milk and farm products dealers.
The Consumer Food Services program ensures that wholesome food products are sold to the consumer and that the industry and the public are protected from fraud, adulteration, or malpractice in the production, processing, transportation, and retailing of food and gasoline, and in the use of measuring devices. In carrying out these purposes, the program:
Licenses and inspects more than 28,000 businesses that produce, process, manufacture, or distribute food products, registers food represented as kosher, and grades farm products;
Inspects and tests dairy products to enforce laws pertaining to milk and milk product sanitation, and guards against harmful or misrepresented food; and
Certifies and calibrates weighing and measuring devices and oversees the testing of motor fuels under the Motor Fuel Quality and Clean Air programs.
STATE FAIR The Department directs the New York State Fair and Fairgrounds, located near Syracuse. The Fairgrounds, a 365-acre complex, has 19 major exhibit buildings and 107 other structures. It is used for the annual 12-day State Fair, and its facilities are rented year-round for various shows and activities. The operating costs of the Fair and Fairgrounds are fully funded from admission, rental and concession fees.

AGRICULTURE AND MARKETS
15
ALL FUNDS APPROPRIATIONS
(dollars)
Category Available
2010-11
AppropriationsRecommended
2011-12 Change
ReappropriationsRecommended
2011-12State Operations 129,384,000 125,798,000 (3,586,000) 137,827,000 Aid To Localities 38,808,000 33,809,000 (4,999,000) 52,009,000 Capital Projects 3,750,000 3,000,000 (750,000) 37,771,000 Total 171,942,000 162,607,000 (9,335,000) 227,607,000
ALL FUND TYPES
PROJECTED LEVELS OF EMPLOYMENT BY PROGRAM FILLED ANNUAL SALARIED POSITIONS
Full-Time Equivalent Positions (FTE)
Program
2010-11Estimated FTEs
03/31/11
2011-12Estimated FTEs
03/31/12 FTE ChangeAdministration
General Fund 60 60 0 Agricultural Business Services
General Fund 135 135 0 Special Revenue Funds - Federal 11 11 0 Special Revenue Funds - Other 36 36 0 Fiduciary Funds 3 3 0
Consumer Food Services General Fund 69 69 0 Special Revenue Funds - Federal 14 14 0 Special Revenue Funds - Other 129 129 0
State Fair Enterprise Funds 54 54 0
Total 511 511 0
The above table does not reflect layoffs that may be necessary in the absence of negotiated workforce savings.
STATE OPERATIONS
ALL FUNDS FINANCIAL REQUIREMENTS BY FUND TYPE APPROPRIATIONS
(dollars)
Fund Type Available
2010-11Recommended
2011-12 ChangeGeneral Fund 29,286,000 26,357,000 (2,929,000) Special Revenue Funds - Federal 29,644,000 29,644,000 0 Special Revenue Funds - Other 47,257,000 46,600,000 (657,000) Enterprise Funds 21,361,000 21,361,000 0 Fiduciary Funds 1,836,000 1,836,000 0 Total 129,384,000 125,798,000 (3,586,000)

AGRICULTURE AND MARKETS
16
STATE OPERATIONS ALL FUNDS FINANCIAL REQUIREMENTS BY PROGRAM
APPROPRIATIONS (dollars)
Program Available
2010-11Recommended
2011-12 ChangeAdministration
General Fund 7,534,000 6,781,000 (753,000) Agricultural Business Services
General Fund 15,071,000 13,563,000 (1,508,000) Special Revenue Funds - Federal 21,919,000 21,919,000 0 Special Revenue Funds - Other 26,417,000 25,760,000 (657,000) Fiduciary Funds 1,836,000 1,836,000 0
Consumer Food Services General Fund 6,681,000 6,013,000 (668,000) Special Revenue Funds - Federal 7,725,000 7,725,000 0 Special Revenue Funds - Other 20,840,000 20,840,000 0
State Fair Enterprise Funds 21,361,000 21,361,000 0
Total 129,384,000 125,798,000 (3,586,000)
STATE OPERATIONS - GENERAL FUND
SUMMARY OF PERSONAL SERVICE APPROPRIATIONS AND CHANGES 2011-12 RECOMMENDED
(dollars)
Total Personal Service Regular
(Annual Salaried) Program Amount Change Amount ChangeAdministration 4,697,000 (522,000) 4,623,000 (514,000)Agricultural Business Services 9,626,000 (1,070,000) 9,239,000 (1,027,000)Consumer Food Services 5,679,000 (631,000) 5,269,000 (585,000) Total 20,002,000 (2,223,000) 19,131,000 (2,126,000)
Temporary Service
(Nonannual Salaried) Holiday/Overtime Pay
Program Amount Change Amount ChangeAdministration 57,000 (6,000) 17,000 (2,000)Agricultural Business Services 198,000 (22,000) 189,000 (21,000)Consumer Food Services 81,000 (9,000) 329,000 (37,000) Total 336,000 (37,000) 535,000 (60,000)
STATE OPERATIONS - GENERAL FUND
SUMMARY OF NONPERSONAL SERVICE AND MAINTENANCE UNDISTRIBUTED APPROPRIATIONS AND CHANGES
2011-12 RECOMMENDED (dollars)
Total Supplies and Materials Program Amount Change Amount ChangeAdministration 2,084,000 (231,000) 119,000 (13,000)Agricultural Business Services 3,937,000 (438,000) 205,000 (23,000)Consumer Food Services 334,000 (37,000) 104,000 (12,000) Total 6,355,000 (706,000) 428,000 (48,000) Travel Contractual Services Program Amount Change Amount ChangeAdministration 99,000 (11,000) 1,827,000 (203,000)Agricultural Business Services 189,000 (21,000) 3,421,000 (380,000)Consumer Food Services 82,000 (9,000) 71,000 (8,000) Total 370,000 (41,000) 5,319,000 (591,000) Equipment Program Amount Change Administration 39,000 (4,000) Agricultural Business Services 122,000 (14,000) Consumer Food Services 77,000 (8,000) Total 238,000 (26,000)

AGRICULTURE AND MARKETS
17
STATE OPERATIONS - OTHER THAN GENERAL FUND SUMMARY OF APPROPRIATIONS AND CHANGES
2011-12 RECOMMENDED (dollars)
Total Personal Service Program Amount Change Amount ChangeAgricultural Business Services 49,515,000 (657,000) 4,992,000 1,766,000 Consumer Food Services 28,565,000 0 13,532,000 3,665,000 State Fair 21,361,000 0 6,831,000 0 Total 99,441,000 (657,000) 25,355,000 5,431,000 Nonpersonal Service Maintenance Undistributed Program Amount Change Amount ChangeAgricultural Business Services 44,523,000 19,496,000 0 (21,919,000)Consumer Food Services 15,033,000 4,060,000 0 (7,725,000)State Fair 14,530,000 0 0 0 Total 74,086,000 23,556,000 0 (29,644,000)
AID TO LOCALITIES
ALL FUNDS FINANCIAL REQUIREMENTS BY FUND TYPE APPROPRIATIONS
(dollars)
Fund Type Available
2010-11Recommended
2011-12 ChangeGeneral Fund 18,808,000 13,809,000 (4,999,000) Special Revenue Funds - Federal 20,000,000 20,000,000 0 Total 38,808,000 33,809,000 (4,999,000)
AID TO LOCALITIES
ALL FUNDS FINANCIAL REQUIREMENTS BY PROGRAM APPROPRIATIONS
(dollars)
Program Available
2010-11Recommended
2011-12 ChangeAgricultural Business Services
General Fund 18,808,000 13,809,000 (4,999,000) Special Revenue Funds - Federal 20,000,000 20,000,000 0
Total 38,808,000 33,809,000 (4,999,000)
CAPITAL PROJECTS
ALL FUNDS FINANCIAL REQUIREMENTS BY PROGRAM APPROPRIATIONS
(dollars)
Comprehensive Construction Program Available
2010-11Recommended
2011-12 Change Reappropriations
2011-12New Facilities
Capital Projects Fund - Authority Bonds 0 0 0 36,358,000 State Fair
Capital Projects Fund 1,750,000 1,000,000 (750,000) 1,413,000 Misc. Capital Projects 2,000,000 2,000,000 0 0
Total 3,750,000 3,000,000 (750,000) 37,771,000

18
DIVISION OF ALCOHOLIC BEVERAGE CONTROL MISSION The Division of Alcoholic Beverage Control operates under the direction of the State Liquor Authority, a three-member board consisting of a Chairperson, who acts as the agency administrator, and two Commissioners, appointed by the Governor with the advice and consent of the Senate. The Division regulates and controls the manufacture, sale and distribution of alcoholic beverages within the State; issues licenses and permits to manufacturers, distributors, wholesalers and retailers; works with local law enforcement agencies and localities across the State to ensure compliance with the Alcoholic Beverage Control Law; and regulates trade and credit practices for the sale and distribution of alcoholic beverages. ORGANIZATION AND STAFFING The Division’s organization includes three functional areas: Administration, Licensing and Compliance. Administration includes the Offices of the Chairman of the Authority, the Chief Operating Officer, Government Affairs, Communications and other traditional administrative functions. Licensing includes the Licensing Bureau, which is responsible for processing new and renewal license applications, in addition to the Wholesale Bureau, which administers price schedules and trade practices. Compliance includes the Office of Counsel, as well as the Enforcement and Hearing Bureaus. BUDGET HIGHLIGHTS The Executive Budget recommends $16.9 million in funding for the Division. This is a decrease of $5.5 million (-25 percent) from the 2010-11 budget. However, the majority of this decrease is attributable to the inclusion in the 2010-11 total of $3.6 million in special appropriations related to investments in improving the Division’s licensing function. After adjusting for this non-recurring action, the Division’s funding decreases $1.9 million, or 10 percent. The Division is entirely self-funded by revenue generated from fees and fines it imposes. The Executive Budget advances a proposal to change the compensation of the board members, other than the Chairperson, from annual salaried to per diem. PROGRAM HIGHLIGHTS The agency is participating in a number of statewide initiatives that will modernize and upgrade its technology and business processes. These upgrades will increase operational efficiency and cost effectiveness throughout the agency, including the processing of license applications. They will also provide a more user-friendly interface for licensees, while supporting the Division’s efforts in enforcing the Alcoholic Beverage Control Law, Rules and Regulations. Interim investments in technology and changes made to the procedures used by agency staff when processing license applications have significantly reduced the licensing backlog. Additionally, the agency is currently engaged in a number of ongoing short-range technology projects that will continue to build upon the changes already made and bridge the gap until the final statewide solutions are implemented. The State Liquor Authority and Division of Alcoholic Beverage Control are also enhancing compliance activities through the Rapid

ALCOHOLIC BEVERAGE CONTROL
19
Enforcement Unit (REU) program while developing partnerships with community boards and local law enforcement agencies, particularly in the downstate area. The Division has also taken steps to increase the investigation of complaints as well as expedite hearings and license suspensions to protect public health, safety and welfare.
ALL FUNDS APPROPRIATIONS
(dollars)
Category Available
2010-11
AppropriationsRecommended
2011-12 Change
ReappropriationsRecommended
2011-12State Operations 22,335,000 16,860,000 (5,475,000) 2,400,000 Aid To Localities 0 0 0 0 Capital Projects 0 0 0 0 Total 22,335,000 16,860,000 (5,475,000) 2,400,000
ALL FUND TYPES
PROJECTED LEVELS OF EMPLOYMENT BY PROGRAM FILLED ANNUAL SALARIED POSITIONS
Full-Time Equivalent Positions (FTE)
Program
2010-11Estimated FTEs
03/31/11
2011-12Estimated FTEs
03/31/12 FTE ChangeAdministration
Special Revenue Funds - Other 17 17 0 Compliance
Special Revenue Funds - Other 64 64 0 Licensing and Wholesaler Services
Special Revenue Funds - Other 59 59 0 Total 140 140 0
The above table does not reflect layoffs that may be necessary in the absence of negotiated workforce savings.
STATE OPERATIONS
ALL FUNDS FINANCIAL REQUIREMENTS BY FUND TYPE APPROPRIATIONS
(dollars)
Fund Type Available
2010-11Recommended
2011-12 ChangeSpecial Revenue Funds - Other 22,335,000 16,860,000 (5,475,000) Total 22,335,000 16,860,000 (5,475,000)
STATE OPERATIONS
ALL FUNDS FINANCIAL REQUIREMENTS BY PROGRAM APPROPRIATIONS
(dollars)
Program Available
2010-11Recommended
2011-12 ChangeAdministration
Special Revenue Funds - Other 4,911,000 4,420,000 (491,000) Compliance
Special Revenue Funds - Other 8,151,000 7,335,000 (816,000) Licensing and Wholesaler Services
Special Revenue Funds - Other 9,273,000 5,105,000 (4,168,000) Total 22,335,000 16,860,000 (5,475,000)
ALCOHOLIC BEVERAGE CONTROL
20
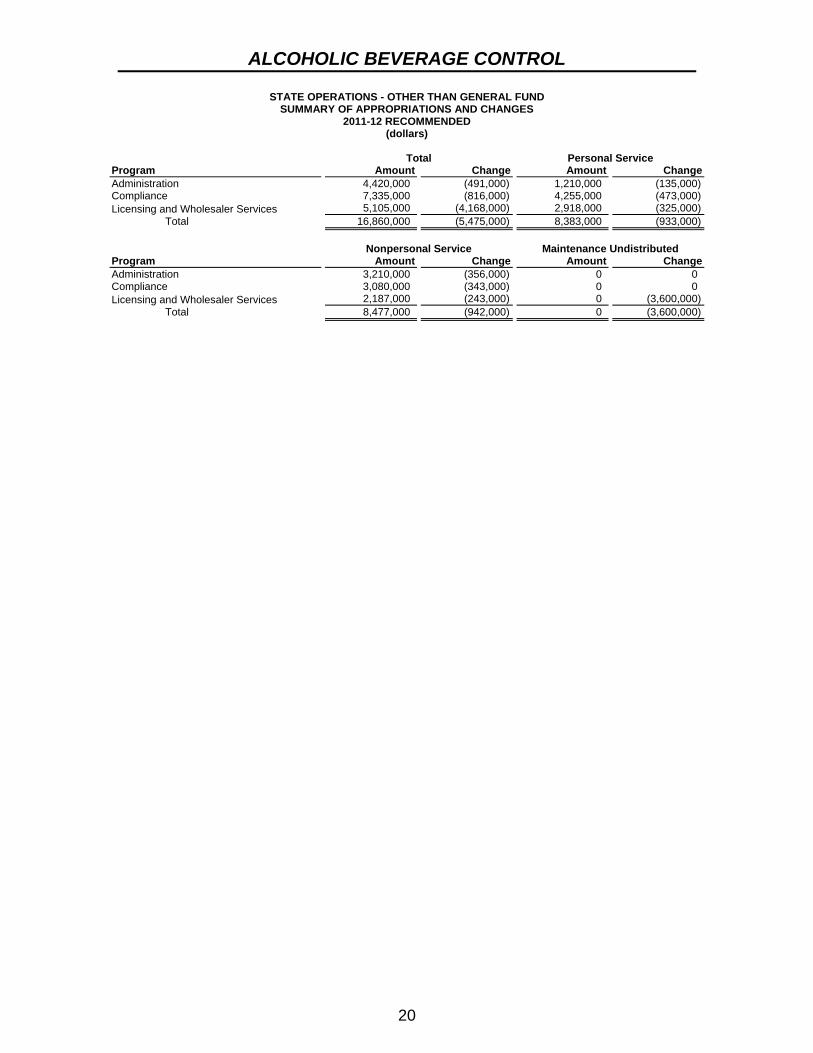
STATE OPERATIONS - OTHER THAN GENERAL FUND SUMMARY OF APPROPRIATIONS AND CHANGES
2011-12 RECOMMENDED (dollars)
Total Personal Service Program Amount Change Amount ChangeAdministration 4,420,000 (491,000) 1,210,000 (135,000)Compliance 7,335,000 (816,000) 4,255,000 (473,000)Licensing and Wholesaler Services 5,105,000 (4,168,000) 2,918,000 (325,000) Total 16,860,000 (5,475,000) 8,383,000 (933,000) Nonpersonal Service Maintenance Undistributed Program Amount Change Amount ChangeAdministration 3,210,000 (356,000) 0 0 Compliance 3,080,000 (343,000) 0 0 Licensing and Wholesaler Services 2,187,000 (243,000) 0 (3,600,000) Total 8,477,000 (942,000) 0 (3,600,000)

21
COUNCIL ON THE ARTS MISSION The New York State Council on the Arts (NYSCA) is an Executive Agency dedicated to preserving and expanding New York’s rich and diverse cultural resources and expanding access to arts and cultural institutions statewide. NYSCA plays a prominent role in increasing access to the performing and fine arts, preserving the State’s cultural resources and promoting greater public awareness of New York’s rich cultural heritage. The Nelson A. Rockefeller Empire State Plaza Performing Arts Center Corporation (The Egg) is a public benefit corporation located in Albany, New York that presents performing arts. The Egg offers a diverse array of cultural and artistic programming. The Egg also spotlights emerging artists, fosters relationships with resident companies, and enhances activities in cultural and arts education. ORGANIZATION AND STAFFING The Council on the Arts is headed by a Chair and a Vice Chair and consists of 21 members nominated to 5-year terms by the Governor with confirmation by the Senate. The Council’s staff, located in New York City, has expertise in the major artistic disciplines (including dance, theater and music) and provides advisory services and financial assistance to New York’s arts community. The Egg was established in 1979 as a public benefit corporation. Its Board of Directors is comprised of members appointed by the Governor, President of the Senate, Speaker of the Assembly, Minority Leaders of both houses, the Albany County Executive, the Albany Mayor, and the Commissioner of the Office of General Services (OGS). BUDGET HIGHLIGHTS The 2011-12 Executive Budget recommends $38.9 million All Funds ($36.2 million General Fund; $2.7 million Other Funds) for NYSCA and the Egg, a net decrease of $5.6 million from the funding provided to arts agencies in the 2010-11 Enacted Budget. Major budget actions include:
Reduce Funding for NYSCA Grants: The 2011-12 Executive Budget provides $31.6 million in General Fund support for arts grants. This represents a decrease of $3.5 million (10 percent) from the 2010-11 Enacted Budget.
Reinvent NYSCA operations: The 2011-12 Executive Budget provides $4.4 million in General Fund support for NYSCA’s operations, which represents a year-to-year decrease of $0.5 million, or 10 percent. In order to accommodate the decreased funding level, NYSCA will need to pursue additional operational efficiencies.
Reduce Funding for The Egg: The 2011-12 Executive Budget provides The Egg with a State appropriation of $220,000, which reflects a 10 percent decrease from the funding provided in the 2010-11 Enacted Budget. In addition to the State subsidy, The Egg traditionally supports its operations with revenue from ticket sales, private donations, and proceeds from the sale and lease of its products and facilities.
New York State Theatre Institute: The New York State Theatre Institute Corporation (NYSTI) is a small public benefit corporation located in Troy, New York. NYSTI’s Board of Directors suspended its operations effective December

ARTS
22
31, 2010 and transferred NYSTI’s assets and property because NYSTI was unable to generate sufficient revenue to cover its operating expenses and become self-supporting. The Executive Budget recommends removing the statutory authorization for the organization. Absent legislation to remove NYSTI’s statutory authorization, the State would continue to incur costs related to ongoing upkeep and maintenance of NYSTI’s real property.
PROGRAM HIGHLIGHTS Council on the Arts: Approximately 93 percent of the funding for the Council on the Arts is provided by the State’s General Fund. Federal grants from the National Endowment for the Arts and dedicated revenue appropriations are projected to represent approximately 7 percent of 2011-12 funding. Grants to not-for-profit arts organizations represent approximately 88 percent of the projected expenditures of NYSCA. The remainder is used for the administration of grant programs and the statewide promotion and development of artistic and cultural programs. Grant awards to not-for-profit arts organizations are approved through a multi-step review process, which ensures fair and equitable treatment of all applicants. Program audits are also conducted to promote accountability by monitoring program quality and contractual compliance. The Council receives approximately 3,000 requests for funding each year from organizations throughout the State including symphony orchestras, museums, dance companies, theaters and libraries. Empire State Plaza Performing Arts Center Corporation (The Egg): The Egg hosts approximately 300 events annually featuring dance, music, and theatre companies; these events were attended by nearly 70,000 individuals last year. Highlights included the enhancement of the American Roots & Branches and Rhythm International concert series, Dance New York and Dance The World, and Arts-in-Education performances.
ALL FUNDS APPROPRIATIONS
(dollars)
Category Available
2010-11
AppropriationsRecommended
2011-12 Change
ReappropriationsRecommended
2011-12State Operations 6,715,000 4,674,000 (2,041,000) 700,000 Aid To Localities 37,759,000 34,244,000 (3,515,000) 25,504,000 Capital Projects 0 0 0 0 Total 44,474,000 38,918,000 (5,556,000) 26,204,000
ALL FUND TYPES
PROJECTED LEVELS OF EMPLOYMENT BY PROGRAM FILLED ANNUAL SALARIED POSITIONS
Full-Time Equivalent Positions (FTE)
Program
2010-11Estimated FTEs
03/31/11
2011-12Estimated FTEs
03/31/12 FTE ChangeAdministration
General Fund 29 29 0 Total 29 29 0
The above table does not reflect layoffs that may be necessary in the absence of negotiated workforce savings.

ARTS
23
STATE OPERATIONS ALL FUNDS FINANCIAL REQUIREMENTS BY FUND TYPE
APPROPRIATIONS (dollars)
Fund Type Available
2010-11Recommended
2011-12 ChangeGeneral Fund 4,838,000 4,574,000 (264,000) Special Revenue Funds - Federal 100,000 100,000 0 Special Revenue Funds - Other 1,777,000 0 (1,777,000) Total 6,715,000 4,674,000 (2,041,000)
STATE OPERATIONS
ALL FUNDS FINANCIAL REQUIREMENTS BY PROGRAM APPROPRIATIONS
(dollars)
Program Available
2010-11Recommended
2011-12 ChangeAdministration
General Fund 4,838,000 4,354,000 (484,000) Special Revenue Funds - Federal 100,000 100,000 0
Empire State Performing Arts Center Corporation General Fund 0 220,000 220,000 Special Revenue Funds - Other 245,000 0 (245,000)
New York State Theatre Institute Special Revenue Funds - Other 1,532,000 0 (1,532,000)
Total 6,715,000 4,674,000 (2,041,000)
STATE OPERATIONS - GENERAL FUND
SUMMARY OF PERSONAL SERVICE APPROPRIATIONS AND CHANGES 2011-12 RECOMMENDED
(dollars)
Total Personal Service Regular
(Annual Salaried) Program Amount Change Amount ChangeAdministration 2,879,000 (319,000) 2,878,000 (319,000)Empire State Performing Arts Center
Corporation 69,000 69,000 48,000 48,000 Total 2,948,000 (250,000) 2,926,000 (271,000)
Temporary Service
(Nonannual Salaried) Holiday/Overtime Pay
Program Amount Change Amount ChangeAdministration 0 0 1,000 0 Empire State Performing Arts Center
Corporation 19,000 19,000 2,000 2,000 Total 19,000 19,000 3,000 2,000

ARTS
24
STATE OPERATIONS - GENERAL FUND SUMMARY OF NONPERSONAL SERVICE AND MAINTENANCE UNDISTRIBUTED
APPROPRIATIONS AND CHANGES 2011-12 RECOMMENDED
(dollars) Total Supplies and Materials Program Amount Change Amount ChangeAdministration 1,475,000 (165,000) 29,000 (3,000)Empire State Performing Arts Center
Corporation 151,000 151,000 31,000 31,000 Total 1,626,000 (14,000) 60,000 28,000 Travel Contractual Services Program Amount Change Amount ChangeAdministration 57,000 (7,000) 1,332,000 (148,000)Empire State Performing Arts Center
Corporation 2,000 2,000 118,000 118,000 Total 59,000 (5,000) 1,450,000 (30,000) Equipment Program Amount Change Administration 57,000 (7,000) Empire State Performing Arts Center
Corporation 0 0 Total 57,000 (7,000)
STATE OPERATIONS - OTHER THAN GENERAL FUND
SUMMARY OF APPROPRIATIONS AND CHANGES 2011-12 RECOMMENDED
(dollars) Total Personal Service Program Amount Change Amount ChangeAdministration 100,000 0 0 0 Empire State Performing Arts Center
Corporation 0 (245,000) 0 (76,000)New York State Theatre Institute 0 (1,532,000) 0 (1,054,000) Total 100,000 (1,777,000) 0 (1,130,000) Nonpersonal Service Program Amount Change Administration 100,000 0 Empire State Performing Arts Center
Corporation 0 (169,000) New York State Theatre Institute 0 (478,000) Total 100,000 (647,000)
AID TO LOCALITIES
ALL FUNDS FINANCIAL REQUIREMENTS BY FUND TYPE APPROPRIATIONS
(dollars)
Fund Type Available
2010-11Recommended
2011-12 ChangeGeneral Fund 35,150,000 31,635,000 (3,515,000) Special Revenue Funds - Federal 2,413,000 2,413,000 0 Special Revenue Funds - Other 196,000 196,000 0 Total 37,759,000 34,244,000 (3,515,000)

ARTS
25
AID TO LOCALITIES ALL FUNDS FINANCIAL REQUIREMENTS BY PROGRAM
APPROPRIATIONS (dollars)
Program Available
2010-11Recommended
2011-12 ChangeAdministration
General Fund 35,150,000 31,635,000 (3,515,000) Special Revenue Funds - Federal 2,413,000 2,413,000 0 Special Revenue Funds - Other 196,000 196,000 0
Total 37,759,000 34,244,000 (3,515,000)

26
DEPARTMENT OF AUDIT AND CONTROL MISSION The Department of Audit and Control was created in 1926 and is headed by the State Comptroller, who is elected by the people. The Department is responsible for paying the State’s bills and payrolls; verifying all financial transactions of the State; reviewing the financial and management practices of State agencies; supervising the fiscal affairs of local governments; investing State funds and issuing bonds and notes; and administering the retirement program for State and most local government employees. ORGANIZATION AND STAFFING The operations of the Department of Audit and Control are organized into eleven programs, with its main office in Albany and regional offices in New York City, Buffalo, Rochester, Syracuse, Binghamton, Glens Falls, Newburgh and Hauppauge. These regional offices function primarily as decentralized audit centers, providing financial review of the accounting of revenues collected and expenses incurred by counties, cities, towns and villages, school and fire districts and quasi-governmental entities. BUDGET HIGHLIGHTS The Executive Budget recommends 284.3 million All Funds ($157.8 million General Fund; $101.4 million Fiduciary Fund; $6.6 million Internal Service Fund; $18.5 million Other Funds) for the Department of Audit and Control, a decrease of $4.1 million (-1.4 percent) from 2010-11. This decrease is the net result of a $13.9 million, or 10 percent, decrease in the General Fund; and an increase of $9.8 million in Other Funds. Executive Budget appropriations support a workforce of up to 2,529 FTEs, which reflects the transfer of 23 positions to the Statewide Financial System Project. PROGRAM HIGHLIGHTS.
The Executive Direction, Legal Services, Administration and the Chief Information Office programs are responsible for the public information, internal audit, fiscal research, IT operations, financial administration, legal, office services, management analysis and human resource functions of the Department.
The Office of Operations provides accounting and financial reporting services, audits State contracts, expenditures and payrolls prior to payment, carries out the mandates of the Abandoned Property Law by safeguarding lost assets belonging to residents, maintains the State’s current Central Accounting System, and has worked with the Executive to consolidate the FOCAS and NYFMS projects into a single statewide financial system. The Office is also responsible for the VendRep system, which was established to promote State agency and Office of the State Comptroller due diligence in assessing the responsibility of vendors with whom the State contracts.
The State and Local Government Accountability program provides oversight through audits of all State and local government agencies, authorities and special purpose entities. The program conducts about 200 independent audits of New York State agencies, public authorities, and New York City agencies. These audits are intended to enhance public accountability and improve the efficiency

AUDIT AND CONTROL
27
and effectiveness of State and city government operations. It collects and reviews local government financial data, provides training programs and support services for local financial officials, and publishes research and analysis on a variety of local government policy issues. The Office is comprised of the Divisions of State Government Accountability and Local Government and School Accountability.
The Office of the State Deputy Comptroller for the City of New York assists the New York State Financial Control Board in carrying out and exercising the responsibilities assigned, and powers granted, to the Board by the Financial Emergency Act for the City of New York. The Retirement Services program administers the State Retirement Systems, consisting of the Employees’ Retirement System, the Police and Fire Retirement System and the Public Employees’ Group Life Insurance Plan. Currently, there are about 3,000 participating government employers, approximately 679,200 active and vested members and approximately 375,800 pensioners and their beneficiaries.
The Pension Investment and Public Finance program, in addition to overseeing the assets of the Retirement Systems, issues general obligation debt, invests short-term moneys for the State and local governments and selects financial institutions to provide banking services to the State.
Under Chapter 845 of the Laws of 1977, the Comptroller administers the New York State Environmental Protection and Oil Spill Compensation Fund. Costs associated with cleaning up oil spills are paid from the fund upon certification of the Commissioner of Environmental Conservation. Moneys in this fund consist of receipts from a fee levied on each barrel of petroleum shipped into the State.
ALL FUNDS
APPROPRIATIONS (dollars)
Category Available
2010-11
AppropriationsRecommended
2011-12 Change
ReappropriationsRecommended
2011-12State Operations 256,429,000 252,308,000 (4,121,000) 0 Aid To Localities 32,025,000 32,025,000 0 0 Capital Projects 0 0 0 0 Total 288,454,000 284,333,000 (4,121,000) 0

AUDIT AND CONTROL
28
ALL FUND TYPES PROJECTED LEVELS OF EMPLOYMENT BY PROGRAM
FILLED ANNUAL SALARIED POSITIONS Full-Time Equivalent Positions (FTE)
Program
2010-11Estimated FTEs
03/31/11
2011-12Estimated FTEs
03/31/12 FTE ChangeAdministration Program
General Fund 115 115 0 Chief Information Office
General Fund 168 168 0 Environmental Protection and Spill
Compensation Special Revenue Funds - Other 6 6 0
Executive Direction General Fund 98 98 0 Internal Service Funds 13 13 0
Pension Investment and Public Finance Program General Fund 5 5 0 Fiduciary Funds 54 54 0
Legal Services General Fund 58 58 0
State Services Program Special Revenue Funds - Federal 8 8 0 Internal Service Funds 11 11 0
Retirement Services Program Fiduciary Funds 850 850 0
Office of the Special Deputy Comptroller for New York City Special Revenue Funds - Other 28 28 0
State and Local Accountability General Fund 538 538 0
State Operations General Fund 600 577 (23)
Total 2,552 2,529 (23)
The above table does not reflect layoffs that may be necessary in the absence of negotiated workforce savings.
STATE OPERATIONS
ALL FUNDS FINANCIAL REQUIREMENTS BY FUND TYPE APPROPRIATIONS
(dollars)
Fund Type Available
2010-11Recommended
2011-12 ChangeGeneral Fund 139,773,000 125,801,000 (13,972,000) Special Revenue Funds - Other 11,008,000 18,508,000 7,500,000 Internal Service Funds 4,258,000 6,609,000 2,351,000 Fiduciary Funds 101,390,000 101,390,000 0 Total 256,429,000 252,308,000 (4,121,000) Adjustments: Transfer(s) To
Statewide Financial System Special Revenue Funds - Other 1,684,000
Appropriated 2010-11 258,113,000

AUDIT AND CONTROL
29
STATE OPERATIONS ALL FUNDS FINANCIAL REQUIREMENTS BY PROGRAM
APPROPRIATIONS (dollars)
Program Available
2010-11Recommended
2011-12 ChangeAdministration Program
General Fund 12,572,000 11,315,000 (1,257,000) Chief Information Office
General Fund 19,453,000 17,509,000 (1,944,000) Internal Service Funds 0 2,351,000 2,351,000
Environmental Protection and Spill Compensation Special Revenue Funds - Other 1,018,000 1,018,000 0
Executive Direction General Fund 8,759,000 7,885,000 (874,000) Internal Service Funds 1,868,000 1,868,000 0
Pension Investment and Public Finance Program General Fund 756,000 681,000 (75,000) Internal Service Funds 2,240,000 2,240,000 0 Fiduciary Funds 11,288,000 11,288,000 0
Legal Services General Fund 6,308,000 5,677,000 (631,000)
Retirement Services Program Fiduciary Funds 90,102,000 90,102,000 0
Office of the Special Deputy Comptroller for New York City Special Revenue Funds - Other 4,397,000 4,397,000 0
State and Local Accountability General Fund 43,993,000 39,594,000 (4,399,000) Special Revenue Funds - Other 491,000 491,000 0
State Operations General Fund 47,932,000 43,140,000 (4,792,000) Special Revenue Funds - Other 5,102,000 12,602,000 7,500,000 Internal Service Funds 150,000 150,000 0
Total 256,429,000 252,308,000 (4,121,000)
STATE OPERATIONS - GENERAL FUND
SUMMARY OF PERSONAL SERVICE APPROPRIATIONS AND CHANGES 2011-12 RECOMMENDED
(dollars)
Total Personal Service Regular
(Annual Salaried) Program Amount Change Amount ChangeAdministration Program 6,547,000 (727,000) 6,412,000 (712,000)Chief Information Office 12,891,000 (1,432,000) 12,441,000 (1,382,000)Executive Direction 7,095,000 (787,000) 7,013,000 (779,000)Pension Investment and Public Finance
Program 505,000 (56,000) 502,000 (56,000)Legal Services 5,339,000 (593,000) 5,276,000 (586,000)State and Local Accountability 35,169,000 (3,907,000) 34,741,000 (3,860,000)State Operations 33,339,000 (3,703,000) 32,063,000 (3,562,000) Total 100,885,000 (11,205,000) 98,448,000 (10,937,000)
Temporary Service
(Nonannual Salaried) Holiday/Overtime Pay
Program Amount Change Amount ChangeAdministration Program 45,000 (5,000) 90,000 (10,000)Chief Information Office 270,000 (30,000) 180,000 (20,000)Executive Direction 68,000 (7,000) 14,000 (1,000)Pension Investment and Public Finance
Program 3,000 0 0 0 Legal Services 45,000 (5,000) 18,000 (2,000)State and Local Accountability 248,000 (27,000) 180,000 (20,000)State Operations 428,000 (47,000) 848,000 (94,000) Total 1,107,000 (121,000) 1,330,000 (147,000)

AUDIT AND CONTROL
30
STATE OPERATIONS - GENERAL FUND SUMMARY OF NONPERSONAL SERVICE AND MAINTENANCE UNDISTRIBUTED
APPROPRIATIONS AND CHANGES 2011-12 RECOMMENDED
(dollars) Total Supplies and Materials Program Amount Change Amount ChangeAdministration Program 4,768,000 (530,000) 311,000 (35,000)Chief Information Office 4,618,000 (512,000) 495,000 (55,000)Executive Direction 790,000 (87,000) 67,000 (7,000)Pension Investment and Public Finance
Program 176,000 (19,000) 11,000 (1,000)Legal Services 338,000 (38,000) 60,000 (7,000)State and Local Accountability 4,425,000 (492,000) 185,000 (21,000)State Operations 9,801,000 (1,089,000) 412,000 (46,000) Total 24,916,000 (2,767,000) 1,541,000 (172,000) Travel Contractual Services Program Amount Change Amount ChangeAdministration Program 181,000 (20,000) 4,143,000 (460,000)Chief Information Office 113,000 (12,000) 2,759,000 (306,000)Executive Direction 82,000 (9,000) 614,000 (68,000)Pension Investment and Public Finance
Program 19,000 (2,000) 116,000 (13,000)Legal Services 66,000 (7,000) 194,000 (22,000)State and Local Accountability 2,665,000 (296,000) 1,297,000 (144,000)State Operations 360,000 (40,000) 5,995,000 (666,000) Total 3,486,000 (386,000) 15,118,000 (1,679,000) Equipment Program Amount Change Administration Program 133,000 (15,000) Chief Information Office 1,251,000 (139,000) Executive Direction 27,000 (3,000) Pension Investment and Public Finance
Program 30,000 (3,000) Legal Services 18,000 (2,000) State and Local Accountability 278,000 (31,000) State Operations 3,034,000 (337,000) Total 4,771,000 (530,000)

AUDIT AND CONTROL
31
STATE OPERATIONS - OTHER THAN GENERAL FUND SUMMARY OF APPROPRIATIONS AND CHANGES
2011-12 RECOMMENDED (dollars)
Total Personal Service Program Amount Change Amount ChangeChief Information Office 2,351,000 2,351,000 946,000 946,000 Environmental Protection and Spill
Compensation 1,018,000 0 523,000 0 Executive Direction 1,868,000 0 1,201,000 0 Pension Investment and Public Finance
Program 13,528,000 0 6,696,000 0 Retirement Services Program 90,102,000 0 44,449,000 0 Office of the Special Deputy Comptroller for
New York City 4,397,000 0 2,759,000 0 State and Local Accountability 491,000 0 270,000 0 State Operations 12,752,000 7,500,000 4,568,000 4,500,000 Total 126,507,000 9,851,000 61,412,000 5,446,000 Nonpersonal Service Program Amount Change Chief Information Office 1,405,000 1,405,000 Environmental Protection and Spill
Compensation 495,000 0 Executive Direction 667,000 0 Pension Investment and Public Finance
Program 6,832,000 0 Retirement Services Program 45,653,000 0 Office of the Special Deputy Comptroller for
New York City 1,638,000 0 State and Local Accountability 221,000 0 State Operations 8,184,000 3,000,000 Total 65,095,000 4,405,000
AID TO LOCALITIES
ALL FUNDS FINANCIAL REQUIREMENTS BY FUND TYPE APPROPRIATIONS
(dollars)
Fund Type Available
2010-11Recommended
2011-12 ChangeGeneral Fund 32,025,000 32,025,000 0 Total 32,025,000 32,025,000 0
AID TO LOCALITIES
ALL FUNDS FINANCIAL REQUIREMENTS BY PROGRAM APPROPRIATIONS
(dollars)
Program Available
2010-11Recommended
2011-12 ChangeState Operations
General Fund 32,025,000 32,025,000 0 Total 32,025,000 32,025,000 0

32
DIVISION OF THE BUDGET MISSION The Division of the Budget is responsible for assisting the Governor in the development of the Executive Budget and executes the budget as adopted by the Legislature. The Division also serves as the Governor’s primary advisor on such fiscal matters as local government and public authority finances. ORGANIZATION AND STAFFING Located in Albany, the Division of the Budget operates under the direction of the Budget Director, who is appointed by the Governor. BUDGET HIGHLIGHTS The Executive Budget recommends $53.6 million All Funds ($29 million General Fund; $24.6 million Other Funds) for the Division of the Budget. Appropriations in 2011-12 have decreased by almost $6 million (-10 percent) from 2010-11, with reductions in both personal and non-personal service. The Executive Budget reduces each agency’s General Fund State Operations budget by 10 percent. These savings are intended to be achieved through administrative efficiencies in non-personal service and negotiated workforce savings that minimize layoffs to the extent possible. PROGRAM HIGHLIGHTS The Division’s activities include:
Establishing budget policy and agency direction; Providing fiscal policy advice in revenue and expenditure forecasting, budget
process management and intergovernmental relations; and Coordinating the development and execution of State agency programs and
budgets.
ALL FUNDS APPROPRIATIONS
(dollars)
Category Available
2010-11
AppropriationsRecommended
2011-12 Change
ReappropriationsRecommended
2011-12State Operations 59,558,000 53,610,000 (5,948,000) 0 Aid To Localities 0 0 0 0 Capital Projects 0 0 0 0 Total 59,558,000 53,610,000 (5,948,000) 0
BUDGET
33
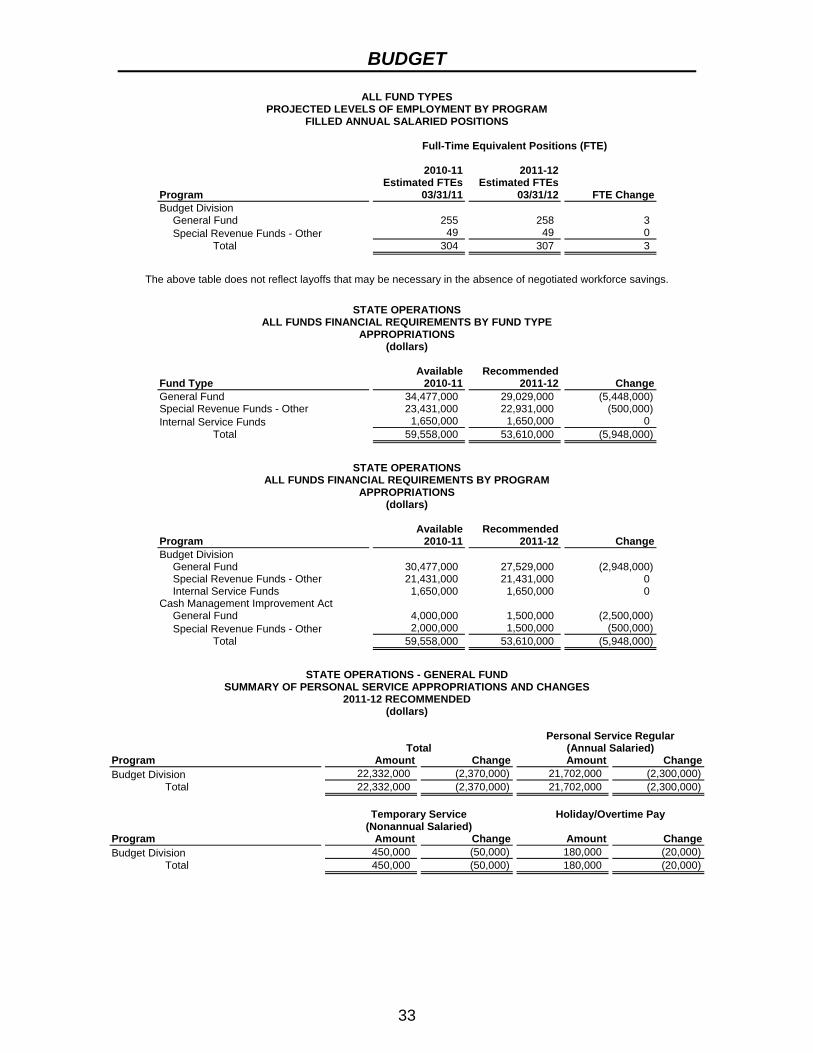
ALL FUND TYPES PROJECTED LEVELS OF EMPLOYMENT BY PROGRAM
FILLED ANNUAL SALARIED POSITIONS Full-Time Equivalent Positions (FTE)
Program
2010-11Estimated FTEs
03/31/11
2011-12Estimated FTEs
03/31/12 FTE ChangeBudget Division
General Fund 255 258 3 Special Revenue Funds - Other 49 49 0
Total 304 307 3
The above table does not reflect layoffs that may be necessary in the absence of negotiated workforce savings.
STATE OPERATIONS
ALL FUNDS FINANCIAL REQUIREMENTS BY FUND TYPE APPROPRIATIONS
(dollars)
Fund Type Available
2010-11Recommended
2011-12 ChangeGeneral Fund 34,477,000 29,029,000 (5,448,000) Special Revenue Funds - Other 23,431,000 22,931,000 (500,000) Internal Service Funds 1,650,000 1,650,000 0 Total 59,558,000 53,610,000 (5,948,000)
STATE OPERATIONS
ALL FUNDS FINANCIAL REQUIREMENTS BY PROGRAM APPROPRIATIONS
(dollars)
Program Available
2010-11Recommended
2011-12 ChangeBudget Division
General Fund 30,477,000 27,529,000 (2,948,000) Special Revenue Funds - Other 21,431,000 21,431,000 0 Internal Service Funds 1,650,000 1,650,000 0
Cash Management Improvement Act General Fund 4,000,000 1,500,000 (2,500,000) Special Revenue Funds - Other 2,000,000 1,500,000 (500,000)
Total 59,558,000 53,610,000 (5,948,000)
STATE OPERATIONS - GENERAL FUND
SUMMARY OF PERSONAL SERVICE APPROPRIATIONS AND CHANGES 2011-12 RECOMMENDED
(dollars)
Total Personal Service Regular
(Annual Salaried) Program Amount Change Amount ChangeBudget Division 22,332,000 (2,370,000) 21,702,000 (2,300,000) Total 22,332,000 (2,370,000) 21,702,000 (2,300,000)
Temporary Service
(Nonannual Salaried) Holiday/Overtime Pay
Program Amount Change Amount ChangeBudget Division 450,000 (50,000) 180,000 (20,000) Total 450,000 (50,000) 180,000 (20,000)

BUDGET
34
STATE OPERATIONS - GENERAL FUND SUMMARY OF NONPERSONAL SERVICE AND MAINTENANCE UNDISTRIBUTED
APPROPRIATIONS AND CHANGES 2011-12 RECOMMENDED
(dollars) Total Supplies and Materials Program Amount Change Amount ChangeBudget Division 5,197,000 (578,000) 180,000 (20,000)Cash Management Improvement Act 1,500,000 (2,500,000) 0 0 Total 6,697,000 (3,078,000) 180,000 (20,000) Travel Contractual Services Program Amount Change Amount ChangeBudget Division 167,000 (19,000) 4,580,000 (509,000)Cash Management Improvement Act 0 0 1,500,000 (2,500,000) Total 167,000 (19,000) 6,080,000 (3,009,000) Equipment Program Amount Change Budget Division 270,000 (30,000) Cash Management Improvement Act 0 0 Total 270,000 (30,000)
STATE OPERATIONS - OTHER THAN GENERAL FUND
SUMMARY OF APPROPRIATIONS AND CHANGES 2011-12 RECOMMENDED
(dollars) Total Personal Service Program Amount Change Amount ChangeBudget Division 23,081,000 0 6,710,000 0 Cash Management Improvement Act 1,500,000 (500,000) 0 0 Total 24,581,000 (500,000) 6,710,000 0 Nonpersonal Service Program Amount Change Budget Division 16,371,000 0 Cash Management Improvement Act 1,500,000 (500,000) Total 17,871,000 (500,000)

35
CITY UNIVERSITY OF NEW YORK MISSION The City University of New York (CUNY) has its origins in the Free Academy, established in 1847 under the auspices of the New York City Board of Education, and today is the nation’s largest urban public university system. The University’s mission is to provide affordable higher education with a focus on the urban community of New York City. ORGANIZATION AND STAFFING The City University of New York has 11 senior colleges, a Graduate School and University Center, a Graduate School of Journalism, a Law School and six community colleges. The University is governed by a 17-member Board of Trustees comprised of: 10 members appointed by the Governor, five members appointed by the Mayor and two ex-officio members – the chairs of the Student Senate and the Faculty Senate. The Board of Trustees appoints the Chancellor, the chief executive officer of the University and individual college presidents. The City University’s operating budget supports an estimated 12,933 full time equivalent positions consisting of 12,641 positions supported through a combination of State tax dollars and tuition revenues and 292 positions supported through other funds. Community college staff are not included in these totals as they are not employees of the State. BUDGET HIGHLIGHTS The Executive Budget recommends $3.6 billion All Funds ($1.9 billion in Fiduciary Funds that represent the City of New York paying Senior College costs in the first instance, $1.2 billion in General Fund support that represents both the State’s contribution to these costs and the operations of the CUNY community colleges, $175.4 million in authority to disburse self-generated revenue, and $336.4 million in capital funding). The budget includes General Fund growth in personal service costs (as a result of collective bargaining contracts), nonpersonal services, fringe benefits and community college enrollment growth, offset by General Fund decreases associated with reductions to senior college campuses and community colleges necessary to close State budget gaps. The Executive Budget reduces each agency’s General Fund State Operations budget by 10 percent. These savings are intended to be achieved through administrative efficiencies in non-personal service and negotiated workforce savings that minimize layoffs to the extent possible. Major 2011-12 budget actions:
Reduce General Fund Support for Senior Colleges: The Executive Budget recommends an $83.2 million decrease in direct General Fund support (approximately -10 percent from 2010-11 appropriation levels for the operations of CUNY Senior Colleges and University-wide programs. This reduction will be allocated by the Board of Trustees.
Reduce Community College Base Operating Aid: The Executive Budget recommends reducing base operating aid support for CUNY’s 6 community colleges by 10 percent per full-time equivalent (FTE) student. As a result, the rate would decline by $226, from $2,260 to $2,034. This action generates General Fund savings of $13.1 million in state fiscal year 2011-12.
CITY UNIVERSITY
36
SENIOR COLLEGES The Executive Budget includes General Fund appropriations of $1.05 billion (including $538.1 million in fringe benefits). Recommended levels of General Fund support (not including fringe benefits) represent a $67.2 million decrease from 2010-11 final enacted budget levels, consisting of a $27.9 million increase from collective bargaining and non-personal services inflationary costs, offset by an $11.9 million reduction that represents savings assumed in the 2010-11 Enacted Budget that could not be realized in the 2010-11, and further reduced by recommended reductions of $83.2 million. In addition, the Executive Budget assumes that the University will collect and spend approximately $801.1 million of revenue from tuition, reflecting a tuition rate increase of approximately 5 percent that was initiated and approved by the CUNY Board of Trustees in November 2010. As a result, combined General Fund and tuition revenue (plus $32.3 million from New York City) will provide for core instructional budget of $1.9 billion to support senior college campuses, central administration and University-wide programs. COMMUNITY COLLEGES CUNY’s community colleges have three basic funding sources: State support, local sponsor support, and student tuition revenue. The Executive Budget recommends $172.5 million in State support, a $13.5 million decrease in total available funding from 2010-11 final enacted budget levels. This change is attributable to increases of $5.7 million for enrollment growth and $1.2 million related to the one-time actions resulting from the 2010-11 FMAP contingency reduction, offset by $5.5 million due to the annualization of the 2010-11 enacted budget reduction of $285 per FTE student, the elimination of $1.8 million in one-time funding for prior year enrollment growth, and a $13.1 million decrease resulting from the recommended $226 per student FTE reduction in base operating aid (from $2,260 to $2,034). CAPITAL PROJECTS The 2008-09 enacted budget provided CUNY with $1.8 billion in new capital appropriations, a major step in the implementation of a $3 billion multi-year capital plan, which provides for facility and infrastructure improvements at senior and community colleges, consistent with University needs and priorities. The 2011-12 Executive Budget continues a commitment to preserve and rehabilitate CUNY’s educational facilities infrastructure by providing the fourth of five annual $284 million appropriations to address the accumulated backlog of critical maintenance projects throughout the University system. The Executive Budget also includes $31.2 million for the State’s 50 percent share of capital projects for community college campuses that have secured a match from the City of New York. PROGRAM HIGHLIGHTS The City University of New York offers a wide variety of educational avenues ranging from vocational courses to doctoral degree programs. Approximately 263,000 full-time and part-time students – 171,800 at the senior colleges and 91,200 at the

CITY UNIVERSITY
37
community colleges – were enrolled in programs for the fall 2010 semester. CUNY’s academic offerings include the following important programs:
The Language Immersion Program is designed to strengthen the language skills of first year students prior to their entry into collegiate coursework. This intensive, full-time program has successfully taken a holistic approach to language development in the context of academic preparation. The program operates on nine campuses and, since its inception in 1995, has helped thousands of students prepare for full collegiate matriculation;
The College Now Program is a joint project of the City University of New York (CUNY)/Office of Academic Affairs and the New York City Department of Education designed to improve the academic preparation of high school students and implement tougher graduation standards. College Now serves nearly 25,000 students at 17 college campuses annually and partners with over 350 New York City public high schools;
The New York City Alliance for Minority Participation is a consortium of 17 CUNY campuses that have joined with the National Science Foundation in a cooperative venture to increase the number of under-represented students successfully completing science, mathematics, engineering and technology baccalaureate programs; and
Approximately 120 research institutes and centers are located throughout the University. Notable examples include the Structural Biology Center — a consortium of public and private research institutions located on the City College campus, the Levich Institute for Physico-Chemical Hydrodynamics at City College and the Institute for Biomolecular Structure and Function at Hunter College.
In recent years, the CUNY Board of Trustees has advanced a series of significant actions to improve academic quality and strengthen the planning and management functions of the University. The Board of Trustees continues to encourage campuses to set higher standards, reduce time-to-program completion and allocate resources in a cost efficient yet academically effective manner. The City University, through its master plan, will continue to advance the core values the University has established including: academic rigor, accountability, assessment, and a commitment to serving a diverse student population. These values have been expressed through a series of system-wide changes and initiatives, implemented over time, which include: the restructuring and integration of admission policies, recruitment and retention of talented full-time faculty, collaboration with the New York City Department of Education to enhance preparation for higher education and development of a performance management process to assess leadership and progress toward University-wide goals.
ALL FUNDS APPROPRIATIONS
(dollars)
Category Available
2010-11
AppropriationsRecommended
2011-12 Change
ReappropriationsRecommended
2011-12State Operations 2,005,258,000 2,056,290,000 51,032,000 0 Aid To Localities 1,223,916,110 1,202,703,000 (21,213,110) 0 Capital Projects 318,785,000 336,461,000 17,676,000 3,579,831,000 Total 3,547,959,110 3,595,454,000 47,494,890 3,579,831,000

CITY UNIVERSITY
38
ALL FUND TYPES PROJECTED LEVELS OF EMPLOYMENT BY PROGRAM
FILLED ANNUAL SALARIED POSITIONS Full-Time Equivalent Positions (FTE)
Program
2010-11Estimated FTEs
03/31/11
2011-12Estimated FTEs
03/31/12 FTE ChangeInstitutional Support Services
Special Revenue Funds - Other 292 292 0 Fiduciary Funds 12,641 12,641 0
Total 12,933 12,933 0
The above table does not reflect layoffs that may be necessary in the absence of negotiated workforce savings.
STATE OPERATIONS
ALL FUNDS FINANCIAL REQUIREMENTS BY FUND TYPE APPROPRIATIONS
(dollars)
Fund Type Available
2010-11Recommended
2011-12 ChangeSpecial Revenue Funds - Other 145,000,000 175,400,000 30,400,000 Fiduciary Funds 1,860,258,000 1,880,890,000 20,632,000 Total 2,005,258,000 2,056,290,000 51,032,000
STATE OPERATIONS
ALL FUNDS FINANCIAL REQUIREMENTS BY PROGRAM APPROPRIATIONS
(dollars)
Program Available
2010-11Recommended
2011-12 ChangeInstitutional Support Services
Special Revenue Funds - Other 145,000,000 175,400,000 30,400,000 Fiduciary Funds 1,860,258,000 1,880,890,000 20,632,000
Total 2,005,258,000 2,056,290,000 51,032,000
AID TO LOCALITIES
ALL FUNDS FINANCIAL REQUIREMENTS BY FUND TYPE APPROPRIATIONS
(dollars)
Fund Type Available
2010-11Recommended
2011-12 ChangeGeneral Fund 1,216,362,110 1,202,703,000 (13,659,110) Special Revenue Funds - Federal 7,554,000 0 (7,554,000) Total 1,223,916,110 1,202,703,000 (21,213,110)
AID TO LOCALITIES
ALL FUNDS FINANCIAL REQUIREMENTS BY PROGRAM APPROPRIATIONS
(dollars)
Program Available
2010-11Recommended
2011-12 ChangeAmerican Recovery and Reinvestment Act
of 2009 State Stabilization Fund Special Revenue Funds - Federal 7,554,000 0 (7,554,000)
Community College Programs General Fund 154,397,110 172,497,765 18,100,655
Institutional Support Services General Fund 1,059,965,000 1,028,205,235 (31,759,765)
Senior College Pension Payments General Fund 2,000,000 2,000,000 0
Total 1,223,916,110 1,202,703,000 (21,213,110)

CITY UNIVERSITY
39
CAPITAL PROJECTS ALL FUNDS FINANCIAL REQUIREMENTS BY PROGRAM
APPROPRIATIONS (dollars)
Comprehensive Construction Program Available
2010-11Recommended
2011-12 Change Reappropriations
2011-12 Senior Colleges General Maintenance and Improvements
Capital Projects Fund 0 0 0 45,521,000 Cap Proj Fund - CUNY (Direct Auth Bonds) 284,222,000 284,222,000 0 2,979,615,000
Program Changes - Expansion and Improvements Capital Projects Fund 0 0 0 697,000
New Facilities Cap Proj Fund - CUNY (Direct Auth Bonds) 0 0 0 108,840,000
Project Administration Capital Projects Fund 0 21,000,000 21,000,000 0 Subtotal 284,222,000 305,222,000 21,000,000 3,134,673,000 Community Colleges
General Maintenance and Improvements Capital Projects Fund 0 0 0 13,330,000 Cap Proj Fund - CUNY (Direct Auth Bonds) 34,563,000 31,239,000 (3,324,000) 431,828,000 Subtotal 34,563,000 31,239,000 (3,324,000) 445,158,000
Total 318,785,000 336,461,000 17,676,000 3,579,831,000

40
DEPARTMENT OF CIVIL SERVICE MISSION In accordance with the Civil Service Law, the Department of Civil Service is charged with providing human resource management services to State and local governments. The Department assists State agencies with personnel recruitment and placement services, administers tests, oversees job classifications, and administers benefits. ORGANIZATION AND STAFFING Based in Albany, the Department of Civil Service operates under the direction of a Commissioner who is appointed by the Governor, subject to Senate confirmation. The Commissioner of Civil Service also serves as the President of the Civil Service Commission, along with two additional Commissioners appointed by the Governor. The Commission acts as an appellate body responsible for reviewing determinations of the Department and the Director of Classification and Compensation. BUDGET HIGHLIGHTS The Executive Budget recommends $59.7 million All Funds ($16.7 million General Fund; $40.7 million Internal Service Fund; $2.3 million Other Funds) for the Department of Civil Service. This is a decrease in the General Fund of $1.9 million (-10 percent) from the 2010-11 budget. The Executive Budget reduces each agency’s General Fund State Operations budget by 10 percent. These savings are intended to be achieved through administrative efficiencies in non-personal service and negotiated workforce savings that minimize layoffs to the extent possible. PROGRAM HIGHLIGHTS In 2010-11, the Department worked with agencies involved in recent consolidations and transfers of function, including the Division of Homeland Security and Emergency Services, the Statewide Financial System, and the Department of Transportation’s takeover of I-84 maintenance from the Thruway Authority. In addition, the Department played a key role in implementation of Chapter 500 of the Laws of 2009, which created a pilot program designed to reduce the State’s reliance on private information technology consulting services. The law authorized up to 500 term appointments to information technology positions requiring special skills or expertise for a maximum of five years. The implementation of Federal health reform will continue to be an integral part of the Department’s operations in the coming years, as part of its responsibility to administer employee health benefits. The 2010 enactment of the Federal Patient Protection and Affordable Care Act (ACA) and the Health Care and Education Reconciliation Act will require significant reforms to the State health plans. It is anticipated that these changes will be implemented by the Department in phases over the next several years. In 2010, the U.S. Department of Health and Human Services approved NYSHIP’s application to participate in the Early Retirement Reinsurance Program (ERRP). This new program provides financial assistance to public and private employers by offsetting the cost of health insurance claims incurred by retirees age 55 to 64 that are not old enough to be eligible for Medicare. The funding is intended to encourage employers to

CIVIL SERVICE
41
maintain insurance coverage for those retirees and must be used to offset future premium increases for NYSHIP employers and enrollees. The Department estimates NYSHIP may receive more than $100 million over two years of the program. As part of the premium-setting process each year, the Department, assisted by its actuarial consultant, reviews carrier premium demands and negotiates reductions in premium to more accurately reflect expected claim costs and allowable administrative expenses in the coming plan year. For 2011, carriers requested premium increases of approximately 20 percent. After negotiations, the insurers agreed to 2011 premiums which on average increased 12.7 percent.
ALL FUNDS APPROPRIATIONS
(dollars)
Category Available
2010-11
AppropriationsRecommended
2011-12 Change
ReappropriationsRecommended
2011-12State Operations 61,554,000 59,695,000 (1,859,000) 0 Aid To Localities 0 0 0 0 Capital Projects 0 0 0 0 Total 61,554,000 59,695,000 (1,859,000) 0
ALL FUND TYPES
PROJECTED LEVELS OF EMPLOYMENT BY PROGRAM FILLED ANNUAL SALARIED POSITIONS
Full-Time Equivalent Positions (FTE)
Program
2010-11Estimated FTEs
03/31/11
2011-12Estimated FTEs
03/31/12 FTE ChangeAdministration and Information
Management General Fund 30 30 0 Internal Service Funds 21 21 0
Commission Operations and Municipal Assistance General Fund 15 15 0
Labor Management Programs General Fund 13 13 0
Personnel Benefit Services General Fund 25 25 0 Internal Service Funds 152 152 0
Personnel Management Services General Fund 134 134 0 Special Revenue Funds - Other 5 5 0 Internal Service Funds 49 49 0
Total 444 444 0
The above table does not reflect layoffs that may be necessary in the absence of negotiated workforce savings.
STATE OPERATIONS
ALL FUNDS FINANCIAL REQUIREMENTS BY FUND TYPE APPROPRIATIONS
(dollars)
Fund Type Available
2010-11Recommended
2011-12 ChangeGeneral Fund 18,593,000 16,734,000 (1,859,000) Special Revenue Funds - Other 2,257,000 2,257,000 0 Internal Service Funds 40,704,000 40,704,000 0 Total 61,554,000 59,695,000 (1,859,000)

CIVIL SERVICE
42
STATE OPERATIONS ALL FUNDS FINANCIAL REQUIREMENTS BY PROGRAM
APPROPRIATIONS (dollars)
Program Available
2010-11Recommended
2011-12 ChangeAdministration and Information
Management General Fund 4,073,000 3,666,000 (407,000) Internal Service Funds 3,549,000 3,549,000 0
Commission Operations and Municipal Assistance General Fund 887,000 798,000 (89,000)
Personnel Benefit Services General Fund 1,850,000 1,665,000 (185,000) Special Revenue Funds - Other 300,000 300,000 0 Internal Service Funds 29,799,000 29,799,000 0
Personnel Management Services General Fund 11,783,000 10,605,000 (1,178,000) Special Revenue Funds - Other 1,957,000 1,957,000 0 Internal Service Funds 7,356,000 7,356,000 0
Total 61,554,000 59,695,000 (1,859,000)
STATE OPERATIONS - GENERAL FUND
SUMMARY OF PERSONAL SERVICE APPROPRIATIONS AND CHANGES 2011-12 RECOMMENDED
(dollars)
Total Personal Service Regular
(Annual Salaried) Program Amount Change Amount ChangeAdministration and Information
Management 3,518,000 (391,000) 3,517,000 (391,000)Commission Operations and Municipal
Assistance 753,000 (84,000) 752,000 (84,000)Personnel Benefit Services 1,546,000 (171,000) 1,507,000 (171,000)Personnel Management Services 10,301,000 (1,145,000) 9,450,000 (1,145,000) Total 16,118,000 (1,791,000) 15,226,000 (1,791,000)
Temporary Service
(Nonannual Salaried) Holiday/Overtime Pay
Program Amount Change Amount ChangeAdministration and Information
Management 0 0 1,000 0 Commission Operations and Municipal
Assistance 0 0 1,000 0 Personnel Benefit Services 28,000 0 11,000 0 Personnel Management Services 750,000 0 101,000 0 Total 778,000 0 114,000 0
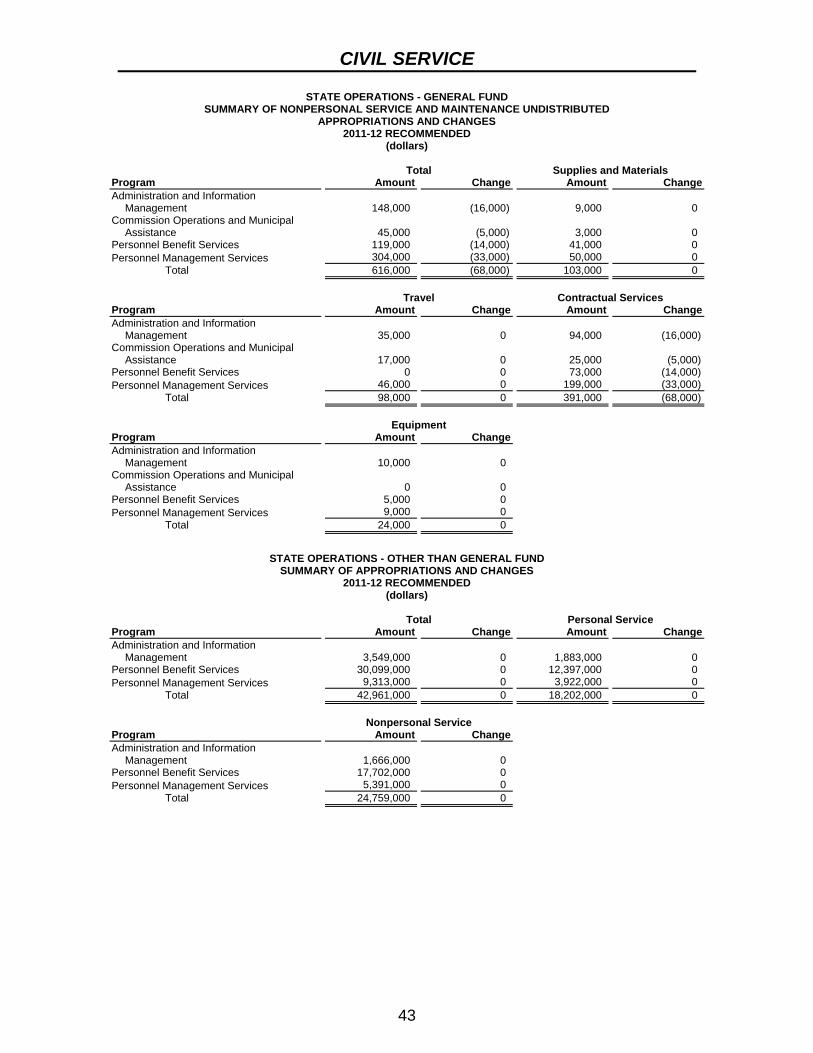
CIVIL SERVICE
43
STATE OPERATIONS - GENERAL FUND SUMMARY OF NONPERSONAL SERVICE AND MAINTENANCE UNDISTRIBUTED
APPROPRIATIONS AND CHANGES 2011-12 RECOMMENDED
(dollars) Total Supplies and Materials Program Amount Change Amount ChangeAdministration and Information
Management 148,000 (16,000) 9,000 0 Commission Operations and Municipal
Assistance 45,000 (5,000) 3,000 0 Personnel Benefit Services 119,000 (14,000) 41,000 0 Personnel Management Services 304,000 (33,000) 50,000 0 Total 616,000 (68,000) 103,000 0 Travel Contractual Services Program Amount Change Amount ChangeAdministration and Information
Management 35,000 0 94,000 (16,000)Commission Operations and Municipal
Assistance 17,000 0 25,000 (5,000)Personnel Benefit Services 0 0 73,000 (14,000)Personnel Management Services 46,000 0 199,000 (33,000) Total 98,000 0 391,000 (68,000) Equipment Program Amount Change Administration and Information
Management 10,000 0 Commission Operations and Municipal
Assistance 0 0 Personnel Benefit Services 5,000 0 Personnel Management Services 9,000 0 Total 24,000 0
STATE OPERATIONS - OTHER THAN GENERAL FUND
SUMMARY OF APPROPRIATIONS AND CHANGES 2011-12 RECOMMENDED
(dollars) Total Personal Service Program Amount Change Amount ChangeAdministration and Information
Management 3,549,000 0 1,883,000 0 Personnel Benefit Services 30,099,000 0 12,397,000 0 Personnel Management Services 9,313,000 0 3,922,000 0 Total 42,961,000 0 18,202,000 0 Nonpersonal Service Program Amount Change Administration and Information
Management 1,666,000 0 Personnel Benefit Services 17,702,000 0 Personnel Management Services 5,391,000 0 Total 24,759,000 0
44
DEPARTMENT OF CORRECTIONS AND COMMUNITY SUPERVISION
MISSION The Department of Corrections and Community Supervision – the combined entity which will result from the proposed merger of the Department of Correctional Services and the Division of Parole – will be responsible for the safe and secure confinement of convicted felons, preparing these individuals for successful reintegration into the community upon release, setting the conditions of release, supervising offenders in the community, and assisting parolees toward successful completion of their sentence. ORGANIZATION AND STAFFING The 2011-12 Executive Budget redesigns the provision of State services and recalibrates State spending by merging the Department of Correctional Services and the Division of Parole into the new Department of Corrections and Community Supervision. The agency will have a new unified mission – to provide offenders support throughout the period of incarceration and reintegration into the community, thereby increasing their ability to successfully return to the community. By blending the operations of the formerly separate agencies, the focus on re-entry is strengthened, and the integration of programming both inside and outside the prisons is improved. By enhancing the prospects of offenders successfully returning to life in their home communities, the agency lowers the risk of new crimes, makes the community safer, and reduces the costs of returning offenders to prison. The Department oversees the nation’s fourth largest state prison system, currently operating 67 institutions, grouped within nine regional hubs. Each of the 65 correctional facilities, as well as the Willard Drug Treatment Campus in Seneca County and including Edgecombe Residential Treatment Facility in Manhattan – both of which are operated by the Department in cooperation with the Office of Alcoholism and Substance Abuse Services, is managed by a Superintendent, who reports to the Commissioner. More than 19,800 – or 64 percent – of the new combined Department’s staff are security personnel, with remaining staff primarily dedicated to the delivery of inmate programs, health services, community supervision and facility operations. Community supervision staff is located across the State in 38 community-based field supervision offices. The Parole Board will continue as an independent body, housed within and receiving administrative support from the new agency. The members of the Board are appointed by the Governor, and confirmed by the Senate. One member is designated by the Governor to serve as the Board’s Chair. Board members review the cases of offenders eligible for parole release and determine if the offender should be released to parole supervision. BUDGET HIGHLIGHTS The Executive Budget recommends $2.9 billion All Funds ($2.4 billion General Fund; $39 million Federal Funds; $30 million Other Funds; $74 million Internal Service Funds; $43 million Enterprise Funds; $320 million in Capital Projects Funds) for the Department of Corrections and Community Supervision. There is a decrease of $271 million in General Fund State Operations appropriations (-10 percent) from the combined 2010-11 totals of the Department of Correctional Services and the Division of

CORRECTIONS AND COMMUNITY SUPERVISION
45
Parole. The Executive Budget reduces each agency’s General Fund State Operations budget by 10 percent. Generally these savings are intended to be achieved through administrative efficiencies in non-personal service and negotiated workforce savings that minimize layoffs to the extent possible. In this Department, savings are also anticipated from the closure of prison facilities, reduced central office management staff, and the merger. Despite the efforts of the Department of Correctional Services to consolidate and achieve savings, the system continues to maintain more facilities than are necessary to house the State’s prison population safely. With the closure of only five small facilities during the past several years, excess capacity remains. Total capacity in medium and minimum general confinement facilities is approximately 36,400 beds, of which at least 3,500 are not needed. The transfer of inmates into facilities that operate the most efficiently and offer more rehabilitative services is expected to yield significant recurring savings and eliminate most of the excess capacity. The Governor will create a task force by Executive Order that will recommend the specific facilities to be closed. If the task force does not recommend rightsizing, the Commissioner would be empowered to implement facility closures. Communities impacted by the closures would receive assistance from the Governor’s new regional economic development councils, with up to $100 million available to help communities end their reliance on incarceration as a major source of employment and economic sustainability. PROGRAM HIGHLIGHTS CORRECTIONS Since peaking at nearly 71,600 in 1999, the under-custody prison population is projected to have declined by approximately 15,000 inmates by the end of the current fiscal year. This decline can be largely attributed to the dramatic drop in the State’s crime rate over the last decade, and the success of legislatively enacted programs that allow certain non-violent offenders to earn time off their sentences for good behavior and program achievements. As soon as an inmate enters prison, an assessment is conducted to determine the need for rehabilitative programs. The Department offers a variety of programs designed to improve the prospects of an offender’s successful re-entry into the community. These include educational programming, with the minimum goal of assisting inmates who do not have high school diplomas to receive General Equivalency Diplomas; apprenticeships; substance abuse treatment services; anger management therapy; and a sex offender treatment program which was expanded under the Sex Offender Management and Treatment Act of 2007. Meeting the critical need of providing appropriate levels of medical services is important to the safety of the prison system and to the general public when an inmate is released. The Department acts quickly to diagnose and begin treatment, if necessary, when an inmate enters prison and provides the greatest degree of services possible to seek a cure. The Department continues to expand and enhance its services for inmates with mental illness. The Department of Correctional Services opened a state-of-the-art Residential Mental Health Unit (RMHU) at Marcy Correctional Facility in Oneida County in

CORRECTIONS AND COMMUNITY SUPERVISION
46
December 2009 for up to 100 inmates with serious mental illness and disciplinary sanctions. The Department also plans to open a second, 60-bed RMHU at Five Points Correctional Facility in Seneca County in 2011-12. COMMUNITY SUPERVISION The Community Supervision program retains responsibility for activities conducted by the former Division of Parole. The focus of this program is to prepare inmates for re-entry into the community; assist the Board in making release determinations; and supervise parolees released from prison while supporting their successful reintegration into the community. Immediately upon being released from prison, parolees are assigned to a Field Parole Officer. Field Parole Officers supervise parolees by monitoring behavior, reviewing employment, evaluating treatment progress, and administering drug tests. In addition to closely monitoring offenders in the community, the Division helps parolees avoid reverting to a life of crime by contracting for various services to support their return to society, such as supportive housing and employment training. Through the merger, the Department will create a more seamless system for assessing the needs of offenders, ensuring access to services both inside and outside the confines of the prison walls, and addressing factors essential to successful community re-entry.
ALL FUNDS APPROPRIATIONS
(dollars)
Category Available
2010-11
AppropriationsRecommended
2011-12 Change
ReappropriationsRecommended
2011-12State Operations 2,875,707,000 2,605,074,000 (270,633,000) 39,422,000 Aid To Localities 22,171,000 17,171,000 (5,000,000) 15,153,000 Capital Projects 320,000,000 320,000,000 0 655,345,000 Total 3,217,878,000 2,942,245,000 (275,633,000) 709,920,000
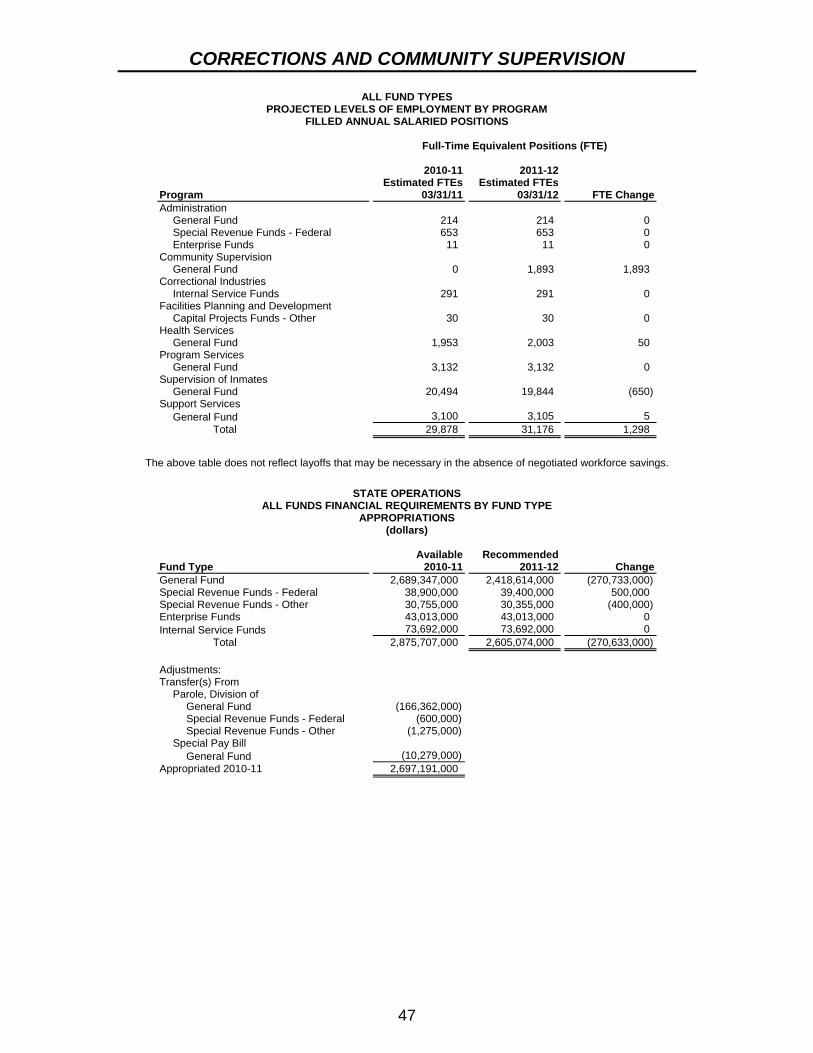
CORRECTIONS AND COMMUNITY SUPERVISION
47
ALL FUND TYPES PROJECTED LEVELS OF EMPLOYMENT BY PROGRAM
FILLED ANNUAL SALARIED POSITIONS Full-Time Equivalent Positions (FTE)
Program
2010-11Estimated FTEs
03/31/11
2011-12Estimated FTEs
03/31/12 FTE ChangeAdministration
General Fund 214 214 0 Special Revenue Funds - Federal 653 653 0 Enterprise Funds 11 11 0
Community Supervision General Fund 0 1,893 1,893
Correctional Industries Internal Service Funds 291 291 0
Facilities Planning and Development Capital Projects Funds - Other 30 30 0
Health Services General Fund 1,953 2,003 50
Program Services General Fund 3,132 3,132 0
Supervision of Inmates General Fund 20,494 19,844 (650)
Support Services General Fund 3,100 3,105 5
Total 29,878 31,176 1,298
The above table does not reflect layoffs that may be necessary in the absence of negotiated workforce savings.
STATE OPERATIONS
ALL FUNDS FINANCIAL REQUIREMENTS BY FUND TYPE APPROPRIATIONS
(dollars)
Fund Type Available
2010-11Recommended
2011-12 ChangeGeneral Fund 2,689,347,000 2,418,614,000 (270,733,000) Special Revenue Funds - Federal 38,900,000 39,400,000 500,000 Special Revenue Funds - Other 30,755,000 30,355,000 (400,000) Enterprise Funds 43,013,000 43,013,000 0 Internal Service Funds 73,692,000 73,692,000 0 Total 2,875,707,000 2,605,074,000 (270,633,000) Adjustments: Transfer(s) From
Parole, Division of General Fund (166,362,000) Special Revenue Funds - Federal (600,000) Special Revenue Funds - Other (1,275,000)
Special Pay Bill General Fund (10,279,000)
Appropriated 2010-11 2,697,191,000

CORRECTIONS AND COMMUNITY SUPERVISION
48
STATE OPERATIONS ALL FUNDS FINANCIAL REQUIREMENTS BY PROGRAM
APPROPRIATIONS (dollars)
Program Available
2010-11Recommended
2011-12 ChangeAdministration
General Fund 26,646,000 22,182,000 (4,464,000) Special Revenue Funds - Federal 38,300,000 38,800,000 500,000 Special Revenue Funds - Other 25,250,000 25,250,000 0 Enterprise Funds 2,701,000 2,701,000 0
Community Supervision General Fund 166,362,000 149,726,000 (16,636,000) Special Revenue Funds - Federal 600,000 600,000 0 Special Revenue Funds - Other 1,275,000 1,275,000 0
Correctional Industries Enterprise Funds 0 412,000 412,000 Internal Service Funds 73,692,000 73,692,000 0
Health Services General Fund 360,523,000 324,471,000 (36,052,000)
Program Services General Fund 234,257,000 210,832,000 (23,425,000) Special Revenue Funds - Other 100,000 100,000 0 Enterprise Funds 39,900,000 39,900,000 0
Supervision of Inmates General Fund 1,455,368,000 1,309,831,000 (145,537,000)
Support Services General Fund 446,191,000 401,572,000 (44,619,000) Special Revenue Funds - Other 4,130,000 3,730,000 (400,000) Enterprise Funds 412,000 0 (412,000)
Total 2,875,707,000 2,605,074,000 (270,633,000)
STATE OPERATIONS - GENERAL FUND
SUMMARY OF PERSONAL SERVICE APPROPRIATIONS AND CHANGES 2011-12 RECOMMENDED
(dollars)
Total Personal Service Regular
(Annual Salaried) Program Amount Change Amount ChangeAdministration 15,571,000 (1,730,000) 15,467,000 (1,718,000)Community Supervision 118,534,000 (13,170,000) 114,862,000 (12,762,000)Health Services 123,998,000 (13,778,000) 112,119,000 (12,458,000)Program Services 174,429,000 (19,381,000) 168,713,000 (18,746,000)Supervision of Inmates 1,288,290,000 (143,144,000) 1,218,294,000 (135,366,000)Support Services 160,200,000 (17,800,000) 150,467,000 (16,719,000) Total 1,881,022,000 (209,003,000) 1,779,922,000 (197,769,000)
Temporary Service
(Nonannual Salaried) Holiday/Overtime Pay
Program Amount Change Amount ChangeAdministration 0 0 104,000 (12,000)Community Supervision 63,000 (7,000) 3,609,000 (401,000)Health Services 5,282,000 (587,000) 6,597,000 (733,000)Program Services 5,014,000 (557,000) 702,000 (78,000)Supervision of Inmates 11,428,000 (1,270,000) 58,568,000 (6,508,000)Support Services 197,000 (22,000) 9,536,000 (1,059,000) Total 21,984,000 (2,443,000) 79,116,000 (8,791,000)

CORRECTIONS AND COMMUNITY SUPERVISION
49
STATE OPERATIONS - GENERAL FUND SUMMARY OF NONPERSONAL SERVICE AND MAINTENANCE UNDISTRIBUTED
APPROPRIATIONS AND CHANGES 2011-12 RECOMMENDED
(dollars) Total Supplies and Materials Program Amount Change Amount ChangeAdministration 6,611,000 (2,734,000) 345,000 (38,000)Community Supervision 31,192,000 (3,466,000) 960,000 (107,000)Health Services 200,473,000 (22,274,000) 78,345,000 (8,705,000)Program Services 36,403,000 (4,044,000) 7,018,000 (780,000)Supervision of Inmates 21,541,000 (2,393,000) 10,134,000 (1,126,000)Support Services 241,372,000 (26,819,000) 118,649,000 (13,183,000) Total 537,592,000 (61,730,000) 215,451,000 (23,939,000) Travel Contractual Services Program Amount Change Amount ChangeAdministration 306,000 (34,000) 5,372,000 (597,000)Community Supervision 3,404,000 (378,000) 25,471,000 (2,830,000)Health Services 381,000 (42,000) 120,965,000 (13,440,000)Program Services 415,000 (46,000) 26,967,000 (2,996,000)Supervision of Inmates 2,718,000 (302,000) 5,925,000 (658,000)Support Services 294,000 (33,000) 112,983,000 (12,554,000) Total 7,518,000 (835,000) 297,683,000 (33,075,000) Equipment Maintenance Undistributed Program Amount Change Amount ChangeAdministration 588,000 (65,000) 0 (2,000,000)Community Supervision 1,357,000 (151,000) 0 0 Health Services 782,000 (87,000) 0 0 Program Services 2,003,000 (222,000) 0 0 Supervision of Inmates 2,764,000 (307,000) 0 0 Support Services 9,446,000 (1,049,000) 0 0 Total 16,940,000 (1,881,000) 0 (2,000,000)
STATE OPERATIONS - OTHER THAN GENERAL FUND
SUMMARY OF APPROPRIATIONS AND CHANGES 2011-12 RECOMMENDED
(dollars) Total Personal Service Program Amount Change Amount ChangeAdministration 66,751,000 500,000 51,323,000 0 Community Supervision 1,875,000 0 100,000 0 Correctional Industries 74,104,000 412,000 20,239,000 0 Program Services 40,000,000 0 0 0 Support Services 3,730,000 (812,000) 0 0 Total 186,460,000 100,000 71,662,000 0 Nonpersonal Service Program Amount Change Administration 15,428,000 500,000 Community Supervision 1,775,000 0 Correctional Industries 53,865,000 412,000 Program Services 40,000,000 0 Support Services 3,730,000 (812,000) Total 114,798,000 100,000

CORRECTIONS AND COMMUNITY SUPERVISION
50
AID TO LOCALITIES ALL FUNDS FINANCIAL REQUIREMENTS BY FUND TYPE
APPROPRIATIONS (dollars)
Fund Type Available
2010-11Recommended
2011-12 ChangeGeneral Fund 11,171,000 6,171,000 (5,000,000) Internal Service Funds 11,000,000 11,000,000 0 Total 22,171,000 17,171,000 (5,000,000) Adjustments: Transfer(s) From
Parole, Division of General Fund (10,971,000) Internal Service Funds (11,000,000)
Appropriated 2010-11 200,000
AID TO LOCALITIES ALL FUNDS FINANCIAL REQUIREMENTS BY PROGRAM
APPROPRIATIONS (dollars)
Program Available
2010-11Recommended
2011-12 ChangeCommunity Supervision
General Fund 10,971,000 5,971,000 (5,000,000) Internal Service Funds 11,000,000 11,000,000 0
Support Services General Fund 200,000 200,000 0
Total 22,171,000 17,171,000 (5,000,000)
CAPITAL PROJECTS
ALL FUNDS FINANCIAL REQUIREMENTS BY PROGRAM APPROPRIATIONS
(dollars)
Comprehensive Construction Program Available
2010-11Recommended
2011-12 Change Reappropriations
2011-12Maintenance and Improvement of Existing Facilities
Correctional Facilities Capital Improvement Fund 320,000,000 320,000,000 0 655,345,000 Total 320,000,000 320,000,000 0 655,345,000

51
DIVISION OF CRIMINAL JUSTICE SERVICES MISSION The mission of the Division of Criminal Justice Services (DCJS) is to enhance public safety and improve criminal justice. DCJS is a multi-functional criminal justice agency with a variety of responsibilities including collection and analysis of statewide crime data; operation of the DNA Databank and criminal fingerprint files; administration of Federal and State funds that support local criminal justice programs; and administration of the State’s Sex Offender Registry. The Division also measures progress toward the overall goal of reducing crime, and tracks the effectiveness of both agency and system-wide criminal justice strategies designed to increase public safety. ORGANIZATION AND STAFFING The Division of Criminal Justice Services is located in Albany and is headed by a Commissioner who is appointed by the Governor subject to Senate confirmation. As part of the 2010-11 enacted budget, the former Division of Probation and Correctional Alternatives was merged into the Division of Criminal Justice Services and was reconstituted as the Office of Probation and Correctional Alternatives. BUDGET HIGHLIGHTS The Executive Budget recommends that the Office for the Prevention of Domestic Violence, the Office of Victim Services, and the State Commission of Correction merge into the Division of Criminal Justice Services. These agencies will be established as specialized offices within the Division to continue their important missions. The Division already provides administrative support to three of these smaller agencies, and a full merger offers a more efficient and cost-effective environment for the delivery of programs and services for which these agencies are responsible. The merger will also foster improved coordination of policies and programs. The Executive Budget recommends $347 million in All Funds support for the Division. This reflects a $6.4 million decrease (-10 percent) in the General Fund from 2010-11. The Executive Budget reduces each agency’s General Fund State Operations budget by 10 percent. These savings are intended to be achieved through administrative efficiencies in non-personal service and negotiated workforce savings that minimize layoffs to the extent possible. All Funds/ local assistance funding is reduced by $46 million in the 2011-12 Executive Budget, primarily reflecting the discontinuation of new appropriations for Federal American Recovery and Reinvestment Act (ARRA) funding. Local programs in the General Fund are reduced by $9.7 million, or an 8 percent decrease from the enacted 2010-11 Budget. Local assistance funding allocations for these programs will be made pursuant to a plan developed by the Commissioner, taking into consideration performance measures and program outcomes. PROGRAM HIGHLIGHTS The Division of Criminal Justice Services’ mission is to make New York the safest state in the nation. Through strategic planning, the Division is meeting the objective to continue lowering the crime rate in New York by: improving coordination among
CRIMINAL JUSTICE SERVICES
52
Federal, State, and local law enforcement agencies; making vital information more readily available to help fight crime; expanding the use of technology to combat crime; and, fostering inter-agency initiatives concerning sex offender management. The Division directly supports inter-agency law enforcement, in part through programs such as Operation IMPACT and the Promoting Safe Communities initiative. Operation IMPACT targets 17 counties that account for 80 percent of crime outside New York City. The focus of IMPACT is to bring together the resources and strategies of Federal, State and local law enforcement in order to fight crime more effectively. The Promoting Safe Communities initiative is intended to encourage the IMPACT jurisdictions to more intensely address spikes in discrete categories of violent crime with strategies designed to combat burglaries, persistent offenders, violent gangs and domestic violence. Additionally, the Division provides local assistance funding to support an array of criminal justice functions such as: law enforcement operations, prosecution, defense, crime laboratories, probation and alternatives to incarceration programs. The Division also supports four Crime Analysis Centers located in Albany, Buffalo, Rochester and Syracuse. Each of these Centers is governed by a board composed of key local law enforcement officials, and supervised by a Director employed by DCJS. The Centers are multi-jurisdictional units responsible for in-depth analysis of crime incidents, offender data and police calls that provide a comprehensive picture of the criminal environment within the Center’s geographical area of responsibility. As the central repository for criminal history records, the Division identifies individuals through fingerprint comparison and provides criminal history records to law enforcement through the Statewide Automated Fingerprint Identification System (SAFIS). A comparable service is offered for civil fingerprints to check the backgrounds of prospective employees for sensitive positions in government and the private sector. A new state-of-the-art fingerprint identification system will be fully implemented by October 2011. The Division also maintains a DNA Identification Index, conducts extensive criminal justice statistical research and policy analysis, and supports New York’s Uniform Crime Reporting program. Further, the Division coordinates and provides information technology services for the criminal justice community. A statewide criminal justice information system, eJusticeNY, is utilized by nearly 2,600 organizations, and provides users with the ability to: obtain rap-sheets; perform name searches; and access NYS criminal history data, wanted/missing person data and the complete NYS Sex Offender Registry. In addition, the Division acts as the State planning agency for the receipt and processing of Federal Juvenile Justice and Delinquency Prevention funding. These funds support programs addressing youth who are at risk of criminal and/or delinquent behavior. The Division also administers other Federal programs, including funds which support a statewide anti-drug strategy of prosecution and preventive enforcement efforts, and which focus on prosecution, law enforcement and victim services related to domestic violence. A key new activity was added following enactment of the 2009 Drug Law Reform. In conjunction with the Office of Alcoholism and Substance Abuse Services and the Office of Court Administration, the Division is undertaking a comprehensive analysis of the impacts of this major legislation, and will provide ongoing data on the implementation and effectiveness of the reforms. The Division is overseeing the allocation of $67 million in Federal funds through the American Reinvestment and

CRIMINAL JUSTICE SERVICES
53
Recovery Act to support drug law reform through investments in drug treatment, drug courts, alternatives to incarceration, probation, probation violation centers, and computer training and transitional employment for former offenders. The Office of Probation and Correctional Alternatives will continue to oversee county probation departments and community correction programs. It establishes standards, provides training and technical assistance, and monitors outcomes related to the supervision and treatment of offenders. The Office also will continue to focus on evidence-based practices, performance measurement, enhanced training and education for local providers, and improved technology. Within the newly merged agency, each of the three existing agencies will maintain their distinct mission, as described below. OFFICE FOR THE PREVENTION OF DOMESTIC VIOLENCE The Office for the Prevention of Domestic Violence (OPDV) will continue to: lead New York State’s efforts to respond to and prevent domestic violence; advise the Governor and Legislature; develop statewide policies; conduct domestic violence training for judges, prosecutors, police, attorneys, probation and parole personnel, social services and health care providers; and serve as a clearinghouse of information and guidance on domestic violence for the entire State. In conjunction with other agencies, the Office develops domestic violence policies and provides training and information about domestic violence. These programs clarify professional and legal responsibility to promote the safety of victims of domestic violence and to hold offenders accountable for their actions. OFFICE OF VICTIM SERVICES The Office of Victim Services (OVS) is the lead State source of assistance to persons who have been the victims of crime, particularly crimes of a violent nature. Its mission will continue to be: providing financial assistance to victims for losses they suffer as a result of crime; making grants to local agencies, which assist witnesses and victims; and, serving as the State’s advocate for crime victims’ rights, needs and interests. STATE COMMISSION OF CORRECTION The State Commission of Correction, comprised of 3 members appointed by the Governor, one of whom is the chair, will continue to regulate and oversee the operation and management of State and local correctional facilities, and secure youth facilities operated by the Office of Children and Family Services. The Commission’s primary role is to promote a safe, secure and stable correctional system and to provide for the accountability of corrections officials.

CRIMINAL JUSTICE SERVICES
54
ALL FUNDS APPROPRIATIONS
(dollars)
Category Available
2010-11
AppropriationsRecommended
2011-12 Change
ReappropriationsRecommended
2011-12State Operations 136,878,000 114,350,000 (22,528,000) 139,400,000 Aid To Localities 278,547,000 232,565,000 (45,982,000) 309,047,986 Capital Projects 0 0 0 0 Total 415,425,000 346,915,000 (68,510,000) 448,447,986
ALL FUND TYPES
PROJECTED LEVELS OF EMPLOYMENT BY PROGRAM FILLED ANNUAL SALARIED POSITIONS
Full-Time Equivalent Positions (FTE)
Program
2010-11Estimated FTEs
03/31/11
2011-12Estimated FTEs
03/31/12 FTE ChangeAdministration
General Fund 100 100 0 Crime Prevention and Reduction Strategies
General Fund 0 450 450 Funding and Program Assistance
General Fund 58 0 (58) Special Revenue Funds - Federal 77 77 0 Special Revenue Funds - Other 4 4 0
Operation and Systems General Fund 311 0 (311) Special Revenue Funds - Federal 23 23 0
Oversight of Correctional Facilities General Fund 0 29 29
Prevention of Domestic Violence General Fund 0 14 14 Special Revenue Funds - Federal 0 2 2 Internal Service Funds 0 10 10
Probation and Correctional Alternatives General Fund 30 0 (30)
Public Safety General Fund 51 0 (51) Special Revenue Funds - Other 3 3 0
Victim Services Program Special Revenue Funds - Federal 0 24 24 Special Revenue Funds - Other 0 51 51
Total 657 787 130
The above table does not reflect layoffs that may be necessary in the absence of negotiated workforce savings.

CRIMINAL JUSTICE SERVICES
55
STATE OPERATIONS ALL FUNDS FINANCIAL REQUIREMENTS BY FUND TYPE
APPROPRIATIONS (dollars)
Fund Type Available
2010-11Recommended
2011-12 ChangeGeneral Fund 64,185,000 57,787,000 (6,398,000) Special Revenue Funds - Federal 40,886,000 30,361,000 (10,525,000) Special Revenue Funds - Other 30,917,000 25,312,000 (5,605,000) Internal Service Funds 890,000 890,000 0 Total 136,878,000 114,350,000 (22,528,000) Adjustments: Transfer(s) From
Correction, Commission of General Fund (2,975,000)
Prevention of Domestic Violence, Office for General Fund (1,365,000) Special Revenue Funds - Federal (1,100,000) Special Revenue Funds - Other (70,000) Internal Service Funds (890,000)
Victim Services, Office of Special Revenue Funds - Federal (3,061,000) Special Revenue Funds - Other (7,268,000)
Appropriated 2010-11 120,149,000
STATE OPERATIONS ALL FUNDS FINANCIAL REQUIREMENTS BY PROGRAM
APPROPRIATIONS (dollars)
Program Available
2010-11Recommended
2011-12 ChangeAdministration
General Fund 13,974,000 12,577,000 (1,397,000) Crime Prevention and Reduction Strategies
General Fund 45,871,000 40,870,000 (5,001,000) Special Revenue Funds - Federal 22,725,000 24,700,000 1,975,000 Special Revenue Funds - Other 23,579,000 18,079,000 (5,500,000)
Funding and Program Assistance Special Revenue Funds - Federal 12,500,000 0 (12,500,000)
Oversight of Correctional Facilities General Fund 2,975,000 2,975,000 0
Prevention of Domestic Violence General Fund 1,365,000 1,365,000 0 Special Revenue Funds - Federal 2,600,000 2,600,000 0 Special Revenue Funds - Other 70,000 70,000 0 Internal Service Funds 890,000 890,000 0
Victim Services Program Special Revenue Funds - Federal 3,061,000 3,061,000 0 Special Revenue Funds - Other 7,268,000 7,163,000 (105,000)
Total 136,878,000 114,350,000 (22,528,000)

CRIMINAL JUSTICE SERVICES
56
STATE OPERATIONS - GENERAL FUND SUMMARY OF PERSONAL SERVICE APPROPRIATIONS AND CHANGES
2011-12 RECOMMENDED (dollars)
Total Personal Service Regular
(Annual Salaried) Program Amount Change Amount ChangeAdministration 6,074,000 (675,000) 6,070,000 (674,000)Crime Prevention and Reduction Strategies 26,615,000 (3,256,000) 26,531,000 (3,246,000)Oversight of Correctional Facilities 2,453,000 0 2,433,000 0 Prevention of Domestic Violence 1,213,000 0 1,213,000 0 Total 36,355,000 (3,931,000) 36,247,000 (3,920,000)
Temporary Service
(Nonannual Salaried) Holiday/Overtime Pay
Program Amount Change Amount ChangeAdministration 0 0 4,000 (1,000)Crime Prevention and Reduction Strategies 15,000 (2,000) 69,000 (8,000)Oversight of Correctional Facilities 0 0 20,000 0 Prevention of Domestic Violence 0 0 0 0 Total 15,000 (2,000) 93,000 (9,000)
STATE OPERATIONS - GENERAL FUND
SUMMARY OF NONPERSONAL SERVICE AND MAINTENANCE UNDISTRIBUTED APPROPRIATIONS AND CHANGES
2011-12 RECOMMENDED (dollars)
Total Supplies and Materials Program Amount Change Amount ChangeAdministration 6,503,000 (722,000) 880,000 (98,000)Crime Prevention and Reduction Strategies 14,255,000 (1,745,000) 597,000 (74,000)Oversight of Correctional Facilities 522,000 0 15,000 0 Prevention of Domestic Violence 152,000 0 50,000 0 Total 21,432,000 (2,467,000) 1,542,000 (172,000) Travel Contractual Services Program Amount Change Amount ChangeAdministration 31,000 (3,000) 4,961,000 (551,000)Crime Prevention and Reduction Strategies 437,000 (53,000) 11,312,000 (1,384,000)Oversight of Correctional Facilities 176,000 0 323,000 0 Prevention of Domestic Violence 42,000 0 42,000 0 Total 686,000 (56,000) 16,638,000 (1,935,000) Equipment Program Amount Change Administration 631,000 (70,000) Crime Prevention and Reduction Strategies 1,909,000 (234,000) Oversight of Correctional Facilities 8,000 0 Prevention of Domestic Violence 18,000 0 Total 2,566,000 (304,000)

CRIMINAL JUSTICE SERVICES
57
STATE OPERATIONS - OTHER THAN GENERAL FUND SUMMARY OF APPROPRIATIONS AND CHANGES
2011-12 RECOMMENDED (dollars)
Total Personal Service Program Amount Change Amount ChangeCrime Prevention and Reduction Strategies 42,779,000 (3,525,000) 11,900,000 475,000 Funding and Program Assistance 0 (12,500,000) 0 0 Prevention of Domestic Violence 3,560,000 0 2,370,000 0 Victim Services Program 10,224,000 (105,000) 6,089,000 0 Total 56,563,000 (16,130,000) 20,359,000 475,000 Nonpersonal Service Maintenance Undistributed Program Amount Change Amount ChangeCrime Prevention and Reduction Strategies 30,879,000 (3,500,000) 0 (500,000)Funding and Program Assistance 0 0 0 (12,500,000)Prevention of Domestic Violence 1,190,000 0 0 0 Victim Services Program 4,135,000 (105,000) 0 0 Total 36,204,000 (3,605,000) 0 (13,000,000)
AID TO LOCALITIES
ALL FUNDS FINANCIAL REQUIREMENTS BY FUND TYPE APPROPRIATIONS
(dollars)
Fund Type Available
2010-11Recommended
2011-12 ChangeGeneral Fund 116,475,000 106,807,000 (9,668,000) Special Revenue Funds - Federal 96,818,000 67,768,000 (29,050,000) Special Revenue Funds - Other 65,254,000 57,990,000 (7,264,000) Total 278,547,000 232,565,000 (45,982,000) Adjustments: Transfer(s) From
Prevention of Domestic Violence, Office for General Fund (685,000) Special Revenue Funds - Federal (500,000)
Victim Services, Office of Special Revenue Funds - Federal (37,843,000) Special Revenue Funds - Other (30,627,000)
Transfer(s) To Victim Services, Office of
Special Revenue Funds - Federal 1,450,000 Appropriated 2010-11 210,342,000
AID TO LOCALITIES
ALL FUNDS FINANCIAL REQUIREMENTS BY PROGRAM APPROPRIATIONS
(dollars)
Program Available
2010-11Recommended
2011-12 ChangeCrime Prevention and Reduction Strategies
General Fund 115,790,000 106,122,000 (9,668,000) Special Revenue Funds - Federal 24,175,000 24,375,000 200,000 Special Revenue Funds - Other 34,627,000 27,363,000 (7,264,000)
Funding and Program Assistance Special Revenue Funds - Federal 28,750,000 0 (28,750,000)
Prevention of Domestic Violence General Fund 685,000 685,000 0 Special Revenue Funds - Federal 7,500,000 7,000,000 (500,000)
Victim Services Program Special Revenue Funds - Federal 36,393,000 36,393,000 0 Special Revenue Funds - Other 30,627,000 30,627,000 0
Total 278,547,000 232,565,000 (45,982,000)

58
DEVELOPMENTAL DISABILITIES PLANNING COUNCIL
MISSION The New York State Developmental Disabilities Planning Council is fully funded under the Federal Developmental Disabilities Assistance and Bill of Rights Act. The Act, originally signed into law in 1975, authorizes the Council to prepare, implement and monitor a plan for improving the quality of life for people with developmental disabilities. ORGANIZATION AND STAFFING Located in Albany, the Council comprises 26 current members who have been appointed by the Governor to three-year staggered terms. Federal law requires that at least 60 percent of the Council’s membership be persons with developmental disabilities, parents or guardians of children with developmental disabilities and immediate relatives or guardians of adults with mentally impairing developmental disabilities who cannot advocate for themselves. Other required members represent State agencies, educational and training providers and local, public and private service agencies. The Governor appoints the Chairperson of the Council from among the Council’s members. In addition, a full-time staff of 18, under the leadership of an Executive Director, assists the Council in carrying out its mission. BUDGET HIGHLIGHTS The Executive Budget recommends $4.8 million All Funds (all Federal funds) for the Council. This represents the same level of funding as in 2010-11 and is based on the level of anticipated Federal funding. This funding is sufficient to support the Council’s role in coordinating information about persons with developmental disabilities and the services available to them, and in overseeing grant funds. Federal funds fully support all Council operations and contracts with non-profit agencies to develop new services and service delivery methods. The contracts are monitored by the Council to ensure that Federal funds provided to the State are used to augment – rather than duplicate or replace – existing services for people with developmental disabilities. PROGRAM HIGHLIGHTS Through its Council membership of State agency heads, including the Commissioner of the Office for People with Developmental Disabilities, the Council employs an interagency approach to advocate improved and enhanced services, supports and assistance for persons with developmental disabilities. Its activities include conducting quarterly meetings, preparing policy papers on issues affecting people with developmental disabilities and their families, providing training and technical assistance and implementing its current five-year State Plan (FFY 2007 – FFY 2011). For 2011-12, the Council will continue to identify and fund new and innovative demonstration programs in support of its multi-year State Plan, including those aimed at increasing the number of available employment opportunities, enhancing programmatic responsiveness

DEVELOPMENTAL DISABILITIES PLANNING
59
to maximize the inclusion of children with developmental disabilities in education and early intervention, ensuring access to and expanding health and wellness programs, promoting choice in housing, and reducing obstacles in transportation to facilitate community integration. In support of these and other strategic objectives, the Council works with persons with developmental disabilities, parents, service providers, advocacy groups and local and State government agencies to advocate for an enhanced system of community services, individualized supports and assistance that facilitates self-determination, independence, community inclusion and productivity.
ALL FUNDS APPROPRIATIONS
(dollars)
Category Available
2010-11
AppropriationsRecommended
2011-12 Change
ReappropriationsRecommended
2011-12State Operations 4,760,000 4,760,000 0 4,400,000 Aid To Localities 0 0 0 0 Capital Projects 0 0 0 0 Total 4,760,000 4,760,000 0 4,400,000
ALL FUND TYPES
PROJECTED LEVELS OF EMPLOYMENT BY PROGRAM FILLED ANNUAL SALARIED POSITIONS
Full-Time Equivalent Positions (FTE)
Program
2010-11Estimated FTEs
03/31/11
2011-12Estimated FTEs
03/31/12 FTE ChangeDevelopmental Disabilities Planning
Special Revenue Funds - Federal 18 18 0 Total 18 18 0
The above table does not reflect layoffs that may be necessary in the absence of negotiated workforce savings.
STATE OPERATIONS
ALL FUNDS FINANCIAL REQUIREMENTS BY FUND TYPE APPROPRIATIONS
(dollars)
Fund Type Available
2010-11Recommended
2011-12 ChangeSpecial Revenue Funds - Federal 4,750,000 4,750,000 0 Enterprise Funds 10,000 10,000 0 Total 4,760,000 4,760,000 0
STATE OPERATIONS
ALL FUNDS FINANCIAL REQUIREMENTS BY PROGRAM APPROPRIATIONS
(dollars)
Program Available
2010-11Recommended
2011-12 ChangeDevelopmental Disabilities Planning
Special Revenue Funds - Federal 4,750,000 4,750,000 0 Enterprise Funds 10,000 10,000 0
Total 4,760,000 4,760,000 0

DEVELOPMENTAL DISABILITIES PLANNING
60
STATE OPERATIONS - OTHER THAN GENERAL FUND SUMMARY OF APPROPRIATIONS AND CHANGES
2011-12 RECOMMENDED (dollars)
Total Personal Service Program Amount Change Amount ChangeDevelopmental Disabilities Planning 4,760,000 0 1,165,000 0 Total 4,760,000 0 1,165,000 0 Nonpersonal Service Program Amount Change Developmental Disabilities Planning 3,595,000 0 Total 3,595,000 0
61
DEPARTMENT OF ECONOMIC DEVELOPMENT
MISSION Together with the Empire State Development Corporation, the New York State Department of Economic Development:
Advises the Governor and Legislature on all major economic development issues and decisions;
Develops State economic development strategies; Provides technical and financial assistance to businesses through a network of
regional offices; and Coordinates the efforts of other State agencies, authorities and organizations, as
well as local governments, on actions that affect the State’s economy. ORGANIZATION AND STAFFING State economic development programs are administered by the Department of Economic Development working in conjunction with the Empire State Development Corporation. The Department is headed by a Commissioner, who also serves as President and CEO of the Empire State Development Corporation and is appointed by the Governor subject to Senate confirmation. The Department’s central office is in Albany, with ten regional offices located in Troy, Buffalo, Rochester, Syracuse, Utica, Binghamton, New Windsor, Plattsburgh, Hauppauge and New York City, and satellite offices in Watertown and Elmira. BUDGET HIGHLIGHTS The Executive Budget recommends $28.3 million All Funds ($23.5 million General Fund; $4.8 million other funds) for the Department of Economic Development. This reflects a $2.3 million decrease (-7.5 percent) from 2010-11, all associated with a 10 percent year-to-year reduction in General Fund spending on State operations. The Executive Budget reduces each agency’s General Fund State Operations budget by 10 percent. These savings are intended to be achieved through administrative efficiencies in non-personal service and negotiated workforce savings that minimize layoffs to the extent possible. State tax dollars from the General Fund will finance 83 percent, or $23.5 million, of the Department of Economic Development’s budget in 2011-12. The balance of the Department’s Executive Budget will be supported by revenues raised through licensing of the “I ♥ NY” logo, and through seminars and programs run by the Department that directly offset the costs of these programs. Also included are Federal dollars used to help defense-dependent industries diversify into new markets, support recycling market development and help small businesses comply with Clean Air Act mandates. The 2011-12 Budget provides:
“I ♥ NY” Program: $3.6 million for “I ♥ NY” tourism advertising; Tourism Matching Grants: $3.8 million to assist local tourism promotion
agencies; International Trade: $1.1 million to attract international investment to New
York State and increase export sales to foreign countries;

ECONOMIC DEVELOPMENT
62
PROGRAM HIGHLIGHTS EXCELSIOR JOBS PROGRAM The Excelsior Jobs Program, created as part of the 2010-11 Budget, acts as the State’s premier job creating tax incentive program. The Department of Economic Development administers the program and offers a package of tax credits for selected firms in targeted industries that create and maintain new jobs in New York for five years. The tax credits, each of which is fully refundable, include the following: Excelsior Jobs Tax Credit, Excelsior Investment Tax Credit (ITC), Excelsior Research and Development (R&D) Tax Credit, and the Excelsior Real Property Tax Credit (RPTC). The 2011-12 Executive Budget includes legislation that would strengthen the effectiveness of the program by extending the benefit period from five to ten years and offering an enriched package of tax credits designed to further incentivize the creation of new jobs and investments in New York. MARKETING AND ADVERTISING This program promotes New York State as a premier tourist destination and business location. Major activities include the “I ♥ NY” advertising campaign and local tourism matching grants administered through locally based tourism promotion agencies representing the State’s 62 counties. The Department of Economic Development also develops the State’s tourism master plan, targets information to consumers and the travel trade, participates in national and international trade shows, provides technical assistance to tour directors and creates publications for use by the Department and the other economic development agencies. INTERNATIONAL TRADE The International Trade program promotes exports from, and attracts foreign investment to, New York State. The program coordinates State participation in trade shows and missions, compiles and disseminates trade leads, and administers grants and seminars designed to encourage increased exporting. EMPIRE ZONES The Empire Zones Program expired on June 30, 2010 and all existing certified firms – over 7,500 businesses – remain eligible to receive Empire Zone benefits through the remainder of their certification. The Department remains responsible for monitoring performance and compliance, and for obtaining and processing annual reports from these businesses. BUSINESS ASSISTANCE PROGRAMS To improve the competitiveness of New York State companies, the Department of Economic Development provides assistance to businesses for productivity assessments, business-specific skills training for new and existing workers, and third-party technical assistance to develop strategies for expanding export markets.

ECONOMIC DEVELOPMENT
63
SMALL BUSINESS ASSISTANCE The Division for Small Business serves as an ombudsman for small businesses and also offers these enterprises training and technical assistance. In addition, the Department provides State and Federal procurement assistance to small businesses. The Division also operates the Clean Air Act Ombudsman Unit, which helps small businesses comply with these environmental regulations. LINKED DEPOSIT PROGRAM This joint public-private program enables small businesses and companies in targeted investment areas to obtain loans from commercial banks at an interest rate that is 2 percent to 3 percent lower than the prevailing rate. The banks are compensated by deposits of State funds earning interest at comparably reduced rates. There is currently $560 million in State funding authorized for deposits at a lower interest rate. The 2011-12 Executive Budget will enhance the Linked Deposit program by increasing the maximum linked deposit loan from $1 million to $2 million and allowing for a four-year renewal of loans. This enhancement will expand utilization of the program by making more dollars available to help New York’s small businesses grow and create new jobs. RECYCLING MARKET DEVELOPMENT PROGRAM The Department of Economic Development is the lead agency in developing New York’s recycling industries and creating programs to help municipalities and businesses develop uses for secondary materials. MINORITY AND WOMEN’S BUSINESS DEVELOPMENT The Division of Minority and Women’s Business Development was established to increase the participation of minority- and women-owned businesses in State procurement opportunities. The Division identifies and certifies minority- and women-owned business enterprises; publishes a directory of certified firms to market small businesses to public and private sector organizations; and provides technical assistance to minority- and women-owned businesses. The 2011-12 Executive Budget will provide the necessary resources to increase minority- and women-owned business participation in State contracts and enhance business development opportunities, consistent with reforms enacted in 2010-11. POLICY AND RESEARCH DIVISION This Division develops the annual State strategic plan for economic development; collects and disseminates economic and demographic information; performs policy analysis and economic research; monitors and intervenes in State regulatory activities affecting energy supply, telecommunications, transportation, environmental facilities and commercial/industrial site and facility development; and coordinates the development and review of State economic development programs.
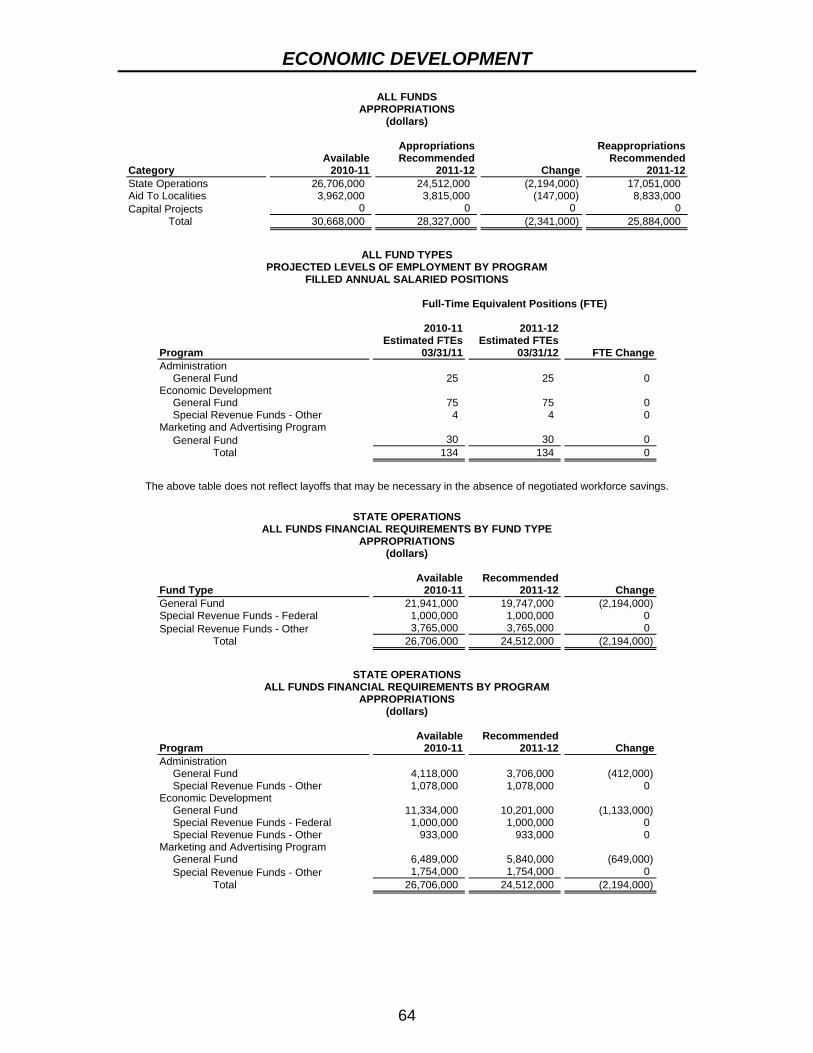
ECONOMIC DEVELOPMENT
64
ALL FUNDS APPROPRIATIONS
(dollars)
Category Available
2010-11
AppropriationsRecommended
2011-12 Change
ReappropriationsRecommended
2011-12State Operations 26,706,000 24,512,000 (2,194,000) 17,051,000 Aid To Localities 3,962,000 3,815,000 (147,000) 8,833,000 Capital Projects 0 0 0 0 Total 30,668,000 28,327,000 (2,341,000) 25,884,000
ALL FUND TYPES
PROJECTED LEVELS OF EMPLOYMENT BY PROGRAM FILLED ANNUAL SALARIED POSITIONS
Full-Time Equivalent Positions (FTE)
Program
2010-11Estimated FTEs
03/31/11
2011-12Estimated FTEs
03/31/12 FTE ChangeAdministration
General Fund 25 25 0 Economic Development
General Fund 75 75 0 Special Revenue Funds - Other 4 4 0
Marketing and Advertising Program General Fund 30 30 0
Total 134 134 0
The above table does not reflect layoffs that may be necessary in the absence of negotiated workforce savings.
STATE OPERATIONS
ALL FUNDS FINANCIAL REQUIREMENTS BY FUND TYPE APPROPRIATIONS
(dollars)
Fund Type Available
2010-11Recommended
2011-12 ChangeGeneral Fund 21,941,000 19,747,000 (2,194,000) Special Revenue Funds - Federal 1,000,000 1,000,000 0 Special Revenue Funds - Other 3,765,000 3,765,000 0 Total 26,706,000 24,512,000 (2,194,000)
STATE OPERATIONS
ALL FUNDS FINANCIAL REQUIREMENTS BY PROGRAM APPROPRIATIONS
(dollars)
Program Available
2010-11Recommended
2011-12 ChangeAdministration
General Fund 4,118,000 3,706,000 (412,000) Special Revenue Funds - Other 1,078,000 1,078,000 0
Economic Development General Fund 11,334,000 10,201,000 (1,133,000) Special Revenue Funds - Federal 1,000,000 1,000,000 0 Special Revenue Funds - Other 933,000 933,000 0
Marketing and Advertising Program General Fund 6,489,000 5,840,000 (649,000) Special Revenue Funds - Other 1,754,000 1,754,000 0
Total 26,706,000 24,512,000 (2,194,000)
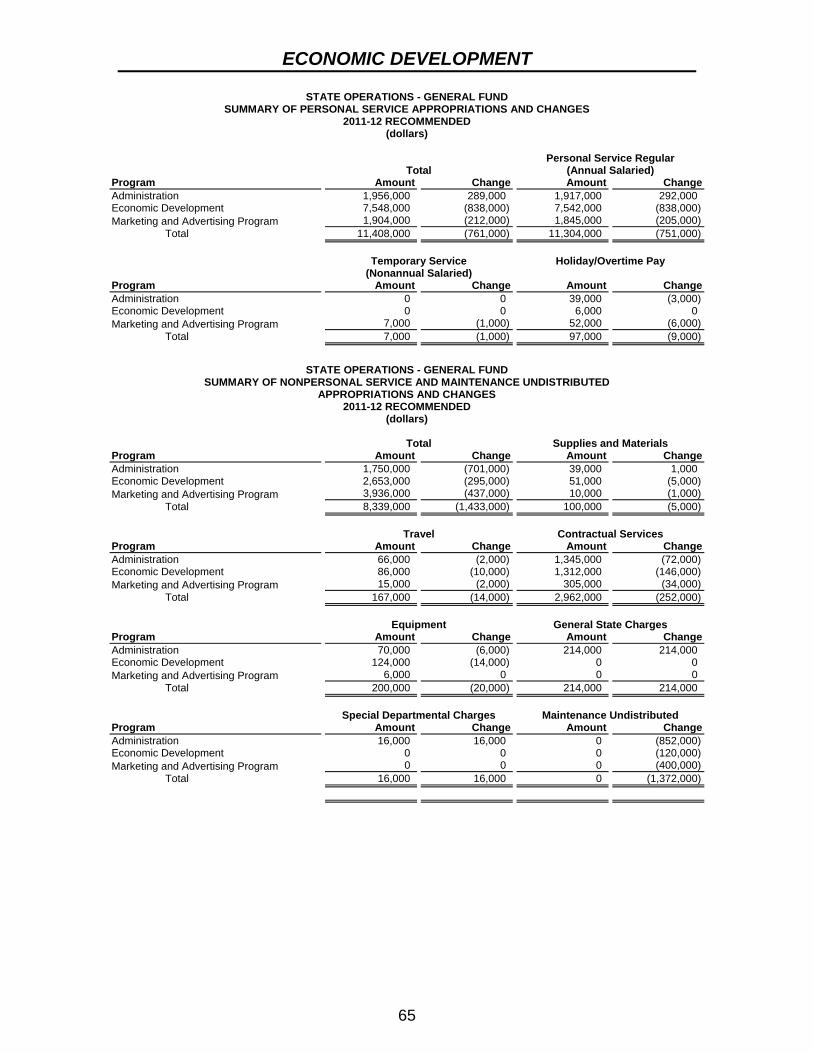
ECONOMIC DEVELOPMENT
65
STATE OPERATIONS - GENERAL FUND SUMMARY OF PERSONAL SERVICE APPROPRIATIONS AND CHANGES
2011-12 RECOMMENDED (dollars)
Total Personal Service Regular
(Annual Salaried) Program Amount Change Amount ChangeAdministration 1,956,000 289,000 1,917,000 292,000 Economic Development 7,548,000 (838,000) 7,542,000 (838,000)Marketing and Advertising Program 1,904,000 (212,000) 1,845,000 (205,000) Total 11,408,000 (761,000) 11,304,000 (751,000)
Temporary Service
(Nonannual Salaried) Holiday/Overtime Pay
Program Amount Change Amount ChangeAdministration 0 0 39,000 (3,000)Economic Development 0 0 6,000 0 Marketing and Advertising Program 7,000 (1,000) 52,000 (6,000) Total 7,000 (1,000) 97,000 (9,000)
STATE OPERATIONS - GENERAL FUND
SUMMARY OF NONPERSONAL SERVICE AND MAINTENANCE UNDISTRIBUTED APPROPRIATIONS AND CHANGES
2011-12 RECOMMENDED (dollars)
Total Supplies and Materials Program Amount Change Amount ChangeAdministration 1,750,000 (701,000) 39,000 1,000 Economic Development 2,653,000 (295,000) 51,000 (5,000)Marketing and Advertising Program 3,936,000 (437,000) 10,000 (1,000) Total 8,339,000 (1,433,000) 100,000 (5,000) Travel Contractual Services Program Amount Change Amount ChangeAdministration 66,000 (2,000) 1,345,000 (72,000)Economic Development 86,000 (10,000) 1,312,000 (146,000)Marketing and Advertising Program 15,000 (2,000) 305,000 (34,000) Total 167,000 (14,000) 2,962,000 (252,000) Equipment General State Charges Program Amount Change Amount ChangeAdministration 70,000 (6,000) 214,000 214,000 Economic Development 124,000 (14,000) 0 0 Marketing and Advertising Program 6,000 0 0 0 Total 200,000 (20,000) 214,000 214,000 Special Departmental Charges Maintenance Undistributed Program Amount Change Amount ChangeAdministration 16,000 16,000 0 (852,000)Economic Development 0 0 0 (120,000)Marketing and Advertising Program 0 0 0 (400,000) Total 16,000 16,000 0 (1,372,000)

ECONOMIC DEVELOPMENT
66
STATE OPERATIONS - OTHER THAN GENERAL FUND SUMMARY OF APPROPRIATIONS AND CHANGES
2011-12 RECOMMENDED (dollars)
Total Personal Service Program Amount Change Amount ChangeAdministration 1,078,000 0 195,000 0 Economic Development 1,933,000 0 0 0 Marketing and Advertising Program 1,754,000 0 84,000 0 Total 4,765,000 0 279,000 0 Nonpersonal Service Program Amount Change Administration 883,000 0 Economic Development 1,933,000 0 Marketing and Advertising Program 1,670,000 0 Total 4,486,000 0
AID TO LOCALITIES
ALL FUNDS FINANCIAL REQUIREMENTS BY FUND TYPE APPROPRIATIONS
(dollars)
Fund Type Available
2010-11Recommended
2011-12 ChangeGeneral Fund 3,962,000 3,815,000 (147,000) Total 3,962,000 3,815,000 (147,000)
AID TO LOCALITIES
ALL FUNDS FINANCIAL REQUIREMENTS BY PROGRAM APPROPRIATIONS
(dollars)
Program Available
2010-11Recommended
2011-12 ChangeMarketing and Advertising Program
General Fund 3,962,000 3,815,000 (147,000) Total 3,962,000 3,815,000 (147,000)
67
STATE EDUCATION DEPARTMENT MISSION The State Education Department (SED) is the administrative agency of the Board of Regents. The Department’s primary mission is to oversee public elementary and secondary education programs throughout New York and promote educational excellence, equity and cost-effectiveness. ORGANIZATION The Board of Regents oversees the State Education Department, which was originally established by the Legislature in 1784 and subsequently continued in the State Constitution. The Board of Regents is comprised of 17 members – one for each of the State’s 13 judicial districts, plus four statewide members – who are elected by a joint session of the Legislature for staggered 5-year terms. The Board elects its chair, who holds the title Chancellor, and appoints the Commissioner of Education as the chief administrative officer of the Department. The Department’s central operations are located in the Education Building in Albany. The Department also has regional service facilities at various locations throughout the State. BUDGET HIGHLIGHTS The Executive Budget recommends $29.63 billion in All Funds support ($18.76 billion General Fund; $10.87 billion Other Funds). This is a decrease of $3.2 billion (-9.7 percent) from the 2010-11 budget. This net change primarily reflects the loss of Federal American Recovery and Reinvestment Act of 2009 (ARRA) funds, a reduction to School Aid and other educational programs, and the addition of $500 million for two new performance programs for school districts. The Executive Budget reduces each agency’s General Fund State Operations budget by 10 percent. These savings are intended to be achieved through administrative efficiencies in nonpersonal service and negotiated workforce savings that minimize layoffs to the extent possible. SCHOOL AID The 2011-12 Executive Budget proposes $19.39 billion in School Aid for the 2011-12 school year. While the State remains committed to improving educational outcomes, the high cost of education is unsustainable. In order to achieve necessary savings, the Executive Budget maintains formula aid categories that provide operating support at current levels and recommends a $2.79 billion Gap Elimination Adjustment (GEA) for the 2011-12 school year. The GEA, combined with the loss of $1.34 billion in one-time Federal funding, and growth in expense-based aids of $305 million results in an overall School Aid year-to-year reduction of $1.54 billion (-7.3 percent). This proposed reduction represents 2.9 percent of school district budgets statewide. Even with this reduction, School Aid will continue to represent the largest State-supported program. On a State fiscal year basis, School Aid will comprise approximately 23 percent of State

EDUCATION
68
operating funds spending in 2011-12 and 29 percent of General Fund spending. The Executive Budget also recommends initiatives to help schools improve student performance and operate more efficiently. Major budget actions for the 2011-12 school year include:
School Year Support: The Executive Budget provides $19.39 billion in State support for public schools for the 2011-12 school year, a year-to-year decrease of $1.54 billion (-7.3 percent). Even with this reduction, School Aid will have increased by $5.70 billion, or 41.6 percent, since the 2000-01 school year.
Fiscal Year Support: The Executive Budget provides $18.74 billion in total appropriation support for public schools in 2011-12, a reduction of $1.29 billion from 2010-11 fiscal year appropriation support. In 2010-11, Federal funding provided under ARRA and the Federal Education Jobs Fund provided $1.45 billion in one-time revenue. The year-to-year reduction is primarily attributable to the loss of this one-time Federal funding.
Gap Elimination Adjustment: The Executive Budget recommends a Gap Elimination Adjustment (GEA) of $2.79 billion for the 2011-12 school year. This approach reduces School Aid progressively, accounting for each school district’s wealth, student need, administrative efficiency, and residential property tax burden. The GEA would be applied against formula-based School Aid, excluding Building Aid and Universal Prekindergarten Aid. In future years, as we redesign our approach to funding schools, the GEA would be continued and scaled to limit growth in School Aid to sustainable levels.
Foundation Aid: The Foundation Aid formula calculates funding based on the cost of an education in a successful school, student need, and local ability to pay. The Executive Budget recommends limiting Foundation Aid for the 2011-12 school year to the amount provided for the 2010-11 school year, $14.89 billion. The Executive Budget recommends extending the full phase-in of Foundation Aid to 2016-17.
Early Childhood Education: The Executive Budget recommends maintaining funding for Universal Prekindergarten for the 2011-12 school year at the 2010-11 level of $393 million. The planned full phase-in will be extended from the 2013-14 school year to the 2016-17 school year, consistent with the proposed phase-in of Foundation Aid. Maintaining funding at the 2010-11 level ensures continued school district participation, stability of funding for those school districts that are currently participating, and preserves the current commitment for this high priority program. Existing statutory provisions for school districts to receive Full-Day Kindergarten Conversion Aid are continued.
Support for School Construction: The Executive Budget recommends $2.66 billion in 2011-12 State support for the construction of school facilities. This reflects an increase of $171 million from the 2010-11 school year. In order to better target limited State resources for school construction, the Executive Budget recommends aligning reimbursement rates more closely with the current fiscal capacity of school districts and creating a new funding structure for school construction. Under this new approach, funding would be awarded based on a competitive application process that considers the need for the project, the age of the building to be renovated or replaced, and the fiscal capacity of the school district.

EDUCATION
69
Boards of Cooperative Educational Services (BOCES): The Executive Budget recommends $720 million in BOCES Aid for 2011-12, an increase of more than $18 million from the 2010-11 school year. Beginning with aid payable in 2012-13, the Executive Budget would distribute BOCES Aid based on the same State aid ratio as Foundation Aid. In addition, in order to encourage system-wide cost effectiveness, beginning with costs reimbursed in 2012-13 certain non-instructional services provided by BOCES would no longer be aidable.
Special Services Aid: The Executive Budget recommends total funding of $214 million, an increase of $2.8 million (1.3 percent) from the 2010-11 funding level. This amount is calculated under existing statutory provisions. This aid category funds career education programs and computer services for school districts that are not component districts of BOCES.
Transportation Aid: The Executive Budget recommends $1.65 billion for reimbursement for the costs of transporting students. This represents an increase of $71 million (4.5 percent) from the 2010-11 funding level. In addition, the Executive Budget would encourage districts to engage in shared services or other efficiency measures.
Private Special Education Aid: The Executive Budget recommends $343 million – the amount that is calculated under existing statutory provisions. This represents a $12.3 million (3.7 percent) increase from the 2010-11 funding level.
High Cost Special Education Aid: The Executive Budget recommends $483 million – the amount that is calculated under existing statutory provisions. This represents a $28.5 million (6.3 percent) increase from the 2010-11 funding level.
Miscellaneous Operating Support Programs: The Executive Budget maintains funding at 2010-11 levels for various programs that can be used by school districts for operating support. These programs include the following: High Tax Aid, Supplemental Public Special Education Aid, the New York City Academic Achievement Grant, Academic Enhancement Aid, and the Supplemental Educational Improvement Plan Grant. These actions are consistent with the existing statutory provisions included in the 2010-11 Enacted Budget and the approach taken to maintain Foundation Aid and other aids that provide operating support at 2010-11 levels.
Charter Schools: The Executive Budget provides $25.1 million in Transitional Aid for school districts impacted by a concentration of charter schools, as well as $4.8 million for technical assistance and start-up grants for charter schools.
Roosevelt Union Free School District: The Executive Budget recommends a $6 million Academic Improvement Grant for the Roosevelt Union Free School District. This is the same amount provided to Roosevelt in the 2010-11 school year.
Teachers of Tomorrow: The Executive Budget continues this $25 million incentive program, which provides awards and stipends to retain and attract teachers into New York State classrooms in areas where teacher shortages exist.
Teacher Mentor Intern Program: The $2 million Teacher-Mentor Intern program is continued at the 2010-11 funding level.
Bilingual Education/English Language Learners: The Executive Budget maintains $12.5 million in funding for Bilingual Education grants. These funds support programs which include technical assistance centers, two-way bilingual classrooms, intensive bilingual teacher training and leadership programs.

EDUCATION
70
Other Programs: The Executive Budget recommends funding based on existing statutory formulas for several programs including the following: Textbook Aid, Library Materials Aid, Computer Software Aid, Computer Hardware Aid, Full Day Kindergarten Conversion Aid and Reorganization Operating Aid. In addition, funding levels based on existing reimbursement methodologies are recommended for certain other categorical programs, including Urban-Suburban Transfer, Education of Homeless Pupils, Education of Incarcerated Youth, Education of Office of Mental Health/Office for People with Developmental Disabilities students, and Native American Building Aid.
Federal Race to the Top: The Executive Budget would continue the Federal Race to the Top program. In August 2010, New York State was awarded $696.6 million in Race to the Top funding. Over the next four years, this funding will support major reforms in standards and assessments, data systems, teacher and principal preparation and evaluation, with the goal of turning around the lowest-achieving schools. Race to the Top funding will be spent consistent with a plan submitted by the State Education Department and approved by the U.S. Department of Education that includes providing at least 50 percent of the funds to schools to be used for implementing the new reforms. The balance of funds will be used for statewide capacity building and supplemental grants to schools related to the reform initiatives.
Reimbursement for the Metropolitan Commuter Transportation Mobility Tax: The Executive Budget includes $70 million for full reimbursement of school district expenses for the mobility tax.
Other proposals in the Executive Budget relating to school districts include: Mandate Relief: The Governor has created the Mandate Relief Redesign Team
by Executive Order. This team – made up of representatives of the Legislature, local government, education and private industry – will conduct a rigorous and comprehensive review of mandates imposed on school districts and other local taxing districts in order to look for the best and most cost-effective ways to deliver mandated programs and services and identify mandates that are ineffective, unnecessary, outdated and duplicative. The Team will report to the Governor on March 1, 2011.
Maintain the Contract for Excellence Program: School districts recently participating in the Contracts for Excellence program would continue operating approved academic intervention programs consistent with Contract for Excellence requirements. However, the required investment in these programs will be permitted to decline by the same percentage as the district’s formula-based aid will be reduced under the Gap Elimination Adjustment. This approach will ensure the continued participation of 23 school districts, including all “Big Five” city school districts (New York City, Buffalo, Rochester, Syracuse and Yonkers).
Allow Access to Employee Benefit Accrued Liability Reserve Funds: In order to maintain educational programming during the 2011-12 school year, a school district’s governing board would be permitted to authorize a withdrawal of excess funds in an employee benefits accrued liability reserve fund. The amount withdrawn could not exceed the Gap Elimination Adjustment for a school district. The State Comptroller would first certify that the amount remaining in the Fund is sufficient to meet employee benefit requirements after the withdrawal.

EDUCATION
71
PERFORMANCE INCENTIVES The 2011-12 Executive Budget includes a competitive program to reward efficient and improving schools, modeled on the Federal Race to the Top program. A total of $500 million will be awarded via two $250 million competitive grants:
School District Performance Improvement Awards: Grants totaling $250 million will be awarded to school districts that demonstrate significant improvements in their student performance outcomes. This program would build upon the objectives of the Race to the Top program by providing additional State funding to those school districts with most improved academic achievement gains and student outcomes.
School District Management Efficiency Awards: Competitive grants totaling $250 million will be awarded to school districts that undertake long-term structural changes which will reduce costs and improve efficiency.
STATE OPERATIONS The taxpayer-supported General Fund accounts for seven percent of the State Education Department’s overall operating budget. Federal grants, including programs for disadvantaged pupils, account for 61 percent of the agency’s resources. The remaining 32 percent is derived from fees, chargebacks and other miscellaneous receipts. For 2011-12, SED’s General Fund State Operations budget totals $38 million, a decrease of $4 million from the 2010-11 Enacted Budget. SPECIAL EDUCATION School-Age Special Education School districts receive funding for special education services provided to school-age children through the Foundation Aid formula. In addition, Public High Cost Special Education Aid and Private Special Education Aid supplement Foundation Aid for students with severe needs. The Executive Budget recommends continuing existing statutory provisions for these two aid categories with total funding of $825 million for the 2011-12 school year, an increase of $41 million (5 percent). Preschool Special Education Approximately 500 providers (school districts, BOCES, and private entities) operate preschool special education programs that provide educational and therapeutic services to approximately 100,000 children aged 3 to 5 during any given school year. The General Fund recommendation of $868 million will support a 59.5 percent State share of preschool special education program costs in the 2011-12 fiscal year. Summer School Special Education The summer school special education program supports educational services provided during July and August for approximately 43,000 disabled students aged 5 to 21. The State has historically supported 70 percent of the total education, transportation and maintenance costs of these programs regardless of a school district’s relative wealth. The

EDUCATION
72
2011-12 Executive Budget proposes to more closely align State reimbursement to school districts for summer school special education costs with wealth-based aid ratios used during the regular school year. Additionally, the priority of payment will be for claims for services provided during the 2011-12 school year, with State reimbursement for costs incurred for prior school years limited to $100 million during the upcoming fiscal year. Private Schools for the Blind and Deaf Currently, nearly 1,500 students attend 11 State-supported private schools for the blind and deaf. Unlike other private special education schools, these schools have historically been funded through a discrete State appropriation. The Executive Budget would consolidate these 11 private schools into the broader classification of private special education schools to realign them with the needs of the State’s current special education population. As such, State support for the costs of students attending these schools would be provided through Private Excess Cost Aid, as is the case for students attending other private special education schools at the direction of school districts. EDUCATION-RELATED PROGRAMS The Executive Budget recommends a net year-to-year reduction of approximately $23.5 million in funding for education-related programs. Major actions include:
Aid for Nonpublic Schools: The Executive Budget provides nonpublic schools $74.2 million in aid for mandated services and $26.2 million for the comprehensive attendance-taking program. This represents a decrease of $8.7 million (-8 percent) from the 2010-11 Enacted Budget.
Library Aid: The Executive Budget provides $76 million in funding for Library Aid; this represents a decrease of $8.4 million (-10 percent) from the 2010-11 Enacted Budget. In addition, $14 million in capital funding is included for public library construction projects.
Public Broadcasting Aid: The Executive Budget provides $13.5 million in State support for New York’s public broadcasting stations, which includes support for eight public radio stations, three public television stations, and five stations that broadcast both radio and television. This represents a decrease of $1.5 million (-10 percent) from the 2010-11 Enacted Budget.
Bundy Aid: The Executive Budget recommends $35.1 million for Unrestricted Aid for Independent Colleges and Universities, also known as Bundy Aid. This represents a $3.9 million (-10 percent) decrease from the 2010-11 Enacted Budget.
Education Improvement Performance Grants: The Executive Budget includes new funding of $1.7 million for competitive grants for programs with demonstrated success in improving achievement outcomes.
Capital Projects: The Executive Budget includes $3.4 million in new capital support for various minor rehabilitation projects to maintain SED’s facilities in safe operating condition. This represents a decrease of 50 percent from 2010-11 funding level of $6.8 million and is consistent with the Department’s priorities. SED will use these funds for various health and safety and critical infrastructure projects at its 24 State-owned buildings.

EDUCATION
73
EDUCATION-RELATED PROGRAMS
($000) 2010-11 2011-12
Program School Year School Year Change Academic Intervention Services for Nonpublic Schools 922 922 0 Adult Basic Education 1,843 1,843 0 Adult Literacy Education 4,293 4,293 0 Charter School Start-Up and Technical Assistance 4,837 4,837 0 County Vocational Education and Extension Boards 932 932 0 Education of Children of Migrant Workers 89 89 0 Education Improvement Performance Grants 0 1,730 1,730 Extended Day/School Safety Program 24,343 24,343 0 Fiscal Stabilization Grants 30,022 30,022 0 Health Education Program 691 691 0 Math and Science High Schools* 1,382 1,382 0 National Board for Professional Teaching Standards 490 0 (490) Nonpublic School Aid 109,105 100,377 (8,728) Postsecondary Aid to Native Americans 598 598 0 Primary Mental Health 894 0 (894) Prior Year Claims 15,046 15,046 0 School Lunch and Breakfast Program 32,300 33,100 800 Statewide Center for School Safety 466 466 0 Student Mentoring and Tutoring Initiative 490 0 (490) Summer Food Program 3,049 3,049 0 SUNY Center for Autism and Related Disabilities 490 490 0 Syracuse City School District/Say Yes to Education* 350 350 0 Targeted Prekindergarten 1,303 1,303 0
Subtotal P-12 Education programs 233,935 225,863 (8,072) Bundy Aid 39,032 35,129 (3,903) Collegiate Science and Technology Entry Program 7,406 7,406 0 High Needs Nursing 941 0 (941) Higher Education Opportunity Program 20,783 20,783 0 Liberty Partnerships 10,842 10,842 0 Science and Technology Entry Program 9,774 9,774 0 Teacher Opportunity Corps 671 0 (671)
Subtotal Higher Education Programs 89,449 83,934 (5,515) Library Aid 84,458 76,012 (8,446) Public Broadcasting Aid* 15,002 13,502 (1,500)
Subtotal Cultural Education Programs 99,460 89,514 (9,946) College Readers Program 294 294 0 Independent Living Centers 12,361 12,361 0 Supported Employment 15,160 15,160 0 VESID Case Services 54,000 54,000 0
Subtotal Vocational Rehab Programs 81,815 81,815 0 Total Education-Related Programs
504,659 481,126 (23,533)
*Includes Federal ARRA funding in 2010-11.
SCHOOL TAX RELIEF (STAR) The School Tax Relief (STAR) program was enacted in 1997 to provide needed tax relief for homeowners across the State. The Executive Budget provides $3.3 billion for the STAR program comprised of the Enhanced STAR exemption for eligible senior citizens, the Basic STAR exemption for other qualified homeowners, and the New York City Personal Income tax rate reduction and refundable tax credit. Major budget actions include:
Adjust STAR Exemption Benefit: When the STAR program was created, it included a mechanism to prevent large drops in benefits resulting from rising property values. However, no similar mechanism was created to prevent significant benefit increases driven by declines in property values. As a result, STAR spending increased significantly in areas where property values declined

EDUCATION
74
dramatically, but the increases were unrelated to property tax burdens. To control spending growth, the Executive Budget limits growth in exemption benefits to two percent annually. This change is worth $125 million in 2011-12.
Audit STAR Recipients to Discover and Eliminate Fraud: The Tax Department will use its in-house database management systems to identify those homeowners who do not qualify for the benefit, then send a list to local assessors to verify. This is expected to produce annual savings of $50 million starting in 2012-13.
Create a Mechanism for STAR Recipients to Repay Improper Exemption: The Executive Budget creates a mechanism for STAR recipients to repay (with interest and a $500 processing fee) STAR exemptions received that they acknowledge they were not entitled to. This will generate $100,000 in 2011-12.
PROGRAM HIGHLIGHTS Under the policy direction of the Board of Regents, operational responsibilities of the State Education Department include administration, regulation and review of numerous education programs. The following provides a description of the major program areas administered by the Department: SCHOOL AID The Executive Budget provides $19.4 billion in School Aid for the 2011-12 school year. State support for public schools, including lottery payments, accounts for approximately 23 percent of State operating funds and 29 percent of the General Fund. School Aid is distributed to school districts through formula-based aids and categorical grants including the following:
Foundation Aid is based on the cost of a successful education adjusted by regional cost variations and pupil needs. The 2011-12 Executive Budget would maintain Foundation Aid at its current level of $14.9 billion.
Transportation Aid and Building Aid provide support to school districts for student transportation and the construction/preservation of school facilities. These two aid categories will total $4.3 billion. They account for 22 percent of overall School Aid.
Universal Prekindergarten provides grants to school districts ranging from $2,700 to $6,500 per child reflective of varying district wealth and educational needs. For the 2011-12 school year, funding will be available for approximately 108,400 students to attend Universal Prekindergarten programs throughout the State.
Specialized Aid and Grant Programs address specific educational needs, ranging from textbooks to adult education programs.
PROGRAMS FOR STUDENTS WITH SPECIAL NEEDS New York provides a full spectrum of special education services for students aged 3 to 21. These services range from speech therapy to placement in full-time residential schools for school-age children with the most severely disabling conditions. Statewide,

EDUCATION
75
over 400,000 children with special needs receive special education services. Students who require particularly intensive programs are served by approximately 150 private schools, including 13 Special Act School Districts. Two State-operated schools provide specialized services for blind and deaf students with multiple disabilities. The Batavia School for the Blind serves 54 blind and multiply-disabled students. The Rome School for the Deaf serves 70 deaf and multiply-disabled school-age students. EDUCATION-RELATED PROGRAMS The State Education Department also administers various programs that address specialized student needs or reimburse school districts for education-related services. Major programs include:
School Nutrition Programs: The Executive Budget recommends $36 million in State funds to supplement Federal support for the School Lunch and Breakfast program and the Summer Food service program. Approximately 400 million school meals are served annually to nearly three million students participating in the school lunch and breakfast program. In addition, more than 280 sponsors of summer food programs serve free meals to approximately 325,000 low-income students participating in summer recreation programs.
Aid for Nonpublic Schools: The Executive Budget recommends a total of $100.4 million to reimburse nonpublic schools for the cost of mandated services and comprehensive attendance-taking.
CULTURAL EDUCATION Cultural Education programs administered by the State Education Department include support for public broadcasting stations and aid to public libraries and library systems. The State Library, the State Museum and the State Archives are located in the Cultural Education Center in Albany and are also administered by SED staff. The State Library is the largest of its kind in the nation, providing reference information and other coordinated library services to State agencies, businesses and the public. The State Library also charters all libraries in the State and distributes State and Federal aid to local libraries. The State Museum is the largest state-operated museum in the nation and contains exhibits on New York’s cultural and natural history. The Museum is also a major research center and the home of the Geological Survey, Biological Survey, Anthropological Survey and the Historical Survey. Each of these surveys is involved with developing and maintaining the collections and exhibits of the State Museum. The State Museum also administers the Cultural Resource Survey Program, which oversees the handling and preservation of artifacts found at construction sites. The State Archives is responsible for the maintenance and preservation of important State and local government records. In addition to its operations in the Cultural Education Center, the State Archives also operates the State Records Center at the Harriman State Office Campus in Albany. The operations of the State Museum, State Library and State Archives are largely supported by a surcharge on certain documents filed in county clerk offices.

EDUCATION
76
HIGHER EDUCATION AND REGULATION OF THE PROFESSIONS The Office of Higher Education and the Professions is responsible for ensuring the quality and availability of postsecondary education programs and regulating professionals in order to protect the public by ensuring the quality and integrity of services provided to consumers in the State. This Office conducts the following activities:
Assists the Regents in making higher education policies and plans; administers aid programs for colleges, universities and students; and reviews and registers academic programs of degree-granting institutions. This Office also oversees teacher certification and discipline and background checks for prospective school personnel.
Licenses and provides oversight for members of the 48 professions regulated pursuant to Title VIII of the Education Law, including the following: Nursing, Optometry, Dentistry, Pharmacy, Veterinary Medicine, Social Work, Architecture, Engineering and Public Accountancy. The Office is also responsible for enforcing standards of practice, codes of conduct and professional discipline for the licensees, except members of the medical professions (Physicians, Physician Assistants and Special Assistants) whose professional conduct is within the purview of the Department of Health. Professional licensure, oversight and enforcement functions are self-supporting through the collection of professional licensing fees and fines.
ADULT CAREER AND CONTINUING EDUCATION SERVICES The former Vocational and Educational Services for Individuals with Disabilities (VESID) program is now called Adult Career and Continuing Education Services (ACCES). Special education, formerly part of VESID, is now under the auspices of the new Office of Prekindergarten through Grade Twelve Education. ACCES supports, promotes and develops the State’s adult education programs; provides a full range of services that may be needed by people with disabilities, including vocational rehabilitation services; regulates the State’s proprietary schools; and oversees the General Education Development (GED) testing office within the State Education Department. Using its network of 15 district offices across the State, ACCES provides vocational rehabilitation services to clients with disabilities tailored to their individual goals, capabilities and needs. In 2009-10, this program arranged job placements for nearly 12,000 individuals from an active caseload of 58,000. SCHOOL TAX RELIEF (STAR) For 2011-12, STAR will provide New York’s taxpayers with savings of $3.3 billion in school tax relief. School Property Tax Relief
In 2011-12, approximately 630,000 senior homeowners will be eligible to receive an enhanced exemption. The statewide average STAR enhanced benefit for seniors is estimated at $1,253. To be eligible for the enhanced benefit, residential property owners must be at least 65 years of age (if property is owned by husband and wife or by siblings, then one of them must be at least 65 years old. Eligibility

EDUCATION
77
was expanded in 2000 to surviving spouses who are at least 62 years of age, and certain nursing home residents). In addition to the age requirement, annual income cannot exceed $79,050 to receive benefits in 2011.
In 2011-12, the school property tax exemption will provide over 2.8 million qualified homeowners who are not eligible for the senior citizen enhanced exemption with a full value equivalent homestead exemption of at least $30,000. Statewide tax savings relating to this basic STAR exemption will average $681.
The exemptions provided to homeowners living in counties where median home sale prices exceed the statewide median are adjusted upward from the minimums stated above to account for regional variations in property values.
Legislation accompanying the Executive Budget would correct STAR exemption benefit oversight and create a mechanism for STAR recipients to repay improper exemptions.
New York City Tax Reduction
Under the current STAR program, New York City’s more than 3 million resident personal income taxpayers receive a rate reduction benefit on the first $500,000 of income.
Those taxpayers whose income is below certain thresholds also receive a flat refundable credit.
Total New York City taxpayer savings will be nearly $580 million in 2011-12, or about 7 percent of tax liability.

EDUCATION
78
School Aid School Year Payments (Millions)
Program Estimated 2010-11
Recommended 2011-12
Change Amount
Change Percent
I. Formula-Based Aids: Foundation Aid 14,893.62 14,893.62 0.00 0.00 Excess Cost - High Cost 454.14 482.62 28.48 6.27 Excess Cost - Private 330.45 342.73 12.28 3.72 Reorganization Operating Aid 2.86 2.86 0.00 0.00 Textbooks (Incl. Lottery) 181.03 182.09 1.06 0.59 Computer Hardware 37.88 37.93 0.05 0.13 Computer Software 45.20 46.37 1.17 2.59 Library Materials 19.17 19.40 0.23 1.20 BOCES 701.69 720.08 18.39 2.62 Special Services 211.09 213.89 2.80 1.33 Transportation (Including Summer) 1,583.32 1,654.69 71.37 4.51 High Tax 204.77 204.77 0.00 0.00 Universal Prekindergarten 393.00 393.00 0.00 0.00 Academic Achievement Grant 1.20 1.20 0.00 0.00 Supplemental Educational Improvement Grant 17.50 17.50 0.00 0.00 Charter School Transitional Aid 23.22 25.11 1.89 8.14 Full-Day Kindergarten 1.36 4.67 3.31 243.38 Academic Enhancement Aid 8.32 8.32 0.00 0.00 Supplemental Public Excess Cost 4.31 4.31 0.00 0.00 Formula-Based Aids 19,114.13 19,255.17 141.04 0.74 Gap Elimination Adjustment (2,138.07) (2,785.79) (647.72) NAFederal SFSF and Education Jobs Fund Restorations 1,333.51 0.00 1,333.51 NANet Gap Elimination Adjustment (804.56) (2,785.79) (1,981.23) NAFMAP Reduction (131.51) 0.00 131.51 NA
(936.07) (2,785.79) (1,849.72) NA Formula-Based Aids w/ GEA, SFSF, Ed Jobs, and FMAP 18,178.06 16,469.38 (1,708.68) (9.40)Building Aid/Reorganization Building 2,488.58 2,659.91 171.33 6.88 Total Formula-Based and Other Aids 20,666.64 19,129.29 (1,537.35) (7.44) II. Grant Programs and Additional Aid Categories: Teachers of Tomorrow 25.00 25.00 0.00 0.00 Teacher-Mentor Intern 2.00 (a) 2.00 0.00 0.00 School Health Services 13.84 13.84 0.00 0.00 Roosevelt 6.00 6.00 0.00 0.00 Urban-Suburban Transfer 2.73 2.73 0.00 0.00 Employment Preparation Education 96.00 96.00 0.00 0.00 Homeless Pupils 16.23 17.23 1.00 6.16 Incarcerated Youth 18.75 19.50 0.75 4.00 Bilingual Education 12.50 12.50 0.00 0.00 Education of OMH/OPWDD Pupils 72.00 76.00 4.00 5.56 Special Act School Districts 2.70 2.70 0.00 0.00 Chargebacks (52.00) (54.50) (2.50) 0.00 BOCES Aid for Special Act Districts 0.70 0.70 0.00 0.00 Learning Technology Grants 3.29 3.29 0.00 0.00 Native American Building Aid 3.50 5.00 1.50 42.86 Native American Education 35.00 32.00 (3.00) (8.57)Bus Driver Safety 0.40 0.40 0.00 0.00 Total Grant Programs and Additional Aid Categories 258.64 260.39 1.75 0.68 SCHOOL YEAR TOTAL 20,925.28 19,389.68 (1,535.60) (7.34) (a) Supported in full by American Recovery and Reinvestment (ARRA) Aid.

EDUCATION
79
ALL FUNDS APPROPRIATIONS
(dollars)
Category Available
2010-11
AppropriationsRecommended
2011-12 Change
ReappropriationsRecommended
2011-12State Operations 596,334,000 566,868,000 (29,466,000) 459,423,000 Aid To Localities 32,193,128,000 29,046,154,000 (3,146,974,000) 9,330,784,000 Capital Projects 41,200,000 17,400,000 (23,800,000) 143,096,000 Total 32,830,662,000 29,630,422,000 (3,200,240,000) 9,933,303,000
ALL FUND TYPES
PROJECTED LEVELS OF EMPLOYMENT BY PROGRAM FILLED ANNUAL SALARIED POSITIONS
Full-Time Equivalent Positions (FTE)
Program
2010-11Estimated FTEs
03/31/11
2011-12Estimated FTEs
03/31/12 FTE ChangeAdult Career and Continuing Education
Services Special Revenue Funds - Federal 957 957 0
Office of Management Services Program General Fund 55 55 0 Special Revenue Funds - Other 210 210 0 Internal Service Funds 135 135 0
Office of Pre-kindergarten Through Grade 12 Education General Fund 149 149 0 Special Revenue Funds - Federal 330 330 0
School for the Blind Special Revenue Funds - Other 121 121 0
School for the Deaf Special Revenue Funds - Other 96 96 0
Higher Education and the Professions, Office of General Fund 42 42 0 Special Revenue Funds - Federal 9 9 0 Special Revenue Funds - Other 404 404 0
Cultural Education General Fund 7 7 0 Special Revenue Funds - Federal 59 59 0 Special Revenue Funds - Other 209 209 0 Internal Service Funds 23 23 0
Total 2,806 2,806 0
The above table does not reflect layoffs that may be necessary in the absence of negotiated workforce savings.
STATE OPERATIONS
ALL FUNDS FINANCIAL REQUIREMENTS BY FUND TYPE APPROPRIATIONS
(dollars)
Fund Type Available
2010-11Recommended
2011-12 ChangeGeneral Fund 42,564,000 38,309,000 (4,255,000) Special Revenue Funds - Federal 367,224,000 345,703,000 (21,521,000) Special Revenue Funds - Other 154,983,000 149,293,000 (5,690,000) Internal Service Funds 31,563,000 33,563,000 2,000,000 Total 596,334,000 566,868,000 (29,466,000) Adjustments: Transfer(s) From
Special Pay Bill Special Revenue Funds - Federal (39,000) Special Revenue Funds - Other (683,000)
Appropriated 2010-11 595,612,000

EDUCATION
80
STATE OPERATIONS ALL FUNDS FINANCIAL REQUIREMENTS BY PROGRAM
APPROPRIATIONS (dollars)
Program Available
2010-11Recommended
2011-12 ChangeAdult Career and Continuing Education
Services General Fund 2,400,000 2,160,000 (240,000) Special Revenue Funds - Federal 122,393,000 122,393,000 0 Special Revenue Funds - Other 7,481,000 7,781,000 300,000
Office of Management Services Program General Fund 11,633,000 10,470,000 (1,163,000) Special Revenue Funds - Other 27,504,577 25,505,000 (1,999,577) Internal Service Funds 18,914,000 20,914,000 2,000,000
Office of Pre-kindergarten Through Grade 12 Education General Fund 20,553,000 18,498,000 (2,055,000) Special Revenue Funds - Federal 222,514,000 204,980,000 (17,534,000) Special Revenue Funds - Other 5,631,000 1,631,000 (4,000,000)
School for the Blind Special Revenue Funds - Other 10,060,000 10,070,000 10,000
School for the Deaf Special Revenue Funds - Other 9,661,000 9,661,000 0
Higher Education and the Professions, Office of General Fund 7,376,000 6,639,000 (737,000) Special Revenue Funds - Federal 2,952,000 2,952,000 0 Special Revenue Funds - Other 52,624,000 52,624,000 0
Cultural Education General Fund 602,000 542,000 (60,000) Special Revenue Funds - Federal 19,365,000 15,378,000 (3,987,000) Special Revenue Funds - Other 42,021,423 42,021,000 (423) Internal Service Funds 12,649,000 12,649,000 0
Total 596,334,000 566,868,000 (29,466,000)
STATE OPERATIONS - GENERAL FUND
SUMMARY OF PERSONAL SERVICE APPROPRIATIONS AND CHANGES 2011-12 RECOMMENDED
(dollars)
Total Personal Service Regular
(Annual Salaried) Program Amount Change Amount ChangeAdult Career and Continuing Education
Services 684,000 (76,000) 630,000 (70,000)Office of Management Services Program 6,553,000 (728,000) 6,319,000 (702,000)Office of Pre-kindergarten Through Grade
12 Education 12,193,000 (1,354,000) 11,597,000 (1,288,000)Higher Education and the Professions,
Office of 2,834,000 (315,000) 2,815,000 (313,000)Cultural Education 398,000 (44,000) 398,000 (44,000) Total 22,662,000 (2,517,000) 21,759,000 (2,417,000)
Temporary Service
(Nonannual Salaried) Holiday/Overtime Pay
Program Amount Change Amount ChangeAdult Career and Continuing Education
Services 54,000 (6,000) 0 0 Office of Management Services Program 117,000 (13,000) 117,000 (13,000)Office of Pre-kindergarten Through Grade
12 Education 466,000 (52,000) 130,000 (14,000)Higher Education and the Professions,
Office of 18,000 (2,000) 1,000 0 Cultural Education 0 0 0 0 Total 655,000 (73,000) 248,000 (27,000)

EDUCATION
81
STATE OPERATIONS - GENERAL FUND SUMMARY OF NONPERSONAL SERVICE AND MAINTENANCE UNDISTRIBUTED
APPROPRIATIONS AND CHANGES 2011-12 RECOMMENDED
(dollars) Total Supplies and Materials Program Amount Change Amount ChangeAdult Career and Continuing Education
Services 1,476,000 (164,000) 36,000 (4,000)Office of Management Services Program 3,917,000 (435,000) 203,000 (23,000)Office of Pre-kindergarten Through Grade
12 Education 6,305,000 (701,000) 90,000 (10,000)Higher Education and the Professions,
Office of 3,805,000 (422,000) 57,000 (6,000)Cultural Education 144,000 (16,000) 23,000 (3,000) Total 15,647,000 (1,738,000) 409,000 (46,000) Travel Contractual Services Program Amount Change Amount ChangeAdult Career and Continuing Education
Services 5,000 (1,000) 1,435,000 (159,000)Office of Management Services Program 103,000 (11,000) 1,429,000 (159,000)Office of Pre-kindergarten Through Grade
12 Education 112,000 (12,000) 5,891,000 (655,000)Higher Education and the Professions,
Office of 57,000 (6,000) 3,634,000 (404,000)Cultural Education 2,000 0 115,000 (13,000) Total 279,000 (30,000) 12,504,000 (1,390,000) Equipment General State Charges Program Amount Change Amount ChangeAdult Career and Continuing Education
Services 0 0 0 0 Office of Management Services Program 714,000 (79,000) 1,468,000 (163,000)Office of Pre-kindergarten Through Grade
12 Education 212,000 (24,000) 0 0 Higher Education and the Professions,
Office of 57,000 (6,000) 0 0 Cultural Education 4,000 0 0 0 Total 987,000 (109,000) 1,468,000 (163,000)

EDUCATION
82
STATE OPERATIONS - OTHER THAN GENERAL FUND SUMMARY OF APPROPRIATIONS AND CHANGES
2011-12 RECOMMENDED (dollars)
Total Personal Service Program Amount Change Amount ChangeAdult Career and Continuing Education
Services 130,174,000 300,000 58,052,000 14,000 Office of Management Services Program 46,419,000 423 24,651,000 275 Office of Pre-kindergarten Through Grade
12 Education 206,611,000 (21,534,000) 82,358,000 0 School for the Blind 10,070,000 10,000 5,956,000 (105,000)School for the Deaf 9,661,000 0 5,574,000 (186,000)Higher Education and the Professions,
Office of 55,576,000 0 25,241,000 0 Cultural Education 70,048,000 (3,987,423) 29,677,000 (275) Total 528,559,000 (25,211,000) 231,509,000 (277,000) Nonpersonal Service Maintenance Undistributed Program Amount Change Amount ChangeAdult Career and Continuing Education
Services 72,122,000 15,173,824 0 (14,887,824)Office of Management Services Program 21,768,000 148 0 0 Office of Pre-kindergarten Through Grade
12 Education 114,053,000 8,978,176 10,200,000 (30,512,176)School for the Blind 4,114,000 115,000 0 0 School for the Deaf 4,087,000 186,000 0 0 Higher Education and the Professions,
Office of 30,335,000 721,000 0 (721,000)Cultural Education 40,371,000 1,135,852 0 (5,123,000) Total 286,850,000 26,310,000 10,200,000 (51,244,000)
AID TO LOCALITIES
ALL FUNDS FINANCIAL REQUIREMENTS BY FUND TYPE APPROPRIATIONS
(dollars)
Fund Type Available
2010-11Recommended
2011-12 ChangeGeneral Fund 18,245,852,000 18,721,587,000 475,735,000 Special Revenue Funds - Federal 7,484,797,000 4,084,088,000 (3,400,709,000) Special Revenue Funds - Other 6,462,479,000 6,240,479,000 (222,000,000) Total 32,193,128,000 29,046,154,000 (3,146,974,000)

EDUCATION
83
AID TO LOCALITIES ALL FUNDS FINANCIAL REQUIREMENTS BY PROGRAM
APPROPRIATIONS (dollars)
Program Available
2010-11Recommended
2011-12 ChangeAdult Career and Continuing Education
Services General Fund 81,815,000 81,815,000 0 Special Revenue Funds - Federal 521,776,000 118,776,000 (403,000,000) Special Revenue Funds - Other 12,458,000 12,458,000 0
Office of Management Services Program Special Revenue Funds - Other 5,214,000 5,214,000 0
Office of Pre-kindergarten Through Grade 12 Education General Fund 17,980,715,000 18,466,324,000 485,609,000 Special Revenue Funds - Federal 6,936,627,000 3,959,912,000 (2,976,715,000) Special Revenue Funds - Other 3,163,000,000 2,912,000,000 (251,000,000)
School Tax Relief Special Revenue Funds - Other 3,273,000,000 3,302,000,000 29,000,000
Higher Education and the Professions, Office of General Fund 89,449,000 83,934,000 (5,515,000)
Cultural Education General Fund 93,873,000 89,514,000 (4,359,000) Special Revenue Funds - Federal 26,394,000 5,400,000 (20,994,000) Special Revenue Funds - Other 8,807,000 8,807,000 0
Total 32,193,128,000 29,046,154,000 (3,146,974,000)
CAPITAL PROJECTS
ALL FUNDS FINANCIAL REQUIREMENTS BY PROGRAM APPROPRIATIONS
(dollars)
Comprehensive Construction Program Available
2010-11Recommended
2011-12 Change Reappropriations
2011-12Education Building
Capital Projects Fund 0 0 0 2,026,000 Capital Projects Fund - Advances 0 0 0 20,000
School for the Blind Capital Projects Fund 0 0 0 2,095,000 Capital Projects Fund - Advances 0 0 0 200,000
School for the Deaf Capital Projects Fund 0 0 0 676,000
Schools For Native American Reservations Capital Projects Fund 0 0 0 120,000 Capital Projects Fund - Authority Bonds 0 0 0 3,398,000
Cultural Education Center Capital Projects Fund 0 0 0 12,403,000 Capital Projects Fund - Advances 0 0 0 1,280,000 Capital Projects Fund - Authority Bonds 0 0 0 13,797,000
Administration Capital Projects Fund 6,800,000 3,400,000 (3,400,000) 10,458,000 Capital Projects Fund - Authority Bonds 20,400,000 0 (20,400,000) 20,400,000
Library Construction Library Aid (Auth Bonds) 14,000,000 14,000,000 0 16,222,000
Public Broadcasting Facilities Capital Projects Fund - Authority Bonds 0 0 0 1,000
Cultural Education Storage Facility Cap Proj Fund - Cultrual Education Storage Facility 0 0 0 60,000,000
Total 41,200,000 17,400,000 (23,800,000) 143,096,000

84
STATE BOARD OF ELECTIONS MISSION The New York State Board of Elections executes and enforces all laws relating to the elective franchise and oversees the disclosure of campaign financing and practices. ORGANIZATION AND STAFFING The State Board of Elections is comprised of four commissioners, two chosen by each major political party. The Board administers provisions of the Election Law regarding campaign financial disclosure, including civil judgments levied for failure to file disclosure documents; oversees the petitioning process and certification of ballots; investigates allegations of criminal violations of the Election Law and recommends prosecution where warranted; and certifies electronic voting machines purchased by local Boards of Elections. The Board also assists County Boards of Elections by completing administrative reviews, assisting in resolving complaints and monitoring statewide compliance with the Help America Vote Act (HAVA), the National Voter Registration Act (NVRA) and the Military and Overseas Voter Empowerment Act (MOVE). BUDGET HIGHLIGHTS The 2011-12 Executive Budget recommends $13.5 million All Funds ($5.5 million General Fund; $8.0 million Other Funds) for the State Board of Elections. This is a General Fund decrease of $614,000 (-10 percent) from the 2010-11 budget. The Executive Budget reduces each agency’s General Fund State Operations budget by 10 percent. These savings are intended to be achieved through administrative efficiencies in non-personal service and negotiated workforce savings that minimize layoffs to the extent possible. PROGRAM HIGHLIGHTS Over the past 30 years, the scope of the Board’s services has grown to include providing legal counsel to the 62 County Boards of Election, administering registration efforts, providing technical assistance to administrators of elections, investigating violations of the Election Law and coordinating the State’s responses to new Federal election requirements. New York continues to work towards full compliance with federal election mandates and achieved a major milestone with the successful deployment in 2010 of new voting systems.
ALL FUNDS APPROPRIATIONS
(dollars)
Category Available
2010-11
AppropriationsRecommended
2011-12 Change
ReappropriationsRecommended
2011-12State Operations 13,135,000 12,521,000 (614,000) 25,000,000 Aid To Localities 1,000,000 1,000,000 0 76,100,000 Capital Projects 0 0 0 0 Total 14,135,000 13,521,000 (614,000) 101,100,000

ELECTIONS
85
ALL FUND TYPES PROJECTED LEVELS OF EMPLOYMENT BY PROGRAM
FILLED ANNUAL SALARIED POSITIONS Full-Time Equivalent Positions (FTE)
Program
2010-11Estimated FTEs
03/31/11
2011-12Estimated FTEs
03/31/12 FTE ChangeRegulation of Elections
General Fund 60 60 0 Total 60 60 0
The above table does not reflect layoffs that may be necessary in the absence of negotiated workforce savings.
STATE OPERATIONS
ALL FUNDS FINANCIAL REQUIREMENTS BY FUND TYPE APPROPRIATIONS
(dollars)
Fund Type Available
2010-11Recommended
2011-12 ChangeGeneral Fund 6,135,000 5,521,000 (614,000) Special Revenue Funds - Federal 6,500,000 6,500,000 0 Special Revenue Funds - Other 500,000 500,000 0 Total 13,135,000 12,521,000 (614,000)
STATE OPERATIONS
ALL FUNDS FINANCIAL REQUIREMENTS BY PROGRAM APPROPRIATIONS
(dollars)
Program Available
2010-11Recommended
2011-12 ChangeRegulation of Elections
General Fund 6,135,000 5,521,000 (614,000) Special Revenue Funds - Federal 6,500,000 6,500,000 0 Special Revenue Funds - Other 500,000 500,000 0
Total 13,135,000 12,521,000 (614,000)
STATE OPERATIONS - GENERAL FUND
SUMMARY OF PERSONAL SERVICE APPROPRIATIONS AND CHANGES 2011-12 RECOMMENDED
(dollars)
Total Personal Service Regular
(Annual Salaried) Program Amount Change Amount ChangeRegulation of Elections 3,746,000 (416,000) 3,727,000 (366,000) Total 3,746,000 (416,000) 3,727,000 (366,000)
Temporary Service
(Nonannual Salaried) Holiday/Overtime Pay
Program Amount Change Amount ChangeRegulation of Elections 15,000 (46,000) 4,000 (4,000) Total 15,000 (46,000) 4,000 (4,000)
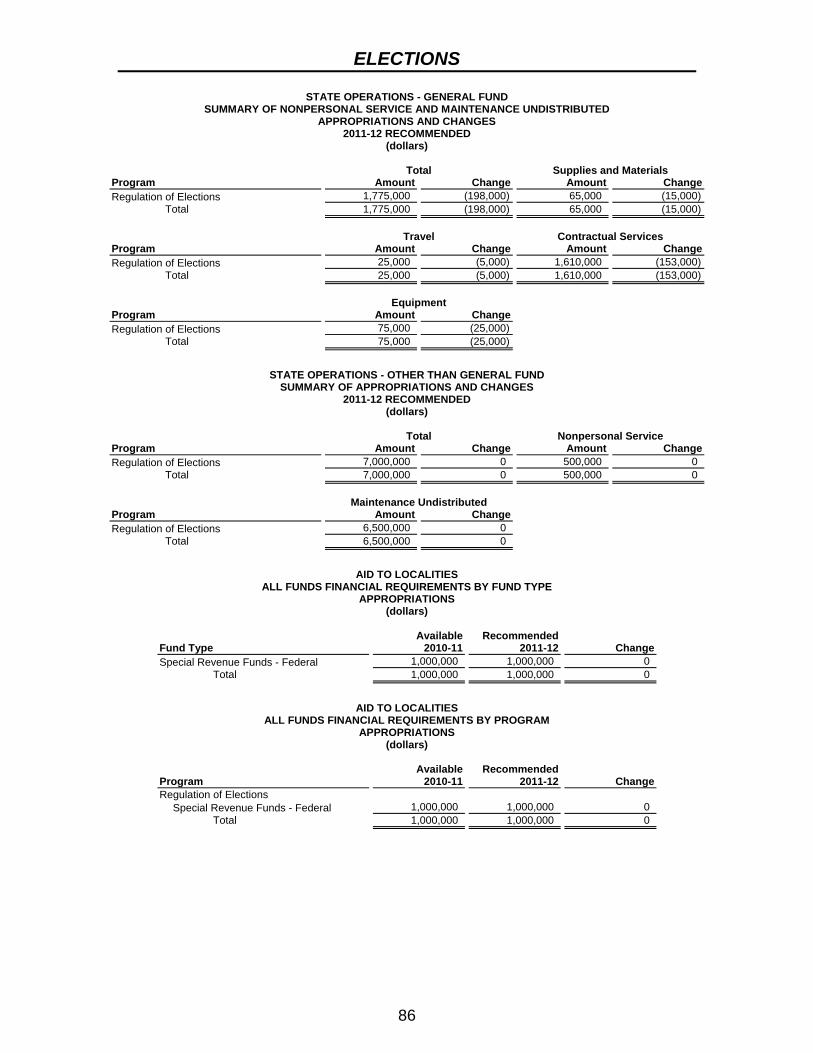
ELECTIONS
86
STATE OPERATIONS - GENERAL FUND SUMMARY OF NONPERSONAL SERVICE AND MAINTENANCE UNDISTRIBUTED
APPROPRIATIONS AND CHANGES 2011-12 RECOMMENDED
(dollars) Total Supplies and Materials Program Amount Change Amount ChangeRegulation of Elections 1,775,000 (198,000) 65,000 (15,000) Total 1,775,000 (198,000) 65,000 (15,000) Travel Contractual Services Program Amount Change Amount ChangeRegulation of Elections 25,000 (5,000) 1,610,000 (153,000) Total 25,000 (5,000) 1,610,000 (153,000) Equipment Program Amount Change Regulation of Elections 75,000 (25,000) Total 75,000 (25,000)
STATE OPERATIONS - OTHER THAN GENERAL FUND
SUMMARY OF APPROPRIATIONS AND CHANGES 2011-12 RECOMMENDED
(dollars) Total Nonpersonal Service Program Amount Change Amount ChangeRegulation of Elections 7,000,000 0 500,000 0 Total 7,000,000 0 500,000 0 Maintenance Undistributed Program Amount Change Regulation of Elections 6,500,000 0 Total 6,500,000 0
AID TO LOCALITIES
ALL FUNDS FINANCIAL REQUIREMENTS BY FUND TYPE APPROPRIATIONS
(dollars)
Fund Type Available
2010-11Recommended
2011-12 ChangeSpecial Revenue Funds - Federal 1,000,000 1,000,000 0 Total 1,000,000 1,000,000 0
AID TO LOCALITIES
ALL FUNDS FINANCIAL REQUIREMENTS BY PROGRAM APPROPRIATIONS
(dollars)
Program Available
2010-11Recommended
2011-12 ChangeRegulation of Elections
Special Revenue Funds - Federal 1,000,000 1,000,000 0 Total 1,000,000 1,000,000 0

87
EMPIRE STATE DEVELOPMENT CORPORATION MISSION Doing business as Empire State Development Corporation (ESDC), the Urban Development Corporation (UDC) is a New York State public benefit corporation. Its overall objective is to stimulate economic growth through the creation of jobs by fostering business development, enhancing industrial competitiveness, revitalizing downtown areas, advancing high technology and promoting tourism. It engages in three principal activities: economic and real estate development; State facility financing; and housing portfolio maintenance. ECONOMIC AND REAL ESTATE DEVELOPMENT The Corporation provides financial and technical assistance to businesses, local governments, and community-based not-for-profit corporations for economic development and large-scale real estate projects that create and/or retain jobs in New York and reinvigorate distressed areas. STATE FACILITY FINANCING The Empire State Development Corporation issues bonds to finance the construction and modernization of correctional facilities and other special projects for the State. Debt service on these bonds is paid from State appropriations. HOUSING PORTFOLIO MAINTENANCE In the early 1970s, the Urban Development Corporation built 113 large-scale housing developments for low- to middle-income persons. The Corporation also built non-residential civic and industrial properties, including the Niagara Falls Convention Center, the Wards Island Fire Training Center, the Monroe County Fairgrounds, the Ten Eyck Plaza in Albany, and public school facilities in Buffalo, Manhattan, the Bronx, and Brooklyn. Since the mid-1970s, activity in this area has been limited to the monitoring and loan servicing of projects. ORGANIZATION AND STAFFING Historically, State economic development programs have been administered by the Empire State Development Corporation working in conjunction with the Department of Economic Development. In addition, the Corporation and Department have worked closely with the Foundation for Science, Technology, and Innovation to foster technology-related job creation. The 2011-12 Executive Budget would reform and reinvent New York’s high technology academic research and economic development efforts by fully merging the Foundation into the Corporation. This recommendation will streamline and improve the delivery of economic development services, eliminate duplicative administrative support and save $1.9 million in State taxpayer dollars. For 2011-12, ESDC will be overseen by a chairman who will coordinate statewide operations of the newly consolidated entity and collaborate with stakeholders on establishing 10 Regional Economic Development Councils to create a more regionally-based approach to allocating economic development resources.

EMPIRE STATE DEVELOPMENT
88
OVERSIGHT The Corporation is governed by a nine-member Board of Directors comprising two ex-officio members and seven members appointed by the Governor with the consent of the Senate. The chairman of the Empire State Development Corporation Board is selected by the Governor. Board members serve without compensation. SUBSIDIARIES The Corporation’s Board of Directors is authorized to create subsidiaries to manage specific projects or economic development activities. Subsidiaries have been established to: (1) oversee revitalization of Lower Manhattan in the wake of the September 11, 2001 terrorist attacks; (2) formulate policies and initiatives to promote economic growth in Harlem; (3) redevelop Times Square; (4) plan and oversee a mixed-use development on 74.5 acres on the East River in Queens County; (5) redevelop the U.S. Postal Service facility, known as the Farley Building, in connection with the New York City Amtrak Train Station Redevelopment project; (6) promote economic development and tourism, and leverage private investment in Niagara Falls; (7) oversee conversion of the 300-acre Harriman State Office Building Campus in Albany into a world-class research and development park; and (8) coordinate the development of the former Buffalo Memorial Auditorium and additional projects along the waterfront and inner harbor in downtown Buffalo. BUDGET HIGHLIGHTS The Executive Budget recommends $310.8 million for the Empire State Development Corporation in 2011-12, an increase of $239.9 million (338.4 percent) from 2010-11. However, this increase for ESDC will not increase overall State spending, since ESDC will assume administration of funding formerly provided through the Foundation and through other existing economic development programs to support the newly created Regional Economic Development Councils and Economic Transformation Program Grants, as well as the continued support of projects in the New York City Empowerment Zone. In 2011-12, Empire State Development Corporation’s activities will be funded through a combination of State General Fund appropriations and corporate revenues generated by corporation-owned residential and non-residential properties and by its financing programs. Major budget actions include:
Regional Economic Development Councils: $200 million in existing State resources will be provided to support new and competitively selected regional economic development projects and initiatives. Nearly $130.6 million will be provided by reprioritizing and redirecting existing economic development funds for competitively determined project grants, and $70 million will be provided in tax credits through the enhanced Excelsior Jobs Program. Ten newly created Regional Economic Development Councils, which will be chaired by the Lieutenant Governor, will compete for these funds based on the best economic development plans; coordinate all economic development resources from State agencies and authorities; and review all previous economic development commitments to ensure projects demonstrating maximum benefits to the State

EMPIRE STATE DEVELOPMENT
89
receive the limited State resources available. These Regional Economic Development Councils will consist of local business, community, academic, municipal, State government, labor and other key regional stakeholders;
Economic Transformation Program: The Budget includes $100 million for new Economic Transformation Program grants for communities adversely impacted by correctional and youth facility closures. In consultation with the new Regional Councils, those affected communities will be able to fund new economic development projects that create jobs and spur new investments, fostering a re-invention of local economies. This spending will be supported by reprioritizing and redirecting existing economic development funds;
Ongoing Economic Development Programs: $43.4 million is provided to support ongoing economic development programs, including: the Empire State Economic Development Fund; Minority - and Women-Owned Business Development and Lending programs; the Urban and Community Development Program; the Entrepreneurial Assistance Program; the retention of professional football in Western New York; and other high technology research centers;
Ongoing High Technology Programs: $35.9 million is made available to support ongoing university-based matching grant programs, and other high technology and research and development programs previously administered by the Foundation;
Continued support of specific existing capital projects: Nearly $2.4 billion is recommended in reappropriations for continued support of various economic development and regional initiatives including statewide competitive grant programs administered by the Corporation, specific downstate regional initiatives, upstate city-by-city projects, and other economic development projects administered by the Corporation and Dormitory Authority of the State of New York. Any new commitments from these resources will be reviewed by the Regional Councils; and
Operations: The Budget includes $1 million to support the Empire State Development Corporation’s administration and continued development of New York’s efforts to support high technology academic research and economic growth.
ALL FUNDS
APPROPRIATIONS (dollars)
Category Available
2010-11
AppropriationsRecommended
2011-12 Change
ReappropriationsRecommended
2011-12State Operations 0 0 0 0 Aid To Localities 45,896,000 55,239,000 9,343,000 380,798,000 Capital Projects 25,000,000 255,550,000 230,550,000 2,449,675,000 Total 70,896,000 310,789,000 239,893,000 2,830,473,000
AID TO LOCALITIES
ALL FUNDS FINANCIAL REQUIREMENTS BY FUND TYPE APPROPRIATIONS
(dollars)
Fund Type Available
2010-11Recommended
2011-12 ChangeGeneral Fund 45,896,000 55,239,000 9,343,000 Total 45,896,000 55,239,000 9,343,000

EMPIRE STATE DEVELOPMENT
90
AID TO LOCALITIES ALL FUNDS FINANCIAL REQUIREMENTS BY PROGRAM
APPROPRIATIONS (dollars)
Program Available
2010-11Recommended
2011-12 ChangeEconomic Development
General Fund 45,896,000 19,378,000 (26,518,000) High Technology Program
General Fund 0 34,048,000 34,048,000 Research Development Program
General Fund 0 343,000 343,000 Training and Business Assistance Program
General Fund 0 1,470,000 1,470,000 Total 45,896,000 55,239,000 9,343,000
CAPITAL PROJECTS
ALL FUNDS FINANCIAL REQUIREMENTS BY PROGRAM APPROPRIATIONS
(dollars)
Comprehensive Construction Program Available
2010-11Recommended
2011-12 Change Reappropriations
2011-12Regional Development
Capital Projects Fund - Authority Bonds 0 0 0 666,861,000 Cap Proj Fund - CEFAP (Direct Auth Bonds) 0 0 0 59,898,000
Economic Development Capital Projects Fund - Authority Bonds 25,000,000 255,550,000 230,550,000 1,449,927,000 Cap Proj Fund - Downtown Buffalo (Auth Bonds) 0 0 0 22,989,000 Misc. Capital Projects 0 0 0 250,000,000
Total 25,000,000 255,550,000 230,550,000 2,449,675,000
91
OFFICE OF EMPLOYEE RELATIONS MISSION Under the Public Employees’ Fair Employment Act (the Taylor Law), the Office of Employee Relations (OER) assists the Governor in relations between the State and its employees, including representing the Executive Branch in collective bargaining negotiations with nine public employee unions. OER’s mission is to advance the performance of State government through collaborative labor relations, workforce training, education and benefits. ORGANIZATION AND STAFFING OER is organized into five divisions: Executive; Contract Negotiations and Administration; Counsel’s Office; Information Technology; and Administration. OER is located in Albany and administered by a Director appointed by the Governor. BUDGET HIGHLIGHTS The Executive Budget recommends $6.8 million All Funds ($3.0 million General Fund; $3.7 million Internal Service Funds; $121,000 Other Funds) for the Office of Employee Relations. This is a decrease in the General Fund of $329,000 (-10 percent) from the 2010-11 budget. The Executive Budget reduces each agency’s General Fund State Operations budget by 10 percent. These savings are intended to be achieved through administrative efficiencies in non-personal service and negotiated workforce savings that minimize layoffs to the extent possible. PROGRAM HIGHLIGHTS The Office of Employee Relations’ focus in 2011-12 will be negotiating new union contracts to succeed those that expire in 2011, continuing negotiations or interest arbitrations for those bargaining units without contracts that extend into 2011, and administering the terms of current contracts and arbitration awards. In 2011-12, the agency will continue to develop and implement a statewide Learning Management System. This initiative will enable employees to register for and receive training, and allow State agencies to track employees’ progress – seamlessly across the State’s entire enterprise. The joint labor-management committees, with OER as the State’s representative, will continue to provide skills training for represented and Management/Confidential employees to increase the efficiency and quality of State operations. Joint committee activities, such as the Employee Assistance Program and NYS-Balance, a resource and referral service, as well as pre-tax health care and dependent care savings plans and the NYS-Ride transportation benefit, all help to improve the quality of State employees’ lives on the job and at home.

EMPLOYEE RELATIONS
92
ALL FUNDS APPROPRIATIONS
(dollars)
Category Available
2010-11
AppropriationsRecommended
2011-12 Change
ReappropriationsRecommended
2011-12State Operations 7,121,000 6,792,000 (329,000) 0 Aid To Localities 0 0 0 0 Capital Projects 0 0 0 0 Total 7,121,000 6,792,000 (329,000) 0
ALL FUND TYPES
PROJECTED LEVELS OF EMPLOYMENT BY PROGRAM FILLED ANNUAL SALARIED POSITIONS
Full-Time Equivalent Positions (FTE)
Program
2010-11Estimated FTEs
03/31/11
2011-12Estimated FTEs
03/31/12 FTE ChangeContract Negotiation and Administration
General Fund 27 27 0 Internal Service Funds 12 12 0
Management Confidential Affairs General Fund 4 4 0
Total 43 43 0
The above table does not reflect layoffs that may be necessary in the absence of negotiated workforce savings.
STATE OPERATIONS
ALL FUNDS FINANCIAL REQUIREMENTS BY FUND TYPE APPROPRIATIONS
(dollars)
Fund Type Available
2010-11Recommended
2011-12 ChangeGeneral Fund 3,290,000 2,961,000 (329,000) Special Revenue Funds - Other 121,000 121,000 0 Internal Service Funds 3,710,000 3,710,000 0 Total 7,121,000 6,792,000 (329,000)
STATE OPERATIONS
ALL FUNDS FINANCIAL REQUIREMENTS BY PROGRAM APPROPRIATIONS
(dollars)
Program Available
2010-11Recommended
2011-12 ChangeContract Negotiation and Administration
General Fund 2,948,000 2,653,000 (295,000) Special Revenue Funds - Other 121,000 121,000 0 Internal Service Funds 3,710,000 3,710,000 0
Management Confidential Affairs General Fund 342,000 308,000 (34,000)
Total 7,121,000 6,792,000 (329,000)

EMPLOYEE RELATIONS
93
STATE OPERATIONS - GENERAL FUND SUMMARY OF PERSONAL SERVICE APPROPRIATIONS AND CHANGES
2011-12 RECOMMENDED (dollars)
Total Personal Service Regular
(Annual Salaried) Program Amount Change Amount ChangeContract Negotiation and Administration 2,551,000 (295,000) 2,541,000 (295,000)Management Confidential Affairs 281,000 (34,000) 280,000 (34,000) Total 2,832,000 (329,000) 2,821,000 (329,000)
Temporary Service
(Nonannual Salaried) Holiday/Overtime Pay
Program Amount Change Amount ChangeContract Negotiation and Administration 10,000 0 0 0 Management Confidential Affairs 0 0 1,000 0 Total 10,000 0 1,000 0
STATE OPERATIONS - GENERAL FUND
SUMMARY OF NONPERSONAL SERVICE AND MAINTENANCE UNDISTRIBUTED APPROPRIATIONS AND CHANGES
2011-12 RECOMMENDED (dollars)
Total Supplies and Materials Program Amount Change Amount ChangeContract Negotiation and Administration 102,000 0 20,000 0 Management Confidential Affairs 27,000 0 1,000 0 Total 129,000 0 21,000 0 Travel Contractual Services Program Amount Change Amount ChangeContract Negotiation and Administration 10,000 0 72,000 0 Management Confidential Affairs 1,000 0 25,000 0 Total 11,000 0 97,000 0
STATE OPERATIONS - OTHER THAN GENERAL FUND
SUMMARY OF APPROPRIATIONS AND CHANGES 2011-12 RECOMMENDED
(dollars) Total Personal Service Program Amount Change Amount ChangeContract Negotiation and Administration 3,831,000 0 986,000 0 Total 3,831,000 0 986,000 0 Nonpersonal Service Program Amount Change Contract Negotiation and Administration 2,845,000 0 Total 2,845,000 0

94
NEW YORK STATE ENERGY RESEARCH AND DEVELOPMENT AUTHORITY
MISSION The New York State Energy Research and Development Authority (NYSERDA) was established in 1975 to develop and implement new energy technologies, focusing on renewable energy sources and energy conservation. As part of its central mission, the Authority manages energy research, development and demonstration programs, which are funded by assessments on gas and electric utilities. Projects are selected on a competitive basis to promote applied research on State energy problems. The Authority administers Federal grant programs which help businesses, schools and hospitals implement energy efficiency measures, and issues tax-exempt bonds on behalf of investor-owned utilities for capital improvements. The Authority also administers the System Benefits Charge, which supports energy programs for low-income consumers, energy efficiency, energy research and development, and environmental protection. In addition, the Authority administers the Renewable Portfolio Standard program, designed to increase the percentage of electricity used by retail customers in the State derived from renewable resources. The Authority manages the former nuclear fuel reprocessing plant at West Valley in Cattaraugus County and the Saratoga Technology and Energy Park (STEP) in Saratoga County. Currently, NYSERDA has several clean-energy technology companies located at STEP, and is continuing to work toward bringing in other clean-energy technology companies. ORGANIZATION AND STAFFING The Energy Research and Development Authority is headed by a 13-member board, consisting of nine members nominated by the Governor with the consent of the Senate and four ex-officio members, who include the commissioners of the departments of Transportation and Environmental Conservation, and the chairs of the Public Service Commission and the Power Authority of the State of New York. All board members serve without compensation. BUDGET HIGHLIGHTS The Authority is partially funded by assessments on electric and gas utility gross intrastate operating receipts. The Executive Budget recommends $31.5 million All Funds ($16.2 million Special Revenue Funds for energy, research and development programs; $15.3 million Capital Funds for ongoing work at West Valley) for the Energy Research and Development Authority. This is a decrease of $3.9 million ($3.9 million Capital Funds) (-11 percent) from the 2010-11 budget. This change reflects a decrease in capital funding for nuclear waste cleanup activities at West Valley. The Authority’s costs at West Valley are largely dictated by a Federal match requirement, and are expected to decrease in 2011-12 as a result of decreased spending by the Federal government.

ENERGY RESEARCH AND DEVELOPMENT
95
ALL FUNDS APPROPRIATIONS
(dollars)
Category Available
2010-11
AppropriationsRecommended
2011-12 Change
ReappropriationsRecommended
2011-12State Operations 6,996,000 8,090,000 1,094,000 0 Aid To Localities 9,234,000 8,140,000 (1,094,000) 0 Capital Projects 19,247,000 15,310,000 (3,937,000) 0 Total 35,477,000 31,540,000 (3,937,000) 0
STATE OPERATIONS
ALL FUNDS FINANCIAL REQUIREMENTS BY FUND TYPE APPROPRIATIONS
(dollars)
Fund Type Available
2010-11Recommended
2011-12 ChangeSpecial Revenue Funds - Other 6,996,000 8,090,000 1,094,000 Total 6,996,000 8,090,000 1,094,000
STATE OPERATIONS
ALL FUNDS FINANCIAL REQUIREMENTS BY PROGRAM APPROPRIATIONS
(dollars)
Program Available
2010-11Recommended
2011-12 ChangeResearch, Development and Demonstration
Special Revenue Funds - Other 6,996,000 8,090,000 1,094,000 Total 6,996,000 8,090,000 1,094,000
STATE OPERATIONS - OTHER THAN GENERAL FUND
SUMMARY OF APPROPRIATIONS AND CHANGES 2011-12 RECOMMENDED
(dollars) Total Personal Service Program Amount Change Amount ChangeResearch, Development and Demonstration 8,090,000 1,094,000 3,565,000 266,000 Total 8,090,000 1,094,000 3,565,000 266,000 Nonpersonal Service Program Amount Change Research, Development and Demonstration 4,525,000 828,000 Total 4,525,000 828,000
AID TO LOCALITIES
ALL FUNDS FINANCIAL REQUIREMENTS BY FUND TYPE APPROPRIATIONS
(dollars)
Fund Type Available
2010-11Recommended
2011-12 ChangeSpecial Revenue Funds - Other 9,234,000 8,140,000 (1,094,000) Total 9,234,000 8,140,000 (1,094,000)
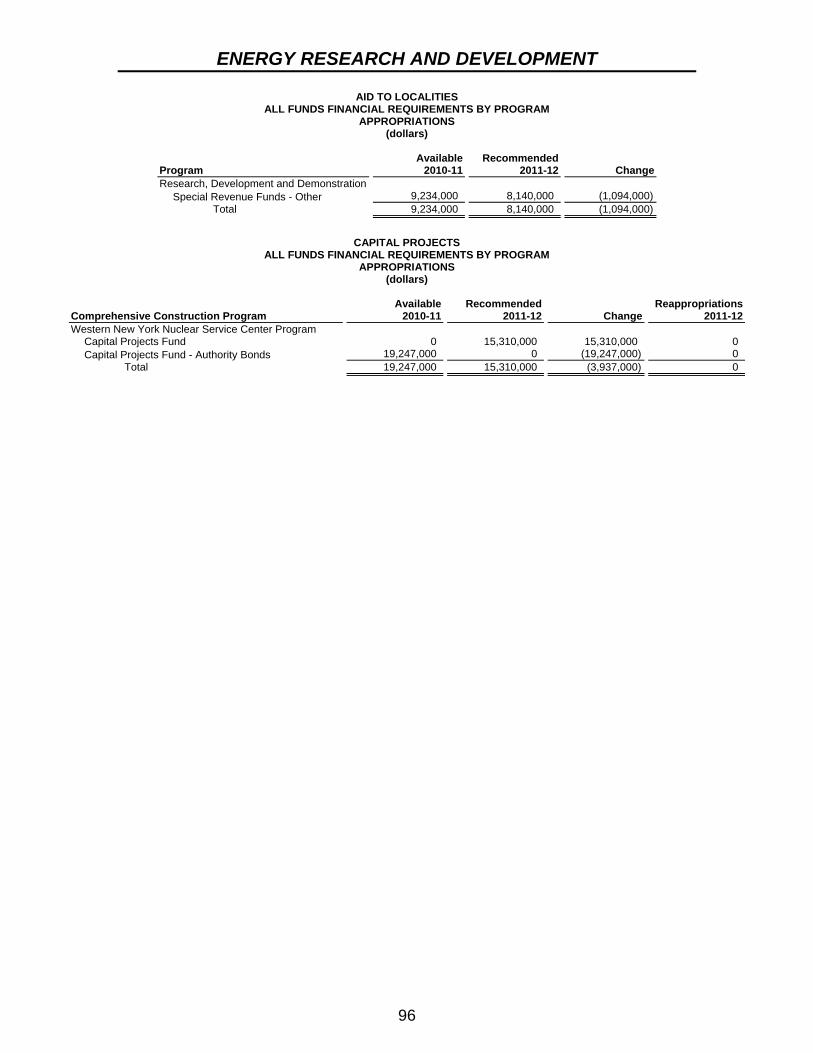
ENERGY RESEARCH AND DEVELOPMENT
96
AID TO LOCALITIES ALL FUNDS FINANCIAL REQUIREMENTS BY PROGRAM
APPROPRIATIONS (dollars)
Program Available
2010-11Recommended
2011-12 ChangeResearch, Development and Demonstration
Special Revenue Funds - Other 9,234,000 8,140,000 (1,094,000) Total 9,234,000 8,140,000 (1,094,000)
CAPITAL PROJECTS
ALL FUNDS FINANCIAL REQUIREMENTS BY PROGRAM APPROPRIATIONS
(dollars)
Comprehensive Construction Program Available
2010-11Recommended
2011-12 Change Reappropriations
2011-12Western New York Nuclear Service Center Program
Capital Projects Fund 0 15,310,000 15,310,000 0 Capital Projects Fund - Authority Bonds 19,247,000 0 (19,247,000) 0
Total 19,247,000 15,310,000 (3,937,000) 0

97
DEPARTMENT OF ENVIRONMENTAL CONSERVATION
MISSION The Department of Environmental Conservation is responsible for conserving, improving and protecting the State’s natural resources and environment. The Department also works to control water, land and air pollution in order to enhance the health, safety and welfare of all New Yorkers. In addition, the Department plays a major role in implementing the Environmental Protection Fund, the State’s dedicated environmental fund. ORGANIZATION AND STAFFING The Department is headed by a Commissioner appointed by the Governor subject to Senate confirmation. The Department’s Central Office is in Albany, with regional offices in Avon, Buffalo, Long Island City, New Paltz, Ray Brook, Schenectady, Stony Brook, Syracuse and Watertown. These regional offices are the operational arms of the Department. Staff in the regional offices review and issue environmental permits for activities regulated by the Department such as the operation of landfills and sewage treatment plants. In addition, these offices ensure compliance with State and Federal environmental statutes, consistent with policy and management direction from program divisions in the Central Office. BUDGET HIGHLIGHTS The Executive Budget recommends $950 million All Funds ($110 million General Fund; $76 million Federal funds and $764 million for all other funds) for the Department of Environmental Conservation. This is a decrease of $53 million (-5 percent) from the 2010-11 budget, primarily as the result of the loss of one-time Federal Great Lakes Restoration Initiative funding and reductions in State operations and capital projects. The Executive Budget reduces each agency’s General Fund State Operations budget by 10 percent. These savings are intended to be achieved through administrative efficiencies in non-personal service and negotiated workforce savings that minimize layoffs to the extent possible. General Fund appropriations will finance 24.6 percent of the Department of Environmental Conservation’s operations in 2011-12. Fees and license revenues will support 58.2 percent, including the major permitting functions, the hazardous substances bulk storage and oil spill programs and the hazardous waste remedial and enforcement programs. Federal funds will support the remaining 17.2 percent of the Department’s budget. The Environmental Protection Fund (EPF) will continue to receive $134 million, the same level as in 2010-11, to support environmental programs, including land acquisition, farmland preservation, recycling programs, non-point source pollution control projects, and municipal park and waterfront revitalization projects. The EPF is supported primarily by revenues from the real estate transfer tax as well as by the sale or lease of State property, Fund interest earnings and receipts from water withdrawal fees, wetland application permits and pesticide applicator fees.

ENVIRONMENTAL CONSERVATION
98
The voter-approved Clean Water/Clean Air Bond Act authorizes $1.75 billion for critical environmental programs in the following categories: Safe Drinking Water Program ($355 million); Clean Water Program ($790 million); Solid Waste Projects ($175 million); Air Quality Projects ($230 million); and Environmental Restoration Projects ($200 million). Unspent portions of these authorizations are reappropriated in the Executive Budget. The Clean Air Fund will continue to provide the resources needed to meet the State’s obligations under the Federal Clean Air Act to control stationary and mobile sources of air pollution. The Fund is supported by vehicle emission inspection fees and fees on regulated pollutants emitted by factories, power plants and other stationary source facilities. General Fund appropriations will support the preservation and maintenance of the State’s trails, regional facilities, campgrounds and the 20 percent match required for Federal grants provided through the Clean Water State Revolving Fund. Since 1992-93, the cost of the State match has been reimbursed by proceeds from the sale of bonds issued by the Environmental Facilities Corporation. Principal and interest on the bonds are paid from State taxes. The 2011-12 Executive Budget provides approximately $950 million to support the Department’s critical environmental, resource management and recreation programs, including:
$120 million to support the refinanced Superfund program to continue the cleanup of inactive hazardous waste sites and to address hazardous substance sites. Recommendations also include $81.7 million in reappropriated funds from the 1986 Environmental Quality Bond Act to continue work already underway for existing Superfund sites;
$134 million in funding from the Environmental Protection Fund to provide resources to address a variety of priority programs including the continued implementation of the Hudson River Estuary Management Plan, the Hudson River Park, stewardship projects, the Pollution Prevention Institute; local solid waste reduction/recycling and marketing of recycled materials; landfill closure/gas management projects; natural resource damage projects; local parks and historic preservation grants; local waterfront revitalization projects; non-point source water pollution control projects; land acquisition; farmland protection; funding for soil and water conservation districts; support for Land Trust Alliance; urban forestry projects; and invasive species grants.
The total 1996 Clean Water/Clean Air Bond Act authorization of $1.75 billion has been appropriated. However, the Executive Budget includes $50 million in continued Bond Act disbursements in 2011-12 for critical Water Quality, Air, Solid Waste, Brownfield and Safe Drinking Water Projects;
$17 million in appropriations to support the abatement of illegal waste tire piles and the development of new markets for waste tires under the Waste Tire Management and Recycling Act of 2003.
$5.8 million to implement the New York City Watershed Agreement. These funds will support State enforcement and monitoring efforts in the Watershed and the provision of technical assistance to participating Watershed communities;
$210 million in new State and Federal funds for the Clean Water State Revolving Fund low-interest loan program to build and rehabilitate municipal sewage treatment facilities;

ENVIRONMENTAL CONSERVATION
99
$51 million to support the programs of the Conservation Fund; $16.8 million in new funding for basic capital infrastructure projects to ensure
health, safety and compliance with State and Federal laws and environmental requirements;
$23.7 million in non-General Fund support for the State’s Clean Air programs. New programs began in 1997-98 to control pollution from automobiles and to establish new consolidated permits for major stationary sources of air pollution, and in 1999-2000 to control air pollution from heavy-duty vehicles; and
$366.1 million to support the operations of the Department. PROGRAM HIGHLIGHTS Under both State and Federal law, the Department carries out a wide range of environmental, regulatory, remedial, resource management, outdoor recreation and education programs. These include the protection and management of the State’s air, water, mineral and energy resources, as well as the management of both solid and hazardous waste. In this regard, the Department has undertaken expanded responsibilities as part of the State’s Homeland Security effort including air and water toxic assessments, hazardous materials monitoring, water infrastructure monitoring and security and other activities to protect public health and safety. The Department has restructured its operations to eliminate redundant management layers and refocused its attention on the core mission of the Department. Additionally, the regulatory process for issuing environmental permits has been streamlined to simplify requirements while still ensuring that environmental standards are maintained and the State’s natural resources are protected. The Department’s functions are divided into the following categories: Natural Resources, Environmental Quality/Remediation and Environmental Enforcement and Regulation. NATURAL RESOURCES In addition to its responsibility to protect the State’s fish, wildlife and marine resources and habitats, the Fish, Wildlife and Marine program also manages 200,000 acres of Wildlife Management Area Lands, operates 12 fish hatcheries, and maintains more than 300 boat launching and fishing access sites. The primary source of funding for this program is sporting license fees (over $50 million annually) deposited to the Conservation Fund. The Lands and Forests program manages more than 4.5 million acres of State land under the Department’s jurisdiction, including nearly three million acres of State-Forest Preserve within the Adirondack and Catskill parks, and manages over 786,000 acres of State Forest land and 825,000 acres of State-owned Conservation Easements. The Lands and Forests program also supports statewide urban and community forestry, forest health and other programs to encourage the long-term sustainable management of private forest lands. Revenues from the sale of forest products from State lands help offset program costs. The Mineral Resources program regulates more than 13,000 active oil and gas wells and oversees the mined land reclamation program. This program is focused on returning land previously used for mining to a productive use and also performs technical and environmental review of new and approximately 2,100 existing active mines.

ENVIRONMENTAL CONSERVATION
100
The Water program protects and conserves the State’s water resources, which include 87,124 miles of rivers, 7,849 waterbodies covering 687,672 acres and 979,200 acres of bays, estuaries and harbors, 577 miles of Great Lakes shoreline and 120 miles of ocean coastline, 2.4 million acres of fresh water wetlands, and 25,000 acres of tidal wetlands. The Department also operates 52 campgrounds and six day-use areas within the Adirondack and Catskill parks, as well as the Belleayre Mountain Ski Center. These recreational facilities serve approximately 1.8 million visits annually, generating over $14 million in revenue and greatly increasing tourist trade to their host communities. Camping and skiing user fees are intended to fully support facility operations. ENVIRONMENTAL QUALITY/REMEDIATION The 1988 Solid Waste Management Act established the State’s policies for the management of solid waste, identifying reduction and recycling as the preferred options. The Act required municipalities to implement source separation programs and to prepare Local Solid Waste Management Plans. Also in 1988, the Department of Environmental Conservation established requirements for the construction and operation of solid waste management facilities, such as landfills. Local governments must meet those requirements before the Department will grant an operating permit. The 1990 amendments to the Federal Clean Air Act imposed new mandates on the State designed to improve air quality. While the cost of complying with the Act is significant, the cost of non-compliance would be more severe. If the Federal Environmental Protection Agency determines that there is a deficiency in New York’s clean air programs, then it must apply sanctions if the deficiency is not corrected within 18 months. Sanctions include the withholding of Federal highway funds and the requirement of a two-for-one air pollution emissions offset for new or modified sources of emissions in areas that do not meet Federal air quality standards. The sanction would result in a virtual ban on industrial expansion and would place New York at a severe economic disadvantage with other states. New York has taken steps to implement a comprehensive stationary source air permit program, a small business assistance program and programs to reduce vehicular emissions from all vehicle types through the establishment of strict emission standards, fuel specification and in-use testing requirements. Air quality programs are supported by Federal Air Pollution Control Grants that must be matched by State funds as well as fees charged to stationary sources and for motor vehicle inspections. The Department has also established regulations implementing the most aggressive Acid Rain controls on emissions of sulfur dioxide and nitrogen oxide in the country. The 1986 Environmental Quality Bond Act – commonly known as the State Superfund – made $1.1 billion available for inactive hazardous waste cleanups, allowing the Department to embark on one of the most ambitious remedial programs in the nation. The Department implements the State’s Superfund Program and the Brownfield Cleanup Program to encourage private investment and job creation through liability reform, tax incentives, and a predictable process for cleaning up and redeveloping brownfields. A total of 347 sites have been approved for the Brownfield Cleanup Program, and 92 have been completely cleaned as of December 2010. The Department has also undertaken significant new initiatives including the most aggressive program in the nation to address the emerging problem of soil vapor intrusion from contaminated sites.
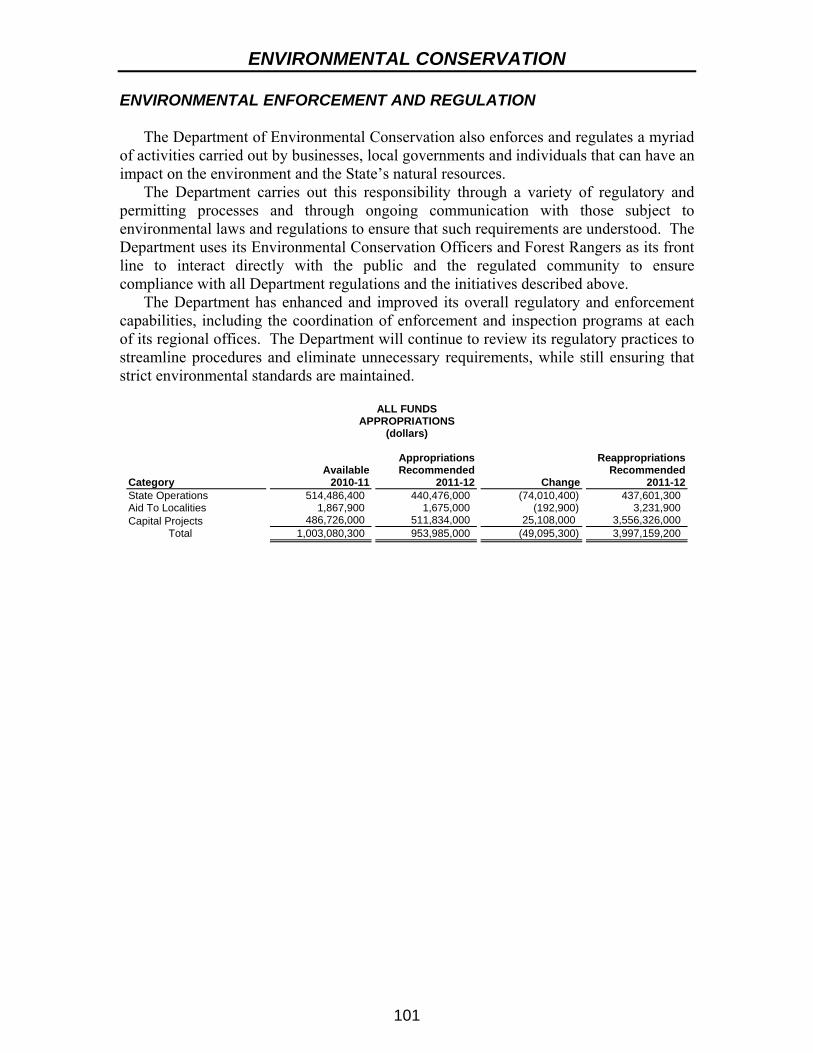
ENVIRONMENTAL CONSERVATION
101
ENVIRONMENTAL ENFORCEMENT AND REGULATION The Department of Environmental Conservation also enforces and regulates a myriad of activities carried out by businesses, local governments and individuals that can have an impact on the environment and the State’s natural resources. The Department carries out this responsibility through a variety of regulatory and permitting processes and through ongoing communication with those subject to environmental laws and regulations to ensure that such requirements are understood. The Department uses its Environmental Conservation Officers and Forest Rangers as its front line to interact directly with the public and the regulated community to ensure compliance with all Department regulations and the initiatives described above. The Department has enhanced and improved its overall regulatory and enforcement capabilities, including the coordination of enforcement and inspection programs at each of its regional offices. The Department will continue to review its regulatory practices to streamline procedures and eliminate unnecessary requirements, while still ensuring that strict environmental standards are maintained.
ALL FUNDS APPROPRIATIONS
(dollars)
Category Available
2010-11
AppropriationsRecommended
2011-12 Change
ReappropriationsRecommended
2011-12State Operations 514,486,400 440,476,000 (74,010,400) 437,601,300 Aid To Localities 1,867,900 1,675,000 (192,900) 3,231,900 Capital Projects 486,726,000 511,834,000 25,108,000 3,556,326,000 Total 1,003,080,300 953,985,000 (49,095,300) 3,997,159,200

ENVIRONMENTAL CONSERVATION
102
ALL FUND TYPES PROJECTED LEVELS OF EMPLOYMENT BY PROGRAM
FILLED ANNUAL SALARIED POSITIONS Full-Time Equivalent Positions (FTE)
Program
2010-11Estimated FTEs
03/31/11
2011-12Estimated FTEs
03/31/12 FTE ChangeAdministration
General Fund 125 125 0 Special Revenue Funds - Other 137 137 0
Air and Water Quality Management General Fund 136 136 0 Special Revenue Funds - Federal 142 142 0 Special Revenue Funds - Other 327 327 0
Environmental Enforcement General Fund 312 312 0 Special Revenue Funds - Other 120 120 0
Fish, Wildlife and Marine Resources General Fund 10 10 0 Special Revenue Funds - Federal 67 67 0 Special Revenue Funds - Other 282 282 0
Forest and Land Resources General Fund 226 226 0 Special Revenue Funds - Federal 10 10 0 Special Revenue Funds - Other 133 133 0
Operations General Fund 248 248 0 Special Revenue Funds - Other 39 39 0
Rehabilitation and Improvement Capital Projects Funds - Other 120 120 0
Solid and Hazardous Waste Management General Fund 39 39 0 Special Revenue Funds - Federal 37 37 0 Special Revenue Funds - Other 212 212 0 Capital Projects Funds - Federal 7 7 0 Capital Projects Funds - Other 274 274 0
Total 3,003 3,003 0
The above table does not reflect layoffs that may be necessary in the absence of negotiated workforce savings.
STATE OPERATIONS
ALL FUNDS FINANCIAL REQUIREMENTS BY FUND TYPE APPROPRIATIONS
(dollars)
Fund Type Available
2010-11Recommended
2011-12 ChangeGeneral Fund 120,373,100 108,327,000 (12,046,100) Special Revenue Funds - Federal 127,419,000 76,012,000 (51,407,000) Special Revenue Funds - Other 266,634,300 256,077,000 (10,557,300) Internal Service Funds 60,000 60,000 0 Total 514,486,400 440,476,000 (74,010,400) Adjustments: Transfer(s) From
Special Pay Bill General Fund (58,000) Special Revenue Funds - Other (284,000)
Appropriated 2010-11 514,144,400

ENVIRONMENTAL CONSERVATION
103
STATE OPERATIONS ALL FUNDS FINANCIAL REQUIREMENTS BY PROGRAM
APPROPRIATIONS (dollars)
Program Available
2010-11Recommended
2011-12 ChangeAdministration
General Fund 12,200,000 10,472,000 (1,728,000) Special Revenue Funds - Other 15,504,000 15,226,000 (278,000) Internal Service Funds 60,000 60,000 0
Air and Water Quality Management General Fund 12,645,000 12,444,000 (201,000) Special Revenue Funds - Federal 90,019,000 38,612,000 (51,407,000) Special Revenue Funds - Other 80,841,000 74,742,000 (6,099,000)
Environmental Enforcement General Fund 36,266,000 32,303,000 (3,963,000) Special Revenue Funds - Other 23,631,000 23,332,000 (299,000)
Fish, Wildlife and Marine Resources General Fund 4,629,100 3,860,000 (769,100) Special Revenue Funds - Federal 26,000,000 26,000,000 0 Special Revenue Funds - Other 42,168,300 44,153,000 1,984,700
Forest and Land Resources General Fund 21,121,000 18,384,000 (2,737,000) Special Revenue Funds - Federal 5,000,000 5,000,000 0 Special Revenue Funds - Other 30,707,000 26,300,000 (4,407,000)
Operations General Fund 28,622,000 27,012,000 (1,610,000) Special Revenue Funds - Other 12,342,000 12,342,000 0
Solid and Hazardous Waste Management General Fund 4,890,000 3,852,000 (1,038,000) Special Revenue Funds - Federal 6,400,000 6,400,000 0 Special Revenue Funds - Other 61,441,000 59,982,000 (1,459,000)
Total 514,486,400 440,476,000 (74,010,400)
STATE OPERATIONS - GENERAL FUND
SUMMARY OF PERSONAL SERVICE APPROPRIATIONS AND CHANGES 2011-12 RECOMMENDED
(dollars)
Total Personal Service Regular
(Annual Salaried) Program Amount Change Amount ChangeAdministration 9,338,000 (1,728,000) 8,788,000 (1,729,000)Air and Water Quality Management 10,700,000 (201,000) 10,585,000 (202,000)Environmental Enforcement 28,106,000 (773,000) 25,510,000 (861,000)Fish, Wildlife and Marine Resources 2,372,000 (420,000) 2,240,000 (424,000)Forest and Land Resources 16,192,000 (2,737,000) 14,955,000 (2,747,000)Operations 14,120,000 (1,881,000) 13,471,000 (1,883,000)Solid and Hazardous Waste Management 3,275,000 (1,038,000) 3,157,000 (1,039,000) Total 84,103,000 (8,778,000) 78,706,000 (8,885,000)
Temporary Service
(Nonannual Salaried) Holiday/Overtime Pay
Program Amount Change Amount ChangeAdministration 485,000 0 65,000 1,000 Air and Water Quality Management 59,000 0 56,000 1,000 Environmental Enforcement 78,000 63,000 2,518,000 25,000 Fish, Wildlife and Marine Resources 91,000 0 41,000 4,000 Forest and Land Resources 241,000 0 996,000 10,000 Operations 532,000 0 117,000 2,000 Solid and Hazardous Waste Management 114,000 0 4,000 1,000 Total 1,600,000 63,000 3,797,000 44,000

ENVIRONMENTAL CONSERVATION
104
STATE OPERATIONS - GENERAL FUND SUMMARY OF NONPERSONAL SERVICE AND MAINTENANCE UNDISTRIBUTED
APPROPRIATIONS AND CHANGES 2011-12 RECOMMENDED
(dollars) Total Supplies and Materials Program Amount Change Amount ChangeAdministration 1,134,000 0 238,000 0 Air and Water Quality Management 1,744,000 0 446,000 0 Environmental Enforcement 4,197,000 (3,190,000) 330,000 33,000 Fish, Wildlife and Marine Resources 1,488,000 (349,100) 676,000 0 Forest and Land Resources 2,192,000 0 1,672,000 0 Operations 12,892,000 271,000 2,012,000 171,000 Solid and Hazardous Waste Management 577,000 0 109,000 0 Total 24,224,000 (3,268,100) 5,483,000 204,000 Travel Contractual Services Program Amount Change Amount ChangeAdministration 91,000 0 712,000 0 Air and Water Quality Management 43,000 0 1,140,000 0 Environmental Enforcement 47,000 20,000 3,780,000 2,555,000 Fish, Wildlife and Marine Resources 57,000 7,000 698,000 2,000 Forest and Land Resources 40,000 0 411,000 0 Operations 256,000 0 8,688,000 100,000 Solid and Hazardous Waste Management 18,000 0 448,000 0 Total 552,000 27,000 15,877,000 2,657,000 Equipment Maintenance Undistributed Program Amount Change Amount ChangeAdministration 93,000 0 0 0 Air and Water Quality Management 115,000 0 0 0 Environmental Enforcement 40,000 10,000 0 (5,808,000)Fish, Wildlife and Marine Resources 57,000 0 0 (358,100)Forest and Land Resources 69,000 0 0 0 Operations 1,936,000 0 0 0 Solid and Hazardous Waste Management 2,000 0 0 0 Total 2,312,000 10,000 0 (6,166,100)
STATE OPERATIONS - OTHER THAN GENERAL FUND
SUMMARY OF APPROPRIATIONS AND CHANGES 2011-12 RECOMMENDED
(dollars) Total Personal Service Program Amount Change Amount ChangeAdministration 15,286,000 (278,000) 9,382,000 (190,000)Air and Water Quality Management 113,354,000 (57,506,000) 45,454,000 (764,000)Environmental Enforcement 23,332,000 (299,000) 11,242,000 (1,254,000)Fish, Wildlife and Marine Resources 70,153,000 1,984,700 29,555,000 180,000 Forest and Land Resources 31,300,000 (4,407,000) 16,154,000 (2,599,000)Operations 12,342,000 0 2,420,000 0 Solid and Hazardous Waste Management 66,382,000 (1,459,000) 25,046,000 (904,000) Total 332,149,000 (61,964,300) 139,253,000 (5,531,000) Nonpersonal Service Maintenance Undistributed Program Amount Change Amount ChangeAdministration 5,904,000 (88,000) 0 0 Air and Water Quality Management 67,900,000 6,408,000 0 (63,150,000)Environmental Enforcement 12,090,000 955,000 0 0 Fish, Wildlife and Marine Resources 40,598,000 6,484,700 0 (4,680,000)Forest and Land Resources 15,146,000 (1,808,000) 0 0 Operations 9,922,000 0 0 0 Solid and Hazardous Waste Management 41,336,000 (555,000) 0 0 Total 192,896,000 11,396,700 0 (67,830,000)
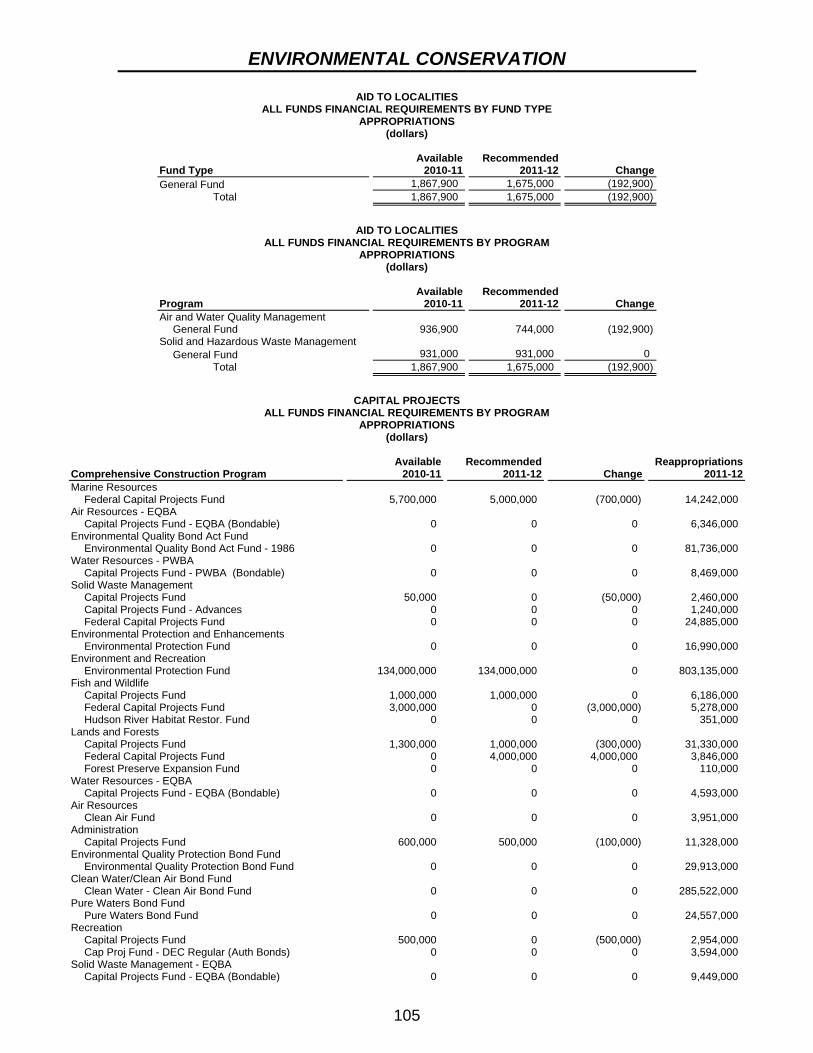
ENVIRONMENTAL CONSERVATION
105
AID TO LOCALITIES ALL FUNDS FINANCIAL REQUIREMENTS BY FUND TYPE
APPROPRIATIONS (dollars)
Fund Type Available
2010-11Recommended
2011-12 ChangeGeneral Fund 1,867,900 1,675,000 (192,900) Total 1,867,900 1,675,000 (192,900)
AID TO LOCALITIES
ALL FUNDS FINANCIAL REQUIREMENTS BY PROGRAM APPROPRIATIONS
(dollars)
Program Available
2010-11Recommended
2011-12 ChangeAir and Water Quality Management
General Fund 936,900 744,000 (192,900) Solid and Hazardous Waste Management
General Fund 931,000 931,000 0 Total 1,867,900 1,675,000 (192,900)
CAPITAL PROJECTS
ALL FUNDS FINANCIAL REQUIREMENTS BY PROGRAM APPROPRIATIONS
(dollars)
Comprehensive Construction Program Available
2010-11Recommended
2011-12 Change Reappropriations
2011-12Marine Resources
Federal Capital Projects Fund 5,700,000 5,000,000 (700,000) 14,242,000 Air Resources - EQBA
Capital Projects Fund - EQBA (Bondable) 0 0 0 6,346,000 Environmental Quality Bond Act Fund
Environmental Quality Bond Act Fund - 1986 0 0 0 81,736,000 Water Resources - PWBA
Capital Projects Fund - PWBA (Bondable) 0 0 0 8,469,000 Solid Waste Management
Capital Projects Fund 50,000 0 (50,000) 2,460,000 Capital Projects Fund - Advances 0 0 0 1,240,000 Federal Capital Projects Fund 0 0 0 24,885,000
Environmental Protection and Enhancements Environmental Protection Fund 0 0 0 16,990,000
Environment and Recreation Environmental Protection Fund 134,000,000 134,000,000 0 803,135,000
Fish and Wildlife Capital Projects Fund 1,000,000 1,000,000 0 6,186,000 Federal Capital Projects Fund 3,000,000 0 (3,000,000) 5,278,000 Hudson River Habitat Restor. Fund 0 0 0 351,000
Lands and Forests Capital Projects Fund 1,300,000 1,000,000 (300,000) 31,330,000 Federal Capital Projects Fund 0 4,000,000 4,000,000 3,846,000 Forest Preserve Expansion Fund 0 0 0 110,000
Water Resources - EQBA Capital Projects Fund - EQBA (Bondable) 0 0 0 4,593,000
Air Resources Clean Air Fund 0 0 0 3,951,000
Administration Capital Projects Fund 600,000 500,000 (100,000) 11,328,000
Environmental Quality Protection Bond Fund Environmental Quality Protection Bond Fund 0 0 0 29,913,000
Clean Water/Clean Air Bond Fund Clean Water - Clean Air Bond Fund 0 0 0 285,522,000
Pure Waters Bond Fund Pure Waters Bond Fund 0 0 0 24,557,000
Recreation Capital Projects Fund 500,000 0 (500,000) 2,954,000 Cap Proj Fund - DEC Regular (Auth Bonds) 0 0 0 3,594,000
Solid Waste Management - EQBA Capital Projects Fund - EQBA (Bondable) 0 0 0 9,449,000

ENVIRONMENTAL CONSERVATION
106
CAPITAL PROJECTS ALL FUNDS FINANCIAL REQUIREMENTS BY PROGRAM
APPROPRIATIONS (dollars)
Comprehensive Construction Program Available
2010-11Recommended
2011-12 Change Reappropriations
2011-12Operations
Capital Projects Fund 11,050,000 11,000,000 (50,000) 45,980,000 Cap Proj Fund - DEC Regular (Auth Bonds) 12,000,000 12,000,000 0 36,000,000 Natural Resource Damages Fund 0 0 0 21,193,000 Financial Security Fund 0 0 0 1,134,000
Water Resources Capital Projects Fund 2,334,000 3,334,000 1,000,000 25,826,000 Capital Projects Fund - Advances 0 0 0 13,821,000 Cap Proj Fund - State Revolving Fund (Auth Bonds) 29,600,000 35,000,000 5,400,000 111,211,000 Cap Proj Fund - Onondaga Lake (Auth Bonds) 5,000,000 0 (5,000,000) 35,000,000 Federal Capital Projects Fund 148,000,000 175,000,000 27,000,000 556,055,000 Federal Stimulus 0 0 0 328,129,000
Air Quality - Clean Water/Clean Air 96 Capital Projects Fund - 1996 CWA (Bondable) 0 0 0 28,752,000
Clean Water - Clean Water/Clean Air 96 Capital Projects Fund - 1996 CWA (Bondable) 0 0 0 148,091,000
Solid Waste - Clean Water/Clean Air 96 Capital Projects Fund - 1996 CWA (Bondable) 0 0 0 8,172,000
Environmental Restoration - Clean Water/Clean Air 96 Capital Projects Fund - 1996 CWA (Bondable) 0 0 0 85,975,000
Clean Water - Clean Air Implementation Clean Water Clean Air Implementation Fund 0 0 0 6,841,000
Solid and Hazardous Waste Management - EQBA 86 Capital Projects Fund - EQBA 86 (Bondable) 342,000 0 (342,000) 65,184,000
Solid and Hazardous Waste Management Capital Projects Fund - Advances 0 0 0 27,967,000 Cap Proj Fund - DEC Regular (Auth Bonds) 0 0 0 22,579,000 Hazardous Waste Remedial Fund - Oversight &
Assessment 12,250,000 10,000,000 (2,250,000) 115,714,000 Hazardous Waste Remedial Fund - Cleanup 120,000,000 120,000,000 0 490,237,000
Total 486,726,000 511,834,000 25,108,000 3,556,326,000

107
ENVIRONMENTAL FACILITIES CORPORATION MISSION The Environmental Facilities Corporation (EFC) is a public benefit corporation that promotes environmental quality by providing low cost financing and technical assistance to municipalities, businesses and State agencies for environmental and public health projects in New York State. EFC’s largest program is the Clean Water State Revolving Fund (CWSRF). This program, administered jointly with the Department of Environmental Conservation (DEC), provides reduced interest rate financing to municipalities for infrastructure projects that control water pollution. EFC, in conjunction with the New York State Department of Health, also administers the Drinking Water State Revolving Fund (DWSRF), which provides reduced interest rate financing and grants to community and private water systems for safe drinking water projects. A Federal grant and corresponding State match provide funding for these programs. The Clean Water/Clean Air Bond Act provides a State match for the DWSRF. Administration of these programs is also supported with a portion of the Federal Capitalization Grant and fees charged on financings. EFC also administers other funding programs including the Industrial Finance Program and the Clean Vessel Assistance Program (in conjunction with DEC). In addition, technical assistance is provided through its New York City Watershed Programs and Small Business Environmental Assistance Program. ORGANIZATION AND STAFFING A seven-member Board of Directors governs the Corporation. Ex-officio board members include the Commissioner of the Department of Environmental Conservation, who serves as the Board Chair, the Commissioner of the Department of Health, and the Secretary of State. The four remaining board members serve six-year terms and require nomination by the Governor and confirmation by the Senate. The Board of Directors appoints the Corporation President and Corporate Officers. BUDGET HIGHLIGHTS Corporate operations are funded by:
Financing fees and annual fees charged to recipients that receive Revolving Fund loans and a portion of State and Federal grants made for the Clean Water and Drinking Water programs; and
User fees paid by businesses, municipalities, and industrial clients for the Corporation’s technical and financial services.
The Executive Budget recommends $12.7 million for EFC, made up entirely of non-General Fund spending. This is a continuation of 2010-11 enacted budget levels. In addition, State funds are included in the DEC and Department of Health’s capital budgets for the required match to Federal funding for the CWSRF and DWSRF programs. EFC will continue to provide approximately $3.5 million for DEC employees who are assigned administratively to the Corporation.

ENVIRONMENTAL FACILITIES
108
PROGRAM HIGHLIGHTS EFC currently administers four major programs: the Clean Water State Revolving Fund (CWSRF), the Drinking Water State Revolving Fund (DWSRF), the Industrial Finance Program (IFP) and the Technical Advisory Services Program (TAS). The American Recovery and Reinvestment Act of 2009 (ARRA) allocated $433 million for the CWSRF and $87 million for the DWSRF. The ARRA funding supported 45 CWSRF ARRA projects, 16 DWSRF ARRA projects and 49 Green Innovation ARRA grants, over and above EFC’s conventional Federal funding. The ARRA projects will receive 50 percent of the project costs as a low-cost loan and the remaining 50 percent as principal forgiveness. CLEAN WATER STATE REVOLVING FUND PROGRAM This program was established in 1989 to help municipalities comply with the Federal Clean Water Act by providing low-interest rate financings to build or upgrade water pollution control facilities. Since 1989, the program has received Federal and State appropriations totaling $3.2 billion and $633 million, respectively. The State Revolving Fund has made financings totaling $15.3 billion to 511 recipients across the State. Interest rates range from as low as zero percent to no more than two-thirds of the market rate. These low-interest rate financings substantially reduce the cost of water pollution control projects for borrowers, making environmental compliance and protection more attainable. DRINKING WATER STATE REVOLVING FUND PROGRAM In 1996, Congress enacted Federal legislation authorizing the Drinking Water State Revolving Fund program. This program, modeled after the Clean Water State Revolving Fund program, provides reduced interest rate financings to community and private water systems to finance safe drinking water projects. In cases of financial hardship, funds are also available from the Clean Water/Clean Air Bond Act to make grants for the construction of drinking water facilities. The Drinking Water Program has made loans and grants totaling $2.7 billion to 342 recipients across the State. Federal funding provided for the Drinking Water State Revolving Fund requires a 20 percent State match. Since 1996, the program has received Federal and State appropriations totaling $738 million and $265 million, respectively. The State’s share of the Drinking Water State Revolving Fund is provided from the Clean Water/Clean Air Bond Act. INDUSTRIAL FINANCE PROGRAM Since 1976, the Industrial Finance Program has provided more than $2.7 billion in low-interest rate loans to businesses and State agencies for environmental improvement projects. Projects eligible for loans include solid waste management facilities, hazardous waste management facilities, and water supply and wastewater management facilities. Loans under the program are financed from the proceeds of special obligation revenue bonds issued by the Corporation.
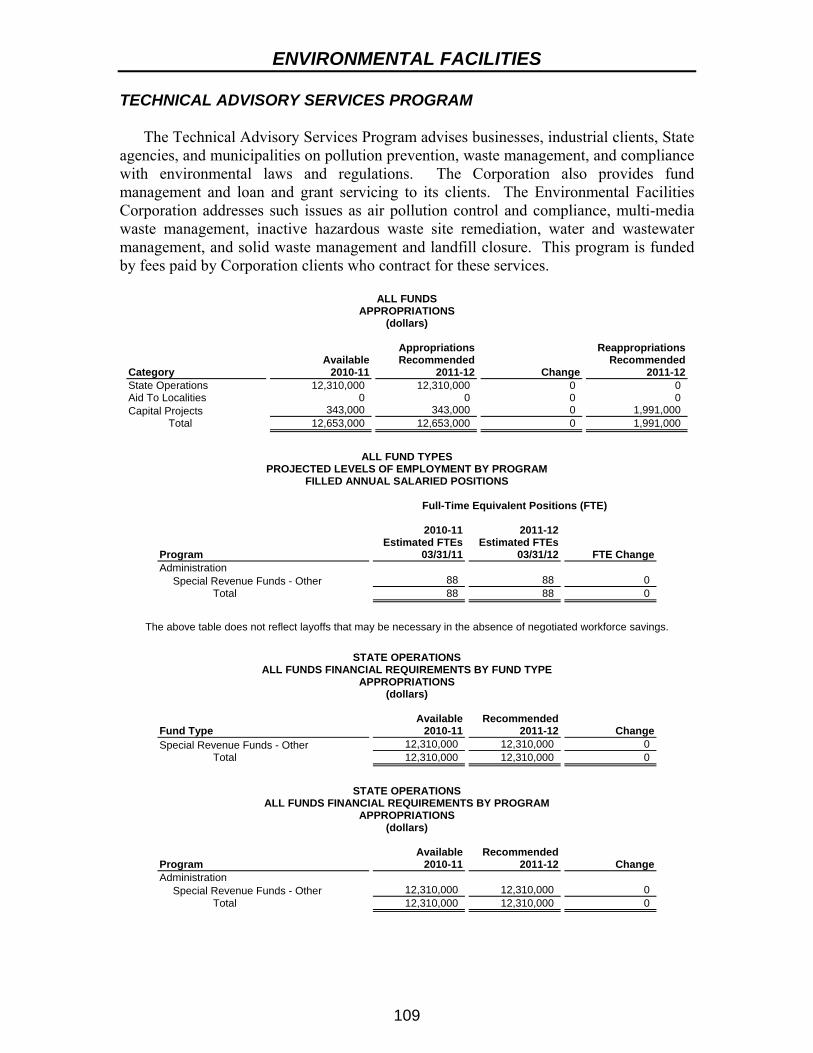
ENVIRONMENTAL FACILITIES
109
TECHNICAL ADVISORY SERVICES PROGRAM The Technical Advisory Services Program advises businesses, industrial clients, State agencies, and municipalities on pollution prevention, waste management, and compliance with environmental laws and regulations. The Corporation also provides fund management and loan and grant servicing to its clients. The Environmental Facilities Corporation addresses such issues as air pollution control and compliance, multi-media waste management, inactive hazardous waste site remediation, water and wastewater management, and solid waste management and landfill closure. This program is funded by fees paid by Corporation clients who contract for these services.
ALL FUNDS APPROPRIATIONS
(dollars)
Category Available
2010-11
AppropriationsRecommended
2011-12 Change
ReappropriationsRecommended
2011-12State Operations 12,310,000 12,310,000 0 0 Aid To Localities 0 0 0 0 Capital Projects 343,000 343,000 0 1,991,000 Total 12,653,000 12,653,000 0 1,991,000
ALL FUND TYPES
PROJECTED LEVELS OF EMPLOYMENT BY PROGRAM FILLED ANNUAL SALARIED POSITIONS
Full-Time Equivalent Positions (FTE)
Program
2010-11Estimated FTEs
03/31/11
2011-12Estimated FTEs
03/31/12 FTE ChangeAdministration
Special Revenue Funds - Other 88 88 0 Total 88 88 0
The above table does not reflect layoffs that may be necessary in the absence of negotiated workforce savings.
STATE OPERATIONS
ALL FUNDS FINANCIAL REQUIREMENTS BY FUND TYPE APPROPRIATIONS
(dollars)
Fund Type Available
2010-11Recommended
2011-12 ChangeSpecial Revenue Funds - Other 12,310,000 12,310,000 0 Total 12,310,000 12,310,000 0
STATE OPERATIONS
ALL FUNDS FINANCIAL REQUIREMENTS BY PROGRAM APPROPRIATIONS
(dollars)
Program Available
2010-11Recommended
2011-12 ChangeAdministration
Special Revenue Funds - Other 12,310,000 12,310,000 0 Total 12,310,000 12,310,000 0

ENVIRONMENTAL FACILITIES
110
STATE OPERATIONS - OTHER THAN GENERAL FUND SUMMARY OF APPROPRIATIONS AND CHANGES
2011-12 RECOMMENDED (dollars)
Total Personal Service Program Amount Change Amount ChangeAdministration 12,310,000 0 7,429,000 0 Total 12,310,000 0 7,429,000 0 Nonpersonal Service Program Amount Change Administration 4,881,000 0 Total 4,881,000 0
CAPITAL PROJECTS
ALL FUNDS FINANCIAL REQUIREMENTS BY PROGRAM APPROPRIATIONS
(dollars)
Comprehensive Construction Program Available
2010-11Recommended
2011-12 Change Reappropriations
2011-12Pipeline for Jobs Program
Capital Projects Fund - Authority Bonds 0 0 0 1,305,000 Clean Water - Clean Air Implementation
Clean Water Clean Air Implementation Fund 343,000 343,000 0 686,000 Total 343,000 343,000 0 1,991,000

111
EXECUTIVE CHAMBER MISSION The Executive Chamber is the Office of the Governor and includes the immediate staff that assists the Governor in managing State government. ORGANIZATION AND STAFFING The Office of the Governor is located in the State Capitol in Albany and also has offices in New York City and Washington, D.C. This budget represents programs directly related to the Governor’s Office and is supported by General Fund revenues. BUDGET HIGHLIGHTS The Executive Budget recommends $17.9 million All Funds ($17.8 million General Fund; $90,000 Other Funds) for the Executive Chamber. Appropriations in 2011-12 have decreased by almost $2 million (-10 percent) from 2010-11, with reductions in both personal and non-personal service. The Executive Budget reduces each agency’s General Fund State Operations budget by 10 percent. These savings are intended to be achieved through administrative efficiencies in non-personal service and negotiated workforce savings that minimize layoffs to the extent possible.
ALL FUNDS APPROPRIATIONS
(dollars)
Category Available
2010-11
AppropriationsRecommended
2011-12 Change
ReappropriationsRecommended
2011-12State Operations 19,938,000 17,944,000 (1,994,000) 0 Aid To Localities 0 0 0 0 Capital Projects 0 0 0 0 Total 19,938,000 17,944,000 (1,994,000) 0
ALL FUND TYPES
PROJECTED LEVELS OF EMPLOYMENT BY PROGRAM FILLED ANNUAL SALARIED POSITIONS
Full-Time Equivalent Positions (FTE)
Program
2010-11Estimated FTEs
03/31/11
2011-12Estimated FTEs
03/31/12 FTE ChangeExecutive Chamber
General Fund 136 136 0 Total 136 136 0
The above table does not reflect layoffs that may be necessary in the absence of negotiated workforce savings.
STATE OPERATIONS
ALL FUNDS FINANCIAL REQUIREMENTS BY FUND TYPE APPROPRIATIONS
(dollars)
Fund Type Available
2010-11Recommended
2011-12 ChangeGeneral Fund 19,838,000 17,854,000 (1,984,000) Special Revenue Funds - Other 100,000 90,000 (10,000) Total 19,938,000 17,944,000 (1,994,000)

EXECUTIVE CHAMBER
112
STATE OPERATIONS ALL FUNDS FINANCIAL REQUIREMENTS BY PROGRAM
APPROPRIATIONS (dollars)
Program Available
2010-11Recommended
2011-12 ChangeExecutive Chamber
General Fund 19,838,000 17,854,000 (1,984,000) Special Revenue Funds - Other 100,000 90,000 (10,000)
Total 19,938,000 17,944,000 (1,994,000)
STATE OPERATIONS - GENERAL FUND
SUMMARY OF PERSONAL SERVICE APPROPRIATIONS AND CHANGES 2011-12 RECOMMENDED
(dollars)
Total Personal Service Regular
(Annual Salaried) Program Amount Change Amount ChangeExecutive Chamber 13,371,000 (1,485,000) 13,011,000 (1,445,000) Total 13,371,000 (1,485,000) 13,011,000 (1,445,000)
Temporary Service
(Nonannual Salaried) Holiday/Overtime Pay
Program Amount Change Amount ChangeExecutive Chamber 180,000 (20,000) 180,000 (20,000) Total 180,000 (20,000) 180,000 (20,000)
STATE OPERATIONS - GENERAL FUND
SUMMARY OF NONPERSONAL SERVICE AND MAINTENANCE UNDISTRIBUTED APPROPRIATIONS AND CHANGES
2011-12 RECOMMENDED (dollars)
Total Supplies and Materials Program Amount Change Amount ChangeExecutive Chamber 4,483,000 (499,000) 180,000 (20,000) Total 4,483,000 (499,000) 180,000 (20,000) Travel Contractual Services Program Amount Change Amount ChangeExecutive Chamber 450,000 (50,000) 3,673,000 (409,000) Total 450,000 (50,000) 3,673,000 (409,000) Equipment Program Amount Change Executive Chamber 180,000 (20,000) Total 180,000 (20,000)
STATE OPERATIONS - OTHER THAN GENERAL FUND
SUMMARY OF APPROPRIATIONS AND CHANGES 2011-12 RECOMMENDED
(dollars) Total Nonpersonal Service Program Amount Change Amount ChangeExecutive Chamber 90,000 (10,000) 90,000 (10,000) Total 90,000 (10,000) 90,000 (10,000)

113
OFFICE OF THE LIEUTENANT GOVERNOR The Office of the Lieutenant Governor, in addition to other projects, is responsible for assisting the Governor in leading the new regional economic development councils that will coordinate and integrate State agency responses with local government and business activities to create jobs. The Executive Budget recommends $630,000 in General Funds for the Office of the Lieutenant Governor. Appropriations in 2011-12 have decreased by $70,000 (-10 percent) from 2010-11, with reductions in both personal and non-personal service. The Executive Budget reduces each agency’s General Fund State Operations budget by 10 percent. These savings are intended to be achieved through administrative efficiencies in non-personal service and negotiated workforce savings that minimize layoffs to the extent possible.
ALL FUNDS APPROPRIATIONS
(dollars)
Category Available
2010-11
AppropriationsRecommended
2011-12 Change
ReappropriationsRecommended
2011-12State Operations 700,000 630,000 (70,000) 0 Aid To Localities 0 0 0 0 Capital Projects 0 0 0 0 Total 700,000 630,000 (70,000) 0
ALL FUND TYPES
PROJECTED LEVELS OF EMPLOYMENT BY PROGRAM FILLED ANNUAL SALARIED POSITIONS
Full-Time Equivalent Positions (FTE)
Program
2010-11Estimated FTEs
03/31/11
2011-12Estimated FTEs
03/31/12 FTE ChangeAdministration
General Fund 7 7 0 Total 7 7 0
The above table does not reflect layoffs that may be necessary in the absence of negotiated workforce savings.
STATE OPERATIONS
ALL FUNDS FINANCIAL REQUIREMENTS BY FUND TYPE APPROPRIATIONS
(dollars)
Fund Type Available
2010-11Recommended
2011-12 ChangeGeneral Fund 700,000 630,000 (70,000) Total 700,000 630,000 (70,000)
STATE OPERATIONS
ALL FUNDS FINANCIAL REQUIREMENTS BY PROGRAM APPROPRIATIONS
(dollars)
Program Available
2010-11Recommended
2011-12 ChangeAdministration
General Fund 700,000 630,000 (70,000) Total 700,000 630,000 (70,000)
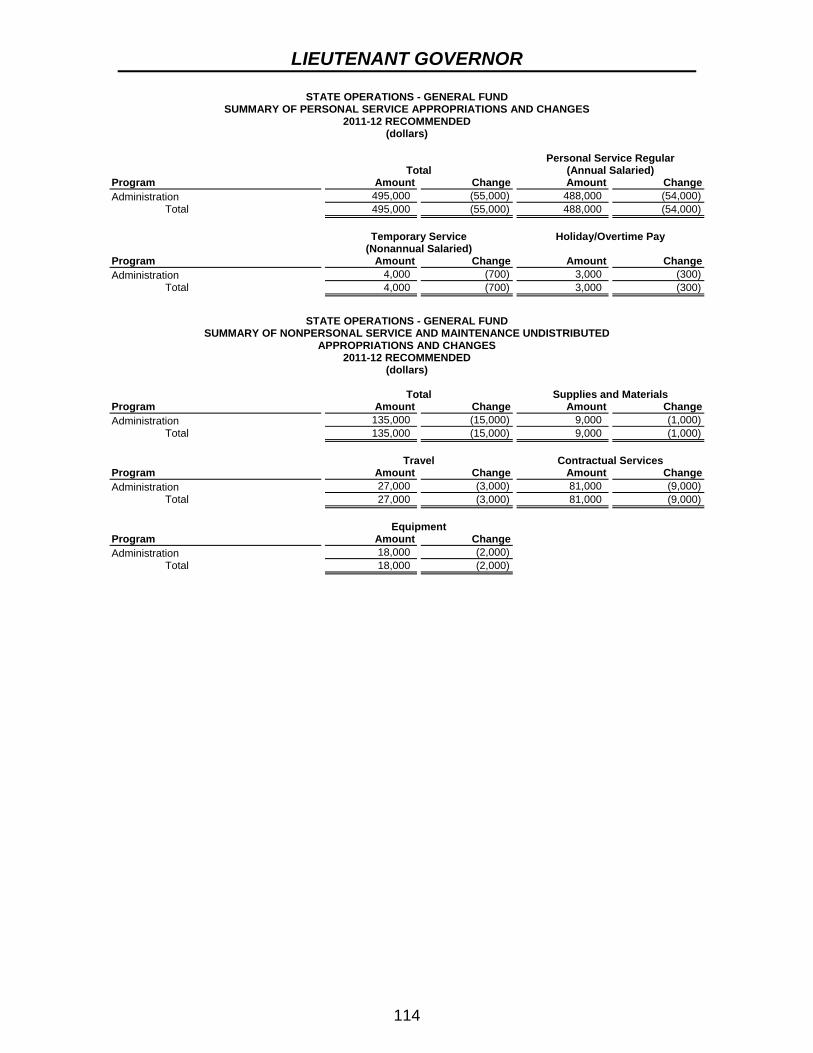
LIEUTENANT GOVERNOR
114
STATE OPERATIONS - GENERAL FUND SUMMARY OF PERSONAL SERVICE APPROPRIATIONS AND CHANGES
2011-12 RECOMMENDED (dollars)
Total Personal Service Regular
(Annual Salaried) Program Amount Change Amount ChangeAdministration 495,000 (55,000) 488,000 (54,000) Total 495,000 (55,000) 488,000 (54,000)
Temporary Service
(Nonannual Salaried) Holiday/Overtime Pay
Program Amount Change Amount ChangeAdministration 4,000 (700) 3,000 (300) Total 4,000 (700) 3,000 (300)
STATE OPERATIONS - GENERAL FUND
SUMMARY OF NONPERSONAL SERVICE AND MAINTENANCE UNDISTRIBUTED APPROPRIATIONS AND CHANGES
2011-12 RECOMMENDED (dollars)
Total Supplies and Materials Program Amount Change Amount ChangeAdministration 135,000 (15,000) 9,000 (1,000) Total 135,000 (15,000) 9,000 (1,000) Travel Contractual Services Program Amount Change Amount ChangeAdministration 27,000 (3,000) 81,000 (9,000) Total 27,000 (3,000) 81,000 (9,000) Equipment Program Amount Change Administration 18,000 (2,000) Total 18,000 (2,000)

115
OFFICE OF CHILDREN AND FAMILY SERVICES MISSION The Office of Children and Family Services (OCFS) was established in 1998 to strengthen services for and promote the well-being and safety of children and families. ORGANIZATION AND STAFFING The Office is headquartered in Rensselaer with regional offices throughout the State. These offices provide operational support and policy direction to local social services districts and youth bureaus. OCFS operates residential facilities (including secure, limited secure, non secure and community residential home programs) and day placement programs statewide, with the capacity to serve 833 youth, projected, by the end of 2011-12. BUDGET HIGHLIGHTS The Executive Budget recommends $3.7 billion All Funds ($2 billion General Fund; $1.7 billion Other Funds) for the Office of Children and Family Services. This is a net decrease of $167.6 million (-4.3 percent) ($173.2 million General Fund decrease; $5.5 million Other Funds increase) from the 2010-11 budget. This net change primarily reflects reductions to non-core programs. The Executive Budget reduces each agency’s General Fund State Operations budget by 10 percent. These savings are intended to be achieved through administrative efficiencies in non-personal service and negotiated workforce savings that minimize layoffs to the extent possible. Major budget actions include:
Preserve Open-ended Funding for Child Welfare Services: The centerpiece of the child welfare financing system is the provision of 62 percent State reimbursement for preventive and child protective services. In order to preserve this funding source, the Executive Budget discontinues funding for the child welfare quality program, which supports services related to improving child welfare services. In addition, OCFS will expand the collection and distribution of information to local social services districts outside of New York City. This information will allow local districts to assess performance and make more informed decisions when contracting for preventive and foster care services.
Utilize Federal Title XX Funding to Support Child Welfare Services: Currently, districts are allocated $102 million annually in Federal Title XX funding, of which the State requires that $66 million be used to offset the State and local cost of the Adult Protective and Domestic Violence Services program. The 2011-12 Executive Budget would shift the remaining $36 million in Title XX funds from mainly discretionary services to reduce the 62 percent State and 38 percent local share of child welfare services. In doing this, the State generates $22 million in savings and reduces by $14 million the direct cost to districts for providing such services. Districts would lose $36 million of discretionary Title XX funds.
Create the Primary Prevention Incentive Program: This new $35 million program (growing to $42 million in 2012-13) would support Statewide front-end prevention services. Primary Prevention Incentive Program funding would be allocated to local social services districts on a competitive basis, and would

CHILDREN AND FAMILY SERVICES
116
support locally administered strategies that improve performance in youth services. This proposal would provide $35 million in net savings in 2011-12 by partially replacing funding for a number of existing OCFS programs.
Juvenile Justice Reform: Right-Size Youth Facility Capacity: The 2011-12 Executive Budget reflects
$22 million in net savings from the closure and downsizing of OCFS facilities. These actions are consistent with declining population trends in OCFS facilities, which has led to system-wide utilization rates of only 50 percent. These actions will reduce OCFS facility jobs by a net 371 annual salaried positions and youth facility capacity by 376 beds.
Improve OCFS Facility Operations: In 2010-11, OCFS began implementing improved medical, mental health and direct care services and increased staff to youth ratios in four youth facilities. The Executive Budget includes $13.5 million for improvements in the remaining facilities in 2011-12. This investment will improve services in all OCFS facilities and outcomes for youth as they return to their home communities. This action will increase staff in the youth facility program by 414.
Establish the Supervision and Treatment Services for Juveniles Program: This program will provide funding ($31.4 million in 2011-12 growing to $48.3 million in 2012-13) to local governments to support performance focused, community based alternatives to placing youth in costly State youth facilities and local detention centers.
Eliminate the Alternatives to Detention/Residential Placement Program: The Executive Budget eliminates $2.2 million in funding for programs that offer community based services to youth as an alternative to institutional placement. Enhanced funding levels will be supported through the new Supervision and Treatment Services for Juveniles Program.
Establish a Capped Detention Program. The Executive Budget provides $15 million to support 50 percent of local detention costs for high-risk youth who pose a risk to public safety. Low risk youth will be served in programs supported with funding from the new Supervision and Treatment Services for Juveniles Program.
Eliminate Open Ended Funding for Local Secure and Non Secure Detention: The Executive Budget eliminates 49 percent state reimbursement for local secure and non secure detention effective July 1, 2011. Local detention costs for high risk youth will be supported through the new capped Detention Program that will provide stronger incentives for local governments to implement effective community-based programs that will generate long-term state and local savings, and better serve youth.
Maintain the Foster Care Block Grant: The 2011-12 Executive Budget maintains funding for the Foster Care Block grant at $436 million. Under the block grant, savings that result from reduced use of foster care can be reinvested in locally-designed child welfare initiatives that strengthen preventive services or better serve high-needs children.
Maintain the Bridges to Health Program: The Bridges to Health Home and Community-Based Medicaid Waiver Program, designed to enhance services to foster care children with multiple needs and prevent them from entering institutional care, was reauthorized by the Federal government for five years starting in 2011. The State will continue to support 3,305 slots for this program.

CHILDREN AND FAMILY SERVICES
117
Implement Child Care Unionization Agreements: In October 2009, the State reached agreements with the Civil Service Employees Association and the United Federation of Teachers, the unions that represent home based child care providers. The 2011-12 Executive Budget includes $5 million in appropriations pursuant to the agreements for quality improvement grants for home-based child care providers.
Align Adoption Subsidy Reimbursement Percentage with Preventive Services: The Adoption Subsidy Program is designed to maintain permanent homes for youth in foster care that cannot return to the care of their biological parents. Monthly subsidies are paid to adoptive parents to support the special needs of handicapped and hard-to-place children in foster care. The current State share, net of available Federal funding, is 73.5 percent. This proposal would reduce the State share to 62 percent, in order to align cost shares with preventive services, which are designed to prevent foster care placements.
Better Align Committee on Special Education (CSE) Funding Responsibility: OCFS oversees the maintenance (room and board) costs of students who are placed in residential schools by a CSE when the child’s needs cannot be met in the school district. Educational determinations that result in residential placements are made by a school district’s CSE. Currently, the maintenance cost shares are split between the State (36.8 percent), the local social services districts (43.2 percent) and the school districts (20 percent). This proposal would better align costs with the entity that makes determinations of placement for children by shifting the State share of costs to the school district. This would result in State savings of $69.3 million. This action should also incentivize school districts to find more effective and less costly ways to better serve these children in their schools and community.
Eliminate the Human Services COLA: This action would eliminate the projected 1.2 percent cost of living adjustment scheduled to take effect in 2011-12 for savings of $13 million. This recommendation would impact the following human services programs: Adoption, Foster Care, Committee on Special Education, Office of Mental Health Home and Community Based Services Waiver, Bridges to Health Medicaid Waiver and New York/New York III.
Eliminate Child Welfare Quality Funding: This action would eliminate supplemental programs and initiatives designed to improve the quality of child welfare services including demonstration projects, training and program evaluations.
Require a $60 Fee for Child Abuse and Maltreatment Background Checks through the Statewide Central Registrar (SCR): The Executive Budget proposes to increase the fee for child abuse and maltreatment clearance checks from $5 to $60 for individuals who currently pay for clearances and impose a $60 fee on individuals who are currently exempt from the fee. Fees will be applied to those obtaining a clearance check for employment purposes. The proposed fee modifications would generate $12 million in revenue.
Additional Agency Reductions: The Executive Budget recommends an additional reduction to OCFS State operations of $21.4 million. The agency will achieve these savings through reductions to personal service and non-personal service costs.

CHILDREN AND FAMILY SERVICES
118
PROGRAM HIGHLIGHTS The Office of Children and Family Services supervises the State’s system of family support and child welfare services to help families live independently. County departments of social services and, in many cases, community-based local organizations, administer programs that identify and protect abused and neglected children; provide counseling and other services to strengthen families and avoid foster care; place children in foster care as needed; reunite children and families; find permanent adoptive parents for children who cannot be reunited with birth families; and prepare teens for independent living. OCFS also oversees a variety of programs serving the State’s most needy and vulnerable adult residents. Programs include oversight of locally administered adult protective services and programs providing services to victims of domestic violence, including emergency shelters and community-based crisis intervention. CHILD CARE The Office’s Child Care Block Grant supports child care subsidies for public assistance and low-income families. Subsidized child care is guaranteed for public assistance recipients with children up to age 13 when such care is required for the parent/guardian to engage in work activities. Families transitioning from welfare to work are guaranteed subsidized child care for up to 12 months after leaving public assistance. The State also provides subsidized child care to families at risk of becoming dependent on public assistance. YOUTH FACILITIES The Office operates a Youth Facilities Program which-, includes residential facilities and day placement programs serving youth placed by the Family Courts or directed by the Criminal Courts. Through a broad array of programs, the Office provides rehabilitative services that include counseling, mental health, substance abuse, sex offender and education and vocational training designed to promote positive youth development and foster a youth’s return to the community as a law-abiding, productive citizen. CHILD ABUSE HOTLINE The Office operates the State Central Register Child Abuse Hotline, which is expected to receive over 370,000 calls reporting alleged child maltreatment or abuse in 2011-12. The State initiates investigations of these allegations, which are conducted by county protective services staff and/or local law enforcement agencies. The Register maintains a master database of those found culpable of child abuse so that employers, such as day care centers, can screen out potential employees with a history of child abuse.

CHILDREN AND FAMILY SERVICES
119
ALL FUNDS APPROPRIATIONS
(dollars)
Category Available
2010-11
AppropriationsRecommended
2011-12 Change
ReappropriationsRecommended
2011-12State Operations 534,363,700 529,200,000 (5,163,700) 394,358,500 Aid To Localities 3,301,424,700 3,138,976,300 (162,448,400) 3,146,117,624 Capital Projects 37,675,000 37,675,000 0 155,454,000 Total 3,873,463,400 3,705,851,300 (167,612,100) 3,695,930,124
ALL FUND TYPES
PROJECTED LEVELS OF EMPLOYMENT BY PROGRAM FILLED ANNUAL SALARIED POSITIONS
Full-Time Equivalent Positions (FTE)
Program
2010-11Estimated FTEs
03/31/11
2011-12Estimated FTEs
03/31/12 FTE ChangeCentral Administration
General Fund 274 274 0 Special Revenue Funds - Federal 2 8 6
Child Care Special Revenue Funds - Federal 232 232 0
Commission for the Blind and Visually Handicapped General Fund 10 10 0 Special Revenue Funds - Federal 139 139 0 Special Revenue Funds - Other 1 1 0
Family and Children Services General Fund 475 475 0 Special Revenue Funds - Federal 57 57 0 Special Revenue Funds - Other 2 2 0
Maintenance & Improvement of Youth Facilities Capital Projects Funds - Other 7 7 0
Systems Support General Fund 137 137 0
Training and Development Special Revenue Funds - Other 56 56 0
Youth Facilities General Fund 1,959 2,373 414
Total 3,351 3,771 420
The above table does not reflect layoffs that may be necessary in the absence of negotiated workforce savings.
STATE OPERATIONS
ALL FUNDS FINANCIAL REQUIREMENTS BY FUND TYPE APPROPRIATIONS
(dollars)
Fund Type Available
2010-11Recommended
2011-12 ChangeGeneral Fund 287,088,000 283,251,000 (3,837,000) Special Revenue Funds - Federal 142,165,700 140,836,000 (1,329,700) Special Revenue Funds - Other 104,535,000 104,538,000 3,000 Enterprise Funds 475,000 475,000 0 Internal Service Funds 100,000 100,000 0 Total 534,363,700 529,200,000 (5,163,700)

CHILDREN AND FAMILY SERVICES
120
STATE OPERATIONS ALL FUNDS FINANCIAL REQUIREMENTS BY PROGRAM
APPROPRIATIONS (dollars)
Program Available
2010-11Recommended
2011-12 ChangeCentral Administration
General Fund 30,308,000 27,277,000 (3,031,000) Special Revenue Funds - Federal 6,528,000 528,000 (6,000,000) Special Revenue Funds - Other 3,534,000 3,534,000 0 Internal Service Funds 100,000 100,000 0
Child Care Special Revenue Funds - Federal 49,583,700 51,254,000 1,670,300
Commission for the Blind and Visually Handicapped General Fund 9,098,000 8,188,000 (910,000) Special Revenue Funds - Federal 32,503,000 32,503,000 0 Special Revenue Funds - Other 1,919,000 1,920,000 1,000
Departmental Administrative Reimbursement General Fund (27,990,000) (27,992,000) (2,000) Special Revenue Funds - Other 34,490,000 34,492,000 2,000
Family and Children Services General Fund 43,884,000 39,497,000 (4,387,000) Special Revenue Funds - Federal 22,958,000 25,958,000 3,000,000 Special Revenue Funds - Other 1,343,000 1,343,000 0
Systems Support General Fund 56,968,000 57,697,000 729,000 Special Revenue Funds - Federal 30,593,000 30,593,000 0 Special Revenue Funds - Other 10,000,000 10,000,000 0
Training and Development General Fund 5,887,000 5,299,000 (588,000) Special Revenue Funds - Other 53,249,000 53,249,000 0 Enterprise Funds 200,000 200,000 0
Youth Facilities General Fund 168,933,000 173,285,000 4,352,000 Enterprise Funds 275,000 275,000 0
Total 534,363,700 529,200,000 (5,163,700)
STATE OPERATIONS - GENERAL FUND
SUMMARY OF PERSONAL SERVICE APPROPRIATIONS AND CHANGES 2011-12 RECOMMENDED
(dollars)
Total Personal Service Regular
(Annual Salaried) Program Amount Change Amount ChangeCentral Administration 21,217,000 (2,357,000) 20,832,000 (2,314,000)Commission for the Blind and Visually
Handicapped 1,673,000 (186,000) 1,661,000 (185,000)Departmental Administrative
Reimbursement (27,992,000) (2,000) (27,992,000) (2,000)Family and Children Services 27,883,000 (3,097,000) 25,543,000 (2,837,000)Systems Support 9,855,000 (1,095,000) 9,701,000 (1,079,000)Youth Facilities 102,887,000 (18,915,000) 91,563,000 (16,897,000) Total 135,523,000 (25,652,000) 121,308,000 (23,314,000)
Temporary Service
(Nonannual Salaried) Holiday/Overtime Pay
Program Amount Change Amount ChangeCentral Administration 311,000 (35,000) 74,000 (8,000)Commission for the Blind and Visually
Handicapped 0 0 12,000 (1,000)Departmental Administrative
Reimbursement 0 0 0 0 Family and Children Services 0 0 2,340,000 (260,000)Systems Support 0 0 154,000 (16,000)Youth Facilities 3,051,000 (491,000) 8,273,000 (1,527,000) Total 3,362,000 (526,000) 10,853,000 (1,812,000)
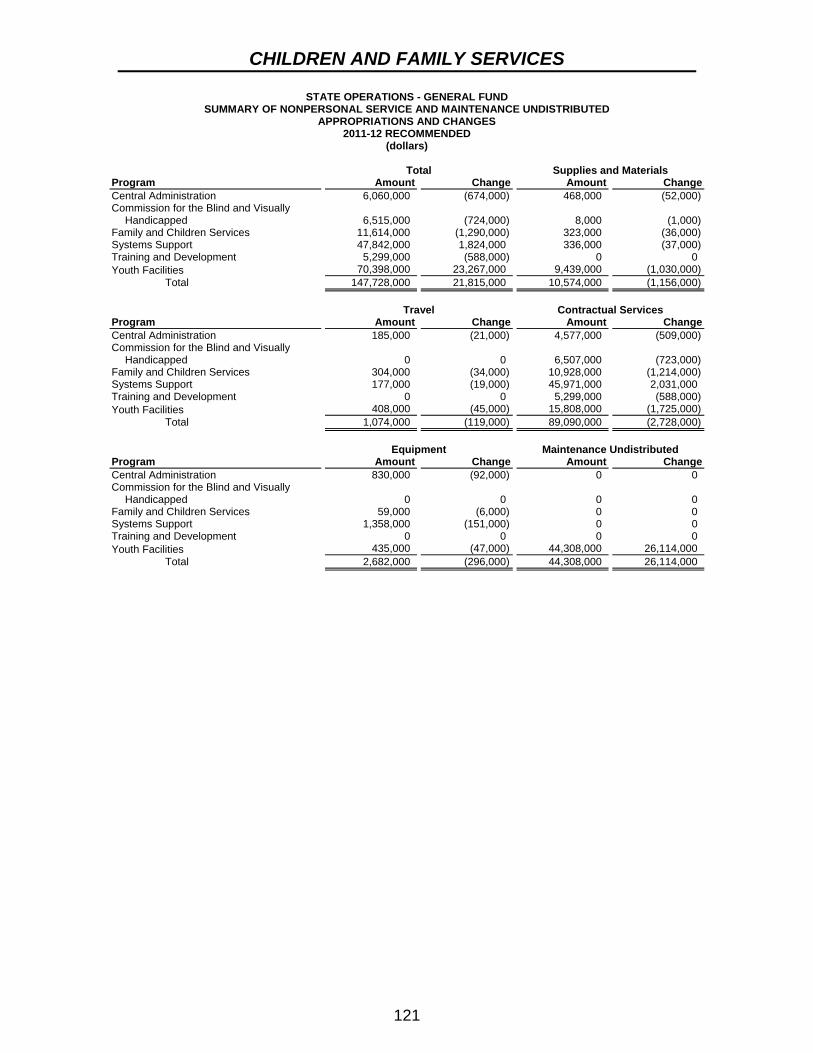
CHILDREN AND FAMILY SERVICES
121
STATE OPERATIONS - GENERAL FUND SUMMARY OF NONPERSONAL SERVICE AND MAINTENANCE UNDISTRIBUTED
APPROPRIATIONS AND CHANGES 2011-12 RECOMMENDED
(dollars) Total Supplies and Materials Program Amount Change Amount ChangeCentral Administration 6,060,000 (674,000) 468,000 (52,000)Commission for the Blind and Visually
Handicapped 6,515,000 (724,000) 8,000 (1,000)Family and Children Services 11,614,000 (1,290,000) 323,000 (36,000)Systems Support 47,842,000 1,824,000 336,000 (37,000)Training and Development 5,299,000 (588,000) 0 0 Youth Facilities 70,398,000 23,267,000 9,439,000 (1,030,000) Total 147,728,000 21,815,000 10,574,000 (1,156,000) Travel Contractual Services Program Amount Change Amount ChangeCentral Administration 185,000 (21,000) 4,577,000 (509,000)Commission for the Blind and Visually
Handicapped 0 0 6,507,000 (723,000)Family and Children Services 304,000 (34,000) 10,928,000 (1,214,000)Systems Support 177,000 (19,000) 45,971,000 2,031,000 Training and Development 0 0 5,299,000 (588,000)Youth Facilities 408,000 (45,000) 15,808,000 (1,725,000) Total 1,074,000 (119,000) 89,090,000 (2,728,000) Equipment Maintenance Undistributed Program Amount Change Amount ChangeCentral Administration 830,000 (92,000) 0 0 Commission for the Blind and Visually
Handicapped 0 0 0 0 Family and Children Services 59,000 (6,000) 0 0 Systems Support 1,358,000 (151,000) 0 0 Training and Development 0 0 0 0 Youth Facilities 435,000 (47,000) 44,308,000 26,114,000 Total 2,682,000 (296,000) 44,308,000 26,114,000

CHILDREN AND FAMILY SERVICES
122
STATE OPERATIONS - OTHER THAN GENERAL FUND SUMMARY OF APPROPRIATIONS AND CHANGES
2011-12 RECOMMENDED (dollars)
Total Personal Service Program Amount Change Amount ChangeCentral Administration 4,162,000 (6,000,000) 251,000 215,000 Child Care 51,254,000 1,670,300 16,780,000 16,780,000 Commission for the Blind and Visually
Handicapped 34,423,000 1,000 8,849,000 8,799,000 Departmental Administrative
Reimbursement 34,492,000 2,000 27,992,000 2,000 Family and Children Services 27,301,000 3,000,000 8,167,000 8,056,000 Systems Support 40,593,000 0 0 0 Training and Development 53,449,000 0 5,557,000 0 Youth Facilities 275,000 0 0 0 Total 245,949,000 (1,326,700) 67,596,000 33,852,000 Nonpersonal Service Maintenance Undistributed Program Amount Change Amount ChangeCentral Administration 3,911,000 313,000 0 (6,528,000)Child Care 34,474,000 34,474,000 0 (49,583,700)Commission for the Blind and Visually
Handicapped 25,574,000 23,705,000 0 (32,503,000)Departmental Administrative
Reimbursement 6,500,000 0 0 0 Family and Children Services 19,134,000 8,491,000 0 (13,547,000)Systems Support 10,000,000 10,000,000 30,593,000 (10,000,000)Training and Development 47,692,000 0 200,000 0 Youth Facilities 275,000 0 0 0 Total 147,560,000 76,983,000 30,793,000 (112,161,700)
AID TO LOCALITIES
ALL FUNDS FINANCIAL REQUIREMENTS BY FUND TYPE APPROPRIATIONS
(dollars)
Fund Type Available
2010-11Recommended
2011-12 ChangeGeneral Fund 1,886,087,400 1,716,768,300 (169,319,100) Special Revenue Funds - Federal 1,396,535,300 1,406,865,000 10,329,700 Special Revenue Funds - Other 18,802,000 15,343,000 (3,459,000) Total 3,301,424,700 3,138,976,300 (162,448,400)
AID TO LOCALITIES
ALL FUNDS FINANCIAL REQUIREMENTS BY PROGRAM APPROPRIATIONS
(dollars)
Program Available
2010-11Recommended
2011-12 ChangeChild Care
General Fund 142,351,700 144,351,700 2,000,000 Special Revenue Funds - Federal 310,416,300 308,746,000 (1,670,300) Special Revenue Funds - Other 343,000 343,000 0
Family and Children Services General Fund 1,738,919,900 1,567,600,800 (171,319,100) Special Revenue Funds - Federal 1,066,900,000 1,078,900,000 12,000,000 Special Revenue Funds - Other 18,459,000 15,000,000 (3,459,000)
Training and Development General Fund 4,815,800 4,815,800 0 Special Revenue Funds - Federal 19,219,000 19,219,000 0
Total 3,301,424,700 3,138,976,300 (162,448,400)

CHILDREN AND FAMILY SERVICES
123
CAPITAL PROJECTS ALL FUNDS FINANCIAL REQUIREMENTS BY PROGRAM
APPROPRIATIONS (dollars)
Comprehensive Construction Program Available
2010-11Recommended
2011-12 Change Reappropriations
2011-12Design and Construction Supervision
Youth Facilities Improvement Fund 7,000,000 7,000,000 0 15,139,000 Maintenance and Improvement of Facilities
Capital Projects Fund 1,825,000 1,825,000 0 9,930,000 Youth Facilities Improvement Fund 18,850,000 18,850,000 0 81,331,000
Executive Direction and Administrative Services Misc. Capital Projects 0 0 0 2,120,000
Program Improvement or Program Change Youth Facilities Improvement Fund 10,000,000 10,000,000 0 41,621,000
Youth Center Capital Projects Fund 0 0 0 5,313,000
Total 37,675,000 37,675,000 0 155,454,000

124
OFFICE OF TEMPORARY AND DISABILITY ASSISTANCE
MISSION The Office of Temporary and Disability Assistance (OTDA), working in close collaboration with the Office of Children and Family Services and other agencies, helps low-income households achieve economic self-sufficiency through work, job training and the provision of supportive services that help avert welfare dependency. OTDA also provides economic assistance to aged and disabled persons who are unable to work. ORGANIZATION AND STAFFING The Office of Temporary and Disability Assistance is headed by a Commissioner, who is appointed by the Governor subject to confirmation by the Senate. OTDA has its central office in Albany and three major field offices throughout the State. These offices provide direct operational support, supervision and guidance to the State’s 58 local social services districts, which include each county and New York City. Social services districts are responsible for directly administering most public assistance programs, including those that serve the homeless and refugees. Agency staff also provide legal, audit and computer systems support. Through its Disability Determinations Program, the agency evaluates the medical eligibility of disability claimants for Supplemental Security Income (SSI) and Social Security Disability Insurance (SSDI). BUDGET HIGHLIGHTS The Executive Budget recommends $5.6 billion All Funds ($1.4 billion General Fund; $4.2 billion Other Funds) for OTDA. This is a decrease of $367.8 million (-6.2 percent) from the 2010-11 budget ($48.5 million General Fund increase (3.7 percent); $416.3 million Other Funds decrease (-9 percent)). The Executive Budget reduces each agency’s General Fund State Operations budget by 10 percent. These savings are intended to be achieved through administrative efficiencies in non-personal service and negotiated workforce savings that minimize layoffs to the extent possible. Major budget actions include:
Fully Finance Family Assistance with Federal Funding: Under current practice, households on public assistance for fewer than five years are financed utilizing Federal, State and local dollars. The Executive Budget maximizes the usage of Federal funds by using Temporary Assistance for Needy Families (TANF) dollars to pay for the full benefit costs of such households, thereby reducing the State and local shares of public assistance benefit costs.
Delay the 2011 Public Assistance Grant Increase: The 2009-10 Enacted Budget increased the basic allowance portion of the public assistance grant by 10 percent a year for three consecutive years, starting in July 2009. The 2011-12 Budget delays, until July 2012, the final grant increase which is scheduled for July 2011. The State will continue to assume the local share of the previously implemented grant increases through March 31, 2012.
TEMPORARY AND DISABILITY ASSISTANCE
125
Reduce Reimbursement for New York City Adult Homeless Shelters: The Executive Budget caps reimbursement for the New York City adult homeless shelter system at $69 million, a reduction of $15.68 million from the 2010-11 level.
Eliminate State Funding for the New York City Work Advantage Program: In addition to the public assistance grant, the State contributes to a shelter supplement program that allows local social services districts to provide an enhanced shelter allowance for those households either at-risk for eviction or already residing in homeless shelters. The 2011-12 Budget ceases funding for the New York City Work Advantage shelter supplement program.
Strengthen Compliance with Public Assistance Work Requirements: Benefit payments to public assistance cases in which the head of the household is out of compliance with work requirements are reduced by the portion of the grant attributable to the head of the household. The 2011-12 Executive Budget withholds a family’s entire benefit in the second and subsequent instances in which the head of the household does not comply with employment requirements.
PROGRAM HIGHLIGHTS PUBLIC ASSISTANCE PROGRAM The Federal Personal Responsibility and Work Opportunity Reconciliation Act of 1996 replaced the old welfare program, Aid to Families with Dependent Children, with the Temporary Assistance for Needy Families (TANF) program – a capped block grant program with both a mandatory recipient work requirement and a five-year time limit provision for cash assistance. The New York State public assistance program is comprised of two populations: Family Assistance Households – who are on assistance for under five years and are thus eligible for federal reimbursement; and Safety Net Households – who are ineligible for federal reimbursement either because they are families who have exhausted their five-year federal limit for cash assistance or because they are single adults or childless couples. By evolving from an entitlement program focused on determining eligibility to a work-focused program that seeks to develop individual responsibility while reducing dependence on public assistance, welfare reform efforts have decreased the public assistance caseload by over 1 million individuals since 1995. STATE SUPPLEMENTAL SECURITY INCOME PROGRAM The Federal SSI program, which is administered by the Social Security Administration (SSA), provides monthly cash benefits to people with limited income and resources who are elderly (age 65 or older), blind, or disabled. In New York State, most SSI recipients receive both a Federal benefit and an additional State supplement. The amount of State supplementation, like the Federal benefit, is established by law and varies by living arrangement, with most recipients residing in the “living alone” category.

TEMPORARY AND DISABILITY ASSISTANCE
126
FOOD STAMP PROGRAM The Food Stamp program is a federally mandated program that seeks to improve the nutritional level of low-income households by supplementing their ability to purchase food items. Food stamp benefits are fully funded by the Federal government, which also shares in the administrative cost of implementing the program, including benefit issuance, fraud prevention, outreach, and employment and training activities. The Food Stamp program was initially authorized by the Food Stamp Act of 1977 but was reauthorized through the Food, Conservation and Energy Act of 2008 which also changed the name of the Federal program to the Supplemental Nutrition Assistance Program (SNAP). Legislation has not yet been enacted at the State level to change the name of the program to SNAP; as such its formal State title remains the Food Stamp program. In addition to outreach efforts, programmatic and administrative initiatives such as the Working Families Food Stamp Initiative (which mitigated some of the eligibility requirements for working families) and myBenefits (an online tool which helps in the enrollment process) have increased the number of food stamp recipients to approximately 3 million individuals. HOME ENERGY ASSISTANCE PROGRAM The Federal Low Income Home Energy Assistance Program (LIHEAP) helps eligible households meet the cost of home energy. Unlike the public assistance and food stamp programs, HEAP is not an entitlement program. Benefits are contingent upon the availability of Federal funding and are only authorized during the program period, which, in New York, typically runs from the beginning of November until mid-May. Households receiving public assistance, food stamp benefits, or SSI are categorically eligible for HEAP, whereas other households must apply and be deemed income eligible. In addition to benefit payments, the Federal HEAP grant also funds administrative activities associated with implementing the HEAP program, as well as weatherization activities which reduce energy usage in residential units occupied by low-income households. CHILD SUPPORT ENFORCEMENT PROGRAM The Child Support Enforcement Program, established in 1975 as Title IV-D of the Social Security Act, requires all states to enact laws and implement procedures for the establishment of paternity and the establishment, enforcement and collection of support. In an effort to reduce child poverty and maximize child well-being, activities undertaken since welfare reform have strengthened child support enforcement procedures to ensure that non-custodial parents provide for the economic well-being of their children. Recent improvements in the child support program include automated updating of child support awards to reflect inflation; improved customer services through website access of account information; interstate reciprocity in child support proceedings; and administrative authority for social services districts to order genetic tests, subpoena information and collect relevant data from Federal, State and local agencies.

TEMPORARY AND DISABILITY ASSISTANCE
127
ALL FUNDS APPROPRIATIONS
(dollars)
Category Available
2010-11
AppropriationsRecommended
2011-12 Change
ReappropriationsRecommended
2011-12State Operations 471,292,000 472,292,000 1,000,000 278,625,000 Aid To Localities 5,433,457,700 5,064,674,000 (368,783,700) 3,597,097,900 Capital Projects 30,000,000 30,000,000 0 104,851,000 Total 5,934,749,700 5,566,966,000 (367,783,700) 3,980,573,900
ALL FUND TYPES
PROJECTED LEVELS OF EMPLOYMENT BY PROGRAM FILLED ANNUAL SALARIED POSITIONS
Full-Time Equivalent Positions (FTE)
Program
2010-11Estimated FTEs
03/31/11
2011-12Estimated FTEs
03/31/12 FTE ChangeAdministration
General Fund 7 7 0 Special Revenue Funds - Federal 65 65 0 Special Revenue Funds - Other 268 268 0 Internal Service Funds 4 4 0
Child Well Being Program Special Revenue Funds - Federal 59 59 0 Special Revenue Funds - Other 25 25 0
Disability Determinations Program Special Revenue Funds - Federal 1,071 1,071 0
Employment and Economic Support Program General Fund 3 3 0 Special Revenue Funds - Federal 146 146 0 Special Revenue Funds - Other 79 79 0
Information Technology Program General Fund 11 11 0 Special Revenue Funds - Federal 40 40 0 Special Revenue Funds - Other 118 118 0
Legal Affairs General Fund 112 112 0 Special Revenue Funds - Other 175 175 0
Specialized Services Program General Fund 21 21 0 Special Revenue Funds - Federal 23 23 0 Special Revenue Funds - Other 21 21 0
Total 2,248 2,248 0
The above table does not reflect layoffs that may be necessary in the absence of negotiated workforce savings.
STATE OPERATIONS
ALL FUNDS FINANCIAL REQUIREMENTS BY FUND TYPE APPROPRIATIONS
(dollars)
Fund Type Available
2010-11Recommended
2011-12 ChangeGeneral Fund 63,116,000 56,804,000 (6,312,000) Special Revenue Funds - Federal 250,359,000 275,086,000 24,727,000 Special Revenue Funds - Other 156,618,000 139,203,000 (17,415,000) Internal Service Funds 1,199,000 1,199,000 0 Total 471,292,000 472,292,000 1,000,000
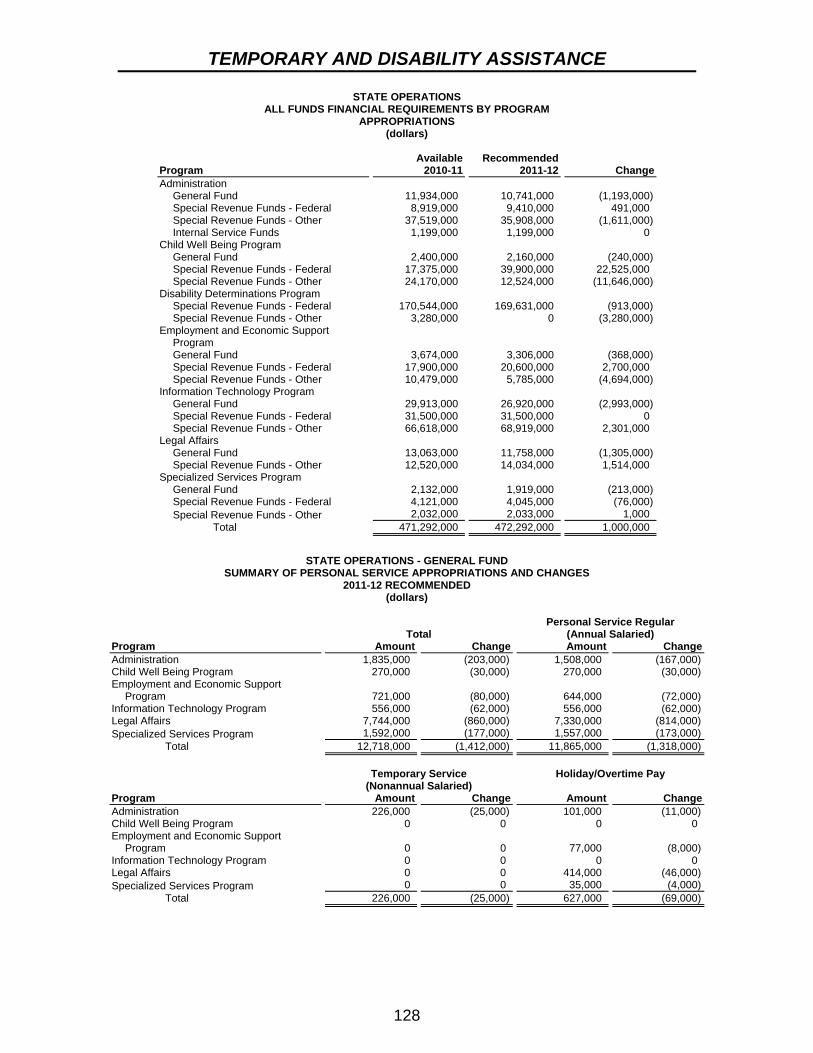
TEMPORARY AND DISABILITY ASSISTANCE
128
STATE OPERATIONS ALL FUNDS FINANCIAL REQUIREMENTS BY PROGRAM
APPROPRIATIONS (dollars)
Program Available
2010-11Recommended
2011-12 ChangeAdministration
General Fund 11,934,000 10,741,000 (1,193,000) Special Revenue Funds - Federal 8,919,000 9,410,000 491,000 Special Revenue Funds - Other 37,519,000 35,908,000 (1,611,000) Internal Service Funds 1,199,000 1,199,000 0
Child Well Being Program General Fund 2,400,000 2,160,000 (240,000) Special Revenue Funds - Federal 17,375,000 39,900,000 22,525,000 Special Revenue Funds - Other 24,170,000 12,524,000 (11,646,000)
Disability Determinations Program Special Revenue Funds - Federal 170,544,000 169,631,000 (913,000) Special Revenue Funds - Other 3,280,000 0 (3,280,000)
Employment and Economic Support Program General Fund 3,674,000 3,306,000 (368,000) Special Revenue Funds - Federal 17,900,000 20,600,000 2,700,000 Special Revenue Funds - Other 10,479,000 5,785,000 (4,694,000)
Information Technology Program General Fund 29,913,000 26,920,000 (2,993,000) Special Revenue Funds - Federal 31,500,000 31,500,000 0 Special Revenue Funds - Other 66,618,000 68,919,000 2,301,000
Legal Affairs General Fund 13,063,000 11,758,000 (1,305,000) Special Revenue Funds - Other 12,520,000 14,034,000 1,514,000
Specialized Services Program General Fund 2,132,000 1,919,000 (213,000) Special Revenue Funds - Federal 4,121,000 4,045,000 (76,000) Special Revenue Funds - Other 2,032,000 2,033,000 1,000
Total 471,292,000 472,292,000 1,000,000
STATE OPERATIONS - GENERAL FUND
SUMMARY OF PERSONAL SERVICE APPROPRIATIONS AND CHANGES 2011-12 RECOMMENDED
(dollars)
Total Personal Service Regular
(Annual Salaried) Program Amount Change Amount ChangeAdministration 1,835,000 (203,000) 1,508,000 (167,000)Child Well Being Program 270,000 (30,000) 270,000 (30,000)Employment and Economic Support
Program 721,000 (80,000) 644,000 (72,000)Information Technology Program 556,000 (62,000) 556,000 (62,000)Legal Affairs 7,744,000 (860,000) 7,330,000 (814,000)Specialized Services Program 1,592,000 (177,000) 1,557,000 (173,000) Total 12,718,000 (1,412,000) 11,865,000 (1,318,000)
Temporary Service
(Nonannual Salaried) Holiday/Overtime Pay
Program Amount Change Amount ChangeAdministration 226,000 (25,000) 101,000 (11,000)Child Well Being Program 0 0 0 0 Employment and Economic Support
Program 0 0 77,000 (8,000)Information Technology Program 0 0 0 0 Legal Affairs 0 0 414,000 (46,000)Specialized Services Program 0 0 35,000 (4,000) Total 226,000 (25,000) 627,000 (69,000)

TEMPORARY AND DISABILITY ASSISTANCE
129
STATE OPERATIONS - GENERAL FUND SUMMARY OF NONPERSONAL SERVICE AND MAINTENANCE UNDISTRIBUTED
APPROPRIATIONS AND CHANGES 2011-12 RECOMMENDED
(dollars) Total Supplies and Materials Program Amount Change Amount ChangeAdministration 8,906,000 (990,000) 99,000 (11,000)Child Well Being Program 1,890,000 (210,000) 0 0 Employment and Economic Support
Program 2,585,000 (288,000) 16,000 (2,000)Information Technology Program 26,364,000 (2,931,000) 52,000 14,000 Legal Affairs 4,014,000 (445,000) 113,000 (12,000)Specialized Services Program 327,000 (36,000) 11,000 (1,000) Total 44,086,000 (4,900,000) 291,000 (12,000) Travel Contractual Services Program Amount Change Amount ChangeAdministration 261,000 (29,000) 8,231,000 (915,000)Child Well Being Program 0 0 1,890,000 (210,000)Employment and Economic Support
Program 77,000 (9,000) 2,474,000 (275,000)Information Technology Program 42,000 5,000 25,244,000 18,646,000 Legal Affairs 167,000 (18,000) 3,428,000 (381,000)Specialized Services Program 95,000 (10,000) 213,000 (24,000) Total 642,000 (61,000) 41,480,000 16,841,000 Equipment Maintenance Undistributed Program Amount Change Amount ChangeAdministration 315,000 (35,000) 0 0 Child Well Being Program 0 0 0 0 Employment and Economic Support
Program 18,000 (2,000) 0 0 Information Technology Program 1,026,000 956,000 0 (22,552,000)Legal Affairs 306,000 (34,000) 0 0 Specialized Services Program 8,000 (1,000) 0 0 Total 1,673,000 884,000 0 (22,552,000)
STATE OPERATIONS - OTHER THAN GENERAL FUND
SUMMARY OF APPROPRIATIONS AND CHANGES 2011-12 RECOMMENDED
(dollars) Total Personal Service Program Amount Change Amount ChangeAdministration 46,517,000 (1,120,000) 24,456,000 (611,000)Child Well Being Program 52,424,000 10,879,000 9,599,000 1,011,000 Disability Determinations Program 169,631,000 (4,193,000) 83,000,000 282,000 Employment and Economic Support
Program 26,385,000 (1,994,000) 15,517,000 (2,560,000)Information Technology Program 100,419,000 2,301,000 16,445,000 2,301,000 Legal Affairs 14,034,000 1,514,000 13,534,000 1,014,000 Specialized Services Program 6,078,000 (75,000) 3,562,000 297,000 Total 415,488,000 7,312,000 166,113,000 1,734,000 Nonpersonal Service Maintenance Undistributed Program Amount Change Amount ChangeAdministration 22,061,000 (509,000) 0 0 Child Well Being Program 42,825,000 9,868,000 0 0 Disability Determinations Program 86,631,000 (4,475,000) 0 0 Employment and Economic Support
Program 10,868,000 566,000 0 0 Information Technology Program 83,974,000 0 0 0 Legal Affairs 500,000 500,000 0 0 Specialized Services Program 2,516,000 278,000 0 (650,000) Total 249,375,000 6,228,000 0 (650,000)

TEMPORARY AND DISABILITY ASSISTANCE
130
AID TO LOCALITIES ALL FUNDS FINANCIAL REQUIREMENTS BY FUND TYPE
APPROPRIATIONS (dollars)
Fund Type Available
2010-11Recommended
2011-12 ChangeGeneral Fund 1,249,887,700 1,304,707,000 54,819,300 Special Revenue Funds - Federal 4,143,670,000 3,720,067,000 (423,603,000) Special Revenue Funds - Other 29,900,000 29,900,000 0 Fiduciary Funds 10,000,000 10,000,000 0 Total 5,433,457,700 5,064,674,000 (368,783,700)
AID TO LOCALITIES
ALL FUNDS FINANCIAL REQUIREMENTS BY PROGRAM APPROPRIATIONS
(dollars)
Program Available
2010-11Recommended
2011-12 ChangeChild Well Being Program
General Fund 34,760,000 34,760,000 0 Special Revenue Funds - Federal 146,200,000 110,000,000 (36,200,000)
Employment and Economic Support Program General Fund 1,096,952,000 1,161,652,000 64,700,000 Special Revenue Funds - Federal 3,961,970,000 3,574,567,000 (387,403,000) Special Revenue Funds - Other 20,000,000 20,000,000 0 Fiduciary Funds 10,000,000 10,000,000 0
Specialized Services Program General Fund 118,175,700 108,295,000 (9,880,700) Special Revenue Funds - Federal 35,500,000 35,500,000 0 Special Revenue Funds - Other 9,900,000 9,900,000 0
Total 5,433,457,700 5,064,674,000 (368,783,700)
CAPITAL PROJECTS
ALL FUNDS FINANCIAL REQUIREMENTS BY PROGRAM APPROPRIATIONS
(dollars)
Comprehensive Construction Program Available
2010-11Recommended
2011-12 Change Reappropriations
2011-12Supported Housing Program
Housing Program Fund 30,000,000 30,000,000 0 104,851,000 Total 30,000,000 30,000,000 0 104,851,000

131
DEPARTMENT OF FINANCIAL REGULATION MISSION The new Department of Financial Regulation (DFR) harnesses the regulatory powers and expertise of the Banking and Insurance Departments, as well as the Consumer Protection Board, to make the State’s oversight of financial services responsive to the 21st century needs of the industry and its consumers. This new State agency, created pursuant to legislation submitted as part of the 2011-12 Executive Budget, consolidates the functions, operations and staff of the Banking and Insurance Departments, along with related segments of the Consumer Protection Board, into a single State agency. Consolidation of these agencies and activities within a single agency platform will afford the State the ability to unify the State’s regulation of financial services and to more rapidly and adroitly respond to changing market practices and consumer preferences, thereby ensuring the industry’s continued integrity while shielding consumers from abuses. In addition to enhancing and refining the State’s regulatory oversight of the industry, the consolidation will provide the State with the opportunity to reduce overall spending by rightsizing the new agency’s administrative and overhead activities in order to ensure that available State moneys are more effectively focused upon DFR’s core regulatory mission. ORGANIZATION AND STAFFING The Superintendent of the Department of Financial Regulation will be appointed by the Governor, with the consent of the Senate. The Department’s main offices will be located in Albany and New York City with smaller offices located throughout the State. The Department’s activities will be carried out through three programs: Administration, Regulation and Consumer Protection. BUDGET HIGHLIGHTS The Executive Budget recommends $564 million in Special Revenue Funds for the Department of Financial Regulation, reflecting a net increase of approximately $6.4 million (1.1 percent) over the combined 2010-11 budgets of Banking and Insurance (because of the manner in which the Consumer Protection Board will be merged into the new Department, there is no comparable 2010-11 budget figure). This increase reflects annualized adjustments related to personal service costs, accommodates expenditures necessary to effectuate full consolidation of the two departments, and provides additional resources that will allow the Department to perform more onsite examinations of insurance companies. Increasing onsite examinations will result in savings to the insurance industry by reducing costly direct-pay examinations for which insurers contract with outside vendors to fulfill regulatory requirements. The Department of Financial Regulation’s operations will be primarily funded through assessments charged to regulated insurance and banking institutions and organizations. The remainder of the Department’s operating budget will be derived from various fees, such as those paid by entities applying for licensure or charter. Of the recommended $564 million, the Department’s operating budget totals $550 million and the remaining $14 million is an appropriation to support the State Transmitter of Money Insurance Fund, which protects moneys that New Yorkers electronically transfer via commercial third parties.
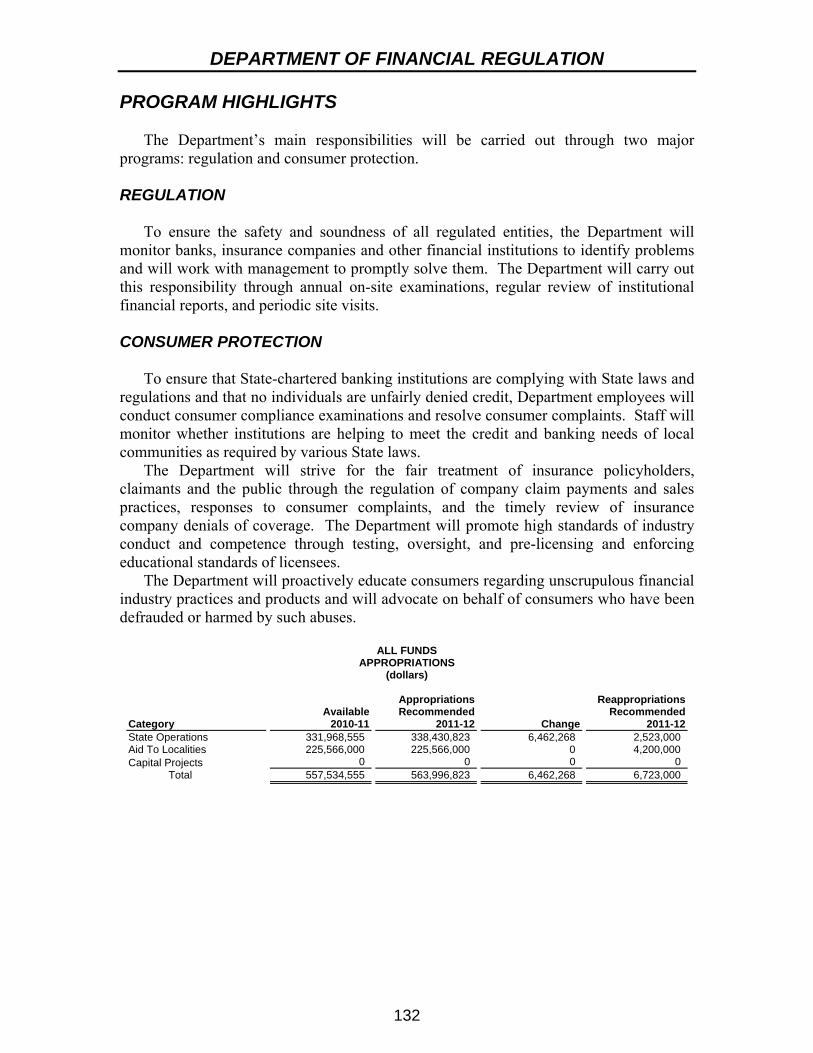
DEPARTMENT OF FINANCIAL REGULATION
132
PROGRAM HIGHLIGHTS The Department’s main responsibilities will be carried out through two major programs: regulation and consumer protection. REGULATION To ensure the safety and soundness of all regulated entities, the Department will monitor banks, insurance companies and other financial institutions to identify problems and will work with management to promptly solve them. The Department will carry out this responsibility through annual on-site examinations, regular review of institutional financial reports, and periodic site visits. CONSUMER PROTECTION To ensure that State-chartered banking institutions are complying with State laws and regulations and that no individuals are unfairly denied credit, Department employees will conduct consumer compliance examinations and resolve consumer complaints. Staff will monitor whether institutions are helping to meet the credit and banking needs of local communities as required by various State laws. The Department will strive for the fair treatment of insurance policyholders, claimants and the public through the regulation of company claim payments and sales practices, responses to consumer complaints, and the timely review of insurance company denials of coverage. The Department will promote high standards of industry conduct and competence through testing, oversight, and pre-licensing and enforcing educational standards of licensees. The Department will proactively educate consumers regarding unscrupulous financial industry practices and products and will advocate on behalf of consumers who have been defrauded or harmed by such abuses.
ALL FUNDS APPROPRIATIONS
(dollars)
Category Available
2010-11
AppropriationsRecommended
2011-12 Change
ReappropriationsRecommended
2011-12State Operations 331,968,555 338,430,823 6,462,268 2,523,000 Aid To Localities 225,566,000 225,566,000 0 4,200,000 Capital Projects 0 0 0 0 Total 557,534,555 563,996,823 6,462,268 6,723,000

DEPARTMENT OF FINANCIAL REGULATION
133
ALL FUND TYPES PROJECTED LEVELS OF EMPLOYMENT BY PROGRAM
FILLED ANNUAL SALARIED POSITIONS Full-Time Equivalent Positions (FTE)
Program
2010-11Estimated FTEs
03/31/11
2011-12Estimated FTEs
03/31/12 FTE ChangeAdministration
Special Revenue Funds - Other 0 186 186 Consumer Protection
Special Revenue Funds - Other 0 198 198 Regulation
Special Revenue Funds - Other 0 1,154 1,154 Total 0 1,538 1,538
The above table does not reflect layoffs that may be necessary in the absence of negotiated workforce savings.
STATE OPERATIONS
ALL FUNDS FINANCIAL REQUIREMENTS BY FUND TYPE APPROPRIATIONS
(dollars)
Fund Type Available
2010-11Recommended
2011-12 ChangeGeneral Fund 150,000 0 (150,000) Special Revenue Funds - Federal 1,000,000 0 (1,000,000) Special Revenue Funds - Other 330,818,555 338,430,823 7,612,268 Total 331,968,555 338,430,823 6,462,268 Adjustments: Transfer(s) From
Banking Department Special Revenue Funds - Federal (1,000,000) Special Revenue Funds - Other (105,194,000)
Insurance Department General Fund (150,000) Special Revenue Funds - Other (225,624,555)
Appropriated 2010-11 0
STATE OPERATIONS ALL FUNDS FINANCIAL REQUIREMENTS BY PROGRAM
APPROPRIATIONS (dollars)
Program Available
2010-11Recommended
2011-12 ChangeAdministration
Special Revenue Funds - Other 41,329,176 42,063,146 733,970 Consumer Protection
Special Revenue Funds - Other 19,059,984 20,840,607 1,780,623 Regulation
General Fund 150,000 0 (150,000) Special Revenue Funds - Federal 1,000,000 0 (1,000,000) Special Revenue Funds - Other 270,429,395 275,527,070 5,097,675
Total 331,968,555 338,430,823 6,462,268
STATE OPERATIONS - GENERAL FUND
SUMMARY OF PERSONAL SERVICE APPROPRIATIONS AND CHANGES 2011-12 RECOMMENDED
(dollars)
Total Personal Service Regular
(Annual Salaried) Program Amount Change Amount ChangeRegulation 0 (120,000) 0 (120,000) Total 0 (120,000) 0 (120,000)

DEPARTMENT OF FINANCIAL REGULATION
134
STATE OPERATIONS - GENERAL FUND SUMMARY OF NONPERSONAL SERVICE AND MAINTENANCE UNDISTRIBUTED
APPROPRIATIONS AND CHANGES 2011-12 RECOMMENDED
(dollars) Total Contractual Services Program Amount Change Amount ChangeRegulation 0 (30,000) 0 (30,000) Total 0 (30,000) 0 (30,000)
STATE OPERATIONS - OTHER THAN GENERAL FUND
SUMMARY OF APPROPRIATIONS AND CHANGES 2011-12 RECOMMENDED
(dollars) Total Personal Service Program Amount Change Amount ChangeAdministration 42,063,146 733,970 17,077,151 421,578 Consumer Protection 20,840,607 1,780,623 13,215,287 1,498,237 Regulation 275,527,070 4,097,675 132,177,590 35,020,342 Total 338,430,823 6,612,268 162,470,028 36,940,157 Nonpersonal Service Maintenance Undistributed Program Amount Change Amount ChangeAdministration 24,985,995 312,392 0 0 Consumer Protection 7,625,320 282,386 0 0 Regulation 143,349,480 50,261,375 0 (81,184,042) Total 175,960,795 50,856,153 0 (81,184,042)
AID TO LOCALITIES
ALL FUNDS FINANCIAL REQUIREMENTS BY FUND TYPE APPROPRIATIONS
(dollars)
Fund Type Available
2010-11Recommended
2011-12 ChangeSpecial Revenue Funds - Other 225,566,000 225,566,000 0 Total 225,566,000 225,566,000 0 Adjustments: Transfer(s) From
Banking Department Special Revenue Funds - Other (850,000)
Insurance Department Special Revenue Funds - Other (224,716,000)
Appropriated 2010-11 0
AID TO LOCALITIES ALL FUNDS FINANCIAL REQUIREMENTS BY PROGRAM
APPROPRIATIONS (dollars)
Program Available
2010-11Recommended
2011-12 ChangeAdministration
Special Revenue Funds - Other 850,000 850,000 0 Regulation
Special Revenue Funds - Other 224,716,000 224,716,000 0 Total 225,566,000 225,566,000 0

135
OFFICE OF GENERAL SERVICES MISSION The mission of the Office of General Services (OGS) is to manage and lease real property, design and build facilities, contract for goods and services, and deliver a wide array of essential support services. In its effort to support cost-effective operations and responsible public stewardship, the Office seeks to provide State agencies, local governments and nonprofit organizations with innovative solutions, integrated service, and best values. As OGS influences the spending of approximately $6 billion in public funds, the Office continually strives to increase efficiencies and improve service. ORGANIZATION AND STAFFING OGS is headed by a Commissioner, who is appointed by the Governor subject to Senate confirmation. The agency is organized into four major business units: Real Property Management and Development; Design and Construction; Procurement Services; and Administration. These units are under the direction of an Executive group which includes the Commissioner’s Office, Public Information, Legal Services, Organizational Effectiveness, and Internal Audit. BUDGET HIGHLIGHTS The 2011-12 Executive Budget recommends $546.2 million in All Funds spending ($128.9 million General Fund; $300.7 million Internal Service Fund; $84 million Capital Projects; and $32.6 million Other Funds) to support ongoing agency activities. This is a decrease of $31.4 million (-5.4 percent) All Funds ($14.3 million General Fund; $14 million Capital Projects; and $3.1 million Other Funds) from the 2010-11 Enacted Budget. The Executive Budget reduces each agency’s General Fund State Operations budget by 10 percent. These savings are intended to be achieved through administrative efficiencies in non-personal service and negotiated workforce savings that minimize layoffs to the extent possible. PROGRAM HIGHLIGHTS EXECUTIVE DIRECTION This program provides the day-to-day management of the Office, assists State agencies with acquisition of vehicle insurance, administers financing for the State equipment purchasing program, coordinates the centralized purchase of electricity from the Power Authority of the State of New York, manages a donated foods program for local school districts and food pantries, and provides administrative services to several other State agencies. REAL PROPERTY MANAGEMENT AND DEVELOPMENT This program is responsible for the safe and efficient operation of approximately 53 major and 79 ancillary State-owned and operated buildings. Services provided by this program include building management, operation, maintenance, cleaning, security, and renovation projects for facilities encompassing approximately 20.8 million interior gross
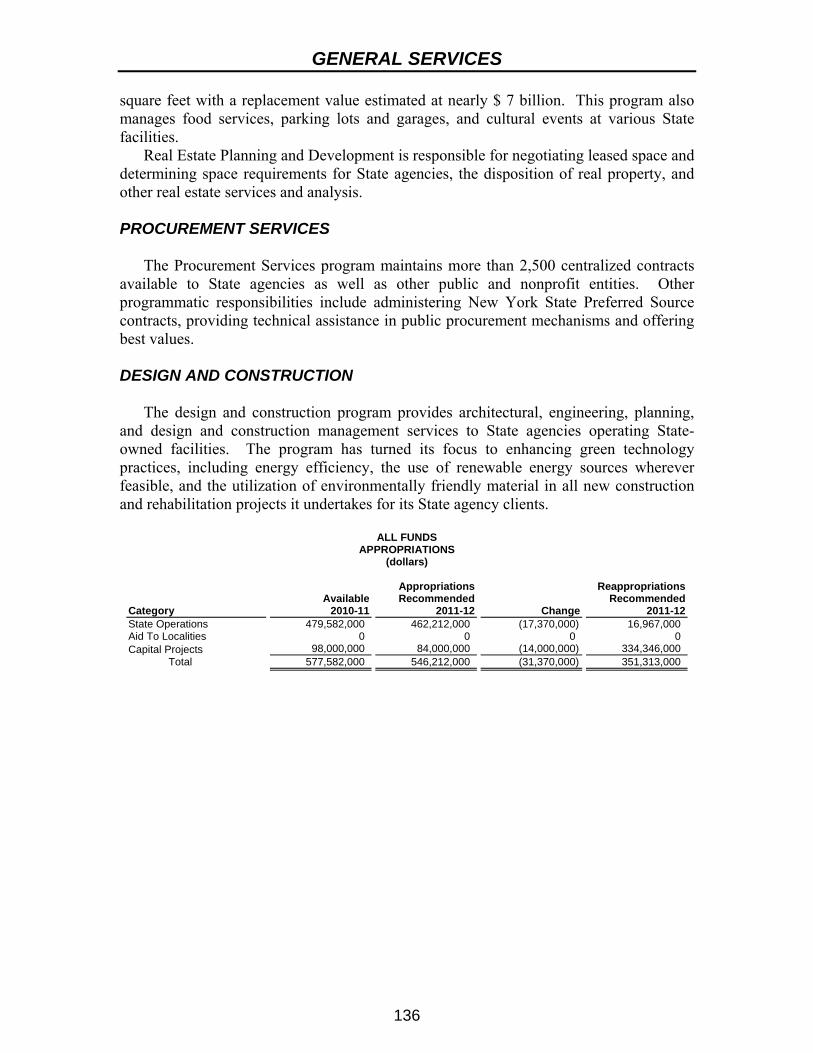
GENERAL SERVICES
136
square feet with a replacement value estimated at nearly $ 7 billion. This program also manages food services, parking lots and garages, and cultural events at various State facilities. Real Estate Planning and Development is responsible for negotiating leased space and determining space requirements for State agencies, the disposition of real property, and other real estate services and analysis. PROCUREMENT SERVICES The Procurement Services program maintains more than 2,500 centralized contracts available to State agencies as well as other public and nonprofit entities. Other programmatic responsibilities include administering New York State Preferred Source contracts, providing technical assistance in public procurement mechanisms and offering best values. DESIGN AND CONSTRUCTION The design and construction program provides architectural, engineering, planning, and design and construction management services to State agencies operating State-owned facilities. The program has turned its focus to enhancing green technology practices, including energy efficiency, the use of renewable energy sources wherever feasible, and the utilization of environmentally friendly material in all new construction and rehabilitation projects it undertakes for its State agency clients.
ALL FUNDS APPROPRIATIONS
(dollars)
Category Available
2010-11
AppropriationsRecommended
2011-12 Change
ReappropriationsRecommended
2011-12State Operations 479,582,000 462,212,000 (17,370,000) 16,967,000 Aid To Localities 0 0 0 0 Capital Projects 98,000,000 84,000,000 (14,000,000) 334,346,000 Total 577,582,000 546,212,000 (31,370,000) 351,313,000

GENERAL SERVICES
137
ALL FUND TYPES PROJECTED LEVELS OF EMPLOYMENT BY PROGRAM
FILLED ANNUAL SALARIED POSITIONS Full-Time Equivalent Positions (FTE)
Program
2010-11Estimated FTEs
03/31/11
2011-12Estimated FTEs
03/31/12 FTE ChangeDesign and Construction
Internal Service Funds 384 384 0 Executive Direction
General Fund 89 89 0 Internal Service Funds 21 21 0
Procurement Program General Fund 128 128 0 Special Revenue Funds - Other 14 14 0 Internal Service Funds 42 45 3
Real Property Management and Development General Fund 604 604 0 Special Revenue Funds - Other 50 50 0 Enterprise Funds 10 10 0 Internal Service Funds 29 29 0
Total 1,371 1,374 3
The above table does not reflect layoffs that may be necessary in the absence of negotiated workforce savings.
STATE OPERATIONS
ALL FUNDS FINANCIAL REQUIREMENTS BY FUND TYPE APPROPRIATIONS
(dollars)
Fund Type Available
2010-11Recommended
2011-12 ChangeGeneral Fund 143,172,000 128,912,000 (14,260,000) Special Revenue Funds - Federal 11,340,000 8,230,000 (3,110,000) Special Revenue Funds - Other 21,591,000 21,591,000 0 Enterprise Funds 2,009,000 2,009,000 0 Internal Service Funds 300,720,000 300,720,000 0 Fiduciary Funds 750,000 750,000 0 Total 479,582,000 462,212,000 (17,370,000) Adjustments: Transfer(s) From
Special Pay Bill General Fund (66,000)
Appropriated 2010-11 479,516,000
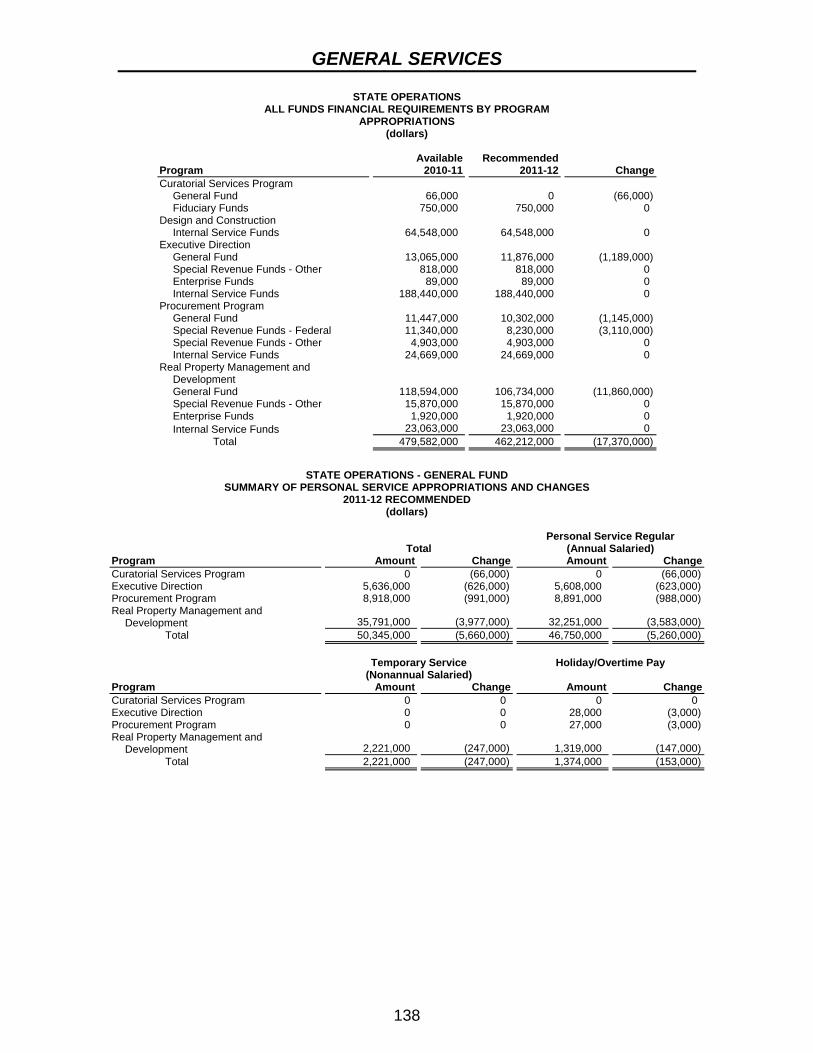
GENERAL SERVICES
138
STATE OPERATIONS ALL FUNDS FINANCIAL REQUIREMENTS BY PROGRAM
APPROPRIATIONS (dollars)
Program Available
2010-11Recommended
2011-12 ChangeCuratorial Services Program
General Fund 66,000 0 (66,000) Fiduciary Funds 750,000 750,000 0
Design and Construction Internal Service Funds 64,548,000 64,548,000 0
Executive Direction General Fund 13,065,000 11,876,000 (1,189,000) Special Revenue Funds - Other 818,000 818,000 0 Enterprise Funds 89,000 89,000 0 Internal Service Funds 188,440,000 188,440,000 0
Procurement Program General Fund 11,447,000 10,302,000 (1,145,000) Special Revenue Funds - Federal 11,340,000 8,230,000 (3,110,000) Special Revenue Funds - Other 4,903,000 4,903,000 0 Internal Service Funds 24,669,000 24,669,000 0
Real Property Management and Development General Fund 118,594,000 106,734,000 (11,860,000) Special Revenue Funds - Other 15,870,000 15,870,000 0 Enterprise Funds 1,920,000 1,920,000 0 Internal Service Funds 23,063,000 23,063,000 0
Total 479,582,000 462,212,000 (17,370,000)
STATE OPERATIONS - GENERAL FUND
SUMMARY OF PERSONAL SERVICE APPROPRIATIONS AND CHANGES 2011-12 RECOMMENDED
(dollars)
Total Personal Service Regular
(Annual Salaried) Program Amount Change Amount ChangeCuratorial Services Program 0 (66,000) 0 (66,000)Executive Direction 5,636,000 (626,000) 5,608,000 (623,000)Procurement Program 8,918,000 (991,000) 8,891,000 (988,000)Real Property Management and
Development 35,791,000 (3,977,000) 32,251,000 (3,583,000) Total 50,345,000 (5,660,000) 46,750,000 (5,260,000)
Temporary Service
(Nonannual Salaried) Holiday/Overtime Pay
Program Amount Change Amount ChangeCuratorial Services Program 0 0 0 0 Executive Direction 0 0 28,000 (3,000)Procurement Program 0 0 27,000 (3,000)Real Property Management and
Development 2,221,000 (247,000) 1,319,000 (147,000) Total 2,221,000 (247,000) 1,374,000 (153,000)

GENERAL SERVICES
139
STATE OPERATIONS - GENERAL FUND SUMMARY OF NONPERSONAL SERVICE AND MAINTENANCE UNDISTRIBUTED
APPROPRIATIONS AND CHANGES 2011-12 RECOMMENDED
(dollars) Total Supplies and Materials Program Amount Change Amount ChangeExecutive Direction 6,240,000 (563,000) 85,000 (9,000)Procurement Program 1,384,000 (154,000) 28,000 (4,000)Real Property Management and
Development 70,943,000 (7,883,000) 6,577,000 (730,000) Total 78,567,000 (8,600,000) 6,690,000 (743,000) Travel Contractual Services Program Amount Change Amount ChangeExecutive Direction 39,000 (4,000) 6,057,000 632,000 Procurement Program 39,000 (4,000) 1,257,000 (140,000)Real Property Management and
Development 109,000 (13,000) 63,768,000 (7,085,000) Total 187,000 (21,000) 71,082,000 (6,593,000) Equipment Maintenance Undistributed Program Amount Change Amount ChangeExecutive Direction 59,000 (7,000) 0 (1,175,000)Procurement Program 60,000 (6,000) 0 0 Real Property Management and
Development 489,000 (55,000) 0 0 Total 608,000 (68,000) 0 (1,175,000)
STATE OPERATIONS - OTHER THAN GENERAL FUND
SUMMARY OF APPROPRIATIONS AND CHANGES 2011-12 RECOMMENDED
(dollars) Total Personal Service Program Amount Change Amount ChangeCuratorial Services Program 750,000 0 0 0 Design and Construction 64,548,000 0 28,628,000 0 Executive Direction 189,347,000 0 2,201,000 0 Procurement Program 37,802,000 (3,110,000) 4,499,000 0 Real Property Management and
Development 40,853,000 0 6,596,000 0 Total 333,300,000 (3,110,000) 41,924,000 0 Nonpersonal Service Maintenance Undistributed Program Amount Change Amount ChangeCuratorial Services Program 750,000 0 0 0 Design and Construction 35,920,000 0 0 0 Executive Direction 187,146,000 90,000,000 0 (90,000,000)Procurement Program 33,303,000 0 0 (3,110,000)Real Property Management and
Development 34,257,000 0 0 0 Total 291,376,000 90,000,000 0 (93,110,000)

GENERAL SERVICES
140
CAPITAL PROJECTS ALL FUNDS FINANCIAL REQUIREMENTS BY PROGRAM
APPROPRIATIONS (dollars)
Comprehensive Construction Program Available
2010-11Recommended
2011-12 Change Reappropriations
2011-12Design and Construction Supervision
Capital Projects Fund 12,766,000 13,166,000 400,000 34,003,000 Maintenance and Improvement of Real Property
Facilities Capital Projects Fund 58,284,000 37,734,000 (20,550,000) 258,201,000 Capital Projects Fund - Advances 0 0 0 856,000 Capital Projects Fund - Authority Bonds 16,000,000 33,100,000 17,100,000 39,286,000
Sustainability Capital Projects Fund - Authority Bonds 10,950,000 0 (10,950,000) 2,000,000
Total 98,000,000 84,000,000 (14,000,000) 334,346,000

141
DEPARTMENT OF HEALTH MISSION The Department of Health ensures that high quality appropriate health services are available to all New York State residents at a reasonable cost. Department functions and responsibilities include:
Promoting and supervising public health activities throughout the State; Ensuring high quality medical care in a sound and cost effective manner for all
residents; Reducing infectious diseases such as food and waterborne illnesses, hepatitis,
HIV, meningitis, sexually transmitted infections, tuberculosis, vaccine-preventable diseases and chronic disabling illnesses such as heart disease, cancer, stroke and respiratory diseases; and
Directing a variety of emergency preparedness initiatives in response to statewide and local epidemic outbreaks. As part of this mission, the Department works with the State’s health care community to ensure appropriate readiness and response to potential public health threats.
The Department of Health is also the principal State agency that interacts with the Federal and local governments, health care providers and program participants for the State’s Medicaid program. In addition, the Office of Health Insurance Programs is responsible for developing and implementing strategies to improve access to health insurance coverage for the uninsured and providing for an integrated approach to oversight and administration of the Medicaid program to strengthen coordination within the Department and among State agencies. ORGANIZATION AND STAFFING Under the direction of the Commissioner, who is appointed by the Governor subject to Senate confirmation, the Department of Health meets its responsibilities through the Office of Health Insurance Programs, the Office of Long Term Care, the centers located in the Office of Public Health, and the Office of Health Systems Management. The Executive Budget centralizes all General Fund State Operations funding within the Administration Program in order to provide greater flexibility for the Commissioner to redesign agency operations. The Office of Health Insurance Programs administers the State’s Medicaid program, which is the largest insurance program in the nation covering 4.8 million people and including the Family Health Plus, Child Health Plus and Elderly Pharmaceutical Insurance Coverage programs, as well as the Health Care Reform Act (HCRA). The Office of Long Term Care oversees the integration of planning and program development, inspection, and quality assurance for services related to long term care. The Office of Public Health, the Office of Health Systems Management, and the Office of Long Term Care are responsible for providing policy and management direction to the Department’s system of regional offices. Department staff located in regional offices conduct health facility surveillance, monitor public health, provide direct services and oversee county health department activities. Additionally, the Department is responsible for five health care facilities that are engaged in patient care: the Helen Hayes Hospital in West Haverstraw, which offers specialty rehabilitation services, and four nursing homes for the care of veterans and their dependents in Oxford, New York City, Batavia and Montrose. In early 1999, responsibility for the operations of the Roswell Park Cancer Institute was transferred to a

HEALTH
142
public benefit corporation, the Roswell Park Cancer Institute Corporation, pursuant to an operating agreement between the Corporation and the Department. This has provided Roswell with the flexibility needed to compete more effectively in a changing health care environment. BUDGET HIGHLIGHTS MEDICAID Despite years of attempts at cost containment, Medicaid spending has continued to grow at an unsustainable rate, while failing to deliver the quality outcomes that New Yorkers deserve. Governor Cuomo is advancing a new and inclusive approach that will bring New Yorkers into the process of developing proposals to provide critical health care services at lower costs. The Executive Budget reflects savings anticipated from the proposals of the Medicaid Redesign Team, established pursuant to Executive Order Number Five. The team’s 27 voting members bring vast experience as health care providers, consumers and industry experts to address the challenges of refocusing our health care system to provide quality care at lower costs. They will conduct a comprehensive review of New York’s Medicaid Program and report their findings and recommendations for cost reductions to the Governor by March 1, 2011 for consideration in the budget negotiation process. The Executive Budget assumes that the Medicaid Redesign Team will identify initiatives to reduce State Funds Medicaid spending by $2.85 billion in 2011-12 and limit Medicaid Program State Funds growth to the 10-year rolling average of the medical care component of the Consumer Price Index. OTHER PUBLIC HEALTH PROGRAMS In 2011-12, General Fund appropriations will finance 18 percent of the Department of Health’s total budget of $5.6 billion, after excluding Medicaid and HCRA program costs. Other revenue sources – including: reimbursement for patient care provided at the Department’s health care facilities; regulatory fees and audit recoveries; management fees for hospital and nursing home construction projects financed through bond proceeds; and registration, testing and certification fees for various public health services – support 30 percent of the Department of Health’s budget, including the Professional Medical Conduct Program, clinical and environmental laboratory certification activities, and health care facilities’ operating costs. The remaining 52 percent is provided by Federal grants. Capital Project appropriations promote the efficient operation of healthcare facilities statewide and preserve and maintain the Department’s hospitals, nursing homes, and the three separate laboratory facilities in Albany County that constitute the Wadsworth Center for Laboratories and Research. The costs of projects at the health care facilities are funded from the General Fund, HCRA and/or facility revenues. Major budget actions include:
Early Intervention: The Executive Budget includes $165 million for the State share of Early Intervention (EI), which provides services to infants and toddlers under the age of three who have developmental delays. Savings are derived from requiring large EI providers to directly bill Medicaid; increasing program reimbursement from commercial insurance; modifying service and service coordination rates; recovering overpayment for Medicaid transportation; revising

HEALTH
143
rates for updated regional cost variations; and applying a 10 percent across-the-board rate cut. These actions generate savings, including Medicaid, of $20.5 million in 2011-12.
General Public Health Work: The Executive Budget includes $319 million for the General Public Health Work (GPHW) Program to reimburse counties for various services. Reimbursement for the General Public Health Work program will be limited to basic services and reimbursement for all optional services will be discontinued. Optional services currently funded include: Medical Examiners, Early Intervention Service Coordination, Dental Services, Home Health Services, Long Term Care, Emergency Medical Services, Other Environmental Services, Radioactive Materials Licensing, Radioactive Equipment Inspection, and Housing Hygiene.
Elderly Pharmaceutical Insurance Coverage (EPIC) Program: The Executive Budget includes $230.5 million for EPIC to serve approximately 298,600 senior citizens. Effective January 1, 2012, EPIC will only provide payment for drugs when an enrollee has entered into the Medicare Part D coverage gap. Additionally, effective July 1, 2011, EPIC enrollees will be responsible for paying their Part D premiums or their full deductible.
Local Competitive Performance Grant Program/Elimination of Dedicated Funding for Various Public Health Programs: The Executive Budget creates a new local competitive performance grant program by reinvesting half of the savings associated with reducing support for various programs including: Audit of Resident Teaching Programs; Brain Trauma Foundation; Cardiac Services; Eating Disorders; Falls Prevention; Health Promotion Initiatives; Infertility Program; Interim Lead Safe Housing; Latino Outreach Program; Long Term Care Community Coalition; Maternal Mortality Review & Safe Motherhood Initiative; Maternity and Early Childhood Foundation; Medicaid Collaborative Studies; Minority Male Wellness; Office of Minority Health; Osteoporosis Prevention; Public Awareness Campaign for Donor Registry Letter; Public Health Genomics; Public Health Management Leaders of Tomorrow; Quality Improvement; Racial Disparities Study; Statewide Health Broadcasts; Sudden Infant Death Syndrome; Tick-Borne Disease; Minority Participation in Medical Education Program – CUNY Gateway Institute; Minority Participation in Medical Education Program – SUNY Upstate Medical; and the Workforce Studies Program as well as the prior year COLA associated with these programs.
Cancer Services Reductions: The Executive Budget reduces funding for non-direct care components of the cancer services program by $0.65 million.
Roswell Park Cancer Institute: The Executive Budget recommends nearly $70 million for the Roswell Park Cancer Institute from HCRA, including anti-tobacco funding of $5.4 million. This represents a 10 percent decrease from the prior year value.
State Operations: The Executive Budget reduces each agency’s General Fund State Operations budget by 10 percent. These savings are intended to be achieved through administrative efficiencies in non-personal service and negotiated workforce savings that minimize layoffs to the extent possible.

HEALTH
144
PROGRAM HIGHLIGHTS MEDICAID Medicaid was established in 1965 by the Federal government as a health insurance program for the poor. In addition to the federally mandated services – inpatient and outpatient hospital care, nursing facility care, physician services, home health care, family planning, and laboratory and x-ray services – New York also provides almost all federally permissible optional services. PUBLIC HEALTH Efforts such as education, research and disease prevention are aimed at improving the health of all New Yorkers. Particular focus is placed on nutrition, prenatal and perinatal care, child health, treatment and control of sexually-transmitted diseases and tuberculosis, childhood immunization, the health risks of environmental contaminants, drinking water purity, cancer education and outreach and follow-up investigations of disease outbreak. In addition, the Department serves as primary liaison with local and county health departments to ensure the quality of public health services throughout New York State. The Wadsworth Center for Laboratories and Research assists the Department in accomplishing its public health mission. Testing programs conducted by the Wadsworth Laboratories address public health concerns such as HIV, tuberculosis, drinking water, environmental contamination and genetic disorders in newborns. The newborn screening program tests for 45 disorders, making New York State a national leader in the area of newborn testing. Ongoing research, largely funded by external grants, is carried out for public health problems such as AIDS, West Nile virus, cancer and the toxic effects of chemical substances and radiation. The Wadsworth Center regulates nearly 700 environmental laboratories and more than 1,800 clinical laboratories and patient service centers to ensure testing quality, and the public’s health and safety. The Department develops and funds HIV prevention and health care programs, educates the public and health care providers, formulates policy and directs regional and statewide HIV/AIDS planning. New York remains a leader in combating this complex epidemic by responding to changes in incidence with even greater attention to population-based programming, long-term care and policies designed to reduce discrimination and guarantee basic medical care and treatment for the uninsured. HEALTH SYSTEMS MANAGEMENT AND LONG TERM CARE The Department ensures that quality health care is available to all New York residents by overseeing the services provided by hospitals, nursing homes, diagnostic and treatment centers and home care providers. The Department strives to ensure that limited health care dollars are prudently spent through its review and monitoring of health facility plans for construction and expansion. Federal reimbursement for surveillance and certification, and fees for overseeing facilities to ensure that bonded debt is repaid, help to offset program costs.

HEALTH
145
HEALTH INSURANCE PROGRAMS The Department is responsible for setting Medicaid reimbursement rates for hospitals, nursing homes, home health agencies and diagnostic and treatment centers, as well as oversight of the HCRA surcharges and assessments, is overseen by the Office of Health Insurance Programs.
ALL FUNDS APPROPRIATIONS
(dollars)
Category Available
2010-11
AppropriationsRecommended
2011-12 Change
ReappropriationsRecommended
2011-12State Operations 2,160,078,287 2,244,123,100 84,044,813 2,549,564,200 Aid To Localities 55,880,582,790 53,885,720,290 (1,994,862,500) 26,378,567,800 Capital Projects 497,783,000 90,433,000 (407,350,000) 1,357,171,000 Total 58,538,444,077 56,220,276,390 (2,318,167,687) 30,285,303,000

HEALTH
146
ALL FUND TYPES PROJECTED LEVELS OF EMPLOYMENT BY PROGRAM
FILLED ANNUAL SALARIED POSITIONS Full-Time Equivalent Positions (FTE)
Program
2010-11Estimated FTEs
03/31/11
2011-12Estimated FTEs
03/31/12 FTE ChangeAdministration Program
General Fund 99 1,914 1,815 Special Revenue Funds - Federal 46 46 0 Special Revenue Funds - Other 209 209 0
AIDS Institute General Fund 144 0 (144)
Child Health Insurance Special Revenue Funds - Other 38 38 0
Community Health General Fund 23 0 (23) Special Revenue Funds - Federal 486 486 0 Special Revenue Funds - Other 108 108 0
Elderly Pharmaceutical Insurance Coverage Special Revenue Funds - Other 26 26 0
Environmental Health General Fund 94 0 (94) Special Revenue Funds - Federal 101 101 0 Special Revenue Funds - Other 66 66 0 Capital Projects Funds - Other 80 80 0
Health Care Financing General Fund 60 0 (60) Special Revenue Funds - Other 61 61 0
Health Insurance Programs, Office of General Fund 346 0 (346) Special Revenue Funds - Federal 56 56 0 Special Revenue Funds - Other 1 1 0
Health Systems Management, Office of General Fund 199 0 (199) Special Revenue Funds - Other 238 238 0
Institution Management Special Revenue Funds - Other 1,510 1,510 0
Long Term Care, Office of General Fund 316 0 (316)
Laboratories and Research General Fund 368 0 (368) Special Revenue Funds - Federal 59 59 0 Special Revenue Funds - Other 193 193 0
Managed Care and Program Evaluation, Division of General Fund 128 0 (128)
Total 5,055 5,192 137
The above table does not reflect layoffs that may be necessary in the absence of negotiated workforce savings.

HEALTH
147
STATE OPERATIONS ALL FUNDS FINANCIAL REQUIREMENTS BY FUND TYPE
APPROPRIATIONS (dollars)
Fund Type Available
2010-11Recommended
2011-12 ChangeGeneral Fund 284,576,500 244,615,000 (39,961,500) Special Revenue Funds - Federal 1,335,200,200 1,480,570,000 145,369,800 Special Revenue Funds - Other 540,291,587 518,938,100 (21,353,487) Enterprise Funds 10,000 0 (10,000) Total 2,160,078,287 2,244,123,100 84,044,813 Adjustments: Transfer(s) From
Special Pay Bill General Fund (247,000) Special Revenue Funds - Other (364,000)
Appropriated 2010-11 2,159,467,287

HEALTH
148
STATE OPERATIONS ALL FUNDS FINANCIAL REQUIREMENTS BY PROGRAM
APPROPRIATIONS (dollars)
Program Available
2010-11Recommended
2011-12 ChangeAdministration Program
General Fund 32,400,200 244,615,000 212,214,800 Special Revenue Funds - Federal 10,338,200 10,670,000 331,800 Special Revenue Funds - Other 31,834,500 31,470,500 (364,000)
AIDS Institute General Fund 16,000,100 0 (16,000,100)
Child Health Insurance Special Revenue Funds - Federal 64,108,000 64,108,000 0 Special Revenue Funds - Other 15,333,400 15,333,400 0
Community Health General Fund 12,120,000 0 (12,120,000) Special Revenue Funds - Federal 154,265,000 153,265,000 (1,000,000) Special Revenue Funds - Other 4,760,000 4,760,000 0
Elderly Pharmaceutical Insurance Coverage Special Revenue Funds - Other 20,378,000 20,378,000 0
Environmental Health General Fund 10,311,900 0 (10,311,900) Special Revenue Funds - Federal 18,184,000 18,184,000 0 Special Revenue Funds - Other 30,783,200 25,574,500 (5,208,700)
Health Care Financing General Fund 8,843,000 0 (8,843,000) Special Revenue Funds - Other 9,501,700 9,501,700 0
Health Insurance Programs, Office of General Fund 85,608,400 0 (85,608,400) Special Revenue Funds - Federal 969,814,000 1,018,914,000 49,100,000 Special Revenue Funds - Other 15,505,400 15,505,400 0
Health Systems Management, Office of General Fund 29,538,700 0 (29,538,700) Special Revenue Funds - Federal 343,000 500,000 157,000 Special Revenue Funds - Other 58,929,500 58,929,500 0
Institution Management Special Revenue Funds - Other 158,118,787 142,338,000 (15,780,787) Enterprise Funds 10,000 0 (10,000)
Long Term Care, Office of General Fund 46,770,700 0 (46,770,700) Special Revenue Funds - Other 9,909,100 9,909,100 0
Laboratories and Research General Fund 43,924,000 0 (43,924,000) Special Revenue Funds - Federal 12,929,000 12,929,000 0 Special Revenue Funds - Other 72,416,000 72,416,000 0
Maintenance Undistributed General Fund (112,822,000) 0 112,822,000 Special Revenue Funds - Other 112,822,000 112,822,000 0
Managed Care and Program Evaluation, Division of General Fund 17,376,500 0 (17,376,500)
Medicaid Management Information System General Fund 94,505,000 0 (94,505,000) Special Revenue Funds - Federal 105,219,000 202,000,000 96,781,000
Total 2,160,078,287 2,244,123,100 84,044,813
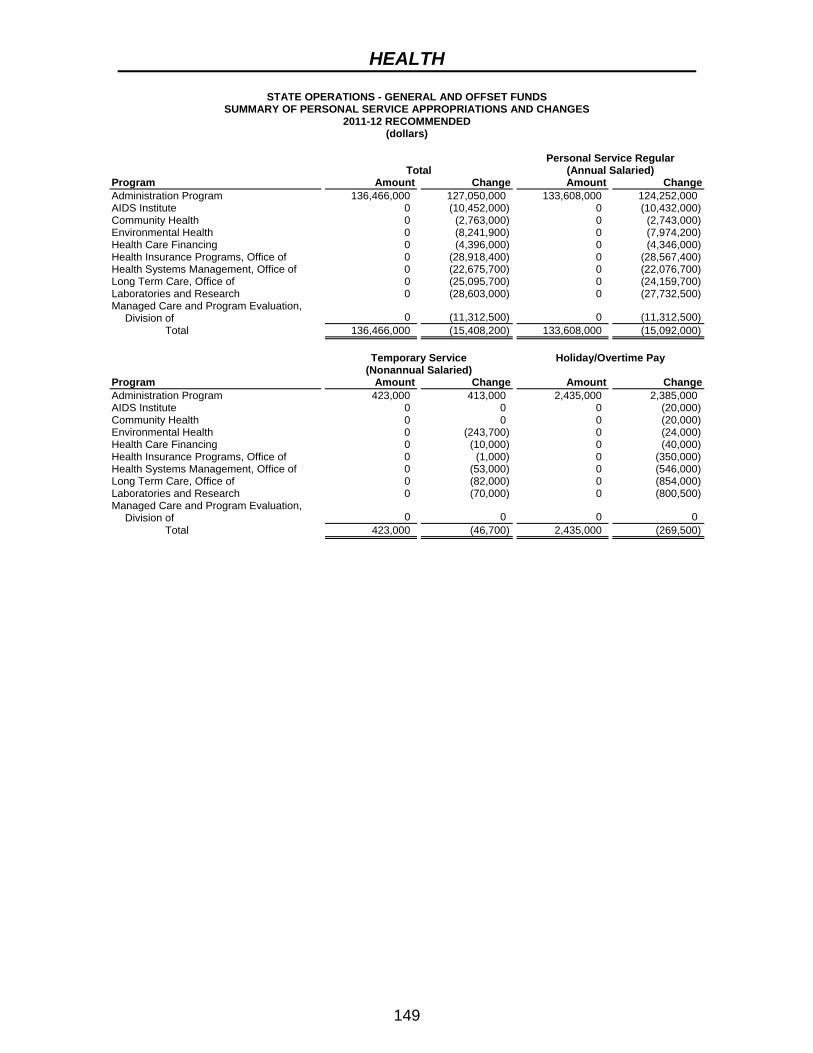
HEALTH
149
STATE OPERATIONS - GENERAL AND OFFSET FUNDS SUMMARY OF PERSONAL SERVICE APPROPRIATIONS AND CHANGES
2011-12 RECOMMENDED (dollars)
Total Personal Service Regular
(Annual Salaried) Program Amount Change Amount ChangeAdministration Program 136,466,000 127,050,000 133,608,000 124,252,000 AIDS Institute 0 (10,452,000) 0 (10,432,000)Community Health 0 (2,763,000) 0 (2,743,000)Environmental Health 0 (8,241,900) 0 (7,974,200)Health Care Financing 0 (4,396,000) 0 (4,346,000)Health Insurance Programs, Office of 0 (28,918,400) 0 (28,567,400)Health Systems Management, Office of 0 (22,675,700) 0 (22,076,700)Long Term Care, Office of 0 (25,095,700) 0 (24,159,700)Laboratories and Research 0 (28,603,000) 0 (27,732,500)Managed Care and Program Evaluation,
Division of 0 (11,312,500) 0 (11,312,500) Total 136,466,000 (15,408,200) 133,608,000 (15,092,000)
Temporary Service
(Nonannual Salaried) Holiday/Overtime Pay
Program Amount Change Amount ChangeAdministration Program 423,000 413,000 2,435,000 2,385,000 AIDS Institute 0 0 0 (20,000)Community Health 0 0 0 (20,000)Environmental Health 0 (243,700) 0 (24,000)Health Care Financing 0 (10,000) 0 (40,000)Health Insurance Programs, Office of 0 (1,000) 0 (350,000)Health Systems Management, Office of 0 (53,000) 0 (546,000)Long Term Care, Office of 0 (82,000) 0 (854,000)Laboratories and Research 0 (70,000) 0 (800,500)Managed Care and Program Evaluation,
Division of 0 0 0 0 Total 423,000 (46,700) 2,435,000 (269,500)

HEALTH
150
STATE OPERATIONS - GENERAL AND OFFSET FUNDS SUMMARY OF NONPERSONAL SERVICE AND MAINTENANCE UNDISTRIBUTED
APPROPRIATIONS AND CHANGES 2011-12 RECOMMENDED
(dollars) Total Supplies and Materials Program Amount Change Amount ChangeAdministration Program 220,971,000 197,986,800 6,653,000 5,575,600 AIDS Institute 0 (5,548,100) 0 (1,333,881)Community Health 0 (9,357,000) 0 (201,000)Environmental Health 0 (2,070,000) 0 (101,000)Health Care Financing 0 (4,447,000) 0 (99,000)Health Insurance Programs, Office of 0 (56,690,000) 0 (536,000)Health Systems Management, Office of 0 (6,863,000) 0 (186,000)Long Term Care, Office of 0 (21,675,000) 0 (350,000)Laboratories and Research 0 (15,321,000) 0 (3,352,000)Managed Care and Program Evaluation,
Division of 0 (6,064,000) 0 (156,000)Medicaid Management Information System 0 (94,505,000) 0 0 Total 220,971,000 (24,553,300) 6,653,000 (739,281) Travel Contractual Services Program Amount Change Amount ChangeAdministration Program 3,222,000 2,815,500 176,175,000 156,053,000 AIDS Institute 0 (311,700) 0 (3,224,000)Community Health 0 (117,000) 0 (8,730,000)Environmental Health 0 (374,400) 0 (1,494,000)Health Care Financing 0 (40,000) 0 (4,258,000)Health Insurance Programs, Office of 0 (823,000) 0 (27,500,000)Health Systems Management, Office of 0 (237,000) 0 (5,966,000)Long Term Care, Office of 0 (1,065,000) 0 (17,845,000)Laboratories and Research 0 (76,000) 0 (6,588,000)Managed Care and Program Evaluation,
Division of 0 (130,000) 0 (5,518,000)Medicaid Management Information System 0 0 0 (94,505,000) Total 3,222,000 (358,600) 176,175,000 (19,575,000) Equipment Maintenance Undistributed Program Amount Change Amount ChangeAdministration Program 7,405,000 6,776,700 27,516,000 26,766,000 AIDS Institute 0 (228,519) 0 (450,000)Community Health 0 (309,000) 0 0 Environmental Health 0 (100,600) 0 0 Health Care Financing 0 (50,000) 0 0 Health Insurance Programs, Office of 0 (831,000) 0 (27,000,000)Health Systems Management, Office of 0 (201,000) 0 (273,000)Long Term Care, Office of 0 (415,000) 0 (2,000,000)Laboratories and Research 0 (5,305,000) 0 0 Managed Care and Program Evaluation,
Division of 0 (160,000) 0 (100,000)Medicaid Management Information System 0 0 0 0 Total 7,405,000 (823,419) 27,516,000 (3,057,000)
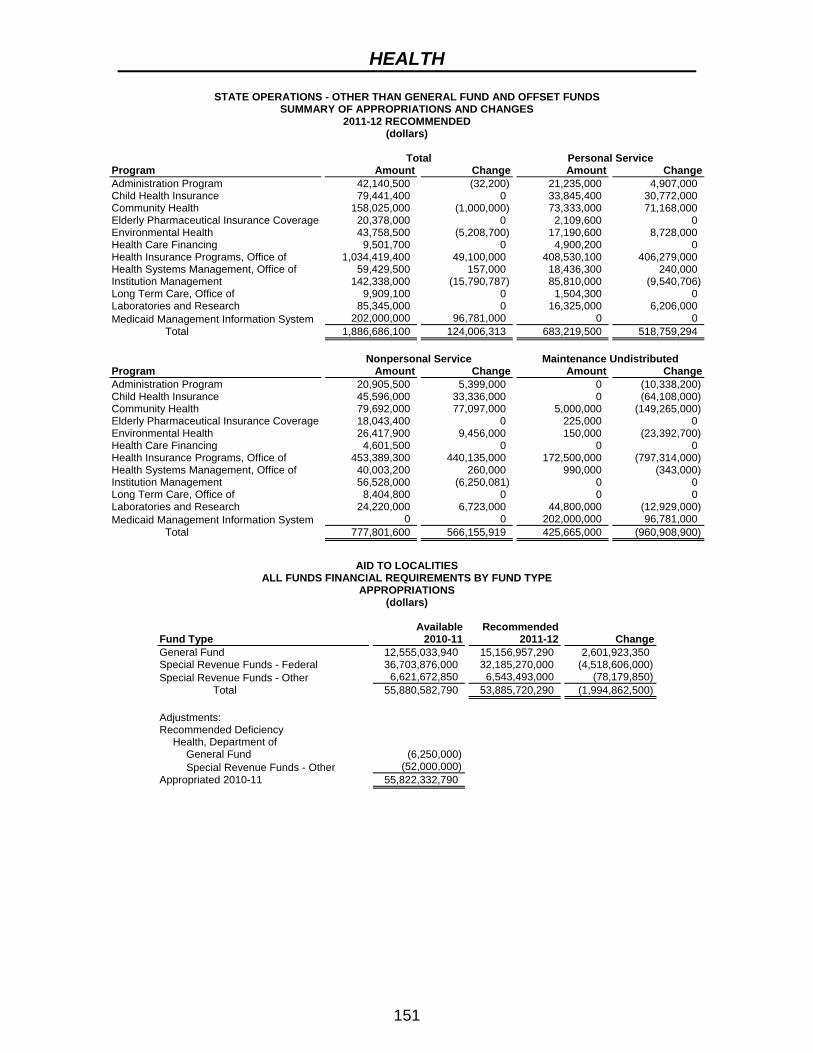
HEALTH
151
STATE OPERATIONS - OTHER THAN GENERAL FUND AND OFFSET FUNDS SUMMARY OF APPROPRIATIONS AND CHANGES
2011-12 RECOMMENDED (dollars)
Total Personal Service Program Amount Change Amount ChangeAdministration Program 42,140,500 (32,200) 21,235,000 4,907,000 Child Health Insurance 79,441,400 0 33,845,400 30,772,000 Community Health 158,025,000 (1,000,000) 73,333,000 71,168,000 Elderly Pharmaceutical Insurance Coverage 20,378,000 0 2,109,600 0 Environmental Health 43,758,500 (5,208,700) 17,190,600 8,728,000 Health Care Financing 9,501,700 0 4,900,200 0 Health Insurance Programs, Office of 1,034,419,400 49,100,000 408,530,100 406,279,000 Health Systems Management, Office of 59,429,500 157,000 18,436,300 240,000 Institution Management 142,338,000 (15,790,787) 85,810,000 (9,540,706)Long Term Care, Office of 9,909,100 0 1,504,300 0 Laboratories and Research 85,345,000 0 16,325,000 6,206,000 Medicaid Management Information System 202,000,000 96,781,000 0 0 Total 1,886,686,100 124,006,313 683,219,500 518,759,294 Nonpersonal Service Maintenance Undistributed Program Amount Change Amount ChangeAdministration Program 20,905,500 5,399,000 0 (10,338,200)Child Health Insurance 45,596,000 33,336,000 0 (64,108,000)Community Health 79,692,000 77,097,000 5,000,000 (149,265,000)Elderly Pharmaceutical Insurance Coverage 18,043,400 0 225,000 0 Environmental Health 26,417,900 9,456,000 150,000 (23,392,700)Health Care Financing 4,601,500 0 0 0 Health Insurance Programs, Office of 453,389,300 440,135,000 172,500,000 (797,314,000)Health Systems Management, Office of 40,003,200 260,000 990,000 (343,000)Institution Management 56,528,000 (6,250,081) 0 0 Long Term Care, Office of 8,404,800 0 0 0 Laboratories and Research 24,220,000 6,723,000 44,800,000 (12,929,000)Medicaid Management Information System 0 0 202,000,000 96,781,000 Total 777,801,600 566,155,919 425,665,000 (960,908,900)
AID TO LOCALITIES
ALL FUNDS FINANCIAL REQUIREMENTS BY FUND TYPE APPROPRIATIONS
(dollars)
Fund Type Available
2010-11Recommended
2011-12 ChangeGeneral Fund 12,555,033,940 15,156,957,290 2,601,923,350 Special Revenue Funds - Federal 36,703,876,000 32,185,270,000 (4,518,606,000) Special Revenue Funds - Other 6,621,672,850 6,543,493,000 (78,179,850) Total 55,880,582,790 53,885,720,290 (1,994,862,500) Adjustments: Recommended Deficiency
Health, Department of General Fund (6,250,000) Special Revenue Funds - Other (52,000,000)
Appropriated 2010-11 55,822,332,790

HEALTH
152
AID TO LOCALITIES ALL FUNDS FINANCIAL REQUIREMENTS BY PROGRAM
APPROPRIATIONS (dollars)
Program Available
2010-11Recommended
2011-12 ChangeAdministration Program
General Fund 561,000 0 (561,000) AIDS Institute
General Fund 23,651,850 23,651,850 0 Special Revenue Funds - Other 143,550,850 75,016,000 (68,534,850)*
Child Health Insurance Special Revenue Funds - Federal 514,600,000 514,600,000 0 Special Revenue Funds - Other 475,600,000 473,554,000 (2,046,000)
Community Health General Fund 671,434,490 690,819,840 19,385,350 Special Revenue Funds - Federal 900,856,000 893,417,000 (7,439,000)*Special Revenue Funds - Other 129,707,600 71,719,600 (57,988,000)*
Elderly Pharmaceutical Insurance Coverage Special Revenue Funds - Other 380,350,000 210,090,000 (170,260,000)
Environmental Health General Fund 12,296,600 12,296,600 0 Special Revenue Funds - Federal 3,687,000 3,687,000 0
Health Care Financing General Fund 951,000 300,000 (651,000)
Health Care Reform Act Program Special Revenue Funds - Other 836,672,000 466,776,000 (369,896,000)*
Health Insurance Programs, Office of General Fund 1,391,200 0 (1,391,200) Special Revenue Funds - Other 300,000,000 300,000,000 0
Health Systems Management, Office of General Fund 14,458,500 11,973,700 (2,484,800) Special Revenue Funds - Federal 400,000 400,000 0
Long Term Care, Office of General Fund 25,234,300 24,865,300 (369,000) Special Revenue Funds - Other 8,623,400 8,623,400 0
Laboratories and Research General Fund 871,000 871,000 0 Special Revenue Funds - Federal 3,682,000 3,682,000 0
Maintenance Undistributed General Fund (7,288,000) (7,288,000) 0 Special Revenue Funds - Other 7,288,000 7,288,000 0
Medical Assistance General Fund 11,160,222,000 13,725,717,000 2,565,495,000 Special Revenue Funds - Federal 34,629,401,000 30,095,734,000 (4,533,667,000) Special Revenue Funds - Other 4,339,881,000 4,930,426,000 590,545,000
Medical Assistance Administration General Fund 651,250,000 673,750,000 22,500,000 Special Revenue Funds - Federal 651,250,000 673,750,000 22,500,000
Total 55,880,582,790 53,885,720,290 (1,994,862,500)
*Includes additional appropriations authorized in the 2010-11 emergency bills and not rescinded in the enacted budget.

HEALTH
153
CAPITAL PROJECTS ALL FUNDS FINANCIAL REQUIREMENTS BY PROGRAM
APPROPRIATIONS (dollars)
Comprehensive Construction Program Available
2010-11Recommended
2011-12 Change Reappropriations
2011-12Health Care Efficiency and Affordability Law for New
Yorkers Capital Projects Fund 217,000,000 0 (217,000,000) 609,468,000 Capital Projects Fund - Advances 108,000,000 0 (108,000,000) 457,905,000
Laboratories and Research Capital Projects Fund 8,000,000 8,000,000 0 31,875,000 Capital Projects Fund - Authority Bonds 0 0 0 5,000,000
Maintenance and Improvements of Existing Institutions Capital Projects Fund 7,600,000 7,600,000 0 25,296,000
Water Resources Federal Capital Projects Fund 157,183,000 74,833,000 (82,350,000) 198,662,000 Federal Stimulus 0 0 0 28,965,000
Total 497,783,000 90,433,000 (407,350,000) 1,357,171,000
154
OFFICE OF THE MEDICAID INSPECTOR GENERAL
MISSION The Office of the Medicaid Inspector General (OMIG) was statutorily established in 2006 as an independent entity within the Department of Health to improve and preserve the integrity of the Medicaid program by conducting and coordinating fraud, waste and abuse control activities for all State agencies responsible for services funded by Medicaid. In carrying out its mission, the Office conducts and supervises all prevention, detection, audit and investigation efforts and coordinates such activities with the Department of Health, and the Office of Mental Health, Office of Mental Retardation and Developmental Disabilities and Office of Alcoholism and Substance Abuse Services. In addition, the Medicaid Inspector General works closely with the Attorney General’s Medicaid Fraud and Control Unit (MFCU) and Federal and local law enforcement agencies. ORGANIZATION AND STAFFING The Office is headed by the Medicaid Inspector General who is appointed by the Governor with the advice and consent of the Senate. The Office of the Medicaid Inspector General is headquartered in Albany with six regional field offices located throughout the state – in Buffalo, Hauppauge (Long Island), Rochester, Syracuse, White Plains and New York City. The Office is organized into six bureaus – Information Technology and Fraud Detection Systems, Investigations and Enforcement, Medicaid Audit, Revenue Initiatives, Administration, and Office of the Counsel. BUDGET HIGHLIGHTS The 2011-12 Executive Budget recommends $80.4 million All Funds ($29.6 million General Fund, $50.8 million Other Funds) to support the operations of the Office of the Medicaid Inspector General. This is a decrease of $7.8 million, or -8.9 percent, from the 2010-11 budget ($3.7 million General Fund, $4.1 million Other Funds). These savings are intended to be achieved through administrative efficiencies in non-personal service and negotiated workforce savings that minimize layoffs to the extent possible. PROGRAM HIGHLIGHTS The Medicaid program was established by the Federal government in 1965 as a health insurance program for the poor. Medicaid provides coverage to nearly 4.7 million New Yorkers. The Department of Health now processes more than 400 million Medicaid claims annually to approximately 60,000 active health care providers offering a wide range of services including nursing facility care, inpatient and outpatient hospital care, home health care, physician services, pharmaceuticals, and other services. OMIG pursues civil and administrative enforcement actions against individuals or entities that engage in fraud, abuse, illegal or inappropriate acts or unacceptable practices within the Medicaid program, including by not limited to: referral of information and evidence to

MEDICAID INSPECTOR GENERAL
155
regulatory agencies, withholding Medicaid payments, imposition of administrative sanctions and penalties, excluding providers and contractors from participation, initiating and maintaining actions for civil recovery, and recovery of Medicaid funds.
ALL FUNDS APPROPRIATIONS
(dollars)
Category Available
2010-11
AppropriationsRecommended
2011-12 Change
ReappropriationsRecommended
2011-12State Operations 88,161,000 80,353,000 (7,808,000) 47,846,000 Aid To Localities 0 0 0 0 Capital Projects 0 0 0 0 Total 88,161,000 80,353,000 (7,808,000) 47,846,000
ALL FUND TYPES
PROJECTED LEVELS OF EMPLOYMENT BY PROGRAM FILLED ANNUAL SALARIED POSITIONS
Full-Time Equivalent Positions (FTE)
Program
2010-11Estimated FTEs
03/31/11
2011-12Estimated FTEs
03/31/12 FTE ChangeMedicaid Audit and Fraud Prevention
General Fund 330 331 1 Special Revenue Funds - Federal 329 331 2 Special Revenue Funds - Other 3 0 (3)
Total 662 662 0
The above table does not reflect layoffs that may be necessary in the absence of negotiated workforce savings.
STATE OPERATIONS
ALL FUNDS FINANCIAL REQUIREMENTS BY FUND TYPE APPROPRIATIONS
(dollars)
Fund Type Available
2010-11Recommended
2011-12 ChangeGeneral Fund 33,274,000 29,577,000 (3,697,000) Special Revenue Funds - Federal 50,804,000 47,076,000 (3,728,000) Special Revenue Funds - Other 4,083,000 3,700,000 (383,000) Total 88,161,000 80,353,000 (7,808,000)
STATE OPERATIONS
ALL FUNDS FINANCIAL REQUIREMENTS BY PROGRAM APPROPRIATIONS
(dollars)
Program Available
2010-11Recommended
2011-12 ChangeMedicaid Audit and Fraud Prevention
General Fund 36,974,000 29,577,000 (7,397,000) Special Revenue Funds - Federal 50,804,000 47,076,000 (3,728,000) Special Revenue Funds - Other 383,000 0 (383,000)
Maintenance Undistributed General Fund (3,700,000) 0 3,700,000 Special Revenue Funds - Other 3,700,000 3,700,000 0
Total 88,161,000 80,353,000 (7,808,000)

MEDICAID INSPECTOR GENERAL
156
STATE OPERATIONS - GENERAL AND OFFSET FUNDS SUMMARY OF PERSONAL SERVICE APPROPRIATIONS AND CHANGES
2011-12 RECOMMENDED (dollars)
Total Personal Service Regular
(Annual Salaried) Program Amount Change Amount ChangeMedicaid Audit and Fraud Prevention 21,136,000 (2,348,000) 21,007,000 (2,334,000) Total 21,136,000 (2,348,000) 21,007,000 (2,334,000)
Temporary Service
(Nonannual Salaried) Holiday/Overtime Pay
Program Amount Change Amount ChangeMedicaid Audit and Fraud Prevention 21,000 (2,000) 108,000 (12,000) Total 21,000 (2,000) 108,000 (12,000)
STATE OPERATIONS - GENERAL AND OFFSET FUNDS
SUMMARY OF NONPERSONAL SERVICE AND MAINTENANCE UNDISTRIBUTED APPROPRIATIONS AND CHANGES
2011-12 RECOMMENDED (dollars)
Total Supplies and Materials Program Amount Change Amount ChangeMedicaid Audit and Fraud Prevention 12,141,000 (1,349,000) 783,000 (87,000) Total 12,141,000 (1,349,000) 783,000 (87,000) Travel Contractual Services Program Amount Change Amount ChangeMedicaid Audit and Fraud Prevention 278,000 (31,000) 8,504,000 (445,000) Total 278,000 (31,000) 8,504,000 (445,000) Equipment Maintenance Undistributed Program Amount Change Amount ChangeMedicaid Audit and Fraud Prevention 2,576,000 (286,000) 0 (500,000) Total 2,576,000 (286,000) 0 (500,000)
STATE OPERATIONS - OTHER THAN GENERAL FUND AND OFFSET FUNDS
SUMMARY OF APPROPRIATIONS AND CHANGES 2011-12 RECOMMENDED
(dollars) Total Personal Service Program Amount Change Amount ChangeMedicaid Audit and Fraud Prevention 47,076,000 (4,111,000) 22,403,000 (1,599,000)Maintenance Undistributed 3,700,000 0 0 0 Total 50,776,000 (4,111,000) 22,403,000 (1,599,000) Nonpersonal Service Maintenance Undistributed Program Amount Change Amount ChangeMedicaid Audit and Fraud Prevention 24,673,000 (2,012,000) 0 (500,000)Maintenance Undistributed 0 0 3,700,000 0 Total 24,673,000 (2,012,000) 3,700,000 (500,000)

157
HIGHER EDUCATION SERVICES CORPORATION MISSION The Higher Education Services Corporation (HESC) was established in 1974 to provide centralized processing of student financial aid programs. The Corporation administers the State’s Tuition Assistance Program, the Federal Family Education Loan Program, the New York Higher Education Loan Program (NYHELPs) and other State and Federal aid programs. ORGANIZATION AND STAFFING The Corporation is governed by a 15-member Board of Trustees, ten of whom are appointed by the Governor. The ten gubernatorial appointees include a student representative from an independent institution, a representative of the general public, a college financial aid administrator, a chief executive officer of a degree-granting proprietary institution, two presidents of independent institutions, one chief executive officer of a non-degree proprietary school, two banking representatives and a student in full time attendance at a State University Community College. The remaining five ex-officio members include the Commissioner of Education, the Chancellors of the State University of New York (SUNY) and the City University of New York (CUNY) and student government leaders representing the public university systems. The Corporation’s chief executive officer is the President, who is appointed by the Governor, subject to Senate confirmation. The President’s responsibilities include administrative oversight of key program areas including legal counsel, data processing, operations, grants and scholarships, loans and research. Agency administrative operations are located in Albany. BUDGET HIGHLIGHTS The Executive Budget recommends $1.08 billion All Funds ($960 million General Fund; $117 million Other Funds) in support of the Corporation. This is a net increase of $45.2 million (4.4 percent) (a General Fund increase of $116.4 million, or 13.8 percent, and an Other Funds decrease of $71.2 million, or -37.8 percent) from 2010-11 funding levels. The budget reflects funding to continue the NYHELPs student loan program and increased General Fund spending for TAP resulting from increased enrollment and the discontinuation of Federal American Reinvestment and Recovery Act (ARRA) funding. The Executive Budget includes the following actions:
Maintain Current Formulas for Allocating TAP Awards: The Executive Budget essentially maintains current policies for TAP enacted in 2010-11 in order to reduce projected growth in the program. These policies include continuing the current maximum TAP award for student enrolled in certain two-year degree granting programs, requiring private pension and annuity income not subject to State taxes to be included determining TAP award eligibility, increasing the academic standards for continued TAP award eligibility and others. These measures represent gap closing actions of $44 million in 2011-12.
Extend the McGee Nursing Faculty Scholarship Program and the Nursing Faculty Loan Forgiveness Program: Statutory authorization for the McGee Nursing Faculty Scholarship program and the Nursing Faculty Loan Forgiveness Program expired June 30, 2010. The 2011-12 Executive Budget extends statutory

HIGHER EDUCATION SERVICES
158
authorization for these programs for a period of five years, and provides the funding necessary to pay for prior obligations to individuals who are fulfilling the service requirements associated with the programs. This measure is expected to cost $3.8 million in 2011-12 and $2.4 million annually thereafter.
Extend the Regents Licensed Social Worker Loan Forgiveness Program: Statutory authorization for the Regents Licensed Social Worker Loan Forgiveness Program is set to expire June 30, 2011. The 2011-12 Executive Budget extends statutory authorization enabling this program to continue for a period of five years. This measure is already assumed in the State Financial Plan and has no net impact on planned spending.
Extend the Regents Physician Loan Forgiveness Program: Statutory authorization for the Regents Physician Loan Forgiveness Program expired June 30, 2009. The 2011-12 Executive Budget extends authorization for this program through the 2015-16 school year, and provides necessary funding to pay prior year obligations for individuals who are fulfilling service requirements associated with the program. This measure is expected to cost $3.9 million in 2011-12 and $1.6 million annually thereafter.
Reduce Funding for NYHELPs: The 2011-2012 Executive Budget reduces funding for NYHELPs by $6.0 million.
PROGRAM HIGHLIGHTS STATE OPERATIONS HESC has made it easier for students to secure college loans by allowing them to apply on-line for loans and electronically sign promissory notes. The Corporation will continue to improve its operational efficiency in 2011-12 through increased reliance on technology and streamlined administrative practices. Colleges and lenders are now able to conduct all loan transactions on-line using the Corporation’s “New York State Marketplace,” an internet portal that facilitates choice, competition and transparency for all government and private student loan products by providing students and their families with access to a broad spectrum of lending and guarantee information. In addition to a renewed emphasis on providing comprehensive services to its clientele, the Corporation continues to develop partnerships with other student loan guaranty agencies and the Federal government to reduce costs, improve services and increase responsiveness through shared development efforts. The Corporation will also continue to coordinate the State’s participation in the Federal GEAR-UP program in 2011-12, providing early college preparation and guidance services to low-income individuals. NEW YORK HIGHER EDUCATION LOAN PROGRAM The 2011-12 Executive Budget continues the NYHELPs student loan program, providing students and parents with access to low-cost loans that would otherwise not be available in the private loan market. The Program is a partnership between the State, private lenders and higher education institutions and makes student loans available with interest rates below those of conventional private bank offerings. Eligible students must be New York State residents attending degree-granting postsecondary education

HIGHER EDUCATION SERVICES
159
institutions in the State that are approved to participate in Federal HEA Title IV student aid programs. The Corporation finances and administers the program in tandem with the State of New York Mortgage Agency (SONYMA). FEDERAL LOAN GUARANTEE PROGRAM The traditional cornerstone of the Corporation’s operations has been the administration of the Federal Family Education Loan program (FFEL). Effective July, 1, 2010, Congress eliminated the FFEL Program which will result in a shift of federally guaranteed student loans to the Federal Direct Loan Program. Although HESC will continue to service its existing portfolio of loans originated through FFEL (currently $20 billion), this portfolio and its associated revenue stream will diminish over time as loans are repaid, rehabilitated, consolidated and sold or transferred back to the U.S. Department of Education. In response to this shift in federal policy, HESC is pursuing a partnership with the U.S. Department of Education whereby it would be designated as a servicer for the newly expanded Direct Loan Program. Under the proposed construct, HESC would use its existing resources and expertise in administering FFEL collections and financial literacy and apply it to the Direct Loan Program. If successful, declining revenues associated with administering FFEL loans will be offset with revenues earned from servicing loans through the expanding Federal Direct Loan Program. In addition to supporting HESC’s general operating budget, these revenues also support what would otherwise be General Fund costs for administering the TAP program, as well as partially offset General Fund costs for TAP awards. The Corporation also provides customer services for lenders, schools and students. This includes the distribution of loan information, as well as training and technical assistance related to loan applications and processing. Federal loan activities administered by the Corporation include:
$3.4 billion in new guaranteed loans in 2009-10; Processing of student loans for more than 642,000 borrowers; and Defaulted loan collections of $369 million and defaulted loan purchases of $557
million in 2009-10. FINANCIAL AID PROGRAMS The Corporation’s responsibilities related to the administration of State financial aid programs include processing student applications, determining award amounts, processing and auditing aid payments to students and colleges, conducting reviews of participating institutions, collecting disallowed amounts identified in audits of participating institutions and providing information services to the public, students and schools for the following programs:
Tuition Assistance Program: New York leads the nation in funding for needs-based student financial aid, and $893 million in General Fund support will be provided to both full- and part-time (TAP) recipients in all sectors of higher education, with an additional $16 million from other funding sources in support of tuition assistance;
Scholarships and Fellowships: $48 million will be provided for various scholarships, fellowships, and loan forgiveness programs including the American Airlines Flight 587 Memorial Scholarships, the World Trade Center Memorial Scholarships, Senator Patricia K. McGee Nursing Faculty Scholarships/Nursing

HIGHER EDUCATION SERVICES
160
Faculty Loan Forgiveness Incentive Program and the Regents Licensed Social Worker Loan Forgiveness Program. More than 27,500 recipients are projected to receive aid under the sixteen State and Federal scholarship programs administered by the Corporation.
COLLEGE CHOICE TUITION SAVINGS PROGRAM Enacted in 1997, the College Choice Tuition Savings Program represents a State initiative to encourage families throughout New York to save for the college education of their children or grandchildren. Under this program, families can save for their children’s attendance at accredited public and private colleges in New York or in other states with accompanying tax benefits on contributions made to, and interest earned on, college savings accounts. Jointly administered by the Corporation and the Office of the State Comptroller, the program has been well received by the general public. Since its inception in September 1998, over 652,414 accounts have been opened, with contributions totaling approximately $9.7 billion. New York’s program has received national recognition as one of the top college savings plans in the nation.
ALL FUNDS APPROPRIATIONS
(dollars)
Category Available
2010-11
AppropriationsRecommended
2011-12 Change
ReappropriationsRecommended
2011-12State Operations 120,047,000 104,930,000 (15,117,000) 20,000,000 Aid To Localities 911,566,000 971,893,000 60,327,000 0 Capital Projects 0 0 0 0 Total 1,031,613,000 1,076,823,000 45,210,000 20,000,000
ALL FUND TYPES
PROJECTED LEVELS OF EMPLOYMENT BY PROGRAM FILLED ANNUAL SALARIED POSITIONS
Full-Time Equivalent Positions (FTE)
Program
2010-11Estimated FTEs
03/31/11
2011-12Estimated FTEs
03/31/12 FTE ChangeAdministration
Special Revenue Funds - Other 316 316 0 Guaranteed Loan Programs
Special Revenue Funds - Other 200 200 0 Total 516 516 0
The above table does not reflect layoffs that may be necessary in the absence of negotiated workforce savings.
STATE OPERATIONS
ALL FUNDS FINANCIAL REQUIREMENTS BY FUND TYPE APPROPRIATIONS
(dollars)
Fund Type Available
2010-11Recommended
2011-12 ChangeGeneral Fund 10,000,000 4,037,000 (5,963,000) Special Revenue Funds - Federal 10,000,000 12,601,000 2,601,000 Special Revenue Funds - Other 100,047,000 88,292,000 (11,755,000) Total 120,047,000 104,930,000 (15,117,000)
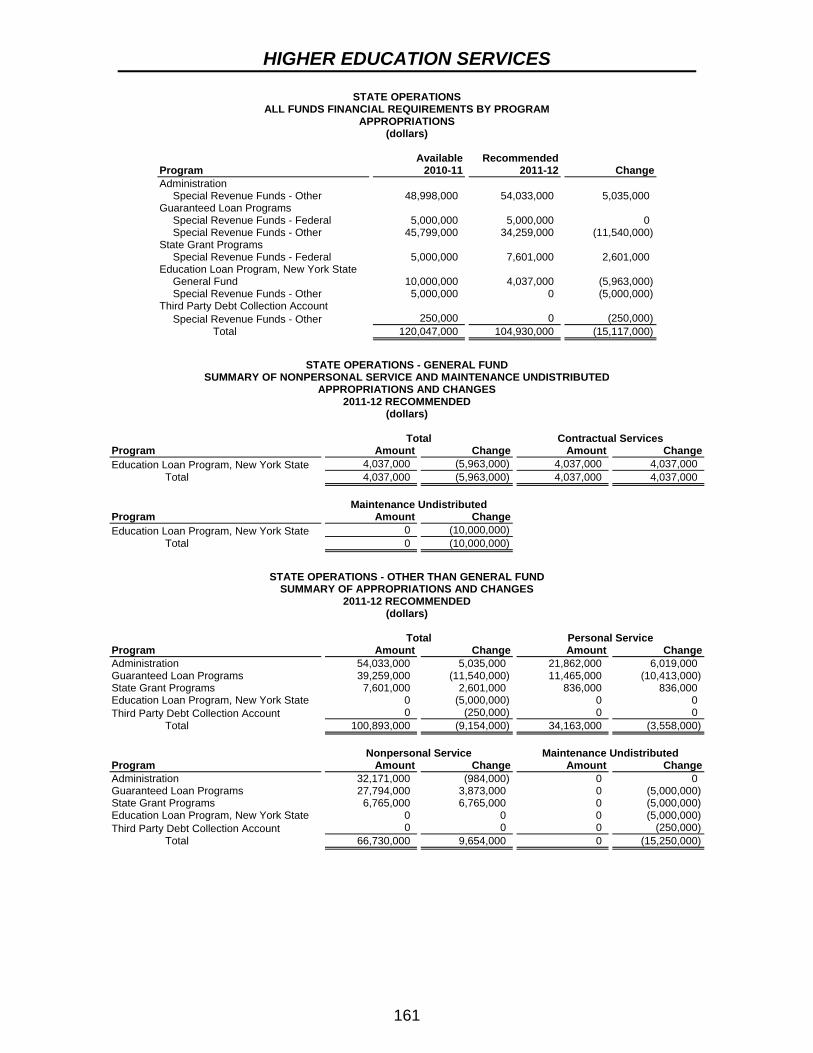
HIGHER EDUCATION SERVICES
161
STATE OPERATIONS ALL FUNDS FINANCIAL REQUIREMENTS BY PROGRAM
APPROPRIATIONS (dollars)
Program Available
2010-11Recommended
2011-12 ChangeAdministration
Special Revenue Funds - Other 48,998,000 54,033,000 5,035,000 Guaranteed Loan Programs
Special Revenue Funds - Federal 5,000,000 5,000,000 0 Special Revenue Funds - Other 45,799,000 34,259,000 (11,540,000)
State Grant Programs Special Revenue Funds - Federal 5,000,000 7,601,000 2,601,000
Education Loan Program, New York State General Fund 10,000,000 4,037,000 (5,963,000) Special Revenue Funds - Other 5,000,000 0 (5,000,000)
Third Party Debt Collection Account Special Revenue Funds - Other 250,000 0 (250,000)
Total 120,047,000 104,930,000 (15,117,000)
STATE OPERATIONS - GENERAL FUND
SUMMARY OF NONPERSONAL SERVICE AND MAINTENANCE UNDISTRIBUTED APPROPRIATIONS AND CHANGES
2011-12 RECOMMENDED (dollars)
Total Contractual Services Program Amount Change Amount ChangeEducation Loan Program, New York State 4,037,000 (5,963,000) 4,037,000 4,037,000 Total 4,037,000 (5,963,000) 4,037,000 4,037,000 Maintenance Undistributed Program Amount Change Education Loan Program, New York State 0 (10,000,000) Total 0 (10,000,000)
STATE OPERATIONS - OTHER THAN GENERAL FUND
SUMMARY OF APPROPRIATIONS AND CHANGES 2011-12 RECOMMENDED
(dollars) Total Personal Service Program Amount Change Amount ChangeAdministration 54,033,000 5,035,000 21,862,000 6,019,000 Guaranteed Loan Programs 39,259,000 (11,540,000) 11,465,000 (10,413,000)State Grant Programs 7,601,000 2,601,000 836,000 836,000 Education Loan Program, New York State 0 (5,000,000) 0 0 Third Party Debt Collection Account 0 (250,000) 0 0 Total 100,893,000 (9,154,000) 34,163,000 (3,558,000) Nonpersonal Service Maintenance Undistributed Program Amount Change Amount ChangeAdministration 32,171,000 (984,000) 0 0 Guaranteed Loan Programs 27,794,000 3,873,000 0 (5,000,000)State Grant Programs 6,765,000 6,765,000 0 (5,000,000)Education Loan Program, New York State 0 0 0 (5,000,000)Third Party Debt Collection Account 0 0 0 (250,000) Total 66,730,000 9,654,000 0 (15,250,000)

HIGHER EDUCATION SERVICES
162
AID TO LOCALITIES ALL FUNDS FINANCIAL REQUIREMENTS BY FUND TYPE
APPROPRIATIONS (dollars)
Fund Type Available
2010-11Recommended
2011-12 ChangeGeneral Fund 833,566,000 955,893,000 122,327,000 Special Revenue Funds - Federal 55,800,000 0 (55,800,000) Special Revenue Funds - Other 22,200,000 16,000,000 (6,200,000) Total 911,566,000 971,893,000 60,327,000 Adjustments: Prior Year Deficiency
Higher Education Services Corporation, New York State General Fund 25,159,000
Appropriated 2010-11 936,725,000
AID TO LOCALITIES ALL FUNDS FINANCIAL REQUIREMENTS BY PROGRAM
APPROPRIATIONS (dollars)
Program Available
2010-11Recommended
2011-12 ChangeState Grant Programs
General Fund 789,505,000 907,726,000 118,221,000 Special Revenue Funds - Federal 55,800,000 0 (55,800,000) Special Revenue Funds - Other 22,200,000 16,000,000 (6,200,000)
Scholarships and Fellowships General Fund 44,061,000 48,167,000 4,106,000
Total 911,566,000 971,893,000 60,327,000
163
DIVISION OF HOMELAND SECURITY AND EMERGENCY SERVICES
MISSION The Division of Homeland Security and Emergency Services (DHSES) was established in July 2010 through the merger of four existing entities: the Office of Homeland Security (now the Office of Counter Terrorism), the State Emergency Management Office (now the Office of Emergency Management), the Office of Fire Prevention and Control (OFPC), and the Office of Cyber Security and Critical Infrastructure Coordination (now the Office of Cyber Security). Additionally, as part of the merger, a new Office of Interoperable and Emergency Communications was established within DHSES. The Division provides leadership, coordination and support for efforts to prevent, protect against, prepare for, respond to, and recover from terrorism and other man-made and natural disasters, threats, fires and other emergencies. ORGANIZATION AND STAFFING The establishment of the Division centralized the oversight of a broad range of related activities that were previously managed by several different State agencies, including: assessing the vulnerability of critical IT assets and systems; supporting the development of interoperable communications systems in New York State; providing training and support to State and local first responders related to disaster preparedness and mitigation; incident management and arson investigation; coordinating the collection and dissemination of counter-terrorism information among law enforcement agencies and other stakeholders; and administering a broad range of State and Federal grants to support various public safety initiatives. The Division’s central office is in Albany. It also has a satellite office in New York City and has regional emergency management and OFPC field offices throughout the State. In addition, the State Preparedness Training Center located outside Oriskany, Oneida County, and the Academy of Fire Science in Montour Falls, Schuyler County serve as key training facilities for first responders across the State. BUDGET HIGHLIGHTS The 2011-12 Executive Budget recommends $818.3 million in All Funds spending ($14.1 million General Fund; and $804.2 million Other Funds) to support ongoing agency activities. This is a decrease of $18.2 million (-2.2 percent) All Funds (a decrease of $1.2 million General Fund and $42 million Capital Projects; as offset by a $25 million increase in Other Funds) from the 2010-11 Enacted Budget. The Executive Budget reduces each agency’s General Fund State Operations budget by 10 percent. These savings are intended to be achieved through administrative efficiencies in non-personal service and negotiated workforce savings that minimize layoffs to the extent possible. Major budget actions include:
Local Interoperable Communications Grants Program: The Executive Budget continues support for a new program that will award grants to county consortiums to assist them in the development of county-driven interoperable communications networks for use by both State and local first-responder agencies. These grants will be funded from a portion of the cellular surcharge revenues.

HOMELAND SECURITY AND EMERGENCY SERVICES
164
Enhanced Training Facilities for First-Responders: The Executive Budget includes re-appropriated funds to support the second year of a five-year, $42 million capital plan to expand the existing State Preparedness Training Center (SPTC) in Oneida County, outside of Oriskany. This investment will advance the vision of a state-of-the-art training facility for State, local and Federal first-responders, and allow the SPTC to become the central location for preparedness training in the State of New York. By coordinating programs at the SPTC, the Academy of Fire Science in Montour Falls, and other applicable state agencies and training centers, the Division will offer high-quality, integrated multi-disciplinary training to first responders in a much more efficient and coordinated manner.
Communications Equipment for State Agencies: Similar to last year, the Executive Budget includes $30 million for the purchase of emergency communications equipment for State agencies.
PROGRAM HIGHLIGHTS The merger of functions related to homeland security and emergency services that began in 2010-11 created a more effective partner for both local and Federal stakeholders, and one uniquely focused on the support of first responders. While the primary missions of the previously separate offices have been preserved as specialized offices within DHSES, the merger has allowed the State to leverage its existing resources as part of a more comprehensive strategy. Although the merger implementation process is still underway, the State expects to offer improved training for first-responders and a wide array of State and Federal grants programs, including new grants to support the development of regional interoperable communications networks in New York State. Other programs and functions which continue to represent State priorities within the new Division structure are highlighted below.
Federal Homeland Security Grant Programs: Since 2001, over $2 billion in Federal homeland security grants have been allocated, including over $450 million in 2010. This requires the development and execution of over 1,300 contracts with State, local and other entities that comply with State and Federal contracting, reporting and oversight requirements. In addition, DHSES works with State agencies and the Urban Area Work Groups to submit a comprehensive application for Federal homeland security funds not later than 90 days after the release of federal guidance.
Intelligence Analysis and Dissemination: Working in concert with the New York State Police and other stakeholders, DHSES will continue to sustain the analysis and dissemination of relevant terrorism information to law enforcement agencies and other stakeholders through the New York State Intelligence Center’s Counter-Terrorism Center (CTC).
Fire Prevention and Control: The Office of Fire Prevention and Control will continue to provide training and technical support for fire fighters, specialized arson investigation training, and fire safety inspections at colleges and State buildings. Further, low interest loans to fire and ambulance companies will continue through the Emergency Revolving Loan Program.
Enhancing First Responder Capabilities Through Training and Exercises: In 2011, DHSES will sustain first responder capabilities by training or directly supporting the training of first responders across the State, including providing a

HOMELAND SECURITY AND EMERGENCY SERVICES
165
variety of high-level courses at the SPTC. In 2008, the SPTC received accreditation from the Commission on Accreditation for Law Enforcement Agencies (CALEA), only the second training center in New York State to receive this prestigious recognition. Expansion plans for the SPTC include a Weapons Training Complex and a Simulations Complex to include a converted 200’x200’ hanger complete with interior and exterior streets, business facades, apartments and offices. This simulated “Cityscape” will provide first responders with a state-of-the-art, real-life training environment. In addition to the SPTC, the State Fire Academy in Montour Falls will continue to be a key training resource for the fire community.
Cyber Security: The Office of Cyber Security (OCS) provides statewide leadership and vision in the cyber security arena. OCS works to protect the State’s cyber security infrastructure by identifying and mitigating vulnerabilities, deterring and responding to cyber events, developing statewide cyber security policies and standards, and promoting cyber security awareness within the State.
NY Alert Emergency Notification System. Beginning in 2007-08, a statewide solution to emergency notifications benefiting schools, State University of New York campuses, and citizens across the State was established by the State Emergency Management Office. This function is preserved in DHSES, with enhancements allowing for increased enrollments, greater use of GIS, and expanded communications mediums that allow NY Alert to reach more citizens in times of emergency.
ALL FUNDS
APPROPRIATIONS (dollars)
Category Available
2010-11
AppropriationsRecommended
2011-12 Change
ReappropriationsRecommended
2011-12State Operations 136,733,000 135,530,000 (1,203,000) 105,685,000 Aid To Localities 657,717,700 682,751,000 25,033,300 2,905,738,400 Capital Projects 42,000,000 0 (42,000,000) 37,000,000 Total 836,450,700 818,281,000 (18,169,700) 3,048,423,400

HOMELAND SECURITY AND EMERGENCY SERVICES
166
ALL FUND TYPES PROJECTED LEVELS OF EMPLOYMENT BY PROGRAM
FILLED ANNUAL SALARIED POSITIONS Full-Time Equivalent Positions (FTE)
Program
2010-11Estimated FTEs
03/31/11
2011-12Estimated FTEs
03/31/12 FTE ChangeAdministration
General Fund 56 56 0 Special Revenue Funds - Other 20 20 0
Cyber Security and Critical Infrastructure Coordination Program General Fund 44 44 0 Special Revenue Funds - Federal 4 5 1
Emergency Management General Fund 25 25 0 Special Revenue Funds - Federal 62 77 15 Special Revenue Funds - Other 12 15 3
Homeland Security Program Special Revenue Funds - Federal 40 50 10
Interop Program Special Revenue Funds - Other 8 8 0
Fire Prevention and Control Special Revenue Funds - Other 133 133 0
Total 404 433 29
The above table does not reflect layoffs that may be necessary in the absence of negotiated workforce savings.
STATE OPERATIONS
ALL FUNDS FINANCIAL REQUIREMENTS BY FUND TYPE APPROPRIATIONS
(dollars)
Fund Type Available
2010-11Recommended
2011-12 ChangeGeneral Fund 11,957,000 10,754,000 (1,203,000) Special Revenue Funds - Federal 9,111,000 9,111,000 0 Special Revenue Funds - Other 63,665,000 63,665,000 0 Enterprise Funds 50,000,000 50,000,000 0 Internal Service Funds 2,000,000 2,000,000 0 Total 136,733,000 135,530,000 (1,203,000) Adjustments: Transfer(s) From
Special Pay Bill General Fund (8,000)
Appropriated 2010-11 136,725,000

HOMELAND SECURITY AND EMERGENCY SERVICES
167
STATE OPERATIONS ALL FUNDS FINANCIAL REQUIREMENTS BY PROGRAM
APPROPRIATIONS (dollars)
Program Available
2010-11Recommended
2011-12 ChangeAdministration
General Fund 6,415,000 5,766,000 (649,000) Special Revenue Funds - Other 13,470,000 13,470,000 0
Cyber Security and Critical Infrastructure Coordination Program General Fund 3,421,000 3,079,000 (342,000) Special Revenue Funds - Other 12,800,000 12,800,000 0 Internal Service Funds 2,000,000 2,000,000 0
Disaster Assistance Special Revenue Funds - Federal 4,786,000 4,786,000 0
Emergency Management General Fund 2,121,000 1,909,000 (212,000) Special Revenue Funds - Federal 1,025,000 1,025,000 0 Special Revenue Funds - Other 3,703,000 3,703,000 0 Enterprise Funds 50,000,000 50,000,000 0
Interop Program Special Revenue Funds - Other 32,000,000 32,000,000 0
Fire Prevention and Control Special Revenue Funds - Federal 3,300,000 3,300,000 0 Special Revenue Funds - Other 1,692,000 1,692,000 0
Total 136,733,000 135,530,000 (1,203,000)
STATE OPERATIONS - GENERAL FUND
SUMMARY OF PERSONAL SERVICE APPROPRIATIONS AND CHANGES 2011-12 RECOMMENDED
(dollars)
Total Personal Service Regular
(Annual Salaried) Program Amount Change Amount ChangeAdministration 5,496,000 (619,000) 5,245,000 (591,000)Cyber Security and Critical Infrastructure
Coordination Program 2,179,000 (242,000) 2,171,000 (241,000)Emergency Management 1,909,000 (212,000) 1,840,000 (204,000) Total 9,584,000 (1,073,000) 9,256,000 (1,036,000)
Temporary Service
(Nonannual Salaried) Holiday/Overtime Pay
Program Amount Change Amount ChangeAdministration 236,000 (26,000) 15,000 (2,000)Cyber Security and Critical Infrastructure
Coordination Program 0 0 8,000 (1,000)Emergency Management 36,000 (4,000) 33,000 (4,000) Total 272,000 (30,000) 56,000 (7,000)

HOMELAND SECURITY AND EMERGENCY SERVICES
168
STATE OPERATIONS - GENERAL FUND SUMMARY OF NONPERSONAL SERVICE AND MAINTENANCE UNDISTRIBUTED
APPROPRIATIONS AND CHANGES 2011-12 RECOMMENDED
(dollars) Total Supplies and Materials Program Amount Change Amount ChangeAdministration 270,000 (30,000) 18,000 (2,000)Cyber Security and Critical Infrastructure
Coordination Program 900,000 (100,000) 27,000 (3,000) Total 1,170,000 (130,000) 45,000 (5,000) Travel Contractual Services Program Amount Change Amount ChangeAdministration 0 0 234,000 (26,000)Cyber Security and Critical Infrastructure
Coordination Program 13,000 (2,000) 765,000 (85,000) Total 13,000 (2,000) 999,000 (111,000) Equipment Program Amount Change Administration 18,000 (2,000) Cyber Security and Critical Infrastructure
Coordination Program 95,000 (10,000) Total 113,000 (12,000)
STATE OPERATIONS - OTHER THAN GENERAL FUND
SUMMARY OF APPROPRIATIONS AND CHANGES 2011-12 RECOMMENDED
(dollars) Total Personal Service Program Amount Change Amount ChangeAdministration 13,470,000 0 2,370,000 1,370,000 Cyber Security and Critical Infrastructure
Coordination Program 14,800,000 0 1,321,000 0 Disaster Assistance 4,786,000 0 2,200,000 0 Emergency Management 54,728,000 0 1,139,000 0 Interop Program 32,000,000 0 1,000,000 0 Fire Prevention and Control 4,992,000 0 545,000 0 Total 124,776,000 0 8,575,000 1,370,000 Nonpersonal Service Maintenance Undistributed Program Amount Change Amount ChangeAdministration 11,100,000 6,600,000 0 (7,970,000)Cyber Security and Critical Infrastructure
Coordination Program 13,479,000 0 0 0 Disaster Assistance 2,586,000 0 0 0 Emergency Management 2,564,000 0 51,025,000 0 Interop Program 0 0 31,000,000 0 Fire Prevention and Control 4,447,000 0 0 0 Total 34,176,000 6,600,000 82,025,000 (7,970,000)
AID TO LOCALITIES
ALL FUNDS FINANCIAL REQUIREMENTS BY FUND TYPE APPROPRIATIONS
(dollars)
Fund Type Available
2010-11Recommended
2011-12 ChangeGeneral Fund 3,300,000 3,300,000 0 Special Revenue Funds - Federal 618,363,000 618,363,000 0 Special Revenue Funds - Other 36,054,700 61,088,000 25,033,300 Total 657,717,700 682,751,000 25,033,300

HOMELAND SECURITY AND EMERGENCY SERVICES
169
AID TO LOCALITIES ALL FUNDS FINANCIAL REQUIREMENTS BY PROGRAM
APPROPRIATIONS (dollars)
Program Available
2010-11Recommended
2011-12 ChangeEmergency Management
General Fund 3,300,000 3,300,000 0 Special Revenue Funds - Federal 18,363,000 18,363,000 0 Special Revenue Funds - Other 2,967,000 3,000,000 33,000
Homeland Security Program Special Revenue Funds - Federal 600,000,000 600,000,000 0
Interop Program Special Revenue Funds - Other 20,000,000 54,300,000 34,300,000
Fire Prevention and Control Special Revenue Funds - Other 13,087,700 3,788,000 (9,299,700)
Total 657,717,700 682,751,000 25,033,300
CAPITAL PROJECTS
ALL FUNDS FINANCIAL REQUIREMENTS BY PROGRAM APPROPRIATIONS
(dollars)
Comprehensive Construction Program Available
2010-11Recommended
2011-12 Change Reappropriations
2011-12Design and Construction Supervision
Capital Projects Fund 42,000,000 0 (42,000,000) 37,000,000 Total 42,000,000 0 (42,000,000) 37,000,000

170
DIVISION OF HOUSING AND COMMUNITY RENEWAL
MISSION The Division of Housing and Community Renewal (DHCR) is responsible for the supervision, maintenance and development of affordable low- and moderate-income housing in New York State. The Division currently performs a number of activities in fulfillment of this mission, including:
Oversight and regulation of the State’s public and publicly assisted rental housing;
Administration of the State’s rent regulations; and Administration of housing development and community preservation programs,
including State and Federal grants and loans to housing developers to finance construction or renovation of affordable housing.
ORGANIZATION AND STAFFING The Division is run by a Commissioner, who is appointed by the Governor. The 2010-11 Budget included the administrative consolidation of DHCR and the “nyhomes” public authorities to coordinate housing policy and administration. The new structure streamlined program areas and consolidated administrative functions to allow for more efficient delivery of services. The new organization brings complementary programs together under three main offices:
The Office of Finance and Development includes all programs that fund the development of affordable housing, including Low Income Housing Tax Credit programs, tax exempt and taxable bond finance programs, and single-family loan and capital awards programs.
The Office of Community Renewal includes all programs that target community and economic development, job creation and downtown revitalization, including the Community Development Block Grant Program, the NY Main Street program, the Affordable Homeownership Development Program, the Neighborhood Stabilization Program and the Neighborhood and Rural Preservation programs.
The Office of Housing Preservation includes all the programs that maintain and enhance the State’s portfolio of existing affordable housing, including rent administration, the Section 8 program, asset management and the Weatherization Assistance Program.
Additionally, all administrative and support services, including communications, legal affairs, administration, fair housing, policy development, and accounting/treasury fall within the Office of Professional Services. The Division maintains three main offices and nine regional offices. Main offices in Albany and Manhattan are responsible for agency-wide administrative functions and the development and execution of the Division’s policies. The Division’s Rent Administration program is administered through the main office in Queens. BUDGET HIGHLIGHTS The Executive Budget recommends $307.82 million All Funds ($52.57 million General Fund; $255.25 million Other Funds) for the Division of Housing and Community Renewal. This is a decrease of $156.92 million ($9.77 million decrease General Fund;
HOUSING AND COMMUNITY RENEWAL
171
$147.15 million decrease Other Funds) (-34 percent) from the 2010-11 budget. This net change primarily reflects the elimination of one-time American Recovery and Reinvestment Act (ARRA) appropriations and various program reductions. The Executive Budget reduces each agency’s General Fund State Operations budget by 10 percent. These savings are intended to be achieved through administrative efficiencies in non-personal service and negotiated workforce savings that minimize layoffs to the extent possible. Major budget actions include:
Consolidation and Reduction in Funding for the Neighborhood and Rural Preservation Programs: The 2011-12 Executive Budget recommends consolidating the Neighborhood Preservation Program (NPP) and Rural Preservation Program (RPP) into a single competitive, performance-based program. Funding will be reduced by 50 percent, from $12 million in 2010-11 to $6 million in 2011-12. NPP and RPP provide such services as housing rehabilitation, home buyer counseling, landlord/tenant mediation, community renewal, and crime watch programs.
State Low Income Housing Tax Credit: The 2011-12 budget recommends $4 million, the same level as prior years, for the State Low-Income Housing Tax Credit Program, which will result in nearly $40 million in new funding for affordable housing over the next ten years.
The Division’s fee revenues come from the following sources: 1) mortgage servicing fees; 2) application and monitoring fees collected from developers of housing projects that are partially financed by Federal low-income tax credits; 3) payments by New York City to finance a portion of the Division’s rent regulation activities; and 4) fees collected from the U.S. Department of Housing and Urban Development in connection with State administration of the Federal Section 8 rental subsidy program. PROGRAM HIGHLIGHTS OFFICE OF FINANCE AND DEVELOPMENT Finance and Development staff provide support to the Housing Trust Fund Corporation, a public benefit corporation that provides State-funded loans and grants to for-profit and not-for-profit entities to develop housing for low-income families, tenants with special needs and the low-income elderly. Finance and Development staff also administer the allocation of low-income housing tax credits across the State. These tax credits promote the production of low-income rental housing projects by reducing the tax liability of investors who finance the acquisition and construction of these projects. OFFICE OF COMMUNITY RENEWAL Community Renewal staff oversee programs that provide community and economic development, job creation and downtown revitalization, including the NY Main Street program; the Affordable Homeownership Development Program; the Neighborhood Stabilization Program; and the Neighborhood and Rural Preservation programs. Community Renewal staff also administer approximately $58 million in annual funding for the Community Development Block Grant Program (CDBG) from the U.S. Department of Housing and Urban Development (HUD). The CDBG program supports

HOUSING AND COMMUNITY RENEWAL
172
projects in communities with populations of less than 50,000 or non-urban counties with populations of less than 200,000 for housing rehabilitation, job creation or retention, infrastructure repair or replacement, micro-enterprise programs and homeownership assistance. OFFICE OF HOUSING PRESERVATION Housing Preservation staff oversee the management of State-assisted housing projects. On a project-by-project basis, staff periodically review the financial and physical condition of the following:
167 housing developments constructed between 1957 and 1974 under the State’s Mitchell-Lama housing laws and financed with State-guaranteed debt. These projects provide more than 71,295 dwelling units to low- and moderate-income families;
21 public housing projects constructed between 1941 and 1973 and financed with State General Obligation bonds that provide more than 1,600 apartments for low-income families; and
Approximately 1,175 low-income apartment projects partially financed by State or Federal capital funds.
In addition to these regulatory functions, staff are responsible for the administration of nearly 42,000 HUD Housing Choice vouchers, which provide rental assistance to low-income families in 50 local program areas in New York State. Staff also oversee the rent administration program. The Omnibus Housing Act of 1983 mandated the consolidation of all rent regulation under the DHCR in order to ensure that the State’s rent laws are administered in a manner that recognizes the concerns of both landlords and tenants. HOUSING CAPITAL PROGRAMS The 2011-12 Executive Budget reflects the continuation of recurring capital funding levels. There are two primary low- and moderate-income housing construction programs supported by State appropriations: the Housing Trust Fund Program and the Affordable Homeownership Development Program. The Housing Trust Fund Program provides grants to finance construction or rehabilitation of low-income apartment buildings. The Affordable Homeownership Development Program stimulates local economic growth and stabilizes distressed communities across the State by providing grants of up to $35,000 per unit or $40,000 per unit in designated high cost areas.
ALL FUNDS APPROPRIATIONS
(dollars)
Category Available
2010-11
AppropriationsRecommended
2011-12 Change
ReappropriationsRecommended
2011-12State Operations 99,303,000 91,987,000 (7,316,000) 83,088,000 Aid To Localities 291,238,000 141,630,000 (149,608,000) 487,295,000 Capital Projects 74,200,000 74,200,000 0 646,109,000 Total 464,741,000 307,817,000 (156,924,000) 1,216,492,000

HOUSING AND COMMUNITY RENEWAL
173
ALL FUND TYPES PROJECTED LEVELS OF EMPLOYMENT BY PROGRAM
FILLED ANNUAL SALARIED POSITIONS Full-Time Equivalent Positions (FTE)
Program
2010-11Estimated FTEs
03/31/11
2011-12Estimated FTEs
03/31/12 FTE ChangeAdministration
General Fund 27 27 0 Special Revenue Funds - Other 39 39 0
Community Development General Fund 21 21 0 Special Revenue Funds - Other 15 15 0 Capital Projects Funds - Federal 41 41 0
Housing General Fund 12 12 0 Special Revenue Funds - Federal 72 72 0 Special Revenue Funds - Other 69 69 0
Housing Information Systems General Fund 53 53 0
Low Income Weatherization Special Revenue Funds - Federal 54 54 0
Rent Administration General Fund 25 25 0 Special Revenue Funds - Other 329 329 0
Total 757 757 0
The above table does not reflect layoffs that may be necessary in the absence of negotiated workforce savings.
STATE OPERATIONS
ALL FUNDS FINANCIAL REQUIREMENTS BY FUND TYPE APPROPRIATIONS
(dollars)
Fund Type Available
2010-11Recommended
2011-12 ChangeGeneral Fund 23,930,000 21,537,000 (2,393,000) Special Revenue Funds - Federal 16,437,000 14,269,000 (2,168,000) Special Revenue Funds - Other 58,936,000 56,181,000 (2,755,000) Total 99,303,000 91,987,000 (7,316,000)
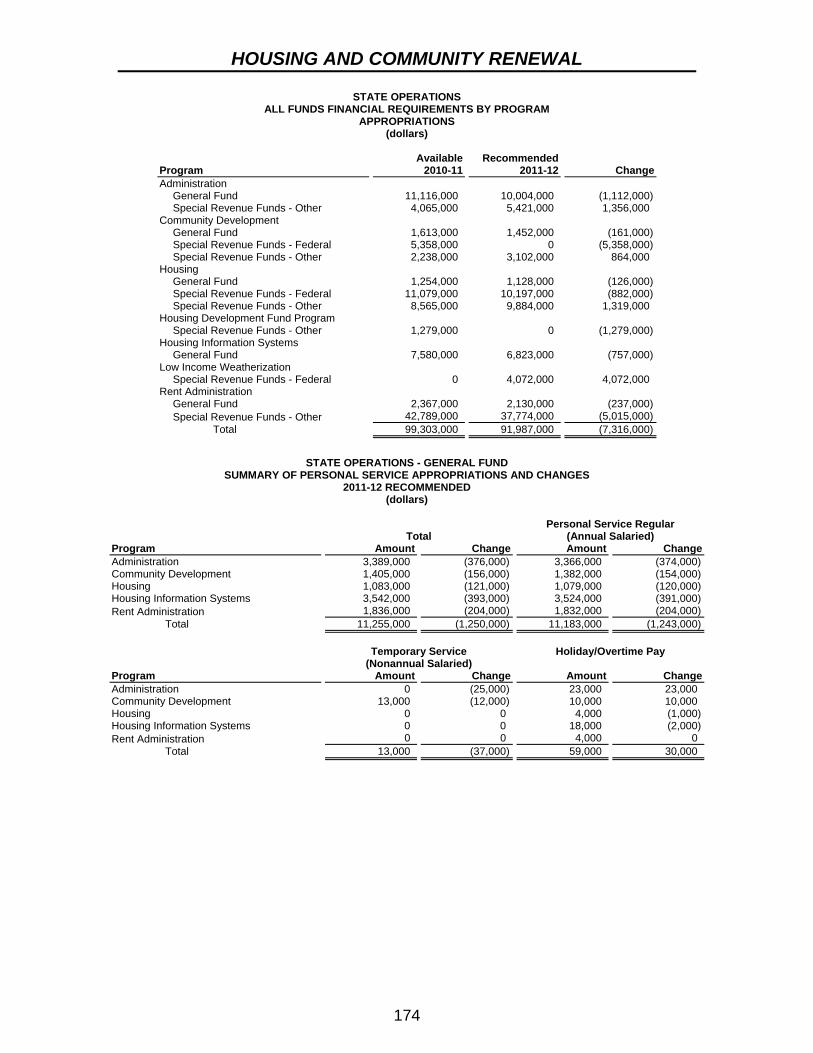
HOUSING AND COMMUNITY RENEWAL
174
STATE OPERATIONS ALL FUNDS FINANCIAL REQUIREMENTS BY PROGRAM
APPROPRIATIONS (dollars)
Program Available
2010-11Recommended
2011-12 ChangeAdministration
General Fund 11,116,000 10,004,000 (1,112,000) Special Revenue Funds - Other 4,065,000 5,421,000 1,356,000
Community Development General Fund 1,613,000 1,452,000 (161,000) Special Revenue Funds - Federal 5,358,000 0 (5,358,000) Special Revenue Funds - Other 2,238,000 3,102,000 864,000
Housing General Fund 1,254,000 1,128,000 (126,000) Special Revenue Funds - Federal 11,079,000 10,197,000 (882,000) Special Revenue Funds - Other 8,565,000 9,884,000 1,319,000
Housing Development Fund Program Special Revenue Funds - Other 1,279,000 0 (1,279,000)
Housing Information Systems General Fund 7,580,000 6,823,000 (757,000)
Low Income Weatherization Special Revenue Funds - Federal 0 4,072,000 4,072,000
Rent Administration General Fund 2,367,000 2,130,000 (237,000) Special Revenue Funds - Other 42,789,000 37,774,000 (5,015,000)
Total 99,303,000 91,987,000 (7,316,000)
STATE OPERATIONS - GENERAL FUND
SUMMARY OF PERSONAL SERVICE APPROPRIATIONS AND CHANGES 2011-12 RECOMMENDED
(dollars)
Total Personal Service Regular
(Annual Salaried) Program Amount Change Amount ChangeAdministration 3,389,000 (376,000) 3,366,000 (374,000)Community Development 1,405,000 (156,000) 1,382,000 (154,000)Housing 1,083,000 (121,000) 1,079,000 (120,000)Housing Information Systems 3,542,000 (393,000) 3,524,000 (391,000)Rent Administration 1,836,000 (204,000) 1,832,000 (204,000) Total 11,255,000 (1,250,000) 11,183,000 (1,243,000)
Temporary Service
(Nonannual Salaried) Holiday/Overtime Pay
Program Amount Change Amount ChangeAdministration 0 (25,000) 23,000 23,000 Community Development 13,000 (12,000) 10,000 10,000 Housing 0 0 4,000 (1,000)Housing Information Systems 0 0 18,000 (2,000)Rent Administration 0 0 4,000 0 Total 13,000 (37,000) 59,000 30,000

HOUSING AND COMMUNITY RENEWAL
175
STATE OPERATIONS - GENERAL FUND SUMMARY OF NONPERSONAL SERVICE AND MAINTENANCE UNDISTRIBUTED
APPROPRIATIONS AND CHANGES 2011-12 RECOMMENDED
(dollars) Total Supplies and Materials Program Amount Change Amount ChangeAdministration 6,615,000 (736,000) 195,000 (22,000)Community Development 47,000 (5,000) 5,000 0 Housing 45,000 (5,000) 1,000 0 Housing Information Systems 3,281,000 (364,000) 18,000 (2,000)Rent Administration 294,000 (33,000) 28,000 (3,000) Total 10,282,000 (1,143,000) 247,000 (27,000) Travel Contractual Services Program Amount Change Amount ChangeAdministration 167,000 (19,000) 5,875,000 (653,000)Community Development 23,000 (3,000) 12,000 (1,000)Housing 30,000 (4,000) 10,000 (1,000)Housing Information Systems 30,000 (3,000) 2,503,000 (278,000)Rent Administration 4,000 0 201,000 (23,000) Total 254,000 (29,000) 8,601,000 (956,000) Equipment Program Amount Change Administration 378,000 (42,000) Community Development 7,000 (1,000) Housing 4,000 0 Housing Information Systems 730,000 (81,000) Rent Administration 61,000 (7,000) Total 1,180,000 (131,000)
STATE OPERATIONS - OTHER THAN GENERAL FUND
SUMMARY OF APPROPRIATIONS AND CHANGES 2011-12 RECOMMENDED
(dollars) Total Personal Service Program Amount Change Amount ChangeAdministration 5,421,000 1,356,000 2,600,000 664,000 Community Development 3,102,000 (4,494,000) 1,800,000 (2,038,000)Housing 20,081,000 437,000 11,450,000 (348,000)Housing Development Fund Program 0 (1,279,000) 0 (833,000)Low Income Weatherization 4,072,000 4,072,000 2,500,000 2,500,000 Rent Administration 37,774,000 (5,015,000) 22,703,000 (3,532,000) Total 70,450,000 (4,923,000) 41,053,000 (3,587,000) Nonpersonal Service Program Amount Change Administration 2,821,000 692,000 Community Development 1,302,000 (2,456,000) Housing 8,631,000 785,000 Housing Development Fund Program 0 (446,000) Low Income Weatherization 1,572,000 1,572,000 Rent Administration 15,071,000 (1,483,000) Total 29,397,000 (1,336,000)
AID TO LOCALITIES
ALL FUNDS FINANCIAL REQUIREMENTS BY FUND TYPE APPROPRIATIONS
(dollars)
Fund Type Available
2010-11Recommended
2011-12 ChangeGeneral Fund 38,411,000 31,031,000 (7,380,000) Special Revenue Funds - Federal 244,600,000 102,372,000 (142,228,000) Special Revenue Funds - Other 8,227,000 8,227,000 0 Total 291,238,000 141,630,000 (149,608,000)

HOUSING AND COMMUNITY RENEWAL
176
AID TO LOCALITIES ALL FUNDS FINANCIAL REQUIREMENTS BY PROGRAM
APPROPRIATIONS (dollars)
Program Available
2010-11Recommended
2011-12 ChangeHousing Development Fund Program
Special Revenue Funds - Other 8,227,000 8,227,000 0 HUD Section 8 New Construction
Special Revenue Funds - Federal 13,100,000 0 (13,100,000) Low Income Weatherization
Special Revenue Funds - Federal 173,500,000 44,372,000 (129,128,000) Neighborhood Preservation
General Fund 8,479,000 6,010,000 (2,469,000) Periodic Subsidies - Local Areas
General Fund 11,591,000 10,219,000 (1,372,000) Rural Preservation
General Fund 3,539,000 0 (3,539,000) Rural Rental Assistance
General Fund 14,802,000 14,802,000 0 Small Cities Community Development
Block Grant Special Revenue Funds - Federal 58,000,000 58,000,000 0
Total 291,238,000 141,630,000 (149,608,000)
CAPITAL PROJECTS
ALL FUNDS FINANCIAL REQUIREMENTS BY PROGRAM APPROPRIATIONS
(dollars)
Comprehensive Construction Program Available
2010-11Recommended
2011-12 Change Reappropriations
2011-12Affordable Housing Corporation
Housing Program Fund 25,000,000 25,000,000 0 81,787,000 Housing Assistance Fund
Housing Assistance Fund 0 0 0 8,900,000 Low Income Housing Trust Fund
Housing Program Fund 29,000,000 29,000,000 0 141,398,000 Maintenance and Improvements of Existing Facilities
Federal Stimulus 0 0 0 253,000,000 Housing Program Fund 0 0 0 3,133,000
Housing Opportunity Program For Elderly Housing Program Fund 400,000 400,000 0 0
Housing Program Capital Improvement Capital Projects Fund 0 0 0 19,720,000
State Housing Bond Fund State Housing Bond Fund 0 0 0 7,344,000
Main Street Program Housing Program Fund 0 0 0 250,000
New Facilities Federal Capital Projects Fund 0 0 0 21,446,000 Housing Program Fund 0 0 0 2,000,000
Public Housing Modernization Program Housing Program Fund 12,800,000 12,800,000 0 65,905,000
Rural Revitalization Program Housing Program Fund 0 0 0 5,450,000
Urban Initiatives Program Housing Program Fund 0 0 0 3,351,000
Homes for Working Families Program Housing Program Fund 7,000,000 7,000,000 0 32,425,000
Total 74,200,000 74,200,000 0 646,109,000

177
HOUSING FINANCE AGENCY MISSION The New York State Housing Finance Agency is a public benefit corporation created in 1960 to finance low- and moderate-income rental housing. The Agency issues tax-exempt and taxable bonds to provide mortgage loans for the construction and rehabilitation of both low income and mixed income multi-family rental housing. The Housing Finance Agency also plays a role in administering several housing programs supported by State and Federal appropriations. In 1990, the Agency’s mission was expanded to include the issuance of bonds to reimburse the State for appropriated expenditures under the State’s housing programs. ORGANIZATION AND STAFFING The Housing Finance Agency is governed by a Board consisting of seven members: the Commissioner of Housing and Community Renewal, the Director of the Budget, the Commissioner of Taxation and Finance and four members nominated by the Governor with the consent of the Senate. The Governor designates a Chairperson. The Agency headquarters is located in New York City and is managed by a President/Chief Executive Officer, who is appointed by the Board. The Agency has regional offices in Albany and Buffalo. The Housing Finance Agency is operated and administered jointly with the State of New York Mortgage Agency, but the two agencies are governed by separate Boards. The New York State Affordable Housing Corporation is a subsidiary of the Agency. BUDGET HIGHLIGHTS The Agency receives no direct operating support from the State. Its operating budget is funded with fees and revenues the Agency generates through its financing activities. The 2010-11 Budget consolidated the administrative and program operations of HFA and the “nyhomes” family of public benefit corporations with the Division of Housing and Community Renewal. PROGRAM HIGHLIGHTS Since its inception in 1960, the Agency has provided financing of more than $12.04 billion for more than 122,760 units of multi-family housing. During the Agency’s fiscal year ending October 31, 2010, more than 3,200 units were financed with mortgage loans totaling more than $392 million.

178
STATE OF NEW YORK MORTGAGE AGENCY MISSION The State of New York Mortgage Agency (SONYMA) is a public benefit corporation created in 1970 to increase the affordability of homeownership for low- to moderate-income residents of New York State. This is accomplished by the Agency’s issuance of taxable and tax-exempt bonds and the use of proceeds to purchase low-interest rate mortgage loans. In 1978, the Agency’s mission was expanded to include the issuance of mortgage insurance to promote the stabilization of neighborhoods throughout the State. In 2009, the Agency’s existing authority to issue tax-exempt bonds to finance education loans was modernized and expanded to authorize the Agency to implement a program to finance education loans for higher education costs for students attending schools in New York State. ORGANIZATION AND STAFFING The Agency is overseen by a Board of Directors comprised of the State Comptroller or his appointee, the Director of the Budget, the Commissioner of Housing and Community Renewal, four appointees of the Governor, one appointee of the Temporary President of the Senate and one appointee of the Speaker of the Assembly. Responsibility for operation of the Agency rests with the President/Chief Executive Officer, who also serves in this capacity for the Housing Finance Agency – the State’s other major housing finance entity. The Agency is operated jointly with the Housing Finance Agency out of its central headquarters in New York City and from regional offices in Albany and Buffalo. The State of New York Mortgage Agency has two program divisions. The Single Family Programs and Financing Division provides low-interest rate mortgages to low- and moderate-income first-time homebuyers (and for other eligible homebuyers in designated target areas) through the issuance of mortgage revenue bonds. The Agency uses a network of lending institutions to originate mortgages on its behalf. The Mortgage Insurance Fund Division provides insurance on mortgage loans for residential, mixed residential, commercial and community service-related properties throughout the State. In addition, in December 2004, the Mortgage Insurance Fund was authorized to enter into agreements to provide credit support for bonds and ancillary bond facilities issued by the Convention Center Development Corporation, a subsidiary of the New York State Urban Development Corporation. This insurance is supported by the Mortgage Insurance Fund, which is funded by a surcharge on the Mortgage Recording Tax. BUDGET HIGHLIGHTS The Agency receives no direct operating support from the State. Statute requires the State to guarantee payments made by the Agency to the State in prior years. The Executive Budget recommends $173.17 million in appropriations in 2011-12 to satisfy this requirement, although no cash disbursements are projected to be made from this appropriation. All State of New York Mortgage Agency programs and operations are supported by Agency funds, consisting of mortgage income, application fees, insurance premiums and investment proceeds.

MORTGAGE AGENCY
179
PROGRAM HIGHLIGHTS Since its inception in 1970, the Agency’s Single Family Division has provided more than $11.1 billion of affordable financing for over 152,000 homes in New York. During the Agency’s 2009-10 fiscal year, 2,100 loans were financed in the amount of $347 million. The Mortgage Insurance Fund’s portfolio of insured mortgages exceeds $5.4 billion. In 2009-10, mortgage insurance provided by the Agency totaled more than $991 million.
ALL FUNDS APPROPRIATIONS
(dollars)
Category Available
2010-11
AppropriationsRecommended
2011-12 Change
ReappropriationsRecommended
2011-12State Operations 76,800,000 76,800,000 0 0 Aid To Localities 97,720,000 96,372,000 (1,348,000) 0 Capital Projects 0 0 0 0 Total 174,520,000 173,172,000 (1,348,000) 0
STATE OPERATIONS
ALL FUNDS FINANCIAL REQUIREMENTS BY FUND TYPE APPROPRIATIONS
(dollars)
Fund Type Available
2010-11Recommended
2011-12 ChangeGeneral Fund 76,800,000 76,800,000 0 Total 76,800,000 76,800,000 0
STATE OPERATIONS
ALL FUNDS FINANCIAL REQUIREMENTS BY PROGRAM APPROPRIATIONS
(dollars)
Program Available
2010-11Recommended
2011-12 ChangeInfrastructure Trust Fund Guarantee -
SONYMA Homeowners Mortgage Revenues General Fund 61,800,000 61,800,000 0
SONYMA Mortgage Insurance Fund Restoration General Fund 15,000,000 15,000,000 0
Total 76,800,000 76,800,000 0
STATE OPERATIONS - GENERAL FUND
SUMMARY OF NONPERSONAL SERVICE AND MAINTENANCE UNDISTRIBUTED APPROPRIATIONS AND CHANGES
2011-12 RECOMMENDED (dollars)
Total Maintenance Undistributed Program Amount Change Amount ChangeInfrastructure Trust Fund Guarantee -
SONYMA Homeowners Mortgage Revenues 61,800,000 0 61,800,000 0
SONYMA Mortgage Insurance Fund Restoration 15,000,000 0 15,000,000 0
Total 76,800,000 0 76,800,000 0

MORTGAGE AGENCY
180
AID TO LOCALITIES ALL FUNDS FINANCIAL REQUIREMENTS BY FUND TYPE
APPROPRIATIONS (dollars)
Fund Type Available
2010-11Recommended
2011-12 ChangeGeneral Fund 97,720,000 96,372,000 (1,348,000) Total 97,720,000 96,372,000 (1,348,000)
AID TO LOCALITIES
ALL FUNDS FINANCIAL REQUIREMENTS BY PROGRAM APPROPRIATIONS
(dollars)
Program Available
2010-11Recommended
2011-12 ChangeSONYMA Mortgage Insurance Fund
Restoration General Fund 97,720,000 96,372,000 (1,348,000)
Total 97,720,000 96,372,000 (1,348,000)

181
HUDSON RIVER PARK TRUST MISSION The Hudson River Park Trust (the Trust) is a public benefit corporation established in 1998 to design, develop, and maintain the 550-acre Hudson River Park in Manhattan, which extends five miles along the Hudson River waterfront from Battery Park to 59th Street. The Trust is governed by a 13-member board: 5 members appointed by the Governor, 5 by the Mayor of New York City, and 3 by the Manhattan Borough President. ORGANIZATION AND STAFFING The Trust is headed by a President and Chief Executive Officer who is appointed by the Board. BUDGET HIGHLIGHTS The Executive Budget recommends funding of $3 million for the Trust, unchanged from the 2010-11 level, to aid in the completion of the remaining segments of the Park. This funding will come from the State Environmental Protection Fund. All Trust administrative activities, including operating costs, are paid directly from a portion of the commercial lease payments and other revenues generated by businesses and activities conducted on the Park property. These receipts are deposited directly to the Trust. The Trust has a workforce of 58 full time employees. PROGRAM HIGHLIGHTS During 2011-12, the Trust will continue the design and construction of the remaining segments of the Park, develop detailed cost estimates, explore alternative sources of funding and continue to oversee capital projects to build the Park.
ALL FUNDS APPROPRIATIONS
(dollars)
Category Available
2010-11
AppropriationsRecommended
2011-12 Change
ReappropriationsRecommended
2011-12State Operations 0 0 0 0 Aid To Localities 0 0 0 0 Capital Projects 0 0 0 21,176,000 Total 0 0 0 21,176,000
CAPITAL PROJECTS
ALL FUNDS FINANCIAL REQUIREMENTS BY PROGRAM APPROPRIATIONS
(dollars)
Comprehensive Construction Program Available
2010-11Recommended
2011-12 Change Reappropriations
2011-12Regional Development
Capital Projects Fund - Advances 0 0 0 21,176,000 Total 0 0 0 21,176,000

182
DIVISION OF HUMAN RIGHTS MISSION New York holds the proud distinction of being the first state in the nation to enact a civil rights law, affording every individual an equal opportunity to enjoy a full and productive life, including in the areas of employment, housing, public accommodations, education, and credit. Under the State’s Human Rights Law, discriminating against others because of their race, sex, age, disability or membership in other specified classes is illegal in the State of New York. Protection under the Human Rights Law also includes prohibiting discrimination based on military status and sexual orientation. The New York State Division of Human Rights is the State agency charged with enforcing the Human Rights Law and protecting the civil rights of New Yorkers. To fulfill these responsibilities, the Division:
Prosecutes unlawful discriminatory practices; Investigates and resolves individual complaints of illegal discrimination; Advances policies and legislation that expand and/or better protect the civil rights
of New Yorkers; and Promotes human rights awareness through education and outreach.
ORGANIZATION AND STAFFING Under the direction of the Commissioner, who is appointed by the Governor subject to confirmation by the Senate, the Division operates from its main office in New York City and from nine regional and two satellite offices across the State. The Division’s workforce is primarily assigned to investigate complaints, to assist in the presentation of cases and to adjudicate individual cases of discrimination. BUDGET HIGHLIGHTS The Executive Budget recommends $21.3 million All Funds ($13.1 million General Fund, $8.2 million Other Funds) for the Division of Human Rights. This is a decrease of $1.5 million (-6.4 percent) from the 2010-11 budget. The Executive Budget reduces each agency’s General Fund State Operations budget by 10 percent. These savings are intended to be achieved through administrative efficiencies in non-personal service and negotiated workforce savings that minimize layoffs to the extent possible. PROGRAM HIGHLIGHTS In 2010-11, the Division focused its activities on investigating systematic forms of discrimination, on improving the individual complaint process, and on investigating and adjudicating individual cases. It will continue this work in 2011-12, along with enforcing provisions of State law that enhance the rights of New Yorkers, particularly in the area of disabilities. The Division is also working with local communities to address issues of bias-related violence.

HUMAN RIGHTS
183
ALL FUNDS APPROPRIATIONS
(dollars)
Category Available
2010-11
AppropriationsRecommended
2011-12 Change
ReappropriationsRecommended
2011-12State Operations 22,745,000 21,293,000 (1,452,000) 13,933,000 Aid To Localities 0 0 0 0 Capital Projects 0 0 0 0 Total 22,745,000 21,293,000 (1,452,000) 13,933,000
ALL FUND TYPES
PROJECTED LEVELS OF EMPLOYMENT BY PROGRAM FILLED ANNUAL SALARIED POSITIONS
Full-Time Equivalent Positions (FTE)
Program
2010-11Estimated FTEs
03/31/11
2011-12Estimated FTEs
03/31/12 FTE ChangeAdministration
General Fund 141 141 0 Special Revenue Funds - Federal 54 54 0
Total 195 195 0
The above table does not reflect layoffs that may be necessary in the absence of negotiated workforce savings.
STATE OPERATIONS
ALL FUNDS FINANCIAL REQUIREMENTS BY FUND TYPE APPROPRIATIONS
(dollars)
Fund Type Available
2010-11Recommended
2011-12 ChangeGeneral Fund 14,522,000 13,070,000 (1,452,000) Special Revenue Funds - Federal 8,223,000 8,223,000 0 Total 22,745,000 21,293,000 (1,452,000)
STATE OPERATIONS
ALL FUNDS FINANCIAL REQUIREMENTS BY PROGRAM APPROPRIATIONS
(dollars)
Program Available
2010-11Recommended
2011-12 ChangeAdministration
General Fund 14,522,000 13,070,000 (1,452,000) Special Revenue Funds - Federal 8,223,000 8,223,000 0
Total 22,745,000 21,293,000 (1,452,000)
STATE OPERATIONS - GENERAL FUND
SUMMARY OF PERSONAL SERVICE APPROPRIATIONS AND CHANGES 2011-12 RECOMMENDED
(dollars)
Total Personal Service Regular
(Annual Salaried) Program Amount Change Amount ChangeAdministration 10,463,000 (1,163,000) 10,154,000 (1,128,000) Total 10,463,000 (1,163,000) 10,154,000 (1,128,000)
Temporary Service
(Nonannual Salaried) Holiday/Overtime Pay
Program Amount Change Amount ChangeAdministration 292,000 (33,000) 17,000 (2,000) Total 292,000 (33,000) 17,000 (2,000)

HUMAN RIGHTS
184
STATE OPERATIONS - GENERAL FUND SUMMARY OF NONPERSONAL SERVICE AND MAINTENANCE UNDISTRIBUTED
APPROPRIATIONS AND CHANGES 2011-12 RECOMMENDED
(dollars) Total Supplies and Materials Program Amount Change Amount ChangeAdministration 2,607,000 (289,000) 136,000 (15,000) Total 2,607,000 (289,000) 136,000 (15,000) Travel Contractual Services Program Amount Change Amount ChangeAdministration 173,000 (19,000) 2,118,000 (235,000) Total 173,000 (19,000) 2,118,000 (235,000) Equipment Program Amount Change Administration 180,000 (20,000) Total 180,000 (20,000)
STATE OPERATIONS - OTHER THAN GENERAL FUND
SUMMARY OF APPROPRIATIONS AND CHANGES 2011-12 RECOMMENDED
(dollars) Total Personal Service Program Amount Change Amount ChangeAdministration 8,223,000 0 4,131,000 0 Total 8,223,000 0 4,131,000 0 Nonpersonal Service Program Amount Change Administration 4,092,000 0 Total 4,092,000 0

185
OFFICE OF INDIGENT LEGAL SERVICES MISSION Created as part of the 2010-11 Enacted Budget, the Office of Indigent Legal Services and the associated Indigent Legal Services Board are responsible for studying, overseeing and improving the quality of legal representation provided to indigent defendants in New York State. ORGANIZATION AND STAFFING The Indigent Legal Services Board consists of nine members, with representation from both houses of the Legislature, counties, and attorneys with public defense backgrounds. The Board nominates an Executive Director of the Office of Indigent Legal Services, who is then approved by the Governor. BUDGET HIGHLIGHTS The Executive Budget recommends $80 million All Funds for the full first-year operation of the Office, of which $3 million will support agency operations. The other $77 million will be available for distribution to the counties and New York City for the cost of indigent defense services. Executive Budget appropriations support up to 20 FTE, including the Director. PROGRAM HIGHLIGHTS The Office has responsibility for developing policies regarding indigent defense services and working collaboratively with the counties to facilitate improvements in the public defense system. The Office will examine and monitor the services provided to indigent defendants in the counties; collect information from the counties in order to study and recommend measures to enhance the quality of representation provided; establish criteria to guide the provision of conflict defender services in the counties; and, target grants to counties in support of innovative and cost-effective proposals to enhance the quality of indigent legal services. The Office will also make recommendations on ways to improve the delivery of services statewide, for consideration by the Board. The Board acts in an approval and advisory role to the Office. It will evaluate existing indigent defense programs and determine the types of services that should be provided; approve, modify, or reject the recommendations of the Office with regard to the distribution of grants; and report to the Governor, Legislature and Judiciary annually.
ALL FUNDS APPROPRIATIONS
(dollars)
Category Available
2010-11
AppropriationsRecommended
2011-12 Change
ReappropriationsRecommended
2011-12State Operations 1,500,000 3,000,000 1,500,000 0 Aid To Localities 77,000,000 77,000,000 0 77,000,000 Capital Projects 0 0 0 0 Total 78,500,000 80,000,000 1,500,000 77,000,000

INDIGENT LEGAL SERVICES
186
ALL FUND TYPES PROJECTED LEVELS OF EMPLOYMENT BY PROGRAM
FILLED ANNUAL SALARIED POSITIONS Full-Time Equivalent Positions (FTE)
Program
2010-11Estimated FTEs
03/31/11
2011-12Estimated FTEs
03/31/12 FTE ChangeIndigent Legal Services Program
Special Revenue Funds - Other 20 20 0 Total 20 20 0
The above table does not reflect layoffs that may be necessary in the absence of negotiated workforce savings.
STATE OPERATIONS
ALL FUNDS FINANCIAL REQUIREMENTS BY FUND TYPE APPROPRIATIONS
(dollars)
Fund Type Available
2010-11Recommended
2011-12 ChangeSpecial Revenue Funds - Other 1,500,000 3,000,000 1,500,000 Total 1,500,000 3,000,000 1,500,000
STATE OPERATIONS
ALL FUNDS FINANCIAL REQUIREMENTS BY PROGRAM APPROPRIATIONS
(dollars)
Program Available
2010-11Recommended
2011-12 ChangeIndigent Legal Services Program
Special Revenue Funds - Other 1,500,000 3,000,000 1,500,000 Total 1,500,000 3,000,000 1,500,000
STATE OPERATIONS - OTHER THAN GENERAL FUND
SUMMARY OF APPROPRIATIONS AND CHANGES 2011-12 RECOMMENDED
(dollars) Total Personal Service Program Amount Change Amount ChangeIndigent Legal Services Program 3,000,000 1,500,000 1,515,000 765,000 Total 3,000,000 1,500,000 1,515,000 765,000 Nonpersonal Service Program Amount Change Indigent Legal Services Program 1,485,000 735,000 Total 1,485,000 735,000
AID TO LOCALITIES
ALL FUNDS FINANCIAL REQUIREMENTS BY FUND TYPE APPROPRIATIONS
(dollars)
Fund Type Available
2010-11Recommended
2011-12 ChangeSpecial Revenue Funds - Other 77,000,000 77,000,000 0 Total 77,000,000 77,000,000 0

INDIGENT LEGAL SERVICES
187
AID TO LOCALITIES ALL FUNDS FINANCIAL REQUIREMENTS BY PROGRAM
APPROPRIATIONS (dollars)
Program Available
2010-11Recommended
2011-12 ChangeIndigent Legal Services Program
Special Revenue Funds - Other 77,000,000 77,000,000 0 Total 77,000,000 77,000,000 0

188
OFFICE OF THE STATE INSPECTOR GENERAL MISSION The Office of the State Inspector General is responsible for detecting, investigating, deterring and eliminating corruption, fraud, criminal activity, conflicts of interest, abuses, and waste in the State entities under its jurisdiction. The Office’s jurisdiction includes Executive Branch agencies, departments, divisions, offices, boards, commissions, public authorities and public benefit corporations and any entity of State government headed by an appointee of the Governor that does not have its own statutory Inspector General. Its mission is designed to ensure that State government maintains the highest standards of integrity and accountability. ORGANIZATION AND STAFFING The Office of the State Inspector General consolidates most of the State’s inspector general activities in a centralized office that replaced what were formerly separate, semi-independent deputy inspectors general located within the agencies they served. Led by the Inspector General, who is appointed by the Governor, the Office is headquartered in Albany and has offices in New York City and Buffalo. BUDGET HIGHLIGHTS The 2011-12 Executive Budget recommendations provide over $5.6 million All Funds ($5.5 million General Fund; $100,000 All Other Funds). This is a decrease of $614,000 (-10 percent) from the 2010-11 budget, which is entirely attributable to the General Fund. The Executive Budget reduces each agency’s General Fund State Operations budget by 10 percent. These savings are intended to be achieved through administrative efficiencies in non-personal service and negotiated workforce savings that minimize layoffs to the extent possible. PROGRAM HIGHLIGHTS In the 2010-11 fiscal year, the Office of the State Inspector General anticipates receiving approximately 2,600 complaints of fraud, criminal activity, waste and abuse involving State employees and resources. This is an increase of over 400 complaints from the previous fiscal year. The Office focuses its investigative efforts on major cases involving theft, bribery, contract fraud, abuse of authority, and other serious allegations of corruption. The Office works jointly with local, State and Federal law enforcement personnel and prosecutors on significant matters of public concern. The Office’s investigations have uncovered instances of theft, bid rigging, bribery, creation of fraudulent documents, misuse of computers, construction industry fraud, and systemic abuse and waste in various agencies that have resulted in arrests and/or referrals for discipline in many cases. In addition, numerous cases have also resulted in recommendations for administrative or policy changes.
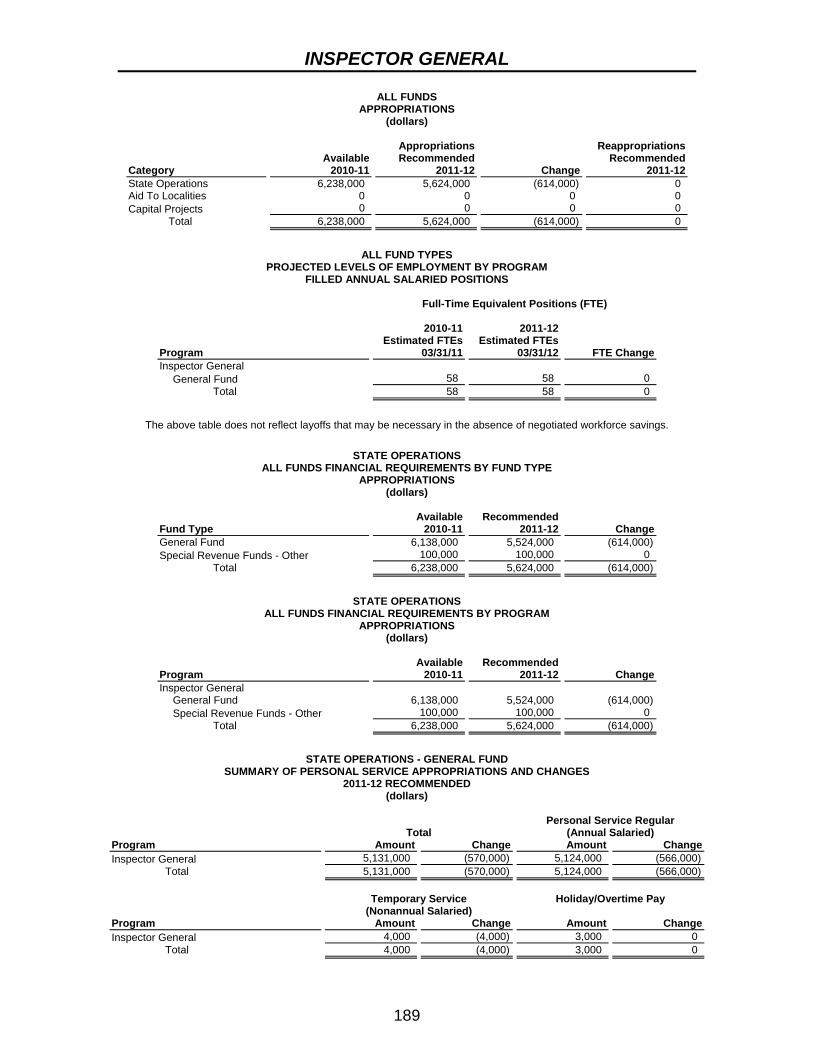
INSPECTOR GENERAL
189
ALL FUNDS APPROPRIATIONS
(dollars)
Category Available
2010-11
AppropriationsRecommended
2011-12 Change
ReappropriationsRecommended
2011-12State Operations 6,238,000 5,624,000 (614,000) 0 Aid To Localities 0 0 0 0 Capital Projects 0 0 0 0 Total 6,238,000 5,624,000 (614,000) 0
ALL FUND TYPES
PROJECTED LEVELS OF EMPLOYMENT BY PROGRAM FILLED ANNUAL SALARIED POSITIONS
Full-Time Equivalent Positions (FTE)
Program
2010-11Estimated FTEs
03/31/11
2011-12Estimated FTEs
03/31/12 FTE ChangeInspector General
General Fund 58 58 0 Total 58 58 0
The above table does not reflect layoffs that may be necessary in the absence of negotiated workforce savings.
STATE OPERATIONS
ALL FUNDS FINANCIAL REQUIREMENTS BY FUND TYPE APPROPRIATIONS
(dollars)
Fund Type Available
2010-11Recommended
2011-12 ChangeGeneral Fund 6,138,000 5,524,000 (614,000) Special Revenue Funds - Other 100,000 100,000 0 Total 6,238,000 5,624,000 (614,000)
STATE OPERATIONS
ALL FUNDS FINANCIAL REQUIREMENTS BY PROGRAM APPROPRIATIONS
(dollars)
Program Available
2010-11Recommended
2011-12 ChangeInspector General
General Fund 6,138,000 5,524,000 (614,000) Special Revenue Funds - Other 100,000 100,000 0
Total 6,238,000 5,624,000 (614,000)
STATE OPERATIONS - GENERAL FUND
SUMMARY OF PERSONAL SERVICE APPROPRIATIONS AND CHANGES 2011-12 RECOMMENDED
(dollars)
Total Personal Service Regular
(Annual Salaried) Program Amount Change Amount ChangeInspector General 5,131,000 (570,000) 5,124,000 (566,000) Total 5,131,000 (570,000) 5,124,000 (566,000)
Temporary Service
(Nonannual Salaried) Holiday/Overtime Pay
Program Amount Change Amount ChangeInspector General 4,000 (4,000) 3,000 0 Total 4,000 (4,000) 3,000 0

INSPECTOR GENERAL
190
STATE OPERATIONS - GENERAL FUND SUMMARY OF NONPERSONAL SERVICE AND MAINTENANCE UNDISTRIBUTED
APPROPRIATIONS AND CHANGES 2011-12 RECOMMENDED
(dollars) Total Supplies and Materials Program Amount Change Amount ChangeInspector General 393,000 (44,000) 20,000 (20,000) Total 393,000 (44,000) 20,000 (20,000) Travel Contractual Services Program Amount Change Amount ChangeInspector General 25,000 (15,000) 314,000 (3,000) Total 25,000 (15,000) 314,000 (3,000) Equipment Program Amount Change Inspector General 34,000 (6,000) Total 34,000 (6,000)
STATE OPERATIONS - OTHER THAN GENERAL FUND
SUMMARY OF APPROPRIATIONS AND CHANGES 2011-12 RECOMMENDED
(dollars) Total Nonpersonal Service Program Amount Change Amount ChangeInspector General 100,000 0 100,000 0 Total 100,000 0 100,000 0
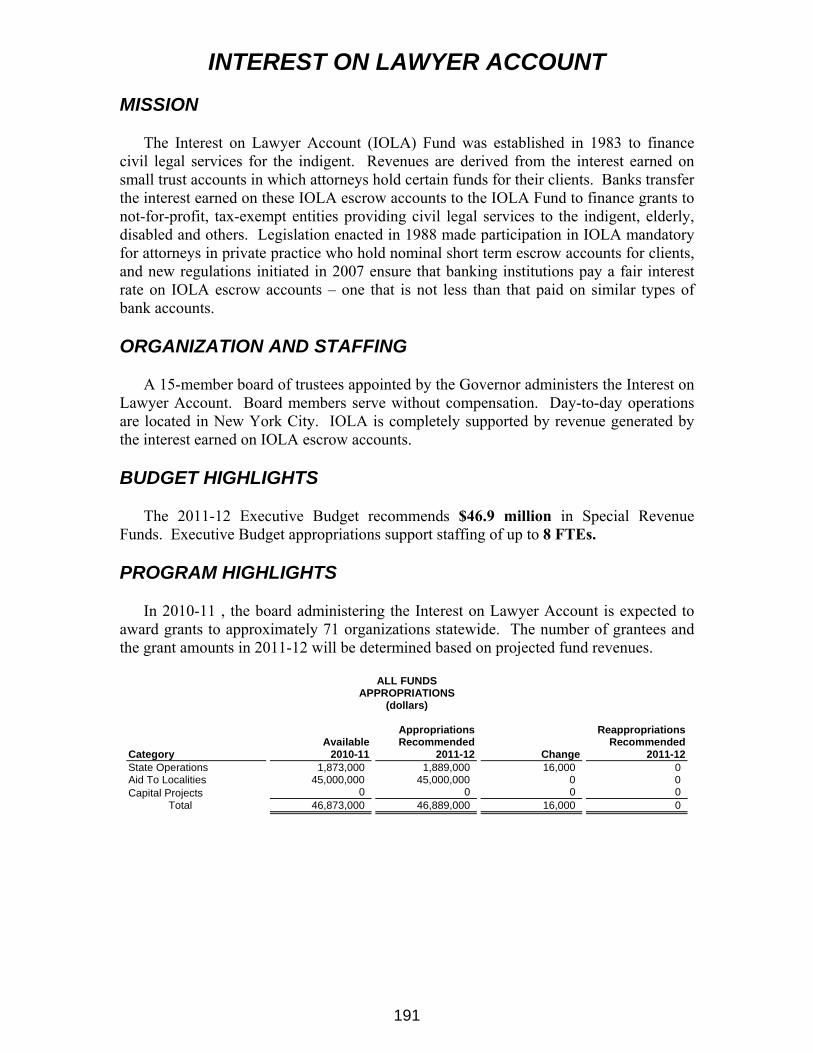
191
INTEREST ON LAWYER ACCOUNT MISSION The Interest on Lawyer Account (IOLA) Fund was established in 1983 to finance civil legal services for the indigent. Revenues are derived from the interest earned on small trust accounts in which attorneys hold certain funds for their clients. Banks transfer the interest earned on these IOLA escrow accounts to the IOLA Fund to finance grants to not-for-profit, tax-exempt entities providing civil legal services to the indigent, elderly, disabled and others. Legislation enacted in 1988 made participation in IOLA mandatory for attorneys in private practice who hold nominal short term escrow accounts for clients, and new regulations initiated in 2007 ensure that banking institutions pay a fair interest rate on IOLA escrow accounts – one that is not less than that paid on similar types of bank accounts. ORGANIZATION AND STAFFING A 15-member board of trustees appointed by the Governor administers the Interest on Lawyer Account. Board members serve without compensation. Day-to-day operations are located in New York City. IOLA is completely supported by revenue generated by the interest earned on IOLA escrow accounts. BUDGET HIGHLIGHTS The 2011-12 Executive Budget recommends $46.9 million in Special Revenue Funds. Executive Budget appropriations support staffing of up to 8 FTEs. PROGRAM HIGHLIGHTS In 2010-11 , the board administering the Interest on Lawyer Account is expected to award grants to approximately 71 organizations statewide. The number of grantees and the grant amounts in 2011-12 will be determined based on projected fund revenues.
ALL FUNDS APPROPRIATIONS
(dollars)
Category Available
2010-11
AppropriationsRecommended
2011-12 Change
ReappropriationsRecommended
2011-12State Operations 1,873,000 1,889,000 16,000 0 Aid To Localities 45,000,000 45,000,000 0 0 Capital Projects 0 0 0 0 Total 46,873,000 46,889,000 16,000 0

INTEREST ON LAWYER
192
ALL FUND TYPES PROJECTED LEVELS OF EMPLOYMENT BY PROGRAM
FILLED ANNUAL SALARIED POSITIONS Full-Time Equivalent Positions (FTE)
Program
2010-11Estimated FTEs
03/31/11
2011-12Estimated FTEs
03/31/12 FTE ChangeNew York Interest on Lawyer Account
Special Revenue Funds - Other 8 8 0 Total 8 8 0
The above table does not reflect layoffs that may be necessary in the absence of negotiated workforce savings.
STATE OPERATIONS
ALL FUNDS FINANCIAL REQUIREMENTS BY FUND TYPE APPROPRIATIONS
(dollars)
Fund Type Available
2010-11Recommended
2011-12 ChangeSpecial Revenue Funds - Other 1,873,000 1,889,000 16,000 Total 1,873,000 1,889,000 16,000
STATE OPERATIONS
ALL FUNDS FINANCIAL REQUIREMENTS BY PROGRAM APPROPRIATIONS
(dollars)
Program Available
2010-11Recommended
2011-12 ChangeNew York Interest on Lawyer Account
Special Revenue Funds - Other 1,873,000 1,889,000 16,000 Total 1,873,000 1,889,000 16,000
STATE OPERATIONS - OTHER THAN GENERAL FUND
SUMMARY OF APPROPRIATIONS AND CHANGES 2011-12 RECOMMENDED
(dollars) Total Personal Service Program Amount Change Amount ChangeNew York Interest on Lawyer Account 1,889,000 16,000 739,000 16,000 Total 1,889,000 16,000 739,000 16,000 Nonpersonal Service Program Amount Change New York Interest on Lawyer Account 1,150,000 0 Total 1,150,000 0
AID TO LOCALITIES
ALL FUNDS FINANCIAL REQUIREMENTS BY FUND TYPE APPROPRIATIONS
(dollars)
Fund Type Available
2010-11Recommended
2011-12 ChangeSpecial Revenue Funds - Other 45,000,000 45,000,000 0 Total 45,000,000 45,000,000 0

INTEREST ON LAWYER
193
AID TO LOCALITIES ALL FUNDS FINANCIAL REQUIREMENTS BY PROGRAM
APPROPRIATIONS (dollars)
Program Available
2010-11Recommended
2011-12 ChangeNew York Interest on Lawyer Account
Special Revenue Funds - Other 45,000,000 45,000,000 0 Total 45,000,000 45,000,000 0

194
JUDICIAL COMMISSIONS MISSION New York State’s three Judicial Commissions play important roles in maintaining the integrity of the court system. The Commission on Judicial Nomination and the Judicial Screening Committees screen potential nominees for high-level judicial appointments by the Governor. The Commission on Judicial Conduct investigates and acts upon allegations of judicial misconduct. COMMISSION ON JUDICIAL CONDUCT The State Constitution established the Commission on Judicial Conduct, which is responsible for investigating complaints of misconduct against State judges and local justices. The Commission has disciplinary powers, which include the authority to remove judges and justices from office for serious misconduct, subject to review by the Court of Appeals. The Commission on Judicial Conduct has 11 members, four of whom are appointed by the Governor, three by the Chief Judge of the Court of Appeals and the remaining four by the Legislature. Commission members serve without pay and meet periodically to consider complaints, hear testimony and determine the disposition of cases. Its main office is in New York City, with branches in Albany and Rochester. The recommended 2011-12 Executive Budget of $5.4 million General Fund is a decrease of $22,000, from the 2010-11 budget. COMMISSION ON JUDICIAL NOMINATION The State Constitution established the Commission on Judicial Nomination to evaluate candidates and make recommendations to the Governor for appointment to the Court of Appeals, the State’s highest court. The Commission on Judicial Nomination has 12 members appointed by the Governor, the Chief Judge of the Court of Appeals and the Legislature. These members serve without pay and conduct the search for qualified candidates upon formal notification of a vacancy on the Court of Appeals. The recommended 2011-12 Executive Budget provides $30,000 General Fund. GOVERNOR’S JUDICIAL SCREENING COMMITTEES The Governor’s Judicial Screening Committees are established by Executive Order to evaluate the qualifications of candidates and make recommendations to the Governor for appointment to judgeships other than those on the Court of Appeals. The Committees are located throughout the State. The recommended 2011-12 Executive Budget provides $38,000 in General Fund.

JUDICIAL
195
ALL FUNDS APPROPRIATIONS
(dollars)
Category Available
2010-11
AppropriationsRecommended
2011-12 Change
ReappropriationsRecommended
2011-12State Operations 5,474,000 5,452,000 (22,000) 0 Aid To Localities 0 0 0 0 Capital Projects 0 0 0 0 Total 5,474,000 5,452,000 (22,000) 0
ALL FUND TYPES
PROJECTED LEVELS OF EMPLOYMENT BY PROGRAM FILLED ANNUAL SALARIED POSITIONS
Full-Time Equivalent Positions (FTE)
Program
2010-11Estimated FTEs
03/31/11
2011-12Estimated FTEs
03/31/12 FTE ChangeJudicial Conduct
General Fund 48 48 0 Total 48 48 0
The above table does not reflect layoffs that may be necessary in the absence of negotiated workforce savings.
STATE OPERATIONS
ALL FUNDS FINANCIAL REQUIREMENTS BY FUND TYPE APPROPRIATIONS
(dollars)
Fund Type Available
2010-11Recommended
2011-12 ChangeGeneral Fund 5,474,000 5,452,000 (22,000) Total 5,474,000 5,452,000 (22,000)
STATE OPERATIONS
ALL FUNDS FINANCIAL REQUIREMENTS BY PROGRAM APPROPRIATIONS
(dollars)
Program Available
2010-11Recommended
2011-12 ChangeJudicial Conduct
General Fund 5,406,000 5,384,000 (22,000) Judicial Nomination, Commission on
General Fund 30,000 30,000 0 Judicial Screening Committees
General Fund 38,000 38,000 0 Total 5,474,000 5,452,000 (22,000)

JUDICIAL
196
STATE OPERATIONS - GENERAL FUND SUMMARY OF PERSONAL SERVICE APPROPRIATIONS AND CHANGES
2011-12 RECOMMENDED (dollars)
Total Personal Service Regular
(Annual Salaried) Program Amount Change Amount ChangeJudicial Conduct 4,093,000 0 4,073,000 0 Judicial Screening Committees 13,000 0 13,000 0 Total 4,106,000 0 4,086,000 0
Temporary Service
(Nonannual Salaried) Program Amount Change Judicial Conduct 20,000 0 Judicial Screening Committees 0 0 Total 20,000 0
STATE OPERATIONS - GENERAL FUND
SUMMARY OF NONPERSONAL SERVICE AND MAINTENANCE UNDISTRIBUTED APPROPRIATIONS AND CHANGES
2011-12 RECOMMENDED (dollars)
Total Supplies and Materials Program Amount Change Amount ChangeJudicial Conduct 1,291,000 (22,000) 51,000 (4,000)Judicial Nomination, Commission on 30,000 0 0 0 Judicial Screening Committees 25,000 0 0 0 Total 1,346,000 (22,000) 51,000 (4,000) Travel Contractual Services Program Amount Change Amount ChangeJudicial Conduct 100,000 (3,000) 1,085,000 27,000 Judicial Nomination, Commission on 30,000 0 0 0 Judicial Screening Committees 10,000 0 15,000 0 Total 140,000 (3,000) 1,100,000 27,000 Equipment Program Amount Change Judicial Conduct 55,000 (42,000) Judicial Nomination, Commission on 0 0 Judicial Screening Committees 0 0 Total 55,000 (42,000)

197
DEPARTMENT OF LABOR MISSION The Department of Labor (DOL) administers New York’s Unemployment Insurance system, Workforce Development Employment and Training system and State worker protection programs, including enforcement of safety and health regulations in the public sector, State labor laws and Federal statutes related to working conditions, wages and hours, and laws related to public work. The Department is a primary advocate for job creation and economic growth through workforce development, and serves as the State’s principal source for labor market information, offering a variety of services designed to help businesses find workers and people find jobs. ORGANIZATION AND STAFFING The Department is headed by a Commissioner, appointed by the Governor and subject to confirmation by the Senate, with a central office located in Albany. This office is responsible for two Unemployment Insurance Telephone Claims Centers and 76 One-Stop Career Centers located throughout the State. In addition, through nine worker protection district offices, the Department enforces child labor laws, fosters workplace health and safety, and ensures that employees are paid in accordance with provisions of the Labor Law. Offices are staffed based upon the workload in each geographic area. BUDGET HIGHLIGHTS The Executive Budget recommends $9.2 billion All Funds ($9 billion Other Funds, including $8.4 billion Enterprise Fund) for the Department of Labor. This is a decrease of $1.6 billion All Funds (-14.9 percent) from the 2010-11 budget, reflecting the non-recurrence of one-time Federal American Recovery and Reinvestment Act (ARRA) appropriations. Major budget actions include:
Continuation of ARRA Programs: The budget recommends $3.3 billion in new appropriations and $158.8 million in reappropriation authority to allow the Department to fully disburse ARRA-related Workforce Investment Act and Unemployment Insurance program funding.
Unemployment Insurance Systems Modernization: Federal grant funding received by DOL will support the Department’s Unemployment Insurance computer systems modernization efforts. Appropriations totaling $6.8 million are recommended for this project.
PROGRAM HIGHLIGHTS JOB SERVICES Consistent with the requirements of the Federal Workforce Investment Act, the Department of Labor and local governments work together at local One-Stop Centers and affiliated sites across the State that offer access to a variety of employment services including job referral and placement, education and training, resume preparation, employer services, human resources consultation, and support services such as child care
LABOR
198
and transportation. The Centers benefit employers by providing them with access to worker resumes and information about tax credits, workplace safety issues and apprenticeship services. Through the use of job orders, online forms, electronic job banks and talent banks available through the Internet, the Department of Labor has made it easier for job seekers and employers to use and benefit from DOL services and to immediately access relevant information without direct assistance from Department staff. In addition to partnering in One-Stop Centers across the State, the Department continues to work with other State and local agencies, community colleges and others to ensure that New York’s workforce development system provides access to information and services across agency lines regardless of where a person may initially go for assistance. WORKFORCE INVESTMENT ACT Federally funded appropriation authority includes $234 million for Workforce Investment Act (WIA) services, which provide job training to youth, adults and dislocated workers. WIA funding also supports programs to upgrade the skills of those currently working, thus helping employers meet the changing needs of their business operations. Eligible participants access WIA services through the network of local One-Stop Centers for the delivery of employment and training services. WIA also improves customer choice and program effectiveness, as participants can choose training providers based on past performance through the use of individual training accounts. Continuing trends that began in 2008 with the downturn in the economy, the number of WIA customers in the Department’s workforce development system increased by 9 percent in 2009 to 800,374, with the dislocated workers component of the total increasing by 32 percent. WORKER PROTECTION Worker Protection functions are carried out by two Department of Labor programs: Occupational Safety and Health and Labor Standards/Public Work. The Occupational Safety and Health program is responsible for health and safety inspections and granting licenses to qualified persons to operate or handle dangerous equipment or substances. Statistics for the last two completed State fiscal years show that the Division inspected 17,687 amusement park devices, 840 ski lifts, 4,730 places of public assembly (e.g., bleachers at concerts) and 32,964 commercial boilers. It also reviewed applications for 54,472 asbestos licenses and certificates. The Labor Standards program enforces the Labor Law in such areas as minimum and prevailing wage, child labor and garment industry registration. During 2009, the Department’s Labor Standards Division inspected 138 businesses for compliance with child labor laws and the Division, together with the Bureau of Public Work, and collected a record total of $28.8 million in back wages, unpaid and underpaid prevailing wage monies, unpaid fringe benefits, and minimum wage underpayments for approximately 18,000 employees. In 2010, Labor Standards inspected 168 businesses for compliance with child labor laws and the two programs collected a total of $25.7 million of underpaid wages from employers for 21,000 workers. The Bureau of Immigrant Workers’ Rights, established within the Department in 2007-08, will continue to detect and address abuses against immigrant workers throughout New York State.

LABOR
199
Through coordinated audit and investigative activities, the Governor’s Joint Enforcement Task Force on Employee Misclassification is aimed at employers who intentionally mislabel workers as independent contractors instead of employees, or pay them “off the books,” to avoid employee-related costs. Misclassification puts law-abiding businesses at a competitive disadvantage, since they must bear the expense of providing these benefits, while those who skirt the law bear no such costs. Since its establishment in September 2007, the enforcement and data sharing activities of the Task Force have identified more than 44,600 instances of employee misclassification and over $607 million in unreported wages, resulting in the assessment of over $18 million in UI taxes due, over $1.7 million in UI fraud penalties, and over $15 million in unpaid wages. In addition, unreported wage information provided to the Department of Taxation and Finance is expected to result in increased State and Federal income tax payments. UNEMPLOYMENT INSURANCE The Unemployment Insurance program makes weekly payments to eligible unemployed workers who have lost a job through no fault of their own. These temporary payments, generally available for up to 26 weeks, help workers and their families pay bills and buy basic household items while looking for work. The Department also operates a re-employment services program to further strengthen efforts to move individuals back to work. In June 2008, the Federal Extended Unemployment Compensation Program (EUC08) was enacted. It provides an additional 13 weeks of benefits to eligible claimants who have exhausted their regular Unemployment Insurance benefits. Since the inception of EUC08, various Federal legislation has been enacted to add additional weeks of EUC08 benefits, to provide a weekly $25 Federal Additional Compensation (FAC) benefit payment, to authorize Federal reimbursement for the Extended Benefits (EB) program, and to extend the eligibility date for EUC08, FAC, and EB. Based on current legislation, a maximum total of 93 weeks of regular, EUC08 and EB benefits are available to eligible claimants, with payments continuing into the first quarter of 2012-13. In calendar year 2009, 28 million weekly benefit payments totaling $9.2 billion were made. During calendar year 2010, as of December 17, 2010, - the high workload experienced in calendar year 2009 continued with the Department making 30 million weekly benefit payments totaling $9.0 billion in combined regular and extended UI benefit payments - compared to 11.7 million payments totaling $3.4 billion paid in calendar year 2008. As of December 2009, there were 611,000 claimants receiving weekly UI benefit payments, and as of December 10, 2010, there were 546,000 claimants receiving weekly benefit payments, - compared to 140,000 in December 2007. As part of a continuing effort to make government more efficient, the Department of Labor operates a telephone claims system that uses computer technology and information received to determine if applicants are eligible to receive Unemployment Insurance benefits and to handle all other processing issues related to an individual’s benefits. The system, which operates through two Tele-Claims Centers located in Troy and Endicott, replaced a process which required DOL staff to determine eligibility from paper forms filled out by applicants at local Department of Labor offices. The Department currently accepts Unemployment Insurance claims and employer registration through the Internet, with recent statistics indicating 70 percent internet usage for original and continued claims, up from 65 percent in 2009. In addition, over 50 percent of current UI claims initiated on the Internet are completed without the assistance of a call center agent.

LABOR
200
The Department offers two secure and convenient options for receiving benefit payments: Unemployment Insurance benefit payment debit cards, known as Direct Payment Cards, and the Direct Deposit program. These modernization initiatives have resulted in improved customer access and cost efficiencies.
ALL FUNDS APPROPRIATIONS
(dollars)
Category Available
2010-11
AppropriationsRecommended
2011-12 Change
ReappropriationsRecommended
2011-12State Operations 10,638,548,000 9,048,595,000 (1,589,953,000) 2,284,869,456 Aid To Localities 227,565,000 192,869,000 (34,696,000) 417,123,000 Capital Projects 0 0 0 0 Total 10,866,113,000 9,241,464,000 (1,624,649,000) 2,701,992,456
ALL FUND TYPES
PROJECTED LEVELS OF EMPLOYMENT BY PROGRAM FILLED ANNUAL SALARIED POSITIONS
Full-Time Equivalent Positions (FTE)
Program
2010-11Estimated FTEs
03/31/11
2011-12Estimated FTEs
03/31/12 FTE ChangeAdministration
Special Revenue Funds - Federal 3,389 3,417 28 Employment and Training
Special Revenue Funds - Other 54 54 0 Labor Standards
Special Revenue Funds - Other 249 249 0 Occupational Safety and Health
Special Revenue Funds - Other 257 257 0 Total 3,949 3,977 28
The above table does not reflect layoffs that may be necessary in the absence of negotiated workforce savings.
STATE OPERATIONS
ALL FUNDS FINANCIAL REQUIREMENTS BY FUND TYPE APPROPRIATIONS
(dollars)
Fund Type Available
2010-11Recommended
2011-12 ChangeSpecial Revenue Funds - Federal 543,968,000 574,015,000 30,047,000 Special Revenue Funds - Other 74,580,000 74,580,000 0 Enterprise Funds 10,020,000,000 8,400,000,000 (1,620,000,000) Total 10,638,548,000 9,048,595,000 (1,589,953,000) Adjustments: Transfer(s) From
Labor, Department of Special Revenue Funds - Other (20,000,000)
Special Pay Bill Special Revenue Funds - Federal (333,000)
Transfer(s) To Labor, Department of
Special Revenue Funds - Federal (Aid To Localities) 1,948,000
Enterprise Funds 20,000,000 Appropriated 2010-11 10,640,163,000

LABOR
201
STATE OPERATIONS ALL FUNDS FINANCIAL REQUIREMENTS BY PROGRAM
APPROPRIATIONS (dollars)
Program Available
2010-11Recommended
2011-12 ChangeAdministration
Special Revenue Funds - Federal 495,907,000 495,907,000 0 Employment and Training
Special Revenue Funds - Federal 26,228,000 56,608,000 30,380,000 Special Revenue Funds - Other 4,644,000 4,644,000 0
Labor Standards Special Revenue Funds - Other 28,016,000 28,016,000 0
Occupational Safety and Health Special Revenue Funds - Other 41,920,000 41,920,000 0
Unemployment Insurance Benefit Fund Special Revenue Funds - Federal 21,833,000 21,500,000 (333,000) Enterprise Funds 10,020,000,000 8,400,000,000 (1,620,000,000)
Total 10,638,548,000 9,048,595,000 (1,589,953,000)
STATE OPERATIONS - OTHER THAN GENERAL FUND
SUMMARY OF APPROPRIATIONS AND CHANGES 2011-12 RECOMMENDED
(dollars) Total Personal Service Program Amount Change Amount ChangeAdministration 495,907,000 0 235,281,000 0 Employment and Training 61,252,000 30,380,000 19,660,000 0 Labor Standards 28,016,000 0 16,104,000 (484,000)Occupational Safety and Health 41,920,000 0 18,720,000 (620,000)Unemployment Insurance Benefit Fund 8,421,500,000 (1,620,333,000) 0 (223,000) Total 9,048,595,000 (1,589,953,000) 289,765,000 (1,327,000) Nonpersonal Service Program Amount Change Administration 260,626,000 0 Employment and Training 41,592,000 30,380,000 Labor Standards 11,912,000 484,000 Occupational Safety and Health 23,200,000 620,000 Unemployment Insurance Benefit Fund 8,421,500,000 (1,620,110,000) Total 8,758,830,000 (1,588,626,000)
AID TO LOCALITIES
ALL FUNDS FINANCIAL REQUIREMENTS BY FUND TYPE APPROPRIATIONS
(dollars)
Fund Type Available
2010-11Recommended
2011-12 ChangeSpecial Revenue Funds - Federal 227,135,000 192,439,000 (34,696,000) Special Revenue Funds - Other 430,000 430,000 0 Total 227,565,000 192,869,000 (34,696,000) Adjustments: Transfer(s) From
Labor, Department of Special Revenue Funds - Federal
(State Operations) (1,948,000) Appropriated 2010-11 225,617,000

LABOR
202
AID TO LOCALITIES ALL FUNDS FINANCIAL REQUIREMENTS BY PROGRAM
APPROPRIATIONS (dollars)
Program Available
2010-11Recommended
2011-12 ChangeAdministration
Special Revenue Funds - Federal 11,608,000 15,000,000 3,392,000 Employment and Training
Special Revenue Funds - Federal 215,527,000 177,439,000 (38,088,000) Occupational Safety and Health
Special Revenue Funds - Other 430,000 430,000 0 Total 227,565,000 192,869,000 (34,696,000)

203
DEPARTMENT OF LAW MISSION The Department of Law was created in 1926 and is headed by the State Attorney General, who is elected by the people. The Department is responsible for protecting the legal rights of New York State and its citizens by representing the State in litigation and in other legal affairs. In implementing its constitutional responsibilities, the Department performs a wide range of functions. Major activities of the Department include prosecuting or defending actions and proceedings for or against the State and its departments; prosecuting certain criminal violations of the Labor, Workers’ Compensation and Unemployment Insurance laws; investigating and prosecuting other criminal cases at the request of the Governor or the commissioners of State departments; investigating the activities of organized crime; bringing civil and/or criminal actions against polluters, violators of antitrust laws and those who defraud consumers or investors; mediating consumer complaints; and investigating and prosecuting cases of Medicaid fraud. ORGANIZATION AND STAFFING The legal functions and administrative functions of the Department of Law are divided into eight major divisions: Administration, Appeals and Opinions, Counsel for the State, Criminal Justice, Economic Justice, Investigations, Social Justice and Regional Offices. Each division consists of smaller bureaus or specialized units dealing with specific issues. The Department’s main offices are located in Albany and New York City, with regional offices in Binghamton, Poughkeepsie, Syracuse, Buffalo, Plattsburgh, Rochester, Watertown, Mineola, Hauppauge, Harlem, Utica, Brooklyn, and White Plains. BUDGET HIGHLIGHTS The Executive Budget recommends $209 million All Funds ($101.4 million General Fund; $34.8 million Federal Funds; $72.8 million Other Funds) for the Department of Law. This is a decrease of $1 million (-0.5 percent) from 2010-11. This decrease is the net result of a 10 percent ($11.3 million) decrease in the General Fund, a $1 million decrease in Federal Funds, and an increase of $11.3 million in Other Funds. Executive Budget appropriations support a workforce of up to 1,747 FTEs. PROGRAM HIGHLIGHTS Agency divisions perform the following functions:
The Administration Division provides budget, personnel, operations and technology services for the Department.
The Division of Appeals and Opinions handles appellate litigation in both State and Federal courts. The Division also prepares opinions, both formal and informal, interpreting State laws for State agencies and municipalities.
The Criminal Justice Division investigates and prosecutes criminal cases, including those involving Medicaid fraud, auto insurance fraud, white collar and organized crime cases involving multi-county, multi-state and even multi-national criminal activities occurring within New York State.

LAW
204
The Investigations Division provides investigative support for legal divisions throughout the Department, and works cooperatively with State, local and Federal law enforcement agencies on cases that cross jurisdictional lines.
The Division of State Counsel provides State agencies, the Governor, other State officials and the Legislature with counsel and representation in legal proceedings. It recoups non tax revenue on behalf of State taxpayers and provides legal assistance to State agencies in connection with the acquisition and disposition of public land.
The Division of Economic Justice defends and protects the public interest in the courts. It enforces laws to prevent restraint of trade, protects consumers from fraudulent and/or deceptive business practices, regulates the sale of securities, and addresses people’s concerns about criminal online activities.
The Division of Social Justice also defends and protects the public interest in the courts. It ensures compliance with the State’s health care and environmental laws, enforces State Labor and Workers’ Compensation Laws, protects charitable donors and beneficiaries, and enforces laws prohibiting discrimination.
The Regional Offices’ Division provides satellite offices across the State to ensure that all New York agencies have cost-effective representation in all local and Federal courts, and that citizens have full access to the programs and services of the Department.
ALL FUNDS
APPROPRIATIONS (dollars)
Category Available
2010-11
AppropriationsRecommended
2011-12 Change
ReappropriationsRecommended
2011-12State Operations 210,026,000 209,020,000 (1,006,000) 26,655,000 Aid To Localities 0 0 0 0 Capital Projects 0 0 0 0 Total 210,026,000 209,020,000 (1,006,000) 26,655,000

LAW
205
ALL FUND TYPES PROJECTED LEVELS OF EMPLOYMENT BY PROGRAM
FILLED ANNUAL SALARIED POSITIONS Full-Time Equivalent Positions (FTE)
Program
2010-11Estimated FTEs
03/31/11
2011-12Estimated FTEs
03/31/12 FTE ChangeAdministration
General Fund 170 170 0 Appeals and Opinions
General Fund 56 56 0 Counsel for the State
General Fund 355 355 0 Special Revenue Funds - Other 211 211 0
Criminal Investigations General Fund 95 95 0
Economic Justice General Fund 126 126 0 Special Revenue Funds - Other 14 14 0
Social Justice General Fund 136 136 0 Capital Projects Funds - Other 7 7 0
Criminal Justice General Fund 82 82 0 Special Revenue Funds - Other 68 68 0
Medicaid Fraud Control Special Revenue Funds - Federal 222 222 0 Special Revenue Funds - Other 74 74 0
Regional Offices General Fund 131 131 0
Total 1,747 1,747 0
The above table does not reflect layoffs that may be necessary in the absence of negotiated workforce savings.
STATE OPERATIONS
ALL FUNDS FINANCIAL REQUIREMENTS BY FUND TYPE APPROPRIATIONS
(dollars)
Fund Type Available
2010-11Recommended
2011-12 ChangeGeneral Fund 112,641,000 101,381,000 (11,260,000) Special Revenue Funds - Federal 35,820,000 34,820,000 (1,000,000) Special Revenue Funds - Other 61,565,000 72,819,000 11,254,000 Total 210,026,000 209,020,000 (1,006,000)

LAW
206
STATE OPERATIONS ALL FUNDS FINANCIAL REQUIREMENTS BY PROGRAM
APPROPRIATIONS (dollars)
Program Available
2010-11Recommended
2011-12 ChangeAdministration
General Fund 15,036,000 13,533,000 (1,503,000) Appeals and Opinions
General Fund 5,786,000 5,207,000 (579,000) Counsel for the State
General Fund 35,810,000 32,229,000 (3,581,000) Special Revenue Funds - Other 46,530,000 57,997,000 11,467,000
Criminal Investigations General Fund 9,743,000 8,769,000 (974,000)
Economic Justice General Fund 11,276,000 10,149,000 (1,127,000) Special Revenue Funds - Other 977,000 977,000 0
Social Justice General Fund 13,075,000 11,768,000 (1,307,000)
Criminal Justice General Fund 7,324,000 6,594,000 (730,000) Special Revenue Funds - Other 2,000,000 2,000,000 0
Medicaid Fraud Control Special Revenue Funds - Federal 35,820,000 34,820,000 (1,000,000) Special Revenue Funds - Other 12,058,000 11,845,000 (213,000)
Regional Offices General Fund 14,591,000 13,132,000 (1,459,000)
Total 210,026,000 209,020,000 (1,006,000)
STATE OPERATIONS - GENERAL FUND
SUMMARY OF PERSONAL SERVICE APPROPRIATIONS AND CHANGES 2011-12 RECOMMENDED
(dollars)
Total Personal Service Regular
(Annual Salaried) Program Amount Change Amount ChangeAdministration 10,821,000 (1,203,000) 10,395,000 (1,155,000)Appeals and Opinions 4,599,000 (511,000) 4,598,000 (511,000)Counsel for the State 26,616,000 (2,957,000) 26,603,000 (2,956,000)Criminal Investigations 8,393,000 (932,000) 8,192,000 (910,000)Economic Justice 9,951,000 (1,105,000) 9,940,000 (1,104,000)Social Justice 11,570,000 (1,285,000) 11,540,000 (1,282,000)Criminal Justice 6,430,000 (713,000) 6,295,000 (699,000)Regional Offices 10,146,000 (1,128,000) 10,132,000 (1,126,000) Total 88,526,000 (9,834,000) 87,695,000 (9,743,000)
Temporary Service
(Nonannual Salaried) Holiday/Overtime Pay
Program Amount Change Amount ChangeAdministration 402,000 (45,000) 24,000 (3,000)Appeals and Opinions 0 0 1,000 0 Counsel for the State 0 0 13,000 (1,000)Criminal Investigations 0 0 201,000 (22,000)Economic Justice 0 0 11,000 (1,000)Social Justice 0 0 30,000 (3,000)Criminal Justice 49,000 (5,000) 86,000 (9,000)Regional Offices 0 0 14,000 (2,000) Total 451,000 (50,000) 380,000 (41,000)

LAW
207
STATE OPERATIONS - GENERAL FUND SUMMARY OF NONPERSONAL SERVICE AND MAINTENANCE UNDISTRIBUTED
APPROPRIATIONS AND CHANGES 2011-12 RECOMMENDED
(dollars) Total Supplies and Materials Program Amount Change Amount ChangeAdministration 2,712,000 (300,000) 1,589,000 (176,000)Appeals and Opinions 608,000 (68,000) 0 0 Counsel for the State 5,613,000 (624,000) 0 0 Criminal Investigations 376,000 (42,000) 0 0 Economic Justice 198,000 (22,000) 0 0 Social Justice 198,000 (22,000) 0 0 Criminal Justice 164,000 (17,000) 5,000 0 Regional Offices 2,986,000 (331,000) 0 0 Total 12,855,000 (1,426,000) 1,594,000 (176,000) Travel Contractual Services Program Amount Change Amount ChangeAdministration 102,000 (11,000) 876,000 (97,000)Appeals and Opinions 0 0 608,000 (68,000)Counsel for the State 133,000 (15,000) 5,480,000 (609,000)Criminal Investigations 91,000 (10,000) 285,000 (32,000)Economic Justice 0 0 198,000 (22,000)Social Justice 0 0 198,000 (22,000)Criminal Justice 77,000 (8,000) 82,000 (9,000)Regional Offices 139,000 (15,000) 2,847,000 (316,000) Total 542,000 (59,000) 10,574,000 (1,175,000) Equipment Program Amount Change Administration 145,000 (16,000) Appeals and Opinions 0 0 Counsel for the State 0 0 Criminal Investigations 0 0 Economic Justice 0 0 Social Justice 0 0 Criminal Justice 0 0 Regional Offices 0 0 Total 145,000 (16,000)
STATE OPERATIONS - OTHER THAN GENERAL FUND
SUMMARY OF APPROPRIATIONS AND CHANGES 2011-12 RECOMMENDED
(dollars) Total Personal Service Program Amount Change Amount ChangeCounsel for the State 57,997,000 11,467,000 12,167,000 2,256,000 Economic Justice 977,000 0 589,000 0 Criminal Justice 2,000,000 0 0 0 Medicaid Fraud Control 46,665,000 (1,213,000) 25,632,000 0 Total 107,639,000 10,254,000 38,388,000 2,256,000 Nonpersonal Service Program Amount Change Counsel for the State 45,830,000 9,211,000 Economic Justice 388,000 0 Criminal Justice 2,000,000 0 Medicaid Fraud Control 21,033,000 (1,213,000) Total 69,251,000 7,998,000

208
DIVISION OF THE LOTTERY MISSION In 1966, New Yorkers approved a constitutional amendment to authorize a State Lottery in support of education. The Division of the Lottery raises revenue through the sale and marketing of Lottery games. ORGANIZATION AND STAFFING The Division of the Lottery is an independent unit of the Department of Taxation and Finance, whose Commissioner appoints the Director of the Lottery. The Division maintains a central office in Schenectady, regional offices in Buffalo, Syracuse, New York City and Long Island, a satellite office in Fishkill to serve the Hudson Valley, and a customer service center in Rochester. Marketing sales representatives, assigned to the regional offices around the State, recruit and support point-of-sale retailers, which include convenience stores, newsstands, supermarkets, restaurants and bowling centers. BUDGET HIGHLIGHTS The Executive Budget recommends $89.7 million All Funds for the Division of the Lottery. This is a decrease of $5.6 million (-5.9 percent) in All Funds from the 2010-11 budget, primarily reflecting achieved savings in nonpersonal services expenditures. Lottery is continuing to achieve reductions through a successful contract negotiation with its full service contractor, who provides services for both draw and instant games. The Executive Budget recommends a staffing level of 369 FTEs for the Division of the Lottery. This level reflects an increase of 50 FTEs to enable Lottery to implement much needed revenue enhancements to help close the State budget gap. In addition, the Division will implement measures to improve efficiency of Lottery sales. The Executive Budget proposes legislation that will remove location restrictions on the Quick Draw game, expand subsidized free play offerings at video gaming facilities, and allow for increased prize payouts on multi-jurisdictional and instant games. PROGRAM HIGHLIGHTS The Division of the Lottery sells games through approximately 17,000 licensed retailers and soon to be nine licensed video gaming facilities across New York State. The Lottery offers three distinct products: 1) Draw games, such as Numbers, Win 4, Pick 10, Take 5, Quick Draw, Lotto, Sweet Million, Mega Millions, and Powerball, 2) Instant scratch-off games, and 3) Video Lottery games. Draw games are conducted multiple times per day, daily, or twice weekly, depending on the game. Players try to win prizes by matching their selected numbers to those drawn by the Lottery. Quick Draw, first introduced in 1995, draws random numbers electronically on a central computer system every four minutes. Quick Draw is displayed at approximately 3,600 licensed retailers statewide, such as restaurants, OTB’s, and bowling centers. Pursuant to legislation enacted in 2001, the Lottery entered into an agreement with nine other states to create the multi-state Lottery game called Mega Millions. Mega Millions’ first drawing in New York occurred on May 17, 2002. Currently, 12 states participate in Mega Millions including New York, California, Georgia, Illinois, Maryland, Massachusetts, Michigan, New Jersey, Ohio, Texas,

LOTTERY
209
Virginia, and Washington. In 2009-10, the Mega Millions consortium reached an agreement with the Multi-State Lottery Association (MUSL) to cross-sell Mega Millions and Powerball, allowing New York to sell the Powerball game and expanding the number of jurisdictions offering each game to 44. Powerball was offered for the first time in New York in February 2010. Instant scratch-off games are played by instantly revealing pre-selected characters and prizes on a game ticket. Instant games have contributed significantly to the growth of Lottery revenues. The Lottery will market approximately 30 to 40 new Instant games during 2011-12, with ticket prices ranging from $1 to $30. Video Lottery games are played on video lottery terminals (VLTs) and electronic table games (ETG) which interact with a central gaming system. Video lottery gaming was authorized in 2001 by legislation enacted to broaden the Lottery gaming opportunities in New York State. This legislation permitted the installation of VLTs at horse racing facilities across the State. Eight racetracks currently offer video lottery gaming: Batavia Downs Casino, Hamburg Casino at the Fairgrounds, Finger Lakes Casino & Racetrack, Monticello Casino & Raceway, Saratoga Gaming & Raceway, Tioga Downs Casino, Vernon Downs Casino, and Empire City Casino at Yonkers Raceway, with a ninth location to be opened soon, Resorts World New York, located at Aqueduct Racetrack. The 2011-12 Executive Budget provides funds necessary for the Lottery to administer, operate, and market traditional Lottery games for the coming fiscal year. The 2011-12 Executive Budget also provides the necessary funding for the video lottery program’s continued operation and implementation.
ALL FUNDS APPROPRIATIONS
(dollars)
Category Available
2010-11
AppropriationsRecommended
2011-12 Change
ReappropriationsRecommended
2011-12State Operations 95,310,700 89,704,000 (5,606,700) 0 Aid To Localities 0 0 0 0 Capital Projects 0 0 0 0 Total 95,310,700 89,704,000 (5,606,700) 0
ALL FUND TYPES
PROJECTED LEVELS OF EMPLOYMENT BY PROGRAM FILLED ANNUAL SALARIED POSITIONS
Full-Time Equivalent Positions (FTE)
Program
2010-11Estimated FTEs
03/31/11
2011-12Estimated FTEs
03/31/12 FTE ChangeAdministration of the Lottery Program
Special Revenue Funds - Other 297 309 12 Administration of the VLT Program
Special Revenue Funds - Other 22 60 38 Total 319 369 50
The above table does not reflect layoffs that may be necessary in the absence of negotiated workforce savings.

LOTTERY
210
STATE OPERATIONS ALL FUNDS FINANCIAL REQUIREMENTS BY FUND TYPE
APPROPRIATIONS (dollars)
Fund Type Available
2010-11Recommended
2011-12 ChangeSpecial Revenue Funds - Other 95,310,700 89,704,000 (5,606,700) Total 95,310,700 89,704,000 (5,606,700)
STATE OPERATIONS
ALL FUNDS FINANCIAL REQUIREMENTS BY PROGRAM APPROPRIATIONS
(dollars)
Program Available
2010-11Recommended
2011-12 ChangeAdministration of the Lottery Program
Special Revenue Funds - Other 84,476,800 80,052,000 (4,424,800) Administration of the VLT Program
Special Revenue Funds - Other 10,833,900 9,652,000 (1,181,900) Total 95,310,700 89,704,000 (5,606,700)
STATE OPERATIONS - OTHER THAN GENERAL FUND
SUMMARY OF APPROPRIATIONS AND CHANGES 2011-12 RECOMMENDED
(dollars) Total Personal Service Program Amount Change Amount ChangeAdministration of the Lottery Program 80,052,000 (4,424,800) 21,189,000 1,101,300 Administration of the VLT Program 9,652,000 (1,181,900) 3,313,000 649,000 Total 89,704,000 (5,606,700) 24,502,000 1,750,300 Nonpersonal Service Program Amount Change Administration of the Lottery Program 58,863,000 (5,526,100) Administration of the VLT Program 6,339,000 (1,830,900) Total 65,202,000 (7,357,000)

211
DEPARTMENT OF MENTAL HYGIENE The Department of Mental Hygiene operates through three independent agencies – the Office of Mental Health, the Office for People With Developmental Disabilities, and the Office of Alcoholism and Substance Abuse Services. All three agencies provide services directly to their clients through State-operated facilities and receive reimbursement for these services, primarily with Medicaid funds. Patient revenues in the Patient Income Account are pledged first to the payment of debt service on outstanding Mental Hygiene bonds. The recommended $600 million in new appropriations from the Patient Income Account and the Mental Hygiene Program Fund may be distributed to any of the three agencies in order to access additional revenues made available or through a decreased set-aside for debt service resulting from planned debt management actions.
ALL FUNDS APPROPRIATIONS
(dollars)
Category Available
2010-11
AppropriationsRecommended
2011-12 Change
ReappropriationsRecommended
2011-12State Operations 600,000,000 600,000,000 0 0 Aid To Localities 0 0 0 0 Capital Projects 0 0 0 0 Total 600,000,000 600,000,000 0 0

212
OFFICE OF ALCOHOLISM AND SUBSTANCE ABUSE SERVICES
MISSION The mission of the Office of Alcoholism and Substance Abuse Services (OASAS) is to improve the lives of New Yorkers by leading a premier system of addiction services through prevention, treatment, and recovery. ORGANIZATION AND STAFFING Headed by a Commissioner appointed by the Governor, subject to Senate confirmation, OASAS is responsible for the development and management of the State’s policy on chemical dependence and problem gambling. The Office exercises these responsibilities directly as a provider of treatment services through a statewide system of Addiction Treatment Centers (ATCs), through the regulation and oversight of over 1,550 chemical dependence and problem gambling prevention, treatment, and recovery service providers, and as a conduit for Federal and State financial assistance. The Office also furthers State policy goals in areas that include Public Safety, Public Health, Public Welfare, and Public Education by coordinating chemical dependence and problem gambling resources and strategies in collaboration with other State agencies through the Addictions Collaborative to Improve Outcomes for New Yorkers (ACTION). BUDGET HIGHLIGHTS The 2011-12 Executive Budget recommends nearly $671 million All Funds ($432 million State Operating Funds; $239 million Other Funds) for OASAS, which represents a decrease of $46 million (-6.4 percent), which is largely attributable to the actions summarized below. The Executive Budget reduces each agency’s General Fund State Operations budget by 10 percent. These savings are intended to be achieved through administrative efficiencies in non-personal service and negotiated workforce savings that minimize layoffs to the extent possible. In addition to 10 percent reductions in State operations, major new actions to promote cost efficiency include:
Deferring Cost-of-Living Adjustment (COLA). Defer the planned 1.2 percent human services COLA for one year. However, to continue the State’s long-term commitment, a three-year human services COLA is planned to commence April 1, 2012 and continue through the 2014-15 fiscal year.
Refocusing and Redesigning Programs and Services. Reduce funding for OASAS programs that fail to meet established performance indicators; reduce and restructure 41 existing gambling education, assessment and referral programs; delay the development of five gambling prevention programs and three Recovery Community Centers; and eliminate planned new funding for additional re-entry services. The 1.1 percent reduction to local payments implemented in 2010-11 is also continued.

ALCOHOLISM AND SUBSTANCE ABUSE SERVICES
213
Providing Services under Drug Law Reform. Continue the current year levels of funding for OASAS costs related to recent drug law reforms, including maintaining 250 residential beds added in 2010-11. As a result, services for this population will be supported within existing OASAS capacity by enhanced performance and the prioritization of services.
PROGRAM HIGHLIGHTS OASAS administers a comprehensive array of prevention, treatment, and recovery services for New Yorkers. This is accomplished through a highly qualified network of State, local government, voluntary agency, and school district providers with a paid and volunteer workforce of 35,000. In accordance with Federal and State statute, OASAS licenses and regulates program providers, ensures that fiscal resources are appropriately spent, and assists local programs in providing the highest quality services. Approximately 260,000 individuals receive services annually in New York State’s licensed chemical dependence treatment and problem gambling system, which is provided by approximately 1,100 community-based programs. About 107,000 individuals are enrolled in New York’s chemical dependence treatment programs on any given day. OASAS also provides funding to approximately 300 prevention providers located in over 2,800 sites, combined with an additional 114 community coalitions across the State. They utilize evidence-based, outcome-oriented programs focusing on such risk factors as family conflict, permissive attitudes towards alcohol and substance abuse, and lack of commitment to school, which research shows are predictive of adolescent problem behaviors like alcohol and substance abuse, delinquency, teen pregnancy, school drop-out, and violence. While reducing these risk factors, prevention programs also focus on nurturing healthy beliefs and clear standards within community and family, since combining both activities is crucial to reducing the prevalence of problem behaviors like alcohol and substance abuse.
ALL FUNDS APPROPRIATIONS
(dollars)
Category Available
2010-11
AppropriationsRecommended
2011-12 Change
ReappropriationsRecommended
2011-12State Operations 130,710,000 119,013,400 (11,696,600) 4,288,000 Aid To Localities 477,234,000 454,121,000 (23,113,000) 191,600,000 Capital Projects 108,934,000 97,606,000 (11,328,000) 456,406,000 Total 716,878,000 670,740,400 (46,137,600) 652,294,000

ALCOHOLISM AND SUBSTANCE ABUSE SERVICES
214
ALL FUND TYPES PROJECTED LEVELS OF EMPLOYMENT BY PROGRAM
FILLED ANNUAL SALARIED POSITIONS Full-Time Equivalent Positions (FTE)
Program
2010-11Estimated FTEs
03/31/11
2011-12Estimated FTEs
03/31/12 FTE ChangeExecutive Direction
Special Revenue Funds - Federal 74 74 0 Special Revenue Funds - Other 290 281 (9)
Institutional Services Special Revenue Funds - Federal 16 16 0 Special Revenue Funds - Other 462 446 (16)
Total 842 817 (25)
The above table does not reflect layoffs that may be necessary in the absence of negotiated workforce savings.
STATE OPERATIONS
ALL FUNDS FINANCIAL REQUIREMENTS BY FUND TYPE APPROPRIATIONS
(dollars)
Fund Type Available
2010-11Recommended
2011-12 ChangeSpecial Revenue Funds - Federal 6,805,000 6,530,000 (275,000) Special Revenue Funds - Other 123,905,000 112,483,400 (11,421,600) Total 130,710,000 119,013,400 (11,696,600)
STATE OPERATIONS
ALL FUNDS FINANCIAL REQUIREMENTS BY PROGRAM APPROPRIATIONS
(dollars)
Program Available
2010-11Recommended
2011-12 ChangeExecutive Direction
Special Revenue Funds - Federal 5,605,000 5,320,000 (285,000) Special Revenue Funds - Other 53,307,000 47,976,300 (5,330,700)
Institutional Services Special Revenue Funds - Federal 1,200,000 1,210,000 10,000 Special Revenue Funds - Other 70,598,000 64,507,100 (6,090,900)
Total 130,710,000 119,013,400 (11,696,600)
STATE OPERATIONS - OTHER THAN GENERAL FUND
SUMMARY OF APPROPRIATIONS AND CHANGES 2011-12 RECOMMENDED
(dollars) Total Personal Service Program Amount Change Amount ChangeExecutive Direction 53,296,300 (5,615,700) 27,973,100 (2,806,900)Institutional Services 65,717,100 (6,080,900) 33,802,700 (2,941,300) Total 119,013,400 (11,696,600) 61,775,800 (5,748,200) Nonpersonal Service Program Amount Change Executive Direction 25,323,200 (2,808,800) Institutional Services 31,914,400 (3,139,600) Total 57,237,600 (5,948,400)

ALCOHOLISM AND SUBSTANCE ABUSE SERVICES
215
AID TO LOCALITIES ALL FUNDS FINANCIAL REQUIREMENTS BY FUND TYPE
APPROPRIATIONS (dollars)
Fund Type Available
2010-11Recommended
2011-12 ChangeGeneral Fund 39,000,000 36,878,500 (2,121,500) Special Revenue Funds - Federal 139,755,000 135,000,000 (4,755,000) Special Revenue Funds - Other 298,479,000 282,242,500 (16,236,500) Total 477,234,000 454,121,000 (23,113,000) Adjustments: Transfer(s) From
Alcoholism and Substance Abuse Services, Office of General Fund (110,400,000)
Transfer(s) To Alcoholism and Substance Abuse
Services, Office of Special Revenue Funds - Other 110,400,000
Appropriated 2010-11 477,234,000
AID TO LOCALITIES ALL FUNDS FINANCIAL REQUIREMENTS BY PROGRAM
APPROPRIATIONS (dollars)
Program Available
2010-11Recommended
2011-12 ChangeCommunity Treatment Services Program
General Fund 39,000,000 36,878,500 (2,121,500) Special Revenue Funds - Federal 106,000,000 106,000,000 0 Special Revenue Funds - Other 245,600,000 232,240,000 (13,360,000)
Prevention and Program Support Special Revenue Funds - Federal 33,755,000 29,000,000 (4,755,000) Special Revenue Funds - Other 52,879,000 50,002,500 (2,876,500)
Total 477,234,000 454,121,000 (23,113,000)
CAPITAL PROJECTS
ALL FUNDS FINANCIAL REQUIREMENTS BY PROGRAM APPROPRIATIONS
(dollars)
Comprehensive Construction Program Available
2010-11Recommended
2011-12 Change Reappropriations
2011-12Design and Construction Supervision
Capital Projects Fund 3,000,000 3,000,000 0 5,731,000 MH Capital Improvements - Authority Bonds 500,000 500,000 0 1,000,000
Administration Capital Projects Fund 1,328,000 0 (1,328,000) 0
Community Alcoholism and Substance Abuse Facilities Capital Projects Fund 4,810,000 4,810,000 0 25,115,000 MH Capital Improvements - Authority Bonds 94,546,000 80,546,000 (14,000,000) 402,090,000
Institutional Services Program Capital Projects Fund 1,000,000 1,000,000 0 3,160,000 MH Capital Improvements - Authority Bonds 3,000,000 7,000,000 4,000,000 19,310,000
Non-Bondable Capital Projects Fund 750,000 750,000 0 0
Total 108,934,000 97,606,000 (11,328,000) 456,406,000

216
OFFICE OF MENTAL HEALTH MISSION The Office of Mental Health’s (OMH) mission is to promote the mental health of all New Yorkers, with a particular focus on providing hope and recovery for adults and children with serious mental illness or emotional disturbances. ORGANIZATION AND STAFFING The Office of Mental Health is headed by a Commissioner who is appointed by the Governor subject to Senate confirmation. New York’s public mental health system consists of programs that are operated by the Office of Mental Health, as well as community programs certified and funded by the State, but operated by local governments, not-for-profit, and proprietary providers. BUDGET HIGHLIGHTS The Executive Budget recommends $3.6 billion in All Funds appropriations for the Office of Mental Health (OMH). This is a net decrease of $95 million (-2.6 percent). This reflects roughly $40 million of additional spending to provide supported housing and services for certain adult home residents pursuant to a Federal court order, offset by a net reduction in all other services. The Executive Budget reduces each agency’s General Fund State Operations budget by 10 percent. These savings are intended to be achieved through administrative efficiencies in non-personal service and negotiated workforce savings that minimize layoffs to the extent possible. OMH continues to improve the efficiency and cost-effectiveness of its operations and the network of non-profit providers it supports, and has ongoing efforts to reform or restructure activities based on a review of its core mission. In addition to savings initiatives undertaken in 2010-11 to control costs, including a significant slowdown in new residential bed development, major new budget actions to promote cost efficiency and rationalize reimbursement include:
Aid to Localities Residential Actions: Freeze development of all new OMH community residential programs for one year. The savings from this delay in development will help provide resources for additional costs pursuant to a Federal court order for certain adult home residents in New York City. Eliminate funding over the next two years for family-based treatment beds, which have not been as effective as projected; reduce aid to providers that are funded above the regional per bed models for supported housing; convert residential pipeline units to lower-cost alternatives, and reprogram 250 planned supported housing beds for adult home litigation requirements.
Aid to Localities Non-Residential Efficiencies: Restructure a variety of non-residential OMH programs, including Continuing Day Treatment to encourage use of the more effective Personalized Recovery Oriented Services program; targeted funding reductions to encourage efficiencies in certain community support programs, children’s Clinic-Plus, non-direct services; and local administration. Continue the 1.1 percent across-the-board reduction on existing local aid programs implemented in 2010-11.
MENTAL HEALTH
217
OMH COLA and Trend: Defer the planned 1.2 percent Human Services COLA for one year, but extend the legislation for another year through 2014-15. Additionally, the rates for Residential Treatment Facilities and the Community Residence/Family Based Treatment programs will be maintained at existing levels.
Enhanced Auditing for Recovery of OMH Medicaid and State Aid Payments: OMH will renew efforts to recover State funds with enhanced audit activities, including reconciliations, State aid letters and direct contract close-outs.
Reform/Efficiencies in State Operations: As part of State Operations reductions of 10 percent, OMH will reduce State-operated inpatient capacity based on a review of current census patterns, and continue efforts to maximize community placement and consolidate capacity and administrative functions throughout the system.
Continuation of Restructuring Efforts: OMH will continue implementing the Ambulatory Care restructuring started in 2008-09, which will rationalize the reimbursement of providers of mental health clinical services. Additionally, OMH will focus on best practices modalities, including the creation of a behavioral health care coordination effort to improve quality care for individuals with mental illness. Also, OMH was awarded a third Federal grant of nearly $10 million (an increase of $4 million over 2010-11 levels) to continue improving employment opportunities for individuals with mental illness.
Adult Home Litigation: In response to a Federal court order, the Budget continues a multi-year plan to provide funding for additional supported housing and support services for 4,500 individuals leaving New York City adult homes. A total of $41.3 million will fund 1,500 rental housing units and services for the first of these individuals beginning February 1, 2011. To address a portion of the funding needed for these individuals, resources will be reprogrammed for this purpose from 250 planned Supported Housing units.
PROGRAM HIGHLIGHTS As the State’s mental health authority, OMH gives priority to ensuring access to high quality services for adults and children with severe mental illness or serious emotional disturbances. In addition, OMH promotes overall public mental health through education and advocacy. The Agency has four lines of business underpinning these functions:
Regulating, Certifying, Financing and Overseeing New York’s Public Mental Health System. OMH oversees 58 local governmental units, one of which covers New York City in its entirety. The Agency also regulates and/or licenses more than 2,500 mental health programs operated by local governments and private agencies serving nearly 700,000 persons annually, including inpatient, outpatient, emergency, residential and family care, and community support services;
Providing State-operated Inpatient and Outpatient Mental Health Services. OMH is a major provider of intermediate and long-term inpatient as well as outpatient treatment services through a network of psychiatric centers that includes Adult Psychiatric Centers, Children’s Psychiatric Centers, and facilities serving forensic patients involved with the criminal justice system. Additionally, OMH provides mental health services around the State to inmates incarcerated in Department of Correctional Services’ facilities;
MENTAL HEALTH
218
Conducting Basic and Applied Research to Advance Prevention, Treatment, and Recovery. OMH conducts basic and applied research at the New York State Psychiatric Institute in Manhattan and the Nathan S. Kline Institute for Psychiatric Research in Rockland County, with a focus on identifying interventions that have been proven by scientific research to be effective and that can be incorporated into mainstream practice. New York State’s investment in research is augmented by many grants from Federal and other sources through the Research Foundation for Mental Hygiene (RFMH), Inc. Additionally, OMH’s Office of Performance Measurement and Evaluation conducts evaluation research and statistical analyses which are used to examine service outcomes, investigate pressing mental health issues, and develop sound approaches for improving service quality and access; and
Promoting Public Mental Health through Education and Outreach. OMH supports a variety of educational activities focusing on the nature and impact of mental illness, effective treatments and services, useful preventive and coping strategies, and service accessibility. The Agency’s information dissemination strategies are designed to reach as many New Yorkers as possible, with a particular focus on high-risk groups.
To live successfully, most individuals with serious mental illness need both treatments that manage or eliminate their psychiatric symptoms and support services that address the needs associated with the disabling effects of their illness. Public mental health services are grouped in four major categories across the health care continuum: community support, and outpatient, inpatient, and emergency services. In New York State, both State- and locally-operated programs provide services in each of these four categories:
Community Support helps individuals diagnosed with serious mental illness live as independently as possible in the community, and helps children with serious emotional disturbance remain with their families. These programs provide case management, vocational, self-help, residential and other support services. Although the specific array of community support services differs for adults and children, the goal is always to support successful and full community living;
Outpatient Services provide treatment and rehabilitation in an ambulatory setting, including clinics, partial hospitalization, day treatment for children, continuing day treatment for adults, Assertive Community Treatment (ACT), Prepaid Mental Health Plan (PMHP), and Personalized Recovery-Oriented Services (PROS);
Inpatient Services provide acute stabilization and intensive treatment and rehabilitation with 24-hour care in a controlled environment when community services and supports do not meet the needs of adults and children; and
Emergency Services provide rapid psychiatric and/or medical stabilization and ensure the safety of individuals who present a risk to themselves or others. These programs include a range of crisis counseling and residential services, as well as Comprehensive Psychiatric Emergency Programs.
In all mental health settings, the fundamental goal of OMH is to maximize access to quality mental health care for every single New Yorker. This includes bridging the gap between science and service; focusing on accountability for results, best practices, and coordination of care; and eliminating disparities and promoting culturally and linguistically competent services and supports.

MENTAL HEALTH
219
ALL FUNDS APPROPRIATIONS
(dollars)
Category Available
2010-11
AppropriationsRecommended
2011-12 Change
ReappropriationsRecommended
2011-12State Operations 2,156,245,000 2,051,226,000 (105,019,000) 2,639,000 Aid To Localities 1,275,183,000 1,298,434,000 23,251,000 40,108,000 Capital Projects 234,291,000 220,874,000 (13,417,000) 1,982,774,000 Total 3,665,719,000 3,570,534,000 (95,185,000) 2,025,521,000
ALL FUND TYPES
PROJECTED LEVELS OF EMPLOYMENT BY PROGRAM FILLED ANNUAL SALARIED POSITIONS
Full-Time Equivalent Positions (FTE)
Program
2010-11Estimated FTEs
03/31/11
2011-12Estimated FTEs
03/31/12 FTE ChangeAdministration and Finance
Special Revenue Funds - Federal 11 11 0 Special Revenue Funds - Other 615 615 0 Enterprise Funds 10 10 0 Internal Service Funds 17 17 0
Adult Services Special Revenue Funds - Other 10,737 10,637 (100)
Capital Planning Capital Projects Funds - Other 41 41 0
Children and Youth Services Special Revenue Funds - Other 1,906 1,906 0
Forensic Services Special Revenue Funds - Other 1,949 1,949 0
Research Special Revenue Funds - Other 474 474 0
Total 15,760 15,660 (100)
The above table does not reflect layoffs that may be necessary in the absence of negotiated workforce savings.
STATE OPERATIONS
ALL FUNDS FINANCIAL REQUIREMENTS BY FUND TYPE APPROPRIATIONS
(dollars)
Fund Type Available
2010-11Recommended
2011-12 ChangeGeneral Fund 800,000 800,000 0 Special Revenue Funds - Federal 2,038,000 2,038,000 0 Special Revenue Funds - Other 2,141,991,000 2,037,172,000 (104,819,000) Enterprise Funds 8,606,000 8,606,000 0 Internal Service Funds 2,810,000 2,610,000 (200,000) Total 2,156,245,000 2,051,226,000 (105,019,000) Adjustments: Transfer(s) From
Special Pay Bill Special Revenue Funds - Other (24,951,000)
Appropriated 2010-11 2,131,294,000

MENTAL HEALTH
220
STATE OPERATIONS ALL FUNDS FINANCIAL REQUIREMENTS BY PROGRAM
APPROPRIATIONS (dollars)
Program Available
2010-11Recommended
2011-12 ChangeAdministration and Finance
Special Revenue Funds - Federal 2,038,000 2,038,000 0 Special Revenue Funds - Other 102,076,000 92,631,000 (9,445,000) Enterprise Funds 8,606,000 8,606,000 0 Internal Service Funds 2,810,000 2,610,000 (200,000)
Adult Services General Fund 800,000 800,000 0 Special Revenue Funds - Other 1,455,756,000 1,395,285,000 (60,471,000)
Children and Youth Services Special Revenue Funds - Other 227,880,000 227,880,000 0
Forensic Services Special Revenue Funds - Other 267,926,000 241,134,000 (26,792,000)
Research Special Revenue Funds - Other 88,353,000 80,242,000 (8,111,000)
Total 2,156,245,000 2,051,226,000 (105,019,000)
STATE OPERATIONS - GENERAL FUND
SUMMARY OF NONPERSONAL SERVICE AND MAINTENANCE UNDISTRIBUTED APPROPRIATIONS AND CHANGES
2011-12 RECOMMENDED (dollars)
Total Travel Program Amount Change Amount ChangeAdult Services 800,000 0 800,000 0 Total 800,000 0 800,000 0
STATE OPERATIONS - OTHER THAN GENERAL FUND
SUMMARY OF APPROPRIATIONS AND CHANGES 2011-12 RECOMMENDED
(dollars) Total Personal Service Program Amount Change Amount ChangeAdministration and Finance 105,885,000 (9,645,000) 43,114,000 (6,698,000)Adult Services 1,395,285,000 (60,471,000) 760,615,000 (33,328,000)Children and Youth Services 227,880,000 0 137,735,000 0 Forensic Services 241,134,000 (26,792,000) 146,029,000 (16,224,000)Research 80,242,000 (8,111,000) 44,708,000 (4,755,000) Total 2,050,426,000 (105,019,000) 1,132,201,000 (61,005,000) Nonpersonal Service Program Amount Change Administration and Finance 62,771,000 (2,947,000) Adult Services 634,670,000 (27,143,000) Children and Youth Services 90,145,000 0 Forensic Services 95,105,000 (10,568,000) Research 35,534,000 (3,356,000) Total 918,225,000 (44,014,000)

MENTAL HEALTH
221
AID TO LOCALITIES ALL FUNDS FINANCIAL REQUIREMENTS BY FUND TYPE
APPROPRIATIONS (dollars)
Fund Type Available
2010-11Recommended
2011-12 ChangeGeneral Fund 420,982,000 420,982,000 0 Special Revenue Funds - Federal 46,807,000 51,414,000 4,607,000 Special Revenue Funds - Other 807,394,000 826,038,000 18,644,000 Total 1,275,183,000 1,298,434,000 23,251,000 Adjustments: Prior Year Deficiency
Mental Health, Office of General Fund 3,000,000 Special Revenue Funds - Other 29,000,000
Transfer(s) From Mental Health, Office of
General Fund (136,772,000) Transfer(s) To
Mental Health, Office of Special Revenue Funds - Other 136,772,000
Appropriated 2010-11 1,307,183,000
AID TO LOCALITIES ALL FUNDS FINANCIAL REQUIREMENTS BY PROGRAM
APPROPRIATIONS (dollars)
Program Available
2010-11Recommended
2011-12 ChangeAdult Services
General Fund 295,979,000 295,979,000 0 Special Revenue Funds - Federal 41,006,000 45,613,000 4,607,000 Special Revenue Funds - Other 687,586,000 706,230,000 18,644,000
Children and Youth Services General Fund 125,003,000 125,003,000 0 Special Revenue Funds - Federal 5,801,000 5,801,000 0 Special Revenue Funds - Other 119,808,000 119,808,000 0
Total 1,275,183,000 1,298,434,000 23,251,000
CAPITAL PROJECTS
ALL FUNDS FINANCIAL REQUIREMENTS BY PROGRAM APPROPRIATIONS
(dollars)
Comprehensive Construction Program Available
2010-11Recommended
2011-12 Change Reappropriations
2011-12Design and Construction Supervision
Capital Projects Fund 2,000,000 2,000,000 0 3,492,000 MH Capital Improvements - Authority Bonds 12,000,000 12,000,000 0 22,153,000
Executive Direction Capital Projects Fund 0 0 0 2,445,000 MH Capital Improvements - Authority Bonds 3,717,000 3,717,000 0 5,799,000
Community Mental Health Facilities Capital Projects Fund 6,000,000 6,000,000 0 40,442,000 MH Capital Improvements - Authority Bonds 5,639,000 5,639,000 0 713,178,000
Maintenance and Improvements of Existing Facilities Capital Projects Fund 28,600,000 28,600,000 0 62,363,000 MH Capital Improvements - Authority Bonds 175,335,000 161,918,000 (13,417,000) 1,127,857,000
Non-Bondable Capital Projects Fund 1,000,000 1,000,000 0 5,045,000
Total 234,291,000 220,874,000 (13,417,000) 1,982,774,000

222
OFFICE FOR PEOPLE WITH DEVELOPMENTAL DISABILITIES
MISSION The mission of the Office for People with Developmental Disabilities (OPWDD) is to help people with developmental disabilities live richer lives. The agency’s vision is to ensure that people with developmental disabilities enjoy meaningful relationships with family, friends, and others in their lives; experience personal health and growth; and live in homes and fully participate in the communities of their choice. ORGANIZATION AND STAFFING Under the direction of a Commissioner appointed by the Governor and subject to Senate confirmation, OPWDD currently operates through 13 district offices called Developmental Disabilities Services Offices (DDSO). Its Central Office oversees and supports operations of the district offices. OPWDD also operates the Institute for Basic Research in Developmental Disabilities (IBR) on Staten Island. By the end of 2011-12, there will be approximately 37,000 individuals with developmental disabilities residing in community settings funded by the State, with 300 individuals living in developmental centers and approximately 1,000 in special units. Over the past two decades, the developmental center population has declined by more than 9,000 and the current plan is to move all remaining 300 individuals in developmental centers to the community by 2014. BUDGET HIGHLIGHTS The 2011-12 Executive Budget recommends almost $4.6 billion All Funds appropriations ($1.4 billion General Fund; $3.2 billion Other Funds) for OPWDD to continue to support a comprehensive system of care serving the more than 126,000 persons with developmental disabilities and their families. This is a decrease of $167 million (-3.5 percent) from 2010-11, which is largely attributable to the actions outlined below. The Executive Budget recommendations for 2011-12 require a number of savings actions in both State Operations and Local Assistance, while recognizing the need to maintain essential direct supports and services and maintain the high quality of care for individuals with developmental disabilities in both not-for-profit and OPWDD-operated programs. The Executive Budget reduces each agency’s General Fund State Operations budget by 10 percent. These savings are intended to be achieved through administrative efficiencies in non-personal service and negotiated workforce savings that minimize layoffs to the extent possible. The overall recommendation maintains the State’s commitment to support a wide range of New Yorkers with developmental disabilities, including those who are medically frail, behaviorally challenged - especially those with autism - those who have been placed out-of-State or who are “aging out” of education or other child care systems, as well as those living at home. However, OPWDD continues to improve the efficiency and cost-effectiveness of its operations and the network of not-for-profit providers it oversees and financially supports. In addition to a 10 percent reduction in State Operations costs, major new budget actions to promote cost efficiency, streamline operations, restructure programs and services, and rationalize reimbursement include:

PEOPLE WITH DEVELOPMENTAL DISABILITIES
223
Deferring Cost-of-Living Adjustment (COLA). Defer the planned 1.2 percent human services COLA for one year. However, to continue the State’s long-term commitment, a three-year human services COLA is planned to commence April 1, 2012 and continue through the 2014-15 fiscal year.
Reforming of Various Programs. Reform the financing of various OPWDD programs through rate, price and contract adjustments to both residential and non-residential services to reflect efficiencies, program restructurings and other cost savings. These reforms include more aggressive reviews of providers’ overall surplus/loss analysis, as well as further constraints on administrative and non-personal service costs. Funding for workshop, day training and other day services will be reduced to encourage placements into other more effective community-based integrated day and employment programs. In addition, funding for transportation services and residential habilitation services delivered in supervised Individualized Residential Alternative programs will be reduced to encourage efficiencies.
Managing the Development of Community Residential Opportunities. Delay the development of OPWDD community adult and children residential opportunities while investing funding to add 2,300 lower-cost residential and/or non-residential opportunities to support individuals and their families during this period. Continue the 1.1 percent local aid reduction begun in 2010-11.
PROGRAM HIGHLIGHTS OPWDD serves more than 126,000 New Yorkers with developmental disabilities, which include primarily developmental disabilities, autism, epilepsy, cerebral palsy, and neurological impairments. In recent years, New York has made great strides in improving its methods of delivering services to this vulnerable population, moving more people from institutions to the community than any other state in the nation. In addition, OPWDD continues to place greater emphasis on individual choice, opportunities that support greater independence and integration into the community, improved sustainability, and satisfaction, and has instituted a recurring survey designed by individuals, families and other stakeholders, which is used to evaluate individuals’ satisfaction and the success of residential opportunities under the NYS-CARES program. Under a 1991 Federal Medicaid waiver, individuals with developmental disabilities have the opportunity to receive individualized services in less restrictive settings. With the aid of trained service coordinators, individuals choose the services they need and receive them in appropriate settings. The HCBS waiver promotes smaller, more natural home environments and people living with families or independently with appropriate supports. Home size has continued to decrease, thereby supporting individualized, quality services. Today, two-thirds of the homes in the community accommodate six people or less; of these, two-thirds accommodate four people or less. Maintaining a statewide system of services, delivered through both the State and not-for-profit providers, OPWDD:
Provides over 38,000 persons with certified community and institutional residential services. Since 1998, more than 18,000 people have left the residential registration list for homes in the community;
Provides over 58,000 people with community day services; and Supports another 43,000 people who live with their families.
An overview of these services is provided below.

PEOPLE WITH DEVELOPMENTAL DISABILITIES
224
RESIDENTIAL SERVICES Residential services are offered through a continuum of programs in both community and institutional settings. The alternative that provides the most intensive services in a community setting is the Intermediate Care Facility for the Developmentally Disabled (ICF/DD). These facilities – approximately 6,000 beds operated statewide by both State and not-for-profit providers – are appropriate for individuals requiring intensive 24-hour care. The most common residential opportunity for persons under the waiver is in Individual Residential Alternatives (IRAs) – homes, typically for four to eight people, operated by either the State or not-for-profit providers in the community. This budget supports more than 28,000 individuals with developmental disabilities living in this setting with accompanying service coordination. Other community living arrangements include Community Residences and Family Care homes, which serve more than 2,800 people. In addition to these community-based residential programs, OPWDD operates nine campuses across the State. Approximately 1,300 people will be served in these settings by the end of 2011-12, of which more than 75 percent will be receiving specialized services. OPWDD remains committed to providing community residential opportunities for all those in State institutions who can receive appropriate care in the community. Currently, New York serves more persons in community residential settings than any other state, with the exception of California. DAY SERVICES OPWDD supports an array of day services for persons with developmental disabilities, which also vary depending on the needs of the individuals. The major programs include:
Day treatment, which provides diagnostic, treatment and rehabilitative services; Day habilitation, a smaller, more individualized service for persons under the
Federal Medicaid waiver for home and community based services; Supported employment, which provides the opportunity for individuals to work in
competitive positions, usually in integrated settings in the private sector; Sheltered workshops, which provide basic, non-competitive work opportunities;
and, Day training, which develops the knowledge and skills that enable persons with
developmental disabilities to improve their personal, social, and vocational skills and to function independently.
SUPPORT FOR INDIVIDUALS LIVING IN THEIR OWN HOMES OPWDD services also support families and individuals with developmental disabilities in their own homes. The Family Support Services program currently assists nearly 43,000 persons with developmental disabilities and their families, enabling these individuals to remain at home and receive over 73,000 individualized services. Services offered include respite, crisis intervention, case management, recreation, information and referral, and home care. Funding for services to individuals with developmental disabilities and families has also been expanded within Family Support Services.
PEOPLE WITH DEVELOPMENTAL DISABILITIES
225
The Individualized Support Services program provides services to nearly 2,200 individuals with developmental disabilities who live independently. In addition, nearly 11,000 individuals living in their own homes receive residential habilitation under the Federal Medicaid waiver with funding to support an additional 1,500 individuals with developmental disabilities. The Care-at-Home program provides a third alternative, designed to preserve family settings for persons under 18 years of age with developmental disabilities who are medically frail. This program allows the parents of young persons with severe disabilities to maintain the child at home, regardless of family income level, thereby preventing more costly out-of-home placements.
ALL FUNDS APPROPRIATIONS
(dollars)
Category Available
2010-11
AppropriationsRecommended
2011-12 Change
ReappropriationsRecommended
2011-12State Operations 2,263,789,000 2,150,820,700 (112,968,300) 3,714,000 Aid To Localities 2,363,796,000 2,296,901,500 (66,894,500) 0 Capital Projects 139,560,000 151,995,000 12,435,000 380,330,000 Total 4,767,145,000 4,599,717,200 (167,427,800) 384,044,000
ALL FUND TYPES
PROJECTED LEVELS OF EMPLOYMENT BY PROGRAM FILLED ANNUAL SALARIED POSITIONS
Full-Time Equivalent Positions (FTE)
Program
2010-11Estimated FTEs
03/31/11
2011-12Estimated FTEs
03/31/12 FTE ChangeCentral Coordination and Support
Special Revenue Funds - Other 745 739 (6) Community Services
Special Revenue Funds - Other 14,721 14,600 (121) Institutional Services
Special Revenue Funds - Other 5,743 5,696 (47) Research in Mental Retardation
Special Revenue Funds - Other 140 139 (1) Total 21,349 21,174 (175)
The above table does not reflect layoffs that may be necessary in the absence of negotiated workforce savings.
STATE OPERATIONS
ALL FUNDS FINANCIAL REQUIREMENTS BY FUND TYPE APPROPRIATIONS
(dollars)
Fund Type Available
2010-11Recommended
2011-12 ChangeSpecial Revenue Funds - Federal 751,000 751,000 0 Special Revenue Funds - Other 2,260,020,000 2,147,051,700 (112,968,300) Enterprise Funds 2,668,000 2,668,000 0 Internal Service Funds 350,000 350,000 0 Total 2,263,789,000 2,150,820,700 (112,968,300) Adjustments: Transfer(s) From
Special Pay Bill Special Revenue Funds - Other (4,328,000)
Appropriated 2010-11 2,259,461,000

PEOPLE WITH DEVELOPMENTAL DISABILITIES
226
STATE OPERATIONS ALL FUNDS FINANCIAL REQUIREMENTS BY PROGRAM
APPROPRIATIONS (dollars)
Program Available
2010-11Recommended
2011-12 ChangeCentral Coordination and Support
Special Revenue Funds - Federal 751,000 751,000 0 Special Revenue Funds - Other 120,390,000 114,370,500 (6,019,500) Internal Service Funds 350,000 350,000 0
Community Services Special Revenue Funds - Other 1,372,491,000 1,303,866,450 (68,624,550)
Institutional Services Special Revenue Funds - Other 740,245,000 703,257,950 (36,987,050) Enterprise Funds 2,668,000 2,668,000 0
Research in Mental Retardation Special Revenue Funds - Other 26,894,000 25,556,800 (1,337,200)
Total 2,263,789,000 2,150,820,700 (112,968,300)
STATE OPERATIONS - OTHER THAN GENERAL FUND
SUMMARY OF APPROPRIATIONS AND CHANGES 2011-12 RECOMMENDED
(dollars) Total Personal Service Program Amount Change Amount ChangeCentral Coordination and Support 115,471,500 (6,019,500) 59,397,800 (3,126,200)Community Services 1,303,866,450 (68,624,550) 771,132,100 (40,585,900)Institutional Services 705,925,950 (36,987,050) 321,096,450 (16,884,550)Research in Mental Retardation 25,556,800 (1,337,200) 15,677,850 (825,150) Total 2,150,820,700 (112,968,300) 1,167,304,200 (61,421,800) Nonpersonal Service Program Amount Change Central Coordination and Support 56,073,700 (2,893,300) Community Services 532,734,350 (28,038,650) Institutional Services 384,829,500 (20,102,500) Research in Mental Retardation 9,878,950 (512,050) Total 983,516,500 (51,546,500)
AID TO LOCALITIES
ALL FUNDS FINANCIAL REQUIREMENTS BY FUND TYPE APPROPRIATIONS
(dollars)
Fund Type Available
2010-11Recommended
2011-12 ChangeGeneral Fund 1,472,023,000 1,430,364,800 (41,658,200) Special Revenue Funds - Other 891,773,000 866,536,700 (25,236,300) Total 2,363,796,000 2,296,901,500 (66,894,500) Adjustments: Transfer(s) From
People with Developmental Disabilities, Office for General Fund (129,799,000)
Transfer(s) To People with Developmental Disabilities,
Office for Special Revenue Funds - Other 129,799,000
Appropriated 2010-11 2,363,796,000

PEOPLE WITH DEVELOPMENTAL DISABILITIES
227
AID TO LOCALITIES ALL FUNDS FINANCIAL REQUIREMENTS BY PROGRAM
APPROPRIATIONS (dollars)
Program Available
2010-11Recommended
2011-12 ChangeCommunity Services
General Fund 1,472,023,000 1,430,364,800 (41,658,200) Special Revenue Funds - Other 891,773,000 866,536,700 (25,236,300)
Total 2,363,796,000 2,296,901,500 (66,894,500)
CAPITAL PROJECTS
ALL FUNDS FINANCIAL REQUIREMENTS BY PROGRAM APPROPRIATIONS
(dollars)
Comprehensive Construction Program Available
2010-11Recommended
2011-12 Change Reappropriations
2011-12Design and Construction Supervision
Capital Projects Fund 5,000,000 5,000,000 0 0 MH Capital Improvements - Authority Bonds 6,000,000 6,000,000 0 3,724,000
Voluntary-Operated Community Facilities Capital Projects Fund 10,070,000 10,370,000 300,000 10,070,000 MH Capital Improvements - Authority Bonds 6,710,000 7,000,000 290,000 13,160,000
State-Operated Community Services Program Capital Projects Fund 24,255,000 28,235,000 3,980,000 33,063,000 MH Capital Improvements - Authority Bonds 29,325,000 32,000,000 2,675,000 86,570,000
Institutional Services Program Capital Projects Fund 16,700,000 17,535,000 835,000 62,003,000 MH Capital Improvements - Authority Bonds 40,500,000 44,855,000 4,355,000 171,740,000
Non-Bondable Capital Projects Fund 1,000,000 1,000,000 0 0
Total 139,560,000 151,995,000 12,435,000 380,330,000

228
METROPOLITAN TRANSPORTATION AUTHORITY MISSION The Metropolitan Transportation Authority (MTA) is responsible for operating, maintaining and improving public transportation in the Metropolitan Commuter Transportation District consisting of New York City and Dutchess, Nassau, Orange, Putnam, Rockland, Suffolk and Westchester counties. The Authority oversees the operations of the bus and subway systems in New York City, commuter railroads in the region, and seven bridges and two tunnels in New York City. This oversight includes general policy direction and development and financing of the operating and capital programs. The Authority is comprised of three independent entities: The Metropolitan Transportation Authority, MTA New York City Transit and MTA Bridges and Tunnels. The Metropolitan Transportation Authority has six subsidiaries: MTA Staten Island Rapid Transit, MTA Long Island Rail Road, MTA Long Island Bus, MTA Metro North Railroad, MTA Bus and MTA Capital Construction. MTA New York City Transit, which operates the New York City subway and bus systems, has one subsidiary: MTA Manhattan and Bronx Surface Transit. ORGANIZATION AND STAFFING Each of the three independent entities mentioned above is governed by its own Board, although by law membership on each Board is identical. There are 17 voting board members, each nominated by the Governor and confirmed by the Senate. Four members are nominated from a list provided by the Mayor of the City of New York and one each from lists prepared by the seven county executives in the Metropolitan Commuter Transportation District. The remaining six members are appointed directly by the Governor, with one serving as Board Chair. There are also six non-voting members on the Board representing riders and labor unions, for a total of 23 members. BUDGET HIGHLIGHTS The Executive Budget recommends approximately $1 billion for the MTA capital program from reappropriations of the Rebuild and Renew New York Bond Act of 2005. This funding was approved by voters in November 2005 and provided a total of $1.45 billion of capital to the MTA. The Executive Budget also includes contingent appropriations worth $2.1 billion for the MTA. These contingent appropriations are from the Dedicated Mass Transportation Trust Fund and the MTA Support Program Fund, and are used to ensure continuation of aid payments to the MTA in the event of temporary non-appropriation due to a late budget for the subsequent fiscal State year. Within the Department of Transportation budget, the Executive Budget recommends $3.8 billion in appropriations to the MTA, a decline of $108 million (-3 percent) from last year. This decline is primarily the result of the 2011-12 Payroll Mobility Tax appropriation level becoming closer aligned with the expected tax receipts for the coming year. Despite this drop in appropriations, the MTA is anticipated to receive an increase of $43 million on a year-to-year cash basis.

METROPOLITAN TRANSPORTATION
229
PROGRAM HIGHLIGHTS MTA NEW YORK CITY TRANSIT AND MTA COMMUTER RAILROADS The Metropolitan Transportation Authority provides 24-hour-a-day transit and commuter services in the New York City metropolitan region and carries 8.5 million riders per day in one of the largest transportation networks in the world. MTA New York City Transit operates 6,300 subway cars on 27 lines, the largest subway network in the world. NYC Transit, MTA Bus and MTA Long Island bus also operate 6,300 buses, serving nearly 4,000 miles of bus routes. MTA Long Island Rail Road and MTA Metro North Railroad, the two largest commuter rail systems in the nation, provide transportation for travelers entering New York City from outlying suburban areas in New York State and Connecticut. Over two and a half billion passengers ride the subways, buses and commuter rail systems each year. MTA BRIDGES AND TUNNELS MTA Bridges and Tunnels, the largest toll system in the nation serving 300 million vehicles annually, operates nine intra-city bridges and tunnels in New York City: Robert F. Kennedy Bridge (formerly known as the Triborough Bridge), Bronx-Whitestone Bridge, Henry Hudson Bridge, Marine Parkway-Gil Hodges Bridge, Cross Bay Veterans’ Memorial Bridge, Throgs Neck Bridge, Verrazano-Narrows Bridge, Queens-Midtown Tunnel and Brooklyn Battery Tunnel. It also provides financing for MTA New York City Transit’s and the commuter railroads’ capital programs. In addition, MTA Bridges and Tunnels is required by law to transfer surplus revenues to MTA New York City Transit and the commuter railroads to support their operations. OTHER SUBSIDIARIES In July 2003, the MTA created the MTA Capital Construction Company, which has the ability to manage, design and effectuate the system expansion projects of all the MTA agencies. The other subsidiaries – MTA Staten Island Rapid Transit, MTA Long Island Bus, and MTA Manhattan and Bronx Surface Transit – provide regional transportation services. MTA Staten Island Rapid Transit operates transit services on Staten Island. MTA Manhattan and Bronx Surface Transit, in conjunction with MTA New York City Transit, provide bus service within New York City, primarily in Manhattan and the Bronx. In September 2004, the MTA Board created the MTA Bus Company. Pursuant to an agreement with the City of New York, the MTA has assumed operation of bus service in the areas previously serviced by the City-franchised private bus lines. The City of New York will pay to the MTA the difference between the actual cost of operations and all revenues. MTA Bus now operates the 11th largest bus fleet in North America. MTA Long Island Bus provides bus service to Nassau County, western Suffolk County and eastern Queens County, connecting these areas to MTA Long Island Rail Road’s stations and New York City Transit’s subway stations. The Metropolitan Transportation Authority carries out the operation and provides general oversight of MTA Long Island Bus. Nassau County is financially responsible for the portion of MTA Long Island Bus’ operating costs that are over and above those supported by fares and by Federal and State assistance.

METROPOLITAN TRANSPORTATION
230
ALL FUNDS APPROPRIATIONS
(dollars)
Category Available
2010-11
AppropriationsRecommended
2011-12 Change
ReappropriationsRecommended
2011-12State Operations 0 0 0 0 Aid To Localities 2,253,300,000 2,151,000,000 (102,300,000) 0 Capital Projects 0 0 0 1,007,000,000 Total 2,253,300,000 2,151,000,000 (102,300,000) 1,007,000,000
AID TO LOCALITIES
ALL FUNDS FINANCIAL REQUIREMENTS BY FUND TYPE APPROPRIATIONS
(dollars)
Fund Type Available
2010-11Recommended
2011-12 ChangeSpecial Revenue Funds - Other 2,253,300,000 2,151,000,000 (102,300,000) Total 2,253,300,000 2,151,000,000 (102,300,000)
AID TO LOCALITIES
ALL FUNDS FINANCIAL REQUIREMENTS BY PROGRAM APPROPRIATIONS
(dollars)
Program Available
2010-11Recommended
2011-12 ChangeDedicated Tax
Special Revenue Funds - Other 621,300,000 630,000,000 8,700,000 Metropolitan Transportation Authority
Support Program Special Revenue Funds - Other 1,632,000,000 1,521,000,000 (111,000,000)
Total 2,253,300,000 2,151,000,000 (102,300,000)
CAPITAL PROJECTS
ALL FUNDS FINANCIAL REQUIREMENTS BY PROGRAM APPROPRIATIONS
(dollars)
Comprehensive Construction Program Available
2010-11Recommended
2011-12 Change Reappropriations
2011-12Mass Transportation and Rail Freight
Metropolitan Transportation Authority Capital Projects Fund - Advances 0 0 0 36,000,000
Urban and Commuter Mass Transportation Bondable Capital Projects Fund - Rebuild Renew NY 2005
(Bondable 0 0 0 971,000,000 Total 0 0 0 1,007,000,000
231
DIVISION OF MILITARY AND NAVAL AFFAIRS MISSION The Division of Military and Naval Affairs’ (DMNA) primary mission is to maintain a well-trained military force ready to respond to civil emergencies, natural disasters, and threats to the nation’s security. ORGANIZATION AND STAFFING The Division of Military and Naval Affairs operates under the direction of the Adjutant General, who is appointed by the Governor. The Division consists of the New York Army National Guard, the New York Air National Guard, the Naval Militia, and the New York Guard all of which is overseen by State headquarters in Latham. DMNA operates 54 armories as well as 19 field and combined support maintenance facilities, 3 training sites, 6 Air National Guard facilities, 3 Aviation Support facilities and a Maneuver Area Training Equipment Site. BUDGET HIGHLIGHTS The 2011-12 Executive Budget recommends $106.8 million in All Funds spending ($16.1 million General Fund; $39.2 million Capital Projects; and $51.5 million Other Funds) to support ongoing agency activities. This reflects a net increase of $6.8 million (6.8 percent) from the 2010-11 Budget, and is primarily due to an $8.5 million increase in capital projects, offset by a 10 percent ($1.7 million) decrease in the General Fund. The Executive Budget reduces each agency’s General Fund State Operations budget by 10 percent. These savings are intended to be achieved through administrative efficiencies in non-personal service and negotiated workforce savings that minimize layoffs to the extent possible. PROGRAM HIGHLIGHTS The Military Readiness program is the core of the Division’s operations. It includes the New York Army National Guard, the New York Air National Guard, the New York Naval Militia and the New York Guard. With a combined force of nearly 20,000 members, the Military Readiness program has mounted a sustained activation since the terrorist attacks of September 2001 to safeguard the State’s citizenry from emerging security threats, while simultaneously meeting its obligations to support the Federal government. Other critical responses to civilian emergencies in recent years have included the abatement and mitigation of the effects of floods, blizzards, tornados, and forest fires. Empire Shield, a New York City based homeland security mission, involves flexible threat-based, rapid response units that provide security and deterrence at major transportation hubs throughout the metropolitan area. Empire Shield has been headquartered at Fort Hamilton since 2008.
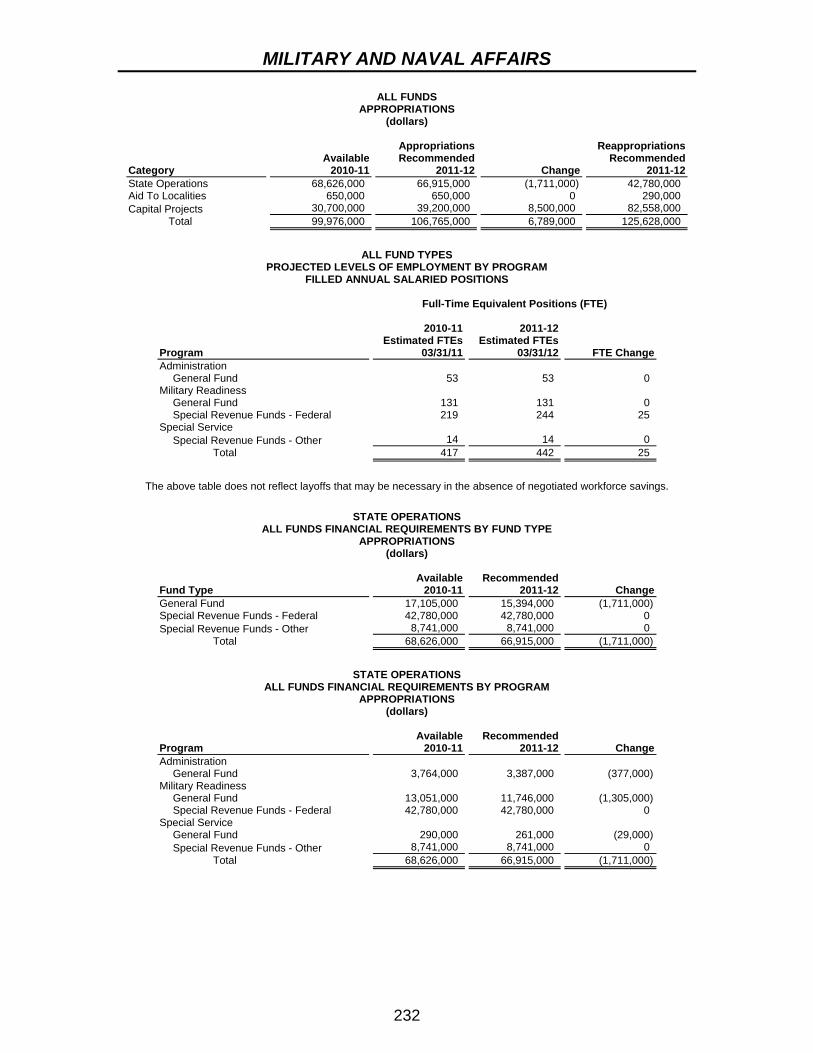
MILITARY AND NAVAL AFFAIRS
232
ALL FUNDS APPROPRIATIONS
(dollars)
Category Available
2010-11
AppropriationsRecommended
2011-12 Change
ReappropriationsRecommended
2011-12State Operations 68,626,000 66,915,000 (1,711,000) 42,780,000 Aid To Localities 650,000 650,000 0 290,000 Capital Projects 30,700,000 39,200,000 8,500,000 82,558,000 Total 99,976,000 106,765,000 6,789,000 125,628,000
ALL FUND TYPES
PROJECTED LEVELS OF EMPLOYMENT BY PROGRAM FILLED ANNUAL SALARIED POSITIONS
Full-Time Equivalent Positions (FTE)
Program
2010-11Estimated FTEs
03/31/11
2011-12Estimated FTEs
03/31/12 FTE ChangeAdministration
General Fund 53 53 0 Military Readiness
General Fund 131 131 0 Special Revenue Funds - Federal 219 244 25
Special Service Special Revenue Funds - Other 14 14 0
Total 417 442 25
The above table does not reflect layoffs that may be necessary in the absence of negotiated workforce savings.
STATE OPERATIONS
ALL FUNDS FINANCIAL REQUIREMENTS BY FUND TYPE APPROPRIATIONS
(dollars)
Fund Type Available
2010-11Recommended
2011-12 ChangeGeneral Fund 17,105,000 15,394,000 (1,711,000) Special Revenue Funds - Federal 42,780,000 42,780,000 0 Special Revenue Funds - Other 8,741,000 8,741,000 0 Total 68,626,000 66,915,000 (1,711,000)
STATE OPERATIONS
ALL FUNDS FINANCIAL REQUIREMENTS BY PROGRAM APPROPRIATIONS
(dollars)
Program Available
2010-11Recommended
2011-12 ChangeAdministration
General Fund 3,764,000 3,387,000 (377,000) Military Readiness
General Fund 13,051,000 11,746,000 (1,305,000) Special Revenue Funds - Federal 42,780,000 42,780,000 0
Special Service General Fund 290,000 261,000 (29,000) Special Revenue Funds - Other 8,741,000 8,741,000 0
Total 68,626,000 66,915,000 (1,711,000)

MILITARY AND NAVAL AFFAIRS
233
STATE OPERATIONS - GENERAL FUND SUMMARY OF PERSONAL SERVICE APPROPRIATIONS AND CHANGES
2011-12 RECOMMENDED (dollars)
Total Personal Service Regular
(Annual Salaried) Program Amount Change Amount ChangeAdministration 3,074,000 (342,000) 3,061,000 (340,000)Military Readiness 6,356,000 (706,000) 5,704,000 (634,000) Total 9,430,000 (1,048,000) 8,765,000 (974,000)
Temporary Service
(Nonannual Salaried) Holiday/Overtime Pay
Program Amount Change Amount ChangeAdministration 0 0 13,000 (2,000)Military Readiness 570,000 (63,000) 82,000 (9,000) Total 570,000 (63,000) 95,000 (11,000)
STATE OPERATIONS - GENERAL FUND
SUMMARY OF NONPERSONAL SERVICE AND MAINTENANCE UNDISTRIBUTED APPROPRIATIONS AND CHANGES
2011-12 RECOMMENDED (dollars)
Total Supplies and Materials Program Amount Change Amount ChangeAdministration 313,000 (35,000) 48,000 (5,000)Military Readiness 5,390,000 (599,000) 698,000 (58,000)Special Service 261,000 (29,000) 59,000 (7,000) Total 5,964,000 (663,000) 805,000 (70,000) Travel Contractual Services Program Amount Change Amount ChangeAdministration 17,000 (2,000) 153,000 (17,000)Military Readiness 63,000 (7,000) 4,496,000 (459,000)Special Service 11,000 (1,000) 108,000 (12,000) Total 91,000 (10,000) 4,757,000 (488,000) Equipment Maintenance Undistributed Program Amount Change Amount ChangeAdministration 95,000 (11,000) 0 0 Military Readiness 133,000 25,000 0 (100,000)Special Service 83,000 (9,000) 0 0 Total 311,000 5,000 0 (100,000)
STATE OPERATIONS - OTHER THAN GENERAL FUND
SUMMARY OF APPROPRIATIONS AND CHANGES 2011-12 RECOMMENDED
(dollars) Total Personal Service Program Amount Change Amount ChangeMilitary Readiness 42,780,000 0 12,098,000 (2,062,000)Special Service 8,741,000 0 1,191,000 0 Total 51,521,000 0 13,289,000 (2,062,000) Nonpersonal Service Program Amount Change Military Readiness 30,682,000 2,062,000 Special Service 7,550,000 0 Total 38,232,000 2,062,000

MILITARY AND NAVAL AFFAIRS
234
AID TO LOCALITIES ALL FUNDS FINANCIAL REQUIREMENTS BY FUND TYPE
APPROPRIATIONS (dollars)
Fund Type Available
2010-11Recommended
2011-12 ChangeGeneral Fund 650,000 650,000 0 Total 650,000 650,000 0
AID TO LOCALITIES
ALL FUNDS FINANCIAL REQUIREMENTS BY PROGRAM APPROPRIATIONS
(dollars)
Program Available
2010-11Recommended
2011-12 ChangeMilitary Readiness
General Fund 650,000 650,000 0 Total 650,000 650,000 0
CAPITAL PROJECTS
ALL FUNDS FINANCIAL REQUIREMENTS BY PROGRAM APPROPRIATIONS
(dollars)
Comprehensive Construction Program Available
2010-11Recommended
2011-12 Change Reappropriations
2011-12Design and Construction Supervision
Capital Projects Fund 5,100,000 6,200,000 1,100,000 12,037,000 Federal Capital Projects Fund 5,000,000 9,600,000 4,600,000 12,466,000
Maintenance and Improvements Capital Projects Fund 8,000,000 8,000,000 0 22,635,000 Federal Capital Projects Fund 12,600,000 15,400,000 2,800,000 35,420,000
Total 30,700,000 39,200,000 8,500,000 82,558,000

235
DEPARTMENT OF MOTOR VEHICLES MISSION The Department of Motor Vehicles (DMV) administers the State’s motor vehicle laws, provides quality customer service, promotes traffic safety, protects consumers, verifies identities, issues secure documents, provides information services, protects the privacy of personal information, and collects revenues for the benefit of the people of the State. ORGANIZATION AND STAFFING Under the direction of the Commissioner, who is appointed by the Governor subject to confirmation by the Senate, the Department operates from its main office in Albany (Empire State Plaza) and from three regional headquarters, in Albany, Long Island and New York City. The Department also operates 27 district and branch offices, which issue licenses and registrations. In addition, County Clerk offices act as DMV agents at 102 locations throughout the State. Dedicated funds and fees, including a portion of traffic violation fines in certain localities, support approximately 99 percent of the Department’s positions. The remaining 1 percent is funded with Federal grants. BUDGET HIGHLIGHTS The Executive Budget recommends $343 million All Funds for the Department of Motor Vehicles, a decrease of $13 million (-3.7 percent) All Funds from the 2010-11 budget. The Department will achieve this reduction by realizing the full-year value of personnel reductions completed in 2010-11 and by generating savings from agency redesign and efficiency improvements. The Executive Budget recommendations include an increase of $1.2 million in Federal funds due to a projected increase in grants to the Governor’s Traffic Safety Committee. The Dedicated Highway and Bridge Trust Fund, supported primarily by revenues from motor vehicle fees and highway use and motor fuel taxes, will supply $201 million, or 59 percent of DMV’s budget. The balance is provided by Federal funds and special revenue funds supported by various fees and fines. The Executive Budget reduces the agency’s operations expenses in the Dedicated Highway and Bridge Trust Fund by 10 percent. These savings are intended to be achieved through administrative efficiencies in non-personal service and negotiated workforce savings that minimize layoffs to the extent possible. PROGRAM HIGHLIGHTS CUSTOMER SERVICE DMV issues drivers licenses and vehicle registrations, collects more than $1.9 billion in revenue for the State and localities, monitors driver training and enforces the directives of local magistrates and departmental referees. State offices are also responsible for conducting road tests and maintaining enforcement sections that issue conditional and restricted use licenses and handle other suspension and revocation activities. The Department of Motor Vehicles served more than 20 million customers last year.

MOTOR VEHICLES
236
The Department also adjudicates traffic violations at 11 locations in New York City and several other jurisdictions across the State. This allows local judges and criminal courts to dedicate their activities to criminal matters. This program is funded entirely by fines collected from violators. After State operating expenses are deducted, remaining funds are returned to the jurisdictions where the violations occurred. The Department continues to enhance its website to provide customers an alternative means for transacting Department business. Through the convenience of personal computers, 3.26 million transactions were processed via the DMV website in 2009-10, more than double the 1.24 million in 2004-05. Through the Internet, customers can renew registrations and drivers licenses, order personalized and custom plates, order duplicate titles, registrations and licenses, plead and pay Traffic Violations Bureau (TVB) tickets, obtain accident reports, and if requested, post insurance proof. Customers can also check the status of plate or title orders, schedule road tests, pay certain fines, and obtain information and instructions from DMV’s Right Now Web knowledge base. Businesses with secure access can order supplies of inspection stickers and post lien information. VEHICLE AND DRIVER SAFETY Highway safety policies have resulted in reductions in fatalities and serious injuries on our roads. Contributing to this success have been new enforcement and educational efforts by State, local and non-profit agencies, including a statewide crackdown to stop those who drink and drive or engage in aggressive driving, initiatives to promote proper child safety seat usage and the statewide Click It or Ticket enforcement campaign, which has increased seatbelt usage to nearly 90 percent. These efforts have resulted in New York State’s roadways being some of the safest in the nation. DMV vehicle safety activities include: licensing and monitoring safety and emissions inspection stations; registering auto repair shops, dealers, transporters and dismantlers; and certifying vehicle inspectors, junk and salvage businesses and automotive body damage estimators. Driver safety initiatives include implementation and oversight of educational or rehabilitative programs for motorists convicted of alcohol- or drug-related driving offenses, the point insurance reduction program and pre-licensing courses. DMV also licenses and monitors driving schools and instructors. FIELD INVESTIGATION AND AUDIT One of the Department’s major functions is to issue credentials that establish the identity and license status of drivers, the ownership of vehicles and boats, and the authenticity of auto-related businesses. External investigation activities focus on stolen automobiles, odometer fraud, fraudulent identity and motor vehicle documents, and complaints regarding unlicensed and suspended drivers.

MOTOR VEHICLES
237
ALL FUNDS APPROPRIATIONS
(dollars)
Category Available
2010-11
AppropriationsRecommended
2011-12 Change
ReappropriationsRecommended
2011-12State Operations 118,368,000 121,312,000 2,944,000 54,450,000 Aid To Localities 20,410,000 20,620,000 210,000 46,510,000 Capital Projects 217,842,000 201,137,000 (16,705,000) 2,500,000 Total 356,620,000 343,069,000 (13,551,000) 103,460,000
ALL FUND TYPES
PROJECTED LEVELS OF EMPLOYMENT BY PROGRAM FILLED ANNUAL SALARIED POSITIONS
Full-Time Equivalent Positions (FTE)
Program
2010-11Estimated FTEs
03/31/11
2011-12Estimated FTEs
03/31/12 FTE ChangeAdministrative Adjudication
Special Revenue Funds - Other 373 373 0 Clean Air
Special Revenue Funds - Other 231 231 0 Compulsory Insurance
Special Revenue Funds - Other 189 189 0 Governor’s Traffic Safety Committee
Special Revenue Funds - Federal 16 16 0 Transportation Safety
Special Revenue Funds - Other 3 3 0 Transportation Support
Capital Projects Funds - Other 1,660 1,660 0 Total 2,472 2,472 0
The above table does not reflect layoffs that may be necessary in the absence of negotiated workforce savings.
STATE OPERATIONS ALL FUNDS FINANCIAL REQUIREMENTS BY FUND TYPE
APPROPRIATIONS (dollars)
Fund Type Available
2010-11Recommended
2011-12 ChangeSpecial Revenue Funds - Federal 16,390,000 17,381,000 991,000 Special Revenue Funds - Other 90,478,000 90,431,000 (47,000) Internal Service Funds 11,500,000 13,500,000 2,000,000 Total 118,368,000 121,312,000 2,944,000 Adjustments: Transfer(s) From
Special Pay Bill Special Revenue Funds - Other (47,000)
Appropriated 2010-11 118,321,000

MOTOR VEHICLES
238
STATE OPERATIONS ALL FUNDS FINANCIAL REQUIREMENTS BY PROGRAM
APPROPRIATIONS (dollars)
Program Available
2010-11Recommended
2011-12 ChangeAdministration
Special Revenue Funds - Other 1,447,000 1,400,000 (47,000) Internal Service Funds 11,500,000 13,500,000 2,000,000
Administrative Adjudication Special Revenue Funds - Other 45,272,000 45,272,000 0
Clean Air Special Revenue Funds - Other 25,595,000 25,595,000 0
Compulsory Insurance Special Revenue Funds - Other 16,167,000 16,167,000 0
Governor’s Traffic Safety Committee Special Revenue Funds - Federal 16,390,000 17,381,000 991,000
Transportation Safety Special Revenue Funds - Other 1,997,000 1,997,000 0
Total 118,368,000 121,312,000 2,944,000
STATE OPERATIONS - OTHER THAN GENERAL FUND
SUMMARY OF APPROPRIATIONS AND CHANGES 2011-12 RECOMMENDED
(dollars) Total Personal Service Program Amount Change Amount ChangeAdministration 14,900,000 1,953,000 0 (31,000)Administrative Adjudication 45,272,000 0 23,056,000 0 Clean Air 25,595,000 0 14,645,000 0 Compulsory Insurance 16,167,000 0 9,380,000 0 Governor’s Traffic Safety Committee 17,381,000 991,000 526,000 0 Transportation Safety 1,997,000 0 270,000 0 Total 121,312,000 2,944,000 47,877,000 (31,000) Nonpersonal Service Maintenance Undistributed Program Amount Change Amount ChangeAdministration 14,900,000 1,984,000 0 0 Administrative Adjudication 22,216,000 0 0 0 Clean Air 10,950,000 0 0 0 Compulsory Insurance 6,787,000 0 0 0 Governor’s Traffic Safety Committee 315,100 (7,370) 16,539,900 998,370 Transportation Safety 1,727,000 0 0 0 Total 56,895,100 1,976,630 16,539,900 998,370
AID TO LOCALITIES
ALL FUNDS FINANCIAL REQUIREMENTS BY FUND TYPE APPROPRIATIONS
(dollars)
Fund Type Available
2010-11Recommended
2011-12 ChangeSpecial Revenue Funds - Federal 20,410,000 20,620,000 210,000 Total 20,410,000 20,620,000 210,000
AID TO LOCALITIES
ALL FUNDS FINANCIAL REQUIREMENTS BY PROGRAM APPROPRIATIONS
(dollars)
Program Available
2010-11Recommended
2011-12 ChangeGovernor’s Traffic Safety Committee
Special Revenue Funds - Federal 20,410,000 20,620,000 210,000 Total 20,410,000 20,620,000 210,000

MOTOR VEHICLES
239
CAPITAL PROJECTS ALL FUNDS FINANCIAL REQUIREMENTS BY PROGRAM
APPROPRIATIONS (dollars)
Comprehensive Construction Program Available
2010-11Recommended
2011-12 Change Reappropriations
2011-12Transportation Support
Dedicated Highway and Bridge Trust Fund 217,842,000 201,137,000 (16,705,000) 2,500,000 Total 217,842,000 201,137,000 (16,705,000) 2,500,000

240
OLYMPIC REGIONAL DEVELOPMENT AUTHORITY
MISSION In 1980, Lake Placid and the surrounding areas hosted the Winter Olympic Games. The following year, the Olympic Regional Development Authority was established to create and administer a post-Olympic program for the Lake Placid facilities. These facilities include: the Olympic Ice Center; the Olympic Speedskating Oval; the Whiteface Mountain Ski Area and Veterans’ Memorial Highway; the Mt. Van Hoevenberg Complex that includes bobsled and luge runs, cross-country ski trails and a biathlon range; the Olympic Ski Jumping Complex; and the U.S. Olympic Training Center. In 1984, the Olympic Regional Development Authority’s responsibility expanded to include the management of the Gore Mountain Ski Center in North Creek, Warren County. ORGANIZATION AND STAFFING The Authority is governed by a ten-member Board of Directors, consisting of the commissioners of Economic Development, Environmental Conservation, Parks and seven other members appointed by the Governor and confirmed by the Senate. The Governor selects one member as Chair. Board members serve without compensation. BUDGET HIGHLIGHTS The 2011-12 Executive Budget recommends $5 million for the Olympic Regional Development Authority, which is approximately 15 percent of its $32.4 million operating budget. This is a decrease of $522,000 (-9.5 percent) from the 2010-11 budget, reflecting a 10 percent year-to-year reduction in General Fund State operations support. In addition to $4.7 million in State Operations funding and $354,000 for the Winter Sports Education and Olympic Training Center Special Revenue Funds, the Authority receives $26.6 million from marketing, ticket sales, fees and other revenues; and over $900,000 from the Town of North Elba. PROGRAM HIGHLIGHTS OLYMPIC FACILITIES The Olympic Regional Development Authority manages one of four primary sites (the others being in California, Colorado and Utah) for year-round training of America’s Olympic athletes. The Authority hosts numerous national and international athletic and entertainment events. In 2010, major events included: North Atlantic Figure Skating Championship, Smucker’s Stars on Ice, World Cup Bob/Skeleton FIBT Tour, America’s Bobsled & Skeleton, Ice Skating Institute Figure Skating Competition, Nature Valley Freestyle Grand National, Intercontinental Cup Skeleton, Eastern Synchronized Skating Championship, Disney On Ice, America’s Cup Bobsled and Skeleton, and several festivals and shows.

OLYMPIC REGIONAL DEVELOPMENT
241
SKI FACILITIES The Authority also manages the Gore and Whiteface Mountain ski centers, two major downhill ski facilities, that hosted more than 482,000 visitors in 2010.
ALL FUNDS APPROPRIATIONS
(dollars)
Category Available
2010-11
AppropriationsRecommended
2011-12 Change
ReappropriationsRecommended
2011-12State Operations 5,576,000 5,054,000 (522,000) 0 Aid To Localities 0 0 0 0 Capital Projects 0 0 0 0 Total 5,576,000 5,054,000 (522,000) 0
STATE OPERATIONS
ALL FUNDS FINANCIAL REQUIREMENTS BY FUND TYPE APPROPRIATIONS
(dollars)
Fund Type Available
2010-11Recommended
2011-12 ChangeGeneral Fund 5,222,000 4,700,000 (522,000) Special Revenue Funds - Other 354,000 354,000 0 Total 5,576,000 5,054,000 (522,000)
STATE OPERATIONS
ALL FUNDS FINANCIAL REQUIREMENTS BY PROGRAM APPROPRIATIONS
(dollars)
Program Available
2010-11Recommended
2011-12 ChangeOperations
General Fund 5,222,000 4,700,000 (522,000) Special Revenue Funds - Other 354,000 354,000 0
Total 5,576,000 5,054,000 (522,000)
STATE OPERATIONS - GENERAL FUND
SUMMARY OF PERSONAL SERVICE APPROPRIATIONS AND CHANGES 2011-12 RECOMMENDED
(dollars)
Total Personal Service Regular
(Annual Salaried) Program Amount Change Amount ChangeOperations 2,849,000 (316,000) 2,849,000 (316,000) Total 2,849,000 (316,000) 2,849,000 (316,000)

OLYMPIC REGIONAL DEVELOPMENT
242
STATE OPERATIONS - GENERAL FUND SUMMARY OF NONPERSONAL SERVICE AND MAINTENANCE UNDISTRIBUTED
APPROPRIATIONS AND CHANGES 2011-12 RECOMMENDED
(dollars) Total Supplies and Materials Program Amount Change Amount ChangeOperations 1,851,000 (206,000) 694,000 (77,000) Total 1,851,000 (206,000) 694,000 (77,000) General State Charges Program Amount Change Operations 1,157,000 (129,000) Total 1,157,000 (129,000)
STATE OPERATIONS - OTHER THAN GENERAL FUND
SUMMARY OF APPROPRIATIONS AND CHANGES 2011-12 RECOMMENDED
(dollars) Total Personal Service Program Amount Change Amount ChangeOperations 354,000 0 178,000 27,000 Total 354,000 0 178,000 27,000 Nonpersonal Service Program Amount Change Operations 176,000 (27,000) Total 176,000 (27,000)

243
OFFICE OF PARKS, RECREATION AND HISTORIC PRESERVATION
MISSION The Office of Parks, Recreation and Historic Preservation’s (OPRHP) mission is to provide safe and enjoyable recreational and interpretive opportunities for all New York State residents and visitors, and to be responsible stewards of our valuable natural, historic, and cultural resources. The Office operates and maintains 178 parks and 35 historic sites, hosts a multitude of cultural and educational programs and offers diverse recreational opportunities, ranging from secluded campsites to the internationally renowned Niagara Falls State Park. The State’s parks and historic sites host approximately 55 million visitors annually. New York’s park system and its unparalleled recreational opportunities are an important factor in the State’s tourism industry and economy. Services open to the public at State parks include beaches, golf courses, performing arts centers, swimming pools, marinas, cabins, campgrounds and many significant historic properties, bird conservation, wildlife habitat and natural areas. ORGANIZATION AND STAFFING The Office is headed by a Commissioner appointed by the Governor. Operations are administered through a network of 11 regional offices: Allegany, Central, Finger Lakes, Genesee, Long Island, New York City, Niagara, Palisades, Saratoga/Capital District, Taconic and Thousand Islands. The central office, which includes executive staff and other administrative support functions, is located in Albany. BUDGET HIGHLIGHTS The Executive Budget recommends $270 million in All Funds spending, including $119 million from the General Fund; $9.8 million in Federal funds and $140.6 million from other funds. This is a cumulative decrease of $17.7 million (-6.2 percent) from the prior year spending level. The Executive Budget reduces each agency’s General Fund State Operations budget by 10 percent. These savings are intended to be achieved through administrative efficiencies in non-personal service and negotiated workforce savings that minimize layoffs to the extent possible. Taxpayer dollars continue to be the primary source of support for State parks, providing nearly 56 percent of total funding. Patron user fees pay for approximately 41 percent of annual costs, while Federal grants comprise the remaining revenues. The primary focus of the OPRHP capital program is the health and safety of park visitors and the maintenance and rehabilitation of existing facilities. Park facilities include more than 5,000 buildings, 29 golf courses, 53 water recreational facilities, 76 beaches, 27 marinas, 40 vacation rentals, 18 nature centers, 817 cabins and 8,355 campsites. The Office also maintains hundreds of miles of roads and over 1,350 miles of trails, expansive utility systems, 106 dams and 604 bridges. For 2011-12, appropriations of $29 million are recommended for capital projects from the State Park Infrastructure Fund, a dedicated fund consisting of revenues generated from day use and camping fees at the parks, as well as concession revenues and other miscellaneous revenues. Budget recommendations also include $4 million in

PARKS, RECREATION AND HISTORIC PRESERVATION
244
Federal appropriations for Federal Land and Water Conservation funding, $10 million in fiduciary appropriations for other potential gifts to improve various parks and $3.8 million for miscellaneous capital projects. Funding from the State Park Infrastructure Fund will be supplemented by the Federal Land and Water Conservation Fund and the Environmental Protection Fund (EPF). In 2011-12, the EPF will provide $16.2 million for infrastructure and stewardship projects for both OPRHP and the Department of Environmental Conservation. PROGRAM HIGHLIGHTS The Office’s mission is carried out through its operation of 213 parks and historic sites, providing safe and attractive facilities, accessible and affordable services and quality visitor experiences. In response to reduced funding levels, OPRHP has reorganized functions and consolidated management operations, and continues to achieve efficiencies by streamlining administrative oversight, redeploying staff and consolidating functions. To enhance park facilities and support events, OPRHP continues to foster public-private partnerships, including corporate sponsorships. The responsibilities of the Office are carried out through four major programs:
Administration provides executive direction, fiscal, personnel and public communication services, as well as management of the capital program;
Park Operations operates the State’s 178 parks in the 11 Park regions throughout the State. Staff includes a statewide police force, security, field operations, and maintenance personnel;
Historic Preservation oversees preservation activities at 35 historic sites, develops a statewide Comprehensive Historic Preservation Plan and maintains the State Register of Historic Places; and
The Natural Heritage Trust receives and administers funds, including private gifts and bequests, to advance conservation, outdoor recreation and historic preservation purposes. Created under the Public Authorities Law in 1968, the Natural Heritage Trust is a public benefit corporation.
ALL FUNDS
APPROPRIATIONS (dollars)
Category Available
2010-11
AppropriationsRecommended
2011-12 Change
ReappropriationsRecommended
2011-12State Operations 228,089,400 214,266,000 (13,823,400) 17,869,800 Aid To Localities 12,675,000 8,805,000 (3,870,000) 17,127,600 Capital Projects 46,801,000 46,801,000 0 198,537,000 Total 287,565,400 269,872,000 (17,693,400) 233,534,400

PARKS, RECREATION AND HISTORIC PRESERVATION
245
ALL FUND TYPES PROJECTED LEVELS OF EMPLOYMENT BY PROGRAM
FILLED ANNUAL SALARIED POSITIONS Full-Time Equivalent Positions (FTE)
Program
2010-11Estimated FTEs
03/31/11
2011-12Estimated FTEs
03/31/12 FTE ChangeAdministration
General Fund 59 59 0 Historic Preservation
General Fund 122 122 0 Special Revenue Funds - Federal 9 9 0
Park Operations General Fund 1,265 1,265 0 Special Revenue Funds - Federal 5 5 0 Special Revenue Funds - Other 210 210 0 Capital Projects Funds - Other 112 112 0
Recreation Services General Fund 3 3 0
Total 1,785 1,785 0
The above table does not reflect layoffs that may be necessary in the absence of negotiated workforce savings.
STATE OPERATIONS
ALL FUNDS FINANCIAL REQUIREMENTS BY FUND TYPE APPROPRIATIONS
(dollars)
Fund Type Available
2010-11Recommended
2011-12 ChangeGeneral Fund 132,734,600 119,461,200 (13,273,400) Special Revenue Funds - Federal 5,700,900 6,650,900 950,000 Special Revenue Funds - Other 88,153,900 88,153,900 0 Enterprise Funds 1,500,000 0 (1,500,000) Total 228,089,400 214,266,000 (13,823,400) Adjustments: Transfer(s) From
Special Pay Bill General Fund (886,000) Special Revenue Funds - Other (122,000)
Appropriated 2010-11 227,081,400
STATE OPERATIONS ALL FUNDS FINANCIAL REQUIREMENTS BY PROGRAM
APPROPRIATIONS (dollars)
Program Available
2010-11Recommended
2011-12 ChangeAdministration
General Fund 7,049,900 6,201,200 (848,700) Special Revenue Funds - Federal 500,000 500,000 0 Special Revenue Funds - Other 500,000 500,000 0
Historic Preservation General Fund 10,918,800 8,880,700 (2,038,100) Special Revenue Funds - Federal 1,200,900 1,350,900 150,000 Special Revenue Funds - Other 42,000 42,000 0
Park Operations General Fund 112,584,500 102,534,400 (10,050,100) Special Revenue Funds - Federal 4,000,000 4,800,000 800,000 Special Revenue Funds - Other 87,611,900 87,611,900 0
Recreation Services General Fund 2,181,400 1,844,900 (336,500) Enterprise Funds 1,500,000 0 (1,500,000)
Total 228,089,400 214,266,000 (13,823,400)
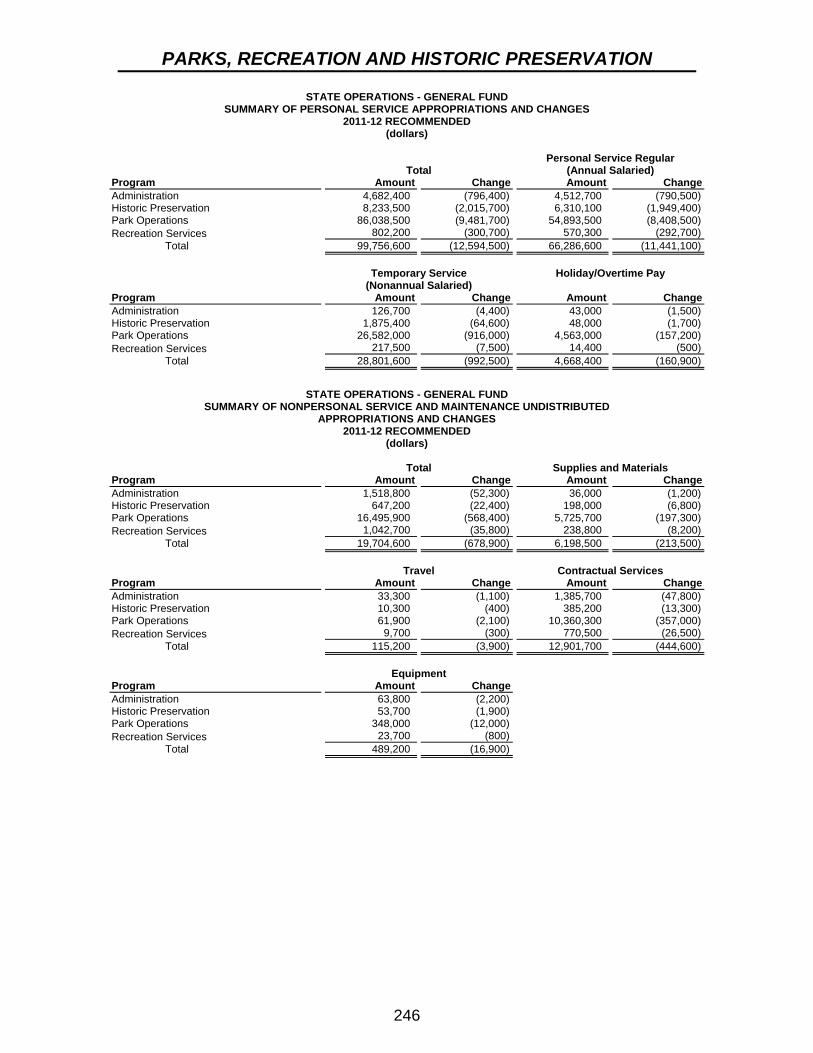
PARKS, RECREATION AND HISTORIC PRESERVATION
246
STATE OPERATIONS - GENERAL FUND SUMMARY OF PERSONAL SERVICE APPROPRIATIONS AND CHANGES
2011-12 RECOMMENDED (dollars)
Total Personal Service Regular
(Annual Salaried) Program Amount Change Amount ChangeAdministration 4,682,400 (796,400) 4,512,700 (790,500)Historic Preservation 8,233,500 (2,015,700) 6,310,100 (1,949,400)Park Operations 86,038,500 (9,481,700) 54,893,500 (8,408,500)Recreation Services 802,200 (300,700) 570,300 (292,700) Total 99,756,600 (12,594,500) 66,286,600 (11,441,100)
Temporary Service
(Nonannual Salaried) Holiday/Overtime Pay
Program Amount Change Amount ChangeAdministration 126,700 (4,400) 43,000 (1,500)Historic Preservation 1,875,400 (64,600) 48,000 (1,700)Park Operations 26,582,000 (916,000) 4,563,000 (157,200)Recreation Services 217,500 (7,500) 14,400 (500) Total 28,801,600 (992,500) 4,668,400 (160,900)
STATE OPERATIONS - GENERAL FUND
SUMMARY OF NONPERSONAL SERVICE AND MAINTENANCE UNDISTRIBUTED APPROPRIATIONS AND CHANGES
2011-12 RECOMMENDED (dollars)
Total Supplies and Materials Program Amount Change Amount ChangeAdministration 1,518,800 (52,300) 36,000 (1,200)Historic Preservation 647,200 (22,400) 198,000 (6,800)Park Operations 16,495,900 (568,400) 5,725,700 (197,300)Recreation Services 1,042,700 (35,800) 238,800 (8,200) Total 19,704,600 (678,900) 6,198,500 (213,500) Travel Contractual Services Program Amount Change Amount ChangeAdministration 33,300 (1,100) 1,385,700 (47,800)Historic Preservation 10,300 (400) 385,200 (13,300)Park Operations 61,900 (2,100) 10,360,300 (357,000)Recreation Services 9,700 (300) 770,500 (26,500) Total 115,200 (3,900) 12,901,700 (444,600) Equipment Program Amount Change Administration 63,800 (2,200) Historic Preservation 53,700 (1,900) Park Operations 348,000 (12,000) Recreation Services 23,700 (800) Total 489,200 (16,900)

PARKS, RECREATION AND HISTORIC PRESERVATION
247
STATE OPERATIONS - OTHER THAN GENERAL FUND SUMMARY OF APPROPRIATIONS AND CHANGES
2011-12 RECOMMENDED (dollars)
Total Personal Service Program Amount Change Amount ChangeAdministration 1,000,000 0 175,000 0 Historic Preservation 1,392,900 150,000 500,000 0 Park Operations 92,411,900 800,000 32,265,100 83,000 Recreation Services 0 (1,500,000) 0 0 Total 94,804,800 (550,000) 32,940,100 83,000 Nonpersonal Service Maintenance Undistributed Program Amount Change Amount ChangeAdministration 825,000 0 0 0 Historic Preservation 892,900 150,000 0 0 Park Operations 60,146,800 2,379,000 0 (1,662,000)Recreation Services 0 (1,500,000) 0 0 Total 61,864,700 1,029,000 0 (1,662,000)
AID TO LOCALITIES
ALL FUNDS FINANCIAL REQUIREMENTS BY FUND TYPE APPROPRIATIONS
(dollars)
Fund Type Available
2010-11Recommended
2011-12 ChangeGeneral Fund 2,920,000 0 (2,920,000) Special Revenue Funds - Federal 4,120,000 3,170,000 (950,000) Special Revenue Funds - Other 5,635,000 5,635,000 0 Total 12,675,000 8,805,000 (3,870,000)
AID TO LOCALITIES
ALL FUNDS FINANCIAL REQUIREMENTS BY PROGRAM APPROPRIATIONS
(dollars)
Program Available
2010-11Recommended
2011-12 ChangeAdministration
General Fund 2,920,000 0 (2,920,000) Historic Preservation
Special Revenue Funds - Federal 120,000 170,000 50,000 Park Operations
Special Revenue Funds - Federal 2,000,000 1,500,000 (500,000) Special Revenue Funds - Other 5,635,000 5,635,000 0
Recreation Services Special Revenue Funds - Federal 2,000,000 1,500,000 (500,000)
Total 12,675,000 8,805,000 (3,870,000)

PARKS, RECREATION AND HISTORIC PRESERVATION
248
CAPITAL PROJECTS ALL FUNDS FINANCIAL REQUIREMENTS BY PROGRAM
APPROPRIATIONS (dollars)
Comprehensive Construction Program Available
2010-11Recommended
2011-12 Change Reappropriations
2011-12Parks EQBA 86
Capital Projects Fund - EQBA 86 (Bondable) 0 0 0 2,754,000 Natural Heritage Trust
Capital Projects Fund 0 0 0 300,000 Federal Capital Projects Fund
Federal Capital Projects Fund 4,000,000 4,000,000 0 17,428,000 Maintenance and Improvements of Existing Facilities
Fiduciary Funds - Misc. Combined Expendable Trust Fund 10,000,000 10,000,000 0 47,855,000
State Parks Infrastructure Fund 29,001,000 29,001,000 0 117,443,000 Misc. Capital Projects 3,800,000 3,800,000 0 11,744,000
Outdoor Recreation Development Bond Fund Outdoor Recreation Development Bond Fund 0 0 0 230,000
Parks and Recreation Land Acquisition Bond Fund Parks and Recreation Land Acquisition Bond Fund 0 0 0 783,000
Total 46,801,000 46,801,000 0 198,537,000

249
NEW YORK STATE PUBLIC AUTHORITIES Public authorities are statutorily created agents of State and local government, established primarily to finance, build, manage or improve specific capital facilities that serve public purposes. Enacted into law as independent and autonomous public benefit corporations, public authorities are governed by boards of directors whose members serve by virtue of their public positions or their appointment by the Governor, the Legislature or local officials. With their statutorily granted management and operating flexibility, public authorities are an effective means to address public needs, which may not otherwise be met within the limitations imposed on traditional government agencies. Public authorities derive their powers and responsibilities from the legislation by which they are established. The Public Authorities Accountability Act of 2005 opened the operations and financial dealings of public authorities to enhanced public scrutiny. State and local public authorities must now adhere to accepted corporate governance standards, disclose their budgets, indebtedness, independent audit reports, financial statements and activities, and follow prescribed procedures for the custody, control and disposition of real property. It had been the responsibility of the Authority Budget Office (ABO), created in 2006, to monitor and assess compliance with these governance and reporting requirements. Enactment of the Public Authorities Reform Act of 2009 (Chapter 506 of the Laws of 2009) restructured the ABO as the independent Authorities Budget Office with additional oversight, regulatory and enforcement responsibilities. By law, the Authorities Budget Office examines and reports on the operations, practices and finances of public authorities; enforces compliance with State law and initiates actions against public authorities and their boards of directors for noncompliance; and provides guidance to public authorities on ways to adhere to the principles of accountability, transparency and effective corporate governance. The Authorities Budget Office is also authorized to make recommendations to the Governor and the Legislature concerning the performance, structure, formation and oversight of public authorities, public authority debt, procurement, and property transaction practices, and to ensure that directors receive training on the fiduciary, legal and ethical obligations of board members. These actions are intended to strengthen public confidence in the decisions and actions taken by public authorities, their boards of directors and executive management. Detailed information on a number of public authorities reflected in Tables 1 through 4 can be found elsewhere in this Executive Budget. These authorities include: BRIDGE, TUNNEL AND HIGHWAY Thruway Authority ECONOMIC DEVELOPMENT Development Authority of the North Country Empire State Development Corporation ENERGY AND ENVIRONMENT Energy Research and Development Authority Environmental Facilities Corporation

PUBLIC AUTHORITIES
250
HOUSING AND FINANCE Housing Finance Agency Local Government Assistance Corporation State of New York Mortgage Agency REGIONAL TRANSPORTATION Metropolitan Transportation Authority Public authorities that are not included elsewhere in the Executive Budget are discussed below: BRIDGE, TUNNEL AND HIGHWAY AUTHORITIES Buffalo and Fort Erie Public Bridge Authority The Buffalo and Fort Erie Public Bridge Authority is a bi-national entity that owns and operates the “Peace Bridge”, which crosses the Niagara River between Buffalo and Fort Erie, Ontario. The Authority is mainly financed through toll revenue and property lease revenue. New York State Bridge Authority The New York State Bridge Authority is responsible for the Bear Mountain, Kingston-Rhinecliff, Mid-Hudson, Newburgh-Beacon and Rip Van Winkle toll bridges that span the lower Hudson River. The Authority is mainly financed through toll revenue. Thousand Islands Bridge Authority The Thousand Islands Bridge Authority operates two bridges connecting U.S. Interstate 81 in Jefferson County with Highway 401 in Ontario, Canada. The Authority also operates a sewage treatment facility and recreational facilities. The Authority is mainly financed through toll revenue and service fees. ECONOMIC DEVELOPMENT AUTHORITIES Battery Park City Authority The Battery Park City Authority (BPCA) is a public benefit corporation charged with the management and development of Battery Park City, a 92-acre mixed-use community located on the southwest tip of Manhattan. The Authority generates revenues by leasing individual plots of land to private developers through a public bid process. It collects rents and real estate tax equivalency payments to support its operations. The Authority’s adoption of environmental building guidelines in early 2000 resulted in the construction of the nation’s first sustainable residential high-rise. When Battery Park City is completed, it will contain nearly five million square feet of sustainable construction – the largest concentration of “green” buildings in the world.

PUBLIC AUTHORITIES
251
New York City Off-Track Betting Corporation New York City Off Track Betting Corporation (NYCOTB) was established forty years ago to take wagers on horse racing in order to generate governmental revenues, provide additional revenues for the horse racing industry and to eliminate illegal wagering on horse races. On December 8, 2010 NYCOTB ceased operations and began the orderly liquidation of the Corporation’s remaining assets. United Nations Development Corporation The United Nations Development Corporation develops and manages commercial and residential facilities for United Nations-related activities in New York City, including One, Two and Three United Nations Plaza. The Corporation does not rely on any State support to pay debt service or for its own operations. ENERGY AND ENVIRONMENTAL AUTHORITIES New York Power Authority The New York Power Authority finances, builds and operates electric generation and transmission facilities. It currently owns and operates five major generating facilities, five small hydroelectric facilities, 11 small natural gas powered generating plants and more than 1,400 circuit miles of transmission lines. The Authority supplies economical electric power to New York State’s municipal electric systems and rural electric cooperatives, private sector businesses and not-for-profit institutions throughout the State, municipalities and public corporations in the New York City metropolitan area, and investor-owned utilities for resale to their customers. The Authority receives no State subsidy. It generally finances construction projects through sales of bonds and notes and pays the related debt service with revenues from the generation and transmission of electricity. Long Island Power Authority The Long Island Power Authority (LIPA) has the broad authority and responsibility to ensure adequate, dependable and affordable electric service within its service area, including Nassau and Suffolk counties and the Rockaway Peninsula in Queens. LIPA serves approximately 1.1 million residential and commercial electricity customers. No State tax dollars are used to fund the Authority. HOUSING AND FINANCE AUTHORITIES Dormitory Authority The Dormitory Authority provides financing, construction management, planning and design, and purchasing services for higher and secondary education, not-for-profit health care, judicial and other not-for-profit institutions. The Authority funds its operations from its own client-generated revenues.

PUBLIC AUTHORITIES
252
Municipal Assistance Corporation for the City of Troy The Municipal Assistance Corporation for the City of Troy was created in 1995 to provide the City with access to credit markets and to oversee Troy’s fiscal affairs. The Authority is subject to a debt cap of $75 million. The State is authorized, subject to legislative review and appropriation, to provide moneys as necessary to ensure a 1.5:1 debt service coverage ratio on Authority debt. No State moneys are used to finance the Corporation, and failure of the State to appropriate State aid to the City does not constitute an event of default for Corporation obligations. Nassau County Interim Finance Authority The Nassau County Interim Finance Authority was established in 2000 to restore fiscal stability to Nassau County by overseeing its finances and issuing debt on its behalf. Authority debt service and operating expenses are funded with County sales tax revenues, on which the Authority has first lien. Buffalo Fiscal Stability Authority The Buffalo Fiscal Stability Authority was established in 2003 to restore fiscal health to the City of Buffalo by overseeing its finances and issuing debt on its behalf. Authority debt service and operating expenses are funded with City sales tax revenues and aid to municipalities on which the Authority has first lien. Municipal Bond Bank Agency The Municipal Bond Bank Agency was established in 1972 to provide low-cost capital financing to towns, villages, cities and counties. In addition, the Agency is authorized to issue special program bonds and tax lien collateralized securities. The Agency is staffed by the Housing Finance Agency. No State tax dollars are used to fund the Agency. Tobacco Settlement Financing Corporation The Tobacco Settlement Financing Corporation (TSFC) is a subsidiary of the Municipal Bond Bank Agency, established by statute in June 2003 to securitize amounts to be received by the State of New York under the Master Settlement Agreement (MSA) entered into in 1998 by the State, the other “settling jurisdictions” and certain participating cigarette manufacturers. In June 2003, TSFC issued $2.3 billion of bonds backed by 50 percent of the anticipated MSA funds. In December 2003, TSFC issued an additional $2.2 billion of bonds backed by the remaining 50 percent of the anticipated MSA funds.

PUBLIC AUTHORITIES
253
PORT DEVELOPMENT AUTHORITIES Albany Port District Commission The Albany Port District Commission develops and operates port facilities in the cities of Albany and Rensselaer. Lease revenues account for the majority of the Port’s annual revenue, with maritime traffic making up the remainder. No State tax dollars are used to fund the Commission. Ogdensburg Bridge and Port Authority The Ogdensburg Bridge and Port Authority (OBPA) operates a 1.5 mile international bridge crossing between Ogdensburg, New York and Prescott, Ontario, Canada, as well as the Port of Ogdensburg Marine Terminal, Ogdensburg International Airport, and two industrial parks, and owns a thirty-mile rail line connecting to the CSX rail system. No State tax dollars are used to fund the Authority. Port Authority of New York and New Jersey The Port Authority of New York and New Jersey was created in 1921 to improve port and transportation facilities in the New York metropolitan area. The Port Authority operates many of the busiest and most important transportation links in the region, including the five major regional airports and the associated AirTrain network, all of the bridges and tunnels that connect New York and New Jersey, the Port of New York and New Jersey, the PATH transit system and the bus terminals at 42nd Street and the George Washington Bridge. The Port Authority also owns the World Trade Center site in Lower Manhattan and is engaged in rebuilding the public projects at the site. The revenues of the Port Authority are completely independent from any Federal, State or local taxes and are derived principally from the tolls, fares, landing and dockage fees, rentals and other charges for the use of Port Authority facilities. In addition, the Port Authority has the power to issue bonds, notes and other obligations needed to raise the necessary funds for the improvement, construction or acquisition of its facilities generally. These instruments are sold on the basis of the Authority’s own credit and are not obligations of New York State or New Jersey. Port of Oswego Authority The Port of Oswego Authority operates port facilities in the Oswego Port District, which includes the City of Oswego, the Town of Scriba, and all waters of the Oswego River and Lake Ontario within its boundaries. The Authority operates a commercial shipping terminal and storage facilities and supports recreational boating activities at three marinas. No State tax dollars are used to fund the Authority.

PUBLIC AUTHORITIES
254
REGIONAL TRANSPORTATION AUTHORITIES Capital District Transportation Authority The Capital District Transportation Authority (CDTA) provides public transportation service within Albany, Rensselaer, Saratoga and Schenectady counties. State funding for the CDTA is provided through appropriations to the New York State Department of Transportation. Central New York Regional Transportation Authority The Central New York Regional Transportation Authority (CNYRTA) provides public transportation service within Central New York through four subsidiary corporations: CNY Centro (Onondaga County); Centro of Oswego (Oswego County); Centro of Oneida (Oneida County); and Centro of Cayuga (Cayuga County). State funding for CNYTRA is provided through appropriations to the New York State Department of Transportation. Niagara Frontier Transportation Authority The Niagara Frontier Transportation Authority (NFTA) oversees the operations of a public transportation system providing bus, rail and paratransit services in Niagara and Erie counties. The Authority also operates the Buffalo Niagara International Airport, a primary commercial airport, and the Niagara Falls International Airport, a joint-use military/general aviation airport that serves as a reliever airport. Additionally, the NFTA operates a small boat harbor and two metro transit centers that serve as primary terminals for private inter-city bus service for Niagara and Erie counties. State funding for the NFTA is provided through appropriations to the New York State Department of Transportation. Rochester-Genesee Regional Transportation Authority The Rochester-Genesee Regional Transportation Authority (RGRTA) provides public transportation service in the counties of Genesee, Livingston, Monroe, Orleans, Seneca, Wayne and Wyoming. The Authority operates the Regional Transit Service (Rochester area), Wayne Area Transportation System, Livingston Area Transportation Service, Orleans Transit Service Inc., Seneca Transit Service Inc., Wyoming Transportation Service and Batavia Bus Service. State funding for RGRTA is provided through appropriations to the New York State Department of Transportation.

PUBLIC AUTHORITIES
255
TABLE 1 FINANCIAL OPERATIONS a/ OF NEW YORK STATE PUBLIC AUTHORITIES
2010 AND 2011 (thousands of dollars)
2010 2011
Authorities by Function
Fiscal Year
Begins Total
Revenues Operating Expenses
Debt Service
Require-ments
Surplus (Deficit) b/
Total Revenues
Operating Expenses
Debt Service
Require-ments
Surplus (Deficit) b/
BRIDGE, TUNNEL AND HIGHWAY Buffalo and Fort Erie Public Bridge Authority Jan. 1 34,268 14,730 3,786 15,752 32,409 15,400 3,608 13,401New York State Bridge Authority Jan. 1 39,447 25,550 8,059 5,838 41,050 26,773 8,050 6,227Thousand Islands Bridge Authority Mar. 1 10,743 8,070 735 1,938 10,290 8,140 0 2,150Thruway Authority c/ Jan. 1 695,507 431,705 191,469 72,333 688,980 449,838 185,270 53,872ECONOMIC DEVELOPMENT Battery Park City Authority Nov. 1 382,923 31,904 70,322 280,697 217,534 33,200 73,084 111,250Development Authority of the North Country April 1 21,800 11,415 4,642 5,743 22,056 11,526 4,981 5,549Job Development Authority April 1 9,297 428 5,909 2,960 8,366 439 5,452 2,475Empire State Development Corporation April 1 923,430 111,895 819,898 (8,363) 1,019,492 89,954 935,554 (6,016)New York City OTB d/ July 1 179,970 211,117 0 (31,147) - - - -United Nations Development Corporation Jan. 1 40,166 29,454 10,712 0 40,286 30,580 9,706 0ENERGY AND ENVIRON- MENT Energy Research and Development Authority April 1 737,509 737,509 0 0 743,975 743,975 0 0Environmental Facilities Corporation April 1 847,751 24,621 820,459 2,671 860,787 24,864 832,692 3,231Long Island Power Authority Jan. 1 3,729,913 3,223,012 550,131 (43,230) 3,657,595 2,998,583 584,012 75,000Power Authority Jan. 1 2,604,800 2,262,600 185,900 156,300 2,700,600 2,330,600 176,100 193,900HOUSING, HEALTH AND FINANCE Dormitory Authority April 1 3,928,924 105,614 3,823,310 0 4,239,602 108,862 4,130,740 0Housing Finance Agency Nov. 1 1,186,997 29,243 1,155,639 2,115 317,881 31,605 285,116 1,160Local Government Assistance Corporation April 1 377,048 13,429 347,311 16,308 383,327 5,909 378,354 (936)Mortgage Agency Nov. 1 480,077 34,670 445,731 (324) 502,260 39,716 461,759 785Municipal Assistance Corpora- tion for the City of Troy Jan. 1 6,394 47 6,272 75 6,323 48 6,040 235Nassau County Interim Finance Authority e Jan. 1 179,258 1,181 178,077 0 190,398 1,475 188,923 0Municipal Bond Bank Agency Nov. 1 59,778 503 59,275 0 83,303 535 82,768 0Tobacco Settlement Financing Corporation Nov. 1 413,080 723 417,306 (4,949) 413,189 1,232 411,957Buffalo Fiscal Stability Authority f July 1 275,537 998 19,405 255,134 274,977 1,027 19,851 254,099

PUBLIC AUTHORITIES
256
TABLE 1 FINANCIAL OPERATIONS a/ OF NEW YORK STATE PUBLIC AUTHORITIES
2010 AND 2011 (thousands of dollars)
2010 2011
Authorities by Function
Fiscal Year
Begins Total
Revenues Operating Expenses
Debt Service
Require-ments
Surplus (Deficit) b/
Total Revenues
Operating Expenses
Debt Service
Require-ments
Surplus (Deficit) b/
PORT DEVELOPMENT Albany Port District Commis- sion Jan. 1 10,725 4,002 1,612 5,111 8,490 4,522 1,309 2,659Ogdensburg Bridge and Port Authority April 1 5,415 3,906 1,199 310 5,156 3,626 1,191 339Port Authority of New York and New Jersey g/ Jan. 1 4,344,239 2,389,403 622,986 1,331,850 4,515,503 2,509,280 700,794 1,305,429Port of Oswego Authority April 1 3,223 2,547 382 294 3,320 2,624 247 449REGIONAL TRANSPORTA- TION Capital District Transportation Authority April 1 73,533 73,533 0 0 72,586 85,920 0 (13,334)Central New York Regional Transportation Authority April 1 59,163 59,866 13 (716) 55,202 62,065 13 (6,876)Metropolitan Transportation Authority h/ Jan. 1 12,933,700 11,162,700 1,841,500 (70,500) 13,262,600 11,698,800 2,051,800 (488,000)Niagara Frontier Transporta- tion Authority April 1 188,089 171,550 13,835 2,704 191,328 174,314 12,798 4,216Rochester-Genesee Regional Transportation Authority April 1 78,803 75,240 0 3,563 78,787 85,598 0 (6,811)
GRAND TOTAL 34,861,507 21,253,165 11,605,875 2,002,467 34,647,652 21,581,030 11,552,169 1,514,453
a/ This table is based on authority estimates and may not reflect approval by the Board of Directors. This table covers the Authority fiscal year
which includes September 30. Data vary as to cash or accrual accounting. b/ The operating surplus may be committed to reserve requirements, repayment of State advances or funding of capital programs or programs
operated by other authorities. Deficits are to be financed from existing resources, by management actions, and/or by securing revenues from outside sources greater than anticipated by the Authority.
c/ Excludes debt service for bonds sold to finance State transportation programs.
d/ New York City Off Track Betting ceased operations on December 8, 2010.
e/ Excess sales tax funds of the Authority are remitted immediately to Nassau County as required under the NIFA Act.
f/ Surplus funds of the Authority are remitted immediately to the City of Buffalo and the Buffalo School District as required by the BFSA Act.g/ 2010 information is a preliminary estimate of Authority Operating Budget and is subject to change.h/ Data represents consolidated reporting for the Metropolitan Transportation Authority and the Triborough Bridge and Tunnel Authority. These
figures do not include debt service on State Service Contract bonds.

PUBLIC AUTHORITIES
257
TABLE 2 CAPITAL PROGRAMS a/ OF NEW YORK STATE PUBLIC AUTHORITIES
2010 AND 2011 (thousands of dollars)
2010 2011
Authorities by Function
CapitalProgram
Disburse-ments
AvailableResources
Sale ofNew Debt b/
Capital Program
Disburse-ments
Available Resources
Sale ofNew Debt b/
BRIDGE, TUNNEL AND HIGHWAY Buffalo and Fort Erie Public Bridge Authority 4,221 67,558 0 1,866 76,738 0New York State Bridge Authority 15,230 23,891 0 20,958 14,888 0Thousand Islands Bridge Authority 2,411 2,411 0 2,935 2,935 0Thruway Authority 361,438 361,438 0 463,620 463,620 0ECONOMIC DEVELOPMENT Battery Park City Authority 15,836 0 85,000 48,070 67,787 0Development Authority of the North Country 14,452 11,952 2,500 37,598 29,748 7,850Job Development Authority 448 2,512 0 555 1,920 0Empire State Development Corporation 983,945 0 1,109,420 733,205 0 1,124,446New York City OTB c/ 2,801 2,801 0 - - -United Nations Development Corporation 2,599 8,250 0 3,318 7,850 0ENERGY AND ENVIRON- MENT Energy Research and Development Authority 19,247 19,247 0 15,310 15,310 0Environmental Facilities Corporation 425,850 0 425,850 250,000 0 250,000Long Island Power Authority 267,032 57,032 210,000 312,271 62,271 250,000Power Authority 326,938 326,938 16,100 328,334 328,334 13,707HOUSING, HEALTH AND FINANCE Dormitory Authority 3,038,644 3,306,416 4,856,898 4,663,420 5,124,670 4,952,175Housing Finance Agency 1,038,261 787,124 1,075,029 851,738 823,927 491,100Local Government Assistance Corporation 0 0 0 0 0 0Mortgage Agency 355,147 0 302,885 399,000 0 398,517Municipal Assistance Corpora- tion for the City of Troy 0 0 0 0 0 0Nassau County Interim Finance Authority d/ 0 0 0 0 0 0Municipal Bond Bank Agency 0 0 0 0 0 0Tobacco Settlement Financing Corporation 0 0 0 0 0 0Buffalo Fiscal Stability Authority 0 0 0 0 0 0

PUBLIC AUTHORITIES
258
TABLE 2 CAPITAL PROGRAMS a/ OF NEW YORK STATE PUBLIC AUTHORITIES
2010 AND 2011 (thousands of dollars)
2010 2011
Authorities by Function
CapitalProgram
Disburse-ments
AvailableResources
Sale ofNew Debt b/
Capital Program
Disburse-ments
Available Resources
Sale ofNew Debt b/
PORT DEVELOPMENT Albany Port District Commis- sion 3,000 6,723 0 2,000 3,968 0Ogdensburg Bridge and Port Authority 15,810 15,810 0 20,845 20,845 0Port Authority of New York and New Jersey e/ 3,090,438 2,680,497 1,206,098 3,310,443 2,573,254 1,385,438Port of Oswego Authority 1,818 451 1,650 337 337 0REGIONAL TRANSPORTA- TION Capital District Transportation Authority 4,071 2,030 0 61,554 2,200 0Central New York Regional Transportation Authority 26,499 26,499 0 23,668 23,668 0Metropolitan Transportation Authority f/ 6,743,700 2,927,100 3,816,500 5,282,700 1,472,000 3,810,800Niagara Frontier Transporta- tion Authority 79,425 79,425 0 71,545 71,545 0Rochester-Genesee Regional Transportation Authority 27,086 56,936 373 47,740 70,722 2,850
GRAND TOTAL 16,866,347 10,773,041 13,108,303 16,953,030 11,258,537 12,686,883
a/ This table is based on authority estimates and may not reflect approval by the Board of Directors. The table covers the Authority fiscal year which includes September 30. “Available resources” may include anticipated and/or requested State and Federal funds.
b/ Includes proceeds available for capital program only. c/ New York City Off Track Betting ceased operations on December 8, 2010.
d/ Includes proceeds available for capital program only. All capital borrowings are made by the Authority on behalf of Nassau County and all capital bond proceeds are disbursed to Nassau County. The Authority issues debt only at the request of Nassau County.
e/ All estimates are preliminary and are subject to change. f/ Data represents consolidated reporting for the Metropolitan Transportation Authority and the Triborough Bridge
and Tunnel Authority.

PUBLIC AUTHORITIES
259
TABLE 3 DEBT STRUCTURE OF NEW YORK STATE PUBLIC AUTHORITIES
AS OF SEPTEMBER 30, 2010 (thousands of dollars)
All Bonds and Notes Moral Obligation Bonds
Authorities by Function Statutory
Authorization BondsIssued
BondsOutstanding
NotesOutstanding
Authorized Limit
BondsIssued
BondsOutstanding
BRIDGE, TUNNEL AND HIGHWAY Buffalo and Fort Erie Public Bridge Authority 165,000 44,120 42,740 0 0 0 0New York State Bridge Authority 153,255 83,522 53,255 0 0 0 0Thousand Islands Bridge Authority Unlimited 5,745 0 0 0 0 0Thruway Authority Unlimited 22,316,300 13,448,165 680,610 0 0 0ECONOMIC DEVELOPMENT Battery Park City Authority a/ 1,060,000 1,155,581 1,110,880 0 0 0 0Development Authority of the North Country Unlimited 67,552 16,955 5,893 0 0 0Job Development Authority 750,000 0 27,745 0 0 0 0Empire State Development Corporation 17,352,204 12,140,418 8,726,717 0 0 0 0New York City OTB b/ None 0 0 0 0 0 0United Nations Development Corporation Unlimited 260,728 106,823 0 75,000 31,000 0ENERGY AND ENVIRON- MENT Energy Research and Development Authority Unlimited 8,094,695 3,626,740 0 0 0 0Environmental Facilities Corporation Unlimited 15,698,405 8,416,035 0 0 0 0Long Island Power Authority Unlimited 11,832,223 6,717,994 200,000 0 0 0Power Authority Unlimited 7,469,425 1,173,415 776,642 0 0 0HOUSING, HEALTH AND FINANCE Dormitory Authority Unlimited 99,417,060 42,537,344 30,730 699,785 698,660 2,880Housing Finance Agency c/ 24,517,299 19,697,716 9,722,370 0 7,112,115 6,524,379 27,410Local Government Assistance Corporation 4,700,000 5,647,035 3,393,118 0 0 0 0Mortgage Agency 8,720,000 14,302,083 3,416,964 0 0 0 0Municipal Assistance Corpora- tion for the City of Troy 75,000 69,583 52,573 0 0 0 0Nassau County Interim Finance Authority Unlimited 3,888,595 1,648,185 0 0 0 0Municipal Bond Bank Agency 1,000,000 921,132 736,282 0 0 0 0Tobacco Settlement Financing Corporation 4,200,000 4,552,495 3,011,900 0 0 0 0Buffalo Fiscal Stability Authority Unlimited 156,580 121,120 0 0 0 0

PUBLIC AUTHORITIES
260
TABLE 3 DEBT STRUCTURE OF NEW YORK STATE PUBLIC AUTHORITIES
AS OF SEPTEMBER 30, 2010 (thousands of dollars)
All Bonds and Notes Moral Obligation Bonds
Authorities by Function Statutory
Authorization BondsIssued
BondsOutstanding
NotesOutstanding
Authorized Limit
BondsIssued
BondsOutstanding
PORT DEVELOPMENT Albany Port District Commis- sion Unlimited 0 0 307 0 0 0Ogdensburg Bridge and Port Authority Unlimited 7,910 5,020 2,365 0 0 0Port Authority of New York and New Jersey Unlimited 21,132,319 14,523,675 431,760 0 0 0Port of Oswego Authority Unlimited 0 0 2,077 0 0 0REGIONAL TRANSPORTA- TION Capital District Transportation Authority Unlimited 0 0 0 0 0 0Central New York Regional Transportation Authority Unlimited 0 0 5,000 0 0 0Metropolitan Transportation Authority d/ 86,631,000 35,255,430 29,806,330 624,165 0 0 0Niagara Frontier Transporta- tion Authority Unlimited 199,334 159,718 38,874 0 0 0Rochester-Genesee Regional Transportation Authority Unlimited 0 0 0 0 0 0
GRAND TOTAL 284,415,986 152,602,063 2,798,423 7,886,900 7,254,039 30,290
a/ $400 million in bonding authority related to the Housing New York Program sunsetted on June 30, 1995. b/ New York City Off Track Betting ceased operations on December 8, 2010.
c/ HFA moral obligation bond limit is reduced as bonds outstanding after April 1, 1976 are repaid. d/ Data represents consolidated reporting for the Metropolitan Transportation Authority and the Triborough Bridge and Tunnel Authority
and does include debt outstanding numbers for State Service Contract bonds and Convention Center bonds. Bond cap is applicable only to projects set forth in transit and commuter capital programs approved by the MTA Capital Program Review Board. Authorization for State Service Contract bonds is limited to $165 million in annual debt service maturing no later than July 1, 2031.

PUBLIC AUTHORITIES
261
TABLE 4 STATE INVOLVEMENT IN FINANCING OF PROJECTS AND OPERATIONS
OF NEW YORK STATE PUBLIC AUTHORITIES 2010 AND 2011-12
(thousands of dollars)
Authority Bonds Outstanding, 2010 a/ State Appropriations Recommended in
Support of Authority Programs, 2011-12 b/
Authorities by Function
Revenue and
Nonrecourse
State Guaranteed
Moral Obligation
OutstandingReimbursable
State Appro-priations,
2010New Appro-
priations Reappro-priations Total
BRIDGE, TUNNEL AND HIGHWAY Buffalo and Fort Erie Public Bridge Authority 42,740 0 0 0 0 0 0New York State Bridge Authority 53,255 0 0 0 0 0 0Thousand Islands Bridge Authority 0 0 0 0 0 0 0Thruway Authority 13,448,165 0 0 0 2,000 0 2,000ECONOMIC DEVELOPMENT Battery Park City Authority 1,110,880 0 0 0 0 0 0Development Authority of the North Country 16,955 0 0 0 0 0 0Job Development Authority 0 27,745 0 0 0 0 0Empire State Development Corporation 8,726,717 0 0 0 55,239 380,798 436,037New York City OTB c/ 0 0 0 0 0 0 0United Nations Development Corporation 106,823 0 0 0 0 0 0ENERGY AND ENVIRON- MENT Energy Research and Development Authority 3,626,740 0 0 0 32,865 50,000 82,865Environmental Facilities Corporation 8,416,035 0 0 570 12,653 1,991 14,644Long Island Power Authority 6,717,994 0 0 0 0 0 0Power Authority 1,173,415 0 0 0 0 0 0HOUSING, HEALTH AND FINANCE Dormitory Authority 42,534,464 0 2,880 77,653 0 0 0Housing Finance Agency 9,694,960 0 27,410 0 0 0 0Local Government Assistance Corporation 3,393,118 0 0 0 392,000 0 392,000Mortgage Agency 3,416,964 0 0 0 0 0 0Municipal Assistance Corpora- tion for the City of Troy 52,573 0 0 0 0 0 0Nassau County Interim Finance Authority 1,648,185 0 0 0 0 0 0Municipal Bond Bank Agency 736,282 0 0 0 0 0 0Tobacco Settlement Financing Corporation 3,011,900 0 0 0 0 0 0Buffalo Fiscal Stability Authority 121,120 0 0 0 0 0 0
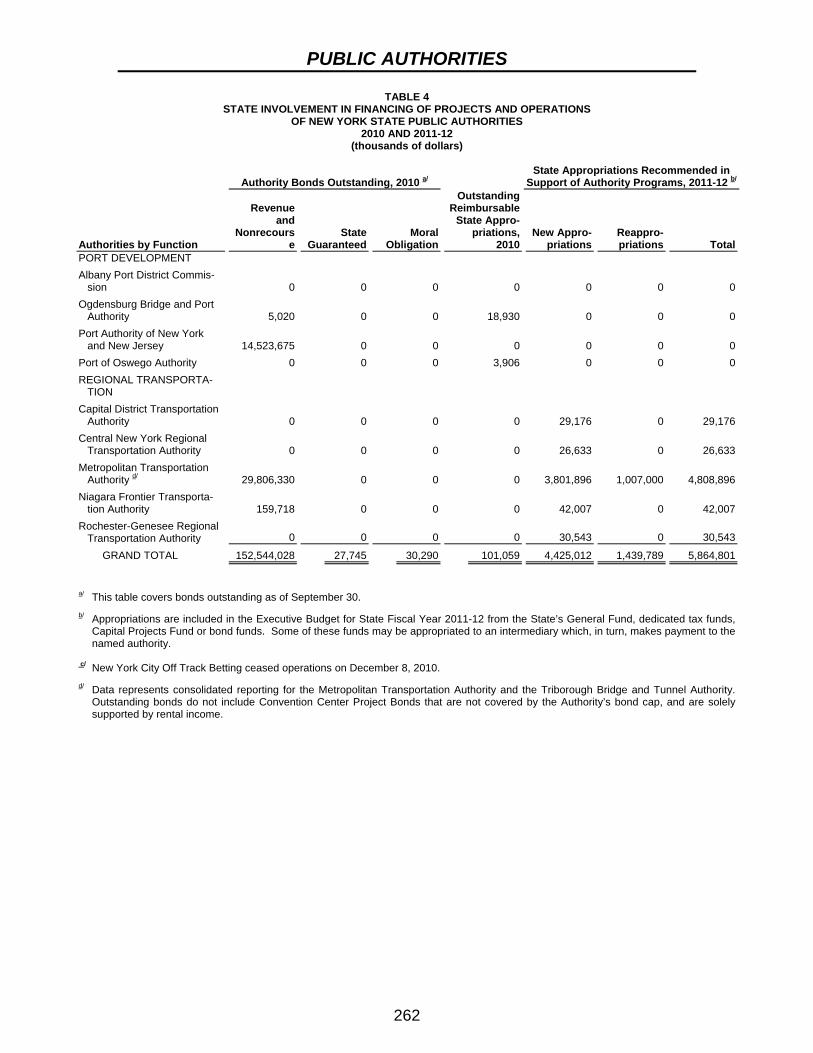
PUBLIC AUTHORITIES
262
TABLE 4 STATE INVOLVEMENT IN FINANCING OF PROJECTS AND OPERATIONS
OF NEW YORK STATE PUBLIC AUTHORITIES 2010 AND 2011-12
(thousands of dollars)
Authority Bonds Outstanding, 2010 a/ State Appropriations Recommended in
Support of Authority Programs, 2011-12 b/
Authorities by Function
Revenue and
Nonrecourse
State Guaranteed
Moral Obligation
OutstandingReimbursable
State Appro-priations,
2010New Appro-
priations Reappro-priations Total
PORT DEVELOPMENT Albany Port District Commis- sion 0 0 0 0 0 0 0Ogdensburg Bridge and Port Authority 5,020 0 0 18,930 0 0 0Port Authority of New York and New Jersey 14,523,675 0 0 0 0 0 0Port of Oswego Authority 0 0 0 3,906 0 0 0REGIONAL TRANSPORTA- TION Capital District Transportation Authority 0 0 0 0 29,176 0 29,176Central New York Regional Transportation Authority 0 0 0 0 26,633 0 26,633Metropolitan Transportation Authority d/ 29,806,330 0 0 0 3,801,896 1,007,000 4,808,896Niagara Frontier Transporta- tion Authority 159,718 0 0 0 42,007 0 42,007Rochester-Genesee Regional Transportation Authority 0 0 0 0 30,543 0 30,543
GRAND TOTAL 152,544,028 27,745 30,290 101,059 4,425,012 1,439,789 5,864,801
a/ This table covers bonds outstanding as of September 30.b/ Appropriations are included in the Executive Budget for State Fiscal Year 2011-12 from the State’s General Fund, dedicated tax funds,
Capital Projects Fund or bond funds. Some of these funds may be appropriated to an intermediary which, in turn, makes payment to the named authority.
c/ New York City Off Track Betting ceased operations on December 8, 2010.
d/ Data represents consolidated reporting for the Metropolitan Transportation Authority and the Triborough Bridge and Tunnel Authority. Outstanding bonds do not include Convention Center Project Bonds that are not covered by the Authority’s bond cap, and are solely supported by rental income.

263
PUBLIC EMPLOYMENT RELATIONS BOARD MISSION The Public Employment Relations Board (PERB) was created by the Public Employees’ Fair Employment Act of 1967 and resolves labor disputes between public employers and employees. PERB provides mediation, fact-finding and arbitration in contract disputes for approximately 4,800 public sector negotiating units in New York State. The 2010-11 budget made PERB also responsible for administering the State Employment Relations Act, in addition to the Taylor Law, and expanded PERB’s labor-management oversight activities to include private sector employers that are not provided services by the National Labor Relations Board, the Federal Mediation and Conciliation Service, or the National Mediation Board. Annually, more than 4,000 notices of contract expiration are filed with the Board by private sector employers or the unions that represent their employees. In addition, the Board settles questions of union representation, conducts hearings on charges of improper and unfair labor practices, designates Management/Confidential positions, makes determinations regarding applications for injunctive relief and acts as a clearinghouse for information on wages, benefits and employment practices. ORGANIZATION AND STAFFING The Board consists of a full-time Chair and two part-time members nominated by the Governor for six-year terms. The Board’s jurisdiction includes State, county and local governments, certain special service districts, school districts, public authorities, and since July 2010, private employers. Central offices are in Albany, with additional staff in Buffalo and Brooklyn. BUDGET HIGHLIGHTS The Executive Budget recommends $4.1 million All Funds ($3.6 million General Fund; $575,000 Other Funds) for the Public Employment Relations Board. This is a decrease in the General Fund of $397,000 (-10 percent) from the 2010-11 budget. The Executive Budget reduces each agency’s General Fund State Operations budget by 10 percent. These savings are intended to be achieved through administrative efficiencies in non-personal service and negotiated workforce savings that minimize layoffs to the extent possible. PROGRAM HIGHLIGHTS The Board provides three principal services: conciliation, settlement of petitions involving representation, and rulings on charges of improper or unfair employment practices.

PUBLIC EMPLOYMENT RELATIONS
264
CONCILIATION The Board provided assistance in 373 of the 2,386 State and local contract negotiations conducted in 2009-10, which represents a nearly 20 percent increase from two years ago. In addition, the Board is also performing these functions for private employers and their unions. REPRESENTATION Through its Office of Employment Practices and Representation, the Board reviews all petitions from public and private employee unions and employers requesting the creation of new negotiating units or the transfer of members between units. It also reviews requests to remove positions from negotiating units and, in the public sector may designate them management or confidential. In 2011-12, the Board expects to receive approximately 110 petitions raising questions about representation and to conduct 20 elections for representation. The Board also addresses matters of bargaining unit changes through unit clarification/placement and Management/Confidential applications. In 2009-10, 83 such applications were received by the Board and 88 cases were resolved: 46 by settlement after a conference was conducted and 42 by issuing a decision. Approximately 100 applications of this type are expected in 2011-12. EMPLOYMENT PRACTICES The Board conducts hearings and renders decisions on improper and unfair labor practice charges. It received 893 charges of improper employment and negotiating practices in 2009-10 and expects 1,000 such charges in the coming year. In 2009-10, the Board wrote 139 decisions and closed, either by decision or settlement, more than 850 improper practice cases. In 2011-12, the Board will also resolve unfair labor practices involving the private sector employers that do not fall within the jurisdiction of the National Labor Relations Board.
ALL FUNDS APPROPRIATIONS
(dollars)
Category Available
2010-11
AppropriationsRecommended
2011-12 Change
ReappropriationsRecommended
2011-12State Operations 4,543,000 4,146,000 (397,000) 0 Aid To Localities 0 0 0 0 Capital Projects 0 0 0 0 Total 4,543,000 4,146,000 (397,000) 0

PUBLIC EMPLOYMENT RELATIONS
265
ALL FUND TYPES PROJECTED LEVELS OF EMPLOYMENT BY PROGRAM
FILLED ANNUAL SALARIED POSITIONS Full-Time Equivalent Positions (FTE)
Program
2010-11Estimated FTEs
03/31/11
2011-12Estimated FTEs
03/31/12 FTE ChangeAdministration
General Fund 35 35 0 Total 35 35 0
The above table does not reflect layoffs that may be necessary in the absence of negotiated workforce savings.
STATE OPERATIONS
ALL FUNDS FINANCIAL REQUIREMENTS BY FUND TYPE APPROPRIATIONS
(dollars)
Fund Type Available
2010-11Recommended
2011-12 ChangeGeneral Fund 3,968,000 3,571,000 (397,000) Special Revenue Funds - Other 575,000 575,000 0 Total 4,543,000 4,146,000 (397,000)
STATE OPERATIONS
ALL FUNDS FINANCIAL REQUIREMENTS BY PROGRAM APPROPRIATIONS
(dollars)
Program Available
2010-11Recommended
2011-12 ChangeAdministration
General Fund 3,968,000 3,571,000 (397,000) Special Revenue Funds - Other 575,000 575,000 0
Total 4,543,000 4,146,000 (397,000)
STATE OPERATIONS - GENERAL FUND
SUMMARY OF PERSONAL SERVICE APPROPRIATIONS AND CHANGES 2011-12 RECOMMENDED
(dollars)
Total Personal Service Regular
(Annual Salaried) Program Amount Change Amount ChangeAdministration 3,295,000 (295,000) 3,020,000 (295,000) Total 3,295,000 (295,000) 3,020,000 (295,000)
Temporary Service
(Nonannual Salaried) Program Amount Change Administration 275,000 0 Total 275,000 0

PUBLIC EMPLOYMENT RELATIONS
266
STATE OPERATIONS - GENERAL FUND SUMMARY OF NONPERSONAL SERVICE AND MAINTENANCE UNDISTRIBUTED
APPROPRIATIONS AND CHANGES 2011-12 RECOMMENDED
(dollars) Total Supplies and Materials Program Amount Change Amount ChangeAdministration 276,000 (102,000) 37,000 0 Total 276,000 (102,000) 37,000 0 Travel Contractual Services Program Amount Change Amount ChangeAdministration 52,000 0 160,000 (102,000) Total 52,000 0 160,000 (102,000) Equipment Program Amount Change Administration 27,000 0 Total 27,000 0
STATE OPERATIONS - OTHER THAN GENERAL FUND
SUMMARY OF APPROPRIATIONS AND CHANGES 2011-12 RECOMMENDED
(dollars) Total Personal Service Program Amount Change Amount ChangeAdministration 575,000 0 275,000 0 Total 575,000 0 275,000 0 Nonpersonal Service Program Amount Change Administration 300,000 0 Total 300,000 0

267
COMMISSION ON PUBLIC INTEGRITY MISSION The mission of the Commission on Public Integrity is to ensure compliance with the ethical standards imposed to foster public trust and confidence in government. Established in 2007 by the merger of the State Ethics Commission and the Temporary State Commission on Lobbying, the Commission on Public Integrity is charged with the responsibility of administering and enforcing the State’s ethics and lobbying statutes along with anti-nepotism laws and the New York State “little Hatch Act.” ORGANIZATION AND STAFFING The Commission has 13 members, and operates through eight units: Executive, Public Information, Administration, Technology, Legal, Investigations, Programs, and Training and Educational Services. The Commission’s office is in Albany. BUDGET HIGHLIGHTS The Executive Budget recommends more than $3.9 million in General Fund spending for the Commission on Public Integrity. This is a General Fund decrease of $430,000 (-10 percent) from the 2010-11 budget. The Executive Budget reduces each agency’s General Fund State Operations budget by 10 percent. These savings are intended to be achieved through administrative efficiencies in non-personal service and negotiated workforce savings that minimize layoffs to the extent possible. PROGRAM HIGHLIGHTS The Commission has jurisdiction over 190,000 statewide officials, state officers and employees, and candidates for statewide elected office and political party chairs filing over 27,000 financial disclosure statements annually, as well as approximately 5,900 lobbyists representing 3,500 clients that reported spending $198 million in 2009 on their lobbying efforts. The Commission is responsible for issuing formal and informal advisory opinions to those under its jurisdiction, providing comprehensive outreach and education programs, administering a website that offers online filing, and conducting investigations and holding hearings to enforce the laws under the Commission’s mandate.
ALL FUNDS APPROPRIATIONS
(dollars)
Category Available
2010-11
AppropriationsRecommended
2011-12 Change
ReappropriationsRecommended
2011-12State Operations 4,308,000 3,878,000 (430,000) 0 Aid To Localities 0 0 0 0 Capital Projects 0 0 0 0 Total 4,308,000 3,878,000 (430,000) 0

PUBLIC INTEGRITY
268
ALL FUND TYPES PROJECTED LEVELS OF EMPLOYMENT BY PROGRAM
FILLED ANNUAL SALARIED POSITIONS Full-Time Equivalent Positions (FTE)
Program
2010-11Estimated FTEs
03/31/11
2011-12Estimated FTEs
03/31/12 FTE ChangePublic Integrity, Commission on
General Fund 46 46 0 Total 46 46 0
The above table does not reflect layoffs that may be necessary in the absence of negotiated workforce savings.
STATE OPERATIONS
ALL FUNDS FINANCIAL REQUIREMENTS BY FUND TYPE APPROPRIATIONS
(dollars)
Fund Type Available
2010-11Recommended
2011-12 ChangeGeneral Fund 4,308,000 3,878,000 (430,000) Total 4,308,000 3,878,000 (430,000)
STATE OPERATIONS
ALL FUNDS FINANCIAL REQUIREMENTS BY PROGRAM APPROPRIATIONS
(dollars)
Program Available
2010-11Recommended
2011-12 ChangePublic Integrity, Commission on
General Fund 4,308,000 3,878,000 (430,000) Total 4,308,000 3,878,000 (430,000)
STATE OPERATIONS - GENERAL FUND
SUMMARY OF PERSONAL SERVICE APPROPRIATIONS AND CHANGES 2011-12 RECOMMENDED
(dollars)
Total Personal Service Regular
(Annual Salaried) Program Amount Change Amount ChangePublic Integrity, Commission on 3,061,000 (340,000) 3,016,000 (335,000) Total 3,061,000 (340,000) 3,016,000 (335,000)
Holiday/Overtime Pay
(Annual Salaried) Program Amount Change Public Integrity, Commission on 45,000 (5,000) Total 45,000 (5,000)

PUBLIC INTEGRITY
269
STATE OPERATIONS - GENERAL FUND SUMMARY OF NONPERSONAL SERVICE AND MAINTENANCE UNDISTRIBUTED
APPROPRIATIONS AND CHANGES 2011-12 RECOMMENDED
(dollars) Total Supplies and Materials Program Amount Change Amount ChangePublic Integrity, Commission on 817,000 (90,000) 40,000 (4,000) Total 817,000 (90,000) 40,000 (4,000) Travel Contractual Services Program Amount Change Amount ChangePublic Integrity, Commission on 20,000 0 717,000 (76,000) Total 20,000 0 717,000 (76,000) Equipment Program Amount Change Public Integrity, Commission on 40,000 (10,000) Total 40,000 (10,000)

270
DEPARTMENT OF PUBLIC SERVICE MISSION The Department of Public Service is the staff arm of the Public Service Commission, which regulates the rates and services of the State’s public utilities, including electric, gas, steam, telephone and water. The Commission also oversees the siting of major electric and gas transmission lines and facilities. In addition, it ensures the safety of natural gas and liquid petroleum pipelines and is responsible for oversight and regulation of the cable television industry in New York State. ORGANIZATION AND STAFFING The Public Service Commission consists of five members who are nominated by the Governor and confirmed by the Senate. The Chairman serves as the chief executive officer of the Department, which operates offices in Albany, New York City, Buffalo and Syracuse. The Department’s budget has two programs: the Administration Program, which supports the Public Service Commission and Department activities; and the Regulation Program, which undertakes activities to ensure fair and reasonable rates, monitor service standards, address consumer complaints, promote efficient operation and ensure that industry construction programs meet safety and environmental requirements. BUDGET HIGHLIGHTS The Executive Budget recommends $80.4 million All Funds ($76.9 million Special Revenue Funds; $3.5 million Federal funds) for the Department of Public Service. This is a net increase of $250,000 All Funds (increase of $500,000 Special Revenue Funds; decrease of $250,000 Federal funds) (0.3 percent) from the 2010-11 budget. This net increase primarily reflects an increase in local assistance appropriations, partially offset by decreased Federal stimulus funding. The Department’s 2011-12 operating budget includes funding of $75.4 million from utility and cable assessments. Public utility assessments are based on a utility’s gross intrastate operating revenues above $500,000. Cable television assessments are based on revenues from those companies with 1,000 or more subscribers. In addition, the local assistance budget provides a total of $1.5 million from fees paid by entities proposing to site electric generation and transmission facilities. These funds can be accessed by local governments and community groups to fund intervention activities related to the siting review process. The Department also receives Federal grants to perform pipeline safety activities. PROGRAM HIGHLIGHTS The Department will continue the following priorities for the coming year:
Ensure just and reasonable utility rates, along with safe and adequate electric, gas, steam, and telecommunications service.
Enhance energy efficiency through the existing Energy Efficiency Portfolio Standard initiative and through an extension or reformulation of programs under the System Benefits Charge.

PUBLIC SERVICE
271
Promote clean and renewable electric generation, including through the Renewable Portfolio Standard Initiative, designed to increase the proportion of electricity in the State generated by renewable resources to 30 percent by 2015.
Conduct complete electric transmission siting reviews, oversee the responsible development of a smart electric grid, and ensure the safety of the State’s natural gas pipelines.
Educate consumers and resolve consumer-utility disputes, to ensure fair and responsible utility service.
ALL FUNDS
APPROPRIATIONS (dollars)
Category Available
2010-11
AppropriationsRecommended
2011-12 Change
ReappropriationsRecommended
2011-12State Operations 79,142,000 78,892,000 (250,000) 4,550,000 Aid To Localities 1,000,000 1,500,000 500,000 3,186,000 Capital Projects 0 0 0 0 Total 80,142,000 80,392,000 250,000 7,736,000
ALL FUND TYPES
PROJECTED LEVELS OF EMPLOYMENT BY PROGRAM FILLED ANNUAL SALARIED POSITIONS
Full-Time Equivalent Positions (FTE)
Program
2010-11Estimated FTEs
03/31/11
2011-12Estimated FTEs
03/31/12 FTE ChangeAdministration
Special Revenue Funds - Other 98 98 0 Regulation of Utilities
Special Revenue Funds - Federal 12 15 3 Special Revenue Funds - Other 421 421 0
Total 531 534 3
The above table does not reflect layoffs that may be necessary in the absence of negotiated workforce savings.
STATE OPERATIONS
ALL FUNDS FINANCIAL REQUIREMENTS BY FUND TYPE APPROPRIATIONS
(dollars)
Fund Type Available
2010-11Recommended
2011-12 ChangeSpecial Revenue Funds - Federal 3,750,000 3,500,000 (250,000) Special Revenue Funds - Other 75,392,000 75,392,000 0 Total 79,142,000 78,892,000 (250,000) Adjustments: Prior Year Deficiency
Public Service Department Special Revenue Funds - Federal 1,250,000
Appropriated 2010-11 80,392,000

PUBLIC SERVICE
272
STATE OPERATIONS ALL FUNDS FINANCIAL REQUIREMENTS BY PROGRAM
APPROPRIATIONS (dollars)
Program Available
2010-11Recommended
2011-12 ChangeAdministration
Special Revenue Funds - Other 12,761,000 12,761,000 0 Regulation of Utilities
Special Revenue Funds - Federal 3,750,000 3,500,000 (250,000) Special Revenue Funds - Other 62,631,000 62,631,000 0
Total 79,142,000 78,892,000 (250,000)
STATE OPERATIONS - OTHER THAN GENERAL FUND
SUMMARY OF APPROPRIATIONS AND CHANGES 2011-12 RECOMMENDED
(dollars) Total Personal Service Program Amount Change Amount ChangeAdministration 12,761,000 0 7,475,000 496,000 Regulation of Utilities 66,131,000 (250,000) 38,097,000 2,053,000 Total 78,892,000 (250,000) 45,572,000 2,549,000 Nonpersonal Service Maintenance Undistributed Program Amount Change Amount ChangeAdministration 5,286,000 (496,000) 0 0 Regulation of Utilities 28,034,000 (1,053,000) 0 (1,250,000) Total 33,320,000 (1,549,000) 0 (1,250,000)
AID TO LOCALITIES
ALL FUNDS FINANCIAL REQUIREMENTS BY FUND TYPE APPROPRIATIONS
(dollars)
Fund Type Available
2010-11Recommended
2011-12 ChangeSpecial Revenue Funds - Other 1,000,000 1,500,000 500,000 Total 1,000,000 1,500,000 500,000
AID TO LOCALITIES
ALL FUNDS FINANCIAL REQUIREMENTS BY PROGRAM APPROPRIATIONS
(dollars)
Program Available
2010-11Recommended
2011-12 ChangeRegulation of Utilities
Special Revenue Funds - Other 1,000,000 1,500,000 500,000 Total 1,000,000 1,500,000 500,000

273
COMMISSION ON QUALITY OF CARE AND ADVOCACY FOR PERSONS WITH DISABILITIES
MISSION The mission of the Commission on Quality of Care and Advocacy for Persons with Disabilities (CQCAPD) is to improve the quality of life for individuals with disabilities in New York State and to protect their rights and advocate for needed change by:
Ensuring programmatic and fiscal accountability, and monitoring care and treatment of people with disabilities within the State’s mental hygiene system, and making recommendations for improvements, when warranted;
Providing individual and systemic investigative and advocacy services; Advancing the availability and use of assistive technology for persons with
disabilities; Offering impartial and informed advice, training, and recommendations on a
broad range of disability issues; and Promoting the inclusion of persons with disabilities in all aspects of community
life and ensuring that persons with disabilities are afforded the opportunity to exercise the full range of rights and responsibilities accorded to all New Yorkers.
The Commission’s Advisory Council has expanded its membership to include individuals with a broader range of disabilities to better fulfill its mission in advising the Governor and Legislature regarding all New Yorkers with disabilities. ORGANIZATION AND STAFFING The Commission comprises a full-time chairperson and two unsalaried members, each appointed by the Governor and confirmed by the Senate to serve staggered five-year terms. The responsibilities of the Commission are carried out through five major programmatic divisions/bureaus:
The Division of Adult Quality Assurance and Investigation; The Division of Children’s Quality Assurance and Investigation; The Fiscal Investigations Bureau; The Division of Protection and Advocacy Program Administration; and The Division of Advocacy and Outreach for Persons with Physical Disabilities.
BUDGET HIGHLIGHTS The Executive Budget recommends $18.1 million All Funds for the Commission on Quality of Care and Advocacy for Persons with Disabilities (CQCAPD). This is a decrease of $0.5 million (-10.0 percent) General Fund from 2010-11. The Executive Budget reduces each agency’s General Fund State Operations budget by 10 percent. These savings are intended to be achieved through administrative efficiencies in non-personal service and negotiated workforce savings that minimize layoffs to the extent possible. In addition to 10 percent reductions in the cost of State Operations, the budget recommends:
Surrogate Decision-Making Committee Reductions: Program funding will be aligned with caseload expectations, and certain cases will be completed using State staff to reduce costs, as these cases are currently passed on to contractors for the administration of the hearings.
QUALITY OF CARE AND ADVOCACY FOR PERSONS WITH DISABILITIES
274
PROGRAM HIGHLIGHTS OVERSIGHT OF SERVICE DELIVERY IN THE MENTAL HYGIENE AREA The Commission provides independent oversight and review of State and voluntary programs serving individuals with mental illness, developmental disabilities, and chemical dependence. Most importantly, it investigates allegations of abuse or mistreatment of individuals served in facilities operated or licensed by these agencies. The Commission also monitors the quality of mental health services in the State prison system. The Commission receives and screens approximately 16,000 reports of abuse, neglect, or death and conducts reviews or investigations on over 1,000 cases annually. The Commission also investigates allegations of fiscal fraud, waste, and abuse relating to the provision of services in the mental hygiene system. PROTECTION AND ADVOCACY Through a combination of staff resources and contracts with non-profit agencies, the Commission provides statewide protection and advocacy services for individuals with disabilities through the following federal programs: Protection and Advocacy for the Developmentally Disabled; Client Assistance; Protection and Advocacy for Individuals with Mental Illness; Protection and Advocacy of Individual Rights; Protection and Advocacy for Beneficiaries of Social Security; Protection and Advocacy for Assistive Technology; Protection and Advocacy for Traumatic Brain Injury; and Protection and Advocacy for Voting Access. These programs assist the Commission in strengthening the non-profit contract network by providing individuals with severe disabilities with Federally-mandated protection and advocacy services. Every year, more than 40,000 individuals with disabilities are served through the Commission’s protection and advocacy programs. SURROGATE DECISION MAKING COMMITTEE The Surrogate Decision Making Committee (SDMC) program reviews recommendations for medical services on behalf of individuals receiving mental hygiene residential services who have neither a legal guardian nor the ability to make decisions for themselves. Teams selected from a pool of 1,600 volunteer medical, legal, and health care professionals, and advocates work via local dispute resolution centers located throughout the State to represent these individuals. More than 900 SDMC cases are resolved, and over 100 volunteers and 400 providers are trained annually. TECHNOLOGY SERVICES TO PERSONS WITH DISABILITIES The Commission’s federally funded Technology-Related Assistance for Individuals with Disabilities (TRAID) Project supports a statewide system that helps New Yorkers with disabilities access technology devices and services to facilitate their full integration into the mainstream workplace and community. This program is coordinated through an

QUALITY OF CARE AND ADVOCACY FOR PERSONS WITH DISABILITIES
275
Interagency Partnership on Assistive Technology and 12 Regional TRAID Centers at 15 sites. During 2010 the TRAID program made over 11,000 loans of adaptive equipment and saved over $1 million through recycling of assistive technology services. The Commission’s Disability and Business Technical Assistance Center grant funding will continue to be used to provide comprehensive education, public awareness, and technical assistance programs that promote increased voluntary compliance with the Americans with Disabilities Act (ADA). ADULT HOMES The Commission contracts with local non-profit organizations to provide advocacy services to protect the rights of residents of adult homes who have been consumers in the mental hygiene system. The Commission’s dedicated team will continue to work collaboratively with the Department of Health (DOH) and the Office of Mental Health (OMH) to conduct programmatic and fiscal investigations into the quality of care provided to individuals living in adult homes. The Commission’s efforts have been expanded to assist in the implementation of new State initiatives already underway to improve the quality of life and safety of adult home residents. Last year, Commission staff conducted 30 comprehensive reviews and investigations of complaints in adult homes serving over 1,500 people. STATEWIDE CLEARINGHOUSE The Commission operates a statewide clearinghouse through which individuals can access information and obtain referrals to a variety of disability-related services. The system features a 24-hour statewide telephone hotline (1-800-642-4143) and a dynamic full-featured Web site (www.cqcapd.state.ny.us), which has attracted more than 1 million visitors. ADVOCACY AND OUTREACH As required by statute, the Division of Advocacy and Outreach coordinates the Commission’s efforts to provide information, support, and technical assistance to empower people with disabilities, family members, advocates, local government officials, and others to identify and undertake the actions necessary to support people with disabilities in becoming fully participating members of their chosen communities. The main focus of this Division is improving inclusion, accommodations, and accessibility for individuals with disabilities. Recently, the Commission partnered with the State Board of Elections to conduct trainings statewide for local election officials to improve accessibility of the voting process.
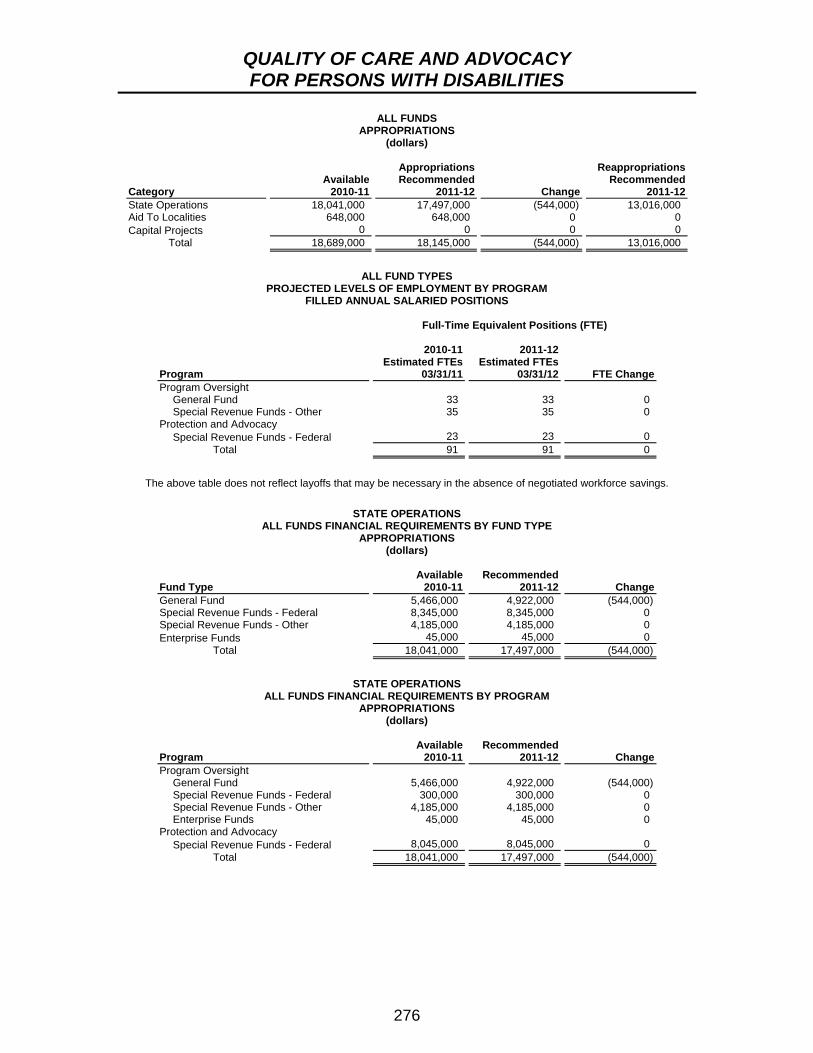
QUALITY OF CARE AND ADVOCACY FOR PERSONS WITH DISABILITIES
276
ALL FUNDS APPROPRIATIONS
(dollars)
Category Available
2010-11
AppropriationsRecommended
2011-12 Change
ReappropriationsRecommended
2011-12State Operations 18,041,000 17,497,000 (544,000) 13,016,000 Aid To Localities 648,000 648,000 0 0 Capital Projects 0 0 0 0 Total 18,689,000 18,145,000 (544,000) 13,016,000
ALL FUND TYPES
PROJECTED LEVELS OF EMPLOYMENT BY PROGRAM FILLED ANNUAL SALARIED POSITIONS
Full-Time Equivalent Positions (FTE)
Program
2010-11Estimated FTEs
03/31/11
2011-12Estimated FTEs
03/31/12 FTE ChangeProgram Oversight
General Fund 33 33 0 Special Revenue Funds - Other 35 35 0
Protection and Advocacy Special Revenue Funds - Federal 23 23 0
Total 91 91 0
The above table does not reflect layoffs that may be necessary in the absence of negotiated workforce savings.
STATE OPERATIONS
ALL FUNDS FINANCIAL REQUIREMENTS BY FUND TYPE APPROPRIATIONS
(dollars)
Fund Type Available
2010-11Recommended
2011-12 ChangeGeneral Fund 5,466,000 4,922,000 (544,000) Special Revenue Funds - Federal 8,345,000 8,345,000 0 Special Revenue Funds - Other 4,185,000 4,185,000 0 Enterprise Funds 45,000 45,000 0 Total 18,041,000 17,497,000 (544,000)
STATE OPERATIONS
ALL FUNDS FINANCIAL REQUIREMENTS BY PROGRAM APPROPRIATIONS
(dollars)
Program Available
2010-11Recommended
2011-12 ChangeProgram Oversight
General Fund 5,466,000 4,922,000 (544,000) Special Revenue Funds - Federal 300,000 300,000 0 Special Revenue Funds - Other 4,185,000 4,185,000 0 Enterprise Funds 45,000 45,000 0
Protection and Advocacy Special Revenue Funds - Federal 8,045,000 8,045,000 0
Total 18,041,000 17,497,000 (544,000)

QUALITY OF CARE AND ADVOCACY FOR PERSONS WITH DISABILITIES
277
STATE OPERATIONS - GENERAL FUND SUMMARY OF PERSONAL SERVICE APPROPRIATIONS AND CHANGES
2011-12 RECOMMENDED (dollars)
Total Personal Service Regular
(Annual Salaried) Program Amount Change Amount ChangeProgram Oversight 3,736,000 (414,000) 3,720,000 (413,000) Total 3,736,000 (414,000) 3,720,000 (413,000)
Holiday/Overtime Pay
(Annual Salaried) Program Amount Change Program Oversight 16,000 (1,000) Total 16,000 (1,000)
STATE OPERATIONS - GENERAL FUND
SUMMARY OF NONPERSONAL SERVICE AND MAINTENANCE UNDISTRIBUTED APPROPRIATIONS AND CHANGES
2011-12 RECOMMENDED (dollars)
Total Supplies and Materials Program Amount Change Amount ChangeProgram Oversight 1,186,000 (130,000) 40,000 (4,000) Total 1,186,000 (130,000) 40,000 (4,000) Travel Contractual Services Program Amount Change Amount ChangeProgram Oversight 177,000 (19,000) 839,000 (93,000) Total 177,000 (19,000) 839,000 (93,000) Equipment Program Amount Change Program Oversight 130,000 (14,000) Total 130,000 (14,000)
STATE OPERATIONS - OTHER THAN GENERAL FUND
SUMMARY OF APPROPRIATIONS AND CHANGES 2011-12 RECOMMENDED
(dollars) Total Personal Service Program Amount Change Amount ChangeProgram Oversight 4,530,000 0 2,454,000 1,000 Protection and Advocacy 8,045,000 0 1,679,000 103,000 Total 12,575,000 0 4,133,000 104,000 Nonpersonal Service Maintenance Undistributed Program Amount Change Amount ChangeProgram Oversight 1,776,000 (1,000) 300,000 0 Protection and Advocacy 6,366,000 (103,000) 0 0 Total 8,142,000 (104,000) 300,000 0
AID TO LOCALITIES
ALL FUNDS FINANCIAL REQUIREMENTS BY FUND TYPE APPROPRIATIONS
(dollars)
Fund Type Available
2010-11Recommended
2011-12 ChangeGeneral Fund 170,000 170,000 0 Special Revenue Funds - Other 478,000 478,000 0 Total 648,000 648,000 0

QUALITY OF CARE AND ADVOCACY FOR PERSONS WITH DISABILITIES
278
AID TO LOCALITIES ALL FUNDS FINANCIAL REQUIREMENTS BY PROGRAM
APPROPRIATIONS (dollars)
Program Available
2010-11Recommended
2011-12 ChangeCommunity Support
General Fund 170,000 170,000 0 Special Revenue Funds - Other 478,000 478,000 0
Total 648,000 648,000 0

279
STATE RACING AND WAGERING BOARD MISSION The State Racing and Wagering Board regulates all legalized gambling activities in New York except those regulated by the State Lottery. Horse racing, off-track betting (OTB) and Indian casino gaming are directly regulated by the Board. The responsibility for oversight of bingo and other permitted games of chance conducted by religious and not-for-profit organizations is shared with municipalities, which collect license fees and ensure that the Board’s rules and regulations are followed. ORGANIZATION AND STAFFING A three-member Board oversees agency activities. The Governor appoints each member to a six-year term with the consent of the Senate. The Chair’s office is located in New York City and central office staff is stationed in Schenectady. The Board employs on-site inspectors at the Oneida Indians’ Turning Stone Casino in Verona, Oneida County; the Mohawk Indians’ Akwesasne Mohawk Casino in Hogansburg, Franklin County; the Seneca Nation’s Seneca Niagara Casino in Niagara Falls, Seneca Buffalo Creek Casino in Buffalo, and Seneca Alleghany Casino in Salamanca. Temporary and full-time employees oversee horse racing at New York’s four thoroughbred race tracks – Aqueduct, Belmont, Saratoga and Finger Lakes – and seven harness tracks – Buffalo, Monticello, Saratoga, Tioga Downs, Vernon Downs, Batavia Downs and Yonkers. The State Racing and Wagering Board staff will be supported by revenues generated by the racing industry, Indian casinos and charitable gaming activities. BUDGET HIGHLIGHTS The Executive Budget recommends $24.8 million All Funds for the State Racing and Wagering Board, an increase of $2.3 million (10 percent), over the 2010-11 budget. This increase is primarily attributable to costs of equine drug testing. Operations of the Board are financed from fees collected from the racing and gaming industries. Over the past several years, the combination of declining horse race wagering and steadily increasing Board operating costs has created a structural deficit within the Board’s Regulation of Racing account. This deficit has required the Board to borrow taxpayer-financed General Fund moneys in order to finance its operations. To correct this fiscal imbalance the Executive Budget includes legislation establishing a two and three quarters percent surcharge on purses, and the moneys from this surcharge will be deposited in the Regulation of Racing account. The additional revenue provided from the purse surcharge, combined with cost containment actions assumed in the Budget, will eliminate the need for further General Fund advances and will thus ensure that the cost for the Board’s regulatory activities are fully borne by the Racing Industry rather than by taxpayers. PROGRAM HIGHLIGHTS REGULATION OF GAMES OF CHANCE The State Racing and Wagering Board promulgates rules and regulations governing bingo and other games of chance operated by more than 15,000 charitable and not-for-
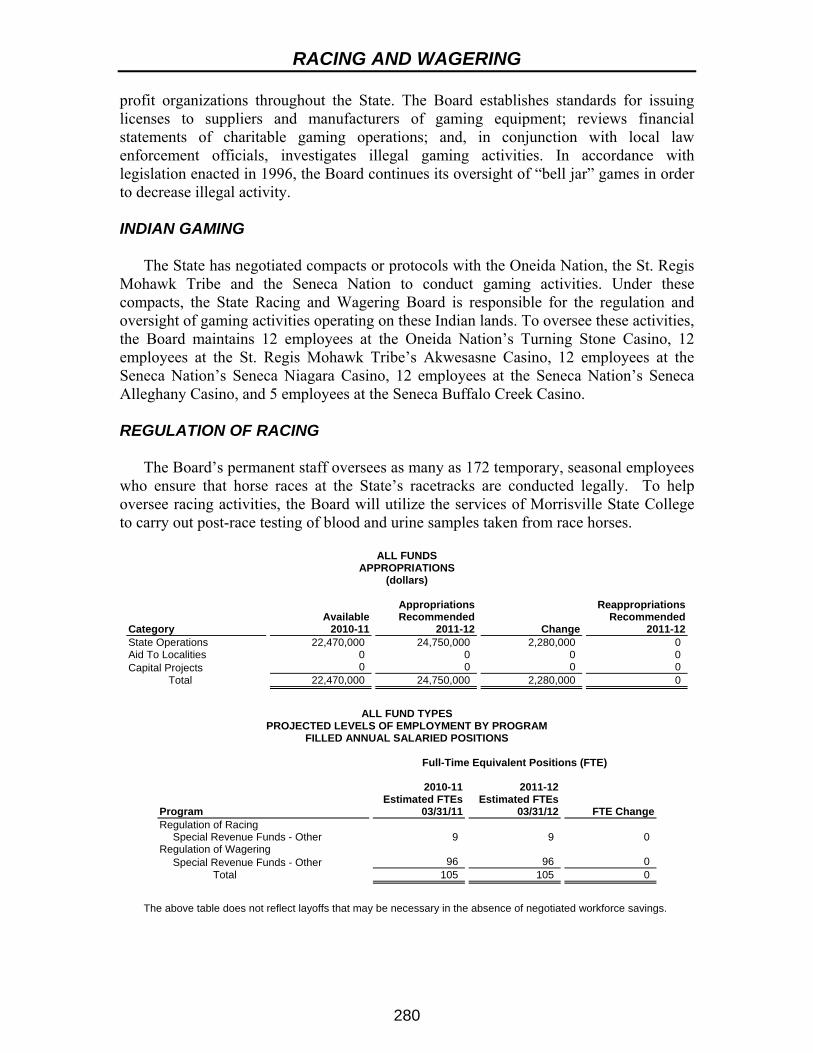
RACING AND WAGERING
280
profit organizations throughout the State. The Board establishes standards for issuing licenses to suppliers and manufacturers of gaming equipment; reviews financial statements of charitable gaming operations; and, in conjunction with local law enforcement officials, investigates illegal gaming activities. In accordance with legislation enacted in 1996, the Board continues its oversight of “bell jar” games in order to decrease illegal activity. INDIAN GAMING The State has negotiated compacts or protocols with the Oneida Nation, the St. Regis Mohawk Tribe and the Seneca Nation to conduct gaming activities. Under these compacts, the State Racing and Wagering Board is responsible for the regulation and oversight of gaming activities operating on these Indian lands. To oversee these activities, the Board maintains 12 employees at the Oneida Nation’s Turning Stone Casino, 12 employees at the St. Regis Mohawk Tribe’s Akwesasne Casino, 12 employees at the Seneca Nation’s Seneca Niagara Casino, 12 employees at the Seneca Nation’s Seneca Alleghany Casino, and 5 employees at the Seneca Buffalo Creek Casino. REGULATION OF RACING The Board’s permanent staff oversees as many as 172 temporary, seasonal employees who ensure that horse races at the State’s racetracks are conducted legally. To help oversee racing activities, the Board will utilize the services of Morrisville State College to carry out post-race testing of blood and urine samples taken from race horses.
ALL FUNDS APPROPRIATIONS
(dollars)
Category Available
2010-11
AppropriationsRecommended
2011-12 Change
ReappropriationsRecommended
2011-12State Operations 22,470,000 24,750,000 2,280,000 0 Aid To Localities 0 0 0 0 Capital Projects 0 0 0 0 Total 22,470,000 24,750,000 2,280,000 0
ALL FUND TYPES
PROJECTED LEVELS OF EMPLOYMENT BY PROGRAM FILLED ANNUAL SALARIED POSITIONS
Full-Time Equivalent Positions (FTE)
Program
2010-11Estimated FTEs
03/31/11
2011-12Estimated FTEs
03/31/12 FTE ChangeRegulation of Racing
Special Revenue Funds - Other 9 9 0 Regulation of Wagering
Special Revenue Funds - Other 96 96 0 Total 105 105 0
The above table does not reflect layoffs that may be necessary in the absence of negotiated workforce savings.

RACING AND WAGERING
281
STATE OPERATIONS ALL FUNDS FINANCIAL REQUIREMENTS BY FUND TYPE
APPROPRIATIONS (dollars)
Fund Type Available
2010-11Recommended
2011-12 ChangeSpecial Revenue Funds - Other 22,470,000 24,750,000 2,280,000 Total 22,470,000 24,750,000 2,280,000
STATE OPERATIONS
ALL FUNDS FINANCIAL REQUIREMENTS BY PROGRAM APPROPRIATIONS
(dollars)
Program Available
2010-11Recommended
2011-12 ChangeRegulation of Racing
Special Revenue Funds - Other 12,970,000 14,770,300 1,800,300 Regulation of Wagering
Special Revenue Funds - Other 9,500,000 9,979,700 479,700 Total 22,470,000 24,750,000 2,280,000
STATE OPERATIONS - OTHER THAN GENERAL FUND
SUMMARY OF APPROPRIATIONS AND CHANGES 2011-12 RECOMMENDED
(dollars) Total Personal Service Program Amount Change Amount ChangeRegulation of Racing 14,770,300 1,800,300 4,609,500 (1,925,500)Regulation of Wagering 9,979,700 479,700 5,687,000 17,000 Total 24,750,000 2,280,000 10,296,500 (1,908,500) Nonpersonal Service Program Amount Change Regulation of Racing 10,160,800 3,725,800 Regulation of Wagering 4,292,700 462,700 Total 14,453,500 4,188,500

282
GOVERNOR’S OFFICE OF REGULATORY REFORM
BUDGET HIGHLIGHTS Established in 1995 via Executive Order 20, the Governor’s Office of Regulatory Reform (GORR) was charged with improving the State’s regulatory process. The Executive Budget recommends the elimination of GORR to achieve $1.5 million in financial plan savings.
ALL FUNDS APPROPRIATIONS
(dollars)
Category Available
2010-11
AppropriationsRecommended
2011-12 Change
ReappropriationsRecommended
2011-12State Operations 2,350,000 0 (2,350,000) 0 Aid To Localities 0 0 0 0 Capital Projects 0 0 0 0 Total 2,350,000 0 (2,350,000) 0
ALL FUND TYPES
PROJECTED LEVELS OF EMPLOYMENT BY PROGRAM FILLED ANNUAL SALARIED POSITIONS
Full-Time Equivalent Positions (FTE)
Program
2010-11Estimated FTEs
03/31/11
2011-12Estimated FTEs
03/31/12 FTE ChangeAdministration
General Fund 14 0 (14) Total 14 0 (14)
The above table does not reflect layoffs that may be necessary in the absence of negotiated workforce savings.
STATE OPERATIONS
ALL FUNDS FINANCIAL REQUIREMENTS BY FUND TYPE APPROPRIATIONS
(dollars)
Fund Type Available
2010-11Recommended
2011-12 ChangeGeneral Fund 2,350,000 0 (2,350,000) Total 2,350,000 0 (2,350,000)
STATE OPERATIONS
ALL FUNDS FINANCIAL REQUIREMENTS BY PROGRAM APPROPRIATIONS
(dollars)
Program Available
2010-11Recommended
2011-12 ChangeAdministration
General Fund 2,350,000 0 (2,350,000) Total 2,350,000 0 (2,350,000)

REGULATORY REFORM
283
STATE OPERATIONS - GENERAL FUND SUMMARY OF PERSONAL SERVICE APPROPRIATIONS AND CHANGES
2011-12 RECOMMENDED (dollars)
Total Personal Service Regular
(Annual Salaried) Program Amount Change Amount ChangeAdministration 0 (2,000,000) 0 (1,970,000) Total 0 (2,000,000) 0 (1,970,000)
Temporary Service
(Nonannual Salaried) Program Amount Change Administration 0 (30,000) Total 0 (30,000)
STATE OPERATIONS - GENERAL FUND
SUMMARY OF NONPERSONAL SERVICE AND MAINTENANCE UNDISTRIBUTED APPROPRIATIONS AND CHANGES
2011-12 RECOMMENDED (dollars)
Total Supplies and Materials Program Amount Change Amount ChangeAdministration 0 (350,000) 0 (50,000) Total 0 (350,000) 0 (50,000) Travel Contractual Services Program Amount Change Amount ChangeAdministration 0 (5,000) 0 (215,000) Total 0 (5,000) 0 (215,000) Equipment Program Amount Change Administration 0 (80,000) Total 0 (80,000)

284
FOUNDATION FOR SCIENCE, TECHNOLOGY, AND INNOVATION
The 2011-12 Executive Budget would merge the Foundation for Science, Technology and Innovation into the Empire State Development Corporation. This recommendation will further streamline and improve the delivery of economic development services, eliminate duplicative administrative support and save $1.9 million in State taxpayer dollars.
ALL FUNDS APPROPRIATIONS
(dollars)
Category Available
2010-11
AppropriationsRecommended
2011-12 Change
ReappropriationsRecommended
2011-12State Operations 3,351,000 0 (3,351,000) 0 Aid To Localities 65,361,000 0 (65,361,000) 0 Capital Projects 0 0 0 0 Total 68,712,000 0 (68,712,000) 0
ALL FUND TYPES
PROJECTED LEVELS OF EMPLOYMENT BY PROGRAM FILLED ANNUAL SALARIED POSITIONS
Full-Time Equivalent Positions (FTE)
Program
2010-11Estimated FTEs
03/31/11
2011-12Estimated FTEs
03/31/12 FTE ChangeAdministration Program
General Fund 23 0 (23) Total 23 0 (23)
STATE OPERATIONS
ALL FUNDS FINANCIAL REQUIREMENTS BY FUND TYPE APPROPRIATIONS
(dollars)
Fund Type Available
2010-11Recommended
2011-12 ChangeGeneral Fund 2,851,000 0 (2,851,000) Special Revenue Funds - Other 500,000 0 (500,000) Total 3,351,000 0 (3,351,000)
STATE OPERATIONS
ALL FUNDS FINANCIAL REQUIREMENTS BY PROGRAM APPROPRIATIONS
(dollars)
Program Available
2010-11Recommended
2011-12 ChangeAdministration Program
General Fund 2,851,000 0 (2,851,000) Special Revenue Funds - Other 500,000 0 (500,000)
Total 3,351,000 0 (3,351,000)

SCIENCE, TECHNOLOGY, AND INNOVATION
285
STATE OPERATIONS - GENERAL FUND SUMMARY OF PERSONAL SERVICE APPROPRIATIONS AND CHANGES
2011-12 RECOMMENDED (dollars)
Total Personal Service Regular
(Annual Salaried) Program Amount Change Amount ChangeAdministration Program 0 (1,742,000) 0 (1,742,000) Total 0 (1,742,000) 0 (1,742,000)
STATE OPERATIONS - GENERAL FUND
SUMMARY OF NONPERSONAL SERVICE AND MAINTENANCE UNDISTRIBUTED APPROPRIATIONS AND CHANGES
2011-12 RECOMMENDED (dollars)
Total Supplies and Materials Program Amount Change Amount ChangeAdministration Program 0 (1,109,000) 0 (22,000) Total 0 (1,109,000) 0 (22,000) Travel Contractual Services Program Amount Change Amount ChangeAdministration Program 0 (33,000) 0 (262,000) Total 0 (33,000) 0 (262,000) Equipment General State Charges Program Amount Change Amount ChangeAdministration Program 0 (48,000) 0 (682,000) Total 0 (48,000) 0 (682,000) Special Departmental Charges Program Amount Change Administration Program 0 (62,000) Total 0 (62,000)
STATE OPERATIONS - OTHER THAN GENERAL FUND
SUMMARY OF APPROPRIATIONS AND CHANGES 2011-12 RECOMMENDED
(dollars) Total Nonpersonal Service Program Amount Change Amount ChangeAdministration Program 0 (500,000) 0 (500,000) Total 0 (500,000) 0 (500,000)
AID TO LOCALITIES
ALL FUNDS FINANCIAL REQUIREMENTS BY FUND TYPE APPROPRIATIONS
(dollars)
Fund Type Available
2010-11Recommended
2011-12 ChangeGeneral Fund 65,361,000 0 (65,361,000) Total 65,361,000 0 (65,361,000)

SCIENCE, TECHNOLOGY, AND INNOVATION
286
AID TO LOCALITIES ALL FUNDS FINANCIAL REQUIREMENTS BY PROGRAM
APPROPRIATIONS (dollars)
Program Available
2010-11Recommended
2011-12 ChangeHigh Technology Program
General Fund 63,548,000 0 (63,548,000) Research Development Program
General Fund 343,000 0 (343,000) Training and Business Assistance Program
General Fund 1,470,000 0 (1,470,000) Total 65,361,000 0 (65,361,000)

287
DEPARTMENT OF STATE MISSION Established in 1788, the Department of State (DOS) is the State’s oldest agency. Historically serving as the State’s general recording officer and custodian of the State’s “Great Seal”, the Department’s mission encompasses a broad range of activities that coordinate programs with, and provide services to, local governments and businesses. The Department supports public safety through the administration of building and energy code programs; administers programs for community development and local government service activities; and supports businesses through various licensing and registration activities. ORGANIZATION AND STAFFING The Department is headed by the Secretary of State, who is appointed by the Governor and confirmed by the Senate. The Department has a central office in Albany and 20 regional offices across the State. BUDGET HIGHLIGHTS The Executive Budget recommends $133.8 million All Funds ($20.2 million General Fund; $113.6 million Other Funds) for the Department of State. This reflects a net decrease of $52.0 million All Funds (-28.0 percent) from the 2010-11 budget, largely attributable to the termination of American Recovery and Reinvestment Act funding for the Community Service Block Grant Program. General Fund appropriations decrease from the 2010-11 budget by $3.2 million (-13.5 percent), reflecting an overall 10 percent reduction in State Operations spending and the elimination of the Tug Hill Commission, offset by a transfer of a portion of Consumer Protection Board operations to the Department. The Executive Budget reduces each agency’s General Fund State Operations budget by 10 percent. These savings are intended to be achieved through administrative efficiencies in non-personal service and negotiated workforce savings that minimize layoffs to the extent possible. PROGRAM HIGHLIGHTS The responsibilities of the Department of State are carried out through three programs:
The Local Government and Community Services Program manages New York’s building and energy codes; offers planning and management services to local governments; supports land use planning activities in the New York City/Catskill watershed; coordinates New York’s coastal resources and waterfront revitalization activities; administers the Department’s Federal grant programs, including the Appalachian Regional Commission; and provides a means for achieving economic self-sufficiency through programs designed to improve opportunities for low-income participants.
The Business and Licensing Services Program maintains all certificates on file for businesses and corporations; administers qualifying examinations and licensing of 26 occupations; and prepares the State Register and other publications.

STATE
288
The Administration Program provides the basic executive direction, fiscal, personnel, legal and electronic data processing activities that support the Department’s operations.
Additionally, the Department’s appropriations contain funds for the Lake George Park Commission, the Commission on Uniform State Laws, the State Athletic Commission, and the Committee on Open Government. AUTHORITIES BUDGET OFFICE The Authorities Budget Office (ABO) was statutorily created by Chapter 506 of the Laws of 2009 as an independent office with administrative support and other host services provided through the Department of State. Activities of the Authorities Budget Office are funded by a portion of an assessment the State charges public authorities. The Office continues, and builds on, the work initially begun by its predecessor, the Authority Budget Office, which was established in 2006 and was hosted by the Division of the Budget. The Authorities Budget Office promotes the principles of effective and efficient corporate governance, and will study, review and report on State and local public authorities, and enforce their compliance with State laws.
ALL FUNDS APPROPRIATIONS
(dollars)
Category Available
2010-11
AppropriationsRecommended
2011-12 Change
ReappropriationsRecommended
2011-12State Operations 77,893,309 66,568,539 (11,324,770) 36,745,000 Aid To Localities 105,133,631 67,245,000 (37,888,631) 95,698,000 Capital Projects 2,750,000 0 (2,750,000) 5,215,000 Total 185,776,940 133,813,539 (51,963,401) 137,658,000
ALL FUND TYPES
PROJECTED LEVELS OF EMPLOYMENT BY PROGRAM FILLED ANNUAL SALARIED POSITIONS
Full-Time Equivalent Positions (FTE)
Program
2010-11Estimated FTEs
03/31/11
2011-12Estimated FTEs
03/31/12 FTE ChangeAdministration
General Fund 48 64 16 Authority Budget Office
Special Revenue Funds - Other 11 11 0 Lake George Park Commission
Special Revenue Funds - Other 9 9 0 Licensing Services
Special Revenue Funds - Other 314 313 (1) Local Government and Community
Services General Fund 60 60 0 Special Revenue Funds - Federal 55 55 0 Special Revenue Funds - Other 82 82 0
Tug Hill Commission General Fund 17 0 (17)
Total 596 594 (2)
The above table does not reflect layoffs that may be necessary in the absence of negotiated workforce savings.

STATE
289
STATE OPERATIONS ALL FUNDS FINANCIAL REQUIREMENTS BY FUND TYPE
APPROPRIATIONS (dollars)
Fund Type Available
2010-11Recommended
2011-12 ChangeGeneral Fund 23,415,000 20,249,700 (3,165,300) Special Revenue Funds - Federal 13,692,309 7,950,000 (5,742,309) Special Revenue Funds - Other 40,786,000 38,368,839 (2,417,161) Total 77,893,309 66,568,539 (11,324,770) Adjustments: Transfer(s) From
Consumer Protection Board, State General Fund (2,508,000)
Special Pay Bill Special Revenue Funds - Other (34,000)
Appropriated 2010-11 75,351,309
STATE OPERATIONS ALL FUNDS FINANCIAL REQUIREMENTS BY PROGRAM
APPROPRIATIONS (dollars)
Program Available
2010-11Recommended
2011-12 ChangeAdministration
General Fund 12,333,207 11,350,686 (982,521) Authority Budget Office
Special Revenue Funds - Other 1,826,000 1,826,000 0 Lake George Park Commission
Special Revenue Funds - Other 1,529,000 1,495,000 (34,000) Licensing Services
Special Revenue Funds - Other 36,145,000 34,273,839 (1,871,161) Local Government and Community
Services General Fund 9,737,793 8,764,014 (973,779) Special Revenue Funds - Federal 13,692,309 7,950,000 (5,742,309) Special Revenue Funds - Other 1,253,000 774,000 (479,000)
Tug Hill Commission General Fund 1,194,000 0 (1,194,000) Special Revenue Funds - Other 33,000 0 (33,000)
Uniform State Laws, NY Commisson on General Fund 150,000 135,000 (15,000)
Total 77,893,309 66,568,539 (11,324,770)
STATE OPERATIONS - GENERAL AND OFFSET FUNDS
SUMMARY OF PERSONAL SERVICE APPROPRIATIONS AND CHANGES 2011-12 RECOMMENDED
(dollars)
Total Personal Service Regular
(Annual Salaried) Program Amount Change Amount ChangeAdministration 7,020,086 (534,121) 6,977,786 (529,421)Local Government and Community
Services 7,645,314 (849,479) 7,610,214 (845,579)Tug Hill Commission 0 (1,084,000) 0 (1,084,000) Total 14,665,400 (2,467,600) 14,588,000 (2,459,000)
Temporary Service
(Nonannual Salaried) Holiday/Overtime Pay
Program Amount Change Amount ChangeAdministration 36,900 (4,100) 5,400 (600)Local Government and Community
Services 30,600 (3,400) 4,500 (500)Tug Hill Commission 0 0 0 0 Total 67,500 (7,500) 9,900 (1,100)

STATE
290
STATE OPERATIONS - GENERAL AND OFFSET FUNDS SUMMARY OF NONPERSONAL SERVICE AND MAINTENANCE UNDISTRIBUTED
APPROPRIATIONS AND CHANGES 2011-12 RECOMMENDED
(dollars) Total Supplies and Materials Program Amount Change Amount ChangeAdministration 4,330,600 (448,400) 651,400 (64,600)Local Government and Community
Services 1,118,700 (124,300) 70,650 (7,850)Tug Hill Commission 0 (110,000) 0 (13,000)Uniform State Laws, NY Commisson on 135,000 (15,000) 0 0 Total 5,584,300 (697,700) 722,050 (85,450) Travel Contractual Services Program Amount Change Amount ChangeAdministration 72,650 (5,850) 2,913,950 (306,550)Local Government and Community
Services 126,270 (14,030) 576,990 (64,110)Tug Hill Commission 0 (8,000) 0 (87,000)Uniform State Laws, NY Commisson on 0 0 135,000 (15,000) Total 198,920 (27,880) 3,625,940 (472,660) Equipment Program Amount Change Administration 692,600 (71,400) Local Government and Community
Services 344,790 (38,310) Tug Hill Commission 0 (2,000) Uniform State Laws, NY Commisson on 0 0 Total 1,037,390 (111,710)
STATE OPERATIONS - OTHER THAN GENERAL FUND AND OFFSET FUNDS
SUMMARY OF APPROPRIATIONS AND CHANGES 2011-12 RECOMMENDED
(dollars) Total Personal Service Program Amount Change Amount ChangeAuthority Budget Office 1,826,000 0 953,000 0 Lake George Park Commission 1,495,000 (34,000) 612,000 (23,000)Licensing Services 34,273,839 (1,871,161) 18,333,573 (1,216,427)Local Government and Community
Services 8,724,000 (6,221,309) 4,878,000 (1,652,000)Tug Hill Commission 0 (33,000) 0 0 Total 46,318,839 (8,159,470) 24,776,573 (2,891,427) Nonpersonal Service Maintenance Undistributed Program Amount Change Amount ChangeAuthority Budget Office 873,000 0 0 0 Lake George Park Commission 883,000 (11,000) 0 0 Licensing Services 15,940,266 (654,734) 0 0 Local Government and Community
Services 3,846,000 (3,533,000) 0 (1,036,309)Tug Hill Commission 0 (33,000) 0 0 Total 21,542,266 (4,231,734) 0 (1,036,309)
AID TO LOCALITIES
ALL FUNDS FINANCIAL REQUIREMENTS BY FUND TYPE APPROPRIATIONS
(dollars)
Fund Type Available
2010-11Recommended
2011-12 ChangeSpecial Revenue Funds - Federal 104,594,631 66,706,000 (37,888,631) Special Revenue Funds - Other 539,000 539,000 0 Total 105,133,631 67,245,000 (37,888,631)

STATE
291
AID TO LOCALITIES ALL FUNDS FINANCIAL REQUIREMENTS BY PROGRAM
APPROPRIATIONS (dollars)
Program Available
2010-11Recommended
2011-12 ChangeLicensing Services
Special Revenue Funds - Other 539,000 539,000 0 Local Government and Community
Services Special Revenue Funds - Federal 104,594,631 66,706,000 (37,888,631)
Total 105,133,631 67,245,000 (37,888,631)
CAPITAL PROJECTS
ALL FUNDS FINANCIAL REQUIREMENTS BY PROGRAM APPROPRIATIONS
(dollars)
Comprehensive Construction Program Available
2010-11Recommended
2011-12 Change Reappropriations
2011-12Solid and Hazardous Waste Management
Hazardous Waste Remedial Fund - Oversight & Assessment 2,750,000 0 (2,750,000) 5,215,000
Total 2,750,000 0 (2,750,000) 5,215,000

292
DIVISION OF STATE POLICE MISSION The primary mission of the Division of State Police is to promote highway safety and protect the citizens of New York State. The Division’s many responsibilities include patrolling roads and highways outside major urban areas, providing specialty and investigative police services, conducting sophisticated investigations of criminal activities like drug trafficking and child endangerment, and working cooperatively with various levels of law enforcement throughout the State. ORGANIZATION AND STAFFING The Division, headed by a Superintendent who is appointed by the Governor, is organized into 11 Troops, all of which are overseen and supported by Division Headquarters located in Albany. Each Troop encompasses a geographic area of the State, with the exception of Troop T which is dedicated to providing police services on the New York State Thruway. Troop NYC provides specialized investigative and support services in the five boroughs of New York City, while the remaining nine Troops provide patrol coverage and criminal investigation services in cooperation with the local law enforcement community. Factors which affect the extent of State Police’s presence throughout the State vary depending on the area’s population, highway mileage, and availability of county and local law enforcement agencies. BUDGET HIGHLIGHTS The 2011-12 Executive Budget recommends $677 million in All Funds spending ($422 million General Fund, $244 Other Operating Funds and $11.5 million Capital Projects;) to support ongoing agency activities. This is a decrease of $46 million (-6.4 percent) All Funds (a $47 million General Fund decrease offset by a $1 million Other Funds increase) from the 2010-11 Enacted Budget. The Executive Budget reduces each agency’s General Fund State Operations budget by 10 percent. These savings are intended to be achieved through administrative efficiencies in non-personal service and negotiated workforce savings that minimize layoffs to the extent possible. PROGRAM HIGHLIGHTS The Division is divided into two principal branches: the Uniform Force and the Bureau of Criminal Investigation. Both of these branches play an integral role in the State’s public safety efforts and work cooperatively with numerous criminal justice entities to reduce crime, protect the public, and guard against acts of terrorism. UNIFORM FORCE The Uniform Force has two primary responsibilities: protecting the citizens of New York State and promoting highway safety. In some areas of the State, Uniformed Troopers serve as the primary law enforcement agency, and respond to various types of criminal activity such as burglaries, missing children, assaults, robberies, and homicides.

STATE POLICE
293
In areas where the State Police is not the primary law enforcement agency, State Troopers work cooperatively with local law enforcement to provide supplemental law enforcement support. BUREAU OF CRIMINAL INVESTIGATION The Bureau of Criminal Investigation (BCI) is the “plain clothes” investigative branch of the Division. BCI Investigators concentrate on cases related to narcotics, child abuse, auto theft, consumer product tampering, organized crime, violent crime, and working with Federal and local law enforcement to support counter-terrorism efforts. In addition, BCI resources are regularly deployed to assist local and county law enforcement agencies that may lack the resources or technical expertise required to conduct major criminal investigations.
ALL FUNDS APPROPRIATIONS
(dollars)
Category Available
2010-11
AppropriationsRecommended
2011-12 Change
ReappropriationsRecommended
2011-12State Operations 711,739,000 665,859,000 (45,880,000) 18,429,000 Aid To Localities 0 0 0 0 Capital Projects 11,500,000 11,500,000 0 94,068,000 Total 723,239,000 677,359,000 (45,880,000) 112,497,000
ALL FUND TYPES
PROJECTED LEVELS OF EMPLOYMENT BY PROGRAM FILLED ANNUAL SALARIED POSITIONS
Full-Time Equivalent Positions (FTE)
Program
2010-11Estimated FTEs
03/31/11
2011-12Estimated FTEs
03/31/12 FTE ChangeAdministration
General Fund 100 100 0 Criminal Investigation Activities
General Fund 1,281 1,238 (43) Special Revenue Funds - Other 105 105 0
Patrol Activities General Fund 2,806 2,719 (87) Special Revenue Funds - Federal 41 41 0 Special Revenue Funds - Other 25 25 0
Governor’s Traffic Safety Committee Special Revenue Funds - Other 4 4 0
Policing the Thruway Special Revenue Funds - Other 312 312 0
Technical Police Services General Fund 765 765 0
Total 5,439 5,309 (130)
The above table does not reflect layoffs that may be necessary in the absence of negotiated workforce savings.

STATE POLICE
294
STATE OPERATIONS ALL FUNDS FINANCIAL REQUIREMENTS BY FUND TYPE
APPROPRIATIONS (dollars)
Fund Type Available
2010-11Recommended
2011-12 ChangeGeneral Fund 469,079,000 422,174,000 (46,905,000) Special Revenue Funds - Federal 6,310,000 7,335,000 1,025,000 Special Revenue Funds - Other 236,350,000 236,350,000 0 Total 711,739,000 665,859,000 (45,880,000) Adjustments: Transfer(s) From
Special Pay Bill General Fund (1,022,000)
Appropriated 2010-11 710,717,000
STATE OPERATIONS ALL FUNDS FINANCIAL REQUIREMENTS BY PROGRAM
APPROPRIATIONS (dollars)
Program Available
2010-11Recommended
2011-12 ChangeAdministration
General Fund 19,298,000 17,370,000 (1,928,000) Special Revenue Funds - Other 308,000 308,000 0
Criminal Investigation Activities General Fund 182,010,000 163,809,000 (18,201,000) Special Revenue Funds - Federal 810,000 700,000 (110,000) Special Revenue Funds - Other 18,450,000 18,450,000 0
Patrol Activities General Fund 207,007,000 186,307,000 (20,700,000) Special Revenue Funds - Federal 5,500,000 5,500,000 0 Special Revenue Funds - Other 129,177,000 129,177,000 0
Policing the Thruway Special Revenue Funds - Other 53,815,000 53,815,000 0
Technical Police Services General Fund 60,764,000 54,688,000 (6,076,000) Special Revenue Funds - Federal 0 1,135,000 1,135,000 Special Revenue Funds - Other 34,600,000 34,600,000 0
Total 711,739,000 665,859,000 (45,880,000)
STATE OPERATIONS - GENERAL FUND
SUMMARY OF PERSONAL SERVICE APPROPRIATIONS AND CHANGES 2011-12 RECOMMENDED
(dollars)
Total Personal Service Regular
(Annual Salaried) Program Amount Change Amount ChangeAdministration 17,163,000 (1,906,000) 16,373,000 (1,819,000)Criminal Investigation Activities 156,710,000 (17,412,000) 149,940,000 (16,660,000)Patrol Activities 184,765,000 (20,529,000) 174,447,000 (19,383,000)Technical Police Services 35,102,000 (3,900,000) 31,066,000 (3,452,000) Total 393,740,000 (43,747,000) 371,826,000 (41,314,000)
Temporary Service
(Nonannual Salaried) Holiday/Overtime Pay
Program Amount Change Amount ChangeAdministration 344,000 (38,000) 446,000 (49,000)Criminal Investigation Activities 0 0 6,770,000 (752,000)Patrol Activities 450,000 (50,000) 9,868,000 (1,096,000)Technical Police Services 2,070,000 (230,000) 1,966,000 (218,000) Total 2,864,000 (318,000) 19,050,000 (2,115,000)

STATE POLICE
295
STATE OPERATIONS - GENERAL FUND SUMMARY OF NONPERSONAL SERVICE AND MAINTENANCE UNDISTRIBUTED
APPROPRIATIONS AND CHANGES 2011-12 RECOMMENDED
(dollars) Total Supplies and Materials Program Amount Change Amount ChangeAdministration 207,000 (22,000) 77,000 (8,000)Criminal Investigation Activities 7,099,000 (789,000) 1,242,000 (138,000)Patrol Activities 1,542,000 (171,000) 341,000 (38,000)Technical Police Services 19,586,000 (2,176,000) 4,026,000 (447,000) Total 28,434,000 (3,158,000) 5,686,000 (631,000) Travel Contractual Services Program Amount Change Amount ChangeAdministration 38,000 (4,000) 54,000 (6,000)Criminal Investigation Activities 101,000 (11,000) 1,800,000 (200,000)Patrol Activities 23,000 (2,000) 739,000 (82,000)Technical Police Services 0 0 8,028,000 (892,000) Total 162,000 (17,000) 10,621,000 (1,180,000) Equipment Program Amount Change Administration 38,000 (4,000) Criminal Investigation Activities 3,956,000 (440,000) Patrol Activities 439,000 (49,000) Technical Police Services 7,532,000 (837,000) Total 11,965,000 (1,330,000)
STATE OPERATIONS - OTHER THAN GENERAL FUND
SUMMARY OF APPROPRIATIONS AND CHANGES 2011-12 RECOMMENDED
(dollars) Total Personal Service Program Amount Change Amount ChangeAdministration 308,000 0 0 0 Criminal Investigation Activities 19,150,000 (110,000) 11,721,000 150,000 Patrol Activities 134,677,000 0 121,452,000 2,700,000 Policing the Thruway 53,815,000 0 37,542,000 0 Technical Police Services 35,735,000 1,135,000 4,250,000 250,000 Total 243,685,000 1,025,000 174,965,000 3,100,000 Nonpersonal Service Maintenance Undistributed Program Amount Change Amount ChangeAdministration 308,000 0 0 0 Criminal Investigation Activities 7,429,000 550,000 0 (810,000)Patrol Activities 13,225,000 2,800,000 0 (5,500,000)Policing the Thruway 16,273,000 0 0 0 Technical Police Services 31,485,000 885,000 0 0 Total 68,720,000 4,235,000 0 (6,310,000)
CAPITAL PROJECTS
ALL FUNDS FINANCIAL REQUIREMENTS BY PROGRAM APPROPRIATIONS
(dollars)
Comprehensive Construction Program Available
2010-11Recommended
2011-12 Change Reappropriations
2011-12Maintenance and Improvement of Existing Facilities
Capital Projects Fund 5,500,000 5,500,000 0 21,915,000 Capital Projects Fund - Authority Bonds 0 0 0 11,653,000
New Facilities Capital Projects Fund - Authority Bonds 6,000,000 6,000,000 0 60,500,000
Total 11,500,000 11,500,000 0 94,068,000

296
STATE UNIVERSITY OF NEW YORK MISSION Created in 1948, the State University of New York (SUNY) is the largest public university system in the nation with 64 campuses offering a complete range of academic, professional and vocational programs. The State University system is uniquely positioned to provide New Yorkers with access to quality postsecondary educational programs in all regions of the State. ORGANIZATION AND STAFFING The three major components of the State University’s mission – teaching, public service and research – are carried out by:
Eight campuses offering academic programs through the doctoral level and serving as research centers;
Fourteen comprehensive colleges providing undergraduate education in a variety of academic fields;
Seven colleges of technology focusing on the development of a workforce with the advanced skills required by an increasingly technology-dependent economy;
Five statutory and contract colleges at Alfred and Cornell universities that offer nationally acclaimed programs in ceramics, veterinary medicine, agriculture and life sciences, industrial and labor relations, and human ecology;
Thirty community colleges offering access to a wide array of higher education opportunities that prepare students for transfer to senior colleges or train them for a variety of technical or paraprofessional occupations; and
Three teaching hospitals in Brooklyn, Stony Brook, and Syracuse, along with a medical school in Buffalo, which provide graduate medical education training for SUNY students as well as valuable health care services for their host communities.
The University is governed by a Board of Trustees consisting of 17 members, with 15 appointed by the Governor to staggered seven-year terms and approved by the Senate, and two ex-officio trustees representing the student assembly and faculty of the State University. The Board oversees the operations of the University’s State-operated campuses and also exercises general supervisory authority over the community colleges, which are sponsored by local governments and governed by local boards of trustees. The chief executive officer of the University is the Chancellor, who is appointed by the Board of Trustees. Individual college presidents are also appointed by the Board. BUDGET HIGHLIGHTS The Executive Budget recommends $9.35 billion All Funds for the State University of New York ($2.6 billion General Fund, $5.7 billion self-generated and federal funds, and $1.0 billion capital funds). The budget includes General Fund growth in personal service costs (as a result of collective bargaining contracts), nonpersonal services, fringe benefits and community college enrollment growth, offset by General Fund decreases associated with reductions to State-operated campuses, statutory colleges and community colleges necessary to close State budget gaps.

STATE UNIVERSITY
297
The Executive Budget reduces each agency’s General Fund State Operations budget by 10 percent. These savings are intended to be achieved through administrative efficiencies in non-personal service and negotiated workforce savings that minimize layoffs to the extent possible. Major 2011-12 budget actions:
Reduce General Fund Support for State-Operated Colleges: The Executive Budget recommends a $131.4 million decrease in direct General Fund support (approximately -10 percent from 2010-11 levels) for the operations of the SUNY State-Operated Colleges and University-wide programs. This reduction will be allocated by the Board of Trustees.
Reduce General Fund Support for Statutory Colleges: The Executive Budget recommends a $17.3 million decrease in direct General Fund support for the operations of the four statutory colleges at Cornell and a $1.3 million decrease in direct General Fund support for the College of Ceramics at Alfred University (an approximately -10 percent decrease from 2010-11 levels).
Eliminate the SUNY Hospital Subsidy: The Executive Budget recommends the elimination of the $154 million General Fund subsidy provided to the three SUNY teaching hospitals at Brooklyn, Stony Brook, and Syracuse. This funding represents approximately eight percent of hospital operating revenue, the balance of which is supported by patient and other self-supporting program income.
Reduce Spending Authority for Long Island Veterans’ Home: The Executive Budget assumes a $4.7 million reduction in operating spending for Long Island Veterans’ Home, and the transfer of these savings to the State treasury.
Reduce Community College Base Operating Aid: The Executive Budget recommends reducing base operating aid support for SUNY’s 30 community colleges by 10 percent per full-time equivalent (FTE) student. As a result, the rate would decline from $2,260 to $2,034. This action generates General Fund savings of $33.2 million.
STATE-OPERATED COLLEGES Executive Budget appropriations for the 29 state-operated campuses consist of $2.1 billion in General Fund resources (including $1.2 billion in fringe benefits) and $1.3 billion for the collection and disbursement of tuition and other revenue for a gross instructional budget of $3.3 billion to support senior college campuses, system administration and University-wide programs. Recommended levels of General Fund support (not including fringe benefits) represent an $87.9 million decrease from 2010-11 final enacted budget levels, consisting of $43.4 million in increases from collective bargaining and non-personal services inflationary costs, offset by a recommended reduction of $131.4 million. STATUTORY COLLEGES The Executive Budget recommends a total of $129.3 million in General Fund support for the operations of the five statutory colleges at Alfred Ceramics and Cornell University. The four statutory colleges at Cornell (Agriculture and Life Sciences, Human Ecology, Veterinary Medicine, and Industrial and Labor Relations) would receive $78.9 million, a net decrease of $6.4 million from 2010-11 final enacted appropriation levels, reflecting $4.7 million in increases from collective bargaining and inflation, offset by

STATE UNIVERSITY
298
2011-12 reductions of $11.0 million. In addition, the budget recommends $42.1 million to support the land grant mission of Cornell University, a $6.3 million decrease from 2010-11 final Enacted Budget appropriation levels. The College of Ceramics at Alfred University would receive $8.1 million, a $900,000 decrease from 2010-11 final Enacted Budget appropriation levels, reflecting $400,000 in increases from collective bargaining and inflation, offset by a recommended reduction of $1.3 million. SUNY HOSPITALS The Executive budget proposes $2.5 billion for the operations of the three SUNY teaching hospitals at Brooklyn, Stony Brook, and Syracuse, including $350 million in spending authority for the operations of the Long Island College Hospital (LICH). This appropriation authority will be available if a proposed agreement for acquisition of LICH by SUNY Brooklyn Downstate Medical Center is finalized in the upcoming months. The SUNY hospitals will continue to reimburse the State for the full cost of capital projects, with $48.0 million provided in transfer authority for this purpose. The Executive Budget eliminates a $154 million State operating subsidy for the three SUNY hospitals, which represents approximately eight percent of total operating revenue. COMMUNITY COLLEGES SUNY’s community colleges have three basic funding sources: State support, local sponsor support, and student tuition revenue. The Executive Budget recommends $427.8 million in State support, representing a $23.9 million decrease in total available funding from 2010-11 final Enacted Budget levels. This change is attributable to increases of $21.6 million for enrollment growth and $2.8 million related to the expiration of one-time reductions from the 2010-11 FMAP contingency plan, offset by decreases related to the annualization of the 2010-11 enacted budget reduction of $285 per FTE student ($14.6 million) and a $33.2 million decrease resulting from a recommended $226 per student FTE reduction in base operating aid (from $2,260 to $2,034). CORNELL COOPERATIVE EXTENSION County cooperative extension associations – funded by State, county and Federal contributions – provide specialized information and assistance in community development, agricultural technology, 4-H youth development and consumer and family education. The Executive Budget recommends $3.9 million in State support for this program. CAPITAL PROJECTS The 2008-09 enacted budget provided SUNY with $4.1 billion in new capital appropriations, a major step in the implementation of a new, $6.4 billion multi-year capital plan for SUNY’s educational facilities, hospitals, residence halls and community colleges. The 2011-12 Executive Budget continues this commitment to the rehabilitation of SUNY’s educational facilities infrastructure by providing the fourth of five annual $550 million appropriations to address the accumulated backlog of critical maintenance projects throughout the University system. The Executive Budget also includes $31.5

STATE UNIVERSITY
299
million for the State’s 50 percent share of capital projects for community college campuses that have secured local sponsor resolutions, and $421 million for SUNY’s self-funded resident hall capital program. PROGRAM HIGHLIGHTS The State University of New York is the nation’s largest comprehensive public university, offering 7,669 degree and certificate programs at the research universities, community colleges, medical schools and colleges of technology that comprise its 64 campuses. The State University enrolls approximately 40 percent of college-bound students graduating from New York State high schools. Nearly 468,000 full-time and part-time SUNY students – 222,000 at State-operated campuses and 246,000 in community colleges – are pursuing studies ranging from one-year certificate programs to doctorates. In 2010, two SUNY campuses, Geneseo and Binghamton, were ranked among the top 10 best values for public campuses in the nation by Kiplinger’s Personal Finance magazine. The academic profile of incoming students continues to grow stronger at SUNY campuses. Nearly three-fourths of students that enrolled at SUNY University Centers in fall 2009 had SAT scores above 1100, comparable to admission profiles found at other top public flagship institutions across the country. Overall, SUNY campuses averaged 1158 on the SAT, more than 140 points above the national average. The State University is also working to expand the volume of scholarly research conducted by its faculty, and is more aggressively seeking Federal and other external support for research. As a result, SUNY sponsored research expenditures totaled $922.0 million in 2009-10. Research grants at SUNY now underwrite more than 7,314 projects, which directly support more than 17,103 full and part-time jobs across New York State. SUNY campuses are partners in the State’s six University-based Centers of Excellence, a high-technology initiative that will continue New York’s advancement in the areas of university-based research, business creation and job development, including:
Albany Center of Excellence in Nanoelectronics, a semiconductor research center at SUNY-Albany;
Buffalo Center of Excellence in Bioinformatics which includes the Life Sciences Complex used for super-computing, pharmaceutical research and workforce development; and
Long Island Center of Excellence in Wireless Internet and Information Technology in tandem with several other high-tech research projects such as the Bioinformatics Research Center at Cold Spring Harbor Laboratory.
The State University’s 30 locally sponsored community colleges serve as a source of skilled employees and play a role in the State’s efforts to attract and retain businesses seeking an able workforce. Through their policy of open admissions, the community colleges also ensure access to postsecondary education. From the curriculum and instruction in its classrooms, research in its laboratories, support from its alumni and its appeal to a growing number of college-bound students, the State University continues to elevate its ranking among the nation’s finest public universities.

STATE UNIVERSITY
300
ALL FUNDS APPROPRIATIONS
(dollars)
Category Available
2010-11
AppropriationsRecommended
2011-12 Change
ReappropriationsRecommended
2011-12State Operations 7,611,213,300 7,912,822,600 301,609,300 934,266,000 Aid To Localities 523,241,386 431,701,345 (91,540,041) 0 Capital Projects 572,426,000 1,002,571,000 430,145,000 6,573,059,000 Total 8,706,880,686 9,347,094,945 640,214,259 7,507,325,000
ALL FUND TYPES
PROJECTED LEVELS OF EMPLOYMENT BY PROGRAM FILLED ANNUAL SALARIED POSITIONS
Full-Time Equivalent Positions (FTE)
Program
2010-11Estimated FTEs
03/31/11
2011-12Estimated FTEs
03/31/12 FTE ChangeAll State University Colleges and Schools
General Fund 24,696 24,696 0 Special Revenue Funds - Other 17,113 17,513 400 Capital Projects Funds - Other 6 6 0
Total 41,815 42,215 400
The above table does not reflect layoffs that may be necessary in the absence of negotiated workforce savings.
STATE OPERATIONS
ALL FUNDS FINANCIAL REQUIREMENTS BY FUND TYPE APPROPRIATIONS
(dollars)
Fund Type Available
2010-11Recommended
2011-12 ChangeGeneral Fund 2,298,224,900 2,190,233,300 (107,991,600) Special Revenue Funds - Federal 358,500,000 363,600,000 5,100,000 Special Revenue Funds - Other 4,937,888,400 5,339,889,300 402,000,900 Internal Service Funds 16,600,000 19,100,000 2,500,000 Total 7,611,213,300 7,912,822,600 301,609,300 Adjustments: Transfer(s) From
Special Pay Bill General Fund (1,115,000) Special Revenue Funds - Other (1,794,000)
Appropriated 2010-11 7,608,304,300
STATE OPERATIONS ALL FUNDS FINANCIAL REQUIREMENTS BY PROGRAM
APPROPRIATIONS (dollars)
Program Available
2010-11Recommended
2011-12 ChangeAll State University Colleges and Schools
General Fund 1,087,428,900 961,623,300 (125,805,600) Special Revenue Funds - Federal 358,500,000 363,600,000 5,100,000 Special Revenue Funds - Other 4,937,888,400 5,339,889,300 402,000,900 Internal Service Funds 16,600,000 19,100,000 2,500,000
Employee Fringe Benefits General Fund 1,210,796,000 1,228,610,000 17,814,000
Total 7,611,213,300 7,912,822,600 301,609,300

STATE UNIVERSITY
301
AID TO LOCALITIES ALL FUNDS FINANCIAL REQUIREMENTS BY FUND TYPE
APPROPRIATIONS (dollars)
Fund Type Available
2010-11Recommended
2011-12 ChangeGeneral Fund 503,802,736 431,701,345 (72,101,391) Special Revenue Funds - Federal 19,438,650 0 (19,438,650) Total 523,241,386 431,701,345 (91,540,041)
AID TO LOCALITIES
ALL FUNDS FINANCIAL REQUIREMENTS BY PROGRAM APPROPRIATIONS
(dollars)
Program Available
2010-11Recommended
2011-12 ChangeAmerican Recovery and Reinvestment Act
of 2009 State Stabilization Fund Special Revenue Funds - Federal 19,438,650 0 (19,438,650)
Community Colleges General Fund 371,182,736 427,781,345 56,598,609
County Cooperative Extension Program - Cornell University General Fund 132,620,000 3,920,000 (128,700,000)
Total 523,241,386 431,701,345 (91,540,041)
CAPITAL PROJECTS
ALL FUNDS FINANCIAL REQUIREMENTS BY PROGRAM APPROPRIATIONS
(dollars)
Comprehensive Construction Program Available
2010-11Recommended
2011-12 Change Reappropriations
2011-12 Senior Universities General Maintenance and Improvements
Capital Projects Fund 0 0 0 4,100,000 Capital Projects Fund - Advances 550,000,000 550,000,000 0 4,883,033,000
State University Capital Projects Fund State University Capital Projects Fund 0 0 0 610,500,000
State University Residence Hall Rehabilitation Fund State University Residence Hall Rehabilitation Fund 0 90,000,000 90,000,000 95,000,000 SUNY Dorms (Direct Auth Bonds) 0 331,000,000 331,000,000 435,000,000 Subtotal 550,000,000 971,000,000 421,000,000 6,027,633,000 Community Colleges
General Maintenance and Improvements Capital Projects Fund 0 0 0 43,000,000 Capital Projects Fund - Advances 0 0 0 18,000,000 Cap Proj Fund - SUNY CC (Direct Auth Bonds) 22,426,000 31,571,000 9,145,000 484,426,000 Subtotal 22,426,000 31,571,000 9,145,000 545,426,000
Total 572,426,000 1,002,571,000 430,145,000 6,573,059,000

302
STATE UNIVERSITY CONSTRUCTION FUND MISSION The State University Construction Fund (Fund) is a public benefit corporation established in 1962 to serve as the construction agent for academic, hospital and student services facilities at State-operated institutions and statutory colleges under the jurisdiction of the State University of New York (SUNY). Consistent with the State University’s approved Master Capital Construction Plan; the Fund oversees construction, acquisition, reconstruction and rehabilitation or improvement of such facilities. ORGANIZATION AND STAFFING The Fund is administered by a Board of Trustees consisting of three members appointed by the Governor, one of whom must be a State University Trustee. Members other than the State University Trustee are confirmed by the Senate. The Board appoints a General Manager who serves as chief administrative officer of the agency. The Fund’s operations are supported entirely from proceeds of personal income tax (PIT) bonds issued to finance the design, construction and rehabilitation of SUNY’s academic, hospital and student services facilities. BUDGET HIGHLIGHTS The Executive Budget includes $26.2 million in appropriations funded from proceeds of PIT bonds. This level of funding represents an increase of $494,000 (1.9 percent) from available 2010-11 funding levels, and will provide the required resources to address the design, planning and construction management workload of SUNY’s ongoing $5.4 billion multi-year capital plan for its academic, hospital and student services facilities. PROGRAM HIGHLIGHTS The total capacity of all University State-operated campus academic, residential, and hospital facilities exceeds 79 million gross square feet of space; containing 2,308 buildings, hundreds of miles of roads, millions of square yards of walks and plazas, more than 75,000 residential beds and approximately 1,275 licensed hospital and clinic beds. The current estimated replacement value of all State-operated academic facilities is nearly $26 billion. During the 2009-10 fiscal year, the Fund initiated the design of 67 projects having a total value of $813 million in design and construction work ($103 million and $710 million, respectively) and began construction of 112 projects having an estimated cost of $392 million. These figures exclude projects administered by individual campuses. In addition to design and construction of SUNY’s educational facilities, other key functions of the Fund include:
Preparation and development of the State University’s Master Capital Construction Plan, as well as master plans for individual campuses;
Preparation of the State University’s annual capital budget request and facility program;
Development and maintenance of online interactive data processing systems on space and property inventories, real property, State building codes and other related plant management functions; and

STATE UNIVERSITY CONSTRUCTION
303
Management and administration of University-wide programs including minor rehabilitation, energy conservation and telecommunications.
ALL FUNDS
APPROPRIATIONS (dollars)
Category Available
2010-11
AppropriationsRecommended
2011-12 Change
ReappropriationsRecommended
2011-12State Operations 25,678,000 26,172,000 494,000 0 Aid To Localities 0 0 0 0 Capital Projects 0 0 0 0 Total 25,678,000 26,172,000 494,000 0
ALL FUND TYPES
PROJECTED LEVELS OF EMPLOYMENT BY PROGRAM FILLED ANNUAL SALARIED POSITIONS
Full-Time Equivalent Positions (FTE)
Program
2010-11Estimated FTEs
03/31/11
2011-12Estimated FTEs
03/31/12 FTE ChangeAdministration
Special Revenue Funds - Other 172 172 0 Total 172 172 0
The above table does not reflect layoffs that may be necessary in the absence of negotiated workforce savings.
STATE OPERATIONS
ALL FUNDS FINANCIAL REQUIREMENTS BY FUND TYPE APPROPRIATIONS
(dollars)
Fund Type Available
2010-11Recommended
2011-12 ChangeSpecial Revenue Funds - Other 25,678,000 26,172,000 494,000 Total 25,678,000 26,172,000 494,000
STATE OPERATIONS
ALL FUNDS FINANCIAL REQUIREMENTS BY PROGRAM APPROPRIATIONS
(dollars)
Program Available
2010-11Recommended
2011-12 ChangeAdministration
Special Revenue Funds - Other 25,678,000 26,172,000 494,000 Total 25,678,000 26,172,000 494,000
STATE OPERATIONS - OTHER THAN GENERAL FUND
SUMMARY OF APPROPRIATIONS AND CHANGES 2011-12 RECOMMENDED
(dollars) Total Personal Service Program Amount Change Amount ChangeAdministration 26,172,000 494,000 15,544,000 266,000 Total 26,172,000 494,000 15,544,000 266,000 Nonpersonal Service Program Amount Change Administration 10,628,000 228,000 Total 10,628,000 228,000

304
STATEWIDE FINANCIAL SYSTEM In 2011, the cooperative efforts of the Office of the State Comptroller (OSC) and the Executive will culminate in the launch of the first phase of a new statewide financial system. This first phase is expected to result in future operating efficiencies for agencies, and will provide detailed information on the State’s financial transactions to support the transformation of government. Development efforts will continue under the governance structure adopted in October 2009, with the Division of the Budget and OSC sharing joint oversight of the project, advised by a Steering Committee that includes broad agency representation. Progress toward full implementation of the statewide financial system will continue during 2011 and 2012, with most agencies expected to be fully utilizing the system by 2013.
ALL FUNDS APPROPRIATIONS
(dollars)
Category Available
2010-11
AppropriationsRecommended
2011-12 Change
ReappropriationsRecommended
2011-12State Operations 1,684,000 45,000,000 43,316,000 15,800,000 Aid To Localities 0 0 0 0 Capital Projects 0 0 0 0 Total 1,684,000 45,000,000 43,316,000 15,800,000
ALL FUND TYPES
PROJECTED LEVELS OF EMPLOYMENT BY PROGRAM FILLED ANNUAL SALARIED POSITIONS
Full-Time Equivalent Positions (FTE)
Program
2010-11Estimated FTEs
03/31/11
2011-12Estimated FTEs
03/31/12 FTE ChangeStatewide Financial System Program
Special Revenue Funds - Other 113 136 23 Total 113 136 23
The above table does not reflect layoffs that may be necessary in the absence of negotiated workforce savings.
STATE OPERATIONS
ALL FUNDS FINANCIAL REQUIREMENTS BY FUND TYPE APPROPRIATIONS
(dollars)
Fund Type Available
2010-11Recommended
2011-12 ChangeSpecial Revenue Funds - Other 1,684,000 45,000,000 43,316,000 Total 1,684,000 45,000,000 43,316,000 Adjustments: Transfer(s) From
Audit and Control, Department of General Fund (1,684,000)
Appropriated 2010-11 0

STATEWIDE FINANCIAL SYSTEM
305
STATE OPERATIONS ALL FUNDS FINANCIAL REQUIREMENTS BY PROGRAM
APPROPRIATIONS (dollars)
Program Available
2010-11Recommended
2011-12 ChangeStatewide Financial System Program
Special Revenue Funds - Other 1,684,000 45,000,000 43,316,000 Total 1,684,000 45,000,000 43,316,000
STATE OPERATIONS - OTHER THAN GENERAL FUND
SUMMARY OF APPROPRIATIONS AND CHANGES 2011-12 RECOMMENDED
(dollars) Total Personal Service Program Amount Change Amount ChangeStatewide Financial System Program 45,000,000 43,316,000 10,234,000 8,550,000 Total 45,000,000 43,316,000 10,234,000 8,550,000 Nonpersonal Service Program Amount Change Statewide Financial System Program 34,766,000 34,766,000 Total 34,766,000 34,766,000
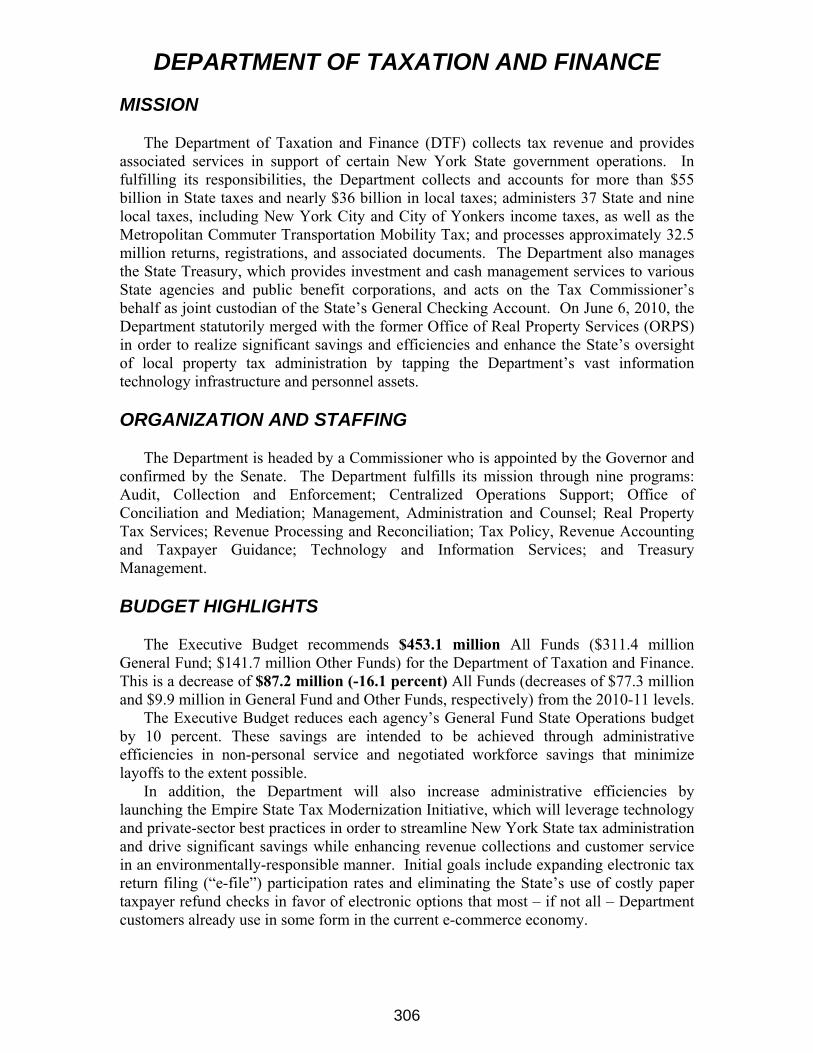
306
DEPARTMENT OF TAXATION AND FINANCE MISSION The Department of Taxation and Finance (DTF) collects tax revenue and provides associated services in support of certain New York State government operations. In fulfilling its responsibilities, the Department collects and accounts for more than $55 billion in State taxes and nearly $36 billion in local taxes; administers 37 State and nine local taxes, including New York City and City of Yonkers income taxes, as well as the Metropolitan Commuter Transportation Mobility Tax; and processes approximately 32.5 million returns, registrations, and associated documents. The Department also manages the State Treasury, which provides investment and cash management services to various State agencies and public benefit corporations, and acts on the Tax Commissioner’s behalf as joint custodian of the State’s General Checking Account. On June 6, 2010, the Department statutorily merged with the former Office of Real Property Services (ORPS) in order to realize significant savings and efficiencies and enhance the State’s oversight of local property tax administration by tapping the Department’s vast information technology infrastructure and personnel assets. ORGANIZATION AND STAFFING The Department is headed by a Commissioner who is appointed by the Governor and confirmed by the Senate. The Department fulfills its mission through nine programs: Audit, Collection and Enforcement; Centralized Operations Support; Office of Conciliation and Mediation; Management, Administration and Counsel; Real Property Tax Services; Revenue Processing and Reconciliation; Tax Policy, Revenue Accounting and Taxpayer Guidance; Technology and Information Services; and Treasury Management. BUDGET HIGHLIGHTS The Executive Budget recommends $453.1 million All Funds ($311.4 million General Fund; $141.7 million Other Funds) for the Department of Taxation and Finance. This is a decrease of $87.2 million (-16.1 percent) All Funds (decreases of $77.3 million and $9.9 million in General Fund and Other Funds, respectively) from the 2010-11 levels. The Executive Budget reduces each agency’s General Fund State Operations budget by 10 percent. These savings are intended to be achieved through administrative efficiencies in non-personal service and negotiated workforce savings that minimize layoffs to the extent possible. In addition, the Department will also increase administrative efficiencies by launching the Empire State Tax Modernization Initiative, which will leverage technology and private-sector best practices in order to streamline New York State tax administration and drive significant savings while enhancing revenue collections and customer service in an environmentally-responsible manner. Initial goals include expanding electronic tax return filing (“e-file”) participation rates and eliminating the State’s use of costly paper taxpayer refund checks in favor of electronic options that most – if not all – Department customers already use in some form in the current e-commerce economy.

TAXATION AND FINANCE
307
The Executive Budget proposes legislation that will reduce mail volumes – including electronic delivery of personal income tax, sales and business tax bills as well as documents regarding property issues, when authorized by the taxpayer – expand e-file participation, and reduce the cost of real property tax administration for localities by allowing notices, filings, and other transactions to be completed electronically. PROGRAM HIGHLIGHTS The Department’s strategic goal is to achieve “universal voluntary compliance” – to ensure that all taxpayers voluntarily pay the correct amount of tax due on a timely basis. To achieve this goal, the Department is committed to increasing the current high level of voluntary compliance through taxpayer education initiatives, technology, and enforcement efforts. The operations of the Department are organized along the following functional lines to support its revenue-generation mission:
Audit, Collection, and Enforcement: Ensures that voluntarily remitted taxes are accurate and complete; employs sophisticated technologies and highly-trained personnel to collect delinquent taxes; and identifies and investigates alleged evasion of the State tax code, whether through underreporting, non-filing or schemes of avoidance.
Centralized Operations Support: Provides infrastructure support services; vehicle fleet management; printing and mailing services; telecommunications support; space planning, management, and utilization; in-house security; and parking services.
Conciliation and Mediation: Provides taxpayers with a statutorily-mandated option of informal and impartial dispute resolution that potentially mitigates time-consuming, formal administrative hearings with the Division of Tax Appeals.
Management, Administration, and Counsel: Provides departmental financial services, including budgeting, accounting, and procurement; provides a full range of legal services to the Department; and provides personnel services, including workforce strategies and solutions.
Real Property Tax Services: Oversees local property tax administration in New York State with a range of responsibilities, including: equalization of local assessments for purposes of apportioning property taxes and calculating state aid; determination of assessments on several specific categories of property; various services to support local governments in performing their assessment responsibilities; and the administration of State aid for quality local assessment practices and property tax relief.
Revenue Processing and Reconciliation: Processes taxpayer returns and remittance to compute liability, identify underpayments or overpayments, and issue assessments and refunds; creates and maintains taxpayer accounts and records; and responds to taxpayer inquiries.
Tax Policy, Revenue Accounting, and Taxpayer Guidance: Performs revenue accounting; reviews tax policies; assesses tax proposals and proposed legislation; prepares fiscal impacts; performs sophisticated studies and analyses for the Legislature and the Division of the Budget; and develops tax information, advice, forms, and instructions.
Technology and Information Services: Maintains, secures, and improves the Department’s information technology infrastructure, applications, and networks.
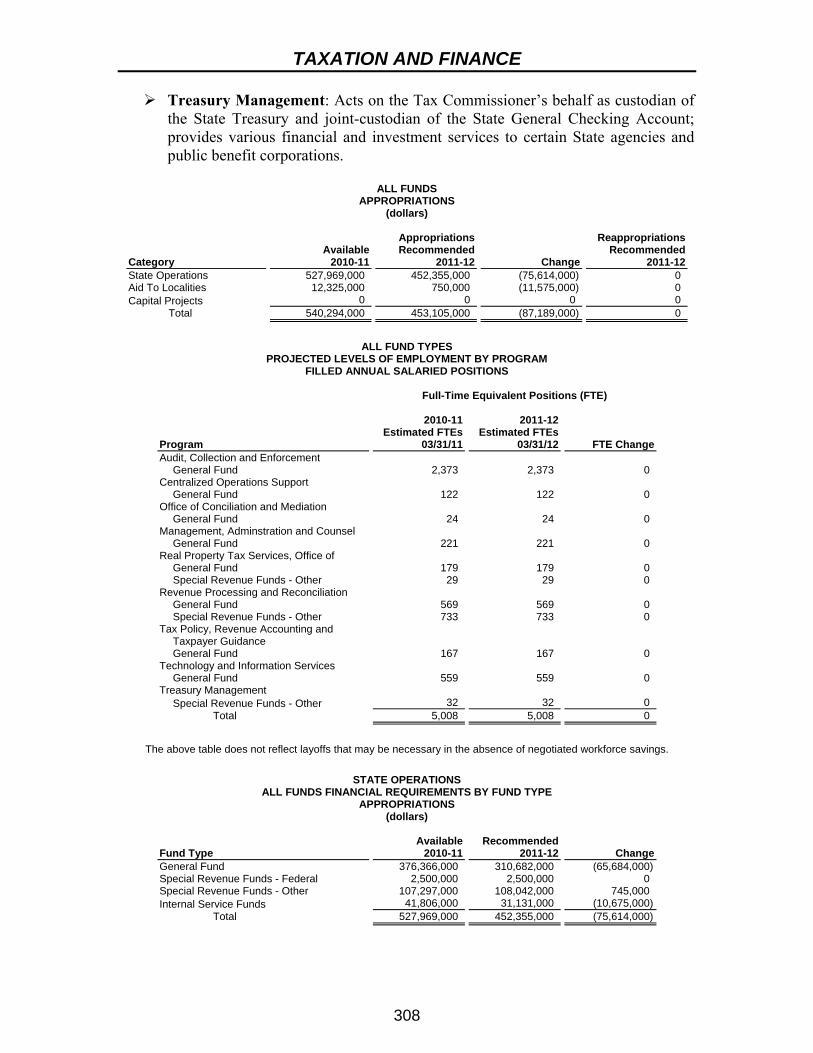
TAXATION AND FINANCE
308
Treasury Management: Acts on the Tax Commissioner’s behalf as custodian of the State Treasury and joint-custodian of the State General Checking Account; provides various financial and investment services to certain State agencies and public benefit corporations.
ALL FUNDS
APPROPRIATIONS (dollars)
Category Available
2010-11
AppropriationsRecommended
2011-12 Change
ReappropriationsRecommended
2011-12State Operations 527,969,000 452,355,000 (75,614,000) 0 Aid To Localities 12,325,000 750,000 (11,575,000) 0 Capital Projects 0 0 0 0 Total 540,294,000 453,105,000 (87,189,000) 0
ALL FUND TYPES
PROJECTED LEVELS OF EMPLOYMENT BY PROGRAM FILLED ANNUAL SALARIED POSITIONS
Full-Time Equivalent Positions (FTE)
Program
2010-11Estimated FTEs
03/31/11
2011-12Estimated FTEs
03/31/12 FTE ChangeAudit, Collection and Enforcement
General Fund 2,373 2,373 0 Centralized Operations Support
General Fund 122 122 0 Office of Conciliation and Mediation
General Fund 24 24 0 Management, Adminstration and Counsel
General Fund 221 221 0 Real Property Tax Services, Office of
General Fund 179 179 0 Special Revenue Funds - Other 29 29 0
Revenue Processing and Reconciliation General Fund 569 569 0 Special Revenue Funds - Other 733 733 0
Tax Policy, Revenue Accounting and Taxpayer Guidance General Fund 167 167 0
Technology and Information Services General Fund 559 559 0
Treasury Management Special Revenue Funds - Other 32 32 0
Total 5,008 5,008 0
The above table does not reflect layoffs that may be necessary in the absence of negotiated workforce savings.
STATE OPERATIONS
ALL FUNDS FINANCIAL REQUIREMENTS BY FUND TYPE APPROPRIATIONS
(dollars)
Fund Type Available
2010-11Recommended
2011-12 ChangeGeneral Fund 376,366,000 310,682,000 (65,684,000) Special Revenue Funds - Federal 2,500,000 2,500,000 0 Special Revenue Funds - Other 107,297,000 108,042,000 745,000 Internal Service Funds 41,806,000 31,131,000 (10,675,000) Total 527,969,000 452,355,000 (75,614,000)

TAXATION AND FINANCE
309
STATE OPERATIONS ALL FUNDS FINANCIAL REQUIREMENTS BY PROGRAM
APPROPRIATIONS (dollars)
Program Available
2010-11Recommended
2011-12 ChangeAudit, Collection and Enforcement
General Fund 183,039,900 154,965,000 (28,074,900) Special Revenue Funds - Federal 2,500,000 2,500,000 0 Special Revenue Funds - Other 16,500,000 16,500,000 0
Centralized Operations Support General Fund 25,000,600 17,792,000 (7,208,600)
Office of Conciliation and Mediation General Fund 1,908,000 1,588,000 (320,000)
Management, Adminstration and Counsel General Fund 17,245,000 15,067,000 (2,178,000)
Real Property Tax Services, Office of General Fund 22,150,000 15,162,000 (6,988,000) Special Revenue Funds - Other 4,055,000 4,007,000 (48,000)
Revenue Processing and Reconciliation General Fund 46,567,700 35,178,000 (11,389,700) Special Revenue Funds - Other 83,053,000 83,813,000 760,000 Internal Service Funds 41,806,000 31,131,000 (10,675,000)
Tax Policy, Revenue Accounting and Taxpayer Guidance General Fund 12,037,700 10,651,000 (1,386,700)
Technology and Information Services General Fund 68,417,100 60,279,000 (8,138,100)
Treasury Management Special Revenue Funds - Other 3,689,000 3,722,000 33,000
Total 527,969,000 452,355,000 (75,614,000)
STATE OPERATIONS - GENERAL FUND
SUMMARY OF PERSONAL SERVICE APPROPRIATIONS AND CHANGES 2011-12 RECOMMENDED
(dollars)
Total Personal Service Regular
(Annual Salaried) Program Amount Change Amount ChangeAudit, Collection and Enforcement 148,595,000 (28,076,000) 147,641,000 (27,260,000)Centralized Operations Support 4,029,000 (1,455,200) 3,869,000 (1,016,200)Office of Conciliation and Mediation 1,510,000 (320,800) 1,510,000 (320,800)Management, Adminstration and Counsel 13,812,000 (2,178,500) 13,770,000 (2,051,500)Real Property Tax Services, Office of 11,262,000 (6,988,000) 11,262,000 (6,988,000)Revenue Processing and Reconciliation 33,060,000 (11,389,200) 31,650,000 (7,250,200)Tax Policy, Revenue Accounting and
Taxpayer Guidance 9,414,000 (1,386,600) 9,341,000 (1,356,600)Technology and Information Services 33,589,000 (3,330,800) 33,154,000 (3,090,800) Total 255,271,000 (55,125,100) 252,197,000 (49,334,100)
Temporary Service
(Nonannual Salaried) Holiday/Overtime Pay
Program Amount Change Amount ChangeAudit, Collection and Enforcement 204,000 (816,000) 750,000 0 Centralized Operations Support 110,000 (439,000) 50,000 0 Office of Conciliation and Mediation 0 0 0 0 Management, Adminstration and Counsel 32,000 (127,000) 10,000 0 Real Property Tax Services, Office of 0 0 0 0 Revenue Processing and Reconciliation 1,035,000 (4,139,000) 375,000 0 Tax Policy, Revenue Accounting and
Taxpayer Guidance 8,000 (30,000) 65,000 0 Technology and Information Services 60,000 (240,000) 375,000 0 Total 1,449,000 (5,791,000) 1,625,000 0

TAXATION AND FINANCE
310
STATE OPERATIONS - GENERAL FUND SUMMARY OF NONPERSONAL SERVICE AND MAINTENANCE UNDISTRIBUTED
APPROPRIATIONS AND CHANGES 2011-12 RECOMMENDED
(dollars) Total Supplies and Materials Program Amount Change Amount ChangeAudit, Collection and Enforcement 6,370,000 1,100 421,000 500 Centralized Operations Support 13,763,000 (5,753,400) 2,970,000 (3,377,700)Office of Conciliation and Mediation 78,000 800 4,000 400 Management, Adminstration and Counsel 1,255,000 500 98,000 0 Real Property Tax Services, Office of 3,900,000 0 200,000 0 Revenue Processing and Reconciliation 2,118,000 (500) 814,000 200 Tax Policy, Revenue Accounting and
Taxpayer Guidance 1,237,000 (100) 44,000 (300)Technology and Information Services 26,690,000 (4,807,300) 107,000 (300) Total 55,411,000 (10,558,900) 4,658,000 (3,377,200) Travel Contractual Services Program Amount Change Amount ChangeAudit, Collection and Enforcement 3,701,000 400 1,084,000 400 Centralized Operations Support 28,000 100 10,141,000 (2,375,600)Office of Conciliation and Mediation 69,000 400 4,000 (300)Management, Adminstration and Counsel 112,000 400 778,000 (200)Real Property Tax Services, Office of 200,000 0 3,200,000 0 Revenue Processing and Reconciliation 100,000 (100) 1,012,000 (300)Tax Policy, Revenue Accounting and
Taxpayer Guidance 20,000 0 1,160,000 100 Technology and Information Services 215,000 500 24,054,000 (4,807,500) Total 4,445,000 1,700 41,433,000 (7,183,400) Equipment Program Amount Change Audit, Collection and Enforcement 1,164,000 (200) Centralized Operations Support 624,000 (200) Office of Conciliation and Mediation 1,000 300 Management, Adminstration and Counsel 267,000 300 Real Property Tax Services, Office of 300,000 0 Revenue Processing and Reconciliation 192,000 (300) Tax Policy, Revenue Accounting and
Taxpayer Guidance 13,000 100 Technology and Information Services 2,314,000 0 Total 4,875,000 0
STATE OPERATIONS - OTHER THAN GENERAL FUND
SUMMARY OF APPROPRIATIONS AND CHANGES 2011-12 RECOMMENDED
(dollars) Total Personal Service Program Amount Change Amount ChangeAudit, Collection and Enforcement 19,000,000 0 0 0 Real Property Tax Services, Office of 4,007,000 (48,000) 2,555,000 0 Revenue Processing and Reconciliation 114,944,000 (9,915,000) 38,666,000 (98,000)Treasury Management 3,722,000 33,000 2,025,000 0 Total 141,673,000 (9,930,000) 43,246,000 (98,000) Nonpersonal Service Maintenance Undistributed Program Amount Change Amount ChangeAudit, Collection and Enforcement 19,000,000 2,500,000 0 (2,500,000)Real Property Tax Services, Office of 1,452,000 (48,000) 0 0 Revenue Processing and Reconciliation 76,278,000 (9,817,000) 0 0 Treasury Management 1,697,000 33,000 0 0 Total 98,427,000 (7,332,000) 0 (2,500,000)

TAXATION AND FINANCE
311
AID TO LOCALITIES ALL FUNDS FINANCIAL REQUIREMENTS BY FUND TYPE
APPROPRIATIONS (dollars)
Fund Type Available
2010-11Recommended
2011-12 ChangeGeneral Fund 12,325,000 750,000 (11,575,000) Total 12,325,000 750,000 (11,575,000)
AID TO LOCALITIES
ALL FUNDS FINANCIAL REQUIREMENTS BY PROGRAM APPROPRIATIONS
(dollars)
Program Available
2010-11Recommended
2011-12 ChangeReal Property Tax Services, Office of
General Fund 12,325,000 750,000 (11,575,000) Total 12,325,000 750,000 (11,575,000)

312
DIVISION OF TAX APPEALS MISSION The Division of Tax Appeals provides taxpayers with a system of due process for resolving disputes with the Department of Taxation and Finance. The separation of tax administration from tax adjudication promotes the impartial and timely hearing of taxpayer disputes. ORGANIZATION AND STAFFING The Division of Tax Appeals is headed by the Tax Appeals Tribunal, which is comprised of three commissioners appointed by the Governor and confirmed by the Senate. Under the direction of the Tax Tribunal, dispute adjudication is provided through small claims hearings, formal hearings and the Tribunal appeals process. The Division holds formal hearings in Troy, New York City and Rochester, while Tax Tribunal oral arguments are held in New York City, Buffalo, and Troy. Small claims hearings are conducted throughout the State. BUDGET HIGHLIGHTS The Executive Budget recommends $3.0 million General Fund for the Division of Tax Appeals. This net decrease of $133,000 (-4.2 percent) from the 2010-11 budget reflects reductions in employee costs and savings in nonpersonal service expenditures. The Executive Budget reduces each agency’s General Fund State Operations budget by 10 percent. These savings are intended to be achieved through administrative efficiencies in non-personal service and negotiated workforce savings that minimize layoffs to the extent possible. PROGRAM HIGHLIGHTS The Division’s hearing process has been substantially improved in recent years to benefit taxpayers. These improvements have allowed taxpayers more flexibility in scheduling hearings, thus minimizing delays caused by sudden cancellations. The Division also conducts formal hearings in New York City and Rochester to provide easier access for taxpayers in these metropolitan areas. At these locations, the Division utilizes existing State office space, thus providing improved service at nominal additional cost.
ALL FUNDS APPROPRIATIONS
(dollars)
Category Available
2010-11
AppropriationsRecommended
2011-12 Change
ReappropriationsRecommended
2011-12State Operations 3,154,000 3,021,000 (133,000) 0 Aid To Localities 0 0 0 0 Capital Projects 0 0 0 0 Total 3,154,000 3,021,000 (133,000) 0

TAX APPEALS
313
ALL FUND TYPES PROJECTED LEVELS OF EMPLOYMENT BY PROGRAM
FILLED ANNUAL SALARIED POSITIONS Full-Time Equivalent Positions (FTE)
Program
2010-11Estimated FTEs
03/31/11
2011-12Estimated FTEs
03/31/12 FTE ChangeAdministration
General Fund 24 24 0 Total 24 24 0
The above table does not reflect layoffs that may be necessary in the absence of negotiated workforce savings.
STATE OPERATIONS
ALL FUNDS FINANCIAL REQUIREMENTS BY FUND TYPE APPROPRIATIONS
(dollars)
Fund Type Available
2010-11Recommended
2011-12 ChangeGeneral Fund 3,154,000 3,021,000 (133,000) Total 3,154,000 3,021,000 (133,000) Adjustments: Recommended Deficiency
Tax Appeals, Division of General Fund (101,000)
Appropriated 2010-11 3,053,000
STATE OPERATIONS ALL FUNDS FINANCIAL REQUIREMENTS BY PROGRAM
APPROPRIATIONS (dollars)
Program Available
2010-11Recommended
2011-12 ChangeAdministration
General Fund 3,154,000 3,021,000 (133,000) Total 3,154,000 3,021,000 (133,000)
STATE OPERATIONS - GENERAL FUND
SUMMARY OF PERSONAL SERVICE APPROPRIATIONS AND CHANGES 2011-12 RECOMMENDED
(dollars)
Total Personal Service Regular
(Annual Salaried) Program Amount Change Amount ChangeAdministration 2,654,000 (133,000) 2,644,000 (133,000) Total 2,654,000 (133,000) 2,644,000 (133,000)
Temporary Service
(Nonannual Salaried) Program Amount Change Administration 10,000 0 Total 10,000 0
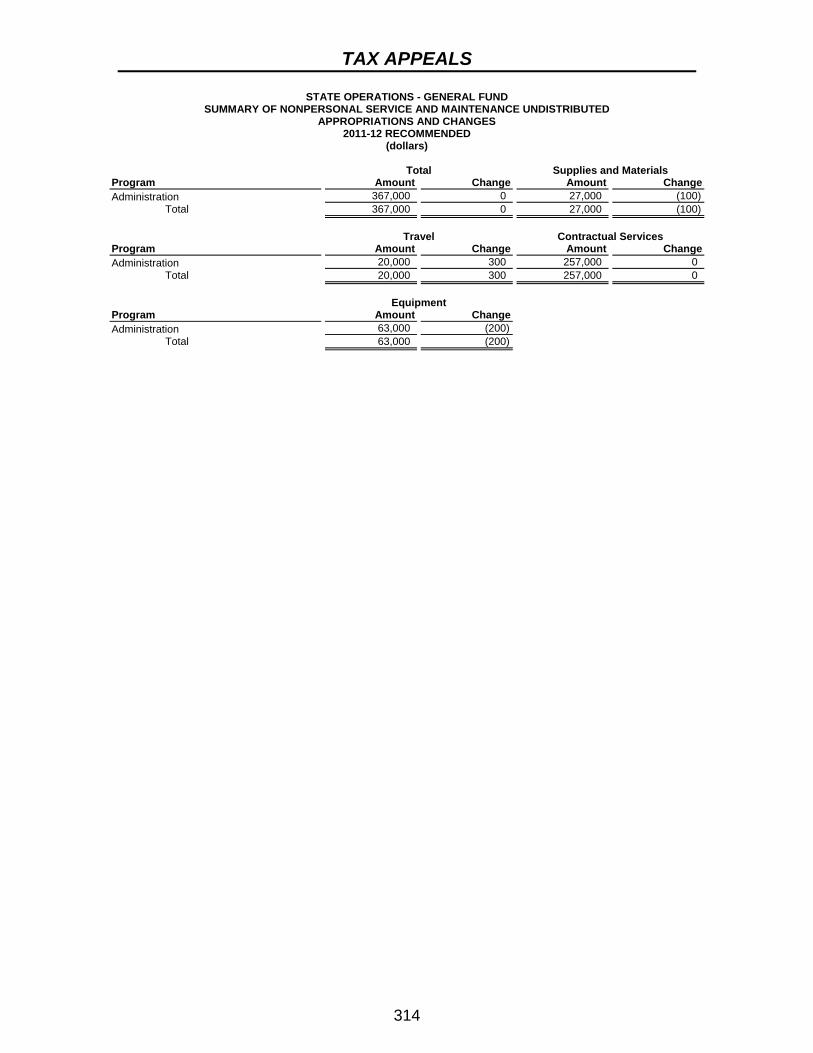
TAX APPEALS
314
STATE OPERATIONS - GENERAL FUND SUMMARY OF NONPERSONAL SERVICE AND MAINTENANCE UNDISTRIBUTED
APPROPRIATIONS AND CHANGES 2011-12 RECOMMENDED
(dollars) Total Supplies and Materials Program Amount Change Amount ChangeAdministration 367,000 0 27,000 (100) Total 367,000 0 27,000 (100) Travel Contractual Services Program Amount Change Amount ChangeAdministration 20,000 300 257,000 0 Total 20,000 300 257,000 0 Equipment Program Amount Change Administration 63,000 (200) Total 63,000 (200)
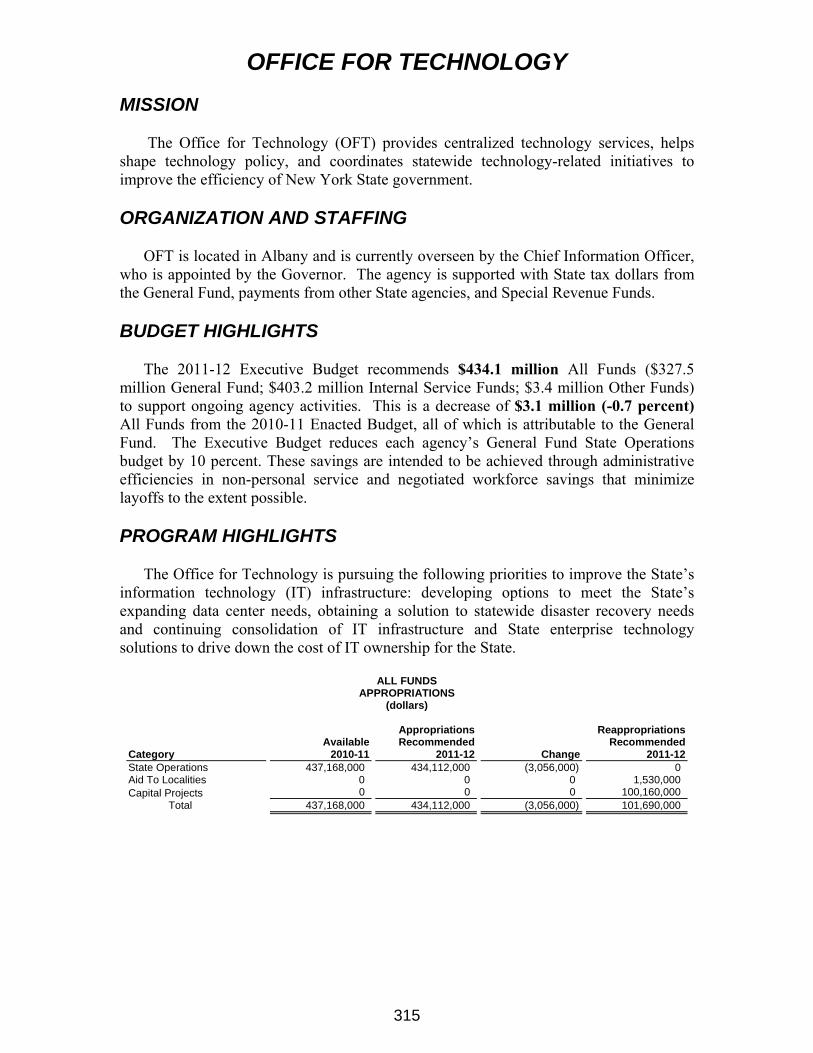
315
OFFICE FOR TECHNOLOGY MISSION The Office for Technology (OFT) provides centralized technology services, helps shape technology policy, and coordinates statewide technology-related initiatives to improve the efficiency of New York State government. ORGANIZATION AND STAFFING OFT is located in Albany and is currently overseen by the Chief Information Officer, who is appointed by the Governor. The agency is supported with State tax dollars from the General Fund, payments from other State agencies, and Special Revenue Funds. BUDGET HIGHLIGHTS The 2011-12 Executive Budget recommends $434.1 million All Funds ($327.5 million General Fund; $403.2 million Internal Service Funds; $3.4 million Other Funds) to support ongoing agency activities. This is a decrease of $3.1 million (-0.7 percent) All Funds from the 2010-11 Enacted Budget, all of which is attributable to the General Fund. The Executive Budget reduces each agency’s General Fund State Operations budget by 10 percent. These savings are intended to be achieved through administrative efficiencies in non-personal service and negotiated workforce savings that minimize layoffs to the extent possible. PROGRAM HIGHLIGHTS The Office for Technology is pursuing the following priorities to improve the State’s information technology (IT) infrastructure: developing options to meet the State’s expanding data center needs, obtaining a solution to statewide disaster recovery needs and continuing consolidation of IT infrastructure and State enterprise technology solutions to drive down the cost of IT ownership for the State.
ALL FUNDS APPROPRIATIONS
(dollars)
Category Available
2010-11
AppropriationsRecommended
2011-12 Change
ReappropriationsRecommended
2011-12State Operations 437,168,000 434,112,000 (3,056,000) 0 Aid To Localities 0 0 0 1,530,000 Capital Projects 0 0 0 100,160,000 Total 437,168,000 434,112,000 (3,056,000) 101,690,000

TECHNOLOGY
316
ALL FUND TYPES PROJECTED LEVELS OF EMPLOYMENT BY PROGRAM
FILLED ANNUAL SALARIED POSITIONS Full-Time Equivalent Positions (FTE)
Program
2010-11Estimated FTEs
03/31/11
2011-12Estimated FTEs
03/31/12 FTE ChangeStatewide Technology Program
Special Revenue Funds - Other 5 5 0 Technology
General Fund 141 141 0 Internal Service Funds 505 557 52
Total 651 703 52
The above table does not reflect layoffs that may be necessary in the absence of negotiated workforce savings.
STATE OPERATIONS
ALL FUNDS FINANCIAL REQUIREMENTS BY FUND TYPE APPROPRIATIONS
(dollars)
Fund Type Available
2010-11Recommended
2011-12 ChangeGeneral Fund 30,558,000 27,502,000 (3,056,000) Special Revenue Funds - Other 3,445,000 3,445,000 0 Internal Service Funds 403,165,000 403,165,000 0 Total 437,168,000 434,112,000 (3,056,000)
STATE OPERATIONS
ALL FUNDS FINANCIAL REQUIREMENTS BY PROGRAM APPROPRIATIONS
(dollars)
Program Available
2010-11Recommended
2011-12 ChangeStatewide Technology Program
Special Revenue Funds - Other 3,445,000 3,445,000 0 Technology
General Fund 30,558,000 27,502,000 (3,056,000) Internal Service Funds 403,165,000 403,165,000 0
Total 437,168,000 434,112,000 (3,056,000)
STATE OPERATIONS - GENERAL FUND
SUMMARY OF PERSONAL SERVICE APPROPRIATIONS AND CHANGES 2011-12 RECOMMENDED
(dollars)
Total Personal Service Regular
(Annual Salaried) Program Amount Change Amount ChangeTechnology 10,858,000 (1,207,000) 10,666,000 (1,189,000) Total 10,858,000 (1,207,000) 10,666,000 (1,189,000)
Temporary Service
(Nonannual Salaried) Holiday/Overtime Pay
Program Amount Change Amount ChangeTechnology 162,000 (18,000) 30,000 0 Total 162,000 (18,000) 30,000 0

TECHNOLOGY
317
STATE OPERATIONS - GENERAL FUND SUMMARY OF NONPERSONAL SERVICE AND MAINTENANCE UNDISTRIBUTED
APPROPRIATIONS AND CHANGES 2011-12 RECOMMENDED
(dollars) Total Supplies and Materials Program Amount Change Amount ChangeTechnology 16,644,000 (1,849,000) 240,000 (50,000) Total 16,644,000 (1,849,000) 240,000 (50,000) Travel Contractual Services Program Amount Change Amount ChangeTechnology 40,000 (10,000) 11,899,000 (1,349,000) Total 40,000 (10,000) 11,899,000 (1,349,000) Equipment Program Amount Change Technology 4,465,000 (440,000) Total 4,465,000 (440,000)
STATE OPERATIONS - OTHER THAN GENERAL FUND
SUMMARY OF APPROPRIATIONS AND CHANGES 2011-12 RECOMMENDED
(dollars) Total Personal Service Program Amount Change Amount ChangeStatewide Technology Program 3,445,000 0 951,000 0 Technology 403,165,000 0 37,267,000 0 Total 406,610,000 0 38,218,000 0 Nonpersonal Service Program Amount Change Statewide Technology Program 2,494,000 0 Technology 365,898,000 0 Total 368,392,000 0
CAPITAL PROJECTS
ALL FUNDS FINANCIAL REQUIREMENTS BY PROGRAM APPROPRIATIONS
(dollars)
Comprehensive Construction Program Available
2010-11Recommended
2011-12 Change Reappropriations
2011-12New Facilities
Capital Projects Fund - Authority Bonds 0 0 0 99,060,000 Economic Development
Capital Projects Fund - Authority Bonds 0 0 0 1,100,000 Total 0 0 0 100,160,000

318
THRUWAY AUTHORITY The Thruway Authority operates a 570-mile highway system, including the 426-mile mainline from Pennsylvania to New York City. The Thruway Authority also has jurisdiction over the New York State Canal System. Through its subsidiary, the New York State Canal Corporation, the Thruway maintains, operates, develops and makes capital improvements to the 524-mile navigable waterway, which includes 57 locks, 20 lift bridges, numerous dams, reservoirs and water control structures. Thruway Authority and Canal System programs are primarily supported by Authority funds, which are not reflected in the Executive Budget. The 2011 Thruway annual operating and capital budget totals $1.1 billion. Revenues from canal tolls and other user fees are deposited into the Canal System Development Fund and, in accordance with the State Constitution, are used exclusively for the canals. The Executive Budget recommends a new appropriation of $2 million, the same level as in 2010-11, and reappropriations of $11.7 million from the Canal System Development Fund for a portion of the maintenance, construction, reconstruction, development and promotion of the canals.
ALL FUNDS APPROPRIATIONS
(dollars)
Category Available
2010-11
AppropriationsRecommended
2011-12 Change
ReappropriationsRecommended
2011-12State Operations 0 0 0 0 Aid To Localities 0 0 0 0 Capital Projects 2,000,000 2,000,000 0 11,653,000 Total 2,000,000 2,000,000 0 11,653,000
CAPITAL PROJECTS
ALL FUNDS FINANCIAL REQUIREMENTS BY PROGRAM APPROPRIATIONS
(dollars)
Comprehensive Construction Program Available
2010-11Recommended
2011-12 Change Reappropriations
2011-12Canal Development Program
New York State Canal System Development Fund 2,000,000 2,000,000 0 11,653,000 Total 2,000,000 2,000,000 0 11,653,000

319
DEPARTMENT OF TRANSPORTATION MISSION The Department of Transportation (DOT) directly maintains and improves the State’s more than 38,000 State highway lane miles and over 7,500 bridges. In addition, the Department partially funds locally-operated transit systems, local government highway and bridge construction, and rail, airport, and canal programs. The DOT of the 21st Century is capitalizing on intelligent transportation technology to manage increases in traffic and to balance security concerns with the need to move people and products safely and efficiently. The Department closely coordinates with other State transportation agencies and authorities with the goal of creating a seamless statewide transportation system that addresses environmental and community concerns and more efficiently moves people and goods. ORGANIZATION AND STAFFING The Department is headed by a Commissioner appointed by the Governor, subject to Senate confirmation. The Department’s main office is in Albany, with 11 regional offices in Schenectady, Utica, Syracuse, Rochester, Buffalo, Hornell, Watertown, Poughkeepsie, Binghamton, Hauppauge and New York City. The Department also maintains highway maintenance and equipment repair facilities across the State. Employees of the Department perform such activities as highway maintenance, snow and ice removal, highway and bridge design and construction inspection. In addition, the Department’s staff inspects school and charter buses, regulates commercial transportation, oversees public transportation systems and State-owned airports, and provides administrative support for the Department. BUDGET HIGHLIGHTS The Executive Budget recommends $8.3 billion All Funds ($97.6 million General Fund; $3.9 billion Capital Projects Funds; $4.3 billion Other Funds) for the Department. This is an overall decrease of $526 million (-6 percent overall; $397 million (-9.3 percent) in Capital Projects Funds and $129 million (-2.9 percent) in Other Funds) from 2010-11 levels. This net change primarily reflects non-recurrence of a 2010-11 Federal rail capital appropriation, a 10 percent year-to-year reduction in operations funding from the Dedicated Highway and Bridge Trust Fund (DHBTF), the annualization of 2010-11 workforce actions and a decrease in mass transit appropriation levels. The Executive Budget reduces the agency’s operations expenses in the DHBTF by 10 percent. These savings are intended to be achieved through administrative efficiencies in non-personal service and negotiated workforce savings that minimize layoffs to the extent possible. The Department is responsible for the implementation of transportation programs related to highways and bridges, transit, aviation, ports, rail and other modes. It is supported by revenues from the Petroleum Business Tax, highway use tax, motor fuel taxes, auto rental tax, transportation/transmission tax, motor vehicle fees, and other fees. Substantial Federal aid is also used to support the programs. While no new appropriations are provided, spending from the 2005 Bond Act continues.
TRANSPORTATION
320
The budget continues the second year of a two-year DOT capital program enacted in 2010-11 while also implementing necessary reductions in agency operations and programs. Major budget actions include:
Preserving State Support for Highway and Bridge Investments: Funding in the Dedicated Highway and Bridge Trust Fund (DHBTF) for highway and bridge construction is preserved at $501 million, the same level as 2010-11.
Preserving Local Capital Aid: Capital aid to local governments for highway and bridge projects is preserved at 2010-11 levels, with $363.1 million provided for the Consolidated Highway Improvement Program (CHIPS) and $39.7 million for the Marchiselli program.
Preserving Rail Programs: The budget includes a $16.9 million appropriation to support Amtrak service and additional rail capital investments.
State Operations Reduction: The budget contains a $64 million, or 10 percent, year-to-year reduction in DHBTF appropriations for DOT operations. The Department will achieve the reduction through administrative efficiencies in non-personal service and negotiated workforce savings that minimize layoffs to the extent possible.
The Department’s operations are devoted primarily to highway maintenance, particularly snow and ice removal. The 2011-12 Executive Budget provides $615 million for snow and ice control and State forces preventive maintenance. This level represents a decrease of almost $54 million from 2010-11 levels. The Department’s regulatory programs and other operations are primarily funded by fees, miscellaneous revenues and Federal aid. Approximately $25.7 million is derived from fees, including those imposed on trucks registered to transport products throughout the State; landing fees and rents levied at Republic Airport; and revenues generated by the sale and rental of Department property, such as commercial leasing of land for parking or storage. These funds support a number of agency activities, including various safety and regulatory oversight functions as well as highway safety and aviation programs. Federal aid of $16.3 million and dedicated mass transit funds totaling $5.4 million help finance the Department’s remaining operating responsibilities for mass transportation, aviation and motor-carrier safety programs. Capital appropriations provide funding for construction and reconstruction projects on State highways, bridges, railways and airports, as well as financing the engineering staff and private-sector consultants who work on these projects. Obligations for State and local highway and bridge construction contracts will total $1.8 billion in 2011-12. The centerpiece of the State’s Highway and Bridge Program is the Dedicated Highway and Bridge Trust Fund, established in 1993. The Trust Fund derives its revenues from portions of the petroleum business tax, motor fuel tax, motor vehicle fees, highway user fees, auto rental tax, transportation/transmission tax, and miscellaneous transportation-related revenues. These funds are used both on a pay-as-you-go basis and to pay debt service on bonds issued by the Thruway Authority to finance portions of the State and local highway programs. A significant portion of the State and local highway capital program is supported by Federal aid, authorized in accordance with multi-year Federal transportation acts. The most recent Federal Transportation Act, known as SAFETEA-LU, expired on September 30, 2009. A successor program has not been enacted and Federal support for the State’s transportation programs continues at reduced levels through temporary funding measures

TRANSPORTATION
321
passed by Congress. The Federal capital aid appropriation in 2011-12 is available for up to $2 billion of Federal funding, including provisions for State and local highways and bridges, engineering, rail and community enhancement programs. Local highway and bridge capital programs include the Consolidated Highway Improvement Program (CHIPS), the Municipal Streets and Highways Program (“Marchiselli” Program) and the Multi-Modal Program. The CHIPS and Marchiselli programs are funded by bonds issued by the Thruway Authority with debt service paid from the State’s Dedicated Highway and Bridge Trust Fund. In 2011-12, the CHIPS capital program will be funded at $363.1 million, and the Marchiselli program at $39.7 million. A $16.9 million rail preservation appropriation will be available to support Amtrak service and new rail infrastructure investments. The State will also provide up to $4 million to match Federal aviation grants. The Aid to Localities budget is comprised primarily of appropriations supported by State taxes dedicated to public transportation through the Mass Transportation Operating Assistance (MTOA) Fund, the Metropolitan Transportation Authority Financial Assistance Fund (MTASP) and the Dedicated Mass Transportation Trust Fund (DMTTF). Mass Transportation Operating Assistance Fund revenues are derived from a 3/8 percent sales tax; a business tax surcharge levied in the New York City metropolitan region; and a portion of statewide taxes on transmission, transportation and petroleum-related businesses. MTASP revenues are derived from a tax on payrolls, surcharges on motor vehicle registration and license fees, a rental car surcharge, and a taxi surcharge, all within the Metropolitan Commuter Transportation District (MCTD). Dedicated Mass Transportation Trust Fund revenues are derived from a share of the revenues deposited in the Transportation Dedicated Funds Pool, which includes portions of the petroleum business tax, the motor fuel tax and motor vehicle fees. The Executive Budget provides appropriations of more than $4.2 billion in aid to transit systems throughout the State, including more than $3.8 billion for the MTA and more than $401 million for other systems. This appropriation level reflects a decrease of approximately $106 million from the amended 2010-11 levels, and is comprised of a $108 million decrease for the MTA and a $2 million increase for all other transit systems. The drop in appropriations is primarily due to a correction from a 2010-11 MTA Payroll Mobility Tax appropriation that exceeded actual tax receipts and, therefore, aid levels. Despite this drop in appropriations, the MTA is anticipated to receive an increase of $43 million on a year-to-year cash basis. In addition to the State Transportation Operating Assistance Program, the Executive Budget provides $37 million for the DMTTF non-MTA capital program, no change from the SFY 2010-11 level. This capital program funds a variety of transit related needs, including bus purchases and a portion of the required match to Federal transit capital aid. PROGRAM HIGHLIGHTS HIGHWAYS AND BRIDGES Improving the State’s vital transportation infrastructure remains the agency’s highest priority. During 2009-10, the Department replaced or rehabilitated a total of 139 State bridges and completed more than 3,800 corrective and preventive bridge treatments to slow deterioration. More than 4,600 lane miles of State highway were resurfaced, rehabilitated or given preventive maintenance treatment. The Executive Budget continues

TRANSPORTATION
322
this commitment to strategic investments in critical infrastructure needs. Even more than in previous years, preventive maintenance performed by State forces and private sector contractors will be an area of significant concentration. State staff and private-sector consultants perform the planning, property acquisition, design engineering, environmental reviews, surveying, materials and soils testing and construction inspection associated with the Department’s capital program. Construction of virtually all highway and bridge projects is performed by private firms. The State makes a significant investment in helping localities maintain safe roads and bridges through its CHIPS and Marchiselli capital programs. These programs fund local construction projects, with the majority performed by private firms. Through its safety inspections of school and charter buses and its regulation of commercial transport, the Department also focuses its resources on passenger safety and environmental issues. PUBLIC TRANSPORTATION The Department provides oversight and funding for more than 130 public transportation operators, including the Metropolitan Transportation Authority, the four upstate regional transportation authorities and other (usually county-sponsored) transit systems. These systems provide bus, subway, light rail and commuter rail services, plus “paratransit” services designed to meet the needs of disabled people as required by the Federal Americans with Disabilities Act. State financial assistance to transit systems is supported by the Mass Transportation Operating Assistance Fund, the Metropolitan Transportation Authority Financial Assistance Fund, the Dedicated Mass Transportation Trust Fund and the General Fund. In addition, State law authorizes the imposition of an additional mortgage recording tax in regions covered by the Metropolitan Transportation Authority and the four upstate transit authorities. These moneys are collected by the affected counties and transmitted directly to the transit systems.
ALL FUNDS APPROPRIATIONS
(dollars)
Category Available
2010-11
AppropriationsRecommended
2011-12 Change
ReappropriationsRecommended
2011-12State Operations 50,340,000 47,404,000 (2,936,000) 111,268,700 Aid To Localities 4,357,490,900 4,232,596,900 (124,894,000) 177,064,000 Capital Projects 4,384,915,000 3,986,577,000 (398,338,000) 18,771,163,000 Total 8,792,745,900 8,266,577,900 (526,168,000) 19,059,495,700

TRANSPORTATION
323
ALL FUND TYPES PROJECTED LEVELS OF EMPLOYMENT BY PROGRAM
FILLED ANNUAL SALARIED POSITIONS Full-Time Equivalent Positions (FTE)
Program
2010-11Estimated FTEs
03/31/11
2011-12Estimated FTEs
03/31/12 FTE ChangeDesign and Construction
Capital Projects Funds - Other 2,673 2,673 0 New York Metropolitan Transportation
Council Special Revenue Funds - Other 54 54 0
Non-Federally Aided Highway Capital Projects - Administration Capital Projects Funds - Other 590 590 0
Operations Program Special Revenue Funds - Other 6 6 0
Passenger and Freight Transportation Program, Office of Special Revenue Funds - Federal 64 64 0 Special Revenue Funds - Other 81 81 0 Capital Projects Funds - Other 98 98 0
Planning and Program Management Capital Projects Funds - Other 529 529 0
Preventive Maintenance Capital Projects Funds - Other 4,445 4,445 0
Real Estate Capital Projects Funds - Other 168 168 0
Total 8,708 8,708 0
The above table does not reflect layoffs that may be necessary in the absence of negotiated workforce savings.
STATE OPERATIONS
ALL FUNDS FINANCIAL REQUIREMENTS BY FUND TYPE APPROPRIATIONS
(dollars)
Fund Type Available
2010-11Recommended
2011-12 ChangeSpecial Revenue Funds - Federal 18,031,000 16,315,000 (1,716,000) Special Revenue Funds - Other 32,309,000 31,089,000 (1,220,000) Total 50,340,000 47,404,000 (2,936,000)
STATE OPERATIONS
ALL FUNDS FINANCIAL REQUIREMENTS BY PROGRAM APPROPRIATIONS
(dollars)
Program Available
2010-11Recommended
2011-12 ChangeOperations Program
Special Revenue Funds - Other 15,710,000 16,210,000 500,000 Passenger and Freight Transportation
Program, Office of Special Revenue Funds - Federal 18,031,000 16,315,000 (1,716,000) Special Revenue Funds - Other 16,599,000 14,879,000 (1,720,000)
Total 50,340,000 47,404,000 (2,936,000)

TRANSPORTATION
324
STATE OPERATIONS - OTHER THAN GENERAL FUND SUMMARY OF APPROPRIATIONS AND CHANGES
2011-12 RECOMMENDED (dollars)
Total Personal Service Program Amount Change Amount ChangeOperations Program 16,210,000 500,000 532,000 (162,000)Passenger and Freight Transportation
Program, Office of 31,194,000 (3,436,000) 9,668,000 (2,169,000) Total 47,404,000 (2,936,000) 10,200,000 (2,331,000) Nonpersonal Service Program Amount Change Operations Program 15,678,000 662,000 Passenger and Freight Transportation
Program, Office of 21,526,000 (1,267,000) Total 37,204,000 (605,000)
AID TO LOCALITIES
ALL FUNDS FINANCIAL REQUIREMENTS BY FUND TYPE APPROPRIATIONS
(dollars)
Fund Type Available
2010-11Recommended
2011-12 ChangeGeneral Fund 97,550,900 97,550,900 0 Special Revenue Funds - Federal 53,062,000 53,062,000 0 Special Revenue Funds - Other 4,206,878,000 4,081,984,000 (124,894,000) Total 4,357,490,900 4,232,596,900 (124,894,000)
AID TO LOCALITIES
ALL FUNDS FINANCIAL REQUIREMENTS BY PROGRAM APPROPRIATIONS
(dollars)
Program Available
2010-11Recommended
2011-12 ChangeAdditional Mass Transportation Assistance
Program General Fund 44,866,000 44,866,000 0
Dedicated Mass Transportation Trust Fund Program Special Revenue Funds - Other 617,600,000 620,400,000 2,800,000
Local Transportation Planning Studies Program Special Revenue Funds - Federal 18,868,000 18,868,000 0
Mass Transportation Assistance Program General Fund 25,251,000 25,251,000 0
Metropolitan Transportation Authority Support Program Special Revenue Funds - Other 1,811,600,000 1,736,000,000 (75,600,000)
Mass Transportation Operating Assistance Fund Program Special Revenue Funds - Other 1,583,242,000 1,531,148,000 (52,094,000)
Mass Transportation Operating Assistance Program General Fund 27,433,900 27,433,900 0 Special Revenue Funds - Other 194,436,000 194,436,000 0
Passenger and Freight Transportation Program, Office of Special Revenue Funds - Federal 9,094,000 9,094,000 0
Rural and Small Urban Transit Aid Program Special Revenue Funds - Federal 25,100,000 25,100,000 0
Total 4,357,490,900 4,232,596,900 (124,894,000)
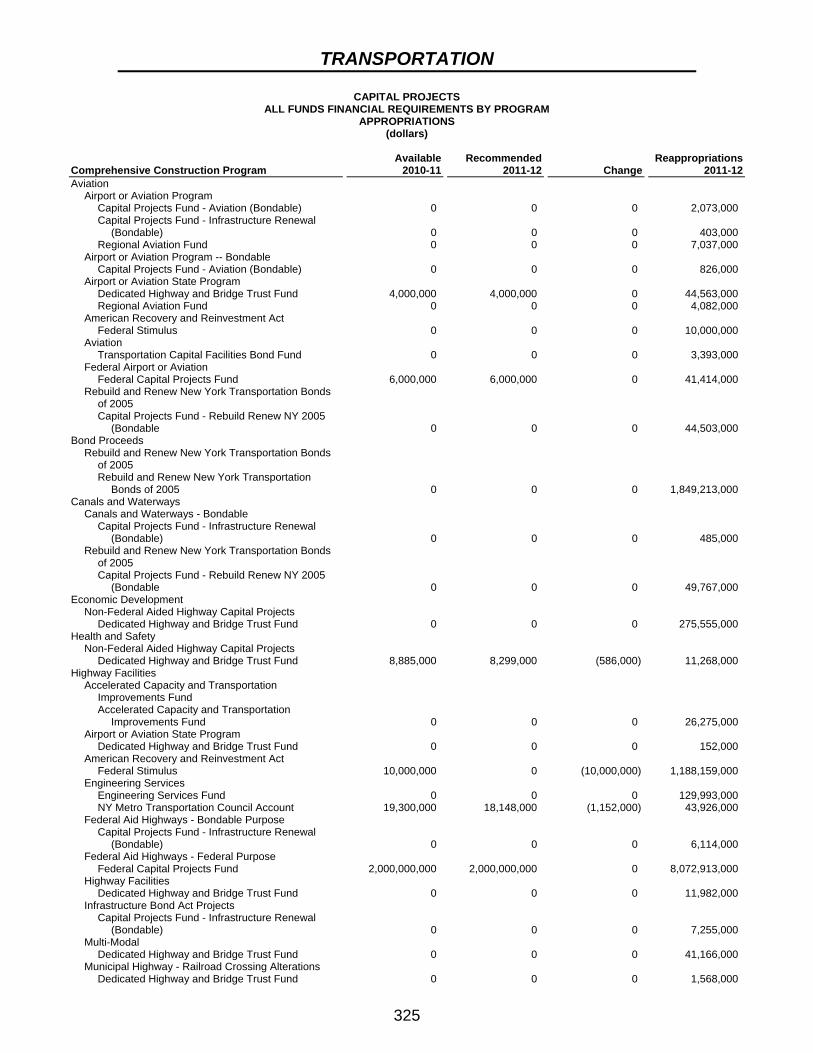
TRANSPORTATION
325
CAPITAL PROJECTS ALL FUNDS FINANCIAL REQUIREMENTS BY PROGRAM
APPROPRIATIONS (dollars)
Comprehensive Construction Program Available
2010-11Recommended
2011-12 Change Reappropriations
2011-12Aviation
Airport or Aviation Program Capital Projects Fund - Aviation (Bondable) 0 0 0 2,073,000 Capital Projects Fund - Infrastructure Renewal
(Bondable) 0 0 0 403,000 Regional Aviation Fund 0 0 0 7,037,000
Airport or Aviation Program -- Bondable Capital Projects Fund - Aviation (Bondable) 0 0 0 826,000
Airport or Aviation State Program Dedicated Highway and Bridge Trust Fund 4,000,000 4,000,000 0 44,563,000 Regional Aviation Fund 0 0 0 4,082,000
American Recovery and Reinvestment Act Federal Stimulus 0 0 0 10,000,000
Aviation Transportation Capital Facilities Bond Fund 0 0 0 3,393,000
Federal Airport or Aviation Federal Capital Projects Fund 6,000,000 6,000,000 0 41,414,000
Rebuild and Renew New York Transportation Bonds of 2005 Capital Projects Fund - Rebuild Renew NY 2005
(Bondable 0 0 0 44,503,000 Bond Proceeds
Rebuild and Renew New York Transportation Bonds of 2005 Rebuild and Renew New York Transportation
Bonds of 2005 0 0 0 1,849,213,000 Canals and Waterways
Canals and Waterways - Bondable Capital Projects Fund - Infrastructure Renewal
(Bondable) 0 0 0 485,000 Rebuild and Renew New York Transportation Bonds
of 2005 Capital Projects Fund - Rebuild Renew NY 2005
(Bondable 0 0 0 49,767,000 Economic Development
Non-Federal Aided Highway Capital Projects Dedicated Highway and Bridge Trust Fund 0 0 0 275,555,000
Health and Safety Non-Federal Aided Highway Capital Projects
Dedicated Highway and Bridge Trust Fund 8,885,000 8,299,000 (586,000) 11,268,000 Highway Facilities
Accelerated Capacity and Transportation Improvements Fund Accelerated Capacity and Transportation
Improvements Fund 0 0 0 26,275,000 Airport or Aviation State Program
Dedicated Highway and Bridge Trust Fund 0 0 0 152,000 American Recovery and Reinvestment Act
Federal Stimulus 10,000,000 0 (10,000,000) 1,188,159,000 Engineering Services
Engineering Services Fund 0 0 0 129,993,000 NY Metro Transportation Council Account 19,300,000 18,148,000 (1,152,000) 43,926,000
Federal Aid Highways - Bondable Purpose Capital Projects Fund - Infrastructure Renewal
(Bondable) 0 0 0 6,114,000 Federal Aid Highways - Federal Purpose
Federal Capital Projects Fund 2,000,000,000 2,000,000,000 0 8,072,913,000 Highway Facilities
Dedicated Highway and Bridge Trust Fund 0 0 0 11,982,000 Infrastructure Bond Act Projects
Capital Projects Fund - Infrastructure Renewal (Bondable) 0 0 0 7,255,000
Multi-Modal Dedicated Highway and Bridge Trust Fund 0 0 0 41,166,000
Municipal Highway - Railroad Crossing Alterations Dedicated Highway and Bridge Trust Fund 0 0 0 1,568,000

TRANSPORTATION
326
CAPITAL PROJECTS ALL FUNDS FINANCIAL REQUIREMENTS BY PROGRAM
APPROPRIATIONS (dollars)
Comprehensive Construction Program Available
2010-11Recommended
2011-12 Change Reappropriations
2011-12New York State Agency Fund
Miscellaneous New York State Agency Fund 50,000,000 50,000,000 0 299,562,000 Non-Federal Aided Highway Capital Projects
Dedicated Highway and Bridge Trust Fund 1,218,448,000 1,183,912,000 (34,536,000) 2,360,682,000 Other Highway Aid
Dedicated Highway and Bridge Trust Fund 0 0 0 1,150,000 Priority Bond Act Projects
Capital Projects Fund - Infrastructure Renewal (Bondable) 0 0 0 8,830,000
Rebuild and Renew New York Transportation Bonds of 2005 Capital Projects Fund - Rebuild Renew NY 2005
(Bondable 0 0 0 633,456,000 Road and Bridge Improvements - Bondable
Capital Projects Fund - AC and TI Fund (Bondable) 0 0 0 26,221,000 Small and Minority and Women-Owned Small
Business Assistance Dedicated Highway and Bridge Trust Fund 0 0 0 3,500,000
Transportation Infrastructure Renewal Bond Fund Transportation Infrastructure Renewal Bond Fund 0 0 0 27,346,000
Maintenance Facilities Maintenance Facilities
Dedicated Highway and Bridge Trust Fund 18,165,000 18,165,000 0 50,333,000 Mass Transportation and Rail Freight
American Recovery and Reinvestment Act Federal Stimulus 0 0 0 2,019,700,000
Mass Transportation Dedicated Mass Transportation Non MTA 18,500,000 18,500,000 0 103,629,000
Mass Transportation and Rail Freight Capital Projects Fund - Energy Conservation
(Bondable) 0 0 0 149,000 Dedicated Highway and Bridge Trust Fund 15,300,000 16,930,000 1,630,000 78,062,000 Dedicated Mass Transportation Non MTA 47,971,000 47,971,000 0 129,748,000 Federal Capital Projects Fund 0 0 0 19,575,000
Mass Transportation and Rail Freight Bondable Capital Projects Fund - Infrastructure Renewal
(Bondable) 0 0 0 2,686,000 Other Transportation Aid
Federal Capital Projects Fund 300,000,000 0 (300,000,000) 300,000,000 Rail Freight
Capital Projects Fund - Advances 0 0 0 21,350,000 Capital Projects Fund - Infrastructure Renewal
(Bondable) 0 0 0 121,000 Dedicated Mass Transportation Non MTA 0 0 0 1,351,000
Rail Preservation and Development Fund Energy Conservation Improved Transportation
Bond Fund 0 0 0 164,000 Rebuild and Renew New York Transportation Bonds
of 2005 Capital Projects Fund - Rebuild Renew NY 2005
(Bondable 0 0 0 38,613,000 Small and Minority and Women-Owned Small
Business Assistance Dedicated Mass Transportation Non MTA 0 0 0 5,000,000
Special Rail and Aviation Program Capital Projects Fund - Authority Bonds 0 0 0 20,949,000 Dedicated Mass Transportation Non MTA 0 0 0 5,244,000
Port Development Port Development Bondable
Capital Projects Fund - Infrastructure Renewal (Bondable) 0 0 0 57,000
Rebuild and Renew New York Transportation Bonds of 2005 Capital Projects Fund - Rebuild Renew NY 2005
(Bondable 0 0 0 95,525,000
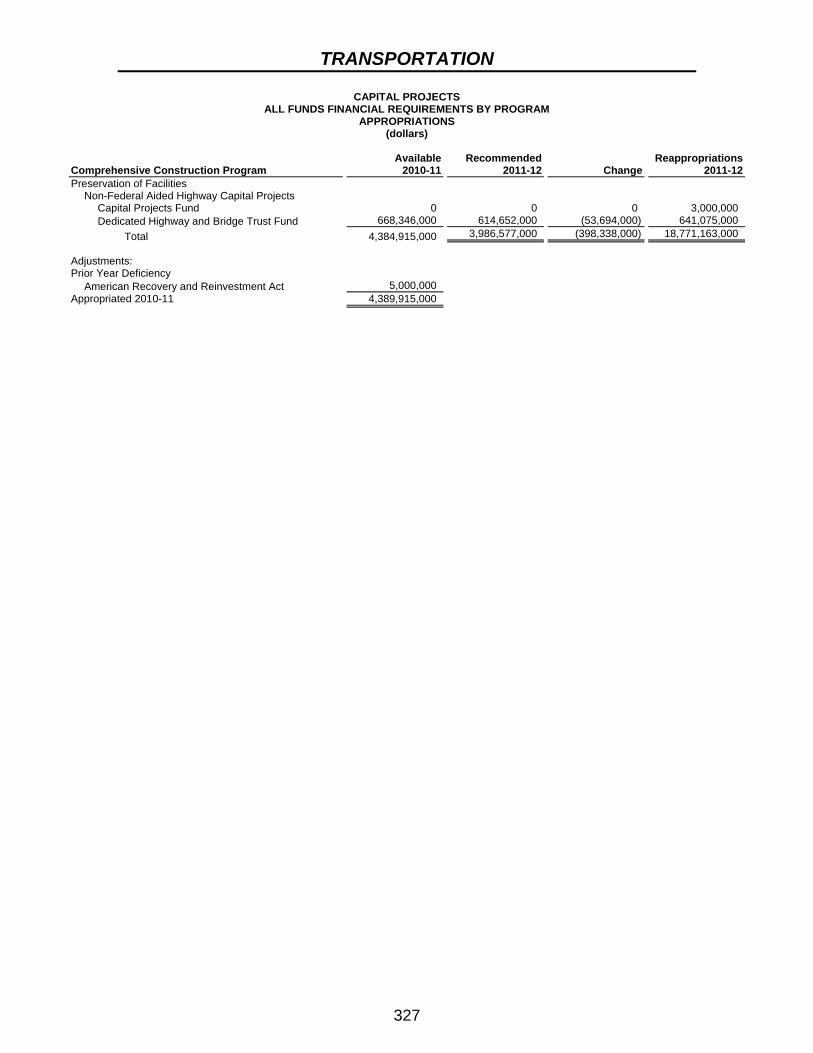
TRANSPORTATION
327
CAPITAL PROJECTS ALL FUNDS FINANCIAL REQUIREMENTS BY PROGRAM
APPROPRIATIONS (dollars)
Comprehensive Construction Program Available
2010-11Recommended
2011-12 Change Reappropriations
2011-12Preservation of Facilities
Non-Federal Aided Highway Capital Projects Capital Projects Fund 0 0 0 3,000,000 Dedicated Highway and Bridge Trust Fund 668,346,000 614,652,000 (53,694,000) 641,075,000
Total 4,384,915,000 3,986,577,000 (398,338,000) 18,771,163,000 Adjustments: Prior Year Deficiency
American Recovery and Reinvestment Act 5,000,000 Appropriated 2010-11 4,389,915,000

328
DIVISION OF VETERANS’ AFFAIRS MISSION The core mission of the Division of Veterans’ Affairs is to link veterans, members of the armed forces, and their families and dependents, to various personal, medical, and financial benefits available as the result of active duty military service. The Division’s professional counseling staff prepares, presents and prosecutes claims including applications for monthly compensation and pension awards, education benefits, burial benefits, vocational rehabilitation training, health care, nursing home care, tax exemption and other services. The Division will continue to offer accessible professional assistance to nearly one million veterans and their dependents, as well as to thousands of New Yorkers currently on active military duty. ORGANIZATION AND STAFFING The Division is headed by the Director, who is appointed by the Governor. The Division’s central office is in Albany, with regional offices in New York City and Buffalo. The Division currently maintains a network of 72 local points of access, both full-time and itinerant, where the veterans’ community can obtain information and assistance from the Division’s veterans counseling staff. The Division maximizes its presence in the veterans’ community by maintaining office locations that are readily accessible to veterans, such as United States Department of Veterans Affairs (VA) medical centers and community outpatient clinics. More than half of the Division’s State Veterans Counselors are assigned to multiple offices, and the Division has recently added mobile counseling services, further expanding outreach efforts to veterans and their families. BUDGET HIGHLIGHTS The 2011-12 Executive Budget recommends $16.3 million in All Funds spending ($13.8 million General Fund, and $2.5 million Other Funds) to support ongoing agency activities. This is a decrease of $0.6 million (-3.6 percent) All Funds from the 2010-11 Enacted Budget, which is entirely attributable to a 10 percent reduction in the agency’s operating budget. The Executive Budget reduces each agency’s General Fund State Operations budget by 10 percent. These savings are intended to be achieved through administrative efficiencies in non-personal service and negotiated workforce savings that minimize layoffs to the extent possible. Local grants remain unchanged at the prior year’s level. PROGRAM HIGHLIGHTS The largest of the Division of Veterans’ Affairs programs is the Veterans’ Counseling Services Program. In State fiscal year 2009-10, new claims for Federal benefits that provide direct assistance to veterans and their families, generated more than $108 million in new and recurring VA for compensation and pension payments for disabled and low-income veterans and dependents. Based on the number of claims filed and awards issued during calendar year 2010, overall benefits flowing into New York State are on a pace to match or exceed those of
VETERANS’ AFFAIRS
329
recent years. The Division of Veterans’ Affairs’ VA accredited counseling staff is responsible for securing and maintaining a substantial portion of the $1.50 billion in Federal VA benefits paid annually to veterans and their dependents in New York State. The Division, in collaboration with other State, Federal, local and not-for-profit agencies, continues its efforts to assist returning active duty military personnel. The Division continues to collaborate with the Division of Military and Naval Affairs and the Office of Mental Health with regard to behavioral health screening for Post Traumatic Stress Disorder (PTSD) and Traumatic Brain Injury (TBI). This provides the Division an opportunity to disseminate information about benefits and familiarize veterans and their families with services offered by the agency’s counseling staff. On, November 11, 2008, the New York State Council on Returning Veterans and Their Families was established. This Council was formed to improve upon the way services are provided to returning veterans who often require assistance with human, social, and economic challenges. The Council has explored new approaches for helping returning veterans and their families address problems and concerns in such areas as: personal finance, family relationships, physical and psychological care, substance abuse treatment, employment, and complex medical injuries. The Division continues to partner with the New York State Department of Health and the State University of New York at Stony Brook to assist veterans and eligible dependents in gaining admission to the State Veterans Home Program that is comprised of five long-term healthcare facilities around the State. State Veterans Counselors, each of whom is a veteran, assist veterans in accessing the VA’s network of health care, state veterans’ homes and nursing homes, as well as local public assistance and private venues that offer programs or services to assist veterans and their families. Without these essential employees, veterans and their families could be required to seek other forms of public health care. Other key benefits to veterans are described below. VETERANS’ EDUCATION PROGRAM The Bureau of Veterans’ Education staff are located in both Albany and New York City, and investigate and certify post-secondary educational and vocational institutions to enable veterans seeking to utilize their Federal benefits to further their education. The Veterans Education Bureau also is responsible for approving on-the-job training and apprenticeship programs. BLIND ANNUITY PROGRAM The Blind Annuity Program provides visually impaired veterans and eligible surviving spouses (who are not re-married) an annual annuity which is paid in monthly installments. The Division of Veterans’ Affairs processes applications and authorizes awards, with more than 4,500 individuals currently receiving benefits. SUPPLEMENTAL BURIAL BENEFIT PROGRAM Families of members of the armed forces killed in combat, or who die while serving in a hostile theater of operation may be eligible for the Supplemental Burial Benefit. Established in 2003, this benefit provides a maximum reimbursement of $6,000 to help families offset the costs of funeral and burial expenses.

VETERANS’ AFFAIRS
330
GOLD STAR PARENT ANNUITY The Division also provides annual annuities to “Gold Star Parents” in the amount of $500 per parent, not to exceed $1,000 per veteran. Any “Gold Star” parent of a deceased veteran, who is a resident of New York State and has an income at or below 200 percent of the Federal poverty level, may be eligible for the annuity.
ALL FUNDS APPROPRIATIONS
(dollars)
Category Available
2010-11
AppropriationsRecommended
2011-12 Change
ReappropriationsRecommended
2011-12State Operations 8,417,000 7,772,000 (645,000) 3,932,000 Aid To Localities 8,446,000 8,526,000 80,000 0 Capital Projects 0 0 0 0 Total 16,863,000 16,298,000 (565,000) 3,932,000
ALL FUND TYPES
PROJECTED LEVELS OF EMPLOYMENT BY PROGRAM FILLED ANNUAL SALARIED POSITIONS
Full-Time Equivalent Positions (FTE)
Program
2010-11Estimated FTEs
03/31/11
2011-12Estimated FTEs
03/31/12 FTE ChangeAdministration
General Fund (1) (1) 0 Higher Education
Special Revenue Funds - Federal 11 12 1 Veteran Counseling Services Program
General Fund 87 87 0 Total 97 98 1
The above table does not reflect layoffs that may be necessary in the absence of negotiated workforce savings.
STATE OPERATIONS
ALL FUNDS FINANCIAL REQUIREMENTS BY FUND TYPE APPROPRIATIONS
(dollars)
Fund Type Available
2010-11Recommended
2011-12 ChangeGeneral Fund 6,451,000 5,806,000 (645,000) Special Revenue Funds - Federal 1,966,000 1,966,000 0 Total 8,417,000 7,772,000 (645,000)
STATE OPERATIONS
ALL FUNDS FINANCIAL REQUIREMENTS BY PROGRAM APPROPRIATIONS
(dollars)
Program Available
2010-11Recommended
2011-12 ChangeAdministration
General Fund 538,000 484,000 (54,000) Higher Education
Special Revenue Funds - Federal 1,966,000 1,966,000 0 Veteran Counseling Services Program
General Fund 5,913,000 5,322,000 (591,000) Total 8,417,000 7,772,000 (645,000)

VETERANS’ AFFAIRS
331
STATE OPERATIONS - GENERAL FUND SUMMARY OF PERSONAL SERVICE APPROPRIATIONS AND CHANGES
2011-12 RECOMMENDED (dollars)
Total Personal Service Regular
(Annual Salaried) Program Amount Change Amount ChangeAdministration 367,000 (41,000) 367,000 (41,000)Veteran Counseling Services Program 4,871,000 (540,000) 4,848,000 (538,000) Total 5,238,000 (581,000) 5,215,000 (579,000)
Holiday/Overtime Pay
(Annual Salaried) Program Amount Change Administration 0 0 Veteran Counseling Services Program 23,000 (2,000) Total 23,000 (2,000)
STATE OPERATIONS - GENERAL FUND
SUMMARY OF NONPERSONAL SERVICE AND MAINTENANCE UNDISTRIBUTED APPROPRIATIONS AND CHANGES
2011-12 RECOMMENDED (dollars)
Total Supplies and Materials Program Amount Change Amount ChangeAdministration 117,000 (13,000) 10,000 (1,000)Veteran Counseling Services Program 451,000 (51,000) 63,000 (7,000) Total 568,000 (64,000) 73,000 (8,000) Travel Contractual Services Program Amount Change Amount ChangeAdministration 14,000 (2,000) 74,000 (8,000)Veteran Counseling Services Program 104,000 (12,000) 194,000 (22,000) Total 118,000 (14,000) 268,000 (30,000) Equipment Program Amount Change Administration 19,000 (2,000) Veteran Counseling Services Program 90,000 (10,000) Total 109,000 (12,000)
STATE OPERATIONS - OTHER THAN GENERAL FUND
SUMMARY OF APPROPRIATIONS AND CHANGES 2011-12 RECOMMENDED
(dollars) Total Personal Service Program Amount Change Amount ChangeHigher Education 1,966,000 0 1,161,000 0 Total 1,966,000 0 1,161,000 0 Nonpersonal Service Program Amount Change Higher Education 805,000 0 Total 805,000 0

VETERANS’ AFFAIRS
332
AID TO LOCALITIES ALL FUNDS FINANCIAL REQUIREMENTS BY FUND TYPE
APPROPRIATIONS (dollars)
Fund Type Available
2010-11Recommended
2011-12 ChangeGeneral Fund 7,946,000 8,026,000 80,000 Special Revenue Funds - Federal 500,000 500,000 0 Total 8,446,000 8,526,000 80,000
AID TO LOCALITIES
ALL FUNDS FINANCIAL REQUIREMENTS BY PROGRAM APPROPRIATIONS
(dollars)
Program Available
2010-11Recommended
2011-12 ChangeAdministration
General Fund 799,000 799,000 0 Blind Veteran Annuity Assistance
General Fund 5,720,000 5,800,000 80,000 Veteran Counseling Services Program
General Fund 1,427,000 1,427,000 0 Special Revenue Funds - Federal 500,000 500,000 0
Total 8,446,000 8,526,000 80,000

333
OFFICE OF THE WELFARE INSPECTOR GENERAL
MISSION The Office of Welfare Inspector General was established in 1992 to prevent, investigate, and prosecute welfare fraud, waste, abuse and illegal acts involving social services programs at both the State and local levels. The Office investigates and when appropriate prosecutes welfare recipients who are dishonestly receiving benefits for which they are not eligible. It also investigates instances in which providers of Medicaid, day care or other social services fraudulently receive payments from government. The agency is responsible for investigating any failure by State and local officials to investigate and prosecute such fraud and abuse within their jurisdiction. Furthermore, the Office is charged with recommending policies to prevent and to detect social services fraud, and then to monitor the implementation of these recommendations. In carrying out its responsibilities, the Office works closely with various State agencies in support of fraud investigations. The Office of Temporary and Disability Assistance provides welfare program data and information concerning the application of program rules and regulations. Local social services districts assist the Office with identifying the amount of money fraudulently obtained from different welfare programs. The Attorney General assists the Office with the prosecution of those alleged to be involved in fraudulent activity. The Office also works with the Office of Children and Family Services on cases involving adult homes and other community programs, as well as with the Department of Health and the Office of the Medicaid Inspector General on Medicaid-related cases. ORGANIZATION AND STAFFING The Office is headed by the Welfare Inspector General, who is appointed for a five-year term by the Governor with the advice and consent of the Senate. The Welfare Inspector General’s statewide operations are administered from New York City with a field office in Albany. BUDGET HIGHLIGHTS The Executive Budget recommends $1.6 million All Funds ($378,000 General Fund; $1.2 million Other Funds) for the Office of Welfare Inspector General, which reflects a $42,000 (-10 percent) reduction to General Fund State Operations appropriations. The Executive Budget reduces each agency’s General Fund State Operations budget by 10 percent. These savings are intended to be achieved through administrative efficiencies in non-personal service and negotiated workforce savings that minimize layoffs to the extent possible. PROGRAM HIGHLIGHTS The Office annually receives hundreds of complaints about alleged welfare fraud, waste and abuse that originate from citizens and other governmental agencies. The Office also generates investigations on its own initiative. Fraud investigations result in substantial savings for all levels of government by uncovering fraudulent activity by a

WELFARE INSPECTOR GENERAL
334
member of a household receiving welfare, as well as unreported income or inappropriate claiming practices by those who provide day care, employment, health care or other services to welfare recipients. The Office annually works on approximately 200 fraud investigations and recovers funding that is repaid to the appropriate programs. Stopping fraudulent activity reduces future years’ welfare costs by individuals who would otherwise continue to fraudulently take money from the government, and by providing a deterrent to those who may seek to defraud government programs. In addition to investigations of individual welfare recipients, the Office completes investigations to uncover patterns of abuse within the welfare system including not only recipients but also social services agencies, organizations and contractors.
ALL FUNDS APPROPRIATIONS
(dollars)
Category Available
2010-11
AppropriationsRecommended
2011-12 Change
ReappropriationsRecommended
2011-12State Operations 1,597,000 1,555,000 (42,000) 0 Aid To Localities 0 0 0 0 Capital Projects 0 0 0 0 Total 1,597,000 1,555,000 (42,000) 0
ALL FUND TYPES
PROJECTED LEVELS OF EMPLOYMENT BY PROGRAM FILLED ANNUAL SALARIED POSITIONS
Full-Time Equivalent Positions (FTE)
Program
2010-11Estimated FTEs
03/31/11
2011-12Estimated FTEs
03/31/12 FTE ChangeWelfare Inspector General, Office of the
General Fund 4 4 0 Special Revenue Funds - Other 3 3 0
Total 7 7 0
The above table does not reflect layoffs that may be necessary in the absence of negotiated workforce savings.
STATE OPERATIONS
ALL FUNDS FINANCIAL REQUIREMENTS BY FUND TYPE APPROPRIATIONS
(dollars)
Fund Type Available
2010-11Recommended
2011-12 ChangeGeneral Fund 420,000 378,000 (42,000) Special Revenue Funds - Other 1,177,000 1,177,000 0 Total 1,597,000 1,555,000 (42,000)
STATE OPERATIONS
ALL FUNDS FINANCIAL REQUIREMENTS BY PROGRAM APPROPRIATIONS
(dollars)
Program Available
2010-11Recommended
2011-12 ChangeWelfare Inspector General, Office of the
General Fund 420,000 378,000 (42,000) Special Revenue Funds - Other 1,177,000 1,177,000 0
Total 1,597,000 1,555,000 (42,000)

WELFARE INSPECTOR GENERAL
335
STATE OPERATIONS - GENERAL FUND SUMMARY OF PERSONAL SERVICE APPROPRIATIONS AND CHANGES
2011-12 RECOMMENDED (dollars)
Total Personal Service Regular
(Annual Salaried) Program Amount Change Amount ChangeWelfare Inspector General, Office of the 378,000 (42,000) 378,000 (42,000) Total 378,000 (42,000) 378,000 (42,000)
STATE OPERATIONS - GENERAL FUND
SUMMARY OF NONPERSONAL SERVICE AND MAINTENANCE UNDISTRIBUTED APPROPRIATIONS AND CHANGES
2011-12 RECOMMENDED (dollars)
Total Program Amount Change Total 0 0
STATE OPERATIONS - OTHER THAN GENERAL FUND
SUMMARY OF APPROPRIATIONS AND CHANGES 2011-12 RECOMMENDED
(dollars) Total Personal Service Program Amount Change Amount ChangeWelfare Inspector General, Office of the 1,177,000 0 457,000 0 Total 1,177,000 0 457,000 0 Nonpersonal Service Program Amount Change Welfare Inspector General, Office of the 720,000 0 Total 720,000 0

336
WORKERS’ COMPENSATION BOARD MISSION The New York State Workers’ Compensation Board protects the rights of employees and employers by ensuring the proper delivery of benefits to those eligible due to being injured or becoming ill while on the job and by promoting compliance with the law. To protect the well-being of New York’s labor force, most private and public sector employers in New York are required to carry workers’ compensation and disability benefits insurance for their employees or demonstrate their ability to self-insure. The Workers’ Compensation Board reviews claims for workers’ compensation payments and assists in resolving disputed claims. In performing these responsibilities, the Board administers provisions of the following laws: the Workers’ Compensation Law; the Disability Benefits Law; the Civil Defense Volunteers’ Law; the Volunteer Firefighters’ Benefit Law; and the Volunteer Ambulance Workers’ Benefit Law. ORGANIZATION AND STAFFING The Board is headed by a Chairperson selected by the Governor and includes 12 additional full-time members nominated by the Governor and confirmed by the Senate for seven-year terms. District offices are located in Albany, Binghamton, Brooklyn, Buffalo, Hauppauge, Hempstead, Manhattan, Peekskill, Queens, Rochester and Syracuse, with administrative offices in Albany. The Board has additional customer service centers located throughout the State. BUDGET HIGHLIGHTS The Executive Budget recommends $204.7 million All Funds for the Workers’ Compensation Board, all of which is funded from assessments on businesses. This amount is unchanged from the 2010-11 level. The Executive Budget projects a staffing level of 1,466 in 2011-12, which is an increase of 16 from 2010-11. This increase reflects positions added for the information technology in-sourcing initiative. PROGRAM HIGHLIGHTS Over the past several years, New York has seen sweeping statutory reform in the workers’ compensation system. During this period, benefits have increased while costs have decreased; injured workers are receiving their benefits faster; and fraud has been aggressively pursued. The Board’s efforts continue to be dedicated to implementing all of the reforms and an agenda of positive transformation within the agency. To that end, on December 1, 2010, the Board issued new medical treatment guidelines which are now the mandatory standard of care for mid- and lower-back, neck, shoulder and knee injuries. These guidelines established a standard of medical care for injured workers which will improve medical outcomes for workers and expedite quality care. The guidelines will also speed return to work by injured workers, reduce disputes between payers and medical providers over treatment issues and reduce overall system costs.

WORKERS’ COMPENSATION
337
ALL FUNDS APPROPRIATIONS
(dollars)
Category Available
2010-11
AppropriationsRecommended
2011-12 Change
ReappropriationsRecommended
2011-12State Operations 204,749,000 204,749,000 0 20,000,000 Aid To Localities 0 0 0 0 Capital Projects 0 0 0 0 Total 204,749,000 204,749,000 0 20,000,000
ALL FUND TYPES
PROJECTED LEVELS OF EMPLOYMENT BY PROGRAM FILLED ANNUAL SALARIED POSITIONS
Full-Time Equivalent Positions (FTE)
Program
2010-11Estimated FTEs
03/31/11
2011-12Estimated FTEs
03/31/12 FTE ChangeDisability Benefits
Special Revenue Funds - Other 43 43 0 Workers Compensation
Special Revenue Funds - Other 1,407 1,423 16 Total 1,450 1,466 16
The above table does not reflect layoffs that may be necessary in the absence of negotiated workforce savings.
STATE OPERATIONS
ALL FUNDS FINANCIAL REQUIREMENTS BY FUND TYPE APPROPRIATIONS
(dollars)
Fund Type Available
2010-11Recommended
2011-12 ChangeSpecial Revenue Funds - Other 204,749,000 204,749,000 0 Total 204,749,000 204,749,000 0 Adjustments: Transfer(s) From
Special Pay Bill Special Revenue Funds - Other (375,000)
Appropriated 2010-11 204,374,000
STATE OPERATIONS ALL FUNDS FINANCIAL REQUIREMENTS BY PROGRAM
APPROPRIATIONS (dollars)
Program Available
2010-11Recommended
2011-12 ChangeDisability Benefits
Special Revenue Funds - Other 7,369,000 7,369,000 0 Workers Compensation
Special Revenue Funds - Other 197,380,000 197,380,000 0 Total 204,749,000 204,749,000 0

WORKERS’ COMPENSATION
338
STATE OPERATIONS - OTHER THAN GENERAL FUND SUMMARY OF APPROPRIATIONS AND CHANGES
2011-12 RECOMMENDED (dollars)
Total Personal Service Program Amount Change Amount ChangeDisability Benefits 7,369,000 0 3,809,000 0 Workers Compensation 197,380,000 0 90,544,000 0 Total 204,749,000 0 94,353,000 0 Nonpersonal Service Maintenance Undistributed Program Amount Change Amount ChangeDisability Benefits 3,560,000 0 0 0 Workers Compensation 106,477,000 0 359,000 0 Total 110,037,000 0 359,000 0

MISCELLANEOUS
339
COLLECTIVE BARGAINING AGREEMENTS The Executive Budget recommends $5.8 million All Funds ($5.3 million General Fund; $500,000 Other Funds) for Collective Bargaining Agreements. This is a decrease of $33.8 million from the 2010-11 budget. These appropriations are limited to the amounts necessary to continue required benefits and programs in the absence of new collective bargaining agreements. Unspent funds from existing agreements have been reappropriated. Costs of new collective bargaining agreements will be incorporated within separate legislation. Executive Budget appropriations support a staffing level of up to 91 in 2011-12 for Collective Bargaining Agreements.
ALL FUNDS APPROPRIATIONS
(dollars)
Category Available
2010-11
AppropriationsRecommended
2011-12 Change
ReappropriationsRecommended
2011-12State Operations 39,593,000 5,800,000 (33,793,000) 45,080,000 Aid To Localities 0 0 0 0 Capital Projects 0 0 0 0 Total 39,593,000 5,800,000 (33,793,000) 45,080,000
ALL FUND TYPES
PROJECTED LEVELS OF EMPLOYMENT BY PROGRAM FILLED ANNUAL SALARIED POSITIONS
Full-Time Equivalent Positions (FTE)
Program
2010-11Estimated FTEs
03/31/11
2011-12Estimated FTEs
03/31/12 FTE ChangeLabor Management Programs
General Fund 91 91 0 Total 91 91 0
The above table does not reflect layoffs that may be necessary in the absence of negotiated workforce savings.
STATE OPERATIONS
ALL FUNDS FINANCIAL REQUIREMENTS BY FUND TYPE APPROPRIATIONS
(dollars)
Fund Type Available
2010-11Recommended
2011-12 ChangeGeneral Fund 39,093,000 5,300,000 (33,793,000) Special Revenue Funds - Other 500,000 500,000 0 Total 39,593,000 5,800,000 (33,793,000) Adjustments: Transfer(s) From
Special Pay Bill General Fund (374,000)
Appropriated 2010-11 39,219,000

MISCELLANEOUS
340
STATE OPERATIONS ALL FUNDS FINANCIAL REQUIREMENTS BY PROGRAM
APPROPRIATIONS (dollars)
Program Available
2010-11Recommended
2011-12 ChangeLabor Management Programs
General Fund 39,093,000 5,300,000 (33,793,000) Special Revenue Funds - Other 500,000 500,000 0
Total 39,593,000 5,800,000 (33,793,000)
STATE OPERATIONS - GENERAL FUND
SUMMARY OF NONPERSONAL SERVICE AND MAINTENANCE UNDISTRIBUTED APPROPRIATIONS AND CHANGES
2011-12 RECOMMENDED (dollars)
Total Supplies and Materials Program Amount Change Amount ChangeLabor Management Programs 5,300,000 (33,793,000) 0 (374,000) Total 5,300,000 (33,793,000) 0 (374,000) Maintenance Undistributed Program Amount Change Labor Management Programs 5,300,000 (33,419,000) Total 5,300,000 (33,419,000)
STATE OPERATIONS - OTHER THAN GENERAL FUND
SUMMARY OF APPROPRIATIONS AND CHANGES 2011-12 RECOMMENDED
(dollars) Total Maintenance Undistributed Program Amount Change Amount ChangeLabor Management Programs 500,000 0 500,000 0 Total 500,000 0 500,000 0
COMMUNITY PROJECTS There are no Community Projects Fund appropriations or reappropriations in the 2011-12 Executive Budget. The Executive Budget would repeal the Community Projects Fund and sweep fund balances to the General Fund effective September 15, 2011.
COMMUNITY SERVICE PROVIDER ASSISTANCE PROGRAM
These reappropriations continue the spending authority for the expenditure of Community Projects Fund lump sum appropriations originally enacted in the 2001-02 budget. The 2011-12 Executive Budget does not advance any new appropriations for the Community Projects Fund.

MISCELLANEOUS
341
ALL FUNDS APPROPRIATIONS
(dollars)
Category Available
2010-11
AppropriationsRecommended
2011-12 Change
ReappropriationsRecommended
2011-12State Operations 0 0 0 4,000,000 Aid To Localities 0 0 0 0 Capital Projects 0 0 0 0 Total 0 0 0 4,000,000
DEFERRED COMPENSATION BOARD MISSION The Deferred Compensation Board, in accordance with Section 5 of the State Finance Law, administers the New York State Deferred Compensation State Plan, which serves over 126,000 State employees and 63,000 employees of local governments that participate in the State Plan. There are approximately 250 local governments that sponsor and administer their own deferred compensation plans in compliance with the Board’s rules. ORGANIZATION AND STAFFING The Board consists of three members, one each appointed by the Governor, the Temporary President of the Senate and the Speaker of the Assembly. The Board maintains a staff of four professionals who are responsible for management of the State Plan as well as for regulatory duties for locally administered plans. Management of the State Plan includes oversight of administrative services delivered by contracted service providers, monitoring the Plan’s investment managers, coordination with professional services firms and direct service delivery through its main office. BUDGET HIGHLIGHTS The Executive Budget recommends $931,000 All Funds ($114,000 General Fund; $817,000 Other Funds) for the Deferred Compensation Board. PROGRAM HIGHLIGHTS The Board continues to pursue opportunities to provide a well balanced supplemental retirement savings program, improve services to State Plan participants, and further State Plan participants’ ability to meet their retirement savings goals. The Board initiates outreach efforts to State agencies and local participating employers to encourage even greater participation at both the State and local government levels. During the past fiscal year, the Plan enrolled almost 8,000 new participants, and voluntary employee salary deferrals to the Plan exceeded $920 million (an increase of nearly 5.2 percent). More than 1,200 local governments now participate in the State Plan.

MISCELLANEOUS
342
The Board provides local governments that sponsor and administer their own deferred compensation plans with updates on the Board’s rules and responds to questions on the administration of deferred compensation plans, and provides guidance on issues related to Federal statutory changes and the State’s Model Deferred Compensation Plan. During 2010-11, the Board examined and amended the Model Plan Documents to assure compliance with all recent changes to Federal law and regulations pertaining to deferred compensation plans.
ALL FUNDS APPROPRIATIONS
(dollars)
Category Available
2010-11
AppropriationsRecommended
2011-12 Change
ReappropriationsRecommended
2011-12State Operations 931,000 931,000 0 0 Aid To Localities 0 0 0 0 Capital Projects 0 0 0 0 Total 931,000 931,000 0 0
ALL FUND TYPES
PROJECTED LEVELS OF EMPLOYMENT BY PROGRAM FILLED ANNUAL SALARIED POSITIONS
Full-Time Equivalent Positions (FTE)
Program
2010-11Estimated FTEs
03/31/11
2011-12Estimated FTEs
03/31/12 FTE ChangeOperations
Special Revenue Funds - Other 4 4 0 Total 4 4 0
The above table does not reflect layoffs that may be necessary in the absence of negotiated workforce savings.
STATE OPERATIONS
ALL FUNDS FINANCIAL REQUIREMENTS BY FUND TYPE APPROPRIATIONS
(dollars)
Fund Type Available
2010-11Recommended
2011-12 ChangeGeneral Fund 114,000 114,000 0 Special Revenue Funds - Other 817,000 817,000 0 Total 931,000 931,000 0
STATE OPERATIONS
ALL FUNDS FINANCIAL REQUIREMENTS BY PROGRAM APPROPRIATIONS
(dollars)
Program Available
2010-11Recommended
2011-12 ChangeOperations
General Fund 114,000 114,000 0 Special Revenue Funds - Other 817,000 817,000 0
Total 931,000 931,000 0

MISCELLANEOUS
343
STATE OPERATIONS - GENERAL FUND SUMMARY OF NONPERSONAL SERVICE AND MAINTENANCE UNDISTRIBUTED
APPROPRIATIONS AND CHANGES 2011-12 RECOMMENDED
(dollars) Total Contractual Services Program Amount Change Amount ChangeOperations 114,000 0 114,000 0 Total 114,000 0 114,000 0
STATE OPERATIONS - OTHER THAN GENERAL FUND
SUMMARY OF APPROPRIATIONS AND CHANGES 2011-12 RECOMMENDED
(dollars) Total Personal Service Program Amount Change Amount ChangeOperations 817,000 0 394,000 0 Total 817,000 0 394,000 0 Nonpersonal Service Program Amount Change Operations 423,000 0 Total 423,000 0
GENERAL STATE CHARGES General State Charges are primarily the costs of providing fringe benefits to most State employees, which are authorized in collective bargaining agreements and various statutes. The General State Charges budget also includes miscellaneous fixed costs such as litigation settlements and taxes on State-owned lands. BUDGET HIGHLIGHTS Recommended 2011-12 appropriations for General State Charges total $3.0 billion All Funds ($2.9 billion General Fund; $101 million in Fiduciary Funds), a net increase of approximately $511 million All Funds (20.6 percent) ($511 million increase in General Fund) from 2010-11. This increase largely stems from statutorily required increases in spending on employee fringe benefits, such as pensions and health insurance. This amount will be augmented by $1 billion initially appropriated to the State University of New York for employee fringe benefits. PROGRAM HIGHLIGHTS FRINGE BENEFITS The State provides a comprehensive fringe benefits package to its employees. These benefits are supported primarily by General Fund revenues and supplemented with revenue from fringe benefit assessments on Federal and other dedicated revenue programs. In 2011-12, revenue collected from fringe benefit assessments is expected to be $2.4 billion.

MISCELLANEOUS
344
Employee and Retiree Health Benefits: Through the New York State Health Insurance Program (NYSHIP), State employees and retirees have the option to participate in the Empire Plan, a health insurance program designed exclusively for New York’s public employees, or one of 20 health maintenance organization options. Approximately 84 percent of State employees and retirees are enrolled in the Empire Plan. The recommended 2011-12 General Fund appropriation for the State’s employee health insurance is $2.0 billion. Pension Benefits: Most State employees are members of the New York State and Local Retirement System, which consists of the New York State and Local Employees’ Retirement System (ERS) and the New York State and Local Police and Fire Retirement System (PFRS). With approximately $132.8 billion in combined invested assets as of September 30, 2010, these systems administer retirement benefits to State and local government employees. Funding for the benefits is supported by employer contributions, bi-weekly contributions from certain employees with less than ten years of service, and pension fund investment earnings. However, Chapter 504 of the Laws of 2009 enacted a new tier of pension benefits (Tier 5) which requires new employees to continue contributions for the duration of their employment with the State. The recommended appropriation for the State’s contribution to the retirement system in 2011-12 is $1.3 billion. This appropriation reflects an estimated contribution rate of 10.5 percent of salary for ERS and 18.5 percent of salary for PFRS, and assumes a March 1 payment date. These rates assume the State will amortize its contribution costs that exceed 10.5 percent and 18.5 percent of salary for ERS and PFRS, respectively, over a 10-year period. If the State does not amortize its pension contribution costs, normal contribution rates would be significantly higher. Social Security and Medicare Taxes: In addition to employer contributions made to the retirement system, the State makes weekly tax payments to the Federal government for the Social Security and Medicare benefit programs. The Social Security tax rate is 6.2 percent, applied on wages up to $106,800 in 2011, and the Medicare tax rate is 1.45 percent on all wages. The recommended General Fund appropriation for Social Security and Medicare taxes in 2011-12 is $505 million. Workers’ Compensation: The State reimburses the State Insurance Fund for actual compensation and medical claims incurred by State employees for job-related injuries. The statutory workers’ compensation benefit is two-thirds of the average weekly wage for the year in which it is reported. Most State employees are paid supplemental benefits pursuant to collective bargaining agreements. The recommended General Fund appropriation for workers’ compensation benefits in 2011-12 is $202 million. Efforts to contain costs and improve program management will continue through funding the automated Accident Reporting System and a dispute resolution program. Dental, Vision and Other Employee Benefits: State employees receive dental insurance and vision benefits either through State administered programs or benefit funds operated by public employee unions. Premiums for the State administered programs are covered in full by the State. The employee union benefit funds are supported by quarterly contributions from the State based on per capita rates authorized in collective bargaining agreements. In addition, the State funds an assortment of other benefit programs to cover losses due to death, disability and unemployment.

MISCELLANEOUS
345
A total of $149 million in General Fund appropriations is recommended in 2011-12 to fund dental, vision, the metropolitan transportation authority mobility tax and other employee benefits. Fringe Benefits for State University Employees: A $1 billion General Fund appropriation to support fringe benefits for employees of the State University will be initially included in the State University budget. Upon enactment, this amount will be transferred to the General State Charges program to be centrally administered along with the benefit programs for all State employees. FIXED COSTS In addition to employee fringe benefits, the State pays for a variety of fixed costs from the General State Charges budget. These costs are supported in full by General Fund revenues and include: Taxes and Other Property Assessments on State-Owned Lands: Real Property Tax Law authorizes local governments to tax certain parcels of State-owned land. The State provides financial support to local governments by paying local and/or school property taxes on approximately 22,000 parcels covering four million acres of land throughout the State as well as transition assessments on tax-exempt State-owned lands. Other property expenses include assessments for improvements on State-owned lands and payments in lieu of taxes on certain property in the City of Albany, Cattaraugus County and other localities. The 2011-12 Executive Budget also includes a new $600,000 appropriation for payments in lieu of taxes for lands in Livingston County. A total of $218 million in appropriations is recommended in 2011-12 for payment of taxes and various other property assessments on State lands. That represents a decrease of $4 million (2.0 percent) from 2010-11. Court of Claims Judgments and Other Litigation Costs: Annual appropriations are authorized to pay for expenses related to the settlement of lawsuits and court judgments against the State. Most litigation against the State is adjudicated in the Court of Claims and involves contract disputes and tort liabilities. Other appropriations in this category support the defense and indemnification of State employees for actions that arise in the course of their official duties, litigation expenses related to Indian land claims and payments to the Property Casualty Insurance Security Fund in accordance with the terms of a multi-year settlement with the insurance industry. A total of $142 million in appropriations is recommended in 2011-12 for these litigation expenses. This represents a $31 million (28.2 percent) increase from 2010-11, largely due to liabilities from the recently settled Simpson case. This case originated from allegations that the State’s battery exams were biased and discriminatory to certain minority groups.
ALL FUNDS APPROPRIATIONS
(dollars)
Category Available
2010-11
AppropriationsRecommended
2011-12 Change
ReappropriationsRecommended
2011-12State Operations 2,478,665,000 2,990,150,000 511,485,000 3,216,000 Aid To Localities 0 0 0 0 Capital Projects 0 0 0 0 Total 2,478,665,000 2,990,150,000 511,485,000 3,216,000

MISCELLANEOUS
346
STATE OPERATIONS ALL FUNDS FINANCIAL REQUIREMENTS BY FUND TYPE
APPROPRIATIONS (dollars)
Fund Type Available
2010-11Recommended
2011-12 ChangeGeneral Fund 2,377,665,000 2,889,150,000 511,485,000 Fiduciary Funds 101,000,000 101,000,000 0 Total 2,478,665,000 2,990,150,000 511,485,000 Adjustments: Transfer(s) From
Special Pay Bill General Fund (2,051,000)
Appropriated 2010-11 2,476,614,000
STATE OPERATIONS ALL FUNDS FINANCIAL REQUIREMENTS BY PROGRAM
APPROPRIATIONS (dollars)
Program Available
2010-11Recommended
2011-12 ChangeGeneral State Charges
General Fund 2,377,665,000 2,889,150,000 511,485,000 Fiduciary Funds 101,000,000 101,000,000 0
Total 2,478,665,000 2,990,150,000 511,485,000
STATE OPERATIONS - GENERAL FUND
SUMMARY OF NONPERSONAL SERVICE AND MAINTENANCE UNDISTRIBUTED APPROPRIATIONS AND CHANGES
2011-12 RECOMMENDED (dollars)
Total Supplies and Materials Program Amount Change Amount ChangeGeneral State Charges 2,889,150,000 511,485,000 0 (44,000) Total 2,889,150,000 511,485,000 0 (44,000) General State Charges Maintenance Undistributed Program Amount Change Amount ChangeGeneral State Charges 2,888,150,000 513,529,000 1,000,000 (2,000,000) Total 2,888,150,000 513,529,000 1,000,000 (2,000,000)
STATE OPERATIONS - OTHER THAN GENERAL FUND
SUMMARY OF APPROPRIATIONS AND CHANGES 2011-12 RECOMMENDED
(dollars) Total Nonpersonal Service Program Amount Change Amount ChangeGeneral State Charges 101,000,000 0 101,000,000 0 Total 101,000,000 0 101,000,000 0
GREEN THUMB PROGRAM The Green Thumb Program provides income-eligible elderly citizens with part-time employment in State agencies through the not-for-profit organization Green Thumb Environmental Beautification, Inc. The 2011-12 Executive Budget recommends a General Fund appropriation of $2.83 million, the same level as 2010-11.

MISCELLANEOUS
347
ALL FUNDS APPROPRIATIONS
(dollars)
Category Available
2010-11
AppropriationsRecommended
2011-12 Change
ReappropriationsRecommended
2011-12State Operations 2,831,000 2,831,000 0 0 Aid To Localities 0 0 0 0 Capital Projects 0 0 0 0 Total 2,831,000 2,831,000 0 0
STATE OPERATIONS - GENERAL FUND
SUMMARY OF NONPERSONAL SERVICE AND MAINTENANCE UNDISTRIBUTED APPROPRIATIONS AND CHANGES
2011-12 RECOMMENDED (dollars)
Total Contractual Services Program Amount Change Amount ChangeGreen Thumb Program 2,831,000 0 2,831,000 0 Total 2,831,000 0 2,831,000 0
THE GREENWAY HERITAGE CONSERVANCY OF THE HUDSON RIVER VALLEY
The Greenway Heritage Conservancy of the Hudson River Valley was established in the Hudson River Valley Greenway Act of 1991 to promote the preservation of natural and cultural resources in the Valley, serve as a land trust in the acquisition of lands important to the Greenway, and designate and develop the Hudson River Valley Greenway Trail. The 2011-12 Executive Budget recommends a General Fund appropriation of $166,000, a decrease of $18,000 (-10 percent) from the funding level provided in 2010-11. The Conservancy is funded entirely from the General Fund.
ALL FUNDS APPROPRIATIONS
(dollars)
Category Available
2010-11
AppropriationsRecommended
2011-12 Change
ReappropriationsRecommended
2011-12State Operations 184,000 166,000 (18,000) 0 Aid To Localities 0 0 0 0 Capital Projects 0 0 0 0 Total 184,000 166,000 (18,000) 0
STATE OPERATIONS - GENERAL FUND
SUMMARY OF PERSONAL SERVICE APPROPRIATIONS AND CHANGES 2011-12 RECOMMENDED
(dollars)
Total Personal Service Regular
(Annual Salaried) Program Amount Change Amount ChangeOperations 132,000 (15,000) 132,000 (15,000) Total 132,000 (15,000) 132,000 (15,000)

MISCELLANEOUS
348
STATE OPERATIONS - GENERAL FUND SUMMARY OF NONPERSONAL SERVICE AND MAINTENANCE UNDISTRIBUTED
APPROPRIATIONS AND CHANGES 2011-12 RECOMMENDED
(dollars) Total General State Charges Program Amount Change Amount ChangeOperations 34,000 (3,000) 34,000 (3,000) Total 34,000 (3,000) 34,000 (3,000)
HEALTH INSURANCE CONTINGENCY RESERVE
ALL FUNDS APPROPRIATIONS
(dollars)
Category Available
2010-11
AppropriationsRecommended
2011-12 Change
ReappropriationsRecommended
2011-12State Operations 651,240,000 605,057,000 (46,183,000) 0 Aid To Localities 0 0 0 0 Capital Projects 0 0 0 0 Total 651,240,000 605,057,000 (46,183,000) 0
STATE OPERATIONS - GENERAL FUND
SUMMARY OF NONPERSONAL SERVICE AND MAINTENANCE UNDISTRIBUTED APPROPRIATIONS AND CHANGES
2011-12 RECOMMENDED (dollars)
Total Maintenance Undistributed Program Amount Change Amount ChangeHealth Insurance Contingency Reserve 605,057,000 (46,183,000) 605,057,000 (46,183,000) Total 605,057,000 (46,183,000) 605,057,000 (46,183,000)
HEALTH INSURANCE RESERVE RECEIPTS FUND
ALL FUNDS APPROPRIATIONS
(dollars)
Category Available
2010-11
AppropriationsRecommended
2011-12 Change
ReappropriationsRecommended
2011-12State Operations 192,400,000 192,400,000 0 0 Aid To Localities 0 0 0 0 Capital Projects 0 0 0 0 Total 192,400,000 192,400,000 0 0
STATE OPERATIONS - OTHER THAN GENERAL FUND
SUMMARY OF APPROPRIATIONS AND CHANGES 2011-12 RECOMMENDED
(dollars) Total Maintenance Undistributed Program Amount Change Amount ChangeHealth Insurance Reserve Receipts Fund 192,400,000 0 192,400,000 0 Total 192,400,000 0 192,400,000 0

MISCELLANEOUS
349
HIGHER EDUCATION This appropriation provides funds for the Higher Education Services Corporation and the Office of the State Comptroller to jointly administer the College Choice Tuition Savings Program. This program helps families save for their children’s education at accredited public and private colleges anywhere in the country with accompanying tax benefits on contributions made to, and interest earned on, college savings accounts.
ALL FUNDS APPROPRIATIONS
(dollars)
Category Available
2010-11
AppropriationsRecommended
2011-12 Change
ReappropriationsRecommended
2011-12State Operations 829,800 829,800 0 600,000 Aid To Localities 0 0 0 0 Capital Projects 0 0 0 0 Total 829,800 829,800 0 600,000
STATE OPERATIONS
ALL FUNDS FINANCIAL REQUIREMENTS BY FUND TYPE APPROPRIATIONS
(dollars)
Fund Type Available
2010-11Recommended
2011-12 ChangeSpecial Revenue Funds - Other 829,800 829,800 0 Total 829,800 829,800 0
STATE OPERATIONS
ALL FUNDS FINANCIAL REQUIREMENTS BY PROGRAM APPROPRIATIONS
(dollars)
Program Available
2010-11Recommended
2011-12 ChangeHigher Education
Special Revenue Funds - Other 829,800 829,800 0 Total 829,800 829,800 0
STATE OPERATIONS - OTHER THAN GENERAL FUND
SUMMARY OF APPROPRIATIONS AND CHANGES 2011-12 RECOMMENDED
(dollars) Total Personal Service Program Amount Change Amount ChangeHigher Education 829,800 0 307,000 (109,100) Total 829,800 0 307,000 (109,100) Nonpersonal Service Program Amount Change Higher Education 522,800 109,100 Total 522,800 109,100

MISCELLANEOUS
350
HIGHER EDUCATION FACILITIES CAPITAL MATCHING GRANTS PROGRAM
The 2005-06 budget included a new $150 million higher education facilities capital matching grant program for private colleges in New York. Under this program, $150 million was to be awarded to private colleges based on enrollment and relative student financial need as measured by total awards provided through the Tuition Assistance Program. This program requires a three to one (non-State to State) match by institutions. Under this program, grants are awarded by the Higher Education Capital Matching Grant Board, which consists of three members (one appointed directly by the Governor with the remaining members appointed upon the recommendation of the Temporary President of the Senate and the Speaker of the Assembly) serving one year terms. Grants may be used for the design, construction or acquisition of new facilities, rehabilitation and repair of existing facilities or for any projects for targeted priorities including economic development/high technology, critical academic facilities, and urban renewal/historic preservation. The 2011-12 Executive Budget continues $150 million in reappropriation authority. To date, 123 capital projects committing $126 million in capital matching grants from the State have been approved. As a result, most of the $150 million in reappropriation authority is provided to honor existing grants. When fully implemented, this program will leverage over $450 million in external funds to match the State’s $150 million investment, thereby providing for a combined capital program totaling $600 million. The State’s share of the program will be financed through the issuance of bonds. Furthermore, the 2011-12 Executive Budget extends the Higher Education Capital Matching Grants Program past the original statutory date of March 31, 2011. This extension is necessary for the program to achieve full implementation.
ALL FUNDS APPROPRIATIONS
(dollars)
Category Available
2010-11
AppropriationsRecommended
2011-12 Change
ReappropriationsRecommended
2011-12State Operations 0 0 0 0 Aid To Localities 0 0 0 0 Capital Projects 0 0 0 93,000,000 Total 0 0 0 93,000,000
CAPITAL PROJECTS
ALL FUNDS FINANCIAL REQUIREMENTS BY PROGRAM APPROPRIATIONS
(dollars)
Comprehensive Construction Program Available
2010-11Recommended
2011-12 Change Reappropriations
2011-12Higher Education Capital Matching Grants
Capital Projects Fund - Authority Bonds 0 0 0 93,000,000 Total 0 0 0 93,000,000

MISCELLANEOUS
351
HOMELAND SECURITY Since Fall 2001, State agencies have deployed numerous resources to detect and protect against domestic security threats. The 2011-12 Executive Budget provides appropriations of $169 million to support a continuation of homeland security activities throughout New York State, including a $65 million contingency appropriation for costs of security measures implemented during periods of heightened threat alerts.
ALL FUNDS APPROPRIATIONS
(dollars)
Category Available
2010-11
AppropriationsRecommended
2011-12 Change
ReappropriationsRecommended
2011-12State Operations 168,000,000 169,000,000 1,000,000 140,700,000 Aid To Localities 0 0 0 200,000,000 Capital Projects 0 0 0 0 Total 168,000,000 169,000,000 1,000,000 340,700,000
STATE OPERATIONS
ALL FUNDS FINANCIAL REQUIREMENTS BY FUND TYPE APPROPRIATIONS
(dollars)
Fund Type Available
2010-11Recommended
2011-12 ChangeSpecial Revenue Funds - Federal 50,000,000 50,000,000 0 Special Revenue Funds - Other 3,000,000 9,000,000 6,000,000 Unspecified Funds 115,000,000 110,000,000 (5,000,000) Total 168,000,000 169,000,000 1,000,000 Adjustments: Transfer(s) From
Homeland Security - Miscellaneous Special Revenue Funds - Federal (Aid
To Localities) (50,000,000) Appropriated 2010-11 118,000,000
STATE OPERATIONS
ALL FUNDS FINANCIAL REQUIREMENTS BY PROGRAM APPROPRIATIONS
(dollars)
Program Available
2010-11Recommended
2011-12 ChangeDomestic Anti-Terrorism Program
Special Revenue Funds - Federal 50,000,000 50,000,000 0 Special Revenue Funds - Other 3,000,000 9,000,000 6,000,000 Unspecified Funds 115,000,000 110,000,000 (5,000,000)
Total 168,000,000 169,000,000 1,000,000

MISCELLANEOUS
352
STATE OPERATIONS - OTHER THAN GENERAL FUND SUMMARY OF APPROPRIATIONS AND CHANGES
2011-12 RECOMMENDED (dollars)
Total Nonpersonal Service Program Amount Change Amount ChangeDomestic Anti-Terrorism Program 169,000,000 1,000,000 50,000,000 0 Total 169,000,000 1,000,000 50,000,000 0 Maintenance Undistributed Program Amount Change Domestic Anti-Terrorism Program 119,000,000 1,000,000 Total 119,000,000 1,000,000
AID TO LOCALITIES
ALL FUNDS FINANCIAL REQUIREMENTS BY FUND TYPE APPROPRIATIONS
(dollars)
Fund Type Available
2010-11Recommended
2011-12 ChangeTotal 0 0 0 Adjustments: Transfer(s) To
Homeland Security - Miscellaneous Special Revenue Funds - Federal
(State Operations) 50,000,000 Appropriated 2010-11 50,000,000
HUDSON RIVER VALLEY GREENWAY COMMUNITIES COUNCIL
The Hudson River Valley Greenway Communities Council is a 25-member advisory board, created in 1991, which is responsible for promoting the preservation of natural and cultural resources in the Hudson River Valley. The Council’s operations are funded with State tax dollars from the General Fund. The Executive Budget recommends total appropriations of $321,000 in 2011-12, a decrease of $18,000 (-5 percent) from 2010-11, to support the Council’s administration, technical assistance, and local planning grants programs. This change reflects a 10 percent year-to-year reduction in State operations spending from the General Fund.
ALL FUNDS APPROPRIATIONS
(dollars)
Category Available
2010-11
AppropriationsRecommended
2011-12 Change
ReappropriationsRecommended
2011-12State Operations 203,000 185,000 (18,000) 0 Aid To Localities 136,000 136,000 0 758,000 Capital Projects 0 0 0 0 Total 339,000 321,000 (18,000) 758,000

MISCELLANEOUS
353
ALL FUND TYPES PROJECTED LEVELS OF EMPLOYMENT BY PROGRAM
FILLED ANNUAL SALARIED POSITIONS Full-Time Equivalent Positions (FTE)
Program
2010-11Estimated FTEs
03/31/11
2011-12Estimated FTEs
03/31/12 FTE ChangeOperations
General Fund 1 1 0 Total 1 1 0
The above table does not reflect layoffs that may be necessary in the absence of negotiated workforce savings.
STATE OPERATIONS
ALL FUNDS FINANCIAL REQUIREMENTS BY FUND TYPE APPROPRIATIONS
(dollars)
Fund Type Available
2010-11Recommended
2011-12 ChangeGeneral Fund 203,000 185,000 (18,000) Total 203,000 185,000 (18,000)
STATE OPERATIONS
ALL FUNDS FINANCIAL REQUIREMENTS BY PROGRAM APPROPRIATIONS
(dollars)
Program Available
2010-11Recommended
2011-12 ChangeOperations
General Fund 203,000 185,000 (18,000) Total 203,000 185,000 (18,000)
STATE OPERATIONS - GENERAL FUND
SUMMARY OF PERSONAL SERVICE APPROPRIATIONS AND CHANGES 2011-12 RECOMMENDED
(dollars)
Total Personal Service Regular
(Annual Salaried) Program Amount Change Amount ChangeOperations 152,000 (16,000) 152,000 (16,000) Total 152,000 (16,000) 152,000 (16,000)
STATE OPERATIONS - GENERAL FUND
SUMMARY OF NONPERSONAL SERVICE AND MAINTENANCE UNDISTRIBUTED APPROPRIATIONS AND CHANGES
2011-12 RECOMMENDED (dollars)
Total Supplies and Materials Program Amount Change Amount ChangeOperations 33,000 (2,000) 9,000 (1,000) Total 33,000 (2,000) 9,000 (1,000) Travel Contractual Services Program Amount Change Amount ChangeOperations 6,000 0 14,000 (1,000) Total 6,000 0 14,000 (1,000) Equipment Program Amount Change Operations 4,000 0 Total 4,000 0

MISCELLANEOUS
354
AID TO LOCALITIES ALL FUNDS FINANCIAL REQUIREMENTS BY FUND TYPE
APPROPRIATIONS (dollars)
Fund Type Available
2010-11Recommended
2011-12 ChangeGeneral Fund 136,000 136,000 0 Total 136,000 136,000 0
AID TO LOCALITIES
ALL FUNDS FINANCIAL REQUIREMENTS BY PROGRAM APPROPRIATIONS
(dollars)
Program Available
2010-11Recommended
2011-12 ChangeOperations
General Fund 136,000 136,000 0 Total 136,000 136,000 0
INSURANCE AND SECURITIES FUNDS RESERVE GUARANTEE
ALL FUNDS
APPROPRIATIONS (dollars)
Category Available
2010-11
AppropriationsRecommended
2011-12 Change
ReappropriationsRecommended
2011-12State Operations 1,605,000,000 1,605,000,000 0 0 Aid To Localities 0 0 0 0 Capital Projects 0 0 0 0 Total 1,605,000,000 1,605,000,000 0 0
STATE OPERATIONS
ALL FUNDS FINANCIAL REQUIREMENTS BY FUND TYPE APPROPRIATIONS
(dollars)
Fund Type Available
2010-11Recommended
2011-12 ChangeGeneral Fund 1,605,000,000 1,605,000,000 0 Total 1,605,000,000 1,605,000,000 0
STATE OPERATIONS
ALL FUNDS FINANCIAL REQUIREMENTS BY PROGRAM APPROPRIATIONS
(dollars)
Program Available
2010-11Recommended
2011-12 ChangeAggregate Trust Fund
General Fund 220,000,000 220,000,000 0 Property/Casualty Insurance Security Fund
General Fund 90,000,000 90,000,000 0 State Insurance Fund
General Fund 1,295,000,000 1,295,000,000 0 Total 1,605,000,000 1,605,000,000 0

MISCELLANEOUS
355
STATE OPERATIONS - GENERAL FUND SUMMARY OF NONPERSONAL SERVICE AND MAINTENANCE UNDISTRIBUTED
APPROPRIATIONS AND CHANGES 2011-12 RECOMMENDED
(dollars) Total Maintenance Undistributed Program Amount Change Amount ChangeAggregate Trust Fund 220,000,000 0 220,000,000 0 Property/Casualty Insurance Security Fund 90,000,000 0 90,000,000 0 State Insurance Fund 1,295,000,000 0 1,295,000,000 0 Total 1,605,000,000 0 1,605,000,000 0
LOCAL GOVERNMENT ASSISTANCE Local Government Assistance programs support a range of State aid and assistance for all classes of local governments. General Fund-supported programs include Aid and Incentives for Municipalities (AIM), which allocates direct State aid to cities, towns and villages, and the Local Government Efficiency Grant (LGEG) program, which provides grants to all classes of local governments intended to encourage municipal shared services and consolidation. BUDGET HIGHLIGHTS The Executive Budget recommends $847 million in All Funds appropriations to fund miscellaneous State aid and assistance programs, including $814 million in General Fund support to local governments under several aid programs and $30 million in Fiduciary Funds to cover contingency appropriation requirements. This is an increase of $41 million (5.1 percent) in All Funds appropriations over the 2010-11 budget, consisting primarily of a General Fund increase for new programs to incentivize local re-organization and efficiency. PROGRAM HIGHLIGHTS AID AND INCENTIVES FOR MUNICIPALITIES The Executive Budget recommends $794 million for the overall AIM program in 2011-12, an increase of $53.2 million (7.2 percent). Major program recommendations include:
$715 million in AIM funding to municipalities outside the City of New York. This allocation reduces funding to municipalities by $14.6 million (-2 percent). Even after these reductions, municipalities outside the City of New York will receive $249.3 million (53.6 percent) more than they did in 2004-05.
Maintain existing AIM policy for New York City. $75 million in appropriations for new programs designed to encourage and reward
local government re-organization and efficiency, including $35 million for Citizen Empowerment Tax Credits and Citizens Re-Organization Empowerment Grants and $40 million for Local Government Performance Incentive awards.

MISCELLANEOUS
356
Citizen Empowerment Tax Credits. These funds would be available to incentivize local government consolidation or dissolution, providing a bonus equal to 15 percent of the newly combined local government’s tax levy. At least 50 percent of such amount must be used for direct relief to property taxpayers.
Citizens Re-Organization Empowerment Grants. Funding for grants up to $100,000 would be available for local governments to cover costs associated with studies, plans and implementation efforts related to local government re-organization activities.
Local Government Performance and Efficiency Program. Funding would be available for competitive one-time awards of up to $25 per capita, capped at $5 million, to municipalities that have achieved significant performance improvements and operational efficiencies.
$4 million for a streamlined Local Government Efficiency Grant (LGEG) program. This allocation is $1 million less than 2009-10 and 2010-11, reflecting a partial shift of funding for local re-organization studies and planning grants from LGEG to the new Citizens Re-Organization Empowerment Grants.
OTHER LOCAL GOVERNMENT ASSISTANCE PROGRAMS In addition to AIM and the various efficiency and performance based programs, the Executive Budget recommends the following:
Providing $19.6 million of aid to the City of Yonkers as the host of a video lottery gaming facility. This allocation preserves such aid to Yonkers, but eliminates the $6.2 million (24 percent) of aid for all other eligible municipalities hosting such facilities.
Eliminating $3.92 million for Miscellaneous Financial Assistance. Oneida and Madison counties will no longer receive $1.96 million each for interim financial assistance related to land claim settlements.
Eliminating $2.09 million for the Small Government Assistance program, which provided funding to certain counties and school districts.
Providing $18.7 million in reappropriations for Efficiency Incentive Grants, which support cost-saving investments in Erie County and the City of Buffalo.
FIDUCIARY FUNDS Fiduciary appropriations totaling $30 million are recommended for the Municipal Assistance State Aid Fund and the Municipal Assistance Tax Fund to comply with the City of Troy Municipal Assistance Corporation’s debt service coverage requirements. This amount matches the total contingency appropriations made in 2010-11.

MISCELLANEOUS
357
ALL FUNDS APPROPRIATIONS
(dollars)
Category Available
2010-11
AppropriationsRecommended
2011-12 Change
ReappropriationsRecommended
2011-12State Operations 3,212,000 3,212,000 0 0 Aid To Localities 802,630,698 843,600,000 40,969,302 45,957,000 Capital Projects 0 0 0 0 Total 805,842,698 846,812,000 40,969,302 45,957,000
ALL FUND TYPES
PROJECTED LEVELS OF EMPLOYMENT BY PROGRAM FILLED ANNUAL SALARIED POSITIONS
Full-Time Equivalent Positions (FTE)
Program
2010-11Estimated FTEs
03/31/11
2011-12Estimated FTEs
03/31/12 FTE ChangeFinancial Control Board, New York State
Special Revenue Funds - Other 15 15 0 Total 15 15 0
STATE OPERATIONS
ALL FUNDS FINANCIAL REQUIREMENTS BY FUND TYPE APPROPRIATIONS
(dollars)
Fund Type Available
2010-11Recommended
2011-12 ChangeSpecial Revenue Funds - Other 3,212,000 3,212,000 0 Total 3,212,000 3,212,000 0
STATE OPERATIONS
ALL FUNDS FINANCIAL REQUIREMENTS BY PROGRAM APPROPRIATIONS
(dollars)
Program Available
2010-11Recommended
2011-12 ChangeFinancial Control Board, New York State
Special Revenue Funds - Other 3,212,000 3,212,000 0 Total 3,212,000 3,212,000 0
STATE OPERATIONS - OTHER THAN GENERAL FUND
SUMMARY OF APPROPRIATIONS AND CHANGES 2011-12 RECOMMENDED
(dollars) Total Personal Service Program Amount Change Amount ChangeFinancial Control Board, New York State 3,212,000 0 1,608,000 0 Total 3,212,000 0 1,608,000 0 Nonpersonal Service Program Amount Change Financial Control Board, New York State 1,604,000 0 Total 1,604,000 0

MISCELLANEOUS
358
AID TO LOCALITIES ALL FUNDS FINANCIAL REQUIREMENTS BY FUND TYPE
APPROPRIATIONS (dollars)
Fund Type Available
2010-11Recommended
2011-12 ChangeGeneral Fund 772,630,698 813,600,000 40,969,302 Fiduciary Funds 30,000,000 30,000,000 0 Total 802,630,698 843,600,000 40,969,302
AID TO LOCALITIES
ALL FUNDS FINANCIAL REQUIREMENTS BY PROGRAM APPROPRIATIONS
(dollars)
Program Available
2010-11Recommended
2011-12 ChangeAid and Incentives for Municipalities
General Fund 740,821,000 794,000,000 53,179,000 Miscellaneous Financial Assistance
General Fund 3,920,000 0 (3,920,000) Municipal Assistance State Aid Fund
Fiduciary Funds 15,000,000 15,000,000 0 Municipal Assistance Tax Fund
Fiduciary Funds 15,000,000 15,000,000 0 Municipalities with VLT Facilities
General Fund 25,801,000 19,600,000 (6,201,000) Small Government Assistance
General Fund 2,088,698 0 (2,088,698) Total 802,630,698 843,600,000 40,969,302
NATIONAL AND COMMUNITY SERVICE MISSION The Office of National and Community Service provides staff support to the New York State Commission on National and Community Service. The Commission qualifies the State for Federal community service grants for local not-for-profit agencies. The community service grants support programs providing youth education, assistance to individuals with disabilities, public health services and disaster preparedness. ORGANIZATION AND STAFFING The Office of National and Community Service is housed and staffed within the Office of Children and Family Services. BUDGET HIGHLIGHTS The Executive Budget recommends $30.7 million All Funds ($692,000 General Fund; $30 million Other Funds) for the Office of National and Community Service. This reflects a $6 million (-17 percent) reduction from 2010-11, primarily due to a loss of Federal American Reinvestment and Recovery Act (ARRA) Funds of $6 million and a 10 percent reduction (-$38,000) in General Fund State Operations appropriations. General Fund support of $342,000 allows the State to meet its match requirements. The remaining $350,000 will fund the regional volunteer centers initiative that was created in 2009-10.

MISCELLANEOUS
359
The Executive Budget reduces each agency’s General Fund State Operations budget by 10 percent. These savings are intended to be achieved through administrative efficiencies in non-personal service and negotiated workforce savings that minimize layoffs to the extent possible.
ALL FUNDS APPROPRIATIONS
(dollars)
Category Available
2010-11
AppropriationsRecommended
2011-12 Change
ReappropriationsRecommended
2011-12State Operations 36,380,000 30,342,000 (6,038,000) 110,253,000 Aid To Localities 350,000 350,000 0 850,000 Capital Projects 0 0 0 0 Total 36,730,000 30,692,000 (6,038,000) 111,103,000
ALL FUND TYPES
PROJECTED LEVELS OF EMPLOYMENT BY PROGRAM FILLED ANNUAL SALARIED POSITIONS
Full-Time Equivalent Positions (FTE)
Program
2010-11Estimated FTEs
03/31/11
2011-12Estimated FTEs
03/31/12 FTE ChangeOperations
General Fund 4 4 0 Special Revenue Funds - Federal 6 6 0
Total 10 10 0
The above table does not reflect layoffs that may be necessary in the absence of negotiated workforce savings.
STATE OPERATIONS
ALL FUNDS FINANCIAL REQUIREMENTS BY FUND TYPE APPROPRIATIONS
(dollars)
Fund Type Available
2010-11Recommended
2011-12 ChangeGeneral Fund 380,000 342,000 (38,000) Special Revenue Funds - Federal 36,000,000 30,000,000 (6,000,000) Total 36,380,000 30,342,000 (6,038,000)
STATE OPERATIONS
ALL FUNDS FINANCIAL REQUIREMENTS BY PROGRAM APPROPRIATIONS
(dollars)
Program Available
2010-11Recommended
2011-12 ChangeOperations
General Fund 380,000 342,000 (38,000) Special Revenue Funds - Federal 36,000,000 30,000,000 (6,000,000)
Total 36,380,000 30,342,000 (6,038,000)

MISCELLANEOUS
360
STATE OPERATIONS - GENERAL FUND SUMMARY OF PERSONAL SERVICE APPROPRIATIONS AND CHANGES
2011-12 RECOMMENDED (dollars)
Total Personal Service Regular
(Annual Salaried) Program Amount Change Amount ChangeOperations 333,900 (37,100) 329,400 (36,600) Total 333,900 (37,100) 329,400 (36,600)
Holiday/Overtime Pay
(Annual Salaried) Program Amount Change Operations 4,500 (500) Total 4,500 (500)
STATE OPERATIONS - GENERAL FUND
SUMMARY OF NONPERSONAL SERVICE AND MAINTENANCE UNDISTRIBUTED APPROPRIATIONS AND CHANGES
2011-12 RECOMMENDED (dollars)
Total Supplies and Materials Program Amount Change Amount ChangeOperations 8,100 (900) 1,800 (200) Total 8,100 (900) 1,800 (200) Contractual Services Program Amount Change Operations 6,300 (700) Total 6,300 (700)
STATE OPERATIONS - OTHER THAN GENERAL FUND
SUMMARY OF APPROPRIATIONS AND CHANGES 2011-12 RECOMMENDED
(dollars) Total Personal Service Program Amount Change Amount ChangeOperations 30,000,000 (6,000,000) 1,000,000 0 Total 30,000,000 (6,000,000) 1,000,000 0 Nonpersonal Service Maintenance Undistributed Program Amount Change Amount ChangeOperations 29,000,000 0 0 (6,000,000) Total 29,000,000 0 0 (6,000,000)
AID TO LOCALITIES
ALL FUNDS FINANCIAL REQUIREMENTS BY FUND TYPE APPROPRIATIONS
(dollars)
Fund Type Available
2010-11Recommended
2011-12 ChangeGeneral Fund 350,000 350,000 0 Total 350,000 350,000 0

MISCELLANEOUS
361
AID TO LOCALITIES ALL FUNDS FINANCIAL REQUIREMENTS BY PROGRAM
APPROPRIATIONS (dollars)
Program Available
2010-11Recommended
2011-12 ChangeOperations
General Fund 350,000 350,000 0 Total 350,000 350,000 0
NEW YORK POWER AUTHORITY ASSET TRANSFER PROGRAM
ALL FUNDS
APPROPRIATIONS (dollars)
Category Available
2010-11
AppropriationsRecommended
2011-12 Change
ReappropriationsRecommended
2011-12State Operations 318,000,000 318,000,000 0 0 Aid To Localities 0 0 0 0 Capital Projects 0 0 0 0 Total 318,000,000 318,000,000 0 0
STATE OPERATIONS - GENERAL FUND
SUMMARY OF NONPERSONAL SERVICE AND MAINTENANCE UNDISTRIBUTED APPROPRIATIONS AND CHANGES
2011-12 RECOMMENDED (dollars)
Total Maintenance Undistributed Program Amount Change Amount ChangeNew York Power Authority Asset Transfer
Program 318,000,000 0 318,000,000 0 Total 318,000,000 0 318,000,000 0
PAYMENT TO THE CITY OF NEW YORK This local assistance appropriation is required pursuant to Section 3238-a of the Public Authorities Law and is related to the refinancing of prior New York City Municipal Assistance Corporation debt by the Sales Tax Asset Receivable Corporation (STARC), a local development corporation established by the City of New York.
ALL FUNDS APPROPRIATIONS
(dollars)
Category Available
2010-11
AppropriationsRecommended
2011-12 Change
ReappropriationsRecommended
2011-12State Operations 0 0 0 0 Aid To Localities 170,000,000 170,000,000 0 0 Capital Projects 0 0 0 0 Total 170,000,000 170,000,000 0 0

MISCELLANEOUS
362
AID TO LOCALITIES ALL FUNDS FINANCIAL REQUIREMENTS BY FUND TYPE
APPROPRIATIONS (dollars)
Fund Type Available
2010-11Recommended
2011-12 ChangeGeneral Fund 170,000,000 170,000,000 0 Total 170,000,000 170,000,000 0
AID TO LOCALITIES
ALL FUNDS FINANCIAL REQUIREMENTS BY PROGRAM APPROPRIATIONS
(dollars)
Program Available
2010-11Recommended
2011-12 ChangeSTARC Payment
General Fund 170,000,000 170,000,000 0 Total 170,000,000 170,000,000 0
RACING REFORM PROGRAM The Racing Reform Program’s appropriations were originally established to facilitate and finance activities associated with the implementation of Chapter 354 of the Laws of 2005. Subsequently, the Legislature enacted further reforms to the New York Racing Association in Chapters 18 and 140 of the Laws of 2008. The 2011-12 Executive Budget recommends reappropriations of $2 million, which are available to finance any State costs resulting from this legislation.
ALL FUNDS APPROPRIATIONS
(dollars)
Category Available
2010-11
AppropriationsRecommended
2011-12 Change
ReappropriationsRecommended
2011-12State Operations 0 0 0 2,000,000 Aid To Localities 0 0 0 0 Capital Projects 0 0 0 0 Total 0 0 0 2,000,000
RESERVE FOR FEDERAL AUDIT DISALLOWANCES The Reserve for Federal Audit Disallowances provides authority to the General Fund in the event of a reduction in available Federal grant awards resulting from disallowances. This reserve is available to provide State funding to cover unusual instances in which legitimate expenditures are determined to be ineligible for federal reimbursement. The 2011-12 Executive Budget recommends an appropriation consistent with the prior year.

MISCELLANEOUS
363
STATE OPERATIONS ALL FUNDS FINANCIAL REQUIREMENTS BY FUND TYPE
APPROPRIATIONS (dollars)
Fund Type Available
2010-11Recommended
2011-12 ChangeGeneral Fund 200,000,000 200,000,000 0 Total 200,000,000 200,000,000 0
ROOSEVELT ISLAND OPERATING CORPORATION The Roosevelt Island Operating Corporation of the State of New York (RIOC) was created by the New York State Legislature in 1984. Its mandate is to manage, develop and operate the 147-acre Roosevelt Island, located in New York City’s East River, in the borough of Manhattan. RIOC has promoted the development of a mixed-use, residential and commercial community that is home to more than 12,000 residents. The island has six historic landmarks, several parks, sports facilities, an aerial tramway, playgrounds and a waterfront promenade. RIOC continues to develop and maintain utilities, public promenades and commercial opportunities on the island to support private development. The RIOC Board of Directors recently approved the planning and design of the Franklin Delano Roosevelt Four Freedoms Park to be located at the southernmost tip of Roosevelt Island and to be supported by funding from New York State, New York City and the Franklin and Eleanor Roosevelt Institute. The 2011-12 Executive Budget recommends reappropriation of $1 million appropriated in 2009-10 for the park.
ALL FUNDS APPROPRIATIONS
(dollars)
Category Available
2010-11
AppropriationsRecommended
2011-12 Change
ReappropriationsRecommended
2011-12State Operations 0 0 0 0 Aid To Localities 0 0 0 0 Capital Projects 0 0 0 1,157,000 Total 0 0 0 1,157,000
CAPITAL PROJECTS
ALL FUNDS FINANCIAL REQUIREMENTS BY PROGRAM APPROPRIATIONS
(dollars)
Comprehensive Construction Program Available
2010-11Recommended
2011-12 Change Reappropriations
2011-12Design and Construction Supervision
Capital Projects Fund 0 0 0 1,157,000 Total 0 0 0 1,157,000

MISCELLANEOUS
364
SPECIAL EMERGENCY APPROPRIATION The Special Emergency Appropriation provides authority for the disbursement of additional State Funds in the event of an unanticipated emergency affecting the State of New York, such as a natural disaster. The 2011-12 Executive Budget recommends an appropriation consistent with the prior year.
ALL FUNDS APPROPRIATIONS
(dollars)
Category Available
2010-11
AppropriationsRecommended
2011-12 Change
ReappropriationsRecommended
2011-12State Operations 100,000,000 100,000,000 0 0 Aid To Localities 0 0 0 0 Capital Projects 0 0 0 0 Total 100,000,000 100,000,000 0 0
SPECIAL FEDERAL EMERGENCY APPROPRIATION The Special Federal Emergency Appropriation provides authority for the disbursement of funds received by the Federal Government in the event of an unanticipated emergency affecting the State of New York, such as a natural disaster. The 2011-12 Executive Budget recommends an appropriation consistent with the prior year.
AID TO LOCALITIES ALL FUNDS FINANCIAL REQUIREMENTS BY FUND TYPE
APPROPRIATIONS (dollars)
Fund Type Available
2010-11Recommended
2011-12 ChangeSpecial Revenue Funds - Federal 1,000,000,000 1,000,000,000 0 Total 1,000,000,000 1,000,000,000 0
SPECIAL PAY BILL These appropriations were enacted in pay bills which implemented the two-year collective bargaining agreements (2007-2009) for the Security Supervisors Unit, represented by the New York State Law Enforcement Officers’ Union, District Council 82, AFSCME, AFL-CIO, and the Security Services Unit (arbitration ineligible), represented by the New York State Correctional Officers and Police Benevolent Association, Inc.. All monies authorized by these appropriations have been allocated to the employing agencies in 2010-11 and no funding for this special pay bill agency is necessary in 2011-12.
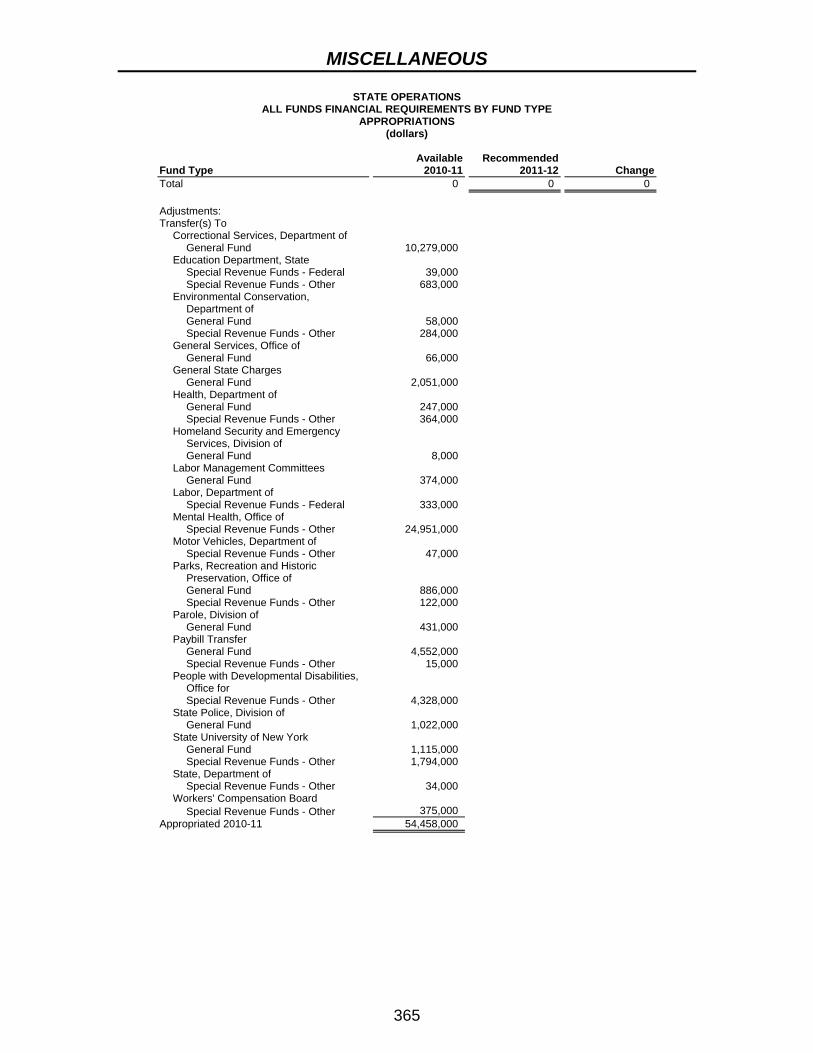
MISCELLANEOUS
365
STATE OPERATIONS ALL FUNDS FINANCIAL REQUIREMENTS BY FUND TYPE
APPROPRIATIONS (dollars)
Fund Type Available
2010-11Recommended
2011-12 ChangeTotal 0 0 0 Adjustments: Transfer(s) To
Correctional Services, Department of General Fund 10,279,000
Education Department, State Special Revenue Funds - Federal 39,000 Special Revenue Funds - Other 683,000
Environmental Conservation, Department of General Fund 58,000 Special Revenue Funds - Other 284,000
General Services, Office of General Fund 66,000
General State Charges General Fund 2,051,000
Health, Department of General Fund 247,000 Special Revenue Funds - Other 364,000
Homeland Security and Emergency Services, Division of General Fund 8,000
Labor Management Committees General Fund 374,000
Labor, Department of Special Revenue Funds - Federal 333,000
Mental Health, Office of Special Revenue Funds - Other 24,951,000
Motor Vehicles, Department of Special Revenue Funds - Other 47,000
Parks, Recreation and Historic Preservation, Office of General Fund 886,000 Special Revenue Funds - Other 122,000
Parole, Division of General Fund 431,000
Paybill Transfer General Fund 4,552,000 Special Revenue Funds - Other 15,000
People with Developmental Disabilities, Office for Special Revenue Funds - Other 4,328,000
State Police, Division of General Fund 1,022,000
State University of New York General Fund 1,115,000 Special Revenue Funds - Other 1,794,000
State, Department of Special Revenue Funds - Other 34,000
Workers' Compensation Board Special Revenue Funds - Other 375,000
Appropriated 2010-11 54,458,000

MISCELLANEOUS
366
STATE EQUIPMENT FINANCING PROGRAM Statewide equipment represents spending for major equipment purchases and information systems research, development, and upgrades across all State agencies.
ALL FUNDS APPROPRIATIONS
(dollars)
Category Available
2010-11
AppropriationsRecommended
2011-12 Change
ReappropriationsRecommended
2011-12State Operations 0 0 0 0 Aid To Localities 0 0 0 0 Capital Projects 187,285,000 92,751,000 (94,534,000) 231,123,000 Total 187,285,000 92,751,000 (94,534,000) 231,123,000
CAPITAL PROJECTS
ALL FUNDS FINANCIAL REQUIREMENTS BY PROGRAM APPROPRIATIONS
(dollars)
Comprehensive Construction Program Available
2010-11Recommended
2011-12 Change Reappropriations
2011-12Program Changes and Expansion
Capital Projects Fund - Authority Bonds 187,285,000 92,751,000 (94,534,000) 231,123,000 Total 187,285,000 92,751,000 (94,534,000) 231,123,000
TRIBAL STATE COMPACT REVENUE State Finance Law requires that, in instances where the State receives Native American casino revenues pursuant to a compact with the respective Tribe, the State must provide local host governments with up to 25 percent of the State’s share of compact revenues. Accordingly, the Executive Budget recommends $44.3 million, which represents 25 percent of the State’s estimated revenues from Native American casinos located in Buffalo, Niagara Falls, Salamanca and Hogansburg.
ALL FUNDS APPROPRIATIONS
(dollars)
Category Available
2010-11
AppropriationsRecommended
2011-12 Change
ReappropriationsRecommended
2011-12State Operations 0 0 0 0 Aid To Localities 39,100,000 44,300,000 5,200,000 87,494,000 Capital Projects 0 0 0 0 Total 39,100,000 44,300,000 5,200,000 87,494,000
AID TO LOCALITIES
ALL FUNDS FINANCIAL REQUIREMENTS BY FUND TYPE APPROPRIATIONS
(dollars)
Fund Type Available
2010-11Recommended
2011-12 ChangeSpecial Revenue Funds - Other 39,100,000 44,300,000 5,200,000 Total 39,100,000 44,300,000 5,200,000

MISCELLANEOUS
367
AID TO LOCALITIES ALL FUNDS FINANCIAL REQUIREMENTS BY PROGRAM
APPROPRIATIONS (dollars)
Program Available
2010-11Recommended
2011-12 ChangeTribal-State Compact Revenue Program
Special Revenue Funds - Other 39,100,000 44,300,000 5,200,000 Total 39,100,000 44,300,000 5,200,000
WORKERS’ COMPENSATION RESERVE
ALL FUNDS APPROPRIATIONS
(dollars)
Category Available
2010-11
AppropriationsRecommended
2011-12 Change
ReappropriationsRecommended
2011-12State Operations 18,030,000 16,130,000 (1,900,000) 0 Aid To Localities 0 0 0 0 Capital Projects 0 0 0 0 Total 18,030,000 16,130,000 (1,900,000) 0
STATE OPERATIONS - GENERAL FUND
SUMMARY OF NONPERSONAL SERVICE AND MAINTENANCE UNDISTRIBUTED APPROPRIATIONS AND CHANGES
2011-12 RECOMMENDED (dollars)
Total Maintenance Undistributed Program Amount Change Amount ChangeWorkers' Compensation Reserve 16,130,000 (1,900,000) 16,130,000 (1,900,000) Total 16,130,000 (1,900,000) 16,130,000 (1,900,000)
WORLD TRADE CENTER REBUILDING AND REVITALIZATION
The recommended reappropriations will facilitate the continuation of New York State’s efforts to revitalize the World Trade Center property and lower Manhattan. Recommendations will provide ongoing authorization for payments associated with the engineering and construction of State capital projects in lower Manhattan, including the reconstruction and improvement of Route 9A, and September 11th-related expenses.
ALL FUNDS APPROPRIATIONS
(dollars)
Category Available
2010-11
AppropriationsRecommended
2011-12 Change
ReappropriationsRecommended
2011-12State Operations 0 0 0 0 Aid To Localities 0 0 0 39,000,000 Capital Projects 0 0 0 295,132,000 Total 0 0 0 334,132,000

MISCELLANEOUS
368
CAPITAL PROJECTS ALL FUNDS FINANCIAL REQUIREMENTS BY PROGRAM
APPROPRIATIONS (dollars)
Comprehensive Construction Program Available
2010-11Recommended
2011-12 Change Reappropriations
2011-12World Trade Center
Federal Capital Projects Fund 0 0 0 295,132,000 Total 0 0 0 295,132,000

369
STATE DEBT SERVICE AND FINANCING AGREEMENT PAYMENTS
INTRODUCTION The 2011-12 recommended debt service appropriations meet all of the State’s potential obligations to bondholders, and reflect the maximum estimated debt service payments for outstanding bonds, including payments due on outstanding variable rate debt, interest rate exchange agreements (“swaps”) and new State-supported bond issuances. A broad overview of the State’s debt management practices, debt affordability measures, and five year information and trends on State debt levels and capital costs is available in the Five-Year Capital Program and Financing Plan released with the budget. OPERATING HIGHLIGHTS Debt financing is used to partially finance the State’s capital program, providing necessary funding for transportation, education, economic development, and other major program areas. State-related debt – a comprehensive measure which includes debt issued by the State, by public authorities on behalf of the State, and other debt obligations for which the State is contractually or morally responsible – is projected to grow from $56.4 billion in 2010-11 to $58.1 billion by the end of 2011-12. Debt service spending – the costs of repaying those debt obligations – is projected to grow from $6.0 billion in 2010-11 to approximately $6.6 billion by the end of 2011-12. KEY STRATEGIES The 2011-12 Executive Budget seeks to reduce the State’s costs of borrowing through a number of debt management efforts. These are expected to produce debt service savings totaling approximately $11.5 million in 2011-12 and include the following.
Extending opportunities for increased efficiencies and savings with the Personal Income Tax Revenue Bond Program through continued issuer flexibility.
Using competitive bond sales for up to 50 percent of State-supported debt issuances, subject to market conditions.
Continuing to refund higher cost debt, including refunding older service contract bonds under a consolidated credit structure, thereby enhancing efficiencies and increasing savings opportunities.
GENERAL DEBT SERVICE FUND The General Debt Service Fund pays for debt service and related expenses on fixed and variable rate General Obligation bonds, Personal Income Tax revenue bonds, and lease-purchase and contractual obligation payments to public authorities. The General Debt Service Fund’s moneys are provided from the General Fund, dedicated personal income taxes, and other available transfers and revenues. Total appropriations of $5.0 billion are recommended from the General Debt Service Fund. These amounts include contingent appropriations for obligations related to deficit (tobacco securitization) and secured hospital financings, which are more fully discussed in the Contingent and Other Appropriations section.

DEBT SERVICE
370
General Obligation Bonds Appropriations from the General Debt Service Fund for general obligation bonds are recommended at $530 million and reflect payments on outstanding fixed rate and variable rate general obligation bonds and estimated payments on new bonds anticipated to be issued. Lease Purchase Obligations Appropriations of $2.9 million are recommended for lease-purchase payments for various State facilities, including the Department of Transportation Region One headquarters building in Schenectady and other facilities. Special Contractual Obligations Appropriations of $1.7 billion are recommended from the General Debt Service Fund to the following public authorities for special contractual obligations due on outstanding State appropriation-backed bonds:
Thruway Authority for Local Highway and Bridge service contract bonds for local transportation purposes ($205 million). Spending from this appropriation is financed by transfers from the Dedicated Highway and Bridge Trust Fund.
Environmental Facilities Corporation for environmental infrastructure service contract bonds, the Pipeline for Jobs Program, and the financing of parks and other environmental programs ($28 million).
Urban Development Corporation for financing the construction and rehabilitation of prisons, State facilities, youth facilities, the pine barrens land acquisition, economic development purposes, projects at various university technology centers, the Higher Education Applied Technology program, and the Onondaga Convention Center ($446 million).
Dormitory Authority of the State of New York for State University of New York educational facilities, athletic facilities and upstate community colleges, State Education Department facilities, City University of New York senior and community colleges, RESCUE school construction, child care facilities, the Department of Health’s Axelrod Laboratory, the Albany Airport, the Department of Audit and Control building, and the East Garage in Albany ($713 million).
Housing Finance Agency pursuant to agreements to finance the State’s housing programs ($34 million).
Triborough Bridge and Tunnel Authority for the Javits Convention Center in New York City ($43 million).
Metropolitan Transportation Authority for service contract payments on bonds issued to finance transit and commuter rail projects ($165 million).
Related and capital expenses ($29 million). Revenue Bond Tax Fund The appropriations for 2011-12 reflect the continued use of the Personal Income Tax revenue bond program (rated AAA by Standard and Poor’s) to reduce State borrowing costs. Appropriations of $2.4 billion are recommended from the Revenue Bond Tax Fund, an account within the General Debt Service Fund that provides for the payment of

DEBT SERVICE
371
Personal Income Tax Revenue bonds. These bonds are secured by the pledge of payments from the Revenue Bond Tax Fund, which receives 25 percent of State personal income tax receipts. Tax receipts in excess of debt service requirements are then transferred back to the State’s General Fund. Personal Income Tax revenue bonds are issued under broad functional areas by certain public authorities and are provided as follows:
Economic Development and Housing ($385 million); Education ($470 million); Environment ($105 million); General Purpose ($940 million) Health care ($15 million); State Facilities and Equipment ($200 million); Transportation ($275 million); and Related and capital expenses ($18 million).
HOUSING DEBT FUND Payments from local governments and housing companies that benefit from housing and urban renewal projects funded with State general obligation bonds are deposited in the Housing Debt Fund and are used to pay debt service on such bonds. A $15.5 million appropriation is recommended for 2011-12. HEALTH INCOME FUND The Department of Health has entered into contractual agreements with the Dormitory Authority of the State of New York to finance the construction and rehabilitation of State hospitals and veterans’ homes. These agreements require the Department of Health to make lease-purchase rental payments to the Dormitory Authority of the State of New York. Such payments have first claim on revenues received in this Fund from patient care at the Department of Health facilities. Consistent with existing bonding pledges and statutory requirements, the Roswell Park Cancer Institute Corporation’s moneys continue to flow into the Fund as security for payments to bondholders. As a result, the State’s Financial Plan reflects the portion of the Corporation’s receipts that are attributable to debt service. Lease-purchase obligations during 2011-12 require appropriations of $34.8 million. STATE UNIVERSITY DORMITORY INCOME FUND This Fund receives payments from student dormitory rentals and other fees at dormitories operated by the State University of New York. Debt service on bonds issued by the Dormitory Authority of the State of New York for the construction and rehabilitation of the State University of New York dormitory facilities has first claim on all revenues deposited in the Fund. An appropriation of $105.3 million is recommended for lease-purchase payments to the Dormitory Authority of the State of New York.

DEBT SERVICE
372
MENTAL HEALTH SERVICES FUND The Dormitory Authority of the State of New York is authorized to issue bonds to finance capital programs for the Department of Mental Hygiene. Patient revenues received from care and treatment activities at State mental health facilities are deposited into the Mental Health Services Fund, and are used to make payments to the Dormitory Authority of the State of New York for debt service on mental health services bonds. These payments have first claim on moneys in the Fund. The Dormitory Authority of the State of New York also makes loans to eligible not-for-profit agencies providing mental health services. In return, these voluntary agencies make rental payments equal to the amount of debt service on bonds issued to finance their projects. These payments are also deposited in the Fund. The recommended appropriation for these obligations is $353 million. LOCAL GOVERNMENT ASSISTANCE TAX FUND To eliminate the State’s annual cash flow borrowing to finance payments in the first quarter of the State Fiscal Year, 1990 legislation authorized the Local Government Assistance Corporation to issue bonds to finance payments to local governments previously funded by the State. By 1995, the Corporation had issued its entire $4.7 billion net authorization, and its activities are now primarily limited to the ongoing maintenance of those existing obligations. Revenues equal to the first cent of the four cent State sales and use tax are deposited into the Local Government Assistance Tax Fund and used to pay debt service on the Local Government Assistance Corporation bonds. The recommended appropriation of $392 million represents anticipated debt service on all outstanding fixed and variable rate bonds, interest rate exchange agreement payments and related administrative expenses. Local aid payments due to New York City from the Local Government Assistance Tax Fund, and assigned by the City to the Sales Tax Asset Receivable Corporation, are appropriated in the local assistance portion of the budget. SCHOOL CAPITAL FACILITIES FINANCING RESERVE FUND An appropriation of $30.5 million is recommended from the School Capital Facilities Financing Reserve Fund, a fiduciary fund, to pay debt service and related expenses on bonds issued by the Dormitory Authority of the State of New York on behalf of special act and certain other authorized local school districts. The districts have assigned to the Dormitory Authority of the State of New York their State local assistance payments, which are deposited into the Fund and used to make debt service payments on bonds issued to finance their respective facilities. DEDICATED HIGHWAY AND BRIDGE TRUST FUND An appropriation of $960.3 million is recommended to the Thruway Authority for 2011-12 debt service payments and related expenses on Dedicated Highway and Bridge Trust Fund bonds. Debt service payments for the highway program are supported by the statutory dedication of transportation-related taxes and fees to the Fund.

DEBT SERVICE
373
DEBT REDUCTION RESERVE FUND An appropriation of $250 million is recommended from the Debt Reduction Reserve Fund to allow the State flexibility to defease high cost debt and/or pay hard dollar for capital projects that would otherwise be financed with debt. No disbursements are anticipated from this appropriation in 2011-12. CONTINGENT AND OTHER APPROPRIATIONS Contingent and other appropriations are required pursuant to various bond financing agreements. Therefore, they supply appropriation authority in the unlikely event that the primary obligated parties cannot provide sufficient funds to meet their own debt service obligations, or to pay unforeseen additional expenses that may arise on State-supported obligations. Appropriations of $2.1 billion are recommended in this section of the debt service appropriation bill to provide for the State’s contingent liabilities to make payments on certain other types of debt instruments. These include arbitrage rebate and defeasance obligations required by Federal tax code limitations, the maximum potential variable rate, swap, termination or other payments on State-supported debt obligations, as well as contingent-contractual obligations for deficit (tobacco securitization) and secured hospital bonds. The State does not anticipate making disbursements from the secured hospital appropriations during the 2011-12 fiscal year, depending on developments related to certain health care facilities. It does not anticipate disbursements for any of the other appropriations described in this section. General Fund – State Purposes Account An appropriation of $20 million is recommended for the State’s potential liability to rebate arbitrage earnings on General Obligation bonds to the Federal government. In addition, a $225 million appropriation is recommended for the redemption of General Obligation bonds, should this become necessary to maintain the exemption from Federal taxation of the interest paid to General Obligation bondholders. This appropriation would only be used if the State received payments from any party found to be responsible for site contamination for which 1986 Hazardous Waste and 1996 Clean Water/Clean Air bonds were sold and disbursed to finance site clean-ups. The potential use of this appropriation is unlikely, as an effort is made to find the responsible parties prior to the issuance of bonds. All Funds An All Funds appropriation of $1.5 billion provides authority for a maximum interest rate of 18 percent on variable rate bonds, and the estimated costs for potential terminations on all interest rate exchange agreements outstanding, under Article 5-D of the State Finance Law. This appropriation is available to all issuers of State-supported debt, and provides assurances to bondholders and counterparties of interest rate exchange agreements that sufficient authorization is available to pay the maximum amounts which may become due on such variable rate and swap instruments. In addition, it provides the State the flexibility needed to comprehensively manage such instruments and State-supported obligations consistent with stressed market conditions, including the ability to terminate swap agreements and effectively manage risks.

DEBT SERVICE
374
Secured Hospitals This appropriation is provided to the Dormitory Authority of the State of New York for contingent-contractual obligations related to financially distressed hospitals in the event that hospital loan repayments and other available funds are inadequate to meet debt service and related expenses ($84 million). Legislative authorization for new projects in this program expired in March 1998. Tobacco Settlement Financing Corporation This appropriation is provided to the Tobacco Settlement Financing Corporation for contingent-contractual obligations that are available to pay debt service on bonds issued by the Corporation to help eliminate a deficit in 2003-04. Such funds would only be called upon in the unlikely event that tobacco receipts sold to the Tobacco Settlement Financing Corporation are insufficient to make such payments. As required by the contingent contract, the debt service bill includes a recommended appropriation that is equal to amounts payable on the Corporation’s bonds in 2011-12 ($306 million).

DEBT SERVICE
375
ALL FUNDS FISCAL REQUIREMENTS DEBT SERVICE AND FINANCING AGREEMENT PAYMENTS
(dollars)
Fund Available
2010-11Recommended
2011-12 ChangeGeneral Fund
State Operations Account Rebates to Federal Government 20,000,000 20,000,000 0 Redemption of General Obligation Bonds 225,000,000 225,000,000 0
Subtotal 245,000,000 245,000,000 0 Fiduciary Funds
School Capital Facilities Financing Reserve Fund Trust and Agency Financing 30,500,000 30,500,000 0
Subtotal 30,500,000 30,500,000 0 Debt Service Funds
Debt Reduction Reserve Fund Debt Reduction 250,000,000 250,000,000 0
Mental Health Services Fund Financing Agreements 375,000,000 353,000,000 (22,000,000)
General Debt Service Fund General Obligation Bonds 515,000,000 530,000,000 15,000,000 Financing Agreements 2,179,700,000 2,052,050,000 (127,650,000)Revenue Bond Payments 2,093,800,000 2,408,350,000 314,550,000 Lease Purchase Payments 39,875,000 2,925,000 (36,950,000)
Housing Debt Fund General Obligation Bonds 16,500,000 15,500,000 (1,000,000)
Department of Health Income Financing Agreements 32,000,000 32,000,000 0 Financing Agreements 1,700,000 2,800,000 1,100,000
State University Dormitory Income Fund Financing Agreements 91,000,000 105,300,000 14,300,000
Local Government Assistance Tax Fund Financing Agreements 398,000,000 392,000,000 (6,000,000)
Subtotal 5,992,575,000 6,143,925,000 151,350,000 Capital Projects Funds - Other
Dedicated Highway and Bridge Trust Fund Financing Agreements 920,200,000 960,250,000 40,050,000
Subtotal 920,200,000 960,250,000 40,050,000 All Funds
All Funds Contingent Appropriation 2,100,000,000 1,500,000,000 (600,000,000)
Subtotal 2,100,000,000 1,500,000,000 (600,000,000) Total Fiscal Year 9,288,275,000 8,879,675,000 (408,600,000) Appropriated 2010-11 9,288,275,000

376
COMMENTARY OF THE GOVERNOR ON THE JUDICIARY
In accordance with Article VII, Section 1 of the State Constitution, I transmit herewith the appropriations requested by the Judiciary for fiscal year 2011-12. As required by the Constitution, I present the Judiciary budget as it has been submitted by the Chief Judge. The Judiciary has requested appropriations that total over $2.7 billion. This reflects an increased appropriation of 1.9 percent, or $50 million, from last year. The proposed Judiciary budget also reflects, on a cash basis, a spending increase of 5.3 percent, or $140 million. In this economy, New York State government must recalibrate, redesign and rebuild. We cannot afford spending increases. Indeed, the State must reduce spending. I have proposed a ten percent General Fund reduction for all State agency operations from 2010-11; the Comptroller and the Attorney General have proposed the same reduction in their spending. In order to address the fiscal realities confronting the State, I respectfully ask the Judicial Branch to reduce its spending while continuing to serve those who seek justice.

377
JUDICIARY 2011-12 BUDGET REQUEST
INTRODUCTION
THE UNIFIED COURT SYSTEM The Judiciary is one of the three branches of New York State Government. Article VI of the State Constitution establishes a Unified Court System (UCS), defines the organization and jurisdiction of the courts and provides for the administrative supervision of the courts by a Chief Administrator on behalf of the Chief Judge of the State of New York. The objectives of the Judiciary are to: (1) provide a forum for the peaceful, fair and prompt resolution of civil claims and family disputes, criminal charges and charges of juvenile delinquency, disputes between citizens and their government, and challenges to government actions; (2) supervise the administration of estates of decedents, consider adoption petitions, and preside over matters involving the dissolution of marriages; (3) provide legal protection for children, mentally ill persons and others entitled by law to the special protection of the courts; and, (4) regulate the admission of lawyers to the Bar and their conduct and discipline. The New York State court system is one of the largest and busiest in the Western World. It consists of nearly 1,300 state-paid judges, 2,300 town and village justices and approximately 17,000 nonjudicial employees. Pursuant to the Unified Court Budget Act, the cost of operating the UCS, excluding town and village courts, is borne by the State. STRUCTURE AND JURISDICTION OF THE COURTS The Unified Court System is structured as follows:
APPELLATE COURTS
Court of Appeals Appellate Divisions of the Supreme Court Appellate Terms of the Supreme Court County Courts (acting as appellate courts)
TRIAL COURTS OF SUPERIOR
JURISDICTION
Statewide: Supreme Court Court of Claims Family Court Surrogate's Court
Outside New York City: County Court
TRIAL COURTS OF LIMITED
JURISDICTION
New York City: Criminal Court Civil Court
Outside New York City: City Courts District Courts Town Courts* Village Courts*
*Locally funded courts

JUDICIARY
378
The jurisdiction of each court is established by Article VI of the Constitution or by statute. The Courts of Original Jurisdiction, or trial courts, hear cases in the first instance, and the appellate courts hear and determine appeals from the decisions of the trial courts. The Court of Appeals, the State's highest court, hears cases on appeal from the other appellate courts and, in some instances, from the Courts of Original Jurisdiction. The jurisdiction of the Court is established in section 3 of Article VI of the Constitution. In most cases, its review is limited to questions of law. The Court also reviews determinations of the Commission on Judicial Conduct. There are four Appellate Divisions of the Supreme Court, one in each of the State's four judicial departments. The Appellate Divisions hear appeals from judgments or orders in civil and criminal cases. In the 1st and 2nd Departments, Appellate Terms have been established to hear appeals in criminal and civil cases determined in the Criminal and Civil Courts of the City of New York and civil and criminal cases determined in district, city, town, and village courts outside the City. In the 3rd and 4th Departments, appeals from city, town and village courts are heard initially in the appropriate county court. The Supreme Court, which functions in each of the State’s thirteen judicial districts, is a trial court of unlimited, original jurisdiction, but it generally hears cases outside the jurisdiction of other courts. It exercises its civil jurisdiction statewide; in the City of New York and some other parts of the State, it also exercises jurisdiction over felony charges. The Court of Claims is a statewide court having jurisdiction over claims for money damages against the State. Certain judges of the Court of Claims; i.e., judges appointed pursuant to paragraphs (b), (d), and (e) of subdivision 2 of section 2 of the Court of Claims Act, are assigned temporarily to the Supreme Court. There are three county-level superior courts. The County Court is established in each county outside the City of New York. It is authorized to handle the prosecution of crimes committed within the county. In practice, however, arraignments and other preliminary proceedings on felonies, misdemeanors and minor offenses are handled by courts of limited jurisdiction, while the County Court presides over felony trials and supervises the Grand Jury. The County Court also has limited jurisdiction in civil cases with authority to entertain those involving contested amounts of up to $25,000. The Family Court is established in each county and in the City of New York. It has jurisdiction over matters involving children and families. Its caseload consists largely of proceedings involving support of dependent relatives, juvenile delinquency, child protection, persons in need of supervision, review and approval of foster-care placements, paternity determinations, and family offenses. The Surrogate's Court is established in every county and hears cases involving the affairs of decedents, including the probate of wills and the administration of estates. Family Court and Surrogate's Court have concurrent jurisdiction in adoption proceedings.

JUDICIARY
379
The Civil Court of the City of New York tries civil cases involving amounts up to $25,000 and other civil matters referred to it by the Supreme Court (pursuant to section 325 of the CPLR). It includes a Housing Part for landlord-tenant matters and housing code violations. It also includes a Small Claims Part and a Commercial Small Claims Part for matters not exceeding $5,000. The Criminal Court of the City of New York has jurisdiction over all violations, infractions and misdemeanor offenses committed within the City of New York, as well as pre-indictment processing in felony matters. Judges of the Criminal Court also act as arraigning magistrates and conduct preliminary hearings in felony cases. There are four kinds of courts of limited jurisdiction outside the City of New York: District (established in Nassau County and in the five western towns of Suffolk County), City, Town and Village Courts. All have jurisdiction over minor criminal matters. They also have jurisdiction over minor civil matters, including small claims and summary proceedings, although their monetary ceilings vary: $15,000 in District and City Courts, and $3,000 in Town and Village Courts. The civil courts of limited jurisdiction in 31 counties are making use of compulsory arbitration with lawyer arbitrators to resolve minor civil disputes, that is, civil actions where the amount sought is $6,000 or less in courts outside the City of New York and $10,000 or less in courts in the City. To address significant delays in the processing and resolution of criminal cases, the UCS has undertaken an experimental reorganization of the courts of criminal jurisdiction within Bronx County. This initiative, commenced during 2004, consolidated the judicial and nonjudicial personnel resources of both the Criminal Court and the Supreme Court, Criminal Term to address both felony and misdemeanor caseloads. This reorganization has significantly reduced the backlog of misdemeanor matters in the Bronx and has shortened the time required to resolve cases. This consolidation of court parts has also resulted in various operating efficiencies with corresponding financial savings. Over the past decade, the court system has been incorporating a variety of problem-solving strategies into mainstream court operations such as Drug Treatment Courts, Integrated Domestic Violence Courts, Community Courts, Mental Health Courts and Sex Offense Courts. These problem-solving courts feature the active involvement of judges in collaboration with criminal justice, treatment and social services agencies. By addressing and seeking to resolve the underlying problems that bring people into the justice system, the courts have demonstrated that they can provide significant savings to state and local governments with regard to incarceration, public assistance and other societal costs. ADMINISTRATIVE STRUCTURE OF THE UNIFIED COURT SYSTEM Section 28 of Article VI of the State Constitution provides that the Chief Judge of the Court of Appeals is the Chief Judge of the State and its chief judicial officer. The Chief Judge appoints a Chief Administrator of the Courts (who is called the Chief

JUDICIARY
380
Administrative Judge of the Courts if the appointee is a judge) with the advice and consent of the Administrative Board of the Courts. The Administrative Board consists of the Chief Judge, as chair, and the Presiding Justices of the four Appellate Divisions of the Supreme Court. The Chief Judge establishes statewide standards and administrative policies after consultation with the Administrative Board of the Courts and promulgates them after approval by the Court of Appeals. The Chief Administrative Judge, on behalf of the Chief Judge, is responsible for supervising the administration and operation of the trial courts and for establishing and directing an administrative office for the courts, called the Office of Court Administration (OCA). In this task, the Chief Administrative Judge is assisted by an Administrative Director, Chief of Operations and a Chief of Policy and Planning; two Deputy Chief Administrative Judges, who supervise the day-to-day operations of the trial courts in New York City and in the rest of the State, respectively; and a Counsel, who directs the legal and legislative work of the Counsel's Office. OCA consists of operational divisions, with overall policy guidance and management directed by the Chief Administrative Judge, assisted by the Chief of Operations and the Administrative Director of the Courts. The Division of Human Resources is responsible for the administration of the UCS’s workforce diversity programs; labor management relations; career development services; employee benefits administration; and a broad range of personnel services dealing with job classification, compensation and examination issues. The Division of Financial Management coordinates the preparation and implementation of the Judiciary Budget and is responsible for payroll processing, as well as for promulgation of fiscal policies and procedures; revenue and expenditure monitoring, control and reporting; and the coordination of the fiscal aspects of the Court Facilities Aid Program. The Division of Technology is responsible for the development, implementation and oversight of all central and local automation and telecommunication services which support court operations and administrative functions. The Division of Court Operations provides centralized support for day-to-day court operations through its oversight of streamlining initiatives, procedural manual development and training programs, alternative dispute resolution programs and oversight of legal and records management services. The Division of Administrative Services provides a broad range of general support services to the courts including, but not limited to: central accounting and revenue management; attorney registration administration; centralized procurement; supply and printing and professional development. The Division of Grants and Program Development supports the UCS in the design, development, funding and evaluation of innovative, collaborative justice initiatives. The services provided by these operational divisions are further supplemented by a Public Affairs Office which coordinates communications with other governmental entities, the press, public and Bar. The Office of Court Research compiles UCS workload statistics for the courts, management, and the public and conducts operational improvement studies. The Office of Justice Courts Support provides oversight of local Town and Village Courts. The Dean of the NYS Judicial Institute oversees the Education and Training Office which administers educational programs and the operation of the Judicial Training Institute at Pace University. The Office of Public Safety

JUDICIARY
381
administers the Judiciary’s court security and disaster preparedness activities. The Inspector General’s Office is responsible for the investigation and elimination of infractions of discipline standards, conflicts of interest, and criminal activities on the part of nonjudicial employees and persons or corporations doing business with the court system. Finally, an Office of Internal Affairs, reporting directly to the Chief Administrative Judge, conducts internal audits and investigations to support the attainment of management’s long-term goals and priorities. Counsel's Office prepares and analyzes legislation, represents the UCS in litigation, and provides various other forms of legal assistance to the Chief Administrative Judge. Responsibility for on-site management of the trial courts and agencies is vested with the Administrative Judges. Upstate, in each of the eight judicial districts established outside the City of New York, there is a District Administrative Judge who is responsible for all the courts and agencies operating within their respective districts except in the Tenth Judicial District, where a separate Administrative Judge is appointed for Nassau and Suffolk Counties. In the City of New York, the day-to-day management of Civil and Criminal Courts has been incorporated into a new county-based system. Each county, except for Richmond, has a separate Administrative Judge for civil and criminal matters. New York City Family Court continues to have a citywide Administrative Judge overseeing supervising judges in each of the five counties. A Deputy Chief Administrative Judge coordinates citywide policies and initiatives for the Civil and Criminal Courts and provides general oversight of all the courts in New York City. The Appellate Divisions are responsible for the administration and management of their respective courts, and of the several Appellate Auxiliary Operations: Candidate Fitness, Attorney Discipline, Assigned Counsel, Attorney for the Child, and Mental Hygiene Legal Service.
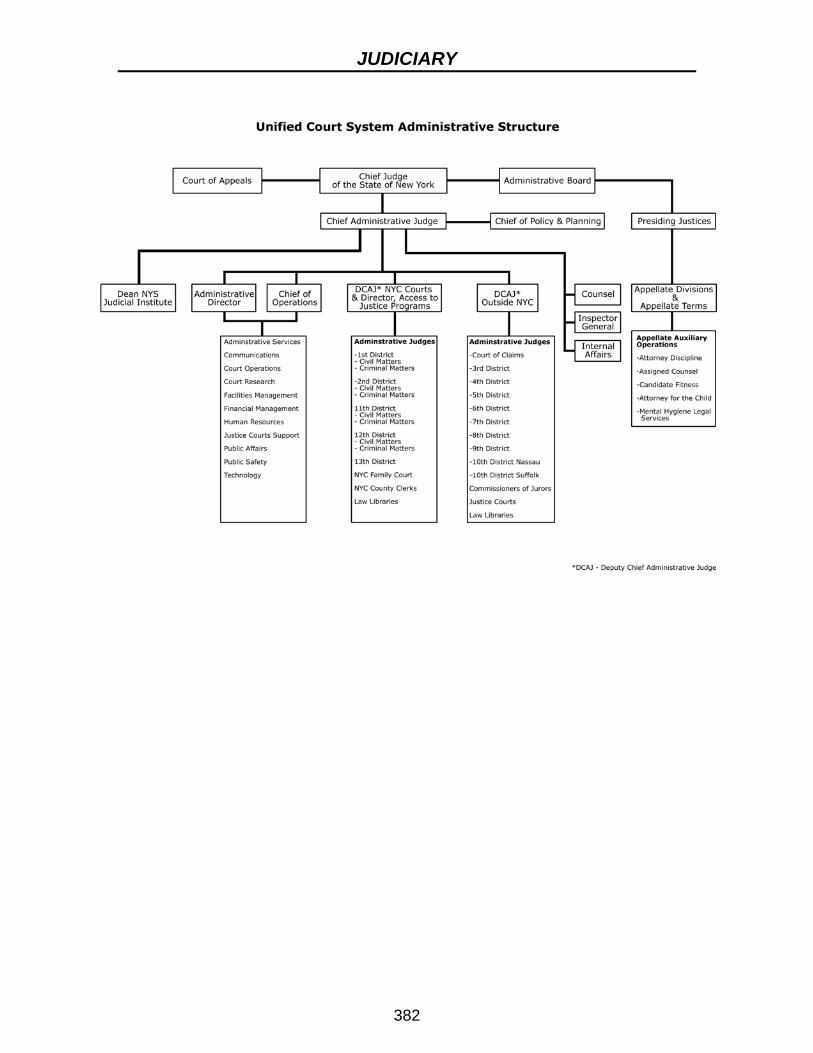
JUDICIARY
382

JUDICIARY
383
EXECUTIVE SUMMARY In the current economic recession, as never before, the New York State courts have become the emergency room for New Yorkers in crisis. In every courtroom throughout the State, the volume of new cases has dramatically increased, the number of litigants appearing without counsel is unprecedented, and the complexity of cases, including foreclosures, has risen to new levels. We have met this challenge through the commitment, intelligence and energy of our Judiciary, who labor, daily and diligently, to meet the vast justice needs of those who seek justice in our courts. It is the fundamental obligation of the Judiciary to ensure that each New Yorker’s most basic right to justice is met. At the same time, we recognize our obligation to ensure that resources are used wisely and efficiently, and to do our part to address the State’s fiscal crisis. The Judiciary’s budget request reflects a careful balancing of these principles, identifying the resources necessary for the courts to fulfill their constitutional duty while reducing costs wherever possible. The challenges we face are daunting:
• The total caseload of the courts Statewide has risen sharply, growing by 12 percent since 2001.
• Foreclosure filings continue their dramatic increase, with 50,000 filings expected in 2010; more than double the number in 2005. The courts have held more than 90,000 settlement conferences in foreclosure cases thus far in 2010.
• Family offense cases are up sharply, with a 32 percent increase over 2006. • The caseload of the New York City Civil Court has increased by 92 percent since
2001, and the civil caseload of city courts outside of New York City has risen by 99 percent over the same period, with much of the growth due to consumer debt cases.
• New York City arrest cases are nearing the levels seen in the late 1990's, with filings up 19 percent since 2005.
Despite this record workload, as the result of an aggressive cost-control program, the Judiciary has been able to hold the line on its operating budget. Indeed, the General Fund - Court and Agency Operations and Aid to Localities portion of the Judiciary budget request is $1.8 billion, .02 percent less than the current year. The Judiciary is able to present this negative-growth budget, despite both the courts’ record-level workload and a number of mandatory cost increases (including $20.2 million for salary adjustments required by law for nonjudicial personnel), by undertaking a variety of cost-saving measures, as well as a comprehensive review of operations. The Judiciary’s participation in the Early Retirement Incentive program will produce significant cost savings. Approximately 1,800 nonjudicial employees participated in the Program. Each office and court was asked to view the Incentive Program as an opportunity to rethink their operations, and to develop plans to improve efficiencies and reduce costs. As a result, a significant number of positions, particularly in administrative

JUDICIARY
384
areas, will not be refilled. Even positions that must be refilled, such as those in courtrooms and chambers, will result in saving because of lower salaries paid to new employees. The Judiciary will also continue to carefully monitor all expenditures, limiting overtime, barring all but essential travel, reducing the purchase of print legal reference materials in favor of flat-rate online legal research, restricting equipment purchases, and increasing the use of web-based remote training. Across these categories, the court system reduced spending by more than 16 percent over the past two years. Beyond these specific cost-cutting measures, the Judiciary has undertaken a comprehensive, system-wide re-engineering effort, examining every aspect of its operations, to identify ways to improve efficiency and cost-effectiveness, for the benefit both of the court system itself and court users. In this effort, the court system is partnering with the National Center for State Courts to bring the broadest possible experience and expertise to New York. Automation continues to play a key role in rethinking the way the courts do business. For example, this year the court system initiated pilot projects in mandatory electronic filing (authorized by L.2009, c.416), an innovation that will transform the justice system, and offer significant savings, convenience and other benefits not just to the courts, but also to County Clerks, the Bar and litigants. Similarly, this year the court system inaugurated online attorney registration, and continued a number of innovative joint projects with a variety of government agencies, to improve inter-agency electronic transmission of data, in order to increase efficiency, enhance services and reduce costs. The re-engineering initiative will also look for ways to streamline processes, eliminate duplicative functions, and consolidate services. A number of such changes have already been implemented. For example, the courts in Nassau County consolidated two separate law libraries and a Help Center for self-represented litigants into a single site, saving thousands of dollars in annual costs while improving operations. The use of public access computer terminals in remote locations ensured that there was no reduction in service to the public, while the consolidation at a single site has led to increased efficiencies and permitted a reduction in staffing levels. Similarly, we have consolidated administrative functions, so that, for example, a single chief clerk now manages the Putnam County Family, County, and Supreme Courts. In addition, the court system has automated all personnel functions, including time and leave transactions and the civil service examination and application processes. The result is a more efficient, greener system, that provides better service with fewer staff. The project with the National Center for State Courts is expected to identify other such opportunities to improve efficiencies and produce savings. These steps – both the specific cost-containment measures and the broad rethinking and re-engineering of how the courts do business – produce significant savings, and enable the Judiciary to present a negative-growth operating budget that still provides the resources necessary for the courts to fulfill their constitutional role.
JUDICIARY
385
Included among the resources necessary to assure the long-term health of our court system is funding to address the critical matter of judicial compensation. Judges in New York now have gone more than 12 years without a cost-of-living increase, facing extraordinary caseloads that have only grown over the years. The budget bill includes a reappropriation for that purpose and language that would raise judicial compensation, retroactive to April 1, 2005. Equally important is reform of the manner in which judicial salaries are set. New York State should have, as most other states do, an open and accountable system for adjusting judicial salaries on a regular basis. Finally, the Judiciary’s negative-growth budget also addresses one of the most troubling issues that faces the courts – the record number of litigants without legal representation in housing, consumer debt, and other cases involving the essentials of life. In May 2010, the Chief Judge convened a Task Force to Expand Access to Civil Legal Services in New York, to assess the need for civil legal services and to recommend steps to improve access to justice in civil matters. Through hearings, surveys and other data-gathering, the Task Force documented a substantial unmet need for civil legal services in New York, and found that the lack of representation imposes a profound human and social cost. The Task Force also found that the impact goes far beyond the non-represented parties. Judges, both in a survey and through testimony at hearings, spoke of the significant burdens – including longer court appearances and more appearances – they bear in cases where a party is not represented. Business leaders, including representatives of property owners and the banking industry, echoed this concern, asserting that it is more difficult and costly for them to litigate a case against a non-represented party. Indeed, business leaders testified that provision of counsel at an early stage would often avoid entirely the need to initiate litigation. The Task Force also found that the provision of adequate civil legal services will result in a substantial economic benefit to State and local governments, by preventing evictions and foreclosures, avoiding foster care placements, and obtaining federal benefits in place of State and local assistance benefits. The proposed budget includes $25 million to begin implementation of the recommendations of the Task Force. In sum, the proposed budget reflects a thoughtful balancing of the Judiciary’s obligation, as a separate and independent branch of government, to work with the other Branches in addressing the State’s continuing fiscal crisis, while also ensuring that the courts can meet their constitutional duty to provide fair and timely justice for every New Yorker, now and in the years ahead.
JUDICIARY
386
THE 2011-12 JUDICIARY BUDGET REQUEST The budget request for the Judiciary General Fund Court and Agency Operations and Aid to Localities for fiscal year 2011-12 totals $1.8 billion, a decrease of $0.36 million, or -0.02%, from the current year appropriation. The All Funds request totals $2.1 billion, a decrease of $0.72 million, or -0.03%, from the current year. KEY ELEMENTS OF CHANGE Significant elements of change in the Judiciary’s 2011-12 General Fund State Operations and Aid to Localities budget request include the following:
• $20.2 million increase for salary increments required by law for nonjudicial personnel.
• - $11.52 million in savings related to salary adjustments and lump sum payouts
for separation from service.
• $5.71 million related to contractual and workload increases in payments for attorneys representing children in the Attorney for the Child Program.
• $11.8 million for continued implementation of caseload standards for attorneys
assigned to represent indigent criminal defendants in New York City pursuant to chapter 56 of the Laws of 2009.
• $4.07 million to meet contractually obligated increases for security services, real
estate rentals, computer assisted legal research, and contracts for community courts, alternative dispute resolution and court improvement projects.
• $2.06 million in net increases necessary to meet the operational needs of the
courts including, but not limited to: per diem interpreters, judicial hearing officers, technology services, expert witnesses, printing, postage and transcripts.
• - $11.09 million in nonpersonal service savings attributable to a variety of cost
saving measures including reductions in travel and elimination of targeted training programs, legal reference print materials, and temporary service and overtime not directly related to court operations. Additional savings are being realized from the transition to IP telephones, the reduced expansion of redundant wiring for Courtnet, and stringent control of the purchase of equipment.
• - $46.59 million net increase in savings related to the Vacancy Control Program
instituted in fiscal year 2008-09 and the Early Retirement Incentive Program authorized in 2010.
• $25.0 million for civil legal services to address the urgent problem of the growing
need for civil legal assistance for low income New Yorkers.

JUDICIARY
387
2010-11 2011-12Court and Agency Operations - General Fund Available Requested Change
Courts of Original Jurisdiction $1,585,477,286 $1,543,573,556 ($41,903,730)
Court of Appeals $16,145,965 $15,652,618 ($493,347)
Appellate Court Operations $76,973,855 $79,904,356 $2,930,501
Appellate Auxilliary Operations $134,700,963 $154,264,475 $19,563,512
Administration and General Support $17,934,182 $18,314,008 $379,826
Judiciary Wide Maintenance Undistributed $7,942,766 $27,109,985 $19,167,219
Court and Agency Operations - General Fund Total $1,839,175,017 $1,838,818,998 ($356,019)
Special Revenue Funds - Federal $9,100,000 $10,500,000 $1,400,000
Special Revenue Funds - Other
NYC County Clerks Operations Offset Fund $25,309,351 $24,816,259 ($493,092)
Judiciary Data Processing Offset Fund $19,167,697 $18,367,438 ($800,259)
Miscellaneous Special Revenue $1,500,000 $1,500,000 $0
Attorney Licensing Fund $26,315,696 $25,941,104 ($374,592)
Indigent Legal Services Fund $25,000,000 $25,000,000 $0
Court Facilities Incentive Aid Fund $2,520,877 $2,454,836 ($66,041)
Special Revenue Funds - Other - Total $99,813,621 $98,079,637 ($1,733,984)
Lawyers' Fund for Client Protection $12,944,281 $12,915,110 ($29,171)
Aid to Localities
General Fund $4,945,584 $4,945,584 $0
Court Facilities Incentive Aid $123,377,787 $123,377,787 $0
Aid to Localities - All Funds Total $128,323,371 $128,323,371 $0
Capital Projects
General Fund $0 $0 $0
Special Revenue Funds $0 $0 $0
Capital Projects Total
Grand Total All Funds $2,089,356,290 $2,088,637,116 ($719,174)
All Funds Appropriation RequirementsMajor Purpose / Fund Summary
Unified Court System2011-12 Budget Request

JUDICIARY
388
2010-11 2011-12Available Required Change
Courts of Original JurisdictionGeneral Fund $1,585,477,286 $1,543,573,556 ($41,903,730)Special Revenue Funds $55,850,341 $55,970,092 $119,751Total $1,641,327,627 $1,599,543,648 ($41,783,979)
Court of AppealsGeneral Fund $16,145,965 $15,652,618 ($493,347)Special Revenue Funds $0 $0 $0Total $16,145,965 $15,652,618 ($493,347)
Appellate Court OperationsGeneral Fund $76,973,855 $79,904,356 $2,930,501Special Revenue Funds $0 $0 $0Total $76,973,855 $79,904,356 $2,930,501
Appellate Auxilliary OperationsGeneral Fund $134,700,963 $154,264,475 $19,563,512Special Revenue Funds $47,963,344 $47,475,317 ($488,027)Total $182,664,307 $201,739,792 $19,075,485
Administration & General SupportGeneral Fund $17,934,182 $18,314,008 $379,826Special Revenue Funds $3,167,697 $3,165,970 ($1,727)Total $21,101,879 $21,479,978 $378,099
Judiciary Wide Maintenance UndistributedGeneral Fund $7,942,766 $27,109,985 $19,167,219Special Revenue Funds $1,932,239 $1,968,258 $36,019Total $9,875,005 $29,078,243 $19,203,238
Lawyers' Fund for Client ProtectionGeneral Fund $0 $0 $0Special Revenue Funds $12,944,281 $12,915,110 ($29,171)Total $12,944,281 $12,915,110 ($29,171)
Aid to LocalitiesGeneral Fund $4,945,584 $4,945,584 $0Special Revenue Funds $123,377,787 $123,377,787 $0Total $128,323,371 $128,323,371 $0
Grand Total General Fund $1,844,120,601 $1,843,764,582 ($356,019)Grand Total Special Revenue $245,235,689 $244,872,534 ($363,155)
Grand Total All Funds $2,089,356,290 $2,088,637,116 ($719,174)
Unified Court System2011-12 Budget Request
All Funds Appropriation RequirementsMajor Purpose Summary by Fund Category
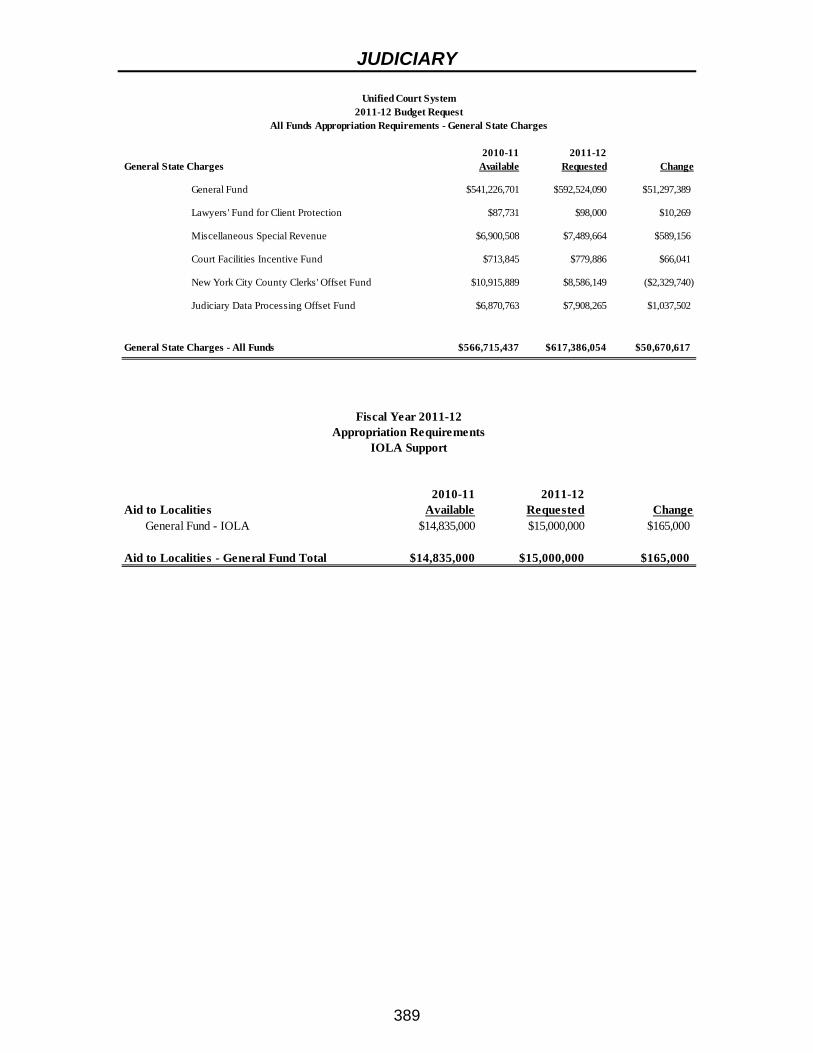
JUDICIARY
389
Unified Court System2011-12 Budget Request
All Funds Appropriation Requirements - General State Charges
2010-11 2011-12General State Charges Available Requested Change
General Fund $541,226,701 $592,524,090 $51,297,389
Lawyers' Fund for Client Protection $87,731 $98,000 $10,269
Miscellaneous Special Revenue $6,900,508 $7,489,664 $589,156
Court Facilities Incentive Fund $713,845 $779,886 $66,041
New York City County Clerks' Offset Fund $10,915,889 $8,586,149 ($2,329,740)
Judiciary Data Processing Offset Fund $6,870,763 $7,908,265 $1,037,502
General State Charges - All Funds $566,715,437 $617,386,054 $50,670,617
2010-11 2011-12Aid to Localities Available Requested Change
General Fund - IOLA $14,835,000 $15,000,000 $165,000
Aid to Localities - General Fund Total $14,835,000 $15,000,000 $165,000
Fiscal Year 2011-12Appropriation Requirements
IOLA Support

JUDICIARY
390
2010-11 2011-12Category / Fund Priojected Projected ChangeCourt & Agency Operations
General Fund 1,787.8 1,873.0 85.2
Special Revenue - Federal 6.5 6.5 0.0
NYC County Clerks' Operations Offset Fund 25.7 24.9 (0.8) Judiciary Data Processing Offset Fund 19.2 18.4 (0.8) Miscellaneous Special Revenue 27.8 27.4 (0.4) Indigent Legal Services Fund 25.0 25.0 0.0 Court Facilities Incentive Aid Fund 2.5 2.5 0.0
Court & Agency Operations - All Funds Total 1,894.5 1,977.7 83.2
Lawyers' Fund for Client Protection 10.5 11.5 1.0
Aid to LocalitiesGeneral Fund 4.9 4.9 0.0 Court Facilities Incentive Aid Fund 120.0 120.0 0.0
Aid to Localities - All Funds Total 124.9 124.9 0.0
Capital Projects - Courthouse Improvements 16.0 16.0 0.0
All Funds Total 2,045.9 2,130.1 84.2
Unified Court System2011-12 Budget Request
All Funds Disbursement Requirements(Millions $)

JUDICIARY
391
2010-11 2011-12General State Charges Projected Projected Change
General Fund 540.1 592.5 52.4Lawyers' Fund for Client Protection 0.2 0.1 -0.1Miscellaneous Special Revenue 11.4 7.5 -3.9Court Facilities Incentive Fund 1.1 0.8 -0.3New York City County Clerks' Offset Fund 0.0 10.9 10.9Judiciary Data Processing Offset Fund 10.7 7.9 -2.8
General State Charges - All Funds 563.5 619.7 56.2
Unified Court System2011-12 Budget Request
All Funds Disbursement RequirementsGeneral State Charges
(Millions $)
2010-11 2011-12Aid to Localities Projected Projected Change
General Fund - IOLA 14.8 15.0 0.2Aid to Localities - General Fund 14.8 15.0 0.2
Fiscal Year 2011-12Disbursement Requirements
IOLA Support(Millions $)

392
THE LEGISLATURE The New York State Constitution vests the State's law-making power in a two-house Legislature composed of a 62-member Senate and a 150-member Assembly. Each representative is elected for two-year terms, with all 212 being elected every two years. The Legislature convenes annually on the first Wednesday after the first Monday in January and remains in session until it concludes its business. The Legislature has many powers set by the State Constitution. These responsibilities include:
♦ the ability to propose laws; ♦ the power to override a gubernatorial veto if two-thirds of the Senate and
Assembly vote to do so; ♦ the reapportionment of legislative and congressional districts every ten years after
the national census; ♦ the confirmation by the Senate of gubernatorial appointments of non-elected state
officials and court judges; ♦ the proposition of amendments to the State Constitution; ♦ voting on ratification of proposed amendments to the Federal Constitution; and ♦ the creation, regulation and, in some limited cases, abolition of local
governments. Subject to the limitations and prohibitions imposed by the Federal Constitution, certain Federal statutes and treaties, and the State Constitution, the law-making powers of the Legislature are practically unlimited. The principal purposes of bills considered by the Legislature are to:
♦ enact or amend laws relating to the government of the State and its various subdivisions;
♦ appropriate funds for the operation of the various agencies and functions of State government and for State aid to local governments, and to provide adequate revenue-producing sources for these purposes;
♦ provide for and regulate the operation of a judicial system, including the practices and procedures for the system;
♦ define acts or omissions that constitute crimes, and to provide penalties for these crimes;
♦ promote the public welfare, including the care of the State's indigent, mentally ill, unemployed, etc.; and
♦ correct, clarify, amend or repeal obsolete, conflicting, uncertain or invalidated statutes.
In addition to the Senate and Assembly, the Legislature's Budget authorizes funding for several other components, which support the operations of the two houses, including:
♦ part of the Lieutenant Governor's office; ♦ fiscal committees operating in each house; and
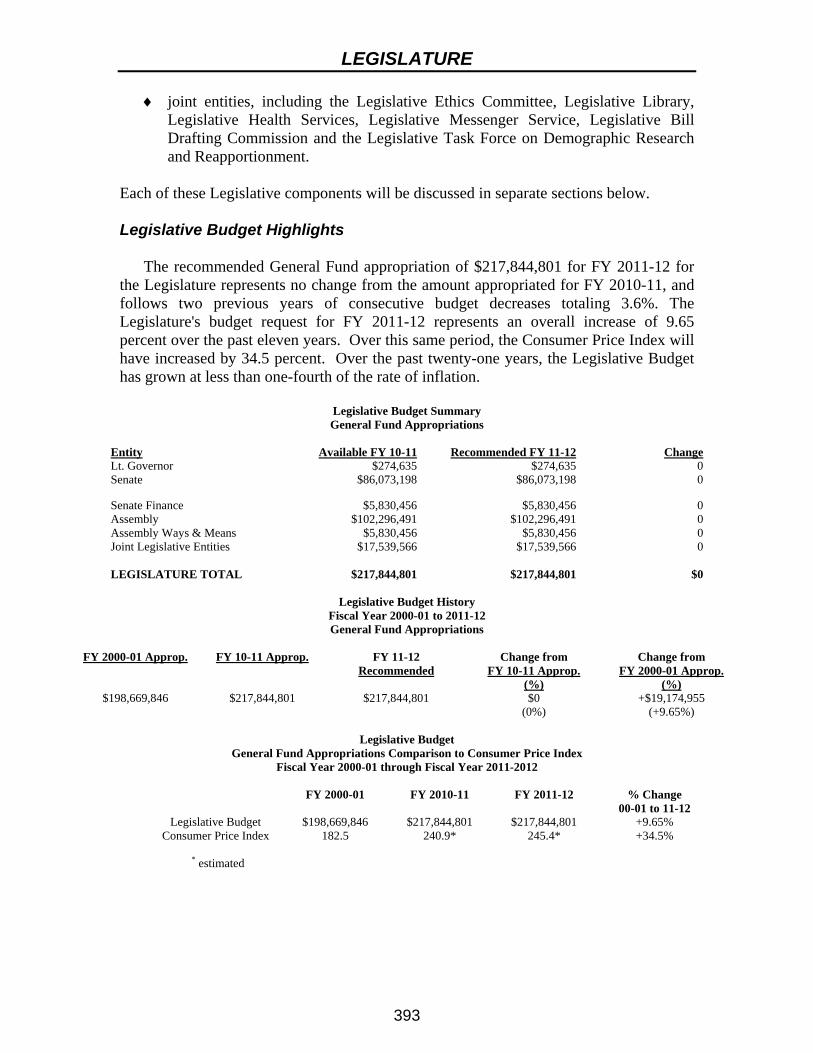
LEGISLATURE
393
♦ joint entities, including the Legislative Ethics Committee, Legislative Library, Legislative Health Services, Legislative Messenger Service, Legislative Bill Drafting Commission and the Legislative Task Force on Demographic Research and Reapportionment.
Each of these Legislative components will be discussed in separate sections below. Legislative Budget Highlights The recommended General Fund appropriation of $217,844,801 for FY 2011-12 for the Legislature represents no change from the amount appropriated for FY 2010-11, and follows two previous years of consecutive budget decreases totaling 3.6%. The Legislature's budget request for FY 2011-12 represents an overall increase of 9.65 percent over the past eleven years. Over this same period, the Consumer Price Index will have increased by 34.5 percent. Over the past twenty-one years, the Legislative Budget has grown at less than one-fourth of the rate of inflation.
Legislative Budget Summary General Fund Appropriations
Entity Available FY 10-11 Recommended FY 11-12 Change Lt. Governor $274,635 $274,635 0 Senate $86,073,198 $86,073,198 0
Senate Finance $5,830,456 $5,830,456 0 Assembly $102,296,491 $102,296,491 0 Assembly Ways & Means $5,830,456 $5,830,456 0 Joint Legislative Entities $17,539,566 $17,539,566 0 LEGISLATURE TOTAL $217,844,801 $217,844,801 $0
Legislative Budget History
Fiscal Year 2000-01 to 2011-12 General Fund Appropriations
FY 2000-01 Approp.
FY 10-11 Approp.
FY 11-12
Recommended
Change from
FY 10-11 Approp. (%)
Change from
FY 2000-01 Approp. (%)
$198,669,846 $217,844,801 $217,844,801 $0 (0%)
+$19,174,955 (+9.65%)
Legislative Budget
General Fund Appropriations Comparison to Consumer Price Index Fiscal Year 2000-01 through Fiscal Year 2011-2012
FY 2000-01 FY 2010-11 FY 2011-12 % Change
00-01 to 11-12 Legislative Budget $198,669,846 $217,844,801 $217,844,801 +9.65%
Consumer Price Index 182.5 240.9* 245.4* +34.5% * estimated

LEGISLATURE
394
The recommended Special Revenue Fund-Other appropriation of $1,600,000 for FY 2011-12 represents no change from the amount appropriated for FY 2010-11. No tax revenues are required for Special Revenue Funds. The recommended Grants and Bequests Fund appropriation of $500,000 for FY 2011-12 represents no change from the amount appropriated for FY 2010-11. No tax revenues are required for Grants and Bequests Funds.
LIEUTENANT GOVERNOR The Lieutenant Governor serves as the Senate's President and has a casting vote. The Lieutenant Governor's salary of $151,500 appears as part of the Legislative Budget. The Legislature also funds a part of the Lieutenant Governor's Office. Budget Highlights The recommended appropriation of $274,635 for FY 2011-12 for the Lieutenant Governor represents no change from the amount appropriated for FY 2010-11.
SENATE The Senate is composed of 62 Members elected for two-year terms from districts around the state. Each Senator represents approximately 306,000 constituents. The Senate conducts its legislative business through the operation of 32 Standing Committees. The Senate elects from among its Members for a two-year term a Temporary President who directs and guides the business of the Senate, appoints Members to Senate Standing Committees, and appoints the Senate's staff. The Temporary President serves as the presiding officer in the absence of the Lieutenant Governor or may delegate this duty to another Member. The minority party of the Senate chooses a Minority Leader from among its membership. Senate Members have staff to assist them in carrying out their legislative duties, delivering constituent services and, where applicable, in fulfilling their responsibilities as committee chairs or leaders of the Senate. Members are also provided with office space both in Albany and the district, as well as office equipment, furnishings and supplies, in order to serve their constituents. Travel expenses for approved official Senate business are reimbursable. The Temporary President and Minority Leader each have staff to provide counsel, policy analysis and program development. The Temporary President, through the Secretary of the Senate, employs staff to operate the Senate Chamber during session and to handle the legislative process during the remainder of the year, furnish research and computer services, and provide administrative services such as personnel, fiscal, maintenance, and printing services for the Senate. The Temporary President also has staff to deliver communications services for the Senate. Finally, the Senate operates a program for college students which includes a Session Assistant program for undergraduates and a Student Fellows program for post-graduates who wish to learn about and experience the legislative process by working with Senate Members.

LEGISLATURE
395
In addition to the Senate's General Fund appropriation, a Special Revenue Fund (Senate Recyclable Materials, Information Services and Conference Fund) has been established to collect revenues from the sale of recyclable materials, distribution of documents, materials and computerized information, and fees charged for conferences sponsored by the Senate. These revenues may be used to pay for waste disposal, production and distribution of Senate documents, materials and computerized information, and expenses related to conferences sponsored by the Senate. A Grants and Bequests Fund has also been established to receive non-state grants which may be used to pay for services and expenses related to the restoration of the Senate Chamber. Budget Highlights The recommended appropriation for the Senate of $86,073,198 for FY 2011-12 represents no change from the amount appropriated for FY 2010-11. This follows two consecutive years of budget decreases. As detailed in the Table below, the Senate has seen its budget increase by $7,406,697 or 9.4 percent from the amount of $78,666,501 appropriated in FY 2000-01. Over the same eleven year period, the consumer price index has increased by 34.5 percent. This is consistent with a twenty-one year trend that has seen the Senate’s budget grow at approximately 28% of the overall rate of inflation. In the past 16 years, the Senate has controlled its spending by reducing its staff by 327 employees or 17.9%, eliminating its Washington, D.C. office lease, closing many district offices, reducing the number of district-wide mailings allowed each Member, delaying essential equipment upgrades and implementing other operational savings.
Senate Budget History Fiscal Year 2000-01 to 2011-12 General Fund Appropriations
FY 00-01 Approp.
FY 10-11 Available
FY 11-12
Recommended
Change from FY 10-11
(%)
Change from FY 00-01
(%)Senate Budget
$78,666,501 $86,073,198
$86,073,198
$0
(0.0%) $7,406,697
(+9.4%)
ASSEMBLY The Assembly is composed of 150 members elected for two-year terms from districts around the state. Each Member of the Assembly represents approximately 127,000 constituents. The Assembly conducts its legislative business through the operation of 38 standing committees. The Assembly elects from among its members a Speaker who directs and guides the business of the Assembly, and appoints members to Assembly Standing Committees and Assembly leadership positions. The Speaker serves as the presiding officer of the Assembly. The minority party of the Assembly chooses a Minority Leader from their membership.

LEGISLATURE
396
Each Member of Assembly is entitled to employ staff to assist them in carrying out their legislative duties and, where applicable, their responsibilities as Committee Chairs or leadership. Members are also provided with office space both in Albany and the district, as well as office equipment, furnishings and supplies, in order to serve their constituents. The State Constitution provides for reimbursement to Assembly Members for travel to the Capitol from their district, and Members and staff are also eligible for reimbursement of other travel related to legislative business. The Speaker of the Assembly and the Assembly Minority Leader employ staff to provide counsel, legislative program development and policy analysis. The Assembly also employs staff to serve the needs of the house, including the operation of the Assembly Chamber during session, the management of the legislative process, and research, communications and administrative services. The Assembly also administers an Intern Program to provide opportunities to undergraduate and graduate college students to learn about the legislative process while utilizing their skills to assist the Assembly Members in fulfilling their constitutional responsibilities. In addition to the Assembly's General Fund appropriation, a Special Revenue Fund (Assembly Recyclable Materials, Information Services and Conference Fund) has been established to collect revenues from the sale of recyclable materials, distribution of documents, materials and computerized information, and fees charged for conferences sponsored by the Assembly. These revenues may be used to pay for waste disposal, production and distribution of Assembly documents, materials and computerized information, and expenses related to conferences sponsored by the Assembly. A Grants and Bequests Fund has also been established to receive non-state grants which may be used to pay for services and expenses related to the restoration of the Assembly Chamber. Budget Highlights The recommended appropriation for FY 2011-12 of $102,296,491 represents no change from the amount appropriated for FY 2010-11. Over the past eleven years, as detailed below, the Assembly's budget has increased by 9.4 percent while over the same period, the Consumer Price Index has increased by 34.5 percent. Over the past twenty-one years, the growth of the Assembly’s budget has been less than three-tenths of the overall rate of inflation. During this period, the Assembly has controlled its spending by reducing the payroll for Assembly controlled entities by over 570 positions and implementing other operational savings.
Assembly Budget History Fiscal Year 2000-01 to 2011-2012
General Fund Appropriations
FY 00-01 Approp.
FY 10-11 Available
FY 11-12 Recommended
Change from FY 10-11
(%)
Change from FY 00-01
(%) Assembly Budget $93,492,920 $102,296,491 $102,296,491 ($0)
(0.0%) 8,803,571 (+9.4%)

LEGISLATURE
397
FISCAL COMMITTEES The Governor's annual budget bills and the budgetary proposals for the Legislature and Judiciary are referred to these committees when introduced and are reported by them, with recommendations, to the Legislature. Designated representatives of the committees are entitled, by constitutional provisions, to attend the required hearings for the preparation of the budget and to make inquiry concerning any part thereof. These committees also consider all bills introduced in the Legislature carrying appropriations or providing for the expenditures of public money. In addition, pursuant to the provisions of section 122-a of the State Finance Law, the Chairmen and ranking Minority Members of the Senate Finance Committee and the Assembly Ways and Means Committee function as an Audit Committee. The responsibilities of the Audit Committee include the selection of an independent certified public accountant to conduct an independent audit of the state's annual financial statements, receiving the results of such independent audit, and submitting the certification received from the independent certified public accountant to the State Comptroller for inclusion in the annual financial report required pursuant to section 8 of the State Finance Law. Budget Highlights The recommended appropriation of $5,830,456 for fiscal year 2011-12 for both the Senate Finance Committee and the Assembly Ways and Means Committee represents no change from the amount appropriated for FY 2010-11.
JOINT ENTITIES AND DUES PAYMENTS LEGISLATIVE ETHICS COMMISSION The Legislative Ethics Commission was created as the Legislative Ethics Committee by Chapter 813 of the laws of 1987 (and renamed the Legislative Ethics Commission by Chapter 14 of the laws of 2007) and is a joint bipartisan commission authorized by law to act on matters arising out of Public Officers Law Sections 73, 73-a and 74, as applied to the legislative branch, and carry out the provisions of Section 80 of the Legislative Law. The Commission is authorized by law to distribute, collect and review financial disclosure statements from legislators, employees and candidates for legislative office. The Commission renders formal advisory opinions, investigates violations of the law, and assesses civil penalties for applicable violations. The Legislative Ethics Commission is also required to adopt policies, rules, and regulations for its operations, develop educational materials and training with regard to legislative ethics for Members of the Legislature and legislative employees, and prepare an annual report to the Governor and Legislature as prescribed by Section 80 of the Legislative Law. The nine-member commission is comprised of one member each from the Senate and Assembly majority and minority parties, and five other members who are not legislators or lobbyists, with one member appointed by each legislative leader, and one appointed jointly by the Speaker of the Assembly and Majority Leader of the Senate.

LEGISLATURE
398
Budget Highlights The recommended appropriation of $376,949 for FY 2011-12 for the Legislative Ethics Commission represents no change from the amount appropriated for FY 2010-11. LEGISLATIVE HEALTH SERVICE Section 7-b of the Legislative Law provides for a legislative emergency health station for the use of members and employees of the Legislature and legislative correspondents. This station is to be under the direction of a registered nurse and suitably and adequately equipped to administer first aid whenever needed. Budget Highlights The recommended appropriation of $211,266 for FY 2011-12 for the Legislative Health Service represents no change from the amount appropriated for FY 2010-11. LEGISLATIVE LIBRARY Section 7-a of the Legislative Law provides for a Legislative Library to be located in the State Capitol, conveniently accessible to the members of both houses of the Legislature. The Legislative Library is the Library of Record for the Legislature. The Legislative Library is open throughout the year and all hours that the Legislature is actively in session, and provides general information services to legislators and their staffs with a collection emphasis on legal materials. Budget Highlights The recommended appropriation of $798,221 for FY 2011-12 for the Legislative Library represents no change from the amount appropriated for FY 2010-11. LEGISLATIVE MESSENGER SERVICE The Legislative Messenger Service provides a communications network throughout the Empire State Plaza and neighboring state buildings for Senate and Assembly legislators and their staffs. The service employs and trains individuals with disabilities as office personnel and messengers, and is located in the Legislative Office Building. Budget Highlights The recommended appropriation of $907,830 for FY 2011-12 represents no change from the amount appropriated for FY 2010-11. LEGISLATIVE BILL DRAFTING COMMISSION The Legislative Bill Drafting Commission is composed of two commissioners jointly appointed by the Temporary President of the Senate and the Speaker of the Assembly. The Commission is mandated to draft or aid in the drafting of legislative bills and resolutions at the request of members or committees of either house of the Legislature.

LEGISLATURE
399
The Commission, upon research and examination, may advise as to the constitutionality, consistency or effect of proposed legislation upon request of a member or committee of either house of the Legislature. The Commissioners direct a legal staff of attorneys and are supported by a data processing and technical staff. The Commission also maintains and operates centralized data processing systems, programs and equipment for the operation of a bill status and statutory and other miscellaneous information retrieval system for the Legislature, including the creation of a databank containing the official statutes of the state and the text of the rules and regulations of state agencies as filed with the Secretary of State. The Commission's budget is used to pay for the cost of printing legislative bills, session laws, Senate and Assembly Journals, and the printing, publication and distribution of the Legislative Digest. The Commission receives revenues from the private sale of subscriptions to the Legislative Digest and to the Legislative Retrieval Service (LRS), which are deposited in a Special Revenue Fund known as the Legislative Computer Services Fund. These revenues are used to offset the costs of operating the Commission's data processing systems. Budget Highlights The recommended appropriation of $13,009,482 for fiscal year 2011-12 for the Legislative Bill Drafting Commission represents no change from the amount appropriated for FY 2010-11. An appropriation of $1,500,000 for FY 2011-12 is recommended for the Legislative Computer Services Fund. This recommended appropriation represents no change from the amount appropriated for FY 2010-11. No tax revenues are required for this Fund. LEGISLATIVE TASK FORCE ON DEMOGRAPHIC RESEARCH AND REAPPORTIONMENT The Task Force on Demographic Research and Reapportionment was established by Chapter 45 of the laws of 1978 to research and study the techniques and methodologies used by the U.S. Commerce Departments' Bureau of the Census in carrying out the decennial federal census. The Task Force aids the Legislature by providing technical plans for meeting the requirements of legislative timetables for the reapportionment of Senate, Assembly and Congressional districts. Using its Geographic Information System database, it also conducts research projects relating to the collection and use of census data and other statistical information. The Task Force is also authorized to receive revenues from the sale of computer-generated data and services for deposit in the Special Revenue Fund known as the Legislative Computer Services Fund. These funds may be used to offset the Task Force's cost of operating its data processing systems.
LEGISLATURE
400
Budget Highlights The total recommended appropriation of $1,858,759 for fiscal year 2011-12 for the Legislative Task Force on Demographic Research and Reapportionment represents no change from the amount appropriated for FY 2010-11. NATIONAL CONFERENCE OF STATE LEGISLATURES DUES The National Conference of State Legislatures (NCSL) is a bi-partisan organization created to serve the legislators and staff of each State Legislature. NCSL provides research, technical assistance and the opportunity for policy makers to exchange ideas on the most pressing state issues. New York's involvement with the NCSL is through the Assembly on the Legislature (AOL) and State-Federal Assembly (SFA). The AOL promotes the exchange of ideas and information on state issues among state legislatures. SFA informs legislators of developments in state-federal relations, identifies issues of critical concern and serves as a forum for discussion among its 50-state membership. All state legislators and their staff members are eligible to participate in the Conference and are entitled to the full use of its services. NCSL is supported from dues assessed to each State Legislature, on the basis of state population totals. Budget Highlights The recommended appropriation of $377,058 for fiscal year 2011-12 for the National Conference of State Legislatures dues represents no change from the amount appropriated for FY 2010-11.
LEGISLATURE
401
ALL FUNDS REQUIREMENTS FOR THE LEGISLATURE
FUND/ENTITY/MAJOR PURPOSE
AVAILABLE 2010-2011
REQUESTED 2011-2012
CHANGE FROM 2010-2011
General Fund: Lt. Governor $274,635 $274,635 $0 Senate 86,073,198 86,073,198 0 Assembly 102,296,491 102,296,491 0 Senate Finance Committee 5,830,456 5,830,456 0 Assembly Ways and Means Committee 5,830,456 5,830,456 0 Joint Entities: Legislative Ethics Commission 376,949 376,949 0 National Conference of State Legislatures Dues 377,058 377,058 0 Legislative Health Service 211,266 211,266 0 Legislative Library 798,221 798,221 0 Legislative Messenger Service 907,830 907,830 0 Legislative Bill Drafting Commission 13,009,482 13,009,482 0 Legislative Task Force on Demographic Research and Reapportionment
1,858,759 1,858,759 0
Joint Entities Total $17,539,565 $17,539,565 $0 GENERAL FUND TOTAL $217,844,801 $217,844,801 $0 Special Revenue Fund - Other: Legislative Computer Services Fund $1,500,000 $1,500,000 $0 Senate Recyclable Materials, Information Services and Conference Fund
50,000 50,000 0
Assembly Recyclable Materials, Information Services and Conference Fund
50,000 50,000 0
SPECIAL REVENUE FUND TOTAL $1,600,000 $1,600,000 $0 Grants and Bequests Fund: Restoration of Senate Chamber 250,000 250,000 0 Restoration of Assembly Chamber 250,000 250,000 0 GRANTS AND BEQUESTS FUND TOTAL $500,000 $500,000 $0

LEGISLATURE
402
SCHEDULE OF APPROPRIATIONS
Appropriated Requested for Title of Appropriation for 2010-11 2011-12 Change
OFFICE OF THE LIEUTENANT GOVERNOR Administration Program--Personal Service For personal service of employees and for temporary and expert services: Personal Service Regular $260,000 $260,000 $0
Administration Program--Nonpersonal Service
Supplies and materials (including liabilities incurred prior to April 1, 2011) $14,635 $14,635 $0 Total--Office of Lieutenant Governor $274,635 $274,635 $0
THE SENATE
Personal Service For payment of salaries to members, 62, pursuant to section five of the legislative law $4,929,000 $4,929,000 $0 For payment of allowances to members designated by the temporary president, pursuant to the schedule of such allowances set forth in section 5-a of the legislative law $1,289,500 $1,289,500 $0 For personal service of employees and for temporary and expert services of members' offices and of standing committees: Personal Service Regular $28,702,765 $28,702,765 $0 For personal service of employees and for temporary and expert services of majority leader and minority leader operations: Personal Service Regular $25,255,762 $25,255,762 $0

LEGISLATURE
403
Appropriated Requested for Title of Appropriation for 2010-11 2011-12 Change For personal service of employees and for temporary and expert services for the senate student program office: Personal Service Regular $158,384 $158,384 $0 Temporary Service $593,939 $593,939 $0 Total Personal Service $60,929,350 $60,929,350 $0
Nonpersonal Service For services and expenses of maintenance and operations (including liabilities incurred prior to April 1, 2011) Supplies and materials $4,068,485 $4,068,485 $0 Travel $1,554,141 $1,554,141 $0 Miscellaneous contractual services $16,897,989 $16,897,989 $0 Equipment $2,623,233 $2,623,233 $0 Total Nonpersonal Service $25,143,848 $25,143,848 $0 Grand Total--The Senate $86,073,198 $86,073,198 $0
THE ASSEMBLY
Personal Service Members, 150, payment of salaries pursuant to section five of the legislative law $11,925,000 $11,925,000 $0 For payment of allowances to members designated by the speaker $1,592,500 $1,592,500 $0 For personal service of employees and for temporary and expert services of members' offices and of standing committees and subcommittees: Personal Service Regular $23,112,207 $23,112,207 $0 Temporary Service $2,261,960 $2,261,960 $0

LEGISLATURE
404
Appropriated Requested for Title of Appropriation for 2010-11 2011-12 Change For personal service of employees and for temporary and expert services for administrative and program support operations: Personal Service Regular $38,770,768 $38,770,768 $0 Temporary Service $460,907 $460,907 $0 For the Assembly Intern and Youth Participation Program for personal service of employees and for temporary and expert services: Personal Service Regular $223,563 $223,563 $0 Temporary Service $705,586 $705,586 $0 Total Personal Service $79,052,491 $79,052,491 $0
Nonpersonal Service For services and expenses of maintenance and operations (including liabilities incurred prior to April 1, 2011) Supplies and materials $2,075,000 $2,075,000 $0 Travel $2,719,000 $2,719,000 $0 Miscellaneous contractual services $17,111,000 $17,111,000 $0 Equipment $1,339,000 $1,339,000 $0 Total Nonpersonal Service $23,244,000 $23,244,000 $0 Grand Total--The Assembly $102,296,491 $102,296,491 $0
SENATE FINANCE COMMITTEE
Personal Service For personal service, temporary and special services (including liabilities incurred prior to April 1, 2011): Personal Service Regular $5,291,456 $5,291,456 $0 Temporary Service $159,000 $159,000 $0 Total Personal Service $5,450,456 $5,450,456 $0

LEGISLATURE
405
Appropriated Requested for Title of Appropriation for 2010-11 2011-12 Change
Nonpersonal Service Supplies and Materials $188,000 $188,000 $0Travel $29,000 $29,000 $0Contractual Services $114,000 $114,000 $0Equipment $49,000 $49,000 $0Total Nonpersonal Service $380,000 $380,000 $0 Total--Senate Finance Committee $5,830,456 $5,830,456 $0
ASSEMBLY WAYS & MEANS COMMITTEE
Personal Service For personal service, temporary and special services (including liabilities incurred prior to April 1, 2011): Personal Service Regular $5,291,456 $5,291,456 $0 Temporary Service $159,000 $159,000 $0 Total Personal Service $5,450,456 $5,450,456 $0
Nonpersonal Service Supplies and Materials $188,000 $188,000 $0Travel $29,000 $29,000 $0Contractual Services $114,000 $114,000 $0Equipment $49,000 $49,000 $0Total Nonpersonal Service $380,000 $380,000 $0 Total--Assembly Ways & Means Committee $5,830,456 $5,830,456 $0
SENATE AND ASSEMBLY JOINT ENTITIES
LEGISLATIVE ETHICS COMMISSION For services and expenses of the legislative ethics commission pursuant to section 80 of the legislative law
Personal Service Personal Service Regular $359,282 $359,282 $0Temporary Service $10,000 $10,000 $0Total Personal Service $369,282 $369,282 $0

LEGISLATURE
406
Appropriated Requested for Title of Appropriation for 2010-11 2011-12 Change
Nonpersonal Service Supplies and Materials $5,667 $5,667 $0Contractual Services $1,000 $1,000 $0Equipment $1,000 $1,000 $0Total Nonpersonal Service $7,667 $7,667 $0 Total--Legislative Ethics Commission $376,949 $376,949 $0
NATIONAL CONFERENCE OF STATE LEGISLATURES For a contribution to the National Conference of State Legislatures: Supplies and Materials $377,058 $377,058 $0 Total--National Conference of State Legislatures $377,058 $377,058 $0
LEGISLATIVE HEALTH SERVICE For services and expenses for the operation of the legislative health service
Personal Service Personal Service Regular $183,566 $183,566 $0Total Personal Service $183,566 $183,566 $0
Nonpersonal Service Supplies and Materials $25,700 $25,700 $0Contractual Services $1,000 $1,000 $0Equipment $1,000 $1,000 $0Total Nonpersonal Service $27,700 $27,700 $0 Total--Legislative Health Service $211,266 $211,266 $0

LEGISLATURE
407
Appropriated Requested for Title of Appropriation for 2010-11 2011-12 Change
LEGISLATIVE LIBRARY For services and expenses and for temporary and special services for the operation of the legislative library
Personal Service Personal Service Regular $409,221 $409,221 $0Temporary Service $10,000 $10,000 $0Total Personal Service $419,221 $419,221 $0
Nonpersonal Service Supplies and Materials $247,500 $247,500 $0Contractual Services $99,000 $99,000 $0Equipment $32,500 $32,500 $0Total Nonpersonal Service $379,000 $379,000 $0 Total--Legislative Library $798,221 $798,221 $0
LEGISLATIVE MESSENGER SERVICE For services and expenses for the operation of the legislative messenger service
Personal Service Personal Service Regular $895,830 $895,830 $0Temporary Service $10,000 $10,000 $0Total Personal Service $905,830 $905,830 $0
Nonpersonal Service Supplies and Materials $2,000 $2,000 $0Total Nonpersonal Service $2,000 $2,000 $0 Total--Legislative Messenger Service $907,830 $907,830 $0

LEGISLATURE
408
Appropriated Requested for Title of Appropriation for 2010-11 2011-12 Change
LEGISLATIVE BILL DRAFTING COMMISSION For services and expenses, temporary and special services, and for expenses of maintenance and operation
Personal Service Personal Service Regular $10,588,688 $10,588,688 $0Temporary Service $169,240 $169,240 $0Total Personal Service $10,757,928 $10,757,928 $0
Nonpersonal Service Supplies and Materials $332,021 $332,021 $0Travel $50,577 $50,577 $0Contractual Services $1,710,163 $1,710,163 $0Equipment $158,793 $158,793 $0Total Nonpersonal Service $2,251,554 $2,251,554 $0 Total--Legislative Bill Drafting Commission $13,009,482 $13,009,482 $0 LEG. TASK FORCE ON DEMOGRAPHIC RESEARCH AND REAPPORTIONMENT
For services and expenses (including liabilities incurred prior to April 1, 2011) of the task force for senate purposes
Personal Service Personal Service Regular $346,923 $346,923 $0Temporary Service $5,000 $5,000 $0Total Personal Service $351,923 $351,923 $0
Nonpersonal Service Travel $3,000 $3,000 $0Contractual Services $3,402 $3,402 $0Total Nonpersonal Service $6,402 $6,402 $0 Total--Senate $358,325 $358,325 $0
LEGISLATURE
409
Appropriated Requested for Title of Appropriation for 2010-11 2011-12 Change For services and expenses (including liabilities incurred prior to April 1, 2011) of the task force for assembly purposes
Personal Service Personal Service Regular $338,125 $338,125 $0Temporary Service $9,000 $9,000 $0Total Personal Service $347,125 $347,125 $0
Nonpersonal Service Travel $1,000 $1,000 $0Contractual Services $10,200 $10,200 $0Total Nonpersonal Service $11,200 $11,200 $0 Total--Assembly $358,325 $358,325 $0 For services and expenses (including liabilities incurred prior to April 1, 2011) of the task force for joint operations
Personal Service Personal Service Regular $797,109 $797,109 $0Temporary Service $9,000 $9,000 $0Total Personal Service $806,109 $806,109 $0
Nonpersonal Service Supplies and Materials $14,000 $14,000 $0Travel $5,000 $5,000 $0Contractual Services $109,000 $109,000 $0Equipment $208,000 $208,000 $0Total Nonpersonal Service $336,000 $336,000 $0 Total--Joint Operations $1,142,109 $1,142,109 $0 Total--Task Force on Demographic Research and Reapportionment $1,858,759 $1,858,759 $0 Grand Total--Senate and Assembly Joint Entities $17,539,565 $17,539,565 $0

LEGISLATURE
410
Appropriated Requested for Title of Appropriation for 2010-11 2011-12 Change
SPECIAL REVENUE FUND - OTHER
LEGISLATIVE COMPUTER SERVICES FUND For services and expenses of the legislative computer services fund
Nonpersonal Service Contractual Services $1,000,000 $1,000,000 $0Equipment $500,000 $500,000 $0Total Nonpersonal Service $1,500,000 $1,500,000 $0 Total--Legislative Computer Services Fund $1,500,000 $1,500,000 $0
SENATE RECYCLABLE MATERIALS, INFORMATION SERVICES AND CONFERENCE FUND
For services and expenses of the senate recyclable materials, information services and conference fund
Nonpersonal Service Supplies and Materials $50,000 $50,000 $0Total Nonpersonal Service $50,000 $50,000 $0 Total--Senate Recyclable Materials, Information Services and Conference Fund $50,000 $50,000 $0
ASSEMBLY RECYCLABLE MATERIALS, INFORMATION SERVICESAND CONFERENCE FUND
For services and expenses of the assembly recyclable materials, information services and conference fund
Nonpersonal Service Supplies and Materials $50,000 $50,000 $0Total Nonpersonal Service $50,000 $50,000 $0 Total--Assembly Recyclable Materials, Information Services and Conference Fund $50,000 $50,000 $0

LEGISLATURE
411
Appropriated Requested for Title of Appropriation for 2010-11 2011-12 Change
GRANTS AND BEQUESTS FUND - LEGISLATURE
SENATE For services and expenses relative to restoration of the Senate Chamber and other purposes as funded by non-state grants
Nonpersonal Service Contractual Services $250,000 $250,000 $0Total Nonpersonal Service $250,000 $250,000 $0 Total--Senate Grants and Bequests Fund $250,000 $250,000 $0
ASSEMBLY For services and expenses relative to restoration of the Assembly Chamber and other purposes as funded by non-state grants
Nonpersonal Service Contractual Services $250,000 $250,000 $0Total Nonpersonal Service $250,000 $250,000 $0 Total--Assembly Grants and Bequests Fund $250,000 $250,000 $0

412
SUMMARY OF APPROPRIATIONS
ALL FUNDS RECOMMENDED 2011-12
COMPARED TO 2010-11 AVAILABLE (dollars)
Available2010-11
StateOperations
Recommended2011-12
Aid toLocalities
Recommended2011-12
Capital Projects
Recommended 2011-12
TotalRecommended
2011-12Change From
2010-11Adirondack Park Agency 6,319,000 5,307,000 0 500,000 5,807,000 (512,000)Aging, Office for the 243,478,400 13,810,600 224,419,000 0 238,229,600 (5,248,800)Agriculture and Markets, Department of 171,942,000 125,798,000 33,809,000 3,000,000 162,607,000 (9,335,000)Alcoholic Beverage Control, Division of 22,335,000 16,860,000 0 0 16,860,000 (5,475,000)Arts, Council on the 44,474,000 4,674,000 34,244,000 0 38,918,000 (5,556,000)Audit and Control, Department of 288,454,000 252,308,000 32,025,000 0 284,333,000 (4,121,000)Budget, Division of the 59,558,000 53,610,000 0 0 53,610,000 (5,948,000)Children and Family Services, Office of 3,873,463,400 529,200,000 3,138,976,300 37,675,000 3,705,851,300 (167,612,100)City University of New York 3,547,959,110 2,056,290,000 1,202,703,000 336,461,000 3,595,454,000 47,494,890 Civil Service, Department of 61,554,000 59,695,000 0 0 59,695,000 (1,859,000)Consumer Protection Board, State 670,000 0 0 0 0 (670,000)Correctional Services, Department of 3,217,878,000 2,605,074,000 17,171,000 320,000,000 2,942,245,000 (275,633,000)Criminal Justice Services, Division of 415,425,000 114,350,000 232,565,000 0 346,915,000 (68,510,000)Developmental Disabilities Planning Council 4,760,000 4,760,000 0 0 4,760,000 0 Economic Development, Department of 30,668,000 24,512,000 3,815,000 0 28,327,000 (2,341,000)Education Department, State 32,830,662,000 566,868,000 29,046,154,000 17,400,000 29,630,422,000 (3,200,240,000)Elections, State Board of 14,135,000 12,521,000 1,000,000 0 13,521,000 (614,000)Empire State Development Corporation 70,896,000 0 55,239,000 255,550,000 310,789,000 239,893,000 Employee Relations, Office of 7,121,000 6,792,000 0 0 6,792,000 (329,000)Energy Research and Development Authority,
New York State 35,477,000 8,090,000 8,140,000 15,310,000 31,540,000 (3,937,000)Environmental Conservation, Department of 1,003,080,300 440,476,000 1,675,000 511,834,000 953,985,000 (49,095,300)Environmental Facilities Corporation 12,653,000 12,310,000 0 343,000 12,653,000 0 Executive Chamber 19,938,000 17,944,000 0 0 17,944,000 (1,994,000)Financial Regulation, Department of 557,534,555 338,430,823 225,566,000 0 563,996,823 6,462,268 General Services, Office of 577,582,000 462,212,000 0 84,000,000 546,212,000 (31,370,000)Health, Department of 58,538,444,077 2,244,123,100 53,885,720,290 90,433,000 56,220,276,390 (2,318,167,687)Higher Education Services Corporation, New
York State 1,031,613,000 104,930,000 971,893,000 0 1,076,823,000 45,210,000 Homeland Security and Emergency Services,
Division of 836,450,700 135,530,000 682,751,000 0 818,281,000 (18,169,700)Housing and Community Renewal, Division of 464,741,000 91,987,000 141,630,000 74,200,000 307,817,000 (156,924,000)Mortgage Agency, State of New York 174,520,000 76,800,000 96,372,000 0 173,172,000 (1,348,000)Human Rights, Division of 22,745,000 21,293,000 0 0 21,293,000 (1,452,000)Inspector General, Office of the 6,238,000 5,624,000 0 0 5,624,000 (614,000)Insurance Department 0 5,526,404 0 0 5,526,404 5,526,404 Interest on Lawyer Account 46,873,000 1,889,000 45,000,000 0 46,889,000 16,000 Judicial Commissions 5,474,000 5,452,000 0 0 5,452,000 (22,000)Labor, Department of 10,866,113,000 9,048,595,000 192,869,000 0 9,241,464,000 (1,624,649,000)Law, Department of 210,026,000 209,020,000 0 0 209,020,000 (1,006,000)Lieutenant Governor, Office of the 700,000 630,000 0 0 630,000 (70,000)Lottery, Division of the 95,310,700 89,704,000 0 0 89,704,000 (5,606,700)Medicaid Inspector General, Office of the 88,161,000 80,353,000 0 0 80,353,000 (7,808,000)Mental Hygiene, Department of 600,000,000 600,000,000 0 0 600,000,000 0 Mental Health, Office of 3,665,719,000 2,051,226,000 1,298,434,000 220,874,000 3,570,534,000 (95,185,000)Alcoholism and Substance Abuse Services,
Office of 716,878,000 119,013,400 454,121,000 97,606,000 670,740,400 (46,137,600)Metropolitan Transportation Authority 2,253,300,000 0 2,151,000,000 0 2,151,000,000 (102,300,000)Military and Naval Affairs, Division of 99,976,000 66,915,000 650,000 39,200,000 106,765,000 6,789,000 Motor Vehicles, Department of 356,620,000 121,312,000 20,620,000 201,137,000 343,069,000 (13,551,000)Olympic Regional Development Authority 5,576,000 5,054,000 0 0 5,054,000 (522,000)Parks, Recreation and Historic Preservation,
Office of 287,565,400 214,266,000 8,805,000 46,801,000 269,872,000 (17,693,400)People with Developmental Disabilities, Office
for 4,767,145,000 2,150,820,700 2,296,901,500 151,995,000 4,599,717,200 (167,427,800)Public Employment Relations Board 4,543,000 4,146,000 0 0 4,146,000 (397,000)Public Integrity, Commission on 4,308,000 3,878,000 0 0 3,878,000 (430,000)Public Service Department 80,142,000 78,892,000 1,500,000 0 80,392,000 250,000 Quality of Care and Advocacy for Persons With
Disabilities, Commission on 18,689,000 17,497,000 648,000 0 18,145,000 (544,000)Racing and Wagering Board, State 22,470,000 24,750,000 0 0 24,750,000 2,280,000 Regulatory Reform, Governor's Office of 2,350,000 0 0 0 0 (2,350,000)Science, Technology and Innovation, NYS
Foundation for 68,712,000 0 0 0 0 (68,712,000)State, Department of 185,776,940 66,568,539 67,245,000 0 133,813,539 (51,963,401)State Police, Division of 723,239,000 665,859,000 0 11,500,000 677,359,000 (45,880,000)State University of New York 8,706,880,686 7,912,822,600 431,701,345 1,002,571,000 9,347,094,945 640,214,259 State University Construction Fund 25,678,000 26,172,000 0 0 26,172,000 494,000 Taxation and Finance, Department of 540,294,000 452,355,000 750,000 0 453,105,000 (87,189,000)Tax Appeals, Division of 3,154,000 3,021,000 0 0 3,021,000 (133,000)Technology, Office for 437,168,000 434,112,000 0 0 434,112,000 (3,056,000)Temporary and Disability Assistance, Office of 5,934,749,700 472,292,000 5,064,674,000 30,000,000 5,566,966,000 (367,783,700)Thruway Authority, New York State 2,000,000 0 0 2,000,000 2,000,000 0 Transportation, Department of 8,792,745,900 47,404,000 4,232,596,900 3,986,577,000 8,266,577,900 (526,168,000)Veterans' Affairs, Division of 16,863,000 7,772,000 8,526,000 0 16,298,000 (565,000)

SUMMARY OF APPROPRIATIONS
413
ALL FUNDS RECOMMENDED 2011-12
COMPARED TO 2010-11 AVAILABLE (dollars)
Available2010-11
StateOperations
Recommended2011-12
Aid toLocalities
Recommended2011-12
Capital Projects
Recommended 2011-12
TotalRecommended
2011-12Change From
2010-11Victim Services, Office of 1,450,000 0 0 0 0 (1,450,000)Welfare Inspector General, Office of 1,597,000 1,555,000 0 0 1,555,000 (42,000)Workers' Compensation Board 204,749,000 204,749,000 0 0 204,749,000 0 Subtotal 158,035,764,868 35,605,801,166 106,311,909,335 7,536,967,000 149,454,677,501 (8,581,087,367) Miscellaneous--All State Departments and
Agencies Deferred Compensation Board 931,000 931,000 0 0 931,000 0 General State Charges 2,478,665,000 2,990,150,000 0 0 2,990,150,000 511,485,000 Green Thumb 2,831,000 2,831,000 0 0 2,831,000 0 Greenway Heritage Conservancy for the
Hudson River Valley 184,000 166,000 0 0 166,000 (18,000)Health Insurance Contingency Reserve 651,240,000 605,057,000 0 0 605,057,000 (46,183,000)Health Insurance Reserve Receipts Fund 192,400,000 192,400,000 0 0 192,400,000 0 Higher Education - Miscellaneous 829,800 829,800 0 0 829,800 0 Homeland Security - Miscellaneous 168,000,000 169,000,000 0 0 169,000,000 1,000,000 Hudson River Valley Greenway Communities
Council 339,000 185,000 136,000 0 321,000 (18,000)Indigent Legal Services, Office of 78,500,000 3,000,000 77,000,000 0 80,000,000 1,500,000 Insurance and Securities Funds Reserve
Guarantee 1,605,000,000 1,605,000,000 0 0 1,605,000,000 0 Labor Management Committees 39,593,000 5,800,000 0 0 5,800,000 (33,793,000)Local Government Assistance 805,842,698 3,212,000 843,600,000 0 846,812,000 40,969,302 National and Community Service 36,730,000 30,342,000 350,000 0 30,692,000 (6,038,000)Payments to STARC / NYC 170,000,000 0 170,000,000 0 170,000,000 0 Power Authority, New York 318,000,000 318,000,000 0 0 318,000,000 0 Reserve for Federal Audit Disallowances 200,000,000 200,000,000 0 0 200,000,000 0 State Equipment Finance Program 187,285,000 0 0 92,751,000 92,751,000 (94,534,000)Statewide Financial System 1,684,000 45,000,000 0 0 45,000,000 43,316,000 Tribal State Compact Revenue 39,100,000 0 44,300,000 0 44,300,000 5,200,000 Workers' Compensation Reserve 18,030,000 16,130,000 0 0 16,130,000 (1,900,000)Paybill Transfer 4,567,000 0 0 0 0 (4,567,000) Subtotal 6,999,751,498 6,188,033,800 1,135,386,000 92,751,000 7,416,170,800 416,419,302 Judiciary 2,671,301,640 2,577,699,799 143,323,371 0 2,721,023,170 49,721,530 Legislature 219,944,801 219,944,801 0 0 219,944,801 0 Total 167,926,762,807 44,591,479,566 107,590,618,706 7,629,718,000 159,811,816,272 (8,114,946,535) Debt Service 9,288,275,000 0 0 0 8,879,675,000 (408,600,000) Grand Total 177,215,037,807 44,591,479,566 107,590,618,706 7,629,718,000 168,691,491,272 (8,523,546,535) Special Emergency Appropriation 100,000,000 100,000,000 Special Federal Emergency Appropriation 1,000,000,000 1,000,000,000

SUMMARY OF APPROPRIATIONS
414
STATE OPERATIONS RECAPITULATION OF 2011-12 RECOMMENDATIONS
BY FUND TYPE (dollars)
General
SpecialRevenue
Federal
SpecialRevenue
Other EnterpriseInternal Service Fiduciary Total
Adirondack Park Agency 4,607,000 700,000 0 0 0 0 5,307,000Aging, Office for the 2,473,600 10,987,000 250,000 100,000 0 0 13,810,600Agriculture and Markets, Department of 26,357,000 29,644,000 46,600,000 21,361,000 0 1,836,000 125,798,000Alcoholic Beverage Control, Division of 0 0 16,860,000 0 0 0 16,860,000Arts, Council on the 4,574,000 100,000 0 0 0 0 4,674,000Audit and Control, Department of 125,801,000 0 18,508,000 0 6,609,000 101,390,000 252,308,000Budget, Division of the 29,029,000 0 22,931,000 0 1,650,000 0 53,610,000Children and Family Services, Office of 283,251,000 140,836,000 104,538,000 475,000 100,000 0 529,200,000City University of New York 0 0 175,400,000 0 0 1,880,890,000 2,056,290,000Civil Service, Department of 16,734,000 0 2,257,000 0 40,704,000 0 59,695,000Correctional Services, Department of 2,418,614,000 39,400,000 30,355,000 43,013,000 73,692,000 0 2,605,074,000Criminal Justice Services, Division of 57,787,000 30,361,000 25,312,000 0 890,000 0 114,350,000Developmental Disabilities Planning
Council 0 4,750,000 0 10,000 0 0 4,760,000Economic Development, Department of 19,747,000 1,000,000 3,765,000 0 0 0 24,512,000Education Department, State 38,309,000 345,703,000 149,293,000 0 33,563,000 0 566,868,000Elections, State Board of 5,521,000 6,500,000 500,000 0 0 0 12,521,000Employee Relations, Office of 2,961,000 0 121,000 0 3,710,000 0 6,792,000Energy Research and Development
Authority, New York State 0 0 8,090,000 0 0 0 8,090,000Environmental Conservation, Department
of 108,327,000 76,012,000 256,077,000 0 60,000 0 440,476,000Environmental Facilities Corporation 0 0 12,310,000 0 0 0 12,310,000Executive Chamber 17,854,000 0 90,000 0 0 0 17,944,000Financial Regulation, Department of 0 0 338,430,823 0 0 0 338,430,823General Services, Office of 128,912,000 8,230,000 21,591,000 2,009,000 300,720,000 750,000 462,212,000Health, Department of 244,615,000 1,480,570,000 518,938,100 0 0 0 2,244,123,100Higher Education Services Corporation,
New York State 4,037,000 12,601,000 88,292,000 0 0 0 104,930,000Homeland Security and Emergency
Services, Division of 10,754,000 9,111,000 63,665,000 50,000,000 2,000,000 0 135,530,000Housing and Community Renewal,
Division of 21,537,000 14,269,000 56,181,000 0 0 0 91,987,000Mortgage Agency, State of New York 76,800,000 0 0 0 0 0 76,800,000Human Rights, Division of 13,070,000 8,223,000 0 0 0 0 21,293,000Inspector General, Office of the 5,524,000 0 100,000 0 0 0 5,624,000Insurance Department 0 0 5,526,404 0 0 0 5,526,404Interest on Lawyer Account 0 0 1,889,000 0 0 0 1,889,000Judicial Commissions 5,452,000 0 0 0 0 0 5,452,000Labor, Department of 0 574,015,000 74,580,000 8,400,000,000 0 0 9,048,595,000Law, Department of 101,381,000 34,820,000 72,819,000 0 0 0 209,020,000Lieutenant Governor, Office of the 630,000 0 0 0 0 0 630,000Lottery, Division of the 0 0 89,704,000 0 0 0 89,704,000Medicaid Inspector General, Office of the 29,577,000 47,076,000 3,700,000 0 0 0 80,353,000Mental Hygiene, Department of 0 0 600,000,000 0 0 0 600,000,000Mental Health, Office of 800,000 2,038,000 2,037,172,000 8,606,000 2,610,000 0 2,051,226,000Alcoholism and Substance Abuse
Services, Office of 0 6,530,000 112,483,400 0 0 0 119,013,400Military and Naval Affairs, Division of 15,394,000 42,780,000 8,741,000 0 0 0 66,915,000Motor Vehicles, Department of 0 17,381,000 90,431,000 0 13,500,000 0 121,312,000Olympic Regional Development Authority 4,700,000 0 354,000 0 0 0 5,054,000Parks, Recreation and Historic
Preservation, Office of 119,461,200 6,650,900 88,153,900 0 0 0 214,266,000People with Developmental Disabilities,
Office for 0 751,000 2,147,051,700 2,668,000 350,000 0 2,150,820,700Public Employment Relations Board 3,571,000 0 575,000 0 0 0 4,146,000Public Integrity, Commission on 3,878,000 0 0 0 0 0 3,878,000Public Service Department 0 3,500,000 75,392,000 0 0 0 78,892,000Quality of Care and Advocacy for
Persons With Disabilities, Commission on 4,922,000 8,345,000 4,185,000 45,000 0 0 17,497,000
Racing and Wagering Board, State 0 0 24,750,000 0 0 0 24,750,000State, Department of 20,249,700 7,950,000 38,368,839 0 0 0 66,568,539State Police, Division of 422,174,000 7,335,000 236,350,000 0 0 0 665,859,000State University of New York 2,190,233,300 363,600,000 5,339,889,300 0 19,100,000 0 7,912,822,600State University Construction Fund 0 0 26,172,000 0 0 0 26,172,000Taxation and Finance, Department of 310,682,000 2,500,000 108,042,000 0 31,131,000 0 452,355,000Tax Appeals, Division of 3,021,000 0 0 0 0 0 3,021,000Technology, Office for 27,502,000 0 3,445,000 0 403,165,000 0 434,112,000Temporary and Disability Assistance,
Office of 56,804,000 275,086,000 139,203,000 0 1,199,000 0 472,292,000Transportation, Department of 0 16,315,000 31,089,000 0 0 0 47,404,000Veterans' Affairs, Division of 5,806,000 1,966,000 0 0 0 0 7,772,000

SUMMARY OF APPROPRIATIONS
415
STATE OPERATIONS RECAPITULATION OF 2011-12 RECOMMENDATIONS
BY FUND TYPE (dollars)
General
SpecialRevenue
Federal
SpecialRevenue
Other EnterpriseInternal Service Fiduciary Total
Welfare Inspector General, Office of 378,000 0 1,177,000 0 0 0 1,555,000Workers' Compensation Board 0 0 204,749,000 0 0 0 204,749,000 Subtotal 6,993,811,800 3,637,635,900 13,526,447,466 8,528,287,000 934,753,000 1,984,866,000 35,605,801,166 Miscellaneous--All State Departments
and Agencies Deferred Compensation Board 114,000 0 817,000 0 0 0 931,000General State Charges 2,889,150,000 0 0 0 0 101,000,000 2,990,150,000Green Thumb 2,831,000 0 0 0 0 0 2,831,000Greenway Heritage Conservancy for the
Hudson River Valley 166,000 0 0 0 0 0 166,000Health Insurance Contingency Reserve 605,057,000 0 0 0 0 0 605,057,000Health Insurance Reserve Receipts Fund 0 0 0 0 0 192,400,000 192,400,000Higher Education - Miscellaneous 0 0 829,800 0 0 0 829,800Homeland Security - Miscellaneous 0 50,000,000 9,000,000 0 0 0 59,000,000Hudson River Valley Greenway
Communities Council 185,000 0 0 0 0 0 185,000Indigent Legal Services, Office of 0 0 3,000,000 0 0 0 3,000,000Insurance and Securities Funds Reserve
Guarantee 1,605,000,000 0 0 0 0 0 1,605,000,000Labor Management Committees 5,300,000 0 500,000 0 0 0 5,800,000Local Government Assistance 0 0 3,212,000 0 0 0 3,212,000National and Community Service 342,000 30,000,000 0 0 0 0 30,342,000Power Authority, New York 318,000,000 0 0 0 0 0 318,000,000Reserve for Federal Audit Disallowances 200,000,000 0 0 0 0 0 200,000,000Statewide Financial System 0 0 45,000,000 0 0 0 45,000,000Workers' Compensation Reserve 16,130,000 0 0 0 0 0 16,130,000 Subtotal 5,642,275,000 80,000,000 62,358,800 0 0 293,400,000 6,078,033,800 Homeland Security - Miscellaneous 110,000,000 Subtotal-Miscellaneous 6,188,033,800 Judiciary 2,431,343,088 10,500,000 135,856,711 0 0 0 2,577,699,799Legislature 217,844,801 0 2,100,000 0 0 0 219,944,801 Subtotal 2,649,187,889 10,500,000 137,956,711 0 0 0 2,797,644,600 Total 15,285,274,689 3,728,135,900 13,726,762,977 8,528,287,000 934,753,000 2,278,266,000 44,591,479,566
SUMMARY OF APPROPRIATIONS
416
STATE OPERATIONS GENERAL FUND
(dollars) Available
2010-11Recommended
2011-12 ChangeAdirondack Park Agency 5,119,000 4,607,000 (512,000)Aging, Office for the 2,748,400 2,473,600 (274,800)Agriculture and Markets, Department of 29,286,000 26,357,000 (2,929,000)Arts, Council on the 4,838,000 4,574,000 (264,000)Audit and Control, Department of 139,773,000 125,801,000 (13,972,000)Budget, Division of the 34,477,000 29,029,000 (5,448,000)Children and Family Services, Office of 287,088,000 283,251,000 (3,837,000)Civil Service, Department of 18,593,000 16,734,000 (1,859,000)Correctional Services, Department of 2,689,347,000 2,418,614,000 (270,733,000)Criminal Justice Services, Division of 64,185,000 57,787,000 (6,398,000)Economic Development, Department of 21,941,000 19,747,000 (2,194,000)Education Department, State 42,564,000 38,309,000 (4,255,000)Elections, State Board of 6,135,000 5,521,000 (614,000)Employee Relations, Office of 3,290,000 2,961,000 (329,000)Environmental Conservation, Department of 120,373,100 108,327,000 (12,046,100)Executive Chamber 19,838,000 17,854,000 (1,984,000)Financial Regulation, Department of 150,000 0 (150,000)General Services, Office of 143,172,000 128,912,000 (14,260,000)Health, Department of 284,576,500 244,615,000 (39,961,500)Higher Education Services Corporation, New York State 10,000,000 4,037,000 (5,963,000)Homeland Security and Emergency Services, Division of 11,957,000 10,754,000 (1,203,000)Housing and Community Renewal, Division of 23,930,000 21,537,000 (2,393,000)Mortgage Agency, State of New York 76,800,000 76,800,000 0 Human Rights, Division of 14,522,000 13,070,000 (1,452,000)Inspector General, Office of the 6,138,000 5,524,000 (614,000)Judicial Commissions 5,474,000 5,452,000 (22,000)Law, Department of 112,641,000 101,381,000 (11,260,000)Lieutenant Governor, Office of the 700,000 630,000 (70,000)Medicaid Inspector General, Office of the 33,274,000 29,577,000 (3,697,000)Mental Health, Office of 800,000 800,000 0 Military and Naval Affairs, Division of 17,105,000 15,394,000 (1,711,000)Olympic Regional Development Authority 5,222,000 4,700,000 (522,000)Parks, Recreation and Historic Preservation, Office of 132,734,600 119,461,200 (13,273,400)Public Employment Relations Board 3,968,000 3,571,000 (397,000)Public Integrity, Commission on 4,308,000 3,878,000 (430,000)Quality of Care and Advocacy for Persons With Disabilities,
Commission on 5,466,000 4,922,000 (544,000)Regulatory Reform, Governor's Office of 2,350,000 0 (2,350,000)Science, Technology and Innovation, NYS Foundation for 2,851,000 0 (2,851,000)State, Department of 23,415,000 20,249,700 (3,165,300)State Police, Division of 469,079,000 422,174,000 (46,905,000)State University of New York 2,298,224,900 2,190,233,300 (107,991,600)Taxation and Finance, Department of 376,366,000 310,682,000 (65,684,000)Tax Appeals, Division of 3,154,000 3,021,000 (133,000)Technology, Office for 30,558,000 27,502,000 (3,056,000)Temporary and Disability Assistance, Office of 63,116,000 56,804,000 (6,312,000)Veterans' Affairs, Division of 6,451,000 5,806,000 (645,000)Welfare Inspector General, Office of 420,000 378,000 (42,000) Subtotal 7,658,518,500 6,993,811,800 (664,706,700) Miscellaneous--All State Departments and Agencies Deferred Compensation Board 114,000 114,000 0 General State Charges 2,377,665,000 2,889,150,000 511,485,000 Green Thumb 2,831,000 2,831,000 0 Greenway Heritage Conservancy for the Hudson River Valley 184,000 166,000 (18,000)Health Insurance Contingency Reserve 651,240,000 605,057,000 (46,183,000)Hudson River Valley Greenway Communities Council 203,000 185,000 (18,000)Insurance and Securities Funds Reserve Guarantee 1,605,000,000 1,605,000,000 0 Labor Management Committees 39,093,000 5,300,000 (33,793,000)National and Community Service 380,000 342,000 (38,000)Power Authority, New York 318,000,000 318,000,000 0 Reserve for Federal Audit Disallowances 200,000,000 200,000,000 0 Workers' Compensation Reserve 18,030,000 16,130,000 (1,900,000)Paybill Transfer 4,552,000 0 (4,552,000) Subtotal 5,217,292,000 5,642,275,000 424,983,000 Judiciary 2,380,401,718 2,431,343,088 50,941,370 Legislature 217,844,801 217,844,801 0 Total 15,474,057,019 15,285,274,689 (188,782,330) Adjustments Recommended Deficiencies (101,000) Transfer To: Special Revenue Funds - Other 1,684,000 Appropriated 2010-11 15,475,640,019

SUMMARY OF APPROPRIATIONS
417
STATE OPERATIONS SPECIAL REVENUE FUNDS - FEDERAL
(dollars) Available
2010-11Recommended
2011-12 ChangeAdirondack Park Agency 700,000 700,000 0 Aging, Office for the 11,252,000 10,987,000 (265,000)Agriculture and Markets, Department of 29,644,000 29,644,000 0 Arts, Council on the 100,000 100,000 0 Children and Family Services, Office of 142,165,700 140,836,000 (1,329,700)Correctional Services, Department of 38,900,000 39,400,000 500,000 Criminal Justice Services, Division of 40,886,000 30,361,000 (10,525,000)Developmental Disabilities Planning Council 4,750,000 4,750,000 0 Economic Development, Department of 1,000,000 1,000,000 0 Education Department, State 367,224,000 345,703,000 (21,521,000)Elections, State Board of 6,500,000 6,500,000 0 Environmental Conservation, Department of 127,419,000 76,012,000 (51,407,000)Financial Regulation, Department of 1,000,000 0 (1,000,000)General Services, Office of 11,340,000 8,230,000 (3,110,000)Health, Department of 1,335,200,200 1,480,570,000 145,369,800 Higher Education Services Corporation, New York State 10,000,000 12,601,000 2,601,000 Homeland Security and Emergency Services, Division of 9,111,000 9,111,000 0 Housing and Community Renewal, Division of 16,437,000 14,269,000 (2,168,000)Human Rights, Division of 8,223,000 8,223,000 0 Labor, Department of 543,968,000 574,015,000 30,047,000 Law, Department of 35,820,000 34,820,000 (1,000,000)Medicaid Inspector General, Office of the 50,804,000 47,076,000 (3,728,000)Mental Health, Office of 2,038,000 2,038,000 0 Alcoholism and Substance Abuse Services, Office of 6,805,000 6,530,000 (275,000)Military and Naval Affairs, Division of 42,780,000 42,780,000 0 Motor Vehicles, Department of 16,390,000 17,381,000 991,000 Parks, Recreation and Historic Preservation, Office of 5,700,900 6,650,900 950,000 People with Developmental Disabilities, Office for 751,000 751,000 0 Public Service Department 3,750,000 3,500,000 (250,000)Quality of Care and Advocacy for Persons With Disabilities,
Commission on 8,345,000 8,345,000 0 State, Department of 13,692,309 7,950,000 (5,742,309)State Police, Division of 6,310,000 7,335,000 1,025,000 State University of New York 358,500,000 363,600,000 5,100,000 Taxation and Finance, Department of 2,500,000 2,500,000 0 Temporary and Disability Assistance, Office of 250,359,000 275,086,000 24,727,000 Transportation, Department of 18,031,000 16,315,000 (1,716,000)Veterans' Affairs, Division of 1,966,000 1,966,000 0 Homeland Security - Miscellaneous 50,000,000 50,000,000 0 National and Community Service 36,000,000 30,000,000 (6,000,000)Judiciary 9,100,000 10,500,000 1,400,000 Total 3,625,462,109 3,728,135,900 102,673,791 Adjustments Prior Year Deficiencies 1,250,000 Transfer From: Special Revenue Funds - Federal (Aid To Localities) (50,000,000) Transfer To: Special Revenue Funds - Federal (Aid To Localities) 1,948,000 Appropriated 2010-11 3,578,660,109

SUMMARY OF APPROPRIATIONS
418
STATE OPERATIONS SPECIAL REVENUE FUNDS - OTHER
(dollars) Available
2010-11Recommended
2011-12 ChangeAging, Office for the 250,000 250,000 0 Agriculture and Markets, Department of 47,257,000 46,600,000 (657,000)Alcoholic Beverage Control, Division of 22,335,000 16,860,000 (5,475,000)Arts, Council on the 1,777,000 0 (1,777,000)Audit and Control, Department of 11,008,000 18,508,000 7,500,000 Budget, Division of the 23,431,000 22,931,000 (500,000)Children and Family Services, Office of 104,535,000 104,538,000 3,000 City University of New York 145,000,000 175,400,000 30,400,000 Civil Service, Department of 2,257,000 2,257,000 0 Consumer Protection Board, State 670,000 0 (670,000)Correctional Services, Department of 30,755,000 30,355,000 (400,000)Criminal Justice Services, Division of 30,917,000 25,312,000 (5,605,000)Economic Development, Department of 3,765,000 3,765,000 0 Education Department, State 154,983,000 149,293,000 (5,690,000)Elections, State Board of 500,000 500,000 0 Employee Relations, Office of 121,000 121,000 0 Energy Research and Development Authority, New York State 6,996,000 8,090,000 1,094,000 Environmental Conservation, Department of 266,634,300 256,077,000 (10,557,300)Environmental Facilities Corporation 12,310,000 12,310,000 0 Executive Chamber 100,000 90,000 (10,000)Financial Regulation, Department of 330,818,555 338,430,823 7,612,268 General Services, Office of 21,591,000 21,591,000 0 Health, Department of 540,291,587 518,938,100 (21,353,487)Higher Education Services Corporation, New York State 100,047,000 88,292,000 (11,755,000)Homeland Security and Emergency Services, Division of 63,665,000 63,665,000 0 Housing and Community Renewal, Division of 58,936,000 56,181,000 (2,755,000)Inspector General, Office of the 100,000 100,000 0 Insurance Department 0 5,526,404 5,526,404 Interest on Lawyer Account 1,873,000 1,889,000 16,000 Labor, Department of 74,580,000 74,580,000 0 Law, Department of 61,565,000 72,819,000 11,254,000 Lottery, Division of the 95,310,700 89,704,000 (5,606,700)Medicaid Inspector General, Office of the 4,083,000 3,700,000 (383,000)Mental Hygiene, Department of 600,000,000 600,000,000 0 Mental Health, Office of 2,141,991,000 2,037,172,000 (104,819,000)Alcoholism and Substance Abuse Services, Office of 123,905,000 112,483,400 (11,421,600)Military and Naval Affairs, Division of 8,741,000 8,741,000 0 Motor Vehicles, Department of 90,478,000 90,431,000 (47,000)Olympic Regional Development Authority 354,000 354,000 0 Parks, Recreation and Historic Preservation, Office of 88,153,900 88,153,900 0 People with Developmental Disabilities, Office for 2,260,020,000 2,147,051,700 (112,968,300)Public Employment Relations Board 575,000 575,000 0 Public Service Department 75,392,000 75,392,000 0 Quality of Care and Advocacy for Persons With Disabilities,
Commission on 4,185,000 4,185,000 0 Racing and Wagering Board, State 22,470,000 24,750,000 2,280,000 Science, Technology and Innovation, NYS Foundation for 500,000 0 (500,000)State, Department of 40,786,000 38,368,839 (2,417,161)State Police, Division of 236,350,000 236,350,000 0 State University of New York 4,937,888,400 5,339,889,300 402,000,900 State University Construction Fund 25,678,000 26,172,000 494,000 Taxation and Finance, Department of 107,297,000 108,042,000 745,000 Technology, Office for 3,445,000 3,445,000 0 Temporary and Disability Assistance, Office of 156,618,000 139,203,000 (17,415,000)Transportation, Department of 32,309,000 31,089,000 (1,220,000)Welfare Inspector General, Office of 1,177,000 1,177,000 0 Workers' Compensation Board 204,749,000 204,749,000 0 Deferred Compensation Board 817,000 817,000 0 Higher Education - Miscellaneous 829,800 829,800 0 Homeland Security - Miscellaneous 3,000,000 9,000,000 6,000,000 Indigent Legal Services, Office of 1,500,000 3,000,000 1,500,000 Labor Management Committees 500,000 500,000 0 Local Government Assistance 3,212,000 3,212,000 0 Statewide Financial System 1,684,000 45,000,000 43,316,000 Paybill Transfer 15,000 0 (15,000)Judiciary 138,246,638 135,856,711 (2,389,927)Legislature 2,100,000 2,100,000 0 Total 13,533,428,880 13,726,762,977 193,334,097 Adjustments Transfer From: General Fund (1,684,000) Transfer To: Enterprise Funds 20,000,000 Appropriated 2010-11 13,551,744,880

SUMMARY OF APPROPRIATIONS
419
STATE OPERATIONS FIDUCIARY FUNDS
(dollars) Available
2010-11Recommended
2011-12 ChangeAgriculture and Markets, Department of 1,836,000 1,836,000 0 Audit and Control, Department of 101,390,000 101,390,000 0 City University of New York 1,860,258,000 1,880,890,000 20,632,000 General Services, Office of 750,000 750,000 0 General State Charges 101,000,000 101,000,000 0 Health Insurance Reserve Receipts Fund 192,400,000 192,400,000 0 Total 2,257,634,000 2,278,266,000 20,632,000 Appropriated 2010-11 2,257,634,000
STATE OPERATIONS
INTERNAL SERVICE FUNDS (dollars)
Available
2010-11Recommended
2011-12 ChangeAudit and Control, Department of 4,258,000 6,609,000 2,351,000 Budget, Division of the 1,650,000 1,650,000 0 Children and Family Services, Office of 100,000 100,000 0 Civil Service, Department of 40,704,000 40,704,000 0 Correctional Services, Department of 73,692,000 73,692,000 0 Criminal Justice Services, Division of 890,000 890,000 0 Education Department, State 31,563,000 33,563,000 2,000,000 Employee Relations, Office of 3,710,000 3,710,000 0 Environmental Conservation, Department of 60,000 60,000 0 General Services, Office of 300,720,000 300,720,000 0 Homeland Security and Emergency Services, Division of 2,000,000 2,000,000 0 Mental Health, Office of 2,810,000 2,610,000 (200,000)Motor Vehicles, Department of 11,500,000 13,500,000 2,000,000 People with Developmental Disabilities, Office for 350,000 350,000 0 State University of New York 16,600,000 19,100,000 2,500,000 Taxation and Finance, Department of 41,806,000 31,131,000 (10,675,000)Technology, Office for 403,165,000 403,165,000 0 Temporary and Disability Assistance, Office of 1,199,000 1,199,000 0 Total 936,777,000 934,753,000 (2,024,000) Appropriated 2010-11 936,777,000
STATE OPERATIONS ENTERPRISE FUNDS
(dollars) Available
2010-11Recommended
2011-12 ChangeAging, Office for the 100,000 100,000 0 Agriculture and Markets, Department of 21,361,000 21,361,000 0 Children and Family Services, Office of 475,000 475,000 0 Correctional Services, Department of 43,013,000 43,013,000 0 Developmental Disabilities Planning Council 10,000 10,000 0 General Services, Office of 2,009,000 2,009,000 0 Health, Department of 10,000 0 (10,000)Homeland Security and Emergency Services, Division of 50,000,000 50,000,000 0 Labor, Department of 10,020,000,000 8,400,000,000 (1,620,000,000)Mental Health, Office of 8,606,000 8,606,000 0 Parks, Recreation and Historic Preservation, Office of 1,500,000 0 (1,500,000)People with Developmental Disabilities, Office for 2,668,000 2,668,000 0 Quality of Care and Advocacy for Persons With Disabilities,
Commission on 45,000 45,000 0 Total 10,149,797,000 8,528,287,000 (1,621,510,000) Adjustments Transfer From: Special Revenue Funds - Other (20,000,000) Appropriated 2010-11 10,129,797,000

SUMMARY OF APPROPRIATIONS
420
AID TO LOCALITIES RECAPITULATION OF 2011-12 RECOMMENDATIONS
BY FUND TYPE (dollars)
General
SpecialRevenue
Federal
SpecialRevenue
OtherInternal Service Fiduciary Total
Aging, Office for the 109,454,000 113,985,000 980,000 0 0 224,419,000Agriculture and Markets, Department of 13,809,000 20,000,000 0 0 0 33,809,000Arts, Council on the 31,635,000 2,413,000 196,000 0 0 34,244,000Audit and Control, Department of 32,025,000 0 0 0 0 32,025,000Children and Family Services, Office of 1,716,768,300 1,406,865,000 15,343,000 0 0 3,138,976,300City University of New York 1,202,703,000 0 0 0 0 1,202,703,000Correctional Services, Department of 6,171,000 0 0 11,000,000 0 17,171,000Criminal Justice Services, Division of 106,807,000 67,768,000 57,990,000 0 0 232,565,000Economic Development, Department of 3,815,000 0 0 0 0 3,815,000Education Department, State 18,721,587,000 4,084,088,000 6,240,479,000 0 0 29,046,154,000Elections, State Board of 0 1,000,000 0 0 0 1,000,000Empire State Development Corporation 55,239,000 0 0 0 0 55,239,000Energy Research and Development Authority, New
York State 0 0 8,140,000 0 0 8,140,000Environmental Conservation, Department of 1,675,000 0 0 0 0 1,675,000Financial Regulation, Department of 0 0 225,566,000 0 0 225,566,000Health, Department of 15,156,957,290 32,185,270,000 6,543,493,000 0 0 53,885,720,290Higher Education Services Corporation, New York
State 955,893,000 0 16,000,000 0 0 971,893,000Homeland Security and Emergency Services,
Division of 3,300,000 618,363,000 61,088,000 0 0 682,751,000Housing and Community Renewal, Division of 31,031,000 102,372,000 8,227,000 0 0 141,630,000Mortgage Agency, State of New York 96,372,000 0 0 0 0 96,372,000Interest on Lawyer Account 0 0 45,000,000 0 0 45,000,000Labor, Department of 0 192,439,000 430,000 0 0 192,869,000Mental Health, Office of 420,982,000 51,414,000 826,038,000 0 0 1,298,434,000Alcoholism and Substance Abuse Services, Office
of 36,878,500 135,000,000 282,242,500 0 0 454,121,000Metropolitan Transportation Authority 0 0 2,151,000,000 0 0 2,151,000,000Military and Naval Affairs, Division of 650,000 0 0 0 0 650,000Motor Vehicles, Department of 0 20,620,000 0 0 0 20,620,000Parks, Recreation and Historic Preservation, Office
of 0 3,170,000 5,635,000 0 0 8,805,000People with Developmental Disabilities, Office for 1,430,364,800 0 866,536,700 0 0 2,296,901,500Public Service Department 0 0 1,500,000 0 0 1,500,000Quality of Care and Advocacy for Persons With
Disabilities, Commission on 170,000 0 478,000 0 0 648,000State, Department of 0 66,706,000 539,000 0 0 67,245,000State University of New York 431,701,345 0 0 0 0 431,701,345Taxation and Finance, Department of 750,000 0 0 0 0 750,000Temporary and Disability Assistance, Office of 1,304,707,000 3,720,067,000 29,900,000 0 10,000,000 5,064,674,000Transportation, Department of 97,550,900 53,062,000 4,081,984,000 0 0 4,232,596,900Veterans' Affairs, Division of 8,026,000 500,000 0 0 0 8,526,000 Subtotal 41,977,022,135 42,845,102,000 21,468,785,200 11,000,000 10,000,000 106,311,909,335 Miscellaneous--All State Departments and
Agencies Hudson River Valley Greenway Communities
Council 136,000 0 0 0 0 136,000Indigent Legal Services, Office of 0 0 77,000,000 0 0 77,000,000Local Government Assistance 813,600,000 0 0 0 30,000,000 843,600,000National and Community Service 350,000 0 0 0 0 350,000Payments to STARC / NYC 170,000,000 0 0 0 0 170,000,000Tribal State Compact Revenue 0 0 44,300,000 0 0 44,300,000 Subtotal 984,086,000 0 121,300,000 0 30,000,000 1,135,386,000 Judiciary 19,945,584 0 123,377,787 0 0 143,323,371 Subtotal 19,945,584 0 123,377,787 0 0 143,323,371Special Federal Emergency Appropriation 0 1,000,000,000 0 0 0 1,000,000,000 Total 42,981,053,719 43,845,102,000 21,713,462,987 11,000,000 40,000,000 108,590,618,706

SUMMARY OF APPROPRIATIONS
421
AID TO LOCALITIES GENERAL FUND
(dollars) Available
2010-11Recommended
2011-12 ChangeAging, Office for the 111,163,000 109,454,000 (1,709,000)Agriculture and Markets, Department of 18,808,000 13,809,000 (4,999,000)Arts, Council on the 35,150,000 31,635,000 (3,515,000)Audit and Control, Department of 32,025,000 32,025,000 0 Children and Family Services, Office of 1,886,087,400 1,716,768,300 (169,319,100)City University of New York 1,216,362,110 1,202,703,000 (13,659,110)Correctional Services, Department of 11,171,000 6,171,000 (5,000,000)Criminal Justice Services, Division of 116,475,000 106,807,000 (9,668,000)Economic Development, Department of 3,962,000 3,815,000 (147,000)Education Department, State 18,245,852,000 18,721,587,000 475,735,000 Empire State Development Corporation 45,896,000 55,239,000 9,343,000 Environmental Conservation, Department of 1,867,900 1,675,000 (192,900)Health, Department of 12,555,033,940 15,156,957,290 2,601,923,350 Higher Education Services Corporation, New York State 833,566,000 955,893,000 122,327,000 Homeland Security and Emergency Services, Division of 3,300,000 3,300,000 0 Housing and Community Renewal, Division of 38,411,000 31,031,000 (7,380,000)Mortgage Agency, State of New York 97,720,000 96,372,000 (1,348,000)Mental Health, Office of 420,982,000 420,982,000 0 Alcoholism and Substance Abuse Services, Office of 39,000,000 36,878,500 (2,121,500)Military and Naval Affairs, Division of 650,000 650,000 0 Parks, Recreation and Historic Preservation, Office of 2,920,000 0 (2,920,000)People with Developmental Disabilities, Office for 1,472,023,000 1,430,364,800 (41,658,200)Quality of Care and Advocacy for Persons With Disabilities,
Commission on 170,000 170,000 0 Science, Technology and Innovation, NYS Foundation for 65,361,000 0 (65,361,000)State University of New York 503,802,736 431,701,345 (72,101,391)Taxation and Finance, Department of 12,325,000 750,000 (11,575,000)Temporary and Disability Assistance, Office of 1,249,887,700 1,304,707,000 54,819,300 Transportation, Department of 97,550,900 97,550,900 0 Veterans' Affairs, Division of 7,946,000 8,026,000 80,000 Subtotal 39,125,468,686 41,977,022,135 2,851,553,449 Miscellaneous--All State Departments and Agencies Hudson River Valley Greenway Communities Council 136,000 136,000 0 Local Government Assistance 772,630,698 813,600,000 40,969,302 National and Community Service 350,000 350,000 0 Payments to STARC / NYC 170,000,000 170,000,000 0 Subtotal 943,116,698 984,086,000 40,969,302 Judiciary 20,000,000 19,945,584 (54,416) Total 40,088,585,384 42,981,053,719 2,892,468,335 Adjustments Prior Year Deficiencies 28,159,000 Recommended Deficiencies (6,250,000) Transfer To: Special Revenue Funds - Other 376,971,000 Appropriated 2010-11 40,487,465,384

SUMMARY OF APPROPRIATIONS
422
AID TO LOCALITIES SPECIAL REVENUE FUNDS - FEDERAL
(dollars) Available
2010-11Recommended
2011-12 ChangeAging, Office for the 116,985,000 113,985,000 (3,000,000)Agriculture and Markets, Department of 20,000,000 20,000,000 0 Arts, Council on the 2,413,000 2,413,000 0 Children and Family Services, Office of 1,396,535,300 1,406,865,000 10,329,700 City University of New York 7,554,000 0 (7,554,000)Criminal Justice Services, Division of 96,818,000 67,768,000 (29,050,000)Education Department, State 7,484,797,000 4,084,088,000 (3,400,709,000)Elections, State Board of 1,000,000 1,000,000 0 Health, Department of 36,703,876,000 32,185,270,000 (4,518,606,000)Higher Education Services Corporation, New York State 55,800,000 0 (55,800,000)Homeland Security and Emergency Services, Division of 618,363,000 618,363,000 0 Housing and Community Renewal, Division of 244,600,000 102,372,000 (142,228,000)Labor, Department of 227,135,000 192,439,000 (34,696,000)Mental Health, Office of 46,807,000 51,414,000 4,607,000 Alcoholism and Substance Abuse Services, Office of 139,755,000 135,000,000 (4,755,000)Motor Vehicles, Department of 20,410,000 20,620,000 210,000 Parks, Recreation and Historic Preservation, Office of 4,120,000 3,170,000 (950,000)State, Department of 104,594,631 66,706,000 (37,888,631)State University of New York 19,438,650 0 (19,438,650)Temporary and Disability Assistance, Office of 4,143,670,000 3,720,067,000 (423,603,000)Transportation, Department of 53,062,000 53,062,000 0 Veterans' Affairs, Division of 500,000 500,000 0 Victim Services, Office of 1,450,000 0 (1,450,000)Special Federal Emergency Appropriation 1,000,000,000 1,000,000,000 0 Total 52,509,683,581 43,845,102,000 (8,664,581,581) Adjustments Recommended Deficiencies (3,000,000) Transfer From: Special Revenue Funds - Federal (State Operations) (1,948,000) Transfer To: Special Revenue Funds - Federal (State Operations) 50,000,000 Appropriated 2010-11 52,554,735,581

SUMMARY OF APPROPRIATIONS
423
AID TO LOCALITIES SPECIAL REVENUE FUNDS - OTHER
(dollars) Available
2010-11Recommended
2011-12 ChangeAging, Office for the 980,000 980,000 0 Arts, Council on the 196,000 196,000 0 Children and Family Services, Office of 18,802,000 15,343,000 (3,459,000)Criminal Justice Services, Division of 65,254,000 57,990,000 (7,264,000)Education Department, State 6,462,479,000 6,240,479,000 (222,000,000)Energy Research and Development Authority, New York State 9,234,000 8,140,000 (1,094,000)Financial Regulation, Department of 225,566,000 225,566,000 0 Health, Department of 6,621,672,850 6,543,493,000 (78,179,850)Higher Education Services Corporation, New York State 22,200,000 16,000,000 (6,200,000)Homeland Security and Emergency Services, Division of 36,054,700 61,088,000 25,033,300 Housing and Community Renewal, Division of 8,227,000 8,227,000 0 Interest on Lawyer Account 45,000,000 45,000,000 0 Labor, Department of 430,000 430,000 0 Mental Health, Office of 807,394,000 826,038,000 18,644,000 Alcoholism and Substance Abuse Services, Office of 298,479,000 282,242,500 (16,236,500)Metropolitan Transportation Authority 2,253,300,000 2,151,000,000 (102,300,000)Parks, Recreation and Historic Preservation, Office of 5,635,000 5,635,000 0 People with Developmental Disabilities, Office for 891,773,000 866,536,700 (25,236,300)Public Service Department 1,000,000 1,500,000 500,000 Quality of Care and Advocacy for Persons With Disabilities,
Commission on 478,000 478,000 0 State, Department of 539,000 539,000 0 Temporary and Disability Assistance, Office of 29,900,000 29,900,000 0 Transportation, Department of 4,206,878,000 4,081,984,000 (124,894,000)Indigent Legal Services, Office of 77,000,000 77,000,000 0 Tribal State Compact Revenue 39,100,000 44,300,000 5,200,000 Judiciary 123,553,284 123,377,787 (175,497) Total 22,251,124,834 21,713,462,987 (537,661,847) Adjustments Prior Year Deficiencies 29,000,000 Recommended Deficiencies (52,000,000) Transfer From: General Fund (376,971,000) Appropriated 2010-11 21,851,153,834
AID TO LOCALITIES FIDUCIARY FUNDS
(dollars) Available
2010-11Recommended
2011-12 ChangeTemporary and Disability Assistance, Office of 10,000,000 10,000,000 0 Local Government Assistance 30,000,000 30,000,000 0 Total 40,000,000 40,000,000 0 Appropriated 2010-11 40,000,000
AID TO LOCALITIES
INTERNAL SERVICE FUNDS (dollars)
Available
2010-11Recommended
2011-12 ChangeCorrectional Services, Department of 11,000,000 11,000,000 0 Total 11,000,000 11,000,000 0 Appropriated 2010-11 11,000,000

SUMMARY OF APPROPRIATIONS
424
CAPITAL PROJECTS APPROPRIATIONS ALL FUNDS
APPROPRIATED 2010-11 (dollars)
Capital
ProjectsFunds
SpecialRevenue
FundsFiduciary
Funds TotalAdirondack Park Agency 0 500,000 0 500,000 Agriculture and Markets, Department of 3,750,000 0 0 3,750,000 Children and Family Services, Office of 37,675,000 0 0 37,675,000 City University of New York 318,785,000 0 0 318,785,000 Correctional Services, Department of 320,000,000 0 0 320,000,000 Education Department, State 41,200,000 0 0 41,200,000 Empire State Development Corporation 25,000,000 0 0 25,000,000 Energy Research and Development Authority, New York State 19,247,000 0 0 19,247,000 Environmental Conservation, Department of 486,726,000 0 0 486,726,000 Environmental Facilities Corporation 343,000 0 0 343,000 General Services, Office of 98,000,000 0 0 98,000,000 Health, Department of 497,783,000 0 0 497,783,000 Homeland Security and Emergency Services, Division of 42,000,000 0 0 42,000,000 Housing and Community Renewal, Division of 74,200,000 0 0 74,200,000 Mental Health, Office of 234,291,000 0 0 234,291,000 Alcoholism and Substance Abuse Services, Office of 108,934,000 0 0 108,934,000 Military and Naval Affairs, Division of 30,700,000 0 0 30,700,000 Motor Vehicles, Department of 217,842,000 0 0 217,842,000 Parks, Recreation and Historic Preservation, Office of 36,801,000 10,000,000 0 46,801,000 People with Developmental Disabilities, Office for 139,560,000 0 0 139,560,000 State, Department of 2,750,000 0 0 2,750,000 State Police, Division of 11,500,000 0 0 11,500,000 State University of New York 572,426,000 0 0 572,426,000 Temporary and Disability Assistance, Office of 30,000,000 0 0 30,000,000 Thruway Authority, New York State 2,000,000 0 0 2,000,000 Transportation, Department of 4,249,144,000 85,771,000 50,000,000 4,384,915,000 State Equipment Finance Program 187,285,000 0 0 187,285,000 Total 7,787,942,000 96,271,000 50,000,000 7,934,213,000 Adjustments: Prior Year Deficiencies 5,000,000 Appropriated 2010-11 7,939,213,000

SUMMARY OF APPROPRIATIONS
425
CAPITAL PROJECTS NEW APPROPRIATIONS AND REAPPROPRIATIONS ALL FUNDS
RECOMMENDED 2011-12 (dollars)
Total Recommended Appropriations
2011-12
TotalRecommended
Reappro-priations2011-12
CapitalProjects
Fund
CapitalProjects
FundAdvances
Federal Capital
Projects Fund
AllOtherFund
Types (a)
TotalCapital
Projects2011-12
Adirondack Park Agency 500,000 500,000 0 0 0 1,000,000 1,000,000Agriculture and Markets, Department of 3,000,000 37,771,000 0 0 0 40,771,000 40,771,000Children and Family Services, Office of 37,675,000 155,454,000 0 0 0 193,129,000 193,129,000City University of New York 336,461,000 3,579,831,000 0 0 0 3,916,292,000 3,916,292,000Correctional Services, Department of 320,000,000 655,345,000 0 0 0 975,345,000 975,345,000Education Department, State 17,400,000 143,096,000 0 0 0 160,496,000 160,496,000Empire State Development Corporation 255,550,000 2,449,675,000 0 0 0 2,705,225,000 2,705,225,000Energy Research and Development
Authority, New York State 15,310,000 0 0 0 0 15,310,000 15,310,000Environmental Conservation,
Department of 511,834,000 3,556,326,000 1,134,000 3,951,000 0 4,063,075,000 4,068,160,000Environmental Facilities Corporation 343,000 1,991,000 0 0 0 2,334,000 2,334,000General Services, Office of 84,000,000 334,346,000 0 0 0 418,346,000 418,346,000Health, Department of 90,433,000 1,357,171,000 0 0 0 1,447,604,000 1,447,604,000Homeland Security and Emergency
Services, Division of 0 37,000,000 0 0 0 37,000,000 37,000,000Housing and Community Renewal,
Division of 74,200,000 646,109,000 0 0 0 720,309,000 720,309,000Hudson River Park Trust 0 21,176,000 0 0 0 21,176,000 21,176,000Mental Health, Office of 220,874,000 1,982,774,000 0 0 0 2,203,648,000 2,203,648,000Alcoholism and Substance Abuse
Services, Office of 97,606,000 456,406,000 0 0 0 554,012,000 554,012,000Metropolitan Transportation Authority 0 1,007,000,000 0 0 0 1,007,000,000 1,007,000,000Military and Naval Affairs, Division of 39,200,000 82,558,000 0 0 0 121,758,000 121,758,000Motor Vehicles, Department of 201,137,000 2,500,000 0 0 0 203,637,000 203,637,000Parks, Recreation and Historic
Preservation, Office of 46,801,000 198,537,000 0 0 0 245,338,000 245,338,000People with Developmental Disabilities,
Office for 151,995,000 380,330,000 0 0 0 532,325,000 532,325,000State, Department of 0 5,215,000 0 0 0 5,215,000 5,215,000State Police, Division of 11,500,000 94,068,000 0 0 0 105,568,000 105,568,000State University of New York 1,002,571,000 6,573,059,000 0 0 0 7,575,630,000 7,575,630,000Technology, Office for 0 100,160,000 0 0 0 100,160,000 100,160,000Temporary and Disability Assistance,
Office of 30,000,000 104,851,000 0 0 0 134,851,000 134,851,000Thruway Authority, New York State 2,000,000 11,653,000 0 0 0 13,653,000 13,653,000Transportation, Department of 3,986,577,000 18,771,163,000 0 0 0 22,757,740,000 22,757,740,000Economic Development Capital 0 524,969,000 0 0 0 524,969,000 524,969,000Economic Development Program, New
York State 0 81,461,000 0 0 0 81,461,000 81,461,000High Technology and Development
Program 0 38,581,000 0 0 0 38,581,000 38,581,000Higher Education Facilities Capital
Matching Grants Program 0 93,000,000 0 0 0 93,000,000 93,000,000Jacob Javits Convention Center 0 350,000,000 0 0 0 350,000,000 350,000,000Judicial Drug Court 0 8,000,000 0 0 0 8,000,000 8,000,000Regional Economic Development
Program 0 34,435,000 0 0 0 34,435,000 34,435,000Roosevelt Island Operating Corporation 0 1,157,000 0 0 0 1,157,000 1,157,000State Equipment Finance Program 92,751,000 231,123,000 0 0 0 323,874,000 323,874,000Strategic Investment Program 0 105,668,000 0 0 0 105,668,000 105,668,000World Trade Center 0 295,132,000 0 0 0 295,132,000 295,132,000Judiciary 0 59,000,000 0 0 0 59,000,000 59,000,000 Total 7,629,718,000 44,568,591,000 1,134,000 3,951,000 0 52,193,224,000 52,198,309,000
(a) Includes Other Capital Projects Funds, Special Revenue Funds - Other, Fiduciary Funds, Enterprise Funds, and Bond Funds.

SUMMARY OF APPROPRIATIONS
426
CAPITAL PROJECTS NEW APPROPRIATIONS ALL FUNDS
RECOMMENDED 2011-12 (dollars)
Total
Appropriated2010-11
CapitalProjects
Funds
SpecialRevenue
FundsFiduciary
Funds
TotalRecommended
2011-12
ChangeFrom
2010-11Adirondack Park Agency 500,000 0 500,000 0 500,000 0 Agriculture and Markets, Department of 3,750,000 3,000,000 0 0 3,000,000 (750,000)Children and Family Services, Office of 37,675,000 37,675,000 0 0 37,675,000 0 City University of New York 318,785,000 336,461,000 0 0 336,461,000 17,676,000 Correctional Services, Department of 320,000,000 320,000,000 0 0 320,000,000 0 Education Department, State 41,200,000 17,400,000 0 0 17,400,000 (23,800,000)Empire State Development Corporation 25,000,000 255,550,000 0 0 255,550,000 230,550,000 Energy Research and Development Authority, New
York State 19,247,000 15,310,000 0 0 15,310,000 (3,937,000)Environmental Conservation, Department of 486,726,000 511,834,000 0 0 511,834,000 25,108,000 Environmental Facilities Corporation 343,000 343,000 0 0 343,000 0 General Services, Office of 98,000,000 84,000,000 0 0 84,000,000 (14,000,000)Health, Department of 497,783,000 90,433,000 0 0 90,433,000 (407,350,000)Homeland Security and Emergency Services,
Division of 42,000,000 0 0 0 0 (42,000,000)Housing and Community Renewal, Division of 74,200,000 74,200,000 0 0 74,200,000 0 Mental Health, Office of 234,291,000 220,874,000 0 0 220,874,000 (13,417,000)Alcoholism and Substance Abuse Services, Office
of 108,934,000 97,606,000 0 0 97,606,000 (11,328,000)Military and Naval Affairs, Division of 30,700,000 39,200,000 0 0 39,200,000 8,500,000 Motor Vehicles, Department of 217,842,000 201,137,000 0 0 201,137,000 (16,705,000)Parks, Recreation and Historic Preservation, Office
of 46,801,000 36,801,000 10,000,000 0 46,801,000 0 People with Developmental Disabilities, Office for 139,560,000 151,995,000 0 0 151,995,000 12,435,000 State, Department of 2,750,000 0 0 0 0 (2,750,000)State Police, Division of 11,500,000 11,500,000 0 0 11,500,000 0 State University of New York 572,426,000 1,002,571,000 0 0 1,002,571,000 430,145,000 Temporary and Disability Assistance, Office of 30,000,000 30,000,000 0 0 30,000,000 0 Thruway Authority, New York State 2,000,000 2,000,000 0 0 2,000,000 0 Transportation, Department of 4,384,915,000 3,851,958,000 84,619,000 50,000,000 3,986,577,000 (398,338,000)State Equipment Finance Program 187,285,000 92,751,000 0 0 92,751,000 (94,534,000) Total 7,934,213,000 7,484,599,000 95,119,000 50,000,000 7,629,718,000 (304,495,000) Adjustments: Prior Year Deficiencies 5,000,000 Appropriated 2010-11 7,939,213,000

427
CONSULTING SERVICE CONTRACTS The 2011-12 Executive Budget begins the process of transforming government into an organization that functions more efficiently and provides services to taxpayers at the lowest possible cost. Toward that end, the Executive Budget makes strategic choices regarding the use of consulting services. The proposed budget reductions will require State agencies to continue to reduce non-personal service costs. This will include efforts to ensure the cost effectiveness of consulting services, including elimination of consulting contracts where these services no longer support core programs, and in-sourcing consulting positions where State staff can provide more cost-efficient services. To support this effort, the Division of the Budget (DOB) will implement several of the recommendations of the 2009 Report of the Governor’s Task Force on Personal Services Contracting, including:
Using a quantitative decision model to assist agencies in evaluating the costs and benefits of utilizing State staff rather than contracting out;
Improving data collection and analysis of consulting costs; and Issue guidance to agencies to increase the justification for and transparency of
consultant service contracts. The Executive has had some recent success with IT in-sourcing efforts, and recognizes that it may be beneficial to expand in-sourcing in order to save jobs while realizing budget savings. INFORMATION TECHNOLOGY IN-SOURCING Chapter 500 of the Laws of 2009 was enacted to establish a pilot program for reducing the State's reliance on private IT consultant services. This legislation represented the first significant step in addressing long-standing challenges to the hiring and promotion of quality IT staff with the requisite skills and training to meet agency needs. Chapter 500 provided the authorization to hire up to 500 individuals into term IT positions across New York State with job appointments of up to 60 months. These appointments are temporary positions requiring special expertise or qualifications in IT services, and can be made without civil service examination where an agency certifies that holding such an examination is not practicable. The law also directs the Department of Civil Service to complete a skills inventory for promotion eligible lists to ensure that existing State employees could compete for these positions. As of December 2010, 247 positions have been approved. Of this number, 94 actual hires have occurred and the hiring process for 153 positions is underway. Nearly 20 percent of those hired were existing State employees; and, 25 percent of those hired entered into civil service titles. The projected 2011-12 savings for the initial 94 positions is $4.3 million, with 25 percent of the savings realized in the General Fund. The ability to hire State staff for positions requiring key technology skills has indeed proved cost-effective for the State, with savings ranging from approximately $25,000 to $50,000 per position, after accounting for a period of transition for the employees involved. Efforts to identify more opportunities both within IT and in other technically skilled positions, e.g., nursing, are ongoing. However, the State has also found that in cases where the positions do not require highly technical skills, the optimal solution is to contract for the services. In keeping with the recommendations of the 2009 Report of the Governor’s Task Force on Personal Services Contracting, agencies will follow a consistent set of principles in identifying which method of service delivery is most appropriate.
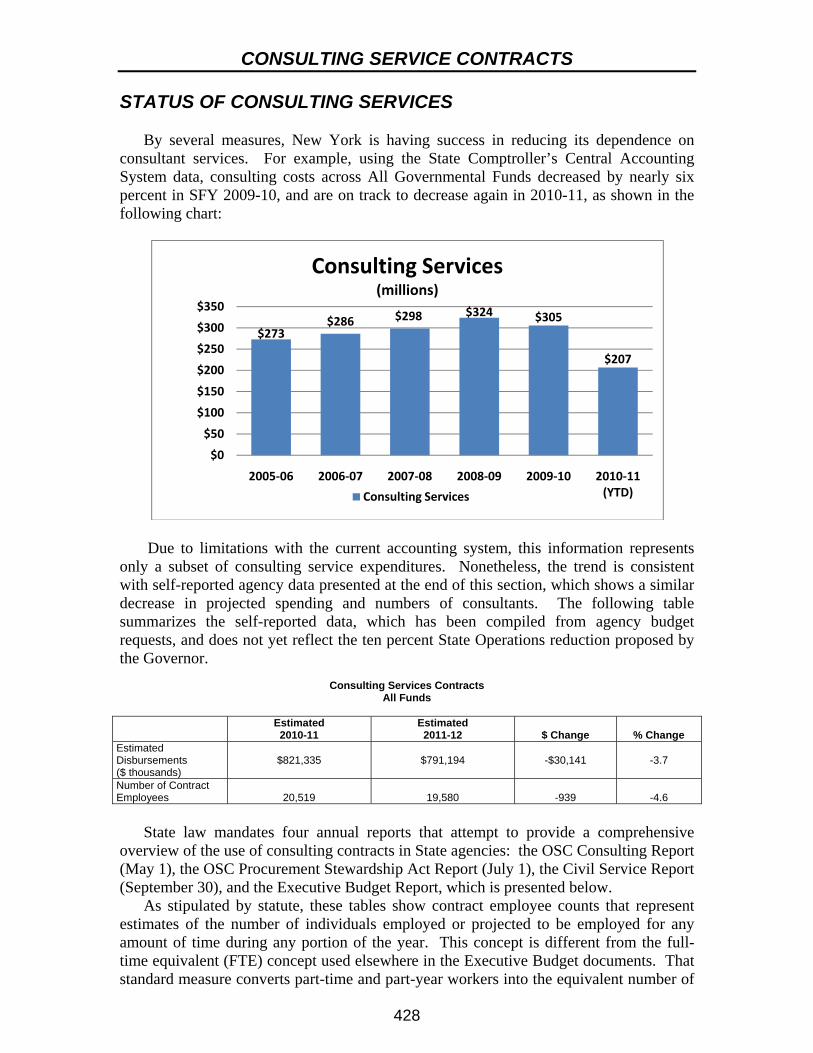
CONSULTING SERVICE CONTRACTS
428
STATUS OF CONSULTING SERVICES By several measures, New York is having success in reducing its dependence on consultant services. For example, using the State Comptroller’s Central Accounting System data, consulting costs across All Governmental Funds decreased by nearly six percent in SFY 2009-10, and are on track to decrease again in 2010-11, as shown in the following chart:
Due to limitations with the current accounting system, this information represents only a subset of consulting service expenditures. Nonetheless, the trend is consistent with self-reported agency data presented at the end of this section, which shows a similar decrease in projected spending and numbers of consultants. The following table summarizes the self-reported data, which has been compiled from agency budget requests, and does not yet reflect the ten percent State Operations reduction proposed by the Governor.
Consulting Services Contracts
All Funds
Estimated 2010-11
Estimated 2011-12 $ Change % Change
Estimated Disbursements ($ thousands)
$821,335
$791,194
-$30,141
-3.7
Number of Contract Employees
20,519
19,580
-939
-4.6
State law mandates four annual reports that attempt to provide a comprehensive overview of the use of consulting contracts in State agencies: the OSC Consulting Report (May 1), the OSC Procurement Stewardship Act Report (July 1), the Civil Service Report (September 30), and the Executive Budget Report, which is presented below. As stipulated by statute, these tables show contract employee counts that represent estimates of the number of individuals employed or projected to be employed for any amount of time during any portion of the year. This concept is different from the full-time equivalent (FTE) concept used elsewhere in the Executive Budget documents. That standard measure converts part-time and part-year workers into the equivalent number of
$273$286 $298 $324 $305
$207
$0
$50
$100
$150
$200
$250
$300
$350
2005‐06 2006‐07 2007‐08 2008‐09 2009‐10 2010‐11 (YTD)
Consulting Services(millions)
Consulting Services

CONSULTING SERVICE CONTRACTS
429
full-time positions over the course of a year. As a result, the employee count (regardless of the percentage of time worked) reported in the tables overstates the number of full-time equivalent positions associated with consulting contracts. Reported spending figures include labor-related contract costs such as overhead, travel and fringe benefits, and in some cases, other non-personal service expenses. Accordingly, contract costs cannot be interpreted as representing only the compensation paid to contract employees.

CONSULTING SERVICE CONTRACTS
430
Esti
mat
edEs
tim
ated
Num
ber
Num
ber
App
ropr
iati
ons
Reap
prop
riat
ions
Esti
mat
edEs
tim
ated
of C
ontr
act
of C
ontr
act
App
ropr
iati
ons
Requ
este
dRe
appr
opri
atio
nsRe
ques
ted
Dis
burs
emen
tsD
isbu
rsem
ents
Empl
oyee
sEm
ploy
ees
Age
ncy
2010
-11
2011
-12
2010
-11
2011
-12
2010
-11
2011
-12
2010
-11
2011
-12
Agin
g, O
ffice
for
the
$463
,834
$662
,500
$204
,081
$667
,915
$486
,315
$678
,000
00
Agric
ultu
re a
nd M
arke
ts, D
epar
tmen
t of
$47,
826
$87,
266
$157
,538
$18,
538
$136
,826
$105
,804
117
Alco
holic
Bev
erag
e Co
ntro
l, D
ivis
ion
of$1
29,0
00$8
0,00
0$0
$0$1
15,0
00$8
0,00
02
1Al
coho
lism
and
Sub
stan
ce A
buse
Ser
vice
s,
O
ffice
of
$3,3
53,8
32$3
,353
,832
$0$0
$3,3
53,8
32$3
,353
,832
2626
Audi
t and
Con
trol
, Dep
artm
ent o
f$9
,693
,125
$9,7
77,5
33$0
$0$9
,693
,125
$9,5
77,5
3321
320
0Bu
dget
, Div
isio
n of
the
$7,8
56,0
50$4
,776
,550
$0$0
$7,8
56,0
50$4
,776
,550
8062
Child
ren
and
Fam
ily S
ervi
ces,
Offi
ce o
f$1
4,35
6,65
4$1
6,04
0,90
3$1
3,33
9,38
3$1
6,04
0,90
3$1
4,53
1,27
2$1
6,04
0,90
325
026
6Ci
ty U
nive
rsity
of N
ew Y
ork
$20,
150,
000
$19,
850,
000
$0$0
$20,
150,
000
$19,
850,
000
290
285
Civi
l Ser
vice
, Dep
artm
ent o
f$2
,438
,900
$2,6
35,0
00$0
$0$2
,350
,900
$2,6
28,1
0026
29Co
rrec
tiona
l Ser
vice
s, D
epar
tmen
t of
$8,5
66,5
00$8
,858
,100
$0$0
$8,5
66,5
00$8
,858
,100
5050
Crim
inal
Jus
tice
Serv
ices
, Div
isio
n of
$21,
250,
124
$22,
045,
143
$16,
707,
804
$18,
559,
487
$22,
015,
245
$20,
149,
033
277
263
Def
erre
d Co
mpe
nsat
ion
Boar
d$6
5,00
0$6
5,00
0$0
$0$6
0,00
0$6
0,00
04
4Ec
onom
ic D
evel
opm
ent,
Dep
artm
ent o
f$2
6,70
6,00
0$2
6,70
6,00
0$2
3,67
5,00
0$2
3,67
5,00
0$3
,396
,075
$4,3
57,2
0531
31Ed
ucat
ion
Dep
artm
ent,
Stat
e$3
2,68
4,30
8$7
4,72
9,27
5$0
$0$3
2,68
4,30
8$7
4,72
9,27
531
128
2El
ectio
ns, S
tate
Boa
rd o
f$3
,825
,000
$2,4
50,0
00$0
$0$3
,825
,000
$2,4
50,0
0011
6En
viro
nmen
tal C
onse
rvat
ion,
Dep
artm
ent o
f$4
,236
,000
$4,2
36,0
00$2
8,80
9,00
0$2
8,80
9,00
0$3
3,04
5,00
0$3
3,04
5,00
03,
037
3,02
5En
viro
nmen
tal F
acili
ties
Corp
orat
ion
$80,
000
$90,
000
$0$0
$80,
000
$90,
000
99
Exec
utiv
e Ch
ambe
r$1
29,5
00$2
00,0
00$0
$0$1
29,5
00$1
00,0
007
2Fi
nanc
ial R
egul
atio
n, D
epar
tmen
t of
$5,6
29,8
10$5
,605
,600
$0$0
$5,6
29,8
10$5
,605
,600
197
172
Gen
eral
Ser
vice
s, O
ffice
of
$7,6
15,0
00$7
,390
,000
$0$0
$7,6
15,0
00$6
,765
,000
507
478
Hea
lth, D
epar
tmen
t of
$84,
652,
671
$84,
685,
000
$0$0
$84,
652,
671
$84,
685,
000
1,16
81,
168
Hig
her
Educ
atio
n Se
rvic
es C
orpo
ratio
n$2
,245
,500
$903
,000
$0$0
$2,2
45,5
00$9
03,0
0034
22H
omel
and
Secu
rity
and
Emer
genc
y Se
rvic
es,
Div
isio
n of
$1,5
15,0
00$1
,625
,000
$0$0
$1,5
15,0
00$1
,625
,000
1112
Hou
sing
and
Com
mun
ity R
enew
al, D
ivis
ion
of$8
,800
,000
$8,8
00,0
00$2
,000
,000
$2,0
00,0
00$1
,325
,000
$985
,000
3223
Hum
an R
ight
s, D
ivis
ion
of$3
00,0
00$3
00,0
00$3
00,0
00$3
00,0
00$3
00,0
00$3
00,0
004
4In
tere
st o
n La
wye
r Ac
coun
t$2
00,0
00$2
00,0
00$0
$0$1
60,0
00$2
00,0
0015
15La
bor,
Dep
artm
ent o
f$9
,068
,700
$6,5
42,0
12$1
0,26
8,49
0$9
,995
,441
$19,
337,
190
$16,
537,
453
134
128
Law
, Dep
artm
ent o
f$4
,914
,000
$4,9
14,0
00$0
$0$3
,719
,000
$3,6
32,0
0054
53Lo
ttery
, Div
isio
n of
the
$1,2
27,0
12$8
39,1
04$0
$0$1
,087
,012
$839
,104
2013
Med
icai
d In
spec
tor
Gen
eral
, Offi
ce o
f the
$5,5
28,9
88$6
,632
,844
$0$0
$5,5
28,9
88$6
,632
,844
9599
Men
tal H
ealth
, Offi
ce o
f$5
1,71
0,00
0$5
2,21
0,00
0$0
$0$5
1,71
0,00
0$5
2,21
0,00
01,
044
1,04
4M
otor
Veh
icle
s, D
epar
tmen
t of
$4,2
30,2
15$4
,230
,215
$150
,000
$150
,000
$4,3
80,2
15$4
,380
,215
4343
Park
s, R
ecre
atio
n an
d H
isto
ric P
rese
rvat
ion,
Offi
ce o
f$3
5,52
9,27
6$3
5,69
0,41
6$9
3,57
1,00
0$9
3,20
4,00
0$9
,570
,514
$7,7
70,5
8951
848
5Pa
role
, Div
isio
n of
$65,
472
$0$0
$0$6
5,47
2$0
10
ALL
FU
ND
S20
11-1
2 CO
NSU
LTIN
G S
ERV
ICE
CON
TRA
CTS
REPO
RT
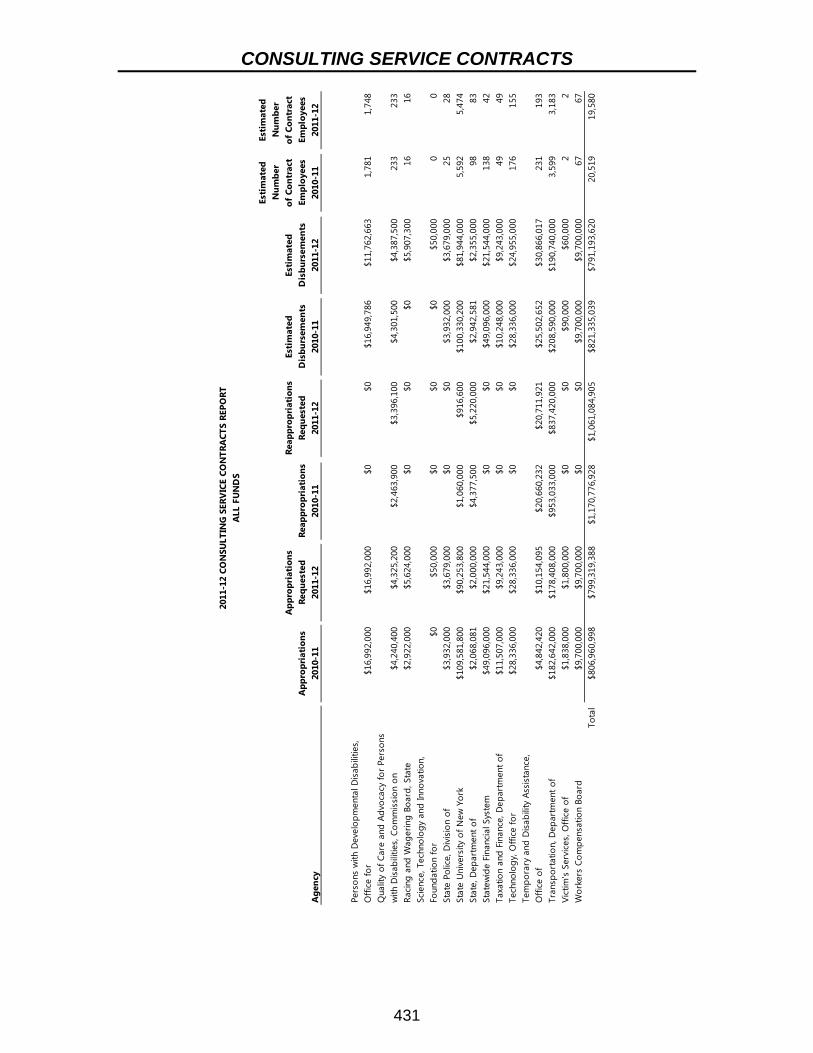
CONSULTING SERVICE CONTRACTS
431
Esti
mat
edEs
tim
ated
Num
ber
Num
ber
App
ropr
iati
ons
Reap
prop
riat
ions
Esti
mat
edEs
tim
ated
of C
ontr
act
of C
ontr
act
App
ropr
iati
ons
Requ
este
dRe
appr
opri
atio
nsRe
ques
ted
Dis
burs
emen
tsD
isbu
rsem
ents
Empl
oyee
sEm
ploy
ees
Age
ncy
2010
-11
2011
-12
2010
-11
2011
-12
2010
-11
2011
-12
2010
-11
2011
-12
Pers
ons
with
Dev
elop
men
tal D
isab
ilitie
s,O
ffice
for
$16,
992,
000
$16,
992,
000
$0$0
$16,
949,
786
$11,
762,
663
1,78
11,
748
Qua
lity
of C
are
and
Advo
cacy
for
Pers
ons
with
Dis
abili
ties,
Com
mis
sion
on
$4,2
40,4
00$4
,325
,200
$2,4
63,9
00$3
,396
,100
$4,3
01,5
00$4
,387
,500
233
233
Raci
ng a
nd W
ager
ing
Boar
d, S
tate
$2,9
22,0
00$5
,624
,000
$0$0
$0$5
,907
,300
1616
Scie
nce,
Tec
hnol
ogy
and
Inno
vatio
n,
Foun
datio
n fo
r $0
$50,
000
$0$0
$0$5
0,00
00
0St
ate
Polic
e, D
ivis
ion
of$3
,932
,000
$3,6
79,0
00$0
$0$3
,932
,000
$3,6
79,0
0025
28St
ate
Uni
vers
ity o
f New
Yor
k$1
09,5
81,8
00$9
0,25
3,80
0$1
,060
,000
$916
,600
$100
,330
,200
$81,
944,
000
5,59
25,
474
Stat
e, D
epar
tmen
t of
$2,0
68,0
81$2
,000
,000
$4,3
77,5
00$5
,220
,000
$2,9
42,5
81$2
,355
,000
9883
Stat
ewid
e Fi
nanc
ial S
yste
m$4
9,09
6,00
0$2
1,54
4,00
0$0
$0$4
9,09
6,00
0$2
1,54
4,00
013
842
Taxa
tion
and
Fina
nce,
Dep
artm
ent o
f$1
1,50
7,00
0$9
,243
,000
$0$0
$10,
248,
000
$9,2
43,0
0049
49Te
chno
logy
, Offi
ce fo
r$2
8,33
6,00
0$2
8,33
6,00
0$0
$0$2
8,33
6,00
0$2
4,95
5,00
017
615
5Te
mpo
rary
and
Dis
abili
ty A
ssis
tanc
e,
Offi
ce o
f$4
,842
,420
$10,
154,
095
$20,
660,
232
$20,
711,
921
$25,
502,
652
$30,
866,
017
231
193
Tran
spor
tatio
n, D
epar
tmen
t of
$182
,642
,000
$178
,408
,000
$953
,033
,000
$837
,420
,000
$208
,590
,000
$190
,740
,000
3,59
93,
183
Vict
im's
Ser
vice
s, O
ffice
of
$1,8
38,0
00$1
,800
,000
$0$0
$90,
000
$60,
000
22
Wor
kers
Com
pens
atio
n Bo
ard
$9,7
00,0
00$9
,700
,000
$0$0
$9,7
00,0
00$9
,700
,000
6767
Tota
l$8
06,9
60,9
98$7
99,3
19,3
88$1
,170
,776
,928
$1,0
61,0
84,9
05$8
21,3
35,0
39$7
91,1
93,6
2020
,519
19,5
80
2011
-12
CON
SULT
ING
SER
VIC
E CO
NTR
ACT
S RE
PORT
ALL
FU
ND
S

CONSULTING SERVICE CONTRACTS
432
Esti
mat
edEs
tim
ated
Num
ber
Num
ber
App
ropr
iati
ons
Reap
prop
riat
ions
Esti
mat
edEs
tim
ated
of C
ontr
act
of C
ontr
act
App
ropr
iati
ons
Requ
este
dRe
appr
opri
atio
nsRe
ques
ted
Dis
burs
emen
tsD
isbu
rsem
ents
Empl
oyee
sEm
ploy
ees
Age
ncy
2010
-11
2011
-12
2010
-11
2011
-12
2010
-11
2011
-12
2010
-11
2011
-12
Agin
g, O
ffice
for
the
$3,3
19$1
2,50
0$6
,681
$10,
000
$79,
000
$138
,500
00
Agric
ultu
re a
nd M
arke
ts, D
epar
tmen
t of
$47,
826
$87,
266
$157
,538
$18,
538
$136
,826
$105
,804
117
Audi
t and
Con
trol
, Dep
artm
ent o
f$5
,805
,205
$5,8
04,0
33$0
$0$5
,805
,205
$5,6
04,0
3399
88Bu
dget
, Div
isio
n of
the
$452
,100
$291
,550
$0$0
$452
,100
$291
,550
139
Child
ren
and
Fam
ily S
ervi
ces,
Offi
ce o
f$7
,977
,144
$8,1
51,7
62$3
,924
,618
$8,1
51,7
62$8
,151
,762
$8,1
51,7
6215
715
7Ci
vil S
ervi
ce, D
epar
tmen
t of
$216
,600
$295
,000
$0$0
$216
,600
$293
,500
22
Corr
ectio
nal S
ervi
ces,
Dep
artm
ent o
f$8
,566
,500
$8,8
58,1
00$0
$0$8
,566
,500
$8,8
58,1
0050
50Cr
imin
al J
ustic
e Se
rvic
es, D
ivis
ion
of$4
81,2
25$4
81,6
03$0
$0$4
47,9
44$4
86,8
4692
148
City
Uni
vers
ity o
f New
Yor
k$1
7,67
5,00
0$1
7,50
0,00
0$0
$0$1
7,67
5,00
0$1
7,50
0,00
025
325
0D
efer
red
Com
pens
atio
n Bo
ard
$65,
000
$65,
000
$0$0
$60,
000
$60,
000
44
Econ
omic
Dev
elop
men
t, D
epar
tmen
t of
$21,
941,
000
$21,
941,
000
$22,
675,
000
$22,
675,
000
$3,3
57,2
05$3
,357
,205
2626
Educ
atio
n D
epar
tmen
t, St
ate
$3,7
72,8
97$3
,469
,458
$0$0
$3,7
72,8
97$3
,469
,458
3428
Elec
tions
, Sta
te B
oard
of
$325
,000
$450
,000
$0$0
$325
,000
$450
,000
11
Envi
ronm
enta
l Con
serv
atio
n, D
epar
tmen
t of
$283
,000
$283
,000
$1,2
32,0
00$1
,232
,000
$1,5
15,0
00$1
,515
,000
114
113
Exec
utiv
e Ch
ambe
r$1
29,5
00$2
00,0
00$0
$0$1
29,5
00$1
00,0
007
2G
ener
al S
ervi
ces,
Offi
ce o
f$1
5,00
0$1
5,00
0$0
$0$1
5,00
0$1
5,00
01
1H
ealth
, Dep
artm
ent o
f$4
7,40
6,96
6$4
7,41
0,00
0$0
$0$4
7,40
6,96
6$4
7,41
0,00
067
067
0H
ousi
ng a
nd C
omm
unity
Ren
ewal
, Div
isio
n of
$3,6
00,0
00$3
,600
,000
$0$0
$615
,000
$275
,000
123
Law
, Dep
artm
ent o
f$2
,135
,000
$2,1
35,0
00$0
$0$1
,170
,000
$1,1
39,0
0033
32M
edic
aid
Insp
ecto
r G
ener
al, O
ffice
of t
he$2
,764
,494
$3,0
16,4
22$0
$0$2
,764
,494
$3,0
16,4
2247
41Pa
rks,
Rec
reat
ion
and
His
toric
Pre
serv
atio
n,
Offi
ce o
f$1
,329
,276
$1,4
90,4
16$0
$0$9
54,9
41$1
,269
,960
2835
Paro
le, D
ivis
ion
of$6
5,47
2$0
$0$0
$65,
472
$01
0Sc
ienc
e, T
echn
olog
y an
d In
nova
tion,
Fo
unda
tion
for
$0$5
0,00
0$0
$0$0
$50,
000
00
Stat
e Po
lice,
Div
isio
n of
$2,0
16,0
00$1
,931
,000
$0$0
$2,0
16,0
00$1
,931
,000
1515
Stat
e U
nive
rsity
of N
ew Y
ork
$8,9
43,5
00$7
,513
,600
$0$0
$8,0
00,6
00$7
,202
,600
899
847
Stat
e, D
epar
tmen
t of
$2,0
00,0
00$2
,000
,000
$3,3
37,0
00$4
,400
,000
$2,0
45,0
00$2
,000
,000
6663
Stat
ewid
e Fi
nanc
ial S
yste
m$0
$1,0
00,0
00$0
$0$0
$1,0
00,0
000
4Ta
xatio
n an
d Fi
nanc
e, D
epar
tmen
t of
$11,
507,
000
$9,2
43,0
00$0
$0$1
0,24
8,00
0$9
,243
,000
4949
Tech
nolo
gy, O
ffice
for
$2,2
54,0
00$2
,254
,000
$0$0
$2,2
54,0
00$1
,288
,000
148
Tem
pora
ry a
nd D
isab
ility
Ass
ista
nce,
O
ffice
of
$3,0
69,9
36$2
,882
,366
$9,9
24,1
42$1
2,13
9,90
6$1
2,99
4,07
8$1
5,02
2,27
310
993
Tota
l$1
54,8
47,9
60$1
52,4
31,0
76$4
1,25
6,97
9$4
8,62
7,20
6$1
41,2
40,0
90$1
41,2
44,0
132,
807
2,74
6
GEN
ERA
L FU
ND
2011
-12
CON
SULT
ING
SER
VIC
E CO
NTR
ACT
S RE
PORT

CONSULTING SERVICE CONTRACTS
433
Esti
mat
edEs
tim
ated
Num
ber
Num
ber
App
ropr
iati
ons
Reap
prop
riat
ions
Esti
mat
edEs
tim
ated
of C
ontr
act
of C
ontr
act
App
ropr
iati
ons
Requ
este
dRe
appr
opri
atio
nsRe
ques
ted
Dis
burs
emen
tsD
isbu
rsem
ents
Empl
oyee
sEm
ploy
ees
Age
ncy
2010
-11
2011
-12
2010
-11
2011
-12
2010
-11
2011
-12
2010
-11
2011
-12
Agin
g, O
ffice
for
the
$460
,515
$650
,000
$197
,400
$657
,915
$407
,315
$539
,500
00
Child
ren
and
Fam
ily S
ervi
ces,
Offi
ce o
f$5
,937
,300
$7,4
46,9
31$9
,414
,765
$7,4
46,9
31$5
,937
,300
$7,4
46,9
3162
78Cr
imin
al J
ustic
e Se
rvic
es, D
ivis
ion
of$3
,646
,407
$3,6
80,4
38$6
,446
,719
$4,9
36,8
05$5
,851
,905
$4,2
73,0
8258
24Ec
onom
ic D
evel
opm
ent,
Dep
artm
ent o
f$1
,000
,000
$1,0
00,0
00$1
,000
,000
$1,0
00,0
00$0
$00
0Ed
ucat
ion
Dep
artm
ent,
Stat
e$2
3,64
6,52
3$6
6,05
9,81
7$0
$0$2
3,64
6,52
3$6
6,05
9,81
717
916
1En
viro
nmen
tal C
onse
rvat
ion,
Dep
artm
ent o
f$3
46,0
00$3
46,0
00$1
,810
,000
$1,8
10,0
00$2
,156
,000
$2,1
56,0
0040
39H
ealth
, Dep
artm
ent o
f$2
6,21
2,92
9$2
6,22
5,00
0$0
$0$2
6,21
2,92
9$2
6,22
5,00
015
915
9H
uman
Rig
hts,
Div
isio
n of
$300
,000
$300
,000
$300
,000
$300
,000
$300
,000
$300
,000
44
Labo
r, D
epar
tmen
t of
$8,9
69,7
20$5
,742
,012
$10,
268,
490
$9,8
96,4
61$1
9,23
8,21
0$1
5,63
8,47
313
212
2La
w, D
epar
tmen
t of
$254
,000
$254
,000
$0$0
$133
,000
$133
,000
55
Med
icai
d In
spec
tor
Gen
eral
, Offi
ce o
f the
$2,7
64,4
94$3
,616
,422
$0$0
$2,7
64,4
94$3
,616
,422
4858
Mot
or V
ehic
les,
Dep
artm
ent o
f$1
,143
,600
$1,1
43,6
00$0
$0$1
,293
,600
$1,2
93,6
0010
10Q
ualit
y of
Car
e an
d Ad
voca
cy fo
r Pe
rson
s w
ith D
isab
ilitie
s, C
omm
issi
on o
n$4
,240
,400
$4,3
25,2
00$2
,463
,900
$3,3
96,1
00$4
,301
,500
$4,3
87,5
0023
323
3St
ate
Polic
e, D
ivis
ion
of$1
,916
,000
$1,7
48,0
00$0
$0$1
,916
,000
$1,7
48,0
0010
13St
ate,
Dep
artm
ent o
f$6
8,08
1$0
$96,
500
$12,
000
$159
,581
$5,0
007
3Te
mpo
rary
and
Dis
abili
ty A
ssis
tanc
e,
Offi
ce o
f$1
,333
,959
$6,9
93,1
26$1
0,13
6,09
0$7
,972
,015
$11,
470,
049
$14,
965,
141
9878
Tota
l$8
2,23
9,92
8$1
29,5
30,5
46$4
2,13
3,86
4$3
7,42
8,22
7$1
05,7
88,4
06$1
48,7
87,4
661,
045
987
SPEC
IAL
REV
ENU
E FU
ND
S -
FED
ERA
L20
11-1
2 CO
NSU
LTIN
G S
ERV
ICE
CON
TRA
CTS
REPO
RT

CONSULTING SERVICE CONTRACTS
434
Esti
mat
edEs
tim
ated
Num
ber
Num
ber
App
ropr
iati
ons
Reap
prop
riat
ions
Esti
mat
edEs
tim
ated
of C
ontr
act
of C
ontr
act
App
ropr
iati
ons
Requ
este
dRe
appr
opri
atio
nsRe
ques
ted
Dis
burs
emen
tsD
isbu
rsem
ents
Empl
oyee
sEm
ploy
ees
Age
ncy
2010
-11
2011
-12
2010
-11
2011
-12
2010
-11
2011
-12
2010
-11
2011
-12
Alco
holic
Bev
erag
e Co
ntro
l, D
ivis
ion
of$1
29,0
00$8
0,00
0$0
$0$1
15,0
00$8
0,00
02
1Al
coho
lism
and
Sub
stan
ce A
buse
Ser
vice
s,
Offi
ce o
f$3
,353
,832
$3,3
53,8
32$0
$0$3
,353
,832
$3,3
53,8
3226
26Au
dit a
nd C
ontr
ol, D
epar
tmen
t of
$1,8
59,0
18$2
,027
,500
$0$0
$1,8
59,0
18$2
,027
,500
3837
Budg
et, D
ivis
ion
of th
e$5
,961
,000
$3,2
85,0
00$0
$0$5
,961
,000
$3,2
85,0
0054
40Ch
ildre
n an
d Fa
mily
Ser
vice
s, O
ffice
of
$442
,210
$442
,210
$0$4
42,2
10$4
42,2
10$4
42,2
1031
31Ci
vil S
ervi
ce, D
epar
tmen
t of
$241
,300
$69,
000
$0$0
$153
,300
$68,
600
52
City
Uni
vers
ity o
f New
Yor
k $2
,475
,000
$2,3
50,0
00$0
$0$2
,475
,000
$2,3
50,0
0037
35Cr
imin
al J
ustic
e Se
rvic
es, D
ivis
ion
of$1
4,99
1,12
5$1
7,15
9,36
4$6
,786
,508
$11,
197,
738
$12,
522,
896
$14,
024,
707
117
83Ec
onom
ic D
evel
opm
ent,
Dep
artm
ent o
f$3
,765
,000
$3,7
65,0
00$0
$0$3
8,87
0$1
,000
,000
55
Educ
atio
n D
epar
tmen
t, St
ate
$5,2
64,8
88$5
,200
,000
$0$0
$5,2
64,8
88$5
,200
,000
9893
Elec
tions
, Sta
te B
oard
of
$3,5
00,0
00$2
,000
,000
$0$0
$3,5
00,0
00$2
,000
,000
105
Envi
ronm
enta
l Con
serv
atio
n, D
epar
tmen
t of
$3,6
00,0
00$3
,600
,000
$2,5
63,0
00$2
,563
,000
$6,1
63,0
00$6
,163
,000
603
595
Envi
ronm
enta
l Fac
ilitie
s Co
rpor
atio
n$8
0,00
0$9
0,00
0$0
$0$8
0,00
0$9
0,00
09
9Fi
nanc
ial R
egul
atio
n, D
epar
tmen
t of
$5,6
29,8
10$5
,605
,600
$0$0
$5,6
29,8
10$5
,605
,600
197
172
Gen
eral
Ser
vice
s, O
ffice
of
$675
,000
$675
,000
$0$0
$675
,000
$675
,000
44
Hea
lth, D
epar
tmen
t of
$11,
032,
776
$11,
050,
000
$0$0
$11,
032,
776
$11,
050,
000
339
339
Hig
her
Educ
atio
n Se
rvic
es C
orpo
ratio
n$2
,245
,500
$903
,000
$0$0
$2,2
45,5
00$9
03,0
0034
22H
omel
and
Secu
rity
and
Emer
genc
y Se
rvic
es,
Offi
ce o
f$1
,515
,000
$1,6
25,0
00$0
$0$1
,515
,000
$1,6
25,0
0011
12H
ousi
ng a
nd C
omm
unity
Ren
ewal
, Div
isio
n of
$5,2
00,0
00$5
,200
,000
$2,0
00,0
00$2
,000
,000
$710
,000
$710
,000
2020
Inte
rest
on
Law
yer
Acco
unt
$200
,000
$200
,000
$0$0
$160
,000
$200
,000
1515
Labo
r, D
epar
tmen
t of
$98,
980
$800
,000
$0$9
8,98
0$9
8,98
0$8
98,9
802
6La
w, D
epar
tmen
t of
$2,5
25,0
00$2
,525
,000
$0$0
$2,4
16,0
00$2
,360
,000
1616
Lotte
ry, D
ivis
ion
of th
e$1
,227
,012
$839
,104
$0$0
$1,0
87,0
12$8
39,1
0420
13M
enta
l Hea
lth, O
ffice
of
$46,
960,
000
$46,
960,
000
$0$0
$46,
960,
000
$46,
960,
000
1,00
61,
006
Mot
or V
ehic
les,
Dep
artm
ent o
f$1
50,0
00$1
50,0
00$1
50,0
00$1
50,0
00$1
50,0
00$1
50,0
004
4Pe
rson
s w
ith D
evel
opm
enta
l Dis
abili
ties,
Offi
ce fo
r$1
6,99
2,00
0$1
6,99
2,00
0$0
$0$1
6,94
9,78
6$1
1,76
2,66
31,
781
1,74
8Ra
cing
and
Wag
erin
g Bo
ard,
Sta
te$2
,922
,000
$5,6
24,0
00$0
$0$0
$5,9
07,3
0016
16St
ate
Uni
vers
ity o
f New
Yor
k$1
00,6
38,3
00$8
2,74
0,20
0$1
,060
,000
$916
,600
$92,
329,
600
$74,
741,
400
4,69
34,
627
Stat
ewid
e Fi
nanc
ial S
yste
m$3
,246
,000
$0$0
$0$3
,246
,000
$011
0Te
mpo
rary
and
Dis
abili
ty A
ssis
tanc
e,
Offi
ce o
f$4
38,5
25$2
78,6
03$0
$0$4
38,5
25$2
78,6
035
3Vi
ctim
s Se
rvic
es, O
ffice
of
$1,8
38,0
00$1
,800
,000
$0$0
$90,
000
$60,
000
22
Wor
kers
Com
pens
atio
n Bo
ard
$9,7
00,0
00$9
,700
,000
$0$0
$9,7
00,0
00$9
,700
,000
6767
Tota
l$2
58,8
96,2
76$2
37,0
89,4
13$1
2,55
9,50
8$1
7,36
8,52
8$2
37,3
63,0
03$2
14,5
11,4
999,
278
9,05
4
SPEC
IAL
REV
ENU
E FU
ND
S -
OTH
ER20
11-1
2 CO
NSU
LTIN
G S
ERV
ICE
CON
TRA
CTS
REPO
RT

CONSULTING SERVICE CONTRACTS
435
Esti
mat
edEs
tim
ated
Num
ber
Num
ber
App
ropr
iati
ons
Reap
prop
riat
ions
Esti
mat
edEs
tim
ated
of C
ontr
act
of C
ontr
act
App
ropr
iati
ons
Requ
este
dRe
appr
opri
atio
nsRe
ques
ted
Dis
burs
emen
tsD
isbu
rsem
ents
Empl
oyee
sEm
ploy
ees
Age
ncy
2010
-11
2011
-12
2010
-11
2011
-12
2010
-11
2011
-12
2010
-11
2011
-12
Crim
inal
Jus
tice
Serv
ices
, Div
isio
n of
$2,1
31,3
67$7
23,7
38$3
,474
,577
$2,4
24,9
44$3
,192
,500
$1,3
64,3
9810
8En
viro
nmen
tal C
onse
rvat
ion,
Dep
artm
ent o
f$7
,000
$7,0
00$2
3,20
4,00
0$2
3,20
4,00
0$2
3,21
1,00
0$2
3,21
1,00
02,
280
2,27
8G
ener
al S
ervi
ces,
Offi
ce o
f$4
,500
,000
$4,9
00,0
00$0
$0$4
,500
,000
$4,2
75,0
0046
544
2M
enta
l Hea
lth, O
ffice
of
$4,7
50,0
00$5
,250
,000
$0$0
$4,7
50,0
00$5
,250
,000
3838
Mot
or V
ehic
les,
Dep
artm
ent o
f$2
,936
,615
$2,9
36,6
15$0
$0$2
,936
,615
$2,9
36,6
1529
29Pa
rks,
Rec
reat
ion
and
His
toric
Pre
serv
atio
n,
Offi
ce o
f$3
4,20
0,00
0$3
4,20
0,00
0$9
3,57
1,00
0$9
3,20
4,00
0$8
,615
,573
$6,5
00,6
2949
045
0St
ate,
Dep
artm
ent o
f$0
$0$9
44,0
00$8
08,0
00$7
38,0
00$3
50,0
0025
17St
atew
ide
Fina
ncia
l Sys
tem
$45,
850,
000
$20,
544,
000
$0$0
$45,
850,
000
$20,
544,
000
127
38Te
mpo
rary
and
Dis
abili
ty A
ssis
tanc
e,
Offi
ce o
f$0
$0$6
00,0
00$6
00,0
00$6
00,0
00$6
00,0
0019
19Tr
ansp
orta
tion,
Dep
artm
ent o
f$1
82,6
42,0
00$1
78,4
08,0
00$9
53,0
33,0
00$8
37,4
20,0
00$2
08,5
90,0
00$1
90,7
40,0
003,
599
3,18
3To
tal
$277
,016
,982
$246
,969
,353
$1,0
74,8
26,5
77$9
57,6
60,9
44$3
02,9
83,6
88$2
55,7
71,6
427,
082
6,50
2
Esti
mat
edEs
tim
ated
Num
ber
Num
ber
App
ropr
iati
ons
Reap
prop
riat
ions
Esti
mat
edEs
tim
ated
of C
ontr
act
of C
ontr
act
App
ropr
iati
ons
Requ
este
dRe
appr
opri
atio
nsRe
ques
ted
Dis
burs
emen
tsD
isbu
rsem
ents
Empl
oyee
sEm
ploy
ees
Age
ncy
2010
-11
2011
-12
2010
-11
2011
-12
2010
-11
2011
-12
2010
-11
2011
-12
Budg
et, D
ivis
ion
of th
e$1
,442
,950
$1,2
00,0
00$0
$0$1
,442
,950
$1,2
00,0
0013
13Ci
vil S
ervi
ce, D
epar
tmen
t of
$1,9
81,0
00$2
,271
,000
$0$0
$1,9
81,0
00$2
,266
,000
1925
Gen
eral
Ser
vice
s, O
ffice
of
$2,4
25,0
00$1
,800
,000
$0$0
$2,4
25,0
00$1
,800
,000
3731
Tech
nolo
gy, O
ffice
for
$26,
082,
000
$26,
082,
000
$0$0
$26,
082,
000
$23,
667,
000
162
147
Tota
l$3
1,93
0,95
0$3
1,35
3,00
0$0
$0$3
1,93
0,95
0$2
8,93
3,00
023
121
6
Esti
mat
edEs
tim
ated
Num
ber
Num
ber
App
ropr
iati
ons
Reap
prop
riat
ions
Esti
mat
edEs
tim
ated
of C
ontr
act
of C
ontr
act
App
ropr
iati
ons
Requ
este
dRe
appr
opri
atio
nsRe
ques
ted
Dis
burs
emen
tsD
isbu
rsem
ents
Empl
oyee
sEm
ploy
ees
Age
ncy
2010
-11
2011
-12
2010
-11
2011
-12
2010
-11
2011
-12
2010
-11
2011
-12
Audi
t and
Con
trol
, Dep
artm
ent o
f$2
,028
,902
$1,9
46,0
00$0
$0$2
,028
,902
$1,9
46,0
0076
75To
tal
$2,0
28,9
02$1
,946
,000
$0$0
$2,0
28,9
02$1
,946
,000
7675
CAPI
TAL
PRO
JECT
S FU
ND
S
FID
UCI
ARY
FU
ND
S
INTE
RNA
L SE
RVIC
E FU
ND
S
2011
-12
CON
SULT
ING
SER
VIC
E CO
NTR
ACT
S RE
PORT

436
USER’S GUIDE The “User’s Guide” provides an explanation of how to use the Executive Budget documents and where to find particular types of information. It also contains some “user-friendly” descriptions of State government and the budget process, a guide on how to read certain budget tables, and definitions of financial terms as included in these budget documents. Government budget documents can be difficult to read. They contain many numbers and tend to involve technical terms and concepts. Even people with considerable government experience can be baffled by the numerous tables or find themselves uncertain about the meaning of specialized terms. The User’s Guide attempts to overcome this problem by providing simplified, nontechnical explanations and a description of how to use the budget documents. The User’s Guide contains the following sections:
The Executive Budget Documents The Structure of State Government The Budget Process Guide to the Tables Financial Terminology
THE EXECUTIVE BUDGET DOCUMENTS
The 2011-12 Executive Budget is presented in five volumes. The first volume, the Briefing Book, contains the Budget Director’s Message which presents the Governor’s fiscal blueprint for 2011-12. It also includes highlights of major initiatives and a list of legislative proposals needed to implement the proposed budget. This document also presents tables summarizing significant changes in agency spending. The Five-Year Financial Plan summarizes the Governor’s Executive Budget and describes the “complete plan” of spending and revenues required by the Constitution. The Economic and Revenue Outlook explains the specific sources of State revenues including the economic outlook for the nation and the State. The fourth book presents the Five-Year Capital Program and Financing Plan which highlights major capital initiatives and objectives and describes the approach to financing. Finally, the Agency Presentations volume describes the functions of each State agency and presents tables that summarize the agency’s spending by program and category. A “User’s Guide” provides background information on State government and the budget process, and explains how to interpret the agency “story” tables. This book also includes the budget requests of the Legislature and Judiciary which are submitted without revision as required by the Constitution. A statutorily-required Tax Expenditure Report is published separately shortly after the formal submission of the budget. It should be noted that this User’s Guide describes only the “official” budget documents. Other documents such as press releases and publicly released briefing materials may also be of help to those seeking to understand the budget. This information will be posted on the Division of the Budget’s website at http://www.budget.state.ny.us as soon as it is available.

USER’S GUIDE
437
THE STRUCTURE OF STATE GOVERNMENT The Executive Budget focuses on the programs and finances of State government. It should be kept in mind, however, that government in New York State also includes the governments of 57 counties outside of New York City, 62 cities (including New York City), 932 towns and 555 villages. In addition, the State is divided into 697 school districts including New York City. Organizationally, the State follows the classic pattern of American government with three independent branches. The legislative branch consists of a bicameral Legislature – a Senate of 62 members and an Assembly of 150 members. The judicial branch includes trial courts and appellate courts ranging from town and village courts to the State’s highest court – the Court of Appeals. The Judiciary functions under a Unified Court System whose organization, administration, and financing are prescribed by the State Constitution and the Unified Court Budget Act. The executive branch of New York State government consists of 20 departments, the maximum number allowed under a constitutional ceiling. The limitation on the number of departments is traceable to the constitutional reforms of the mid-1920s which sought to make government more manageable by eliminating most of the independently elected executive officers and by inhibiting the creation of new departments. Although there have been several interim changes since the 1920s, in 1961 the maximum number of departments was set at 20, which at the present time are the following:
Agriculture and Markets Health Audit and Control Insurance* Banking* Labor Civil Service Law Correctional Services** Mental Hygiene Economic Development Motor Vehicles Education Public Service Environmental Conservation State Executive Taxation and Finance Family Assistance Transportation
* The 2011-12 Executive Budget proposes to merge the Banking and Insurance Departments and the Consumer Protection Board to form a new Department of Financial Regulation. ** The 2011-12 Executive Budget proposes to merge the Department of Correctional Services and the Division of Parole into a new Department of Corrections and Community Supervision.
To accommodate governmental functions added since the 1920s within the limit established by the Constitution, additional agencies have been created within the Executive Department. At the time of the 1920s reorganization, this Department, headed by the Governor, consisted solely of such core functions as budgeting, central purchasing, State police, and military and naval affairs. However, over the years as the State took on new responsibilities that did not fit logically into the framework of one of the other departments, the entities charged with providing those services became divisions or offices of the Executive Department.

USER’S GUIDE
438
New York grants its Governor a comparatively broad range of executive power. Only two officers, in addition to the Governor and Lieutenant Governor (who are elected on a joint ballot), are directly elected by the people of the State: the State Comptroller, who heads the Department of Audit and Control, and the Attorney General, who heads the Department of Law. With a handful of exceptions, the Governor appoints the heads of all other departments and agencies of the executive branch. The exceptions include the Commissioner of the State Education Department, who is appointed by and serves at the pleasure of the State Board of Regents. The State University of New York (SUNY) Chancellor and the City University of New York (CUNY) Chancellor are appointed by the Board of Trustees of each system. The departments and agencies, whose heads report to the Governor, are separate and distinct from one another. Conceptually, however, one may think of each department, board, commission, office or other entity as operating within the context of one of seven major functional areas. An organization chart of the executive branch by functional areas is displayed on the following page. This chart depicts the current structure of the executive branch.

USER’S GUIDE
439
EDU
CA
TIO
NB
OA
RD
S
REG
EN
TSS
UN
Y T
RU
STE
ES
CU
NY
TR
US
TEE
S
CO
MPT
RO
LLER
ATT
OR
NEY
GEN
ERA
L
Law
Audi
t and
Con
trol
GO
VER
NO
R
LIEU
TEN
AN
T G
OVE
RN
OR
EDU
CAT
ION
TRA
NS
PO
RTA
TIO
Nan
d E
CO
NO
MIC
DE
VE
LOP
ME
NT
GE
NE
RA
LG
OV
ER
NM
EN
TLA
BO
R a
nd F
AM
ILY
AS
SIS
TAN
CE
PU
BLI
CP
RO
TEC
TIO
NH
EAL
TH a
ndM
EN
TAL
HYG
IEN
EE
NV
IRO
NM
EN
TAL
CO
NS
ER
VA
TIO
N
Ban
king
3
Eco
nom
ic D
evel
opm
ent
Em
pire
Sta
te D
evel
op-
men
tCor
pora
tion
Ene
rgy
Res
earc
h an
d D
evel
opm
ent
Auth
ority
Insu
ranc
e3
Lotte
ryM
etro
polit
an T
rans
por-
tatio
nAu
thor
ityM
otor
Veh
icle
sO
lym
pic
Reg
iona
l De-
velo
pmen
tA
utho
rity
Pub
lic S
ervi
ceR
acin
g an
d W
ager
ing
Boa
rd*
Reg
ulat
ory
Ref
orm
*4
Sci
ence
, Te
chno
logy
an
d In
nova
tion*
5
Sta
teTa
x A
ppea
ls*
Taxa
tion
and
Fina
nce
Thru
way
Aut
horit
yTr
ansp
orta
tion
Arts
*C
ity U
nive
rsity
of N
ew
York
Edu
catio
nH
ighe
r E
duca
tion
Ser
-vi
ces
Cor
pora
tion
Sta
te U
nive
rsity
of N
ew
York
Sta
te U
nive
rsity
Con
-st
ruct
ion
Fund
Fam
ily A
ssis
tanc
eC
hild
ren
and
Fam
ilySe
rvic
esTe
mpo
rary
and
Dis
-ab
ility
Ass
ista
nce
Hou
sing
and
Com
-m
unity
Ren
ewal
*H
ousi
ng F
inan
ce
Age
ncy
Affo
rdab
le H
ousi
ng
Cor
pora
tion
Hou
sing
Tru
st F
und
Cor
pora
tion
Sta
te o
f New
Yor
kM
ortg
age
Age
ncy
Hum
an R
ight
s*La
bor
Wel
fare
Insp
ecto
r G
ener
al
Cor
rect
ion
Com
mis
sion
* 1
Cor
rect
iona
l Ser
vice
s2
Crim
inal
Jus
tice
Serv
ices
*H
omel
and
Sec
urity
and
Emer
genc
y Se
rvic
esIn
dige
nt L
egal
Ser
vices
Milit
ary
and
Nav
al
Affa
irs*
Paro
le*
2
Pre
vent
ion
of D
omes
tic
Vio
lenc
e1
Sta
te P
olic
e*Vi
ctim
Ser
vice
s*1
Agin
g*D
evel
opm
enta
l Dis
abil-
ities
Pla
nnin
g C
ounc
ilH
ealth Med
icai
d In
spec
tor
Gen
eral
Men
tal H
ygie
neA
lcoh
olis
m a
nd
Subs
tanc
e A
buse
Serv
ices
Men
tal H
ealth
Peo
ple
with
Dev
elop
-m
enta
l Dis
abilit
ies
Qua
lity
of C
are
and
Advo
cacy
for
Per
sons
with
Dis
abilit
ies
Adiro
ndac
k Pa
rk*
Agric
ultu
re a
nd M
arke
tsE
nviro
nmen
tal C
onse
r-va
tion
Env
ironm
enta
l Fa
cilit
ies
Cor
pora
tion
Hud
son
Riv
er P
ark
Trus
t*P
arks
, Rec
reat
ion
and
His
toric
Pre
serv
atio
n
Alc
ohol
ic B
ever
age
Con
trol*
Bud
get*
Civ
il Se
rvic
eC
onsu
mer
Pro
tect
ion
Boa
rd*
3
Ele
ctio
ns*
Em
ploy
ee R
elat
ions
*E
xecu
tive
Cha
mbe
r*G
ener
al S
ervi
ces*
Insp
ecto
r G
ener
al*
Inte
rest
on
Law
yer
Acc
ount
Judi
cial
Com
mis
sion
sP
ublic
Em
ploy
men
t R
elat
ions
Boa
rdP
ublic
Inte
grity
, C
omm
issi
on o
nS
tate
Ins
uran
ce F
und
Sta
tew
ide
Fina
ncia
lS
yste
mTe
chno
logy
*V
eter
ans’
Affa
irs*
Wor
kers
’ Com
pens
atio
n B
oard
FUN
CTI
ON
AL
DIS
TRIB
UTI
ON
OF
STAT
E A
GEN
CIE
S IN
TH
E EX
ECU
TIVE
BR
AN
CH
Janu
ary
1, 2
011
* Ind
icat
es a
genc
ies
with
in th
e E
xecu
tive
Dep
artm
ent
1 Th
e 20
11-1
2 E
xecu
tive
Bud
get
prop
oses
to m
erge
the
Com
mis
sion
of C
orre
ctio
n, th
e O
ffice
for
the
Pre
vent
ion
of D
omes
tic V
iole
nce
and
the
Offi
ce o
f Vic
tim S
ervi
ces
into
the
Div
isio
n of
Crim
inal
Ju
stic
e S
ervi
ces.
2Th
e 20
11-1
2 E
xecu
tive
Bud
get
prop
oses
to m
erge
the
Dep
artm
ent
of C
orre
ctio
nal S
ervi
ces
and
the
Divi
sion
of P
arol
e in
to
a ne
w D
epar
tmen
t of
Cor
rect
ions
and
Com
mun
ity S
uper
visi
on.
3Th
e 20
11-1
2 E
xecu
tive
Bud
get
prop
oses
to m
erge
the
Ban
king
Dep
artm
ent,
the
Insu
ranc
e D
epar
tmen
t an
d th
e C
onsu
mer
Pro
tect
ion
Boa
rd
into
a
new
Dep
artm
ent
of F
inan
cial
Reg
ulat
ion.
4Th
e 20
11-1
2 E
xecu
tive
Bud
get
prop
oses
the
elim
inat
ion
of th
e G
over
nor’s
Offi
ce o
f Reg
ulat
ory
Ref
orm
.5
The
2011
-12
Exe
cutiv
e B
udge
t pr
opos
es to
mer
ge t
he O
ffice
of S
cien
ce,
Tech
nolo
gy a
nd In
nova
tion
into
the
Em
pire
Sta
te D
evel
opm
ent
Cor
pora
tion.
USER’S GUIDE
440
THE BUDGET PROCESS New York State’s budget process uses an executive budget model. Under this system, the Executive is responsible for developing and preparing a comprehensive, balanced budget proposal which the Legislature modifies and enacts into law. The Governor is required by the State Constitution to seek and coordinate requests from agencies of State government, develop a “complete” plan of proposed expenditures and the revenues available to support them (a “balanced budget”), and submit a budget to the Legislature along with the appropriation bills and other legislation required to carry out budgetary recommendations. The Governor is also required by the State Finance Law to manage the budget through administrative actions during the fiscal year. The State’s fiscal year begins April 1 and ends on March 31. However, the actual “budget cycle,” representing the time between early budget preparation and last-minute disbursements, begins some 9 months earlier and lasts approximately 27 months – until the expiration of the State Comptroller’s authority to honor vouchers against the previous fiscal year’s appropriations. AGENCY BUDGET PREPARATION (JUNE-SEPTEMBER/OCTOBER) Preparation of budget requests varies among agencies reflecting their size, complexity, and internal practice. Typically, budget development begins at the program or subdepartmental level, with staff preparing individual program requests. The head of the agency or its top fiscal officer may hold internal hearings at which program managers outline their budgetary needs. Although agencies begin to analyze their budget needs as early as May or June, the formal budget cycle begins when the Budget Director issues a policy memorandum – the “call letter” – to agency heads. The call letter outlines, in general terms, the Governor’s priorities for the coming year, alerts the agency heads to expected fiscal constraints, and informs agencies of the schedule for submitting requests to the Division of the Budget. The call letter signals the official start of the budget process. By early-mid fall, the final program package is assembled, guided by the instructions set forth by the Division of the Budget in the Budget Request Manual; reviewed for consistency with the call letter; and approved by the agency head. DIVISION OF THE BUDGET REVIEW (SEPTEMBER/OCTOBER–DECEMBER) In accordance with the schedule outlined in the call letter, agencies typically submit their budget requests to the Division of the Budget in early-mid fall, with copies provided to the legislative fiscal committees. Examination units within the Division then analyze the requests of the agencies for which they have responsibility. Examiners may seek additional information from the agencies and may hold informal hearings or meetings with agency management to clarify agency requests and seek a more precise definition of agency priorities. By the end of October, examination units have also usually determined funding requirements to continue agency programs at current levels in the new fiscal year.

USER’S GUIDE
441
In November, the Budget Director conducts constitutionally authorized “formal” budget hearings, giving agency heads an opportunity to present and discuss their budget requests and giving the staff of the Division of the Budget and the Governor’s office an opportunity to raise critical questions on program, policy, and priorities. As provided in the Constitution, representatives of the Legislature also participate in the hearings. Pursuant to the State Finance Law, and to help expedite the budget process, legislative and Executive staffs meet in early November to discuss the economic outlook, revenue forecasts, projected spending, the impact of State and Federal statutes, and any other relevant issues. Through late November, the Division’s examiners transform agency requests into preliminary budget and personnel recommendations which are reviewed in detail with the Director. The staff also prepare the appropriation bills and any other legislation required to carry out these recommendations. Concurrently, the Division of the Budget’s fiscal planning staff is reassessing economic projections, investigating possible changes in the revenue structure, analyzing trends in Federal funding, and preparing the Financial Plan that describes and forecasts the State’s fiscal condition. The Financial Plan is prepared both on a cash basis and according to Generally Accepted Accounting Principles (GAAP). By early December, the Division of the Budget will normally have completed its preliminary recommendations on both receipts and disbursements and presented them to the Governor and the Governor’s staff. Budget staff then prepare the tables and the narrative (the “budget story”) that accompany each agency budget and the descriptions and forecasts of individual revenue sources. THE GOVERNOR’S DECISIONS (NOVEMBER–JANUARY) The Governor and Executive Chamber staff, who are also preparing the annual “State of the State” Message to the Legislature (which the Governor presents to the Legislature when it convenes in January), are conversant with the budget throughout its development. The Governor is kept up-to-date on changing economic and revenue forecasts and confirms that Executive program priorities are accurately reflected in the budget. Based on the preliminary recommendations and the most current reading of the economic and fiscal environment, the final Executive Budget recommendations are formulated in a series of meetings between Division of the Budget staff and the Governor and his staff. These sessions focus on major fiscal and policy issues and may lead to significant revisions in agency budgets. LEGISLATIVE ACTION (JANUARY–MARCH) As required by the State Constitution, by mid-January – or following a gubernatorial election year, by February 1 – the Governor submits the Executive Budget to the Legislature along with the related appropriation, revenue, and other budget bills. The State’s Five-Year Financial Plan, Five-Year Capital Program and Financing Plan, and financial information supporting the Executive Budget are also submitted with the Executive Budget. The Executive Budget documents are available on the Division of the Budget’s website at http://www.budget.state.ny.us.
USER’S GUIDE
442
The Legislature, primarily through its fiscal committees Senate Finance and Assembly Ways and Means, analyzes the Executive spending proposals and revenue estimates, holds public hearings on major programs, and seeks further information from the staffs of the Division of the Budget and other State agencies. Following that review, the Legislature acts on the appropriation bills submitted with the Executive Budget to reflect its decisions. Under budget reform legislation passed in 2007, the Legislature is required to follow a Conference Committee process to organize its deliberations, set priorities, and reach agreement on a budget between the two houses. In addition, the State Finance Law requires that the Executive and Legislature convene a consensus economic and revenue forecasting conference and issue a consensus report on tax, lottery, and miscellaneous receipts on or before March 1. If the parties fail to reach consensus, the Comptroller is required to issue a revenue forecast by March 5. Based on their separate and joint deliberations, the two houses reach agreement on spending and revenue recommendations which are reflected in amended versions of the Governor’s proposed appropriation bills, and related legislation, and approved by both houses. These amended bills are available from the Senate and Assembly Document Rooms located in the Capitol and the Legislative Office Building and are also available on the Internet. The appropriation bills, except for those items which were added by the Legislature and the appropriations for the Legislature and Judiciary, become law without further action by the Governor. The Governor must approve or disapprove all or parts of the appropriation bills covering the Legislature and Judiciary and may use the line item veto to disapprove items added by the Legislature while approving the remainder of the bill. As provided in the Constitution, the Legislature may override the Governor’s veto by a vote of two-thirds of the members of each house. The appropriation bills legally authorize the expenditure of funds during the new fiscal year. Prior to passage of the appropriation bills, the Legislature must issue a summary of the proposed changes to the budget to its members. The Division of the Budget is also required to prepare a report that summarizes the impact of the Legislature’s actions on the State’s multi-year Financial Plan. Once the Governor completes his review of the Legislature’s actions, the Division of the Budget then issues a comprehensive Enacted Budget Report that contains the State’s official Financial Plan projections for the current and successive fiscal years. The Legislature must also issue a report describing appropriation changes and the effect of the enacted budget on State agency employment levels. BUDGET EXECUTION (APRIL–MARCH) At this point, the budget process enters a new phase: budget execution. As a first step, the Division of the Budget approves “certificates of allocation” informing the State Comptroller that accounts may be established as specified in the certificates and that vouchers drawn against the accounts may be honored. In addition, the Division of the Budget keeps a close watch throughout the year on the flow of revenue and the pattern of expenditures against its projections. This information is reflected in quarterly updates of the Financial Plan which are provided to the Legislature as required by law in April (or as soon as practicable after budget enactment), July, October and with the Executive Budget for the ensuing year (usually January). The Debt Reform Act of 2000 (see also page 468) requires the Governor to report on the

USER’S GUIDE
443
State’s compliance with statutory caps placed on new debt issued after March 31, 2000; the State annually reports these findings in the Financial Plan update most proximate to October 31. These updates serve as the basis of financial management during the fiscal year and may alert both the Governor and the Legislature to potential problems in maintaining budget balance as the State fiscal year unfolds. Shortly after the end of the fiscal year, the Division of the Budget issues a comprehensive report that (1) compares unaudited year-end results to the projections set forth in the enacted budget and in the final update to the Financial Plan and (2) summarizes the reasons for the annual change in receipts and disbursements.

USER’S GUIDE
444
A GUIDE TO THE TABLES One of the most daunting features of any budget document is the array of tables that accompanies each narrative. What does each table include? What is a “category”? Is it the same as a “program”? What are “all funds”? How do the tables account for transactions that have occurred during the current fiscal year and that may have changed the basis for year-to-year comparisons? At first glance, the tables may appear to differ widely in appearance and content from one agency budget to another. Some agencies will have a limited number of programs, receive funding in only one category of appropriation – say, State Operations – and have no capital construction projects. Others may receive funding in all categories and many fund types, have a complex set of programs, and reflect numerous current-year adjustments. A closer look will reveal that the agency presentations use a uniform set of tables in an identical sequence. It should be noted, however, that some agencies may not require one or more of the set. For example, the capital projects table will not be included for an agency that has no construction program. All or most of the following tables accompany each agency presentation. Although the titles of the tables are identical to those that appear in the agency presentations, the tables in the presentations are not lettered. The letters of the tables (e.g., A, B…J) have been included in this guide for ease of reference only.
A. All Funds — Appropriations
B. All Fund Types — Projected Levels of Employment by Program — Filled Annual Salaried Positions
C. State Operations — All Funds Financial Requirements by Fund Type — Appropriations
D. State Operations — All Funds Financial Requirements by Program — Appropriations
E. State Operations - General Fund — Summary of Personal Service Appropriations and Changes — 2011-12 Recommended
F. State Operations - General Fund — Summary of Nonpersonal Service and Maintenance Undistributed Appropriations and Changes — 2011-12 Recommended
G. State Operations - Other Than General Fund — Summary of Appropriations and Changes — 2011-12 Recommended
H. Aid To Localities — All Funds Financial Requirements by Fund Type — Appropriations
I. Aid To Localities — All Funds Financial Requirements by Program — Appropriations
J. Capital Projects — All Funds Financial Requirements by Program — Appropriations

USER’S GUIDE
445
A. ALL FUNDS — APPROPRIATIONS
ALL FUNDS 1 APPROPRIATIONS
(dollars)
2 Category
3 Available
2010-11
4 AppropriationsRecommended
2011-12 5
Change
6 Reappropriations
Recommended2011-12
State Operations 82,050,000 86,977,000 4,927,000 24,486,000 Aid To Localities 403,074,150 9,650,000 (393,424,150) 849,811,000 Capital Projects 36,100,000 30,700,000 (5,400,000) 111,358,000 Total 521,224,150 127,327,000 (393,897,150) 985,655,000
1 “All Funds” captures spending from all of the State’s various revenue sources
including taxes, fees, fines, Federal grants, bond proceeds, lottery proceeds, and other miscellaneous receipts. This concept includes the four fund types which comprise the Governmental Funds Financial Plan: the General Fund (the repository for the majority of State-imposed taxes and fees), Special Revenue funds (including funds earmarked for specific purposes like lottery proceeds, fishing licenses, or Federal grants), Capital Projects funds and Debt Service1 funds. Another three fund types – Internal Service funds, Enterprise funds and Fiduciary funds – are included as well.
2 There are four major categories of spending: State Operations, Aid to Localities,
Capital Projects, and Debt Service. 3 This column displays the appropriations available for the current fiscal year.
Adjustments, such as the recommended transfer of a program or an item to another fund or agency for the next fiscal year, are included to provide for year-to-year comparability.
4 This column displays the appropriations recommended for the next fiscal year. As
explained in the “Financial Terminology” section of this guide, appropriations represent an authorization to incur spending obligations during the fiscal year, up to the specified amount. Cash payments for those obligations may occur during the fiscal year of the appropriation or during the first part of the ensuing fiscal year.
5 This column displays the difference between the appropriations available in the
current fiscal year and the amounts recommended for the next fiscal year, with negative amounts displayed in parentheses.
6 A reappropriation is a prior-year or current-year appropriation which will not be fully
spent by the end of the current fiscal year and which has been recommended for extension.
1 While funds classified as Debt Service may be included, any appropriations made specifically in the Debt Service category of spending are not included in this table. For more information about State Debt Service, please refer to Part II.

USER’S GUIDE
446
B. ALL FUND TYPES — PROJECTED LEVELS OF EMPLOYMENT BY PROGRAM — FILLED ANNUAL SALARIED POSITIONS The Projected Levels of Employment by Program table for filled, annual salaried positions is presented on a Full-Time Equivalent (FTE) basis. The table provides a point-in-time projection of filled, full-time, annual salaried positions. In understanding the definition of FTE, it is important to note that the FTE is a unit of measure which identifies filled, full-time, annual salaried positions rather than people. The following three examples illustrate this concept:
1 person serving in 1 position at 100 percent time (full-time) = 1 FTE 2 people sharing 1 position, each at 50 percent time (half-time) = .5 FTE + .5 FTE
= 1 FTE 2 people serving in 2 positions, each at 50 percent time (half-time) = .5 FTE + .5
FTE = 1 FTE In total, the above three examples indicate that 5 people are employed within State service, but since 4 people work half-time, only 3 FTEs are counted. FTE’s supported by funds derived from some external source (i.e., suballocations) are included within agency program fund type totals.
ALL FUND TYPES PROJECTED LEVELS OF EMPLOYMENT BY PROGRAM
FILLED ANNUAL SALARIED POSITIONS Full-Time Equivalent Positions (FTE)
1 Program
2 2010-11
Estimated FTEs03/31/11
3 2011-12
Estimated FTEs03/31/12
4 FTE Change
Administration General Fund 62 62 0
Emergency Management General Fund 30 32 2 Special Revenue Funds - Federal 75 75 0 Special Revenue Funds - Other 18 18 0
Military Readiness General Fund 164 164 0 Special Revenue Funds - Federal 292 292 0
Special Service Special Revenue Funds - Other 11 11 0
Total 652 654 2
1 Each agency has a program structure which is described in its narrative presentation.
Each of the agency’s activities falls within a program and each program that contains FTEs may have appropriations from one or more fund types.
2 This column displays an estimate of FTEs on March 31, 2011 (i.e., the last day of the
current fiscal year). 3 This column displays an estimate of FTEs on March 31, 2012 (i.e., the last day of the
next fiscal year). 4 This column displays the difference between the FTE’s in the current fiscal year and
FTEs recommended for the next fiscal year, with negative amounts displayed in parentheses.

USER’S GUIDE
447
The next five tables apply to the State Operations category. Each agency which has appropriations in this category will have some or all of these tables in its presentation. C. STATE OPERATIONS — ALL FUNDS REQUIREMENTS BY FUND TYPE — APPROPRIATIONS This table shows the distribution of all appropriations within the State Operations category by fund type and shows a year-to-year comparison of the amounts available in the current fiscal year and those recommended for the next fiscal year. See the next table for a distribution by program.
STATE OPERATIONS ALL FUNDS FINANCIAL REQUIREMENTS BY FUND TYPE
APPROPRIATIONS (dollars)
1 Fund Type
2 Available
2010-11
3 Recommended
2011-12 4
ChangeGeneral Fund 24,766,000 24,671,000 (95,000) Special Revenue Funds - Federal 5 46,419,000 46,041,000 (378,000) Special Revenue Funds - Other 10,865,000 16,265,000 5,400,000 Total 82,050,000 86,977,000 4,927,000
Adjustments: 6 Transfer(s) From
Special Pay Bill General Fund (390,000)
Appropriated 2010-11 81,660,000 1 The State Finance Law defines and mandates the use of seven fund types. Of these,
the fund types typically found in the State Operations category are General, Special Revenue, Enterprise, Internal Service, and Fiduciary.
2 This column displays the appropriations available for the current fiscal year. 3 This column displays the appropriations recommended for the next fiscal year. 4 This column displays the difference between the appropriations available in the
current fiscal year and the amounts recommended for the next fiscal year, with negative amounts displayed in parentheses.
5 Because of the difference between the State’s fiscal year (April 1 through March 31)
and the Federal fiscal year (October 1 through September 30), appropriations of most Federal grants generally include spending from portions of two Federal fiscal years. The amounts discussed throughout the Executive Budget represent the totals of spending from different grants that are expected to occur during the State fiscal year.
6 Adjustments in the amounts available for the current year may occur for a number of
reasons. As discussed below, they may anticipate changes that are being recommended in the budget for the new fiscal year or reflect transactions occurring during the course of the current year:
Most commonly, the adjustment is included to make the amounts available in the current fiscal year more comparable to those recommended for the next fiscal year. For example, if the Executive Budget is recommending that an item which

USER’S GUIDE
448
has been appropriated in the current year’s budget as a State Operations item be included as an Aid to Localities item in the next fiscal year, the dollar amount of the item would be deducted from the amount available in the current year for State Operations to achieve year-to-year comparability. A similar amount would be added to the amount available this year for Aid to Localities.
In other cases, including the example shown in the table above, the amount shown reflects an adjustment that has actually taken place during the current year. In the example, amounts were transferred to this agency from an appropriation made to “All State Departments and Agencies” which is included among the Miscellaneous appropriations elsewhere in the Executive Budget. During budget execution, such Miscellaneous All State Department and Agency appropriations (e.g., to fund a salary increase or some other across-the-board adjustment) are divided and transferred to the appropriations of individual agencies to be expended (“lump sum appropriations” are explained on page 462 of the Financial Terminology section). The adjustments made in this case enable the reader to compare the amount actually available to the agency under this category during the current fiscal year with that appropriated by the Legislature for the year.
D. STATE OPERATIONS — ALL FUNDS FINANCIAL REQUIREMENTS BY PROGRAM —APPROPRIATIONS This table shows the amounts available for State Operations for the current fiscal year and those that have been recommended for the next fiscal year by program and, within each program, by fund type.
STATE OPERATIONS ALL FUNDS FINANCIAL REQUIREMENTS BY PROGRAM
APPROPRIATIONS (dollars)
1 Program
2 Available
2010-11
3 Recommended
2011-12 4
ChangeAdministration
General Fund 4,004,000 4,004,000 0 Disaster Assistance
Special Revenue Funds - Federal 4,843,000 4,861,000 18,000 Emergency Management
General Fund 4,384,000 4,584,000 200,000 Special Revenue Funds - Federal 966,000 575,000 (391,000) Special Revenue Funds - Other 2,000,000 7,400,000 5,400,000
Military Readiness General Fund 15,488,000 15,693,000 205,000 Special Revenue Funds - Federal 40,610,000 40,605,000 (5,000)
Special Service General Fund 890,000 390,000 (500,000) Special Revenue Funds - Other 8,865,000 8,865,000 0
Total 82,050,000 86,977,000 4,927,000
1 Each agency has a program structure which is described in its narrative presentation.
Each of the agency’s activities falls within a program, and each program may have appropriations from one or more fund types.
2 This column displays the appropriations available for the current fiscal year.

USER’S GUIDE
449
3 This column displays the appropriations recommended for the next fiscal year. 4 This column displays the difference between the appropriations available in the
current fiscal year and the amounts recommended for the next fiscal year, with negative amounts displayed in parentheses.
E. STATE OPERATIONS - GENERAL FUND — SUMMARY OF PERSONAL SERVICE APPROPRIATIONS AND CHANGES — 2011-12 RECOMMENDED Personal service is one of the “major objects” of expenditure in use in New York State budgeting. This table shows the amounts recommended for personal service for each program supported from the General Fund. As discussed in the notes for this table, there are “subobjects” within personal service. The remaining major objects are discussed in the tables that follow.
STATE OPERATIONS - GENERAL FUND SUMMARY OF PERSONAL SERVICE APPROPRIATIONS AND CHANGES
2011-12 RECOMMENDED (dollars)
1 2
Total
3 Personal Service Regular
(Annual Salaried) Program Amount Change Amount ChangeAdministration 3,546,000 (5,000) 3,531,000 (6,000)Emergency Management 2,100,000 217,000 2,063,000 215,000 Military Readiness 7,996,000 6,000 7,172,000 (45,000)Special Service 137,000 0 137,000 0 Total 13,779,000 218,000 12,903,000 164,000
4 Temporary Service
(Nonannual Salaried)
5 Holiday/Overtime Pay
Program Amount Change Amount ChangeAdministration 0 0 15,000 1,000 Emergency Management 0 0 37,000 2,000 Military Readiness 733,000 13,000 91,000 38,000 Special Service 0 0 0 0 Total 733,000 13,000 143,000 41,000
1 Each agency has a program structure which is described in its narrative presentation. 2 The Total columns display the sum of the amounts recommended for the “subobjects”
Personal Service Regular (Annual Salaried), Temporary Service (Nonannual Salaried), and Holiday/Overtime Pay (Annual Salaried). Total Personal Service includes funding for annual-salaried personnel (see table B) and nonannual-salaried personal service costs, and may include adjustments to account for savings expected to result from vacancies occurring throughout the year.
3 The Personal Service Regular columns display the amounts recommended for the
“subobject” Personal Service Regular (Annual Salaried) and the difference between the appropriations available in the current fiscal year and the amounts recommended for the next fiscal year, with negative amounts displayed in parentheses. The bulk of the State’s permanent work force is funded through Personal Service Regular and is generally paid on the basis of an annual salary.

USER’S GUIDE
450
4 Similar to 3 above, these columns display the recommended and change amounts for the “subobject” Temporary Service. Temporary Service authorizes pay for employees hired on a seasonal or short-term basis who are generally paid according to an hourly wage scale including amounts to cover holiday/overtime pay for such nonannual salaried employees.
5 Similar to 3 above, these columns display the recommended and change amounts for
the “subobject” Holiday/Overtime Pay. Holiday/Overtime Pay includes compensation for annual salaried employees eligible to receive additional payment for work performed on holidays or beyond normal duty hours. Eligibility for such payment is established by Civil Service Rules and Regulations and by contracts resulting from collective bargaining with employee organizations. The provisions of both the Civil Service Rules and Regulations and contracts with employee organizations must meet the standards set forth in the Federal Fair Labor Standards Act which governs State overtime policies.
F. STATE OPERATIONS - GENERAL FUND — SUMMARY OF NONPERSONAL SERVICE AND MAINTENANCE UNDISTRIBUTED APPROPRIATIONS AND CHANGES — 2011-12 RECOMMENDED Nonpersonal service is one of the four “major objects” of expenditure in use in New York State budgeting. This table shows the amounts recommended for nonpersonal service for each program supported from the General Fund. As discussed in the notes for this table, there are “subobjects” within nonpersonal service.
STATE OPERATIONS - GENERAL FUND SUMMARY OF NONPERSONAL SERVICE AND MAINTENANCE UNDISTRIBUTED
APPROPRIATIONS AND CHANGES 2011-12 RECOMMENDED
(dollars)
1 2
Total 3
Supplies and Materials Program Amount Change Amount ChangeAdministration 458,000 5,000 91,000 9,000 Emergency Management 2,484,000 (17,000) 137,000 (40,000)Military Readiness 7,697,000 199,000 1,045,000 66,000 Special Service 253,000 (500,000) 66,000 0 Total 10,892,000 (313,000) 1,339,000 35,000
4
Travel 5
Contractual Services Program Amount Change Amount ChangeAdministration 19,000 (9,000) 230,000 (47,000)Emergency Management 101,000 (5,000) 1,802,000 (15,000)Military Readiness 140,000 47,000 6,089,000 50,000 Special Service 12,000 0 101,000 0 Total 272,000 33,000 8,222,000 (12,000)
6
Equipment 7
Maintenance Undistributed Program Amount Change Amount ChangeAdministration 118,000 52,000 0 0 Emergency Management 404,000 3,000 40,000 40,000 Military Readiness 218,000 (169,000) 205,000 205,000 Special Service 74,000 0 0 (500,000) Total 814,000 (114,000) 245,000 (255,000)

USER’S GUIDE
451
1 Each agency has a program structure which is described in its narrative presentation. 2 The Total columns display the sum of the amounts recommended for the “subobjects”
Supplies and Materials, Travel, Contractual Services, Equipment and Maintenance Undistributed and the difference between the appropriations available in the current fiscal year and the amounts recommended for the next fiscal year, with negative amounts displayed in parentheses.
3 The Supplies and Materials columns display the amounts recommended for the
“subobject” Supplies and Materials and the difference between the appropriations available in the current fiscal year and the amounts recommended for the next fiscal year, with negative amounts displayed in parentheses. Supplies and Materials include items such as institutional food, clothing, household supplies and office supplies. The mix of items purchased will, of course, vary widely from agency to agency and program to program.
4 Similar to 3 above, these columns display the recommended and change amounts for
the “subobject” Travel. Travel includes items such as public transportation, meals and lodging, reimbursement for the use of personal cars, and the costs associated with the operation and maintenance of State-owned cars.
5 Similar to 3 above, these columns display the recommended and change amounts for
the “subobject” Contractual Services. Contractual services includes the payment of leases, the rental of data processing and other equipment, and a variety of services provided to the State on an occasional or regular basis by outside vendors. Some examples are printing, accounting, legal, consulting, and medical services.
6 Similar to 3 above, these columns display the recommended and change amounts for
the “subobject” Equipment. Equipment includes items such as vehicles, office machines and furniture, and highway equipment.
7 These columns display the recommended and change amounts for Maintenance
Undistributed. Maintenance Undistributed is not a subobject within Nonpersonal Service. It contains one or more lump sum appropriations for specific purposes or programs; as appropriated, it may not distinguish between major objects or subobjects. Under the State Finance Law, before an agency can use these funds, a segregation (“certificate”) must be issued by the Director of the Budget to specify the amounts available from the lump sum for major objects (Personal Service, Nonpersonal Service) and for various subobjects (e.g., personal service regular, travel, equipment). Copies of the certificate are filed with the Comptroller and the legislative fiscal committees.

USER’S GUIDE
452
G. STATE OPERATIONS - OTHER THAN GENERAL FUND — SUMMARY OF APPROPRIATIONS AND CHANGES — 2011-12 RECOMMENDED This table shows the amounts recommended to support State Operations from funds other than the General Fund. It shows amounts recommended by program for the “major objects” Personal Service and Nonpersonal Service and amounts recommended for Maintenance Undistributed. This table does not show separate amounts for “subobjects” within Personal Service and Nonpersonal Service. For more information about Maintenance Undistributed, see table F note 7 . Other-than-General Fund recommendations include Federal funds; Internal Service funds, such as the Centralized Services Fund through which individual agencies purchase telecommunications and other support services from the Office for Technology; Special Revenue funds, such as the Miscellaneous Special Revenue Fund; Debt Service funds (budgeted centrally, not within agency appropriations, in most cases); Fiduciary funds, such as the Common Retirement Fund; and Enterprise funds.
STATE OPERATIONS - OTHER THAN GENERAL FUND SUMMARY OF APPROPRIATIONS AND CHANGES
2011-12 RECOMMENDED (dollars)
1 2
Total 3
Personal Service Program Amount Change Amount ChangeDisaster Assistance 4,861,000 18,000 2,650,000 (13,000)Emergency Management 7,975,000 5,009,000 1,416,000 0 Military Readiness 40,605,000 (5,000) 12,459,000 (31,000)Special Service 8,865,000 0 681,000 (3,000) Total 62,306,000 5,022,000 17,206,000 (47,000)
3
Nonpersonal Service 3
Maintenance Undistributed Program Amount Change Amount ChangeDisaster Assistance 2,211,000 31,000 0 0 Emergency Management 6,559,000 5,009,000 0 0 Military Readiness 28,146,000 26,000 0 0 Special Service 7,746,000 (435,000) 438,000 438,000 Total 44,662,000 4,631,000 438,000 438,000
1 Each agency has a program structure which is described in its narrative presentation. 2 The Total columns display the sum of the amounts recommended for Personal
Service, Nonpersonal Service and Maintenance Undistributed and the difference between the appropriations available in the current fiscal year and the amounts recommended for the next fiscal year, with negative amounts displayed in parentheses.
3 The Personal Service, Nonpersonal Service, and Maintenance Undistributed columns
display the amounts recommended for each item within a program and the difference between the appropriations available in the current fiscal year and the amounts recommended for the next fiscal year, with negative amounts displayed in parentheses.

USER’S GUIDE
453
The next two tables apply to the Aid to Localities category. Each agency which has appropriations in this category will have these two tables in its presentation. H. AID TO LOCALITIES — ALL FUNDS FINANCIAL REQUIREMENTS BY FUND TYPE — APPROPRIATIONS This table shows the distribution of all appropriations for this agency within the Aid to Localities category by fund type and shows a year-to-year comparison of the amounts available in the current year with those recommended for the next fiscal year. See the next table for a distribution by program.
AID TO LOCALITIES ALL FUNDS FINANCIAL REQUIREMENTS BY FUND TYPE
APPROPRIATIONS (dollars)
1 Fund Type
2 Available
2010-11
3 Recommended
2011-12 4
ChangeGeneral Fund 90,013,150 0 (90,013,150) Special Revenue Funds - Federal 5 311,411,000 8,000,000 (303,411,000) Special Revenue Funds - Other 1,650,000 1,650,000 0 Total 403,074,150 9,650,000 (393,424,150) Adjustments: 6 Prior Year Deficiency
Military and Naval Affairs, Division of General Fund 85,000,000 Special Revenue Funds - Federal 255,000,000
Appropriated 2010-11 743,074,150 1 The State Finance Law defines and mandates the use of seven fund types. Of these,
the fund types typically found in the Aid to Localities category are General, Special Revenue, Enterprise, Internal Service, and Fiduciary.
2 This column displays the appropriations available for the current fiscal year. 3 This column displays the appropriations recommended for the next fiscal year. 4 This column displays the difference between the appropriations available in the
current fiscal year and the amounts recommended for the next fiscal year, with negative amounts displayed in parentheses.
5 Because of the difference between the State’s fiscal year (April 1 through March 31)
and the Federal fiscal year (October 1 through September 30), appropriations of most Federal grants generally include spending from portions of two Federal fiscal years. The amounts discussed throughout the Executive Budget represent the totals of spending from different grants that are expected to occur during the State fiscal year.
6 Adjustments in the amounts available for the current year may occur for a number of
reasons. For more information, please refer to table C note 6 .

USER’S GUIDE
454
I. AID TO LOCALITIES — ALL FUNDS FINANCIAL REQUIREMENTS BY PROGRAM — APPROPRIATIONS This table shows the amounts available for Aid to Localities for the current fiscal year and those that have been recommended for the next fiscal year by program and, within each program, by fund type.
AID TO LOCALITIES ALL FUNDS FINANCIAL REQUIREMENTS BY PROGRAM
APPROPRIATIONS (dollars)
1 Program
2 Available
2010-11
3 Recommended
2011-12 4
ChangeDisaster Assistance
General Fund 90,000,000 0 (90,000,000) Special Revenue Funds - Federal 300,000,000 0 (300,000,000)
Emergency Management Special Revenue Funds - Federal 11,411,000 8,000,000 (3,411,000) Special Revenue Funds - Other 1,650,000 1,650,000 0
Community Projects General Fund 13,150 0 (13,150)
Total 403,074,150 9,650,000 (393,424,150)
1 Each agency has a program structure which is described in its narrative presentation.
Each of the agency’s activities falls within a program and each program may have appropriations from one or more fund types.
2 This column displays the appropriations available for the current fiscal year. 3 This column displays the appropriations recommended for the next fiscal year. 4 This column displays the difference between the appropriations available in the
current fiscal year and the amounts recommended for the next fiscal year, with negative amounts displayed in parentheses.
The next table applies to the Capital Projects category. Each agency which has appropriations in this category will have this table in its presentation.
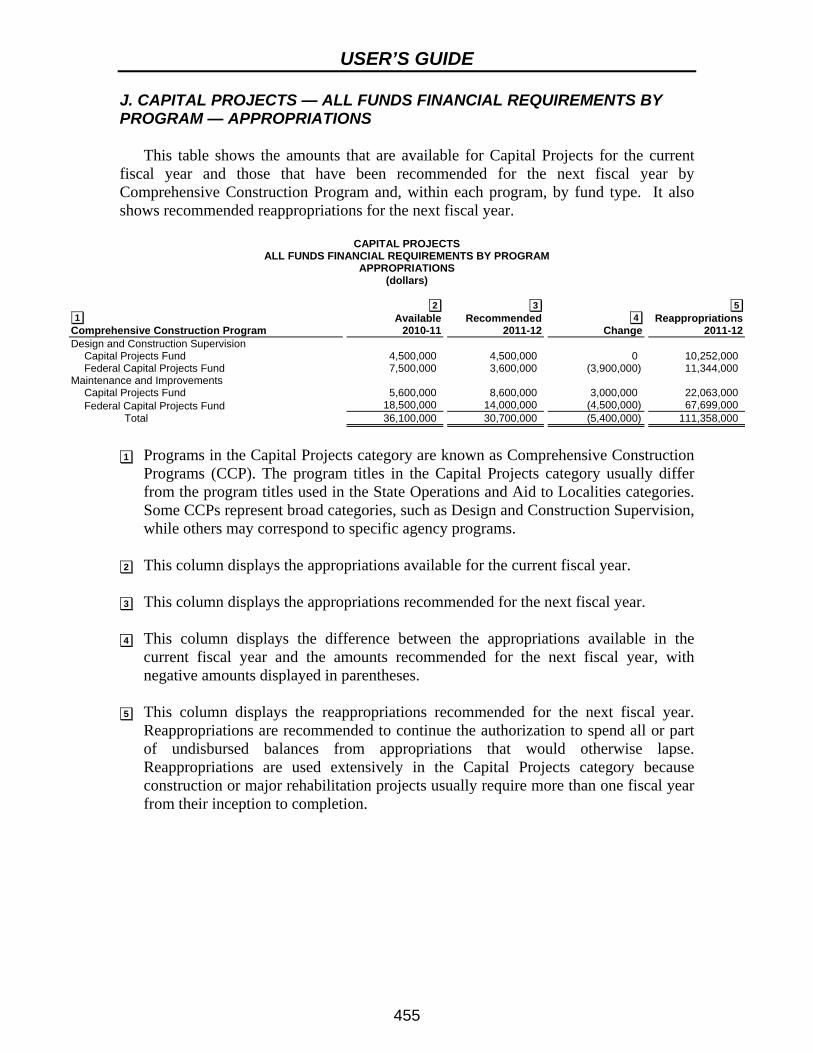
USER’S GUIDE
455
J. CAPITAL PROJECTS — ALL FUNDS FINANCIAL REQUIREMENTS BY PROGRAM — APPROPRIATIONS This table shows the amounts that are available for Capital Projects for the current fiscal year and those that have been recommended for the next fiscal year by Comprehensive Construction Program and, within each program, by fund type. It also shows recommended reappropriations for the next fiscal year.
CAPITAL PROJECTS ALL FUNDS FINANCIAL REQUIREMENTS BY PROGRAM
APPROPRIATIONS (dollars)
1 Comprehensive Construction Program
2 Available
2010-11
3 Recommended
2011-12 4
Change
5 Reappropriations
2011-12Design and Construction Supervision
Capital Projects Fund 4,500,000 4,500,000 0 10,252,000 Federal Capital Projects Fund 7,500,000 3,600,000 (3,900,000) 11,344,000
Maintenance and Improvements Capital Projects Fund 5,600,000 8,600,000 3,000,000 22,063,000 Federal Capital Projects Fund 18,500,000 14,000,000 (4,500,000) 67,699,000
Total 36,100,000 30,700,000 (5,400,000) 111,358,000
1 Programs in the Capital Projects category are known as Comprehensive Construction
Programs (CCP). The program titles in the Capital Projects category usually differ from the program titles used in the State Operations and Aid to Localities categories. Some CCPs represent broad categories, such as Design and Construction Supervision, while others may correspond to specific agency programs.
2 This column displays the appropriations available for the current fiscal year. 3 This column displays the appropriations recommended for the next fiscal year. 4 This column displays the difference between the appropriations available in the
current fiscal year and the amounts recommended for the next fiscal year, with negative amounts displayed in parentheses.
5 This column displays the reappropriations recommended for the next fiscal year.
Reappropriations are recommended to continue the authorization to spend all or part of undisbursed balances from appropriations that would otherwise lapse. Reappropriations are used extensively in the Capital Projects category because construction or major rehabilitation projects usually require more than one fiscal year from their inception to completion.

USER’S GUIDE
456
FINANCIAL TERMINOLOGY This section provides a comprehensive overview of financial terms used throughout the Executive Budget and in other financial and budgetary documents. Many of the terms are generic; others reflect definitions set forth in New York State law, regulations issued by State financial control agencies, or historical usage in State government. The terms have been grouped under the following major headings:
1. Budgets 2. Financial Plan 3. Fund Structure 4. Appropriations and Expenditures 5. Budget Execution and Control 6. Generally Accepted Accounting Principles (GAAP) 7. Accountability, Audit and Internal Controls 8. Debt and Capital Financing 9. Other Miscellaneous Terms
BUDGETS Executive Budget refers to the structure and process of the constitutional system of budgeting in New York State which vests in the Governor primary authority and responsibility for budget formulation, presentation, and execution. More specifically, it refers to the Governor’s constitutionally mandated annual submission to the Legislature containing his plan of recommended appropriations (see page 461), cash disbursements, and expenditures necessary to carry out programs, along with estimates of cash receipts and revenues expected to be available to support these expenditures and disbursements for the forthcoming fiscal year (see page 457 for the definition of fiscal year). The State Constitution requires explicit recommendations for making changes to the current revenue structure and legislation to implement such recommendations (see Financial Plan on page 457). Pursuant to the Constitution, the Governor’s Executive Budget must incorporate the appropriations requests of the Judiciary and the Legislature as they are received from these bodies, although they are not part of the Executive branch of State government. While the Governor may not alter their requests, the Governor may comment on them and recommend changes. The Constitution requires submission of the budget on or before the third Tuesday after the first Monday in January, except in years following gubernatorial elections when it must be submitted by February 1. Amendments to the Budget: The State Constitution permits the Governor to amend or supplement the Executive Budget within 30 calendar days (reduced to 21 days under the recent budget reform agreement) after its submission or, with the consent of the Legislature, at any time before the close of the legislative session. Such revisions, additions, or deletions conveyed to the heads of the fiscal committees in a memorandum reflect necessary corrections or responses to new situations or conditions arising after the preparation of the Executive Budget. Legislative action on the Executive Budget: The Legislature and its fiscal committees – Senate Finance and Assembly Ways and Means – analyze the budget, holding public hearings on major programs and seeking further information from the

USER’S GUIDE
457
staffs of the Division of the Budget and other State agencies. Except for the budgets of the Legislature and the Judiciary, the Legislature may not alter an appropriation bill except to eliminate or reduce the amount of an item recommended therein. It may, however, add items separate and distinct from those included in the original bill submitted by the Governor. The appropriations passed by the Legislature, except for those which added items or provided funds for the Legislature and Judiciary, become law without further action by the Governor. The Governor must approve or disapprove all or parts of the appropriation bills covering the Legislature and Judiciary and may disapprove, by line item veto, items added to his original bills. As provided in the Constitution, the Legislature may override the Governor’s veto by a vote of two-thirds of those elected to each house. Other Appropriation Measures: An appropriation bill may also be submitted through the regular legislative process (i.e., it may be introduced by one or more legislators or by a legislative committee). However, the Legislature must act upon the Governor’s constitutionally mandated appropriation bills before it acts on any other appropriation bills (unless the Governor certifies the need for immediate passage of another appropriation bill, pursuant to the Governor’s constitutional authority to issue a “Message of Necessity”). Appropriation measures initiated by the Legislature are subject to veto in whole or in part by the Governor. Fiscal Years: A fiscal year is the accounting period on which a budget is based. The State fiscal year runs from April 1 through March 31. The Federal fiscal year runs from October 1 through September 30. The fiscal year for all New York counties and towns and for most cities is the calendar year. New York City, the State University of New York, the City University of New York, and independent school districts in the State operate on July 1 through June 30 fiscal years. For most villages, the fiscal year runs from June 1 through May 31. Other cities and villages in New York State have varying fiscal years. FINANCIAL PLAN The State’s Financial Plan is a comprehensive estimate of the government’s projected financial resources and spending requirements for the budget year and three subsequent fiscal years. State laws and appropriation bills together authorize the State to collect money and use it to pay for the operations of State agencies, aid to local governments and school districts, and for capital projects and debt service. The Budget Director is designated by law to act on specific matters on behalf of the Governor in exercising the Governor’s constitutionally prescribed responsibilities. The Division of the Budget, headed by the Budget Director, prepares a Financial Plan for each fiscal year. The Financial Plan presented with the Executive Budget reflects the receipts and disbursements that would result from legislative adoption of the Executive Budget recommendations. The Division prepares a revised Financial Plan shortly after the Legislature has acted on the Executive Budget. This plan becomes the basis for administration of the State’s finances and must be updated quarterly. The Financial Plan includes results for one or more funds that are managed by the State, displayed on a cash or GAAP basis, and projects closing balances at the completion of a fiscal period (e.g., a fiscal year). See Generally Accepted Accounting Principles (GAAP) on page 464 for a discussion of GAAP and cash-based accounting.
USER’S GUIDE
458
FUND STRUCTURE State Operating Funds In its Financial Plan updates for 2007-08, the Division of the Budget introduced a revised reporting format which provided a new “operating budget” (spending for current operations) and “capital budget” (long-term capital investment) presentation. The State Funds operating budget comprises the General Fund and other State supported activities financed by dedicated revenues in State Special Revenue funds, as well as Debt Service funds accounting for the payment of debt service on all State long-term debt. All capital spending, regardless of financing source, is included in the Capital budget. By distinguishing between the two types of spending and capturing all State funds in the operating category, this approach provides a more up-to-date view of the budget than the traditional, more simplistic focus on General Fund/All Funds spending. Governmental Funds
1. General Fund: This is the major operating fund of the State. It receives all State income not earmarked for a particular program or activity and not specified by law to be deposited in another fund. State income for Financial Plan purposes consists of moneys deposited to the credit of the General Fund during the fiscal year from current revenues (taxes, fees, and miscellaneous receipts including certain repayments of State advances) and transfers. General Fund income finances disbursements from its two operating accounts – the Local Assistance Account and the State Purposes Account – and transfers to other funds.
The Local Assistance Account finances: State grants to, or State expenditures on behalf of, counties, cities, towns,
villages, school districts and other local entities; Certain contractual payments to localities; Certain advances for reimbursable costs (see advances on page 469); and Certain financial assistance to, or on behalf of, individuals and not-for-profit
organizations. The State Purposes Account finances:
Salaries and non-wage compensation for most State employees; Other operating costs of State departments and agencies, the Legislature, and
the Judiciary; General state charges which are costs mandated by statute or court decree or
by agreements negotiated with employee unions for which the State is liable, including: pensions; health, dental and optical benefits; Social Security payments on behalf of State employees; unemployment insurance benefits; employee benefit programs; court judgments and settlements; assessments for local improvements; and taxes on public lands;
Certain contractual payments, including some contractual payments to localities;
Certain financial assistance to individuals and not-for-profit organizations; Certain advances for reimbursable costs; and

USER’S GUIDE
459
Interest payments on tax and revenue anticipation notes (TRANs) (see page 469), bond anticipation notes (BANs) (see page 468), and BANs issued in the form of commercial paper if such short-term debt instruments are used by the State.
In addition to the above accounts, the General Fund includes the following funds: Tax Stabilization Reserve Fund (TSRF): This fund receives any General
Fund cash surpluses existing at year-end up to a maximum contribution of two-tenths of one percent of total General Fund disbursements. The reserve fund is capped at 2 percent of General Fund disbursements for the fiscal year. Any General Fund surplus after the reserve contribution may be used to reduce taxes or may be carried over into the succeeding fiscal year. At the close of the fiscal year money may be loaned from the TSRF to avoid a deficit. Such loans must be repaid in three equal annual installments within a period of six years from the date of the loan. Cash assets of the TSRF are routinely loaned to the Local Assistance Account or the State Purposes Account during the fiscal year, but repaid in cash by March 31 of any fiscal year.
Rainy Day Reserve: Created by the 2007 budget reform legislation, this fund may be used to respond to an economic downturn or catastrophic event, as defined in the law. The reserve may have a maximum balance equal to 3 percent of spending.
Contingency Reserve Fund: Created by legislation accompanying the 1993-94 budget, this fund provides a reserve to fund extraordinary needs arising from litigation against the State. Its use is generally restricted to litigation cases of $25 million or more and requires an appropriation to authorize spending.
Community Projects Fund: This fund was created by legislation accompanying the 1996-97 Budget to finance discretionary, usually local projects (“member items”) sponsored by individual legislators and the Governor.
Fringe Benefit Escrow Fund: This fund contains payments by State agencies of certain fringe benefit costs chargeable to other entities. It was reclassified by the State Comptroller in April 2001 from the Agency Fund group to the General Fund.
The General Fund, as reported by the State Comptroller in his annual GAAP financial statements, also includes the revenues and expenditures of funds budgeted as Internal Service Funds and Enterprise Funds and of certain Special Revenue Funds (see below).
2. Special Revenue Funds: These funds are collectively the largest group of funds within the State in both size and number. They account for State receipts from specific revenue sources and are legally restricted to disbursement for specified purposes. This governmental fund type is divided into two classifications in New York State – Special Revenue Funds-Other and Special Revenue Funds-Federal. An example of a Special Revenue Fund-Other is the Conservation Fund which finances a number of State environmental programs. An example of a Special Revenue Fund-Federal is the Health and Human Services Fund where, for

USER’S GUIDE
460
instance, Federal Medicaid reimbursements are received and disbursed. Although any earmarked revenue fund is treated as a Special Revenue Fund-Other for cash-basis budgeting and reporting purposes, some are combined with the General Fund for purposes of reporting on the basis of GAAP.
3. Capital Projects Funds: These funds finance such capital construction costs as: Planning, land acquisition, design, construction, construction management and
supervision, and equipment costs attributable to: highway, parkway and rail preservation projects; outdoor recreation and environmental conservation projects; and buildings and other capital facilities required by various State departments and agencies;
Aid payments to local governmental units and public authorities to help finance the following types of capital programs: highway, parkway, bridge, mass transportation, aviation, economic development, port development, community college, community and State mental health, outdoor recreation, State-assisted housing, and environmental quality; and
Advances for capital construction costs reimbursable by public authorities, instrumentalities of the State, the Federal government or local governments.
Sources of revenue for this fund type include transfers from other State funds including the General Fund, dedicated taxes and other revenues, reimbursement of advances, bond proceeds, and Federal capital grants.
4. Debt Service Funds: All State debt service on long-term debt and payments on certain lease-purchase or other contractual obligations are paid from Debt Service funds. These account for the accumulation of money for, and the payment of principal and interest on, general long-term. Lease-purchase payments for State University, Health and Mental Hygiene facilities under contractual agreements with public authorities are also paid from funds classified as debt service funds. Debt service on highway bonds supported by dedicated highway revenues is also reflected in this fund type. Sources of revenue for this fund type include transfers from the General Fund, dedicated taxes and other revenues such as personal income taxes dedicated to the PIT Revenue Bond Tax Fund.
Proprietary Funds
1. Internal Service Funds: These funds are used to account for the financing of goods or services supplied by one State agency to other State agencies or governmental units on a cost reimbursement basis.
2. Enterprise Funds: These funds are used to account for operations that operate similarly to private business enterprises.
The Internal Service funds and Enterprise funds are treated as Proprietary funds for cash-basis budgeting and reporting purposes and are combined with the General Fund for purposes of reporting on a GAAP basis. Fiduciary Funds
1. Private-Purpose Trust Funds: These funds are used to report all other trust arrangements under which principal and income benefit individuals, private organizations, or other governments.
2. Pension Trust Fund: This fund is used to account for the cash basis results of operations for the administration portion of the State’s Common Retirement Fund.

USER’S GUIDE
461
It does not reflect investment activity, balances, or other assets available to this fund. In addition, pension contributions and payments to retirees are excluded since these payments are not required to be appropriated.
3. Agency Funds: These funds are used to account for funds held by the State in a purely custodial capacity. Cash is held temporarily until disbursements are made to individuals, private organizations, or other governments.
APPROPRIATIONS AND EXPENDITURES An appropriation is a statutory authorization to make expenditures during a specific State fiscal year and to make disbursements for the purposes designated up to the stated amount of the appropriation. Under the Constitution, an appropriation may be made for no longer than a two-year period (also see reappropriation on page 462). Appropriations are authorizations, rather than mandates, to spend. Expenditures and disbursements need not, and generally do not, equal the amount of the appropriation from which they were made since less than the full amount of the appropriation is usually spent within the fiscal year to which it pertains (see carryover on page 462). An appropriation thus represents maximum spending authority unless a lower maximum has been set by a disbursement ceiling. When authorized by statute, an appropriation may be suballocated (that is moved) from one agency to another agency for the purpose of incurring obligations and making disbursements in the agency which receives the suballocation. (The term suballocation should not be confused with allocation which is defined under Budget Execution and Control on page 463). In New York, all appropriations are classified in one of the following four categories:
State Operations: This category relates to appropriations for the operation of State agencies, regardless of fund source. For example, an agency may have appropriations in several different funds (or accounts within funds) and all of these appropriations would be categorized as “State Operations.” Also included in this category, although authorized by appropriation bills separate and distinct from those for the Executive branch, are the appropriations for the operation of the Legislature and the Judiciary. (See also personal service and nonpersonal service defined below.)
Aid to Localities: This category includes all appropriations for aid to localities, regardless of fund source.
Capital Projects: When used as a category of appropriation, “Capital Projects” includes all appropriations for capital construction projects, regardless of fund source.
Debt Service: This category includes all appropriations for State debt service on long-term debt; contractual-obligation and lease-purchase arrangements with several public authorities and municipalities. This also includes appropriations for interest rate exchange and similar agreements.
A deficiency appropriation is used to meet actual or anticipated obligations not foreseen when the annual budget and any supplemental budgets were enacted and for which the costs would exceed available spending authorizations. It might add to a previously authorized appropriation anticipated to be inadequate or provide a new appropriation to finance an existing or anticipated liability for which no appropriation exists. A deficiency appropriation usually applies to the fiscal year during which it is made.

USER’S GUIDE
462
Section 53 of the State Finance Law authorizes the enactment of a special emergency appropriation which may be allocated by the Governor to various funds. As set forth in the statute, allocations to the General Fund, Capital Projects funds and funds receiving Federal moneys are subject to the prior approval of the chairpersons of the Senate Finance and Assembly Ways and Means committees. Personal service represents an appropriation for salaries and non-wage compensation for State employees and certain payments to non-State employees. Nonpersonal service represents an appropriation for such items as contractual services, equipment and supplies. Maintenance undistributed is an appropriation which does not define the amounts to be available for personal and nonpersonal service. Such an appropriation allows flexibility in the management of a program. The terms lump sum and maintenance undistributed are often used synonymously, although they are not equivalent. A lump-sum appropriation is one made for personal service, nonpersonal service or maintenance undistributed or for local assistance or capital projects for all State agencies, or to an agency alone or on behalf of itself and one or more other agencies. A lump sum is appropriated for a stated purpose without specifying maximum amounts that may be spent for specific activities or individual objects of expenditure. Such an appropriation cannot be obligated and expended without an allocation (see below under Budget Execution and Control). Under the 2007 budget reform legislation, the Legislature is prohibited from adding lump sum appropriations. A reappropriation is a legislative enactment that continues the undisbursed balance of an appropriation that would otherwise lapse (see lapsed appropriation below). Reappropriations are commonly used in the case of federally funded programs and capital projects where the funding amount is intended to support activities that may span several fiscal years. For example, funds for capital projects are customarily recommended and appropriated in amounts sufficient to cover the total estimated cost of all phases of a specific project (such as land acquisition, design, and construction). As contracts within each phase are established, portions of the capital construction appropriation are allocated and disbursements are made to meet the actual costs incurred as each phase of the project progresses. In ensuing years, the balances not disbursed are reappropriated to cover the costs of subsequent construction phases in the project. An obligation is a commitment (such as a contract or purchase order) to spend against a given appropriation. An encumbrance provides a mechanism for reserving all or a portion of an appropriation for future expenditure. Entering into a contract usually requires an encumbrance, although the funds will be expended or disbursed over a period of several months. Encumbrance accounting enables management to avoid spending in excess of authorized appropriations. A carryover is the balance of an appropriation that remains at the end of the fiscal year for which it was appropriated, against which liabilities were incurred but for which cash payments were not disbursed before the end of the fiscal year. Disbursements may be made against a carryover balance through June 30 of the following fiscal year to liquidate any such liabilities for State Operations, or through September 15 for Aid to Localities, Capital Projects, and Debt Service. A lapsed appropriation is an appropriation which has expired and against which obligations can no longer be incurred, nor payment made. An appropriation lapses, and is no longer available to authorize any encumbrances or cash payments, on June 30 for State Operations and on September 15 for Aid to Localities, Capital Projects, and Debt Service.
USER’S GUIDE
463
BUDGET EXECUTION AND CONTROL Certificates of several types are issued by the Budget Director to authorize various fiscal actions. Copies of all certificates must be sent to the State Comptroller and to the chairpersons of the two legislative fiscal committees. For State Operations, and in some cases Aid to Localities, a certificate of approval issued by the Budget Director formally authorizes certain financial transactions. These transactions include allocations or segregations, apportionments and interchanges:
An allocation or a segregation authorizes expenditures from appropriated funds for specified purposes, activities, or objects. It is used as a control device for appropriated funds (e.g., quarterly allocations) and to distribute lump-sum appropriations within State agencies.
An interchange is the movement of appropriation authority by certificate to increase or decrease the funds for any items within the same fund and program. In accordance with the State Finance Law, the amounts appropriated to a department or agency from a given fund may also be interchanged among appropriations in different programs, subject to the following formula (with the exclusion of the State University of New York, the City University of New York, and other specific appropriations as may be noted in the various appropriation bills): the total amount appropriated for any given program or purpose may not, in aggregate, be increased or decreased via interchanges by more than the total of 5 percent of the first $5 million, 4 percent of the second $5 million and 3 percent of amounts in excess of $10 million.
A certificate of transfer authorizes the transfer of appropriation authority and/or positions between agencies and/or funds. All such transfers must be specifically authorized in statute. Transfers of appropriation authority must be distinguished from operating transfers which move moneys (cash) between funds or accounts. For Capital Projects, the appropriation format differs somewhat from the program structure found in State Operations and Aid to Localities. Capital Projects appropriations are structured as follows:
One or more comprehensive construction programs (CCPs), which may or may not relate to agency operating or local aid programs or other organizational arrangements;
A grouping of appropriations into one or more purposes within CCPs, which purposes may or may not relate to other agency organizational structures; and
One or more appropriations or projects in each purpose. Some appropriations have “project schedules” that list institutions or projects for which construction work will be done.
For Capital Projects, a certificate of approval of availability issued by the Budget Director in accordance with an appropriation authorizes the State Comptroller to encumber, expend, and disburse funds to the extent required for specific projects or phases of projects. Capital Projects Funds interchanges or transfers must be accompanied by a certification of need and availability of funds and may be made as follows: In the case of interchanges, which are movements of funds by certificate between items within an appropriation “project schedule,” no certification is required when the appropriation states that schedule amounts are estimates and are interchangeable among the various projects; all other interchanges require the certification of need and availability.

USER’S GUIDE
464
In the case of transfers, a certificate of transfer authorizes the transfer of a specified amount, within available limits, from an appropriation for a given capital project to an appropriation for another capital project within the same CCP and agency. However, the Budget Director cannot authorize any Capital Projects Fund transfer which would increase or decrease the total of appropriations (including reappropriations) for projects sharing the same purpose by an amount exceeding the total of the following percentages of the total amount of the original appropriation for the project: 25 percent of the first $5 million, 20 percent of the second $5 million, 15 percent of the third $5 million, and 10 percent of any amount in excess of $15 million. GENERALLY ACCEPTED ACCOUNTING PRINCIPLES (GAAP) Generally Accepted Accounting Principles (GAAP) for governments are uniform minimum standards and guidelines for financial accounting and reporting as promulgated by authoritative national standard-setting bodies, primarily the National Council on Governmental Accounting (NCGA); its successor, the Governmental Accounting Standards Board (GASB); and the American Institute of Certified Public Accountants (AICPA). NCGA’s Statement One – Governmental Accounting and Financial Reporting Principles, published in 1979, succeeding statements by NCGA (reaffirmed by GASB), and statements promulgated by GASB are the most widely recognized sources for authoritative guidance. New York presents its State Financial Plan and Executive Budget on both a cash basis and in accordance with GAAP. The GASB issued Statement 34 entitled Basic Financial Statements—and Management’s Discussion and Analysis—for State and Local Governments. This statement establishes new financial statement reporting requirements for State and local governments. New York State implemented GASB 34 when reporting its GAAP financial results for the 2002-03 fiscal year in July 2003. The Division of the Budget has modified its GAAP-basis projections to conform with GASB 34. These changes include new statements that reflect the State’s net overall financial condition, including activities that affect State assets and liabilities during the fiscal year. Projected operating results in the General Fund as measured on the cash basis of accounting may sometimes differ from projections measured in accordance with GAAP. Generally, these differences are caused by the inclusion of certain funds in the GAAP General Fund which are outside the cash basis General Fund, plus the recognition of differences between cash and GAAP. The conversion tables in the Financial Plan volume show these differences classified into the following major categories:
“Perspective Differences” represent the projected cash basis operating results of the Miscellaneous State Special Revenue Fund which is treated as part of the General Fund in the GAAP basis financial plan, but as part of the Special Revenue funds in the cash basis financial plan. The Miscellaneous State Special Revenue Fund includes dozens of individual accounts which finance the operation of agencies and programs from sources other than General Fund tax dollars.
“Entity Differences” represent the projected cash basis operating results of the proprietary funds (Internal Service funds and Enterprise funds) which are treated as part of the General Fund in the GAAP basis financial plan. On a cash basis, the proprietary funds are reported separately and are not part of the all governmental funds financial plan.

USER’S GUIDE
465
“Changes in Accruals” result from timing differences between the recognition of individual accounting transactions on a cash basis and under GAAP. On a cash basis, receipts are recorded when moneys are deposited in the State Treasury and disbursements are recorded when a check is drawn from the Treasury. Under GAAP, revenues are recorded when they are measurable and available and expenditures are recorded when the State incurs an obligation to pay. It is in this column that revenues and expenditures are attributed to the appropriate fiscal year. For example, positive numbers in this column reflect the accrual of revenues which are owed to the State but not yet received and obligations of the State for which payment has not yet been made. Negative entries generally reflect the reduction of receipts or disbursements which are attributed under GAAP to a different fiscal period.
“Eliminations” exclude activity related to State advances and the repayment of such advances, which are treated as receipts and disbursements in the cash basis financial plan. On a GAAP basis, the repayment is not a revenue and the advance is not an expenditure unless it is determined to be uncollectible. This category also includes transactions related to the elimination of SUNY/CUNY Senior College operations, which are not part of the governmental fund structure on a GAAP basis.
“Intra-fund Eliminations” remove any transactions which occur between two funds in the same fund type, in order to avoid counting such transactions twice.
“Reclassifications” show the movement of transactions from one category of the financial plan to another and do not impact the operating results of a given fund.
GAAP Basis Reporting Differences In general, the General Fund revenue and expenditure projections contained in the Budget reflect the application of GAAP as applied by the State Comptroller in his audited financial statements. There is one exception to this policy. Activity related to public authorities has not been reclassified as operating transfers. These reclassifications do not affect operating results and only further complicate the differences between cash basis financial plans and GAAP basis financial plans. Accordingly, these reclassifications have not been included. GAAP Revenues The Economic and Revenue Outlook volume provides tax-by-tax descriptions of the cash-based estimates of tax receipts underlying the cash-based financial plans. This section deals with estimates of GAAP revenues that are included in the GAAP financial plan. The following is a brief description of how such estimates are generated, what factors are considered in their preparation, and how such estimates differ from those prepared on the cash basis. In general, cash-based estimates are forecasts of the deposits of cash (net of refund payments) that will occur during the fiscal year. Estimates of GAAP revenue attempt to more closely measure what the State actually “earned” during the period, regardless of when the cash transactions that represent those earnings occur. The State, of course, “earns” money when taxpayers incur liability for taxes, for example, by receiving money subject to income taxes or purchasing goods or services subject to the sales or excise levies, or by wagering on horse races in betting pools subject to the pari-mutuel tax.

USER’S GUIDE
466
Taxpayers may discharge that liability in a variety of ways. For example, in the case of the sales tax, they often pay the money directly to an authorized agent of the State who must then transmit it to the State, sometimes in a period different from that in which the actual liability was incurred and discharged by the taxpayer. In the case of the personal income tax, they may be subject to withholding by their employer (another agent of the State) or make estimated and final tax payments directly to the State. Some taxpayers overpay their liability and are due refunds for a given liability period. Such refunds or final payments are usually paid in years (or accounting periods) different from those to which the transaction relates. In theory, GAAP revenue estimates attempt to gather all the (actual or estimated) transactions that apply to tax liabilities earned in a given State fiscal year, regardless of the year in which the related cash transaction occurs, to appropriately “measure” what the State has earned. In practice, given the limits of both information systems and time, some accommodations are made in the development of these “earnings” estimates. During any one fiscal year, the State will receive money earned in the current year and in any of several prior years (and sometimes money not yet earned). Estimates of those prior-year earnings are not changed each time a new transaction is disclosed and so GAAP revenue estimates are not “pure.” However, for any given tax, GAAP revenue estimates should attempt to measure (as an increase in revenue, or a receivable) how much the State is owed, but has not yet received, from taxpayers for the activity during a State fiscal year. Similarly, they must reflect (as a reduction in revenue, or a payable) any amounts that the State has received but must refund (in some future period) as a result of overpayments of liability by taxpayers. In some sources, the receivable and payable amounts are relatively trivial and do not change materially from year to year. In others, the accruals are large and variable. GAAP revenue estimates differ from cash receipt estimates by how much the receivable and payable balances change from year to year. If receivables are growing relative to payables in a particular source (i.e., if the net amount owed to the State is larger at the end of the year than at the beginning of the year), estimated GAAP revenues will exceed forecasted cash receipts. Should payables rise faster than receivables, the opposite relationship will exist. GAAP Expenditures As previously mentioned, GAAP measures expenditures when the State incurs a liability to pay, rather than when a check is written against the Treasury. The Comptroller generally applies a 12-month recognition rule – if the liability is determined to exist and will be disbursed in the 12 months following the close of the fiscal year, the expenditure will be recorded in that fiscal year. Thus, the GAAP basis financial plan includes liabilities projected to be incurred during a given fiscal year for which actual payments will not be made for up to 12 months following the close of such fiscal year. The most significant of these liabilities occur in the categories of local assistance and State operations. The GAAP basis financial plan reflects:
Amounts owed to local governments for Medicaid, public health, criminal justice and court-ordered handicapped programs which are all reimbursed on a lag basis.
Employee salaries remaining unpaid at the close of each fiscal year, and the related fringe benefits.

USER’S GUIDE
467
ACCOUNTABILITY, AUDIT AND INTERNAL CONTROL Internal controls are the measures an organization adopts to encourage adherence to agency policies and procedures, promote operational efficiency and effectiveness, safeguard assets, and ensure the reliability of data. Internal controls encompass both internal administrative controls and internal accounting controls. Internal audit is an independent appraisal of operations, conducted under the direction of agency management, to assess the effectiveness of internal controls. Internal Control Review (ICR) is a detailed evaluation of the degree to which the organization has designed, established, documented, and followed the policies and procedures necessary to achieve specific functional goals and objectives and avoid unwanted outcomes. The ICR focuses upon how well procedures operate for a given function. Vulnerability Assessment (VA) is an assessment by an agency of its susceptibility to operational breakdowns which could lead to inadequate or inappropriate program outcomes, including waste of resources. The VA analyzes the overall organizational and administrative environment, the potential for failures, and related impact. VAs help the agency schedule the timing and frequency of ICRs or identify weaknesses which can be immediately corrected. Testing is that part of an internal control review which assesses whether actual practice follows, or complies with, prescribed policies and procedures. The assessment is made by interviewing or observing staff, following a transaction through the process, or sampling documentation of transactions to determine if required steps are executed. Corrective Action Plan is a step-by-step plan of action and schedule for resolving the internal control weaknesses identified by a vulnerability assessment or internal control review. Certification is the annual affirmation by each agency that it is in conformance with the Internal Control Act which requires the establishment and maintenance of a system of internal controls and a program of internal control review by State agencies and covered public authorities. Agencies may submit a plan to achieve compliance with the Act in lieu of a certification. In addition to the certification, each agency submits an Annual Internal Control Summary which describes certain aspects of its internal control system for the preceding year. DEBT AND CAPITAL FINANCING The Annual Information Statement (AIS) is the State’s principal means for disclosing financial information that is required to meet its legal obligations under Federal securities law and constitutes the official form of such financial disclosure information. The State publishes the AIS annually, generally within 30 days of the adoption of a budget by the State Legislature. The AIS is updated on a quarterly basis (the “Quarterly Updates”) and may be supplemented (“Supplements”) for significant events or developments that occur between updates. The AIS, updates, and supplements are available online at http://www.budget.state.ny.us. Appropriation-backed bonds refer to long-term obligations sold by the State’s public authorities under a variety of financial arrangements – primarily lease-purchase and contractual service agreements. Debt service on such obligations is appropriated annually by the State, although the State has no legal obligation to continue to make such

USER’S GUIDE
468
appropriations. This form of debt represents an important source of financing for capital projects in the State’s transportation, criminal justice, mental hygiene, education, health, and housing programs. Bond anticipation notes (BANs) are short-term notes to finance capital expenditures until long-term bonds are sold. Since these obligations are outstanding for no more than two years (with certain exceptions), the interest rates paid on such obligations are typically lower than that for long-term bonds. Bondable capital spending refers to disbursements for capital purposes which, by statute, may be financed by the proceeds of bonds or other debt obligations. A credit rating is assigned by a non-governmental agency serving the financial market (such as Standard & Poor’s) and represents that agency’s opinion concerning the likelihood that the principal and interest on State debt will be paid on time. The State’s current general obligation and personal income tax revenue bonds are assigned a rating of AA by Standard & Poor’s, AA by Fitch, and Aa2 by Moody’s Investors Service. The Debt Reform Act of 2000, which applies to all new State-supported debt issued after March 31, 2000, imposes phased-in caps that limit new debt outstanding to 4 percent of personal income and new debt service costs to 5 percent of total governmental receipts. Pursuant to section 23 of the State Finance Law, the State is required to calculate compliance with the caps annually and report the findings in the Financial Plan update most proximate to October 31. General obligation bonds refer to long-term obligations of the State, used to finance capital projects. These obligations must be authorized by the voters in a general election, are issued by the Comptroller, and are backed by the full faith and credit of the State. Under current provisions of the Constitution, only one bond act proposal may be put before the voters at each general election and it must be for a single work or purpose. The amount of general obligation bonds or notes which the State expects to issue in a given fiscal year is shown in the Capital Projects fund-type of the Governmental Funds Financial Plan in the Other Financing Sources category. Debt service must be paid from the first available taxes whether or not the Legislature has enacted the required appropriations for such payments. Impoundment is the term used to describe the setting aside, in a separate account, of income necessary to pay principal and interest on obligations. The specific method of impoundment, including the timing and amounts, is generally specified by State law for each obligation and is an integral element of the security behind any obligation. Moral obligation debt refers to long-term bonds issued by certain State public authorities, also known as public benefit corporations, which are essentially supported by their own revenues. Moral obligation debt is not incurred pursuant to a referendum, is not considered State debt, and is not backed by the full faith and credit of the State. However, the authorities selling such obligations have been allowed to establish procedures where, under certain conditions, the State may be called upon to meet deficiencies in debt service reserve funds supporting such bonds. An appropriation must be enacted by the Legislature to meet any such obligation. An official statement accompanies the issuance of bonds, notes, and publicly sold certificates of participation offered for sale by the State or its public authorities. This statement is prepared by the issuer and describes the issuer, the project or program being financed, and the security behind the bond issue. In addition, where payment of debt service is made primarily with State moneys, this statement includes the State’s Annual Information Statement (AIS), which includes recent and projected fiscal and economic trends and developments that bear reasonably on the credit strength of the issue. It

USER’S GUIDE
469
discusses potential legal, fiscal, or economic problems facing the issuer, State government, and other relevant major governmental jurisdictions. Its primary purpose is to provide prospective bond or note purchasers sufficient information to make informed decisions on the creditworthiness of the issue. State personal income tax revenue bonds are the primary funding vehicle for a broad range of State-supported debt programs. In 2001, legislation was enacted to permit certain State public authorities to issue State personal income tax revenue bonds. The legislation provides that 25 percent of personal income tax receipts (excluding refunds owed to taxpayers and deposits to the STAR Fund) be deposited to the Revenue Bond Tax Fund for purposes of making debt service payments on these bonds, with excess amounts returned to the General Fund. These bonds have reduced borrowing costs by improving the marketability and creditworthiness of State-supported obligations and by permitting the consolidation of multiple bonding programs to reduce administrative costs. Pay-as-you-go financing refers to the use of current State resources, i.e., cash (as opposed to debt) to finance capital projects. State-guaranteed debt refers to debt authorized by the voters to be sold by three public authorities: the Job Development Authority, the New York State Thruway Authority, and the Port Authority of New York and New Jersey. Of these authorizations, only Job Development Authority debt remains outstanding. Such debt is backed by a guarantee of the full faith and credit of the State. State-supported debt represents obligations of the State that are paid from traditional State resources (i.e., tax revenue) and have a budgetary impact. It includes general obligation debt approved directly by the voters and debt authorized by the Legislature and issued on behalf of the State by public authorities, where the State is contractually obligated to pay debt service, subject to appropriation. The State’s debt reform caps on debt outstanding and debt service apply to State-supported debt. State-related debt is a broader measure that includes State-supported debt, State-guaranteed debt, moral obligation financings and certain contingent-contractual obligation financings, where debt service is paid from non-State sources in the first instance, and State appropriations are available, but typically not expected to be needed, to make payments. Tax and revenue anticipation notes (TRANs) refer to short-term obligations of the State. The notes must be redeemed within one year of issuance. Bond covenants and the Debt Reform Act of 2000 limit the State’s ability to issue TRANS. OTHER MISCELLANEOUS TERMS An account is a subdivision of a fund and refers to a classification by which information on particular financial transactions and financial resources is recorded and arranged. An advance is a payment by the State on behalf of an agency, an authority, a fund, a public benefit corporation, or the Federal government that must be reimbursed by such entity. Certain advances are made from the Capital Projects Fund for prefinancing the cost of capital projects undertaken by public authorities, State agencies, or localities. All Governmental Funds is a term referring to all State government funds within the following fund types: General, Special Revenue, Capital Projects, and Debt Service. In a discussion of appropriations rather than cash figures (e.g., in the Agency Presentations
USER’S GUIDE
470
tables described earlier in this Guide), All Funds includes All Governmental Funds appropriations plus appropriations made from the non-governmental (Proprietary and Fiduciary) fund types. Annualization refers to the expected full-year financial implications of a revenue item or an expenditure item initially budgeted for only part of a fiscal year. Attrition refers to a method of achieving a reduction in personnel by not refilling positions that are vacated through resignation, reassignment, transfer, retirement, or means other than layoffs. Cap refers to an absolute dollar limit placed on spending and/or borrowing for a designated activity or program. The term is sometimes used to refer to the limitation of a disbursement for the current and/or forthcoming fiscal year(s) to the level of the preceding fiscal year or to some other predetermined level. Chargeback refers to an assessment levied by the State on another government or other entity (e.g., a public authority, a private-sector enterprise, a trade association, or a nonprofit organization) for payment of costs incurred by the State in administering an activity or program on behalf of such government or entity. It may also refer to an assessment by one State agency against another. A deficit, for purposes of the cash-basis Financial Plan, is an excess of disbursements over receipts at the end of a fiscal year. On a GAAP basis, a deficit is an excess of expenditures or expenses over revenues at the end of a fiscal year. Fixed assets are assets of a long-term character, such as land, buildings, machinery, equipment and improvements other than buildings, that are intended to continue to be held or used. General fixed assets include all fixed assets not accounted for in proprietary funds or in trust and agency funds. Under GAAP, general fixed assets are recorded in an account group (which does not involve the measurement of results of operations), rather than in a fund, and the recording of “infrastructure” assets and depreciation is not required. Full Time Equivalent (FTE) is a unit of measure which is equal to one filled, full-time, annual-salaried position. A joint-custody fund is held within the State Treasury by both the State Comptroller and the Commissioner of Taxation and Finance (see sole-custody fund below). The line item veto in the State Constitution authorizes the Governor to veto individual appropriations for the Legislature and Judiciary and appropriations added by the Legislature contained within any multiple appropriation bill passed by the Legislature. A margin, or positive margin, is a temporary excess of receipts over disbursements. When disbursements temporarily exceed receipts, a negative margin exists. A positive margin is not a surplus, nor is a negative margin a deficit, until the fiscal year ends. A matching formula is a formula applied under an intergovernmental grant program which requires a recipient to match from its own funds a specified percentage of each dollar granted by one or more higher level(s) of government. Nonrecurring receipts are receipts in a given fiscal year that are not normally expected to recur in subsequent fiscal years. Recurring receipts are normally derived from an income stream that is expected to continue from one fiscal year to the next. An offset fund is an appropriated fund, usually of the Special Revenue fund type, which is used to reimburse expenditures charged in the first instance to the General Fund. Save harmless refers to a provision of law under which the State protects another entity against any decrease from a previous level of funding under a given State program.

USER’S GUIDE
471
Shortfall refers to a situation where actual revenues collected are less than those that had been projected. A sole-custody fund is administered by an individual State agency official and is not under the joint custody of the State Comptroller and the Commissioner of Taxation and Finance. Sole-custody funds are usually fiduciary in nature. Examples include assets held for wards of the State. A surplus, for purposes of the cash-basis Financial Plan, is an excess of receipts over disbursements at the end of a fiscal year. On a GAAP basis, a surplus is an excess of revenues over expenditures or expenses at the end of a fiscal year.