2011 MANAGEMENT CAPABILITY INDEX – INDIAresources.aima.in/mci/MCI-Report-2011.pdf · I am pleased...
116
2011 MANAGEMENT CAPABILITY INDEX – INDIA ALL INDIA MANAGEMENT ASSOCIATION
Transcript of 2011 MANAGEMENT CAPABILITY INDEX – INDIAresources.aima.in/mci/MCI-Report-2011.pdf · I am pleased...

2011 MANAGEMENT CAPABILITY INDEX – INDIA
ALL INDIA MANAGEMENT ASSOCIATION

02 2011 Management Capability Index – India

03
All India Management Association (AIMA) 14, Institutional Area, Lodhi Road New Delhi - 110 003, IndiaWebsite: www.aima-ind.org
Mercer Consulting (India) Pvt. Ltd.Unit - I, 7th Floor, Tower A DLF Infinity Towers, DLF Cyber CityGurgaon - 122 002, IndiaWebsite: www.mercer.co.in
Asian Association of Management Organisations (AAMO)Rua de Xangai 175Edf. ACM, 9 AndarMacauWebsite: www.aamo.net
2011 MANAGEMENT CAPABILITY INDEX – INDIA

04 2011 Management Capability Index – India

05
CONTENTSFOREWORD BY AIMA – RAJIV VASTUPAL . . . . . . . . . . . . . . . . . . . . . 1
FOREWORD BY Mercer – NISHCHAE SURI . . . . . . . . . . . . . . . . . . . . 3
EXECUTIVE SUMMARY . . . . . . . . . . . . . . . . . . . . . . . . . . . . . . . . . . . . . 4
INTRODUCTION TO MANAGEMENT CAPABILITY INDEX – INDIA 7
COMPARISON WITH OTHER COUNTRIES . . . . . . . . . . . . . . . . . . . . 9
LEADERSHIP ARTICLES . . . . . . . . . . . . . . . . . . . . . . . . . . . . . . . . . . . . 13
MANAGEMENT CAPABILITY LANDSCAPE – INDIA . . . . . . . . . . . . . 231. ORGANIzATION RESULTS AND COMPARATIVE PERFORMANCE 252. VISIONARY AND STRATEGIC LEADERSHIP . . . . . . . . . . . . . . . . . . . 333. PERFORMANCE LEADERSHIP . . . . . . . . . . . . . . . . . . . . . . . . . . . . . . 414. PEOPLE LEADERSHIP . . . . . . . . . . . . . . . . . . . . . . . . . . . . . . . . . . . . . . 495. FINANCIAL MANAGEMENT . . . . . . . . . . . . . . . . . . . . . . . . . . . . . . . . 576. INNOVATION OF PRODUCTS AND SERVICES . . . . . . . . . . . . . . . . . 637. ORGANIzATION CAPABILITY . . . . . . . . . . . . . . . . . . . . . . . . . . . . . . . 718. APPLICATION OF TECHNOLOGY AND kNOWLEDGE . . . . . . . . . . 799. EXTERNAL RELATIONSHIPS . . . . . . . . . . . . . . . . . . . . . . . . . . . . . . . . 8710. INTEGRITY AND CORPORATE GOVERNANCE . . . . . . . . . . . . . . . . . 95
APPENDIX – RESPONDENT PROFILES . . . . . . . . . . . . . . . . . . . . . . . 103
ABOUT . . . . . . . . . . . . . . . . . . . . . . . . . . . . . . . . . . . . . . . . . . . . . . . . . . 105

06 2011 Management Capability Index – India

1
“The greater danger for most of us lies not in setting our aim too high and falling short, but in setting our aim too low, and achieving our mark.”—Michelangelo, Italian sculptor, painter, architect and poet
I am delighted to present to you the second AIMA Management Capability Index (MCI) study, conducted in partnership with Mercer. This global benchmark for measuring organizational effectiveness is being emulated by other countries and a number of national management bodies are rolling out similar MCI studies in their respective countries. I would not be surprised to see MCI becoming a common currency to gauge management effectiveness across borders in the next few years.
This year’s results show some encouraging shifts from the last year. I am pleased to share with you that we have managed to double the number of our MCI survey respondents, which means that effectively twice as many business leaders have responded and contributed to this study.
I would also like to congratulate the Mercer and AIMA teams involved in bringing out this important research on the health of our management capability. We at AIMA hope you will find that our endeavor brings you the most enriching and leading edge insights of value.
Rajiv VastupalPresident, AIMA
FOREWORD – AIMA
Foreword – AIMA

2 2011 Management Capability Index – India2

33
We are indeed proud of continuing to bring forth this cutting edge research in partnership with AIMA. The Management Capability Index (MCI), now in its second year, has during this time seen a lot of uptake from countries around the world and we are confident that MCI will soon become a great tool to compare management capability across sectors and geographies globally.
These are unprecedented times. Given the global economic headwinds and challenging macroeconomic environment, many companies across the board are finding innovative ways of continuing with their growth trajectory. Leadership capability has therefore come to the fore as arguably the most important differentiator in these times. The potential of an organization as the collective worth of the management capability inherent within that can be tapped for the greater good.
While the overall scores have hovered in the same region as last year’s scores, what is interesting to note is that the areas of people leadership and organization capability continue to constrain “India Inc.” from reaching its full potential. Respondents have critiqued their respective organizational abilities to create a pipeline of leaders. Therefore, the results are in line with what we as a consulting firm are witnessing: that a number of companies are developing and executing comprehensive leadership development and succession planning strategies and programs.
We hope you will find this report an important reference piece as you benchmark your organization against the practices prevalent in “India Inc.” as you also plan to prepare for your future growth.
Nishchae SuriManaging Director, Mercer India
FOREWORD – MERCER
Foreword – AIMA

4 2011 Management Capability Index – India
The 2011 Management Capability Index (MCI) – India is Mercer and AIMA’s second such initiative measuring management capability across corporate India. The report aims to create comparative insights for measuring the evolving capability of management, based on changes in the business environment across different kinds of organizations.
The MCI survey is now conducted annually, enabling “India Inc.” to identify and address areas that need further intervention from stakeholders, both from within the organizations and from the external ecosystem. The MCI converts the evaluation of management performance into an index – a useful measurement tool and indicator of how a CEO, an organization, a group, a sector or a country is performing in terms of management capability. The index enables useful comparison or benchmarks between organizations based on their size, nature of ownership and industry, and even allows a comparison among countries at an aggregate level.
As in 2010, the MCI – India is based on the following 10 major drivers of management capability. The weighting of the 10 categories remains unchanged from last year.
EXECUTIVE SUMMARY
No. Category Weighting
1 Organization results and comparative performance 25%
2 Visionary and strategic leadership 15%
3 Performance leadership 10%
4 People leadership 10%
5 Financial management 10%
6 Innovation of products and services 10%
7 Organization capability 5%
8 Application of technology and knowledge 5%
9 External relationships 5%
10 Integrity and corporate governance 5%
Total 100%
For each of the 10 categories, CEOs, managing directors and general managers have assessed what they consider to be their organization’s current performance level using a six-point scale. The results are based on the responses of the 412 organizations who participated in the 2011 survey (compared to 208 companies in 2010). The respondents included local large organizations (LLOs), multinational corporations (MNCs), small and medium enterprises (SMEs), government agencies and others.

5Executive Summary
Dimensions of overall MCI2010(%)
2011(%)
Visionary and strategic leadership 71.3 76.5
Performance leadership 75.4 77.1
People leadership 71.8 74.9
Financial management 74.1 76.7
Organisation capability 72.0 75.9
Application of technology and knowledge 73.5 75.7
External relationships 76.5 77.6
Innovation in products and services 74.5 76.2
Integrity and corporate governance 80.8 80.1
Overall organization results and comparative performance 76.7 77.6
Type of organization2010(%)
2011(%)
2010 overall MCI 74.6 77.8
Local large organisations (LLOs) 75.3 78.5
Multinational corporations (MNCs) 77.3 78.0
Small and medium enterprises (SMEs) 74.6 69.2
Government agencies 66.1 81.4
Others 72.6 77.0
OVERALL SCORES The overall MCI – India for 2011 is 77.8%, which shows a slight improvement on the overall performance in 2010 of 74.6%. However, Indian management is still operating at less than four-fifths of its total capability and has considerable opportunity for improvement in specific areas.
The Indian corporate sector continues to rate itself as strongest in the category of integrity and corporate governance, with an index score of 80.1%.
As in 2010, the 2011 MCI results also indicate that Indian organizations perform relatively better in the more tangible, performance-oriented measures such as organizational results and comparative performance, and performance leadership.
In contrast, Indian organizations continue to perform weaker on the softer aspects of leadership and management, such as people leadership and organizational capability.
RESULTS BY ORGANIzATION TYPEThere are significant differences by type of organization in terms of their performance by the different measures, as shown by the table below.

6 2011 Management Capability Index – India
GOVERNMENT AGENCIESGovernment agencies performed significantly better than in 2010. For 2011, they were the strongest organization type in terms of overall MCI score. The improvement in scores among government agencies can be seen across categories, especially in the performance-related dimensions.
MULTINATIONAL CORPORATIONS (MNCs)The performance of multinational companies remained unchanged from last year: MNCs are operating at 78% MCI.
LOCAL LARGE ORGANIzATIONS (LLOs)LLOs also posted a significant improvement in their ratings between 2010 and 2011. Financial management and organizational capability are areas in which LLOs have shown maximum improvement.
SMALL AND MEDIUM ENTERPRISES (SMEs)SMEs continue to perform poorly – their ratings slid down from 75% in 2010 to 69% in 2011.
OTHER OBSERVATIONSOther than the type of ownership, some of the other differences that emerged between the various organizations in 2011 survey were:
•Established sectors and organizations performed well:
— Traditional sectors such as energy achieved high MCI scores.
— Older organizations performed better across categories.
•Indian organizations seemed particularly strong in the following areas:
— Innovation – products and services
— Organization capability
— Results and comparative performance
•By comparison, Indian organizations are nearly on par with their international counterparts in the following areas:
— Integrity and corporate governance
— Financial management

7Introduction to the Management Capability Index – India
INTRODUCTION TO ThE MANAGEMENT CAPABILITY INDEX – INDIAThe MCI – India report maps the aggregated collective potential of business teams to determine sustainable performance and growth. The report results indicate the leadership competency of organizations in India, demonstrated through variables like financial performance, talent, governance, innovation and social value. It is an assessment of how business leaders respond to and evolve with the rapidly changing business environment in the global economy.
In order to enhance and maximize management capability, it is essential to create and track metrics that measure that capability or inherent potential. The MCI has been established to measure the capability of management, to identify where improvements in performance need to be made and to track cumulative performance. It converts the evaluation of management performance into an index – a measurement of how effectively a CEO, an organization, a group, a sector or a country is performing. The MCI enables useful comparison or benchmarking between organizations, sectors and countries.
As pioneers in management thought leadership, AIMA last year embarked upon the groundbreaking initiative to study Indian management practices and to gauge the robustness and competitiveness of business performance of Indian corporations and institutions.
The inaugural MCI report was carried out jointly by AIMA and Mercer. Launched in January 2011, it was very well received. The study involved the participation of more than 200 CEOs and managing directors across MNCs, LLOs, SMEs and government agencies from industries such as education; manufacturing; energy; trading; construction; automobiles; IT and telecommunications; consumer banking and finance; business and professional services; and tourism and leisure services. The report revealed some very interesting findings, which we believe will serve as a rich reference and best practices guide to both industry and academia.
Some of the key survey findings of the 2010 report were:
•The overall 2010 Indian MCI was 74.6%, suggesting that Indian management is performing at around 72% of its potential (100%).
•Indian organizations were strongest in the areas of integrity and corporate governance, followed by external relationships and performance leadership.
•India’s weakest area was visionary and strategic leadership, followed by people leadership and organization capability.

8 2011 Management Capability Index – India
Each MCI questionnaire asked for information about the organizations and their financial data, as well as a set of questions covering the 10 different survey categories (rated on a scale of 1 to 5, with 5 being the highest). The survey parameters included the following values, with organization results and comparative performance carrying the highest weighting:
1. Organization results and comparative performance
2. Visionary and strategic leadership
3. Performance leadership
4. People leadership
5. Financial management
6. Innovation of products and services
7. Organization capability
8. Application of technology and knowledge
9. External relationships
10. Integrity and corporate governance
The questionnaire also investigated the ownership structure of the organizations taking the survey, asking respondents to choose from the following categories: equal ownership (50% local and 50% foreign), fully foreign (100% foreign ownership), fully local (0% foreign ownership), majority foreign (51%–99% foreign), majority local (1%–49% foreign ownership) and others. The majority of the participants were in the fully local bracket.
We are happy to share with you the executive summary of our second study of management capability in India.

9
COMPARISON WITh OThER COUNTRIES
9

10 2011 Management Capability Index – India2011 Management Capability Index – India10

11
2011 MCI performance (across areas of performance) Weighting India Malaysia New zealand
Results and comparative performance 25% 78 71 65
Visionary and strategic leadership 15% 77 73 66
Performance leadership 10% 77 73 67
People leadership 10% 75 70 67
Financial management 10% 77 75 76
Organization capability 5% 76 69 65
Application of technology and knowledge 5% 76 72 66
External relationships 5% 78 71 71
Innovation of products and services 10% 76 70 65
Integrity and corporate governance 5% 80 80 79
72%77%
68%
India Malaysia NewZealand
COMPARISON WITh OThER COUNTRIES
The 2011 MCI – India scores have been compared with those from Malaysia and New zealand. In absolute terms, India scores are higher than for both of those countries.
While Indian organizations rated consistently highly across different aspects of leadership and management, there were areas of relative weakness among their counterparts in Malaysia and New zealand.
Overall 2011 MCI Scores
11Compariosn with other countries

12 2011 Management Capability Index – India12 2011 Management Capability Index – India

131313
LEADERShIPARTICLES

14 2011 Management Capability Index – India2011 Management Capability Index – India14

15
THE FUTURE OF MANAGEMENT
Management is not an exact science and it is therefore a challenge for every corporation to distill its strengths and have the ability to replicate that strength repeatedly. Management as a discipline is learning by doing and codifying the experience.
This is not as easy as it sounds, since it requires an organization to align its people skills and capabilities to the opportunities, and also to motivate and energize the organization to a winning mindset-level versus a routine chore-of-the-day attitude.
Indian enterprises need to be run differently in the future. We have quickly moved to a services economy and a lot of the jobs are white-collar roles now. The knowledge worker is a cornerstone of the new India. knowledge workers tend to be young, be a mix of both genders and have a clear, articulate point of view, and they don’t buy into hierarchy.
The challenge of having capability is to translate that capability into a high-performance way of working and winning. Capabilities change over time and some will always remain a given for high-performance organizations. In India those will be:
1. Institution-building leadership
2. Managing people as assets
3. Governance
4. Innovation as a discipline
5. Partnering in the ecosystem
These will be essential for building a different and capable company.
D. ShIVAkUMARSENIOR VICE PRESIDENT – IMEA, NOkIA
15Leadership articles

16 2011 Management Capability Index – India
INNOVATION: A RISk WORTH TAkING
Innovation is a risky business, but not innovating is even riskier.
During a slowdown in growth, executives may debate whether resources spent on innovation are justified by the benefits it yields. I believe innovation can help companies counter slowdown and induce growth.
Normally we perceive innovation as “first in the world” and technology-led with a high level of visibility. Products like the iPod and iPad fall into this category. Innovation is also about creating a product, a service or a process that’s difficult to replicate. Although not high in visibility, some of these innovations create very high societal impact. Take for instance Aravind Eye Care, where the average cost of cataract treatment is $25, as opposed to $3000 in the USA. The secret lies in standardization and “engineering” of cataract surgery for high-volume production. Surely, an advantage difficult to replicate. Similarly, Nirma managed to deliver a detergent to consumers at INR5 a kilo and that was tough to replicate. To create another Amul is very tough. But Nirma and Amul do not really register in our innovation consciousness.
Take a straw poll on the best innovations globally over the last 50 years and you will get names such as Apple and Google coming up, but almost never will a Nirma or an Amul surface. In this lesser-known league are the likes of Tata Ace, a breakthrough automobile that sold over 100,000 vehicles annually within two years of its launch, and Ginger, a hotel chain that provides good, clean rooms at a budget price.
Techniques that push innovation forward and help us measure it have been extensively researched and developed. Today, there is almost a plug and play of techniques available, but without the right environment, innovation will not grow. Companies must create a culture that will foster innovation. Creating the right environment where people don’t feel threatened, where people feel encouraged, is a very important part of innovation. Democratizing innovation is important so that more and more people see that it is the core of their job and what they are paid for. It doesn’t matter if they are raising invoices or loading trucks or working in a research lab.
Tata Group Innovation Forum (TGIF) has been established to facilitate and help companies create the right environment for innovation. TGIF has been able to spread awareness about innovation across the group. It is getting under the skin of companies and spurring them on to achieve long-lasting success. Companies would do well to treat creation of the right environment for innovation as importantly as the techniques they employ for innovation.
R. GOPALAkRIShNANDIRECTOR, TATA SONS
16 2011 Management Capability Index – India

17
ORGANIzATIONAL CAPABILITY
Nearly 60% of respondents to a Mckinsey survey conducted in 2010 said that building organizational capabilities such as lean operations, project and talent management were the top-three priorities for their companies, and 90% placed it among the top ten.
In today’s business environment, with uncertain markets and regulatory changes, leadership needs to focus on building dynamic capability. Organizations ought to be able to manage and reconfigure competences to address rapidly changing environments.
Globalization is a major test of strength of organizational capabilities for multinational companies from emerging economies. For the Avantha Group, the key to profitable growth in every market that we participate in is our ability to continuously improve the alignment between new categories and current core competencies. That is, we need to build on our organizational capabilities and make our products appeal to consumers in other markets.
Organizational capabilities can be economic, strategic or technical. Identifying key capabilities, spending resources on developing these capabilities, encouraging innovation to discover new methods of improving capabilities and actively monitoring the business environment to understand when to reconfigure capabilities will contribute
to the success and value creation of the company.
GAUTAM ThAPARGROUP ChAIRMAN AND CEO,ThE AVANThA GROUP
17Leadership articles

18 2011 Management Capability Index – India18
MAINTAINING INDIA’S EDGE
“The future belongs to those who see possibilities before they become obvious.”
—Ted Levitt, American economist, professor at Harvard Business School and expert on globalization
As Indian businesses take on their international counterparts in the fight for dominance of the global market, being leaders at home will no longer suffice. To be internationally competitive, corporate India has to learn from the major multinationals of the world while creating their own unique path that leverages the advantages of belonging to an emerging economy.
Complacency in existing strengths can make leaders stumble. For instance, India is losing some of its advantage in terms of lower labor cost. Companies, including Genpact, are now hiring in the United States as wage expectations there have been revised downwards, making skilled and experienced employees available at an affordable cost. Thus, adapting to the changing global environment is necessary to remain competitive.
The slowdown in growth makes the global battle more intense. There is little scope for inefficiency and the stress on improvement and innovation is immense. However, there also exist exhilarating opportunities for those who are willing to grab them, and it will be these visionaries who will form the new breed of performance leaders.
PRAMOD BhASINNON-EXECUTIVE VICE ChAIRMAN AND FORMER PRESIDENT AND CEO, GENPACT
18 2011 Management Capability Index – India

19
A BITTER PILL IS BETTER THAN THE WRONG MEDICATION
The role of the finance function is evolving at a faster pace than ever before. Today, businesses are demanding that a CFO play a more integral role in the very life of the business than ever before. The discharge of this function is transforming to a more holistic role, including strategy formulation, enterprise-wide risk management and even challenging the basic assumptions upon which the business is founded.
Business is the function that generates wealth for all stakeholders while performing a core and vital function that satisfies human wants and needs. Finance is but a part, albeit a vital one, that is subservient and integral to the overarching business goals and objectives. The role of the finance executive transcends mere computation of IRR, NPV and other traditional measures, to encompass careful study and recommendation to the top management and peers of well-considered possible solutions based on experience and deep understanding of the business itself. Any other approach would fall short of a truly responsible professional job.
On the other hand, the present-day propensity to divorce the finance function and super-specialise it, without reference to the underlying business and economic realities, has resulted in the near collapse of the global financial system, causing tremendous human suffering and hardship on an unprecedented scale. This thinking, which flies in the face of good commonsense, has to be curbed and reason must prevail among all related to the profession of finance in the larger interests of the unsuspecting laity, who place their trust and hard-earned money in the hands of these professionals.
True welfare and sound management lies in genuine innovation, in gains in productivity, in providing access to people at the bottom of the pyramid, in improving yields in scarce resources, in breakthrough thinking and technologies. Innovation does not lie in parcelling out loans and ignoring risk-reward relationships, which are inviolable by nature.
Business is more about exploiting opportunities and less about problem solving, and the task of management is to ensure that resources are utilized in the larger and best interests of society. The CFO thus has to ensure that, as a responsible professional at the top level of management, he or she states what is right always, in preference to what is acceptable. This is a riskier approach personally, but the enterprise would be better off with the right advice
over an acceptable one. The world would indeed be a better place if we had more of the right advice.
PREEThA REDDYMANAGING DIRECTOR, APOLLO hOSPITAL ENTERPRISES
19Leadership articles

20 2011 Management Capability Index – India
LEADING PEOPLE
Our huge population is not an economic albatross. Instead, India’s growth story is increasingly the story of its young and growing population.
Today, India commands the attention of the world as a result of its unique demographic dividend – it has one of the youngest populations in the world at a time when the rest of the globe is going grey.
Globally, more people than ever before are entering retirement. Even in the 1980s, European leaders had begun to worry about Europe’s falling population. The French president, Jacques Chirac, famously said that the continent was becoming a place of “old people, living in old houses, ruminating about old ideas.” This trend of an ageing, shrinking population, now visible across much of the developed world, opens up a wealth of opportunities for India, since the challenge of maintaining wealth in ageing societies means that developed markets will have to increasingly outsource their labor requirements. India is projected to have an additional 47 million workers by 2020, a number almost equal to the total world shortfall. The average Indian will then be only 29 years old, compared with an average age of 37 in China and the United States, 45 in Western Europe and 48 in Japan.
India’s population and crowds have, since its independence, dominated the country’s image to the point of stereotype. It led economists and social scientists to erroneously predict either India’s political fragmentation – how, after all, could a center in Delhi hold together such vast and diverse numbers? – or India’s decline by famine, due to its inability to feed its millions. But in the last two decades, this depressing vision of India’s population as an “overwhelming burden” has been turned on its head. Instead of suffering famines and revolutions as prophesied by doomsayers, because of its huge population, India is positioned to benefit from the higher growth rates that typically characterize a young working populace. India, in fact, may have better prospects than China, whose one-child policy will lead to a rapid ageing of its population, thus creating problems for its economy.
With economic growth, our human capital has emerged as a vibrant source of workers and consumers not just for India, but also for the global economy. The economist Julian Simon has argued that as population increases, so does the stock of creativity and innovation. “The ultimate resource is human imagination,” he said. This idea of population as an asset rather than a burden has gained currency particularly with the rise of knowledge-based industries such as IT, telecommunications and biotechnology. In fact, the information economy is the culmination of what the Industrial Revolution started – it has placed human capital front and centre as the main driver of productivity and growth.
India’s position as the world’s go-to destination for talent is hardly surprising; we may have been short on various things at various times, but we have always had plenty of people. However, the pressures of India’s vast population are indeed humungous – our natural resources are no bottomless pool. A billion people may offer us a deep base of human capital, but they also serve as a potentially massive and detrimental burden on our environment, food production and resources, as millions of people join the middle class, ramp up their consumption, and per capita energy intake grows. We will have to find solutions for these concerns.
Nevertheless, the impact of human capital in India has so far had large payoffs for the economy. Globally, human creativity and economic competitiveness are now closely linked, and competition among countries is competition between their human capital. As Tom Friedman notes, these days rather than tell his children to finish their dinner because people are going hungry, “I tell my daughters to finish their homework because people in China and India are starving for their jobs.”
SANTRUPT B. MISRACEO, CARBON BLACk BUSINESS, AND GROUP hR DIRECTOR, ADITYA BIRLA GROUP
20 2011 Management Capability Index – India

21
MANAGING CORPORATE WELLNESS HOMOEOPATHICALLY
Not all people living under the same circumstances take ill simultaneously. It is only those who are “susceptible” to the “disease” at that moment, who manifest its “symptoms.” Such susceptibility is a function of the state of their immune system, known as the “life force” in homoeopathy.
Homoeopathy is guided by principles such as individualization, holism and “like cures like,” which seeks to heal people gently, quickly and permanently inside and out by restoring the misalignments in their life force.
Quite similarly we observe that there are some organizations, in every industry, whose performance is consistently superior to their peers. Even in an adverse external environment such organizations often remain well. Is that which distinguishes their wellness explained by their material resources? Or does the answer lie deeper in the organization’s equivalent of a human being’s immaterial life force?
Is it this life force that we refer to as “strategy” in an organization’s context? If so, management principles can be drawn from the aphorisms of “Organon of Medicine” by Dr. Samuel H. Hahnemann, the founder of homoeopathy. Dr. Hahnemann taught, “It is
the life force that cures, for a dead man needs no more medicine.”
RAjIV BAjAjMANAGING DIRECTOR, BAjAj AUTO LTD
21Leadership articles

22 2011 Management Capability Index – India2011 Management Capability Index – India22

23
MANAGEMENT CAPABILITY LANDSCAPE – INDIA
23

24 2011 Management Capability Index – India2011 Management Capability Index – India24

25
With a weighting of 25%, the category of organization results and comparative performance is the most critical driver of the AIMA Management Capability Index.
Organization results are measured through three underlying financial parameters:
•Growth in revenue over the past five years
•Profit performance over the past five years
•Economic value added2 (EVA) performance over past 5 years
To understand the performance of different types of organizations in terms of overall results and comparative performance, they have been rated on the following six-point scale:
1. OVERALL ORGANIZATION RESULTS AND COMPARATIVE PERFORMANCE
Scale point Numeric score Scale point description
5 100 Excellent performance in most areas. Strong evidence of industry leadership in most areas
4 80 Good to excellent performance in most areas. Most trends compared against benchmarks show areas of leadership and very good performance
3 60 Good performance in many areas. Many trends compared against benchmarks shows areas of good performance
2 40 Improving trends in many areas. Some trends compared against benchmarks shows areas of strength
1 20 Early stages of developing trends, many results not reported
0 0 No results; poor results
2 EVA is a measure of an organization’s financial performance based on residual wealth, calculated by deducting cost of capital from its operating profit.
251. Overall organization results and comparative performance

26 2011 Management Capability Index – India
Figure 1.1: Overall organization results and comparative performance scores 2010–2011
Practiced throughout and improvements made
Practiced across most of organization
Practiced only in parts of organization
Fully practiced and continuously refined
Just started
Not in place
2010
2011
0%
0% 5%
26%
28%
43%
50%
21%
15%
7%
3%
2%
5%
RESULTS BETWEEN 2010 AND 2011Figure 1.1 below encapsulates the overall performance of the survey sample in the two waves of the MCI.
In absolute terms, the organizations surveyed performed well in terms of overall results and comparative performance, with close to four out of every five ratings showing either excellent or very good scores.
The overall score went up between the 2010 and 2011 waves: a marginal improvement compared to the scores last year, from 76.7% to 77.6%.
*Graphs featuring percentages may not total 100% due to rounding

271. Overall organization results and comparative performance
Overall organization results and comparative performance
Integrity and corporate governance
Innovation of products and services
External relationships
Application of technology and knowledge
Organization capability
Financial management
People leadership
Performance leadership
Visionary and strategic leadership
5% 3%
3%
15%
3%
21% 43% 27%
43% 37%4%
4%
3% 45% 30%
50% 23% 23%
47% 25% 25%
4%
3% 20%4%
50% 26% 26%
46% 28% 28%
49% 25% 25%
49% 22% 22%
3% 16%4%
3% 18%4%
3% 17%4%
6% 19%4%
4% 18%4%
50% 28%
13%
17%
30%
Excellent
Very good
Good
Improving trends
Early stages
No/poor results
2%
1%
1%
1%
1%
1%
2%
Figure 1.2: Performance across different categories
Some differences were apparent between the performances of different types of institutions within the organization results and comparative performance parameter.
RESULTS BY INDUSTRY•Organizations in the energy and banking and finance sectors performed especially well in this category.
•IT and telecommunications companies also recorded high organization performance scores.

28 2011 Management Capability Index – India
Figure 1.3: Overall organization results and comparative performance scores by industry
Type of organization (with more than 25 respondents)
Energy IT and telecom-munications
Manufacturing Banking and finance
Education/academia
All
Fully practiced; continually refined and improved
56% 36% 29% 30% 14% 28%
Practiced consistently with further improvements made
33% 36% 57% 61% 54% 50%
Practiced across most of the organization, most of the time
4% 8% 9% 9% 25% 15%
Practiced across part of the organization, part of the time
4% 8% 0% 0% 4% 3%
Just started 0% 0% 0% 0% 0% 0%
No results/poor results 4% 12% 4% 0% 3% 5%
RESULTS BY AGE AND ORGANIzATION TYPE•On the whole, older organizations (more than 25 years old) performed better than younger companies did.
Figure 1.4: Overall organization results and comparative performance scores by age of organization
Less than5 years
5−24years
25−49years
50+ years
4.1
3.6
2.9
4.1
Average score=3.9

291. Overall organization results and comparative performance
•Similar to 2010, larger organizations (government agencies and LLOs) scored the highest on organization results and comparative performance (see figure 1.5).
•Compared with 2010, there was a significant improvement in scores among government agencies for the 2011 survey, with 85% of the sample rating their organizations “excellent” in this category.
Governmentagencies
LLOs MNCs SMEs Others
2011201020112010201120102011201020112010
36%
21%
29%
7%
7%
85%
7%
5%
2% 1%
31%
39%
24%
6%
37%
38%
17%
2%5%
22%
55%
19%
3%
27%
53%
14%
2%5%
27%
41%
16%
9%
7%
14%
53%
21%
12%
23%
42%
23%
13%
24%
53%
16%
3%1%
2%
Excellent Very good Good Improving trends Early stages No/poor results
Figure 1.5: Overall organization results and comparative performance scores by organization type
OTHER CONCLUSIONSGoing back to the three underlying attributes of organization results and comparative performance, we see the following outcomes:
•Profit and EVA performance improved from the 2010 results.
•On average, 26%–30% of the sample rated their own organization’s performance by the three individual measures as “excellent.”

30 2011 Management Capability Index – India1. Overall organization results and comparative performance
Excellent Very good Good Improving trends Early stages No/poor results
Growth performance Profit performance EVA performance
26% 26% 26%
45%
45%
19% 30%
42%
18%
3% 1%5%
26%
6%
3%
19%
3%2%5%
22%
41%
24%
10%
2% 1%
48%
17%
3% 1%5%
43%
23%
5%
3%
201120102011201020112010
Figure 1.6: Individual attributes defining organization results and comparative performance 2010–2011
IN SUMMARY•Organization performance remained the most critical factor in driving the management and leadership
capabilities of an organization.
•Overall, organizations continued to score highly in this category with close to 80% of the organizations rated as “very good/excellent” – a rise on the 2010 ratings. The improvement in ratings was most pronounced among government agencies and LLOs.
•Older, more established organizations – especially those in industries like energy (oil and gas) and manufacturing/construction – scored the highest on this parameter.
•SMEs were the weakest performers in this area among the types of organizations, with a third of the sample scoring “good” or below in 2011.
•IT and telecommunications was the only other industry that did well in this category, with 72% of the sample rating their organization “excellent” or “very good.”
Economic Value Added or EVA (EVA) is a registered trademark of Stern Stewart & Co. and a commonly used corporate finance term. In simple words, EVA is the profit earned by the firm, minus the cost of financing the capital. In recent business parlance, the concept of value addition has acquired interesting contexts, as social entrepreneurship takes off. Measuring success of a business on other variables besides the economic value add may yet not be the most mainstream concept, but is one that is gaining a foothold as financial markets globally display a lack of stability and firms with traditionally high EVA fail to make an impact on the contexts within which they operate.
2011 Management Capability Index – India30

3131

32 2011 Management Capability Index – India32 2011 Management Capability Index – India2011 Management Capability Index – India32

33
Providing visionary and strategic leadership is the second-most crucial driver of the overall MCI, with a weighting of 15%.
Visionary and strategic leadership is measured through two underlying parameters:
•Setting the right vision and strategies:
— There is a clear and inspiring vision.
— Strategies, objectives and plans are targeted at growing the business and take full account of employee, supplier, customer and other stakeholder interests.
— There is an international perspective and a good understanding of global management and leadership issues, research and best practices.
•Driving the organization towards attaining its vision and strategies:
— People are actively encouraged to own the vision.
— The vision is well-understood by all stakeholders.
— People are motivated to work towards achieving the goals of the vision.
— The vision and supporting goals underpin and guide decisions and behavior in the organizations.
To understand the performance of different types of organizations on visionary and strategic leadership, they have been rated on the following six-point scale:
2. VISIONARY AND STRATEGIC LEADERShIP
Scale point Numeric score Scale point description
5 100 Yes, fully practiced throughout the organization. Continually refined and improved as “the way things are done around here”
4 80 Yes, practiced consistently across the organization with further improvements being made
3 60 Yes, practiced across most of the organization most of the time
2 40 Yes, practiced, but only in parts of the organization, part of the time
1 20 Yes, has just started
0 0 No, is not in place
2. Visionary and strategic leadership2. Visionary and strategic leadership 33

34 2011 Management Capability Index – India
RESULTS BETWEEN 2010 AND 2011Figure 2.1 below encapsulates the overall performance of the sample surveyed in the two waves of the AIMA Management Capability Index.
In absolute terms, the organizations surveyed performed well in terms of visionary and strategic leadership, with close to three out of every four ratings showing either excellent or very good scores.
There was significant improvement in scores this year, with the two top-box scores improving by close to 16%. This jump improved the average overall score across the sample, from 71.3% to 76.5%.
Figure 2.1: Overall visionary and strategic leadership scores 2010–2011
Practiced throughout and improvements made
Practiced across most of organization
Practiced only in parts of organization
Fully practiced and continuously refined
Just started
Not in place
2010
2011
5%1%
18%
25%
41%
49%
26%
17%
10%
3%
4%
2%
4%

352. Visionary and strategic leadership
When compared to the other areas of performance, provision of visionary and strategic leadership emerges as an area of moderate performance for Indian organizations.
While scores are lower here than in areas such as corporate integrity, they are not as low as in areas such as people leadership and innovation (see figure 2.2).
Some differences were apparent between the performances of different types of organizations within the visionary and strategic leadership parameter.
RESULTS BY INDUSTRY•Organizations in the more traditional industries of energy, manufacturing and banking performed better
within the parameter of visionary and strategic leadership.
Overall organization results and comparative performance
Integrity and corporate governance
Innovation of products and services
External relationships
Application of technology and knowledge
Organization capability
Financial management
People leadership
Performance leadership
Visionary and strategic leadership
5% 3%
3%
15%
3%
21% 43% 27%
43% 37%4%
4%
3% 45% 30%
50% 23% 23%
47% 25% 25%
4%
3% 20%4%
50% 26% 26%
46% 28% 28%
49% 25% 25%
49% 22% 22%
3% 16%4%
3% 18%4%
3% 17%4%
6% 19%4%
4% 18%4%
50% 28%
13%
17%
30%
Excellent
Very good
Good
Improving trends
Early stages
No/poor results
2%
1%
1%
1%
1%
1%
2%
Figure 2.2: Performance across different categories

36 2011 Management Capability Index – India
Figure 2.3: Visionary and strategic leadership by different industries
Type of organization (with more than 25 respondents)
Energy IT and telecom-munications
Manufacturing Banking and finance
Education/academia
All
Fully practiced; continually refined and improved
33% 24% 24% 22% 23% 25%
Practiced consistently with further improvements made
48% 44% 55% 57% 46% 49%
Practiced across most of the organization, most of the time
4% 24% 16% 17% 23% 17%
Practiced across part of the organization, part of the time
11% 0% 0% 4% 3% 3%
Just started 0% 0% 1% 0% 3% 2%
No results/poor results 4% 8% 4% 0% 1% 4%
RESULTS BY AGE AND ORGANIzATION TYPE•On the whole, older organizations (more than 25 years old) performed better.
Figure 2.4: Visionary and strategic leadership scores by age of organization
Less than5 years
5−24years
25−49years
50+ years
3.8
3.6
3.4
3.9
Average score=3.8
•There was a marked improvement in the ratings of government agencies in 2011. These types of organizations now rate themselves higher in this category than other organization types do.
•SMEs emerged as the weakest organization type on this front, their scores having weakened considerably since the 2010 survey.

37
Figure 2.5: Visionary and strategic leadership scores by organization type
2011201020112010201120102011201020112010
2.79
4.00
3.53
3.83 3.83 3.86
3.54
3.403.52
3.89
Governmentagencies
LLOs MNCs SMEs Others
OTHER CONCLUSIONSGoing back to the two underlying attributes of visionary and strategic leadership, we see the following outcomes:
Setting the right vision and strategies
•There was a clear decline in the scores for attributes relating to setting the right vision and strategy, particularly in terms of:
— Having a clear and inspired vision (excellent ratings reduced from 44% to 33%)
— Having a vision that takes into account stakeholder interests (excellent ratings reduced from 35% to 27%)
2. Visionary and strategic leadership

38 2011 Management Capability Index – India
Figure 2.6: Setting the right vision and strategies 2010–2011
Excellent Very good Good Improving trends Early stages No/poor results
44%
44%
33%35%
27%24%
23%
46%
18%
5%
47%
20%
7%
48%
16%
8%
41%
18%
5%1% 1% 1%
1%1%1%
5%
1%1%
36%
16%
4%
16%
Having clear/inspired vision
Accounts forstakeholder interest
Has globalperspective
201120102011201020112010
Driving the organization towards attaining its vision and strategies
•Ratings on attributes relating to driving vision across the organization remained low. Less than a quarter of the sample rated their organization as excellent in this category.
•The performance of organizations declined slightly in terms of encouraging people to own the organizational vision (excellent scores reduced from 29% to 22%).

39
Figure 2.7: Driving organization towards vision 2010–2011
20112010201120102011201020112010
Excellent Very good Good Improving trends Early stages No/poor results
People encouragedto own vision
Everybodyunderstands vision
People motivated towork towards vision
Vision underpins andguides decisions
29% 23% 23% 23%
44%
24%
24%
47%
8%
26%26%
45%
20%
4%
46%
21%
5%5%
19%
45%
19%
6%
46%
23%
7%
1% 1% 1%1%4%
2% 2%5% 3%
48%
18%
5%
22%
49%
20%
4% 1%6%
IN SUMMARY•Vision and strategic leadership remained the second most critical driver of overall MCI, with a contribution
of 15%.
•Despite some improvement in scores in this wave, having a visionary and strategic leadership continued to be an area of moderate performance for Indian organizations, with only about a quarter of organizations rating themselves “excellent” on this front.
•Older, more established organizations – especially those in industries like energy, manufacturing and banking – scored higher in this category, while SMEs fared the weakest in this area, with a third of the sample scoring “good” or below in 2011.
•On individual attributes, performance remained low in categories related to driving strategy across the organization. In this wave, scores for having a clear vision that takes care of stakeholder interests declined.
As businesses evolve in a flat, information-centric world, the leadership challenge is in remaining true to the context of the global corporation and customers. Diversity, agility, respect for change, collaborative work environments, empowerment of every single member of the team and enhancing the experiential quotient for the customer are the challenges leadership teams face today.
2. Visionary and strategic leadership

40 2011 Management Capability Index – India40 2011 Management Capability Index – India2011 Management Capability Index – India40

41
The category of performance leadership focuses on the result-oriented culture of an organization, and it carries a weighting of 10%.
Providing leadership that is performance-oriented is critical to the overall leadership perceptions of an organization. This parameter has a weighting of 10% in driving overall MCI scores. It comprises attributes that straddle the dimensions of setting challenging performance objectives and having a track record of meeting these objectives through strong organizational focus and commitment.
Performance leadership is measured through three underlying parameters:
Setting challenging performance objectives
•Demonstrates the ability and attitude to lead the achievement of challenging goals, and change, while managing risk and breaking new ground
•Balances risk with achievement
Track record of consistently meeting performance objectives
•Consistently meets its performance goals and has a performance track record of growth and continuously improving performance
•Consistently betters the performance of its competitors or other comparable organizations
Organization focus and commitment towards achieving performance objectives
•Ensures the organization has a strong focus on goals, performance and achievement
To understand the performance of different types of organizations on performance-oriented leadership, they have been rated on the following six-point scale:
3. PERFORMANCE LEADERShIP
3. Performance leadership
Scale point Numeric score Scale point description
5 100 Yes, fully practiced throughout the organization. Continually refined and improved as “the way things are done around here”
4 80 Yes, practiced consistently across the organization with further improvements being made
3 60 Yes, practiced across most of the organization most of the time
2 40 Yes, practiced, but only in parts of the organization, part of the time
1 20 Yes, has just started
0 0 No, is not in place
41

42 2011 Management Capability Index – India
RESULTS BETWEEN 2010 AND 2011Figure 3.1 below describes the overall performance of Indian organizations surveyed in the two waves of the AIMA Management Capability Index in the category of being performance-oriented.
In absolute terms, the organizations surveyed were rated as being performance-oriented, with close to three out of every four stating that performance orientation is fully or consistently practiced.
There was a significant improvement in scores this year, with the top-box score improving by close to 8%, thereby improving the average score across the sample from 75.4% to 77.1%.
Figure 3.1: Performance leadership scores 2010–2011
Practiced throughout and improvements made
Practiced across most of organization
Practiced only in parts of organization
Fully practiced and continuously refined
Just started
Not in place
2010
2011
5%0%
20%
28%
51%
46%
19%
18%
8%
3%
3%
4%
1%

43
While scores for performance leadership were lower than for areas like corporate integrity, they were higher than for areas such as people leadership and application of technology and knowledge.
3. Performance leadership
Overall organization results and comparative performance
Integrity and corporate governance
Innovation of products and services
External relationships
Application of technology and knowledge
Organization capability
Financial management
People leadership
Performance leadership
Visionary and strategic leadership
5% 3%
3%
15%
3%
21% 43% 27%
43% 37%4%
4%
3% 45% 30%
50% 23% 23%
47% 25% 25%
4%
3% 20%4%
50% 26% 26%
46% 28% 28%
49% 25% 25%
49% 22% 22%
3% 16%4%
3% 18%4%
3% 17%4%
6% 19%4%
4% 18%4%
50% 28%
13%
17%
30%
Excellent
Very good
Good
Improving trends
Early stages
No/poor results
2%
1%
1%
1%
1%
1%
2%
Figure 3.2: Performance across different categories

44 2011 Management Capability Index – India
RESULTS BY INDUSTRY•Organizations in the more traditional industries such as energy, manufacturing and banking performed
better in the category of providing visionary and strategic leadership.
•Organizations in energy performed especially well in this category, while those in education/academia performed poorly on this front.
Figure 3.3: Performance leadership scores by industry
Type of organization (with more than 25 respondents)
Energy IT and telecom-munications
Manufacturing Banking and finance
Education/academia
All
Fully practiced; continually refined and improved
48% 28% 28% 22% 13% 28%
Practiced consistently with further improvements made
33% 44% 48% 52% 59% 46%
Practiced across most of the organization, most of the time
11% 16% 19% 22% 20% 18%
Practiced across part of the organization, part of the time
0% 0% 0% 4% 4% 3%
Just started 4% 0% 1% 0% 1% 1%
No results/poor results 4% 12% 4% 0% 1% 4%
Figure 3.4: Performance leadership by age of organization
Less than5 years
5−24years
25−49years
50+ years
4.1
3.6
2.9
4.0
Average score=3.9
RESULTS BY AGE AND TYPE OF ORGANIzATION•On the whole, older organizations (more than 25 years old) performed better than younger companies
did (see figure 3.5).
Some differences were apparent in the performances of the different types of organizations within the performance leadership parameter.
•Larger organizations, such as government agencies, LLOs and MNCs, showed a marked improvement in ratings.
•The ratings of SMEs remained low – less than one-fifth of SME organizations say that performance leadership is practiced fully/consistently across their organization.

453. Performance leadership
OTHER CONCLUSIONSGoing back to the three attributes of performance leadership, we see the following outcomes:
Setting challenging performance objectives
•Despite some improvement in scores on leading achievement of challenging goals while managing risk, absolute scores remained moderate – less than a quarter the sample gave their organization top-box scores on this aspect.
Figure 3.5: Performance leadership scores by organization type
Governmentagencies
LLOs MNCs SMEs Others
2011201020112010201120102011201020112010
Excellent Very good Good Improving trends Early stages No/poor results
7%
29%
29%
21%
14%
58%
26%
11%
5%
20%
37%
8%
6% 6%
29%
35%
43%
13%
2%1%
16%
41%
33%
7%
3% 3%
29%
53%
15%
19%
39%
23%
19%
24%
48%
20%
5%1%2%
29%
41%
16%
11%
11%
4%
19%
47%
23%

46 2011 Management Capability Index – India
Figure 3.6 Score on distribution – setting challenging performance targets
Leads achievement of challenging goals while managing risk
Balances risk with achievement
25%38%23%8%6%
21%41%27%5%5% 2%
17%37%28%12%5%
23%48%20%4%4%1%
1%
2011
2010
2011
2010
Track record of consistently meeting performance objectives
•The organizations surveyed performed better in meeting performance and growth goals with close to one-third of the sample rating themselves in the top box. Compared with the 2010 results, scores in this dimension remained largely unchanged.
Figure 3.7: Score on dimension – focusing on and achieving targets set
Consistently meets its performance goals
Has track record of growth and continuously improving performance
23%41%22%9%
27%48%17%3%
32%42%17%6%
34%44%15%2%2011
2010
2011
2010
1%
1%
4%
4%
3%
1%4%
Organization focus and commitment towards achieving performance objectives
•There was a significant decline in the performance of organizations in the category of being goal- and performance-focused.
•However, despite the reduction in scores, focus towards achieving performance objectives remained an area of comparative strength in comparison with setting challenging goals.

473. Performance leadership
IN SUMMARY•Performance-oriented leadership remained an important driver of overall MCI, with a contribution of 10%.
•There was marginal improvement in scores this year and performance-oriented leadership continued to be an area of relative strength for Indian organizations.
•Older, more established organizations – especially those in traditional industries such as energy – scored higher in this parameter. Understandably, educational/academic institutions fared the weakest in this area.
•Within the different dimensions defining performance orientation, organizations performed comparatively better in the area of focusing on and delivering objectives once they have been set.
•Results were relatively weaker for setting goals that are challenging enough and balancing risk with achievement.
Recent management research suggests a healthy correlation between a firm’s performance and the leadership team’s emotional quotient. While many organizations successfully meet the wired frameworks of performance, the differentiation between long-term sustainable performance and short-term bursts of success is how leadership teams exemplify emotional maturity and heightened self-awareness. A leader is the most critical reserve of discretionary energy an organization has and the one that has a lasting impact on how teams and processes deliver.
Figure 3.8: Score distribution – performance targets and achieving them
40%33%21%4%
17% 49%2%
Strongly goal-, performance- and achievement-focused
2011
2010
28%
3%
3%1%

48 2011 Management Capability Index – India48 2011 Management Capability Index – India2011 Management Capability Index – India48

49
The dimension of people leadership focuses on the results-oriented culture of an organization. People leadership outweighs most factors in terms of its ability to create a culture of growth and innovation. It is also the parameter with the maximum multiplier effect, both of operational and strategic measures.
Providing people-oriented leadership is critical to the overall management perception of an organization. This category has a weighting of 10% in driving overall MCI score.
This parameter comprises attributes that straddle the dimensions of owning a consistent and holistic human resource (HR) plan, and fostering a people-friendly culture in the organization.
People leadership is measured through two underlying parameters:
Having a holistic human resource plan
•The organization attracts, retains and motivates people to create an effective team capable of achieving organizational objectives.
•Human resource planning is an integral part of the annual business planning process.
Fostering a people-oriented culture
•Managers act as role models and are committed to developing subordinates and to leading people effectively.
•The organization is strong on empowerment; it allows scope for people to grow.
•The culture supports diversity in all aspects; it is not stifled by structure and hierarchy.
•Managers are able to work effectively with, and achieve results through, a diverse range of people.
•The organization has a stimulating culture.
To understand the performance of different types of organizations on people-oriented leadership, they have been rated on the following six-point scale:
4. PEOPLE LEADERShIP
Scale point Numeric score Scale point description
5 100 Yes, fully practiced throughout the organization. Continually refined and improved as “the way things are done around here”
4 80 Yes, practiced consistently across the organization with further improvements being made
3 60 Yes, practiced across most of the organization most of the time
2 40 Yes, practiced, but only in parts of the organization, part of the time
1 20 Yes, has just started
0 0 No, is not in place
4. People leadership 49
50 2011 Management Capability Index – India
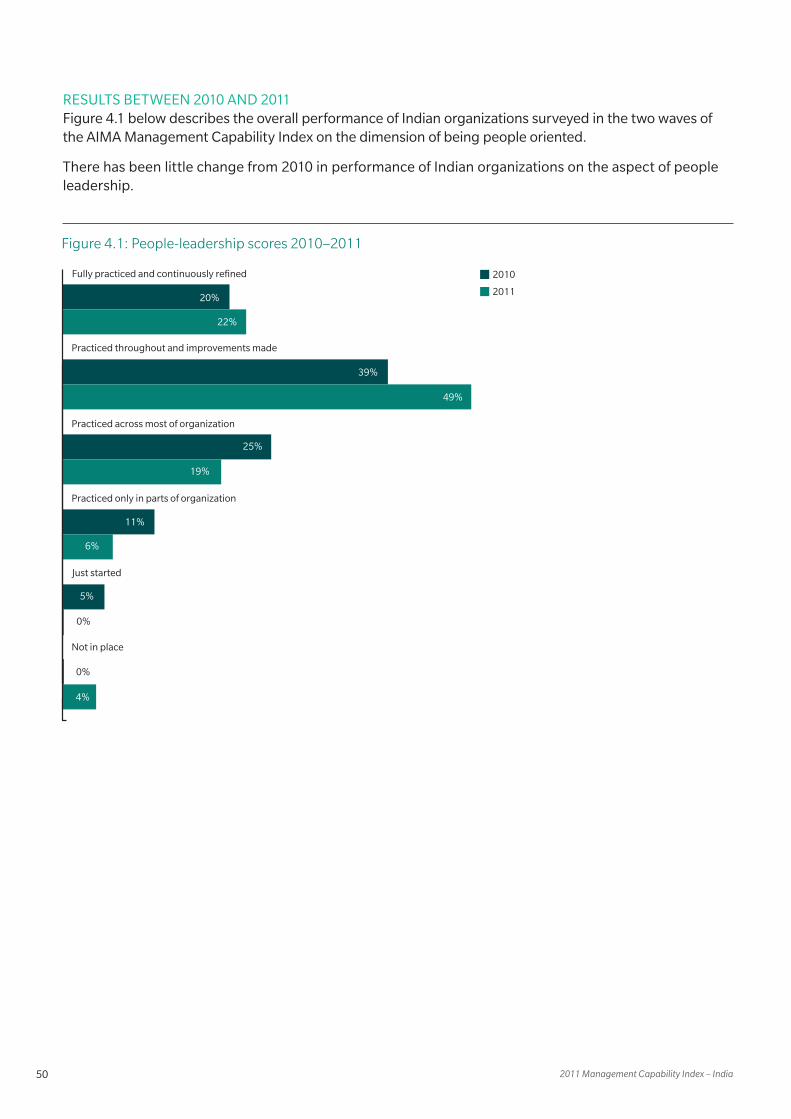
RESULTS BETWEEN 2010 AND 2011Figure 4.1 below describes the overall performance of Indian organizations surveyed in the two waves of the AIMA Management Capability Index on the dimension of being people oriented.
There has been little change from 2010 in performance of Indian organizations on the aspect of people leadership.
Figure 4.1: People-leadership scores 2010–2011
Practiced throughout and improvements made
Practiced across most of organization
Practiced only in parts of organization
Fully practiced and continuously refined
Just started
Not in place
2010
2011
5%0%
20%
22%
39%
49%
25%
19%
11%
6%
5%
0%
4%

514. People leadership
People leadership continued to remain one of the weakest areas of performance for Indian organizations. Only one out five organizations rated themselves in the top box on this front (see figure 4.2).
Overall organization results and comparative performance
Integrity and corporate governance
Innovation of products and services
External relationships
Application of technology and knowledge
Organization capability
Financial management
People leadership
Performance leadership
Visionary and strategic leadership
5% 3%
3%
15%
3%
21% 43% 27%
43% 37%4%
4%
3% 45% 30%
50% 23% 23%
47% 25% 25%
4%
3% 20%4%
50% 26% 26%
46% 28% 28%
49% 25% 25%
49% 22% 22%
3% 16%4%
3% 18%4%
3% 17%4%
6% 19%4%
4% 18%4%
50% 28%
13%
17%
30%
Excellent
Very good
Good
Improving trends
Early stages
No/poor results
2%
1%
1%
1%
1%
1%
2%
Figure 4.2: Performance across different categories
Some differences were apparent between the performances of the different types of organizations within the people-leadership parameter.

52 2011 Management Capability Index – India
RESULTS BY AGE AND ORGANIzATION TYPE
•On the whole, older organizations (more than 25 years old) performed better than younger ones did (see figure 4.5).
Figure 4.4: People leadership scores by age of organization
Less than5 years
5−24years
25−49years
50+ years
3.83.5
3.1
4.0
Average score=3.7
Figure 4.3: People leadership scores by industry
Type of organization (with more than 25 respondents)
Energy IT and telecom-munications
Manufacturing Banking and finance
Education/academia
All
Fully practiced; continually refined and improved
30% 12% 24% 35% 13% 22%
Practiced consistently with further improvements made
41% 64% 59% 26% 52% 49%
Practiced across most of the organization, most of the time
15% 8% 11% 30% 26% 19%
Practiced across part of the organization, part of the time
11% 0% 3% 9% 6% 6%
Just started 0% 4% 0% 0% 0% 0%
No results/poor results 4% 12% 4% 0% 3% 4%
RESULTS BY INDUSTRY
•Organizations in banking performed especially well in this category (see figure 4.3) while those in education/academics and IT performed poorly on this front.

534. People leadership
•Government agencies performed the best on people leadership with more than 40% rating their organizations in the top box – a significant improvement in ratings from last year.
•Ratings of SMEs remained the lowest – less than 15% of SMEs say that performance leadership is practiced fully/consistently across their organization.
Figure 4.5: People leadership scores by organization type
Governmentagencies
LLOs MNCs SMEs Others
2011201020112010201120102011201020112010
Excellent Very Good Good Improving trends Early stages No/poor results
16%
41%
33%
3%
7%
42%
37%
11%
5%
5%
20%
37%
8%
6%
29%
22%
52%
15%
5%
6%
29%
41%
16%
11%
4%
24%
44%
22%
5%
3%
19%
39%
23%
19%
22%
48%
21%
7%
2%
7%
29%
29%
14%
21%
14%
56%
16%
2%
12%
2%

54 2011 Management Capability Index – India
Figure 4.6: holistic hR plan 2010–2011
HR planning integral part of business organization
Attracts, retains and motivates e�ective team
19%39%25%10%6%
20%48%19%7%1%
21%39%10% 24%5%
18%56%16%5%2%
2011
2010
2011
2010
Excellent Very Good Good Improving trends Early stages No/poor results
3%
3%
OTHER CONCLUSIONSGoing back to the two attributes of people leadership, we see the following results:
•Having a holistic HR plan
— There was no improvement in scores for the dimension of HR planning and team building. About one-fifth of the organizations rated themselves in the top box.

554. People leadership
•Fostering a people-oriented culture
— Indian organizations performed relatively better in the category of building a people-oriented culture than they did for having a holistic HR plan.
— Working with organizational diversity and empowering people were areas of relatively better performance, with close to 30% top-box rating in this category.
Figure 4.7: People-oriented culture 2010–2011
Managers act asmentors
Strong onempowerment
Supportsdiversity
Enables peopleto grow
E�ective workingthrough diversity
Stimulatingculture
Excellent Very good Good Improving trends Early stages No/poor results
201120102011201020112010201120102011201020112010
20%
29%
41%
13%
18%
19%
49%
18%
8%
2%8%
25%
35%
14%
4%
21%
30%
41%
18%
7%
1%
21%
31%
25%
16%
5%
32%
41%
21%
2%5%
22%
39%
21%
14%
4%
25%
43%
22%
5%
3%
21%
37%
24%
13%
4%
25%
47%
20%
3%1%
24%
35%
22%
13%
6%
26%
47%
18%
3%1%
4% 4% 4% 4%
IN SUMMARY•People leadership is an important driver of overall MCI, with a contribution of 10%.
•There was little improvement from the 2010 scores in this front – about one-fifth of the sample rated their organizations in the top box for this parameter.
•Government agencies – especially in the energy and banking and finance sectors –performed better in this category than SMEs did.
•Of the different dimensions of people leadership, organizations performed relatively weaker in the categories of having a holistic HR plan and mentoring employees.

56 2011 Management Capability Index – India56 2011 Management Capability Index – India2011 Management Capability Index – India56

57
Providing sound financial management is a critical driver of overall quality of leadership in an organization. This parameter has a weighting of 10% in overall MCI scores.
The individual attributes defining the financial management parameter are:
•Develops and commits to plans and goals that support sound growth and continuing performance improvement.
•Leads and manages the business to consistently achieve or exceed these goals.
•Practices sound and effective financial management of the organization including financial planning, accounting, cash-flow management, investment, financial reporting and liaison with financial institutions.
To understand the performance of different types of organizations on financial management, they have been rated on the following six-point scale:
5. FINANCIAL MANAGEMENT
5. Financial management
Scale point Numeric score Scale point description
5 100 Yes, fully practiced throughout the organization. Continually refined and improved as “the way things are done around here”
4 80 Yes, practiced consistently across the organization with further improvements being made
3 60 Yes, practiced across most of the organization most of the time
2 40 Yes, practiced, but only in parts of the organization, part of the time
1 20 Yes, has just started
0 0 No, is not in place
5. Financial management 57

58 2011 Management Capability Index – India
Figure 5.1: Financial management scores 2010–2011
Practiced consistently across the organizations with further improvements
Practiced across most of the organization most of the time
Practised only in parts of the organization, part of the time
Yes, fully practiced − continually refined and improved
This has just started
No, this is not in place
2010
2011
5%0%
22%
26%
45%
50%
18%
16%
12%
3%
1%
4%
3%
RESULTS BETWEEN 2010 AND 2011Figure 5.1 below describes the overall performance of Indian organizations surveyed in the two waves of the AIMA Management Capability Index on the dimension of financial management.
The 2011 results showed some improvement in comparison with the 2010 results. The two top-box ratings improved from 67% to about 76% on overall financial management.

59
Figure 5.2 below shows that financial management remained an area of moderate performance when compared to other dimensions.
5. Financial management
RESULTS BY INDUSTRY
Figure 5.3: Financial management scores by industry
Type of organization (with more than 25 respondents)
Energy IT and telecom-munications
Manufacturing Banking and finance
Education/academia
All
Fully practiced; continually refined and improved
48% 20% 25% 26% 12% 4%
Practiced consistently with further improvements made
41% 44% 63% 43% 49% 0%
Practiced across most of the organization, most of the time
4% 24% 8% 30% 30% 6%
Practiced across part of the organization, part of the time
4% 0% 0% 0% 3% 19%
Just started 0% 0% 0% 0% 4% 49%
No results/poor results 4% 12% 4% 0% 1% 22%
Overall organization results and comparative performance
Integrity and corporate governance
Innovation of products and services
External relationships
Application of technology and knowledge
Organization capability
Financial management
People leadership
Performance leadership
Visionary and strategic leadership
5% 3%
3%
15%
3%
21% 43% 27%
43% 37%4%
4%
3% 45% 30%
50% 23% 23%
47% 25% 25%
4%
3% 20%4%
50% 26% 26%
46% 28% 28%
49% 25% 25%
49% 22% 22%
3% 16%4%
3% 18%4%
3% 17%4%
6% 19%4%
4% 18%4%
50% 28%
13%
17%
30%
Excellent
Very good
Good
Improving trends
Early stages
No/poor results
2%
1%
1%
1%
1%
1%
2%
Figure 5.2: Performance across different categories

60 2011 Management Capability Index – India
RESULTS BY AGE AND ORGANIzATION TYPESome differences were apparent between the performances of different types of organizations in the category of financial management.
•Government agencies and LLOs performed better on financial management than SMEs and MNCs did.
•Older, more traditional organizations such as those in the energy, manufacturing and banking sectors scored higher than organizations in newer industries did.
Figure 5.4: Financial management scores by organization type
Governmentagencies
LLOs MNCs SMEs Others
2011201020112010201120102011201020112010
Excellent Very good Good Improving trends Early stages No/poor results
14%
36%
29%
7%
14%
53%
26%
11%
5%
5%
22%
47%
8%
4%
18%
33%
48%
12%
1%
28%
45%
19%
9%
20%
68%
8%
19%
42%
16%
23%
25%
47%
19%
5%1%
20%
46%
16%
11%
7%
14%
62%
8%
2%
6% 4%
14%
3%

61
OTHER CONCLUSIONSGoing back to the two attributes of financial management, we see the following results.
•There was a significant decline in scores on developing growth-oriented financial plans.
•Achievement of these plans remained an area of concern, with only 19% of organizations scoring top-box ratings on this front.
IN SUMMARY•Financial management is an important driver of overall MCI, with a contribution of 10%.
•There was some improvement from the 2010 scores in this front; about a quarter of the sample rated their organizations in the top box for this category. When compared to other areas, financial management remains an area of moderate performance.
•Government agencies and LLOs – especially organizations in the energy sector – performed better in this category than SMEs did.
•Of the different attributes, organizations performed comparatively worse on developing and achieving growth-centric plans. Indian organizations performed relatively better in areas such as maintaining sound financial systems like cash flow, financial accounting, and so on.
5. Financial management
Figure 5.5: Financial management attributes 2010–2011
Excellent Very good Good Improving trends Early stages No/poor results
25%
55%
19% 18% 19% 25% 25%
50%
18%
40%
22%
9%
52%
21%
3%
43%
25%
11%
39%
26%
7% 5%
2% 3% 3%1%
3% 1%
16%
Plans/goals supportsound growth and
continuous improvementConsistently achieves or
exceeds these goals
Has sound e�ective financialmanagement systems like
financial accounting, cash flow
201120102011201020112010
1%4% 4% 4%

62 2011 Management Capability Index – India62 2011 Management Capability Index – India2011 Management Capability Index – India62

63
Innovating products and services is a critical aspect of providing able leadership to an organization and this parameter has a weighting of 10% in driving the overall MCI scores.
Innovation of products and services is measured through two underlying parameters:
Recognizing the need for innovation
•The organization recognizes that innovation is important for all aspects of the business and for all its processes – innovation is part of the organization’s culture.
•The organization recognizes that innovation creates new dimensions of performance.
Encouraging innovation and practicing the same
•The organization has a climate that encourages innovation in products and services.
•The organization practices innovation to create new value for the business, customers and shareholders.
•The organization practices innovation to expand its market and increase its market share.
To understand the performance of different types of organizations on innovation of products and services, they have been rated on the following six-point scale:
6. INNOVATION OF PRODUCTS AND SERVICES
Scale point Numeric score Scale point description
5 100 Yes, fully practiced throughout the organization. Continually refined and improved as “the way things are done around here”
4 80 Yes, practiced consistently across the organization with further improvements being made
3 60 Yes, practiced across most of the organization most of the time
2 40 Yes, practiced, but only in parts of the organization, part of the time
1 20 Yes, has just started
0 0 No, is not in place
6. Innovation of products and services 63

64 2011 Management Capability Index – India
Figure 6.1: Innovation scores 2010–2011
Practiced throughout and improvements made
Practiced across most of organization
Practiced only in parts of organization
Fully practiced and continuously refined
Just started
Not in place
2010
2011
5%0%
24%
22%
39%
43%
26%
21%
7%
3%
3%
1%
4%
RESULTS BETWEEN 2010 AND 2011Figure 6.1 below describes the overall performance of the Indian organizations surveyed in the two waves of the AIMA Management Capability Index on the dimension of being innovative.
There was some improvement from 2010 in the performance of Indian organizations on the aspect of innovation: the two top-box ratings improved from 63% to about 70%.

656. Innovation of products and services
When compared to other dimensions, innovation of products and services remained an area of moderate performance. While performance was better than that for people management, it is still not as strong as in areas such as integrity and corporate governance.
Overall organization results and comparative performance
Integrity and corporate governance
Innovation of products and services
External relationships
Application of technology and knowledge
Organization capability
Financial management
People leadership
Performance leadership
Visionary and strategic leadership
5% 3%
3%
15%
3%
21% 43% 27%
43% 37%4%
4%
3% 45% 30%
50% 23% 23%
47% 25% 25%
4%
3% 20%4%
50% 26% 26%
46% 28% 28%
49% 25% 25%
49% 22% 22%
3% 16%4%
3% 18%4%
3% 17%4%
6% 19%4%
4% 18%4%
50% 28%
13%
17%
30%
Excellent
Very good
Good
Improving trends
Early stages
No/poor results
2%
1%
1%
1%
1%
1%
2%
Figure 6.2: Performance across different categories

66 2011 Management Capability Index – India
Figure 6.3: Innovative products/services scores by industry
Type of organization (with more than 25 respondents)
Energy IT and telecom-munications
Manufacturing Banking and finance
Education/academia
All
Fully practiced; continually refined and improved
44% 32% 35% 30% 14% 27%
Practiced consistently with further improvements made
30% 32% 44% 48% 55% 43%
Practiced across most of the organization, most of the time
15% 16% 13% 22% 23% 21%
Practiced across part of the organization, part of the time
7% 8% 4% 0% 4% 3%
Just started 0% 0% 0% 0% 1% 1%
No results/poor results 4% 12% 4% 0% 1% 4%
RESULTS BY AGE AND TYPE OF ORGANIzATION•In general, older organizations tended to perform better on this front than the younger organizations did.
However, the extent of the difference is less than that in other dimensions.
Figure 6.4: Innovation of products and services scores by age of organization
Less than5 years
5−24years
25−49years
50+ years
3.93.6
3.2
3.9
Average score=3.8
Some differences were apparent between performances of different types of organizations on this parameter.
RESULTS BY INDUSTRY•Organizations in energy, manufacturing, and IT and telecommunications scored higher than others in
terms of innovative culture.

67
•LLOs and MNCs scored better on being innovative. In comparison, government agencies continued to score poorly on this front.
Figure 6.5: Innovative products scores by organization type
Governmentagencies
LLOs MNCs SMEs Others
Excellent Very good Good Improving trends Early stages No/poor results
2011201020112010201120102011201020112010
21%
29%
21%
7%
14%
21%
53%
16%
5%
26%
22%
3%
48%
27%
44%
20%
5%
3%
27%
41%
24%
4%
34%
40%
16%
2%
5%
23%
23%
39%
13%
25%
45%
23%
3%
2%
21%
39%38%
27%
9%
24%
62%
24%
2%
12%8%
5% 4%
3%
4% 3%1%
6. Innovation of products and services

68 2011 Management Capability Index – India
OTHER CONCLUSIONSGoing back to the two attributes of innovation, we see the following results.
•Recognizing the need for innovation
•Encouraging innovation and practicing the same
— Organizations performed particularly poorly on recognizing the need for innovation and creating a conducive climate for innovation – on both fronts scores weakened further, with only 18% rating their organisations in the top box.
— Organizations performed slightly better on practicing innovation to expand market and improve market share.
Figure 6.6: Recognizes the need for innovation 2010–2011
Recognizes innovation; important for all business aspects
Recognizes innovation; creates new performance dimension
2011
2010
2011
2010
28%40%23%5%
25%47%7%1%4%
27%39%22%7%
18%51%19%7%4%
Excellent Very Good Good Improving trends Early stages No/poor results
5%
1%
3%
2%

69
IN SUMMARY•Innovation of products and services is an important driver of overall MCI, with a contribution of 10%.
•Despite some improvement, overall performance of Indian organizations on this front remained moderate, with about a quarter of the sample rating themselves in the top box on this front.
•MNCs and LLOs – especially organizations in the energy and manufacturing sectors – appeared to perform better on this aspect than government agencies.
•While Indian organizations realize the potential of innovation to expand their market and improve market share, they performed poorly in terms of recognizing the need for innovation across the organization and creating an innovation-friendly culture.
Figure 6.7: Creating conducive climate and practicing innovation 2010–2011
Excellent Very good Good Improving trends Early stages No/poor results
Climate in organizationencourages innovation
Practices innovation to createnew value for business
Practices innovation to expand market
201120102011201020112010
27% 30%
43%
19%
3%
4%
38%
23%
8%
1%
22% 26%
44%
18%
5%
4%
46%
21%
8%
29%
37%
25%
6%
18%
54%
21%
2%
4%3%1%
5%1% 4% 1%
Innovation is like the butterfly, which may breeze into your garden when it wants, but there is no way to keep it there through your own will. It is a challenge that organizations are learning to address as they figure out that innovation may not come from the place they want or the way they would like it to. A traditional organization has expected innovation to be a top-down phenomenon, but now organizations are making efforts to seek innovation where is grows organically – external ecosystems, incubators, creative projects, scientific research and conversations.
6. Innovation of products and services

70 2011 Management Capability Index – India70 2011 Management Capability Index – India2011 Management Capability Index – India70

71717. Organizational capability
The capability of an organization has a weighting of 5% in driving overall MCI scores. The different dimensions defining this parameter are:
•The organization is fully capable, has a culture of innovation and research, and is dedicated to continuous improvement.
•The organization is “boundary-less” and the structure is non-hierarchical.
•It has an effective balance of both team and individual work as needed.
•There is a sound understanding and effective application of best management practices to achieve organizational goals and objectives within the company.
•There is a strong commitment to continuous learning for both individuals and the organization itself.
To understand performance of different types of organizations on organizational capability, they have been rated on the following six-point scale:
7. ORGANIZATIONAL CAPABILITY
Scale point Numeric score Scale point description
5 100 Yes, fully practiced throughout the organization. Continually refined and improved as “the way things are done around here”
4 80 Yes, practiced consistently across the organization with further improvements being made
3 60 Yes, practiced across most of the organization most of the time
2 40 Yes, practiced, but only in parts of the organization, part of the time
1 20 Yes, has just started
0 0 No, is not in place

72 2011 Management Capability Index – India
Figure 7.1: Organization capability scores 2010–2011
Practiced throughout and improvements made
Practiced across most of organization
Practiced only in parts of organization
Fully practiced and continuously refined
Just started
Not in place
2010
2011
5%0%
19%
25%
40%
47%
26%
20%
9%
3%
5%
1%
4%
RESULTS BETWEEN 2010 AND 2011Figure 7.1 below describes the overall performance of Indian organizations surveyed in the two waves of the AIMA Management Capability Index on the dimension of organizational capability.
There was marked improvement from 2010 on the performance of Indian organizations in the category of organizational capability. The two top-box ratings improved from 59% to about 72% on this front.

73
When compared to other dimensions, organization capability emerges as an area of moderate performance. While performance improved from 2010, it still is not in the same league as performance on external relationships and integrity/corporate governance.
7. Organizational capability
Overall organization results and comparative performance
Integrity and corporate governance
Innovation of products and services
External relationships
Application of technology and knowledge
Organization capability
Financial management
People leadership
Performance leadership
Visionary and strategic leadership
5% 3%
3%
15%
3%
21% 43% 27%
43% 37%4%
4%
3% 45% 30%
50% 23% 23%
47% 25% 25%
4%
3% 20%4%
50% 26% 26%
46% 28% 28%
49% 25% 25%
49% 22% 22%
3% 16%4%
3% 18%4%
3% 17%4%
6% 19%4%
4% 18%4%
50% 28%
13%
17%
30%
Excellent
Very good
Good
Improving trends
Early stages
No/poor results
2%
1%
1%
1%
1%
1%
2%
Figure 7.2: Performance across different categories

74 2011 Management Capability Index – India
RESULTS BY AGE AND ORGANIzATION TYPE•In general, older organizations tended to perform better on this front than the newer organizations did.
Figure 7.4: Organization capability scores by age of organization
Less than5 years
5−24years
25−49years
50+ years
3.93.5
3.1
3.8
Average score=3.8
Figure 7.3: Organization capability scores by industry
Type of organization (with more than 25 respondents)
Energy IT and telecom-munications
Manufacturing Banking and finance
Education/academia
All
Fully practiced; continually refined and improved
44% 36% 27% 35% 14% 25%
Practiced consistently with further improvements made
37% 28% 53% 39% 48% 47%
Practiced across most of the organization, most of the time
7% 24% 13% 22% 32% 20%
Practiced across part of the organization, part of the time
4% 0% 1% 4% 4% 3%
Just started 4% 0% 1% 0% 0% 1%
No results/poor results 4% 12% 4% 0% 1% 4%
Some differences were apparent between performances of different types of organizations on this parameter.
RESULTS BY INDUSTRY•Organizations in the energy, banking and finance, and IT and telecommunications sectors scored
higher than others in terms of organization capability.

757. Organizational capability
•Larger organizations, such as government agencies and LLOs, performed better than smaller entities did on organization capability.
Figure 7.5: Organization capability scores by organization type
Governmentagencies
LLOs MNCs SMEs Others
Excellent Very good Good Improving trends Early stages No/poor results
29%
21%
3%
7%
29%
37%
37%
16%
5%
5%
16%
24%
12%
4%
43%
32%
46%
13%
1%1%
16%
47%
31%
5%1%
24%
49%
19%
5%
16%
39%
23%
19%
3%
23%
47%
23%
4%1%
25%
38%
25%
5%
2%
21%
47%
21%
2011201020112010201120102011201020112010
7%3%
11%
2%
OTHER CONCLUSIONSGoing back to the underlying attributes of organizational capability, we see the following outcomes:
•Organizations performed particularly poorly in the area of having a boundary-less, non-hierarchical structure.
•When compared to 2010, scores for having a culture of innovation and research also weakened.
•In contrast, scores picked up for understanding best management practices and commitment to individual and organizational learning.

76 2011 Management Capability Index – India
IN SUMMARY•Organization capability is an important driver of overall MCI with a contribution of 5%.
•Despite some improvement, the overall performance of Indian organizations on this front remained moderate with about a quarter of the sample rating themselves in the top box in this category.
•MNCs and LLOs – especially organizations in the energy and manufacturing sectors – appeared to perform better in this aspect than government agencies did.
23%
25%
26%
28%
25%
22%
Excellent Very good Good Improving trends Early stages No/poor results
2011
2010
2011
2010
2011
2010
2011
2010
2011
2010
Fully capable; has a culture of innovation and research
Boundary-less, non-hierarchical structure
E�ective balance of both team and individual work
Sound understanding and application of best management practices
Strong commitment to continuous learning of both individual and organization
5% 10%
14%
20%
4%
30% 28% 15%
53% 19%4%
5%
7% 46% 13%
41% 17%
50% 19%
6%
4% 21%4%
40% 15%
45% 16%
43% 16%
45% 23%
12% 27%6%
10% 24%5%
7% 19%4%
5% 22%4%
10% 27%5%
38% 27%
19%
25%
8%
1%
3%
2%
1%
1%
Figure 7.6: Individual attributes defining organizational capability 2010–2011
Democratization of performance is the emerging mantra of organizational capability. Success is not a preserve of any process, people or context anymore. A high performing organization manages to create a valuable experience for the customer, to keep it simple, to stay relevant and to stay cognizant of contextual frameworks. Business success has moved out from the simplistic preserve of pure play economic value and moved into the realm of a consumer’s mind. Information-consuming, self-motivated, global consumers are fundamentally altering the way organizations deliver and map performance.
2011 Management Capability Index – India76

7777

78 2011 Management Capability Index – India78 2011 Management Capability Index – India2011 Management Capability Index – India78

798. Application of technology and knowledge 79
Effectively applying technology and being knowledge-driven is a critical driver of overall leadership in an organization and this parameter has a weighting of 5% in driving the overall MCI scores.
Application of technology and knowledge is measured through three underlying parameters:
•The organization is able to exploit information technology and is knowledge-driven.
•People in the organization understand the impact of technology on an organization and on work itself.
•People in the organization understand the value and application of knowledge in the organization and demonstrate effective knowledge and information management.
To understand performance of different types of organizations on application of technology and knowledge, they have been rated on the following six-point scale:
8. APPLICATION OF TEChNOLOGY AND kNOWLEDGE
Scale point Numeric score Scale point description
5 100 Yes, fully practiced throughout the organization. Continually refined and improved as “the way things are done around here”
4 80 Yes, practiced consistently across the organization with further improvements being made
3 60 Yes, practiced across most of the organization most of the time
2 40 Yes, practiced, but only in parts of the organization, part of the time
1 20 Yes, has just started
0 0 No, is not in place

80 2011 Management Capability Index – India
Figure 8.1: Overall applying technology and knowledge scores 2010–2011
Practiced throughout and improvements made
Practiced across most of organization
Practiced only in parts of organization
Fully practiced and continuously refined
Just started
Not in place
2010
2011
5%0%
18%
23%
44%
50%
27%
18%
7%
4%
3%
1%
4%
RESULTS BETWEEN 2010 AND 2011Figure 8.1 below is based on the ratings of the organizations surveyed on the aspect of effectively applying technology and knowledge.
There was some improvement from 2010 in the performance of Indian organizations on this front. The two top-box ratings improved from 62% to about 73% in this category.

81
Despite some improvement on last year, application of knowledge and technology continued to remain an area of relative under-performance for Indian organizations compared to other dimensions.
Less than one in five of the organizations surveyed rated themselves in the top box for this parameter. This rating is similar to other areas of weakness, such as people leadership.
8. Application of technology and knowledge
Overall organization results and comparative performance
Integrity and corporate governance
Innovation of products and services
External relationships
Application of technology and knowledge
Organization capability
Financial management
People leadership
Performance leadership
Visionary and strategic leadership
5% 3%
3%
15%
3%
21% 43% 27%
43% 37%4%
4%
3% 45% 30%
50% 23% 23%
47% 25% 25%
4%
3% 20%4%
50% 26% 26%
46% 28% 28%
49% 25% 25%
49% 22% 22%
3% 16%4%
3% 18%4%
3% 17%4%
6% 19%4%
4% 18%4%
50% 28%
13%
17%
30%
Excellent
Very good
Good
Improving trends
Early stages
No/poor results
2%
1%
1%
1%
1%
1%
2%
Figure 8.2: Performance across different categories

82 2011 Management Capability Index – India
Figure 8.4: Application of technology and knowledge scores by age of organization
Less than5 years
5−24years
25−49years
50+ years
3.93.6
3.4
3.9
Average score=3.8
RESULTS BY AGE AND ORGANIzATION TYPE•In general, older organizations tended to perform better on this front than the newer organizations did.
Figure 8.3: Application of technology and knowledge scores by industry
Type of organization (with more than 25 respondents)
Energy IT and telecom-munications
Manufacturing Banking and finance
Education/academia
All
Fully practiced; continually refined and improved
33% 12% 21% 39% 19% 23%
Practiced consistently with further improvements made
48% 56% 59% 35% 59% 50%
Practiced across most of the organization, most of the time
11% 16% 12% 26% 19% 18%
Practiced across part of the organization, part of the time
0% 4% 3% 0% 1% 4%
Just started 4% 0% 1% 0% 0% 1%
No results/poor results 4% 12% 4% 0% 1% 4%
Some differences were apparent between performances of different types of organizations within the application of technology and knowledge parameter.
RESULTS BY INDUSTRY•Organizations in the banking and finance sector seemed to be particularly good in applying knowledge
and technology with close to 40% of the sample rating themselves in the top box.

838. Application of technology and knowledge
•Government agencies fared better in this category, with close to half the sample surveyed rating their organization in the top box. In contrast, SMEs performed the poorest, with a significant decline in ratings from 2010.
Figure 8.5: Application of technology and knowledge scores by organization type
Governmentagencies
LLOs MNCs SMEs Others
Excellent Very good Good Improving trends Early stages No/poor results
2011201020112010201120102011201020112010
21%
36%
7%
21%
14%
47%
32%
21%
16%
20%
10%
4%
49%
26%
52%
12%
5%
16%
52%
29%
2%2%
22%
56%
17%
2%
16%
29%
42%
10%
3%
20%
49%
16%
11%
1%
23%
43%
25%
5%
4%
14%
35%
40%
5%3%
11%
3%

84 2011 Management Capability Index – India
OTHER CONCLUSIONSGoing back to the three attributes of application of technology and knowledge, we see the following outcomes:
•There was little difference in performance across each individual attribute – close to one-fifth of the sample rated themselves in the top box on the different parameters.
•When compared to last year, there was some decline in ratings on the attributes of understanding the impact of technology and exploiting knowledge effectively.
Figure 8.6: Attributes defining application of technology and knowledge 2010–2011
Excellent Very good Good Improving trends Early stages No/poor results
Exploits technology/innovation and is
knowledge driven
Understands impact oftechnology on an organization
and on work itself
Understands the value andapplication of knowledge in anorganization and demostrates
e�ective knowledge andinformation management
201120102011201020112010
17% 21%
51%
19%
5%
4%2%
41%
33%
5%
24% 19%
39%
18%
5%
2% 4%
53%
27%
7%
25%
39%
25%
7%
20%
54%
17%
4%
4%4%1% 1% 1%

85
IN SUMMARY•Effectively applying technology and knowledge is an important driver of overall MCI with a weighting of
5% towards overall ratings.
•Despite some improvement, this category remained an area of underperformance when compared with other dimensions. Less than one-fifth of the sample rated themselves in the top box on this front.
•Government agencies – especially organizations in the banking and finance sector – performed well on this aspect. In contrast, newer organizations and SMEs performed poorly.
•There is little difference in the performance of Indian organizations on the different individual attributes constituting this dimension. When compared to last year, there was some decline in ratings on the attributes of understanding the impact of technology and exploiting knowledge effectively.
The digital imperative: There is hardly any application of skill or knowledge today that is not supported or built on the digital economy. The “binary-fication” of commerce and services means that the delivery of goods and services is significantly dependent on how the digital curve is scaled by organizations. The process has also eliminated traditional barriers in adopting newer methods and techniques in business, but has also meant that the divide is growing between the fast-moving digital natives and the traditionalists.
8. Application of technology and knowledge

86 2011 Management Capability Index – India86 2011 Management Capability Index – India2011 Management Capability Index – India86

87
Successful organizations maintain effective external relationships in addition to driving an internal, “within-organization” focus. This parameter has a weighting of 5% in driving the overall MCI scores.
The category of external relationships is measured through four underlying parameters:
•The organization has developed and maintains effective networks and spheres of influence.
•The organization has a positive external image through the building of effective relationships with all stakeholders, including members, customers and suppliers.
•The organization has a positive external image through the fulfillment of community and social obligations.
•The organization practices corporate social responsibility.
To understand the performance of different types of organizations in the category of external relationships, they have been rated on the following six-point scale:
9. EXTERNAL RELATIONShIPS
Scale point Numeric score Scale point description
5 100 Yes, fully practiced throughout the organization. Continually refined and improved as “the way things are done around here”
4 80 Yes, practiced consistently across the organization with further improvements being made
3 60 Yes, practiced across most of the organization most of the time
2 40 Yes, practiced, but only in parts of the organization, part of the time
1 20 Yes, has just started
0 0 No, is not in place
9. External relationships 87

88 2011 Management Capability Index – India
Figure 9.1: External relationships scores 2010–2011
Practiced throughout and improvements made
Practiced across most of organization
Practiced only in parts of organization
Fully practiced and continuously refined
Just started
Not in place
2010
2011
5%0%
29%
30%
32%
45%
22%
17%
8%
3%
2%
1%
4%
RESULTS BETWEEN 2010 AND 2011Figure 9.1 is based on the ratings of the organizations surveyed on the dimension of maintaining effective external relationships.
There was some improvement from 2010 in the performance of Indian organizations on this front, with the two top-box ratings improving from 61% to about 75%.

899. External relationships
External relationship management remained an area of relatively strong performance for Indian organizations – next to only integrity and corporate governance in terms of top-box ratings.
Overall organization results and comparative performance
Integrity and corporate governance
Innovation of products and services
External relationships
Application of technology and knowledge
Organization capability
Financial management
People leadership
Performance leadership
Visionary and strategic leadership
5% 3%
3%
15%
3%
21% 43% 27%
43% 37%4%
4%
3% 45% 30%
50% 23% 23%
47% 25% 25%
4%
3% 20%4%
50% 26% 26%
46% 28% 28%
49% 25% 25%
49% 22% 22%
3% 16%4%
3% 18%4%
3% 17%4%
6% 19%4%
4% 18%4%
50% 28%
13%
17%
30%
Excellent
Very good
Good
Improving trends
Early stages
No/poor results
2%
1%
1%
1%
1%
1%
2%
Figure 9.2: Performance across different categories

90 2011 Management Capability Index – India
Figure 9.3: Maintaining external relationships scores by industry
Type of organization (with more than 25 respondents)
Energy IT and telecom-munications
Manufacturing Banking and finance
Education/academia
All
Fully practiced; continually refined and improved
48% 28% 29% 26% 16 % 30%
Practiced consistently with further improvements made
37% 44% 45% 52% 54% 45%
Practiced across most of the organization, most of the time
7% 16% 19% 22% 23% 17%
Practiced across part of the organization, part of the time
4% 0% 1% 0% 3% 3%
Just started 0% 0% 1% 0% 3% 1%
No results/poor results 4% 12% 4% 0% 1% 4%
RESULTS BY INDUSTRYSome differences were apparent between the performances of different types of organizations within the maintaining external relationships parameter.
•There was significant improvement among government agencies, especially those in the energy sector, in terms of ratings on maintaining external relationships. More than half the government agencies interviewed rated themselves in the top box on this parameter.
RESULTS BY AGE AND ORGANIzATION TYPE•SMEs continued to perform the worst on maintaining external relationships – their performance
weakened in 2011 when compared to last year.
•In general, older organizations performed better on maintaining external relationships, especially those over 25 years old.
Figure 9.4: Maintaining external relationships scores by age of organization
Less than5 years
5−24years
25−49years
50+ years
3.93.6
3.4
3.9
Average score=3.8

91
Figure 9.5: Maintaining external relationships scores by organization type
Governmentagencies
LLOs MNCs SMEs Others
Excellent Very good Good Improving trends Early stages No/poor results
21%
21%
7%
14%
36%
53%
37%
32%
5%
11%
37%
22%
6%
2%
33%
37%
43%
12%
2%1%
31%
40%
21%
9%
31%
41%
24%
2%
29%
32%
26%
13%
29%
46%
18%
4%1%
23%
48%
18%
4%
5%
16%
53%
14%
2%2%
2011201020112010201120102011201020112010
5% 2% 2%
13%
2%
9. External relationships

92 2011 Management Capability Index – India
OTHER CONCLUSIONSGoing back to the four attributes of maintaining effective external relationships, we see the following results:
23%
25%
26%
28%
25%
22%
Excellent Very good Good Improving trends Early stages No/poor results
2011
2010
2011
2010
2011
2010
2011
2010
Develops and maintains e�ective networks and spheres of influence
Maintains positive external image through the building of e�ective relationships
Maintains positive image through the fulfilment of community and social obligations
Practices corporate social responsibility
7%
18%
24%
3%
47% 26%
55% 17%4%
6%
3% 52% 22%
40% 27%
49% 26%
4%
4% 15%4%
41% 36%
43% 30%
13%
5% 18%4%
9% 19%
42% 25%
20%
17%
7%
2%
1%
3%
2%
5%
2%
2%
Figure 9.6: Attributes defining maintaining external relationships 2010–2011

93
•Ratings on the individual parameters did not change significantly from last year; there was some dilution in top-box ratings on developing and maintaining effective external networks and spheres of influence.
• Indian organisations performed better on practicing social responsibility, but were relatively weaker on developing effective external networks.
IN SUMMARY•Developing and leveraging effective external relationships is a critical driver of overall leadership
performance with a weighting of 5%.
•This category remained an area of relatively better performance for Indian organizations, next to only corporate integrity and governance. While top-box ratings did not change, the two top-box ratings improved marginally from last year.
•Government agencies – especially organizations in the energy sector – performed better in this category. In contrast, younger organizations and SMEs performed the worst.
•Of the different dimensions, Indian organizations continued to perform the poorest on developing and maintaining external links and spheres of influence. Practicing corporate social responsibility emerges as an area of relatively superior performance.
An organization is known by the relationships it maintains. This was never more true as information travels virally, experiences are shared and perceptions become large masses of amoebic organisms that can only be influenced and not controlled. External relationships for an organization mean fewer distinct boundaries of hierarchy, age and roles, but a larger converged mass of perception carriers.
9. External relationships

94 2011 Management Capability Index – India94 2011 Management Capability Index – India2011 Management Capability Index – India94

95
Integrity and corporate governance is another critical aspect of providing able leadership to an organization and this parameter has a weighting of 5% in driving the overall MCI scores.
This category is measured through five underlying parameters:
•The organization and employees understand ethical principles in making decisions on the organization’s affairs.
•The organization follows ethical rules and procedures in making decisions on the organization’s affairs.
•The organization and employees adhere to legislation, regulations and guidelines in administering its business.
•The organization promotes an established standard of ethical behavior for directors, management and employees based on integrity and a code of proper conduct.
•The organization practices integrity and ethical behavior as being good for long-term business and profitability.
To understand performance of different types of organizations on integrity and corporate governance, they have been rated on the following six-point scale.
10. INTEGRITY AND CORPORATE GOVERNANCE
10. Integrity and corporate governance
Scale point Numeric score Scale point description
5 100 Yes, fully practiced throughout the organization. Continually refined and improved as “the way things are done around here”
4 80 Yes, practiced consistently across the organization with further improvements being made
3 60 Yes, practiced across most of the organization most of the time
2 40 Yes, practiced, but only in parts of the organization, part of the time
1 20 Yes, has just started
0 0 No, is not in place
10. Integrity and corporate governance 95

96 2011 Management Capability Index – India
Figure 10.1: Integrity and corporate governance scores 2010–2011
Practiced throughout and improvements made
Practiced across most of organization
Practiced only in parts of organization
Fully practiced and continuously refined
Just started
Not in place
2010
2011
5%0%
39%
37%
36%
43%
16%
13%
7%
3%
2%
0%
4%
RESULTS BETWEEN 2010 AND 2011Figure 10.1 below reports on the performance of Indian organizations in the dimension of corporate integrity.
The high performance of Indian organizations on this front remained unchanged. Close to 40% of the organizations interviewed stated that corporate integrity is practiced fully and continuously improved.

97
When compared to other areas, integrity and corporate governance remained the area of highest performance.
10. Integrity and corporate governance
Overall organization results and comparative performance
Integrity and corporate governance
Innovation of products and services
External relationships
Application of technology and knowledge
Organization capability
Financial management
People leadership
Performance leadership
Visionary and strategic leadership
5% 3%
3%
15%
3%
21% 43% 27%
43% 37%4%
4%
3% 45% 30%
50% 23% 23%
47% 25% 25%
4%
3% 20%4%
50% 26% 26%
46% 28% 28%
49% 25% 25%
49% 22% 22%
3% 16%4%
3% 18%4%
3% 17%4%
6% 19%4%
4% 18%4%
50% 28%
13%
17%
30%
Excellent
Very good
Good
Improving trends
Early stages
No/poor results
2%
1%
1%
1%
1%
1%
2%
Figure 10.2: Performance across different categories

98 2011 Management Capability Index – India
Figure 10.3: Integrity and corporate governance scores by industry
Type of organization (with more than 25 respondents)
Energy IT and telecom-munications
Manufacturing Banking and finance
Education/academia
All
Fully practiced; continually refined and improved
44% 32% 37% 39% 17% 37%
Practiced consistently with further improvements made
44% 40% 49% 43% 51% 43%
Practiced across most of the organization, most of the time
4% 16% 9% 17% 28% 13%
Practiced across part of the organization, part of the time
4% 0% 0% 0% 1% 3%
Just started 0% 0% 0% 0% 0% 0%
No results/poor results 4% 12% 4% 0% 2% 4%
Some differences were apparent in the way different organizations perform within the parameter of integrity and corporate governance.
RESULTS BY INDUSTRY•As expected, educational institutions placed the greatest importance on this category, with close to
three-quarters of the organizations interviewed rating themselves in the top box.
Figure 10.4: Integrity and corporate governance scores by age of organization
Less than5 years
5−24years
25−49years
50+ years
4.13.93.8
4.3
Average score=4.0
RESULTS BY AGE AND TYPE OF ORGANIzATION•Larger and older organizations performed better in the category of integrity and corporate governance.
More than 40% of government agencies and LLOs rated themselves in the top box on this front.
•There was a significant decline in ratings among MNCs in this wave.

9910. Integrity and corporate governance
Figure 10.5: Integrity and corporate governance scores by organization type
Governmentagencies
LLOs MNCs SMEs Others
Excellent Very good Good Improving trends Early stages No/poor results
21%
36%
14%
29%
42%
37%
5%
16%
43%
27%
2%
27%
43%
39%
11%
2%
5%1%
43%
38%
14%
3%
31%
41%
24%
2%3%
39%
32%
16%
13%
35%
32%
9%
2%4%
38%
43%
7%
9%
35%
42%
7%
5%
12%
2011201020112010201120102011201020112010
2% 2%

100 2011 Management Capability Index – India
OTHER CONCLUSIONSGoing back to the five attributes of integrity and corporate governance, we see the following results:
•There was a significant decline in ratings on understanding ethical principles and following them while making decisions.
23%
25%
26%
28%
25%
22%
Excellent Very good Good Improving trends Early stages No/poor results
2011
2010
2011
2010
2011
2010
2011
2010
2011
2010
Understands ethical principles in making decisions
Follows ethical rules and procedures for making decisions
Adheres to regultaions and guidelines in administering business
Promotes established standards of ethical behavior for everybody based on integrity
Recognizes ethical behavior as good for long-term business
5% 6%
8%
17%
3%
19% 32% 36%
51% 26%1%
47% 29%
36% 40%
43% 33%
1%
4% 15%
40% 36%
41% 36%
40% 38%
37% 37%
8% 14%3%
7% 13%
3% 15%
4% 17%
7% 15%3%
35% 38%
15%
17%
5%
3%
4%
3%3%
5%
5%
5%
Figure 10.6: Individual attributes defining integrity and corporate governance 2010–2011

10110. Integrity and corporate governance
IN SUMMARY• Integrity and corporate governance is a critical category, with a contribution of 5% towards overall MCI ratings.
•This dimension remains the area of highest performance for Indian organizations. Government agencies and LLOs – especially the older organizations – performed better this year; by contrast, younger organizations – such as MNCs and SMEs – performed worse.
•Of the different dimensions, Indian organizations’ performance on understanding and practicing ethics while making decisions declined significantly this year.
This year witnessed previously unseen levels of corporate activism for better corporate governance and transparency in India. Acute focus on executive compensation and corporate accountability highlighted the need for transparent corporate practices. We also witnessed the advent of shareholder activism and a growing demand to make companies completely responsible for their actions across the organizational life cycle. The conversation that originated in the West is equally relevant for emerging markets like India, where governance frameworks and practices still leave much to be desired.

102 2011 Management Capability Index – India102 2011 Management Capability Index – India2011 Management Capability Index – India102

103
APPENDIX – RESPONDENT PROFILES(INDUSTRY, NATURE OF OWNERShIP, NUMBER OF EMPLOYEES, LOCATION)
Type of Organization
Small and medium enterprises (SMEs)
Other
Multinational corporations (MNCs)
Local large organizations (LLOs)Government agencies
51%
20%
14%
5%
10%
Type of Industry
Automobiles
Banking and finance
Basic material
Business and professional servicesConstruction
17%
21%
18%
2%
6%
Consumer goods
Education/academia
Energy
IT and telecommunicationsManufacturingMedia
Oil and gas
Others
Pharmaceutical and medical equipmentTourist and leisure services
TradingTransport
2%3%
5%3%
7%6%
1%
2%1%
1% 1%
0%
Appendix – Respondent profiles 103

104 2011 Management Capability Index – India
Number of Employees
Up to 100
100−500
501−1,000
1,001−2,0002,001−5,000
4%
4%
71%
4%7%
5,001−10,000
More than 10,000Blank
4%
4%
2%
Year of Establishment
1960 or before
1961−1970
1971−1980
1981−19901991−2000
0%
10%48%
10%
5%
2001−2010
2011−2020Blank
9%
11%
7%

105
AIMA The All India Management Association (AIMA) is the national apex body of the management profession in India. Over the last five decades, AIMA has contributed immensely to the enhancement of management capability in the country.
AIMA has a broad base of 66 Local Management Associations including two cooperating LMAs abroad, with a membership crossing 30,000 in number. AIMA is a non-lobbying organisation, working closely with Industry, Government, Academia and students to further the cause of the management profession in India. AIMA is represented on the Boards of India’s premier Business Institutions like Indian Institute of Management – IIMs. AIMA is also represented on Boards of Government bodies including the All India Council for Technical Education, National Board of Accreditation, National Productivity Council to name a few.
AIMA makes a salutary contribution to management learning and practice in the country by offering various services in the areas of testing, distance education, research, publications and management development programmes.
AIMA brings to the Indian managers, the best management practices and techniques through numerous foreign collaborations with professional bodies and institutions. AIMA is a member of the Asian Association of Management Organisations (AAMO) and works closely with several international management institutions like Insead, St Gallen Foundation etc. in organising international conferences and management development programmes.
MERCERMercer is a global leader in human resource consulting and related services. The firm works with clients to solve their most complex human capital issues by designing and helping manage health, retirement and other benefits. Mercer’s 20,000 employees are based in more than 40 countries. Mercer is a wholly owned subsidiary of Marsh & McLennan Companies (NYSE: MMC), a global team of professional services companies offering clients advice and solutions in the areas of risk, strategy and human capital. With 52,000 employees worldwide and annual revenue exceeding $10 billion, Marsh & McLennan Companies is also the parent company of Marsh, a global leader in insurance broking and risk management; Guy Carpenter, a global leader in providing risk and reinsurance intermediary services; and Oliver Wyman, a global leader in management consulting. For more information, visit www.mercer.com. Follow Mercer on Twitter @MercerInsights.
AIMA and Mercer, as partners for the India survey, endeavor to institutionalize the Management Capability Index research in India as an annual benchmarking research, to provide credible insight into the management practices of Indian companies and how they fare when benchmarked against these indices in the rest of the Asia Pacific region.
AAMOThe Asian Association of Management Organisations (AAMO) is an independent, nonpolitical and not-for-profit partnership of National Management Organizations in the Asia Pacific region, which promotes, facilitates and supports the development of professional management. The current 15 members of AAMO include Australia, Hong kong, India, Japan, Macau, Malaysia, Mauritius, Nepal, New zealand, Pakistan, the Philippines, Qatar, Singapore, Sri Lanka and Taiwan. AAMO has launched the MCI study in New zealand and Malaysia and intends to replicate the research in all affiliated countries this year. These results will then be calibrated and compiled to provide a regional view of the prevalent management practices while creating a platform for sharing management best practices.
ABOUT
About

2011 Management Capability Index – India2011 Management Capability Index – IndiaAbout AIMA, MERCER, AAMO

107

108 2011 Management Capability Index – India

109

Copyright 2012 Mercer LLC. All rights reserved. 10985-MG-190912
For further information, please contact your local Mercer office or visit our website at:www.mercer.com
ALL INDIA MANAGEMENT ASSOCIATION
All India Management Association (AIMA) 14, Institutional Area, Lodhi Road New Delhi - 110 003, IndiaWebsite: www.aima-ind.org
Mercer Consulting (India) Pvt. Ltd.Unit - I, 7th Floor, Tower A DLF Infinity Towers, DLF Cyber CityGurgaon - 122 002, IndiaWebsite: www.mercer.co.in
Asian Association of Management Organisations (AAMO)Rua de Xangai 175Edf. ACM, 9 AndarMacauWebsite: www.aamo.net