2011 Annual Results - caltagironeeditore.com · Since November 21st 2011 Leggo renews its format...
22
2011 Annual Results
Transcript of 2011 Annual Results - caltagironeeditore.com · Since November 21st 2011 Leggo renews its format...

2011 Annual Results

Agenda
• Executive Summary
Th G• The Group
• Leadership in traditional newspapers and free press
• The Advertising marketThe Advertising market
• Financial highlights
• The Caltagirone Group and main shareholders
2

Executive Summary
Since 2008 the publishing industry has undergone a structural crisis which is challenging thetraditional business model.
Caltagirone Editore has been successful in tackling this adverse trading environment by:
• Keeping its n°2 position in Italian publishing, with 26,42% share of average daily readers, upfrom 24 8% in 2010from 24,8% in 2010.
• Maintaining a solid Financial position (Net Cash Position of € 180.9m and Equity Ratio (1) of 76%)• Reviewing its Business model in order to face the digital challenges and to take on new growth
opportunities (ex. Leggo restyling; internet revenues increase by 27%)opportunities (ex. Leggo restyling; internet revenues increase by 27%)• Re-organizing its processes and restructuring its organization, achieving a structural costs
reduction (operating costs decreased by 1.9% on 2010; by 3% excluding, raw materials)
(1) Net Shareholders Equity / Total Assets

Tne Group: N.2 in the domestic market (1)
Caltagirone Editore is the 2nd Italian publishing group with26,42% share of average daily readers (1)
Avg. daily
Avg. dailyreaders6,840
Data in thousands
Avg. dailyreaders5,965 Avg. daily
readers5,176
30,30%26,42%
Avg. dailyreaders2,625
,22,93%
11,63%
Gruppo Editoriale L’Espresso
4(1) Source: Audipress 2011/III excluding specialized newspapers (financial and sports) and including free press

Tne Group: N.2 in the domestic market (1)
The Group publishes 4 titles among the first 15 in Italy
23213430
3523
16071542
17461920
9361109
13331607
594604
703746
541594
Avg. daily readers /1000
5(1) Source: Audipress 2011/III excluding specialized newspapers (financial and sports) and including free press

The Group: traditional newspapers and free press
Newspapers (1) New Media Advertising
• National with 13 local editions • Readership 1,607,000
Advertising agency for
• National with 7 local editions• Readership 1,109,000
the GroupBranch dedicated to
Internet
• National with 8 local editions • Readership 604,000
• Regional with 5 local editions • Readership 347,000
• Multiple provincial with 3 local editions• Multiple-provincial with 3 local editions• Readership 378,000
• National network in 2 cities• Readership 1 920 000
6
• Readership 1,920,000
(1) Source: Audipress 2011/III

The Group: web and multimedia
In 2011 our websites audience kept growing and new platforms (Mobile and IPAD) have been launched, raising significant interest on the part of our readers, with 27% internet advertising expenditure from 2010
Internet website IPAD application Mobile – Iphoneapplications
Title
7

Leadership in traditional newspapers and Free Press
8

CED has a strong local leadership (1)
Regions in which CED is #1 or # 2 in the market
Considerable presence (> 10%)
READERSHIP IN LAZIO
READERSHIP IN VENETO35.9%Combined with local newspapers (2)
39 2%Gr Espresso-RepubblicaREADERSHIP IN LAZIO69.5%
36,2%
69,5%
Rcs
Caltagirone Editore
14,7%
32,0%
35,9%
39,2%
0,0% 5,0% 10,0% 15,0% 20,0% 25,0% 30,0% 35,0% 40,0% 45,0%
Rcs
Athesis
Caltagirone Editore
Gr. Espresso-Repubblica
READERSHIP IN MARCHE71.2%
4,8%
23,2%
26,0%
0,00% 10,00% 20,00% 30,00% 40,00% 50,00% 60,00% 70,00% 80,00%
Soc. Ed. Il Tempo
Gr. Espresso- Repubblica
Metro
71,2%Caltagirone Editore
READERSHIP IN UMBRIA
9,4%
13,7%
38,5%
0,0% 10,0% 20,0% 30,0% 40,0% 50,0% 60,0% 70,0% 80,0%
Rcs
Gr. Espresso-Repubblica
Poligrafici Ed.
19,5%
22,7%
Poligrafici Ed.
Caltagirone Editore
Corriere dell'Umbria
READERSHIP IN UMBRIA22.7%
57%
READERSHIP IN CAMPANIA
READERSHIP IN “GRANDE SALENTO” (3)
94.3%11,2%
13,0%
19,5%
0,00% 10,00% 20,00% 30,00% 40,00% 50,00% 60,00%
Rcs
Gr. Espresso- Repubblica
Poligrafici Ed.
Caltagirone Editore 94 373.4%
22,7%
31,7%
73,4%
Gr. Espresso - Repubblica
Rcs
Caltagirone Editore
10,5%
13,2%
38,5%
0 0% 10 0%20 0%30 0%40 0%50 0%60 0%70 0%80 0%90 0%100 0%
Rcs
Gr. Espresso - Repubblica
EdiSud SpA
Caltagirone Editore 94,3
9
(1) Source: Audipress 2011/III, avg. daily readers excluding financial and sports daily newspapers and including free press(2) In Calabria, Basilicata and in Puglia both Il Messaggero and Il Mattino are sold combined with local newspapers(3) Unlike other Group newspapers, Il Nuovo Quotidiano di Puglia is not a regional newspaper because it is sold only in 3 cities: Lecce, Brindisi and Taranto (Salento)(4) The readership share includes double readings
0,0% 10,0% 20,0% 30,0% 40,0% 50,0% 60,0% 70,0% 80,0%0,0% 10,0%20,0%30,0%40,0%50,0%60,0%70,0%80,0%90,0%100,0%

Leadership in the Central Italy
Group newspapers have a well-established leadership in the Macroregion
READERSHIP IN THE MACROREGION64.2%
(1) (2)
64 2%Caltagirone
28,7%
64,2%
Rcs
gEditore
11,9%
24,4%
Metro
Gruppo Espresso -Repubblica
5,4%
0,00% 10,00% 20,00% 30,00% 40,00% 50,00% 60,00% 70,00%
Poligrafici Ed.
0,00% 10,00% 20,00% 30,00% 40,00% 50,00% 60,00% 70,00%
10(1) Source: Audipress 2011/III, avg. daily readers excluding financial and sports daily newspapers and including free press(2) Macroregion consists of Lazio, Campania, Marche, Umbria, Abruzzo and Molise

N.1 in the domestic market
Leggo ranks as the first daily free newspaper in Italy with 1,920,000 daily readers.Since November 21st 2011 Leggo renews its format becoming Social Press. Nowadays it is distributed in the two most important Italian cities Milan and Rome
(1)
distributed in the two most important Italian cities, Milan and Rome.
Leggo
New Leggo is composed of three sections:
LOMBARDY
Milan
Leggo
RiLeggo
543,000 avg. daily readers
QuiLeggo
LAZIO639,000 avg. daily readers
RomeNEWS
MONOTHEMATIC IN-DEPTH
LOCAL NEWS
11
LOCAL NEWS
(1) Source: Audipress 2011/III

N.1 in the domestic market
Leggo is leader in the free press market with 35.1% share, around 10% of daily readers more than City and 24.5% more than Metro(1)
Avg. daily readers
1.542.0001.746.000
1.920.000
262.000
Metro City Leggo Dnews
12(1) Source: Audipress 2011/III

The Advertising Market
13

Advertising Italian market 2007-2011 (1)
From 2007 to 2011, advertising expenditure on traditional newspapers’ decreased (from 20.2% to 15,1% of total) vis-a-vis TV (from 52.7% to 54%) and “new media”
€ Billion8,83 9,69 8,21 8,90 8,59
7 4%
12,1%19,9% 19,0% 21,5%
14,3%
20,2%17,3%
17,2% 15,5% 15,1%
15,0%
12,7% 10,7% 9,3% 9,3%
7,4%OTHER
INTERNET
MAGAZINES
DAILYNEWSPAPERS
52,7% 50,1% 53,1% 53,7% 53,9%
DAILY NEWSPAPERS
TV
Total advertising expenditure EUR Billion
2007 2008 2009 2010 2011
(1) Source: Nielsen Media Research. Total advertising does not include free press advertising expenditure

Newspapers advertising (1)
• In 2011 newspapers advertising expenditure in Italy declined for the fourth consecutive year, -5,6% decrease (-5,1% national and -6% local advertising) compared to 2010
€ billion
1.530 1.564 1.537 1.5631.623
1.543
1 302
720 756 747 795812
735605 599
1.302 1.2541.184
605 599 569467 473 452 443 473 482
424 397 373
2003 2004 2005 2006 2007 2008 2009 2010 2011
National Commercial Local Commercial Total Newspapers Free Press
15(1) Source: Osservatorio FCP

Financial Highlightsg g
16
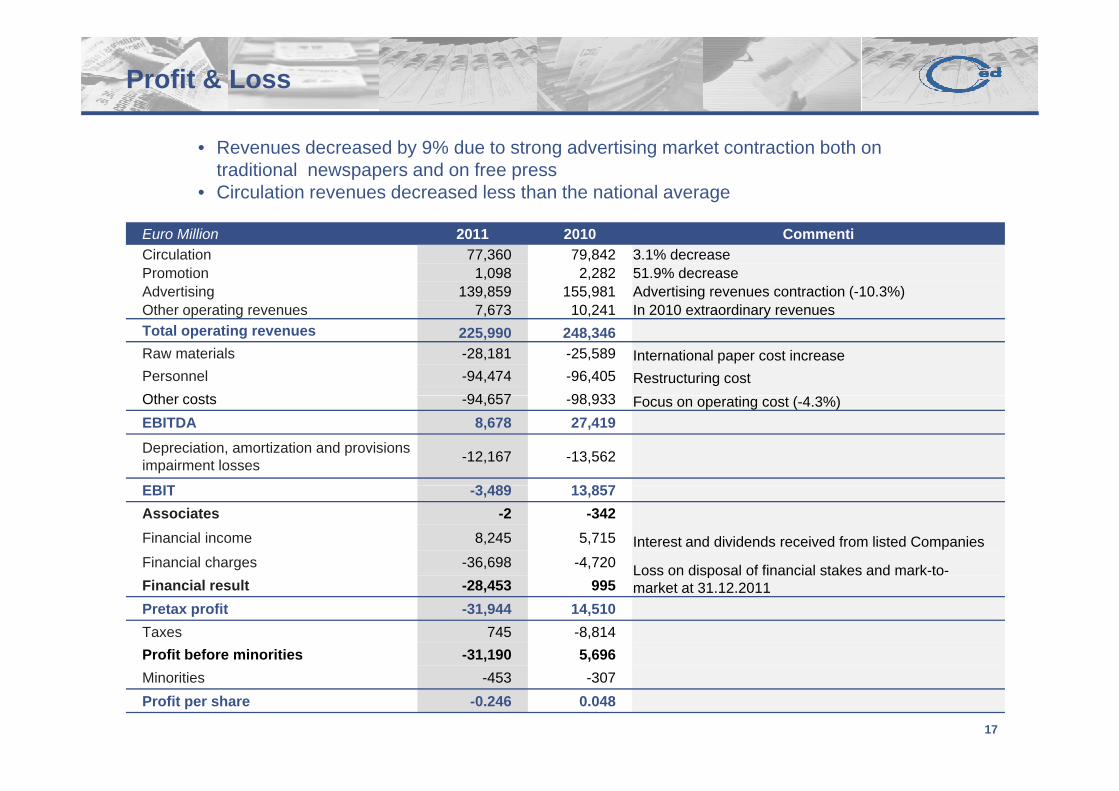
Profit & Loss
• Revenues decreased by 9% due to strong advertising market contraction both on traditional newspapers and on free press
• Circulation revenues decreased less than the national average
Euro Million 2011 2010 CommentiCirculation 77,360 79,842 3.1% decreasePromotion 1,098 2,282 51.9% decreaseAdvertising 139,859 155,981 Advertising revenues contraction (-10.3%)Oth ti 7 673 10 241 I 2010 t diOther operating revenues 7,673 10,241 In 2010 extraordinary revenuesTotal operating revenues 225,990 248,346Raw materials -28,181 -25,589 International paper cost increasePersonnel -94,474 -96,405 Restructuring costOth t 94 657 98 933Other costs -94,657 -98,933 Focus on operating cost (-4.3%)EBITDA 8,678 27,419Depreciation, amortization and provisions impairment losses -12,167 -13,562
EBIT 3 489 13 857EBIT -3,489 13,857Associates -2 -342Financial income 8,245 5,715 Interest and dividends received from listed CompaniesFinancial charges -36,698 -4,720 Loss on disposal of financial stakes and mark-to-Loss on disposal of financial stakes and mark to
market at 31.12.2011Financial result -28,453 995Pretax profit -31,944 14,510Taxes 745 -8,814Profit before minorities -31,190 5,696
17
Minorities -453 -307Profit per share -0.246 0.048

Restructuring: operating costs dynamics
€ MillionCAGR 07 - 11
121,1 114,7 106,6
273.2 263.1 250.8 220.9 217.3 -5.6%
111,5 110,4 102,2 94,4 92,0
1,5 1,0 9,52,0 2,5
106,698,9 94,7
-4.1%
-6.0%
39,1 37,1 32,4 25,6 28,2
2007 2008 2009 2010 2011
Other operating costs Personnel extraordinary charges Personnel Raw materials
-7.9%
Total operating costs
In order to offset the revenue decline in the last 4 years, CED has undertaken a restructuring plan which determined:
Operating costs decline by approximately €56 million, with CAGR of -5.6%Personnel structure costs reduction by approximately €19.5 million
18

Financial strength: Net Financial Position
€ Million
N t ti31 12 10 Net operating cash flow
Dividend distribution
31.12.10
€6.3
31.12.11
€1.6
€23.3
Investments (1)
and other variations
31.12.11
€ 208.9€180.9
(1) Investments in intangible assets , tangible assets, financial stakes and securities
19
Investments in intangible assets , tangible assets, financial stakes and securities

The Caltagirone Group and g pmain shareholders
20

Caltagirone Group and main shareholders*
• Caltagirone Spa is a holding company which controls three different subsidiaries active in the cement, media and construction industries
• 2011 Consolidated revenues achieved € 1.45 billion and EBITDA €151.2 million
MEDIACONSTRUCTION CEMENT
MktMkt CapCap: : €€ 181m181m
25.5%66.7% 56.5% 31.7% 35.6%
Shareholders
Cap: € 253m
Francesco GaetanoCaltagirone **
60.8%Free Float34.6%
C t tiWater pipes Cap: € 253m
Edizione Srl2.24%
ConstructionWater pipes/ pilons
Cap: € 117m
Cap: € 329m Cap: € 39mCap: € 34m Cap: € 150m
GaetanoCaltagirone 2.4%
International cement and RMC producer
Newspapers, Advertising, Internet
21
RMC producer
(*) Mkt cap in € million is based on prices at April 20, 2012(**) Direct / indirect stakes

Disclaimer
This presentation is not intended as an offer or solicitation of an offer topurchase or sell any financial instrument and it is being distributed to
f i l i t l d t fi i l itprofessional investors only and to financial community
It may not be reproduced, redistributed or published in whole or in part.
For any further information please contact our Investor Relations Office,coordinated by Marco M. Bianconi:
E-mail: [email protected]
Phone: +39 06 32493227
Fax: +39 06 32493277
22