Creating growth opportunities with streaming finance models by Nolan Watson, Sandstorm Gold
2011 Annual Report
2011
YEAR ENDED DECEMBER 31, 2011

Contents
OUR COMPANY ONE
About Sandstorm Gold Ltd. 04
Letter to the Shareholders 05
Management & Directors 06
MANAGEMENT’S DISCUSSION & ANALYSIS TWO
Highlights 08
Summary of Gold Streams 10
Summary of Annual Results 16
Summary of Quarterly Results 17
Mineral Reserves & Resources 25
FINANCIALS THREE
Financials Statements 30

Section OneOUR COMPANY
SANDSTORM GOLD LTD. 2011 Annual Report SECTION ONE Our Company 04
04
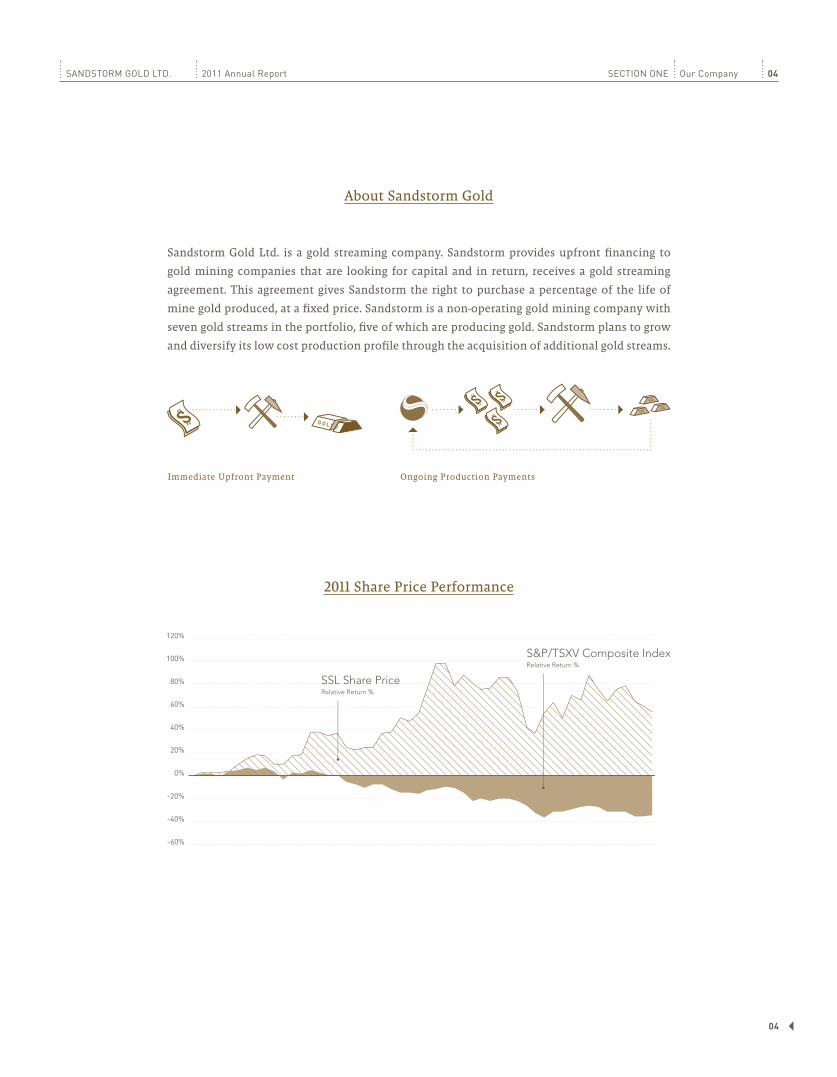
Sandstorm Gold Ltd. is a gold streaming company. Sandstorm provides upfront financing to
gold mining companies that are looking for capital and in return, receives a gold streaming
agreement. This agreement gives Sandstorm the right to purchase a percentage of the life of
mine gold produced, at a fixed price. Sandstorm is a non-operating gold mining company with
seven gold streams in the portfolio, five of which are producing gold. Sandstorm plans to grow
and diversify its low cost production profile through the acquisition of additional gold streams.
About Sandstorm Gold
2011 Share Price Performance

SANDSTORM GOLD LTD. 2011 Annual Report SECTION ONE Our Company 05
05
A Messageto our ShareholdersFROM CEO NOLAN WATSON
When asked to discuss an investment
in Sandstorm Gold, I often speak about
the importance of risk adjusted return. I
talk about leverage to the gold price and
low cash costs. About participating in
production rate upside without capital
expenditure overruns. About exposure to
exploration rate upside without the
sustaining capital expenditures. I speak
about profiting from inflation instead of
watching it erode shareholder value. I talk
about the power of the streaming business
model. Sandstorm Gold is the only 100%
pure gold streaming company and in 2011
we certainly saw the power of the
business model at work.
Over the last year, although rife with
volatility, gold pushed higher on the back
of economic uncertainty, debt crises and
currency devaluation. Sandstorm saw its
average realized selling price of gold rise
to $1,618 per ounce in 2011 with cash costs
of $420 per ounce on average. These strong
margins, together with substantial produc-
tion rate increases, led to breakout quarters
in terms of cash flow from operations and
revenue. Production milestones included the
Aurizona Mine in Brazil reaching feasibil-
ity level production and the Santa Elena
Mine in Mexico exceeding feasibility level
production rates. In addition, the Black Fox
Mine began mining from both the open pit
and underground operations concurrently.
Production grew from 2,322 ounces in 2010
to 18,516 in 2011 with no sustaining capital
costs. We will continue to monetize further
production rate upside as Aurizona expands
its production, the Santa Elena Mine looks to
expand underground and our other projects
advance towards commercial production.
Exploration activities throughout the year
also yielded promising results, culminated
by a resource update at the Aurizona Mine
showing a 250% increase in gold resources.
Excluding newly acquired streams, Sand-
storm’s company-wide resources increased
by 80%, without any required expenditures
by Sandstorm.
Looking forward, we are expecting significant
growth and are forecasting 25,000 to 35,000
ounces of attributable production in 2012,
increasing to over 50,000 ounces per year
by 2015. In addition to the strong growth
profile of our current gold streams, Sand-
storm is well positioned to grow through
the completion of additional gold streaming
acquisitions. With significant cash on hand,
over $3 million in free cash flow coming
in on a monthly basis and a $50 million
undrawn revolving line of credit, we have an
opportunity to add significant shareholder
value.
It is an exciting time to be a part of our
company. We have transitioned into a cash
flowing business and we are focused on
continuing to deliver strong risk adjusted
returns for our shareholders.
Nolan Watson
President & CEO

01
05
06
07
02
03
04
01. Nolan Watson
President, CEO & Director
02. David Awram
Executive Vice President & Director
03. Ron Ho
Vice President, Finance
04. Erfan Kazemi Chief Financial Officer
SANDSTORM GOLD LTD. 2011 Annual Report SECTION ONE Our Company 06
06
Management & Directors
05. Andrew T. Swarthout Director
06. David E. De Witt Director
07. John P. A. Budreski Director

Section TwoMANAGEMENT’S DISCUSSION & ANALYSIS

SANDSTORM GOLD LTD. 2011 Annual Report SECTION TWO MANAGEMENT’S DISCUSSION & ANALYSIS 08
08
Sandstorm Gold Ltd. Management’s Discussion and AnalysisFOR ThE YEAR ENDED DECEMBER 31, 2011
HIGHLIGHTS• Gold sales for the three months and year
ended December 31, 2011 were 6,611 ounces
and 18,516, respectively, representing an
increase of 241% and 697% over the com-
parable periods in 2010.
• Operating cash flow for the three months
and year ended December 31, 2011 of $7.8
million and $20.7 million respectively,
representing an increase of over 350%
and 4,300% over the comparable periods
in 2010 (cash flow of $1.7 million and $0.5
million for three months and year ended
December 31, 2010).
• On January 17, 2011, the Company entered
into a Gold Stream agreement with Meta-
nor Resources Inc. to purchase 20% of
the life of mine gold produced from the
Bachelor Lake Mine.
• On July 13, 2011, the Company entered into a
gold stream agreement with Donner Metals
Ltd. (”Donner”) via a back-to-back agree-
ment with Sandstorm Metals & Energy Ltd.
(“Sandstorm Metals & Energy”) to purchase
17.5% of the life of mine gold produced
from the Bracemac-McLeod development
project (the “Bracemac-McLeod Property”)
for a per ounce payment equal to the lesser
of $350 and the prevailing market price of
gold. This transaction highlights the financ-
ing synergy between the Company and
This management’s discussion and analysis
(“MD&A”) for Sandstorm Gold Ltd. (“Sandstorm”
or the “Company”) should be read in conjunction
with the consolidated annual financial statements
of Sandstorm for the year ended December 31,
2011 and related notes thereto which have been
prepared in accordance with International Finan-
cial Reporting Standard (“IFRS”) as issued by the
International Accounting Standard Board (“IASB”).
Previously, the Company prepared its annual con-
solidated financial statements in accordance with
Canadian generally accepted accounting principles
(“GAAP”). The Company’s 2010 comparatives in this
MD&A are presented in accordance with IFRS. The
Company’s transition date was January 1, 2010, and
accordingly the 2009 comparative information in
this MD&A is presented in accordance with GAAP.
The information contained within this MD&A is
current to March 13, 2012 and all figures are stated
in U.S. dollars unless otherwise noted.
Sandstorm Metals & Energy as Sandstorm
Metals & Energy has concurrently agreed
to purchase 17.5% of the life of mine cop-
per from the Bracemac-McLeod Property.
• Gold production reached feasibility lev-
els at both the Aurizona Mine and Santa
Elena Mine.
• Luna released a significant mineral re-
source update at the Aurizona Mine.
Measured and Indicated gold resources
now total 78 million tonnes at 1.26 grams
per tonne gold or 3.2 million ounces, an
increase of 250% from the previous mineral
resource estimate published in January
2009. Inferred gold resources now total
15.2 million tonnes at 1.47 grams per tonne
gold or 0.7 million ounces, an increase of
79% from the previous resource estimate.
• Rambler is now mining and processing ore
from its flagship project, the Ming Mine.
Commercial production is targeted before
the end of fiscal 2012.
• On January 12, 2012, Sandstorm entered
into a revolving credit agreement with
the Bank of Nova Scotia which allows the
Company to borrow up to $50 million (the
“Revolving Loan”). The Revolving Loan has
a term of three years, which is extendable
by mutual consent of both parties.

SANDSTORM GOLD LTD. 2011 Annual Report SECTION TWO MANAGEMENT’S DISCUSSION & ANALYSIS 09
09
OVERVIEW
The Company is a growth focused company that seeks to acquire
gold purchase agreements (“Gold Streams”) from companies that have
advanced stage development projects or operating mines. In return
for making upfront payments to acquire a Gold Stream, Sandstorm
receives the right to purchase, at a fixed price per ounce, a percentage
of a mine’s gold production for the life of the mine. Sandstorm helps
other companies in the resource industry grow their businesses, while
acquiring attractive assets in the process. The Company is focused
on acquiring Gold Streams from mines with low production costs,
significant exploration potential and strong management teams. The
Company currently has seven Gold Streams.
Effective February 17, 2011, the Company changed its name from
Sandstorm Resources Ltd. to Sandstorm Gold Ltd.
OUTLOOK
Based on existing Gold Stream agreements, forecasted 2012 attributable
production is 25,000 – 35,000 ounces of gold, increasing to over 50,000
ounces of gold per annum by 2015. This growth is driven by the
Company’s portfolio of Gold Streams with mines, all of which are either
currently producing or expected to commence production by 2013.
SANDSTORM GOLD LTD. 2011 Annual Report SECTION TWO MANAGEMENT’S DISCUSSION & ANALYSIS 10
10
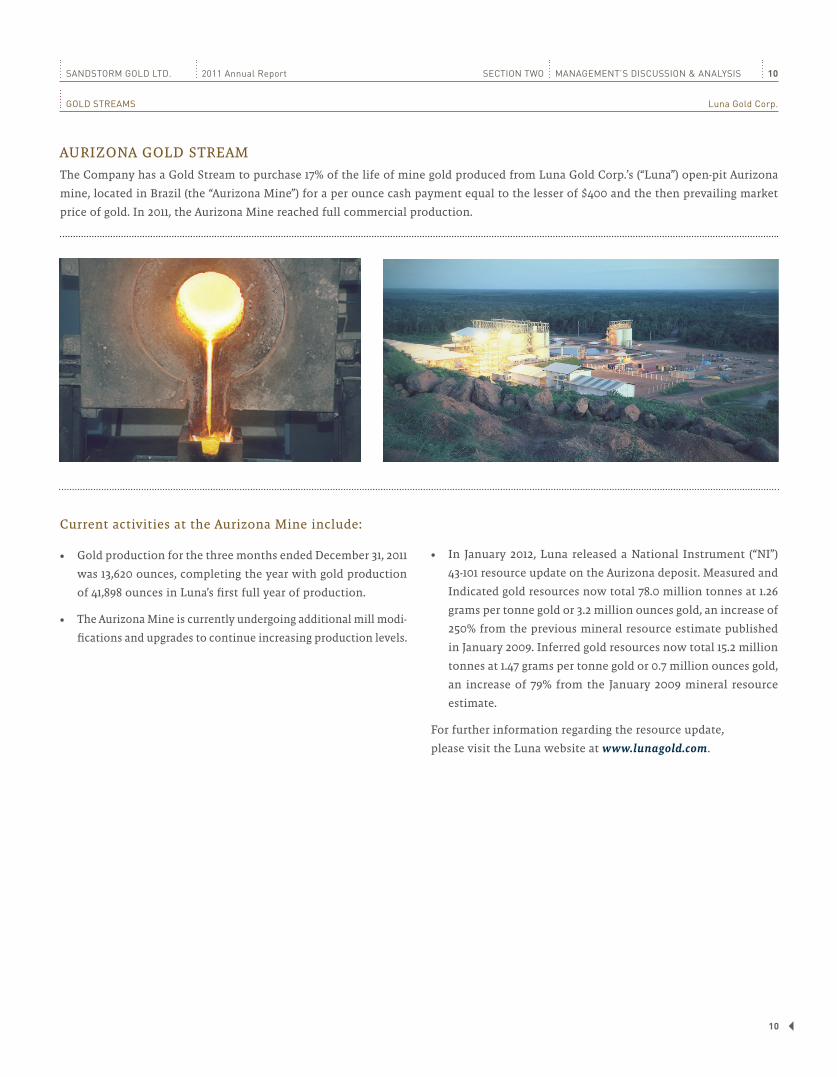
AURIZONA GOLD STREAM
The Company has a Gold Stream to purchase 17% of the life of mine gold produced from Luna Gold Corp.’s (“Luna”) open-pit Aurizona
mine, located in Brazil (the “Aurizona Mine”) for a per ounce cash payment equal to the lesser of $400 and the then prevailing market
price of gold. In 2011, the Aurizona Mine reached full commercial production.
Current activities at the Aurizona Mine include:
• Gold production for the three months ended December 31, 2011
was 13,620 ounces, completing the year with gold production
of 41,898 ounces in Luna’s first full year of production.
• The Aurizona Mine is currently undergoing additional mill modi-
fications and upgrades to continue increasing production levels.
• In January 2012, Luna released a National Instrument (“NI”)
43-101 resource update on the Aurizona deposit. Measured and
Indicated gold resources now total 78.0 million tonnes at 1.26
grams per tonne gold or 3.2 million ounces gold, an increase of
250% from the previous mineral resource estimate published
in January 2009. Inferred gold resources now total 15.2 million
tonnes at 1.47 grams per tonne gold or 0.7 million ounces gold,
an increase of 79% from the January 2009 mineral resource
estimate.
For further information regarding the resource update,
please visit the Luna website at www.lunagold.com.
GOLD STREAMS Luna Gold Corp.

SANDSTORM GOLD LTD. 2011 Annual Report SECTION TWO MANAGEMENT’S DISCUSSION & ANALYSIS 11
11
SANTA ELENA GOLD STREAM
The Company has a Gold Stream to purchase 20% of the life of mine gold produced from Silver Crest Mines Inc.’s (“Silver Crest”) open-pit
Santa Elena mine, located in Mexico (the “Santa Elena Mine”) for a per ounce cash payment equal to the lesser of $350 and the then
prevailing market price of gold. On July 13, 2011, the Santa Elena Mine reached full commercial production.
Current activities at the Santa Elena Mine include:
• Gold production for the three months ended December 31, 2011 was 9,536 ounces, com-
pleting the year with gold production of 26,969 ounces in Silver Crest’s first full year of
production.
• A NI 43-101 Technical Report was filed in April 2011 which estimates a 10 year mine life
and average annual full year production of approximately 30,000 ounces of gold.
• A preliminary economic assessment has been completed and a preliminary feasibility
study is underway for a potential concurrent underground mining and milling opera-
tion at Santa Elena.
• The Company has finished drilling four geotechnical drill holes at the Santa Elena Mine
to help establish geotechnical and hydrological parameters for the proposed decline and
subsequent underground development. The portal site for the decline has been selected,
and the initial underground contractor proposals for the Phase I underground work,
consisting of approximately 1,800 metres of main ramp and exploration drifting are
currently being reviewed. When completed, the Phase I decline will allow development
and initial production from the deposit that lies below the ultimate open pit limits.
GOLD STREAMS Silver Crest Mines Inc.

SANDSTORM GOLD LTD. 2011 Annual Report SECTION TWO MANAGEMENT’S DISCUSSION & ANALYSIS 12
12
BLACK FOX GOLD STREAM
The Company has a Gold Stream to purchase 12% of the life of mine gold produced from Brigus Gold Corp.’s (“Brigus”) open pit and
underground Black Fox mine, located in Ontario, Canada (the “Black Fox Mine”) and 10% of the life of mine gold produced from Brigus’
Black Fox Extension, which includes a portion of Brigus’ Pike River concessions for a per ounce payment equal to the lesser of $500 and
the then prevailing market price of gold.
Brigus has the option until January 1, 2013 to repurchase 50% of the Brigus Gold Stream by making a $36.6 million payment to the
Company, upon receipt of which, the percentage of gold the Company is entitled to purchase will decrease to 6% for the Black Fox Mine
and 4.5% for the Black Fox extension.
The Black Fox Mine began operating as an open pit mine, but since mid-2010, Brigus began development of an underground mine. Both
open pit and underground operations are running concurrently, feeding the 2,000 tonnes per day mill.
Current activities at the Black Fox Mine include:
• The Black Fox Mine produced 14,457 ounces of gold at an aver-
age grade of 2.66 grams per tonne in the fourth quarter of 2011
and 55,756 ounces of gold at an average grade of 2.54 grams per
tonne for the full year. Grades in the open pit are expected to
increase later in 2012 as higher grade ore is mined deeper in
Phase 2 of the pit.
• Mining from the open pit will be reduced as higher-grade under-
ground ore production increases in future quarters.
• Brigus announced at the end of June 2011 that it would proceed
with an initial expansion of the Black Fox mill, which is expected
to be completed and in service during the first quarter of 2012.
GOLD STREAMS Brigus Gold Corp.
This initial expansion will increase processing capacity at the
Black Fox mill to up to 2,200 tonnes per day. Processing capacity
and recovery is planned to increase through the optimization
of existing equipment and equipment additions.
• Underground exploration at the Black Fox mine is expected to
begin in the second half of 2012. The program is intended to
expand the gold deposit along the strike and down dip.
SANDSTORM GOLD LTD. 2011 Annual Report SECTION TWO MANAGEMENT’S DISCUSSION & ANALYSIS 13
13
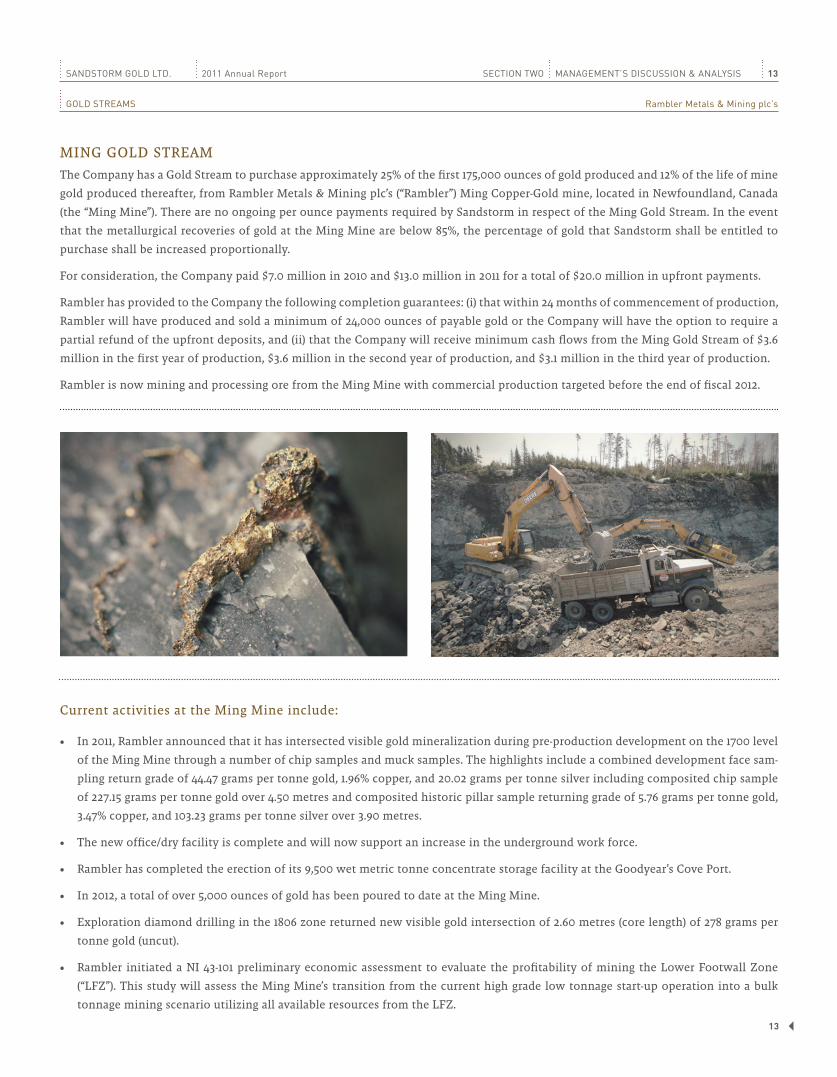
MING GOLD STREAM
The Company has a Gold Stream to purchase approximately 25% of the first 175,000 ounces of gold produced and 12% of the life of mine
gold produced thereafter, from Rambler Metals & Mining plc’s (“Rambler”) Ming Copper-Gold mine, located in Newfoundland, Canada
(the “Ming Mine”). There are no ongoing per ounce payments required by Sandstorm in respect of the Ming Gold Stream. In the event
that the metallurgical recoveries of gold at the Ming Mine are below 85%, the percentage of gold that Sandstorm shall be entitled to
purchase shall be increased proportionally.
For consideration, the Company paid $7.0 million in 2010 and $13.0 million in 2011 for a total of $20.0 million in upfront payments.
Rambler has provided to the Company the following completion guarantees: (i) that within 24 months of commencement of production,
Rambler will have produced and sold a minimum of 24,000 ounces of payable gold or the Company will have the option to require a
partial refund of the upfront deposits, and (ii) that the Company will receive minimum cash flows from the Ming Gold Stream of $3.6
million in the first year of production, $3.6 million in the second year of production, and $3.1 million in the third year of production.
Rambler is now mining and processing ore from the Ming Mine with commercial production targeted before the end of fiscal 2012.
Current activities at the Ming Mine include:
• In 2011, Rambler announced that it has intersected visible gold mineralization during pre-production development on the 1700 level
of the Ming Mine through a number of chip samples and muck samples. The highlights include a combined development face sam-
pling return grade of 44.47 grams per tonne gold, 1.96% copper, and 20.02 grams per tonne silver including composited chip sample
of 227.15 grams per tonne gold over 4.50 metres and composited historic pillar sample returning grade of 5.76 grams per tonne gold,
3.47% copper, and 103.23 grams per tonne silver over 3.90 metres.
• The new office/dry facility is complete and will now support an increase in the underground work force.
• Rambler has completed the erection of its 9,500 wet metric tonne concentrate storage facility at the Goodyear’s Cove Port.
• In 2012, a total of over 5,000 ounces of gold has been poured to date at the Ming Mine.
• Exploration diamond drilling in the 1806 zone returned new visible gold intersection of 2.60 metres (core length) of 278 grams per
tonne gold (uncut).
• Rambler initiated a NI 43-101 preliminary economic assessment to evaluate the profitability of mining the Lower Footwall Zone
(“LFZ”). This study will assess the Ming Mine’s transition from the current high grade low tonnage start-up operation into a bulk
tonnage mining scenario utilizing all available resources from the LFZ.
GOLD STREAMS Rambler Metals & Mining plc’s
SANDSTORM GOLD LTD. 2011 Annual Report SECTION TWO MANAGEMENT’S DISCUSSION & ANALYSIS 14
14
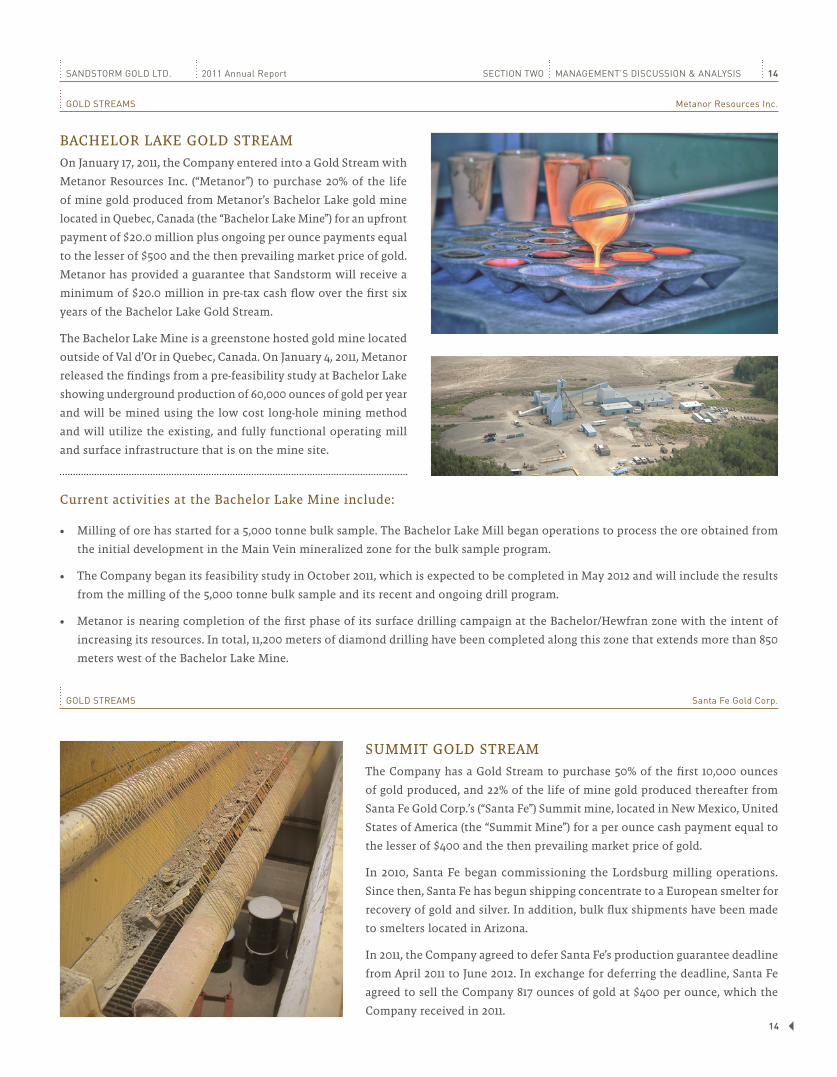
BACHELOR LAKE GOLD STREAM
On January 17, 2011, the Company entered into a Gold Stream with
Metanor Resources Inc. (“Metanor”) to purchase 20% of the life
of mine gold produced from Metanor’s Bachelor Lake gold mine
located in Quebec, Canada (the “Bachelor Lake Mine”) for an upfront
payment of $20.0 million plus ongoing per ounce payments equal
to the lesser of $500 and the then prevailing market price of gold.
Metanor has provided a guarantee that Sandstorm will receive a
minimum of $20.0 million in pre-tax cash flow over the first six
years of the Bachelor Lake Gold Stream.
The Bachelor Lake Mine is a greenstone hosted gold mine located
outside of Val d’Or in Quebec, Canada. On January 4, 2011, Metanor
released the findings from a pre-feasibility study at Bachelor Lake
showing underground production of 60,000 ounces of gold per year
and will be mined using the low cost long-hole mining method
and will utilize the existing, and fully functional operating mill
and surface infrastructure that is on the mine site.
Current activities at the Bachelor Lake Mine include:
• Milling of ore has started for a 5,000 tonne bulk sample. The Bachelor Lake Mill began operations to process the ore obtained from
the initial development in the Main Vein mineralized zone for the bulk sample program.
• The Company began its feasibility study in October 2011, which is expected to be completed in May 2012 and will include the results
from the milling of the 5,000 tonne bulk sample and its recent and ongoing drill program.
• Metanor is nearing completion of the first phase of its surface drilling campaign at the Bachelor/Hewfran zone with the intent of
increasing its resources. In total, 11,200 meters of diamond drilling have been completed along this zone that extends more than 850
meters west of the Bachelor Lake Mine.
SUMMIT GOLD STREAM
The Company has a Gold Stream to purchase 50% of the first 10,000 ounces
of gold produced, and 22% of the life of mine gold produced thereafter from
Santa Fe Gold Corp.’s (“Santa Fe”) Summit mine, located in New Mexico, United
States of America (the “Summit Mine”) for a per ounce cash payment equal to
the lesser of $400 and the then prevailing market price of gold.
In 2010, Santa Fe began commissioning the Lordsburg milling operations.
Since then, Santa Fe has begun shipping concentrate to a European smelter for
recovery of gold and silver. In addition, bulk flux shipments have been made
to smelters located in Arizona.
In 2011, the Company agreed to defer Santa Fe’s production guarantee deadline
from April 2011 to June 2012. In exchange for deferring the deadline, Santa Fe
agreed to sell the Company 817 ounces of gold at $400 per ounce, which the
Company received in 2011.
GOLD STREAMS Metanor Resources Inc.
GOLD STREAMS Santa Fe Gold Corp.

SANDSTORM GOLD LTD. 2011 Annual Report SECTION TWO MANAGEMENT’S DISCUSSION & ANALYSIS 15
15
Current activities at the Bracemac-McLeod Mine include:
• The mine design has been revised to access the McLeod Zone
with two ramps by early 2013. The new development plan
improves the overlap and timing of production from both the
Bracemac and McLeod zones.
• Once access is available at McLeod, delineation drilling will be
focused on the West McLeod Zone.
• Construction of access and haulage roads, mine support in-
frastructure and electrical supply has been mostly completed.
BRACEMAC-MCLEOD GOLD STREAM
On July 13, 2011, the Company entered into a Gold Stream with
Donner via a back-to-back agreement with Sandstorm Metals &
Energy to purchase 17.5% of the life of mine gold and gold equivalent
of silver (“Gold equivalent”) produced from the Bracemac-McLeod
Mine which is operated by Xstrata Canada Corporation (“Xstrata”).
Donner is the owner of a 35% joint venture interest in the Bracemac-
McLeod Mine.
For consideration, the Company will make an upfront payment
of $5.0 million by June 30, 2012 plus ongoing per ounce of gold or
Gold equivalent payments equal to the lesser of $350 and the then
prevailing market price of gold. Donner has provided a guarantee,
via a back-to-back agreement with Sandstorm Metals & Energy, that
the Company will receive a minimum of $5.0 million in pre-tax
cash flows between 2013 and 2016 from the Bracemac-McLeod
Gold Stream.
Donner has the option until July 13, 2013 to repurchase 50% of
the Donner Gold Stream by making a $3.5 million payment to the
Company, upon receipt of which, the percentage of gold and Gold
equivalent the Company is entitled to purchase will decrease to 8.75%.
The Bracemac-McLeod Mine is a high grade volcanogenic massive
sulphide deposit located in the historical and prolific mining district
of Matagami, Quebec. Continuous mining and milling operations
have been active in the Matagami district for almost fifty years
with ten previously operating mines and one current producing
mine. Xstrata plans to utilize the existing Matagami mill to produce
concentrates of zinc and copper. The Bracemac-McLeod Mine will
be an underground mine, accessed via a ramp, and is expected to
begin ore production in early 2013.
SUBSEQUENT EVENT
On January 12, 2012, the Company announced that it has entered into a revolving credit agreement with The Bank of Nova Scotia, which
will allow the Company to borrow up to $50 million (“the Revolving Loan”). The Revolving Loan has a term of three years, which is
extendable by mutual consent of The Bank of Nova Scotia and the Company. The Revolving Loan will be used for the acquisition of
Gold Streams. The amounts drawn on the Revolving Loan are subject to interest at LIBOR plus 3.00%-4.25% per annum, and the undrawn
portion of the Revolving Loan is subject to a standby fee of 0.75%-1.05% per annum, dependent on the Company’s leverage ratio.
GOLD STREAMS Donner Metals Ltd.

16
Summary of Annual Results
In $000sYear Ended
December 31, 2011Year Ended
December 31, 2010Nine Months Ended December 31, 20092
Gold ounces sold 18,516 2,322 -
Gold sales $ 29,967 $ 3,148 -
Average realized gold price per ounce 1,618 1,356 -
Average cash cost per ounce 1 420 396 -
Cash flow from operations 20,662 463 (884)
Cash flow from operations per share (basic) 1 0.06 0.00 (0.01)
Cash flow from operations per share (diluted) 1 0.05 0.00 (0.01)
Net income (loss) 12,489 (2,838) 1,002
Basic income (loss) per share 0.04 (0.01) 0.01
Diluted income (loss) per share 0.03 (0.01) 0.01
Total assets 152,792 131,732 74,137
Total long-term liabilities - - -
1. See non-IFRS measures section below.
2. The 2009 figures reported are under GAAP. The Company changed its fiscal year-end in 2009 resulting in a nine-month transition year
from April 1, 2009 to December 31, 2009.
Year Ended December 31, 2011
In $000s Ounces sold Sales Cost of sales Depletion Other incomeNet income
(loss)Cash flow
from operations
Aurizona 7,021 $ 11,332 $ 2,808 $ 1,032 $ - $ 7,492 $ 8,784
Bachelor Lake - - - - - - -
Black Fox 6,105 9,863 3,052 2,614 - 4,197 6,810
Bracemac-McLeod - - - - - - -
Ming - - - - - - -
Santa Elena 4,792 7,790 1,677 1,431 - 4,682 6,113
Summit 598 982 240 447 1,101 1,396 1,845
Corporate - - - - - (5,278) (2,890)
Consolidated 18,516 $ 29,967 $ 7,777 $ 5,524 $ 1,101 $ 12,489 $ 20,662
Year Ended December 31, 2010
In $000s Ounces sold Sales Cost of sales Depletion Other incomeNet income
(loss)Cash flow
from operations
Aurizona 2,017 $ 2,729 $ 807 $ 296 $ - $ 1,626 $ 1,769
Bachelor Lake - - - - - - -
Black Fox - - - - - - -
Bracemac-McLeod - - - - - - -
Ming - - - - - - -
Santa Elena 187 256 65 42 - 149 190
Summit
118163 47 6 - 110 68
Corporate - - - - - (4,723) (1,564)
Consolidated 2,322 $ 3,148 $ 919 $ 344 $ - $ (2,838) $ 463
The Company had no Commodity Streams in production as at December 31, 2009.

17
Summary of Quarterly Results
Quarters Ended
In $000s Dec. 31, 2011 Sept. 30, 2011 June 30, 2011 Mar. 31, 2011
Gold ounces sold 6,611 5,561 3,706 2,638
Gold sales $ 11,125 $ 9,592 $ 5,582 $ 3,668
Average realized gold price per ounce 1,683 1,725 1,506 1,390
Average cash cost per ounce 2 407 428 434 417
Cash flow from operations 7,843 8,558 2,645 1,616
Cash flow from operations per share (basic) 2 0.02 0.03 0.01 0.01
Cash flow from operations per share (diluted)2 0.02 0.02 0.01 0.00
Net income (loss) 4,879 4,391 2,261 958
Basic income (loss) per share 0.02 0.01 0.01 0.00
Diluted income (loss) per share 0.01 0.01 0.01 0.00
Total assets 152,792 147,607 137,472 133,474
Total long-term liabilities - - - -
In $000s Dec. 31, 20101 Sept. 30, 20101 June 30, 20101 Mar. 31, 20101
Gold ounces sold 1,939 257 126 -
Gold sales $ 2,672 322 $ 155 $ -
Average realized gold price per ounce 1,378 1,251 1,233 -
Average cash cost per ounce 2 395 400 400 -
Cash flow from operations 1,731 (105) (386) (792)
Cash flow from operations per share (basic) 2 0.01 (0.00) (0.00) (0.00)
Cash flow from operations per share (diluted) 2 0.01 (0.00) (0.00) (0.00)
Net income (loss) 1,690 (225) (1,065) (4,282)
Basic income (loss) per share 0.01 (0.00) (0.00) (0.02)
Diluted income (loss) per share 0.01 (0.00) (0.00) (0.02)
Total assets 131,732 74,848 74,975 74,814
Total long-term liabilities - - - -
1. The quarters in 2010 were previously reported under GAAP and have been restated to IFRS.
2. See non-IFRS measures section below.
The Company’s operating segments for the three months ended December 31, 2011 are summarized in the table below:
In $000s Ounces sold Sales Cost of sales Depletion Other incomeNet income
(loss)Cash flow
from operations
Aurizona 2,382 $ 4,010 $ 953 $ 351 $ - $ 2,707 $ 3,318
Bachelor Lake - - - - - - -
Black Fox 1,701 2,886 850 728 - 1,308 2,035
Bracemac-McLeod - - - - - - -
Ming - - - - - - -
Santa Elena 2,528 4,229 885 777 - 2,567 3,344
Summit - - - - - - -
Corporate - - - - - (1,703) (854)
Consolidated 6,611 $ 11,125 $ 2,688 $ 1,856 $ - $ 4,879 $ 7,843

18
The Company’s operating segments for the three months ended September 30, 2011 are summarized in the table below:
In $000s Ounces sold Sales Cost of sales Depletion Other incomeNet income
(loss)Cash flow
from operations
Aurizona 2,233 $ 3,881 $ 894 $ 328 $ - $ 2,659 $ 2,987
Bachelor Lake - - - - - - -
Black Fox 2,043 3,489 1,021 875 - 1,593 2,274
Bracemac-McLeod - - - - - - -
Ming - - - - - - -
Santa Elena 938 1,612 328 288 - 996 1,544
Summit 347 610 139 393 327 405 843
Corporate - - - - - (1,262) 910
Consolidated 5,561 $ 9,592 $ 2,382 $ 1,884 $ 327 $ 4,391 $ 8,558
The Company’s operating segments for the three months ended June 30, 2011 are summarized in the table below:
In $000s Ounces sold Sales Cost of sales Depletion Other incomeNet income
(loss)
Cash flow from (used in)
operations
Aurizona 984 $ 1,466 $ 393 $ 145 $ - $ 928 $ 1,073
Bachelor Lake - - - - - - -
Black Fox 1,692 2,555 845 725 - 985 1,710
Bracemac-McLeod - - - - - - -
Ming - - - - - - -
Santa Elena 860 1,299 301 263 - 735 998
Summit 170 262 68 38 774 930 263
Corporate - - - - - (1,317) (1,399)
Consolidated 3,706 $ 5,582 $ 1,607 $ 1,171 $ 774 $ 2,261 $ 2,645
The Company’s operating segments for the three months ended March 31, 2011 are summarized in the table below:
In $000s Ounces sold Sales Cost of sales Depletion Other incomeNet income
(loss)
Cash flow from (used in)
operations
Aurizona 1,421 $ 1,975 $ 569 $ 210 $ - $ 1,196 $ 1,406
Bachelor Lake - - - - - - -
Black Fox 670 932 335 287 - 310 597
Bracemac-McLeod - - - - - - -
Ming - - - - - - -
Santa Elena 467 650 163 101 - 386 487
Summit 80 111 32 16 - 63 79
Corporate - - - - - (997) (953)
Consolidated 2,638 $ 3,668 $ 1,099 $ 614 $ - $ 958 $ 1,616

19
YEAR ENDED DECEMBER 31, 2011 COMPARED TO THE YEAR ENDED DECEMBER 31, 2010
For the year ended December 31, 2011, net income and cash flow from operations were $12.5 million and $20.7 million, respectively,
compared with a net loss of $2.8 million and cash flow of $0.5 million for the comparable period in 2010. The increase in net income
and cash flow from operations is attributable to a combination of factors including:
• 697% increase in the number of gold ounces sold, due to:
i. An increase in deliveries relating to the Aurizona Mine, reflecting the ramping up of the milling operations which achieved
commercial production in 2011;
ii. The Black Fox Mine entering commercial production in the first quarter of 2011;
iii. An increase in gold deliveries from Santa Elena Mine reflecting the continued ramping up of operations; and
• 19% increase in the average realized selling price of gold; partially offset by
• A $1.0 million increase in both administration and non-cash share based payment expense primarily driven by the Company’s growth
in operations.
Sales continue to be earned from Gold Streams in geographically secure countries with 100% of revenues being generated by assets
located in North America and Brazil.
THREE MONTHS ENDED DECEMBER 31, 2011 COMPARED
TO THE THREE MONTHS ENDED SEPTEMBER 30, 2011
For the three months ended December 31, 2011, net income and
cash flow from operations were $4.9 million and $7.8 million,
respectively, compared with $4.4 million and $8.6 million for the
three month period ended September 30, 2011. The variance is
attributable to a combination of factors including:
• A 19% increase in the number of gold ounces sold, primarily due to:
i. 107% increase in gold deliveries from the Santa Elena
Mine and the additional sales of 589 gold ounces which
were previously held in inventory at the end of the third
quarter; and
ii. 7% increase in gold deliveries from the Aurizona Mine
reflecting the first full quarter of the mine reaching feasi-
bility levels of production, partially offset by
iii. A 17% decrease in gold deliveries from the Black Fox Mine
due to a slower ramp up of underground production and
higher than expected dilution in the underground mine;
• A $0.8 million decrease in changes in non-cash working capi-
tal, primarily driven by the receipt of the Santa Fe production
deferral payment during the three months ended September
30, 2011; and
• A 2% decrease in the average realized selling price of gold.
THREE MONTHS ENDED DECEMBER 31, 2011 COMPARED TO THE THREE MONTHS ENDED JUNE 30, 2011
For the three months ended December 31, 2011, net income and
cash flow from operations were $4.9 million and $7.8 million,
respectively, compared with $2.3 million and $2.6 million for the
three month period ended June 30, 2011. The increase in net income
and cash flow from operations is attributable to a combination of
factors including:
• A 78% increase in the number of gold ounces sold with such
increase being primarily related to increased production at
the Aurizona, Black Fox, and Santa Elena Mines reflecting the
continued ramping up of operations; and
• A 12% increase in the average realized selling price of gold.
THREE MONTHS ENDED DECEMBER 31, 2011 COMPARED
TO THE THREE MONTHS ENDED MARCH 31, 2011
For the three months ended December 31, 2011, net income and
cash flow from operations were $4.9 million and $7.8 million,
respectively, compared with $1.0 million and $1.6 million for the
three month period ended March 31, 2011. The increase in net income
and cash flow from operations is attributable to a combination of
factors including:
• A 151% increase in the number of gold ounces sold with such
increase being primarily related to increased production at
the Aurizona, Black Fox, and Santa Elena Mines reflecting the
continued ramping up of operations; and
• A 21% increase in the average realized selling price of gold.

20
THREE MONTHS ENDED DECEMBER 31, 2011 COMPARED
TO THE THREE MONTHS ENDED DECEMBER 31, 2010
During the three months ended December 31, 2010, the Company
earned $1.7 million of net income, primarily resulting from (i) $1.6
million in gross profit driven by the sale of 1,939 ounces of gold; and
(ii) a foreign exchange gain of $1.4 million from the appreciation
of the Company’s Canadian dollar denominated currency. These
gains were partially offset by (i) administration expenses of $0.6
million; and (ii) a non-cash share-based payment of $0.2 million.
Ounces of gold sold during the three months ended December 31,
2011 were higher than the three months ended December 31, 2010
as the Aurizona Mine, Santa Elena Mine, and Summit Mine began
initial production late in 2010 and the Company began purchasing
gold from the Black Fox Mine in 2011.
THREE MONTHS ENDED DECEMBER 31, 2011 COMPARED
TO THE REMAINING QUARTERS
During the three months ended September 30, 2010, the Company
incurred a net loss of $0.2 million primarily resulting from admin-
istration expenses and project evaluation expenditures that where
in excess of the Company’s $0.2 million gross profit. During the
three months ended June 30, 2010, the Company incurred a net
loss of $1.1 million primarily resulting from a loss of $0.7 million
on the fair value of the warrant liability.
The Company did not have any gold sales prior to the three months
ended June 30, 2010. Therefore, previous quarter results are not
comparable to the quarters ended June 30, 2010 and thereafter.
CHANGE IN TOTAL ASSETS
The Company’s total assets increased by $5.2 million from September 30, 2011 to December 31, 2011 primarily resulting from operating
cash flows which was partially offset by depletion expense. The Company’s total assets increased by $10.1 million from June 30, 2011 to
September 30, 2011 primarily resulting from operating cash flows. Total assets increased by $4.0 million from March 31, 2011 to June 30,
2011 primarily resulting from operating cash flows. Total assets increased by $1.7 million from December 31, 2010 to March 31, 2011 primarily
from operating cash flows. Total assets at December 31, 2010 increased primarily due to an equity financing completed on October 19,
2010 where the Company raised net proceeds of $51.4 million. Total assets increased during the three months ended December 31, 2009,
compared to prior periods, due to the Company completing an equity financing on October 14, 2009 for net proceeds of $32.8 million.
In addition, total assets increased during the three months ended June 30, 2009 due to the Company completing an equity financing on
April 23, 2009 for net proceeds of $35.3 million.
Non-IFRS Measures
The Company has included, throughout this document, certain non-IFRS performance measures, including (i) average cash cost per
ounce; and (ii) Cash flow from operations per share (basic and diluted).
i. Average cash cost per ounce is calculated by dividing the Company’s costs of sales by the number of ounces sold. The Com-
pany presents average cash cost per ounce as it believes that certain investors use this information to evaluate the Company’s
performance in comparison to other companies in the precious metals mining industry who present results on a similar basis.
ii. Cash flow from operations per share (basic and diluted) is calculated by dividing cash generated by operating activities by the
weighted average number of shares outstanding (basic and diluted). The Company presents operating cash flow per share as it
believes that certain investors use this information to evaluate the Company’s performance in comparison to other companies
in the precious metals mining industry who present results on a similar basis.
These non-IFRS measures do not have any standardized meaning prescribed by IFRS, and other companies may calculate these measures
differently. The presentation of these non-IFRS measures is intended to provide additional information and should not be considered
in isolation or as a substitute for measures of performance prepared in accordance with IFRS.

21
Liquidity and Capital Resources
As of December 31, 2011 the Company had cash of $13.1 million (December 31, 2010 – $28.5 million) and working capital of $12.3 million
(December 31, 2010 – $27.9 million). Cash decreased from December 31, 2010 due to Sandstorm making payments of $13.0 million to
Rambler and $20.0 million to Metanor as upfront payments in connection with their respective Gold Streams, which was partially offset
by the Company’s 2011 operating cash flow. As described earlier, the Company has an additional $50 million available under its revolving
bank debt facility. In the opinion of management, cash flows, cash balances and available credit facilities are sufficient to support the
Company’s normal operating requirements on an ongoing basis.
The Company has an upfront payment commitment to Donner of $5.0 million (due June 30, 2012). The Company plans on funding this
commitment with working capital on hand as of December 31, 2011.
Contractual Obligations
In connection with its Gold Streams, the Company has committed to purchase the following:
Gold Stream % of life of mine gold
Per ounce cash payment: lesser of below and the then
prevailing market price of gold
Inflationary adjustment to per ounce cash payment
Aurizona 17% $4001% annual inflationary adjustment
beginning on February 9, 2014
Bachelor Lake 20% $500 None
Black Fox 12% $500An inflationary adjustment beginning in 2013, not to exceed 2% per annum
Bracemac-McLeod 17.5% $350 None
Ming25% of the first 175,000 ounces of
gold produced, and 12% thereafter$nil N/A
Santa Elena 20% $3501% annual inflationary adjustment
beginning on July 13, 2014
Summit50% of the first 10,000 ounces of
gold produced, and 22% thereafter$400
1% annual inflationary adjustment beginning 3 years after the mine achieves commercial production
In connection with the Bracemac-McLeod Gold Stream, the Company has committed an upfront payment of $5.0 million by June 30, 2012.
The Company has a commitment to Sandstorm Metals & Energy to share a reasonable allocation, agreed to by both companies, of costs
paid by Sandstorm Metals & Energy that are incurred for the benefit of Sandstorm. Sandstorm Metals & Energy is contractually obligated
to make annual rental payments ranging from $0.2 million to $0.4 million during 2011-2016 and Sandstorm will reimburse Sandstorm
Metals & Energy for a reasonable allocation of these rental costs.

22
Share Capital
As of March 13, 2012 the Company had 346,458,871 common shares outstanding.
A summary of the Company’s outstanding share purchase options as of March 13, 2012, are as follows:
Outstanding Vested Exercise Price (C$) Expiry Date
40,000 40,000 $0.10 July 31, 2012
3,500,000 3,500,000 $0.45 June 16, 2014
700,000 700,000 $0.44 July 6, 2014
2,000,000 2,000,000 $0.435 July 28, 2014
100,000 66,667 $0.67 May 19, 2015
6,820,000 4,533,336 $0.68 November 26, 2015
455,000 - $1.26 August 25, 2016
5,735,000 - $1.27 November 25, 2016
19,350,000 10,840,003
A summary of the Company’s outstanding share purchase warrants as of March 13, 2012 are as follows:
Warrants Outstanding Exercise Price Expiry Date
SSL.WT 79,751,497 $0.60 April 23, 2014
SSL.WT.A 19,689,525 $1.00 October 19, 2015
99,441,022
The Company issued compensation warrants (the “Compensation Warrants”) to agents in 2009. Each Compensation Warrant entitles the
holder to acquire one unit comprised of one common share of the Company and one-half of a share purchase warrant. Each Compensation
Warrant has an exercise price of $0.33 and 1,227,550 of the Compensation Warrants were outstanding as of March 13, 2012. Each whole
share purchase warrant issued upon exercise of the Compensation Warrants will entitle the holder to purchase one common share at
a price of $0.60 until April 23, 2014.
Financial Instruments
The Company’s financial instruments consist of cash, trade and other receivables, investments, trade and other payables, and the warrant
liability. The warrant liability represented the derivative liability that arose from warrants issued with an exercise price denominated in
Canadian dollars as the Company would have received a variable amount of cash in its functional currency of U.S. dollars when those
warrants were exercised. All financial instruments are initially recorded at fair value.
CREDIT RISK
The Company’s credit risk is limited to trade and other receivables in
the ordinary course of business. The Company sells gold exclusively
to large corporations with strong credit ratings and the balance of
trade and other receivables owed to the Company in the ordinary
course of business is not significant. Therefore, the Company is
not exposed to significant credit risk and overall, the Company’s
credit risk has not changed significantly from the prior year.
CURRENCY RISK
The Company is exposed to the fluctuations of the Canadian to U.S.
dollar as from time to time, as it holds investments denominated in
the Canadian dollar. As at December 31, 2011 and 2010, the Company
held an insignificant portion of its financial instruments in Canadian
dollars and was not exposed to significant currency risk.
OTHER RISKS
The Company is not subject to significant interest rate or other
price risks and the Company’s exposure to these risks has not
changed significantly from the prior year.

23
Risks to Sandstorm
The primary risk factors affecting the Company are set forth below. For additional discussion of risk factors, please refer to the Company’s
annual information form dated July 22, 2011, which is available on www.sedar.com.
RISKS RELATING TO MINERAL PROJECTS
To the extent that they relate to the production of gold from, or the
operation of, the Aurizona Mine, the Santa Elena Mine, the Summit
Mine, the Ming Mine, the Black Fox Mine, the Bachelor Lake Mine,
and the Bracemac-McLeod Mine (the “Mines”), the Company will be
subject to the risk factors applicable to the operators of such Mines.
NO CONTROL OVER MINING OPERATIONS
The Company has no contractual rights relating to the operation
or development of the Mines. Except for any payments which may
be payable in accordance with applicable completion guarantees
or cash flow guarantees, the Company will not be entitled to any
material compensation if these mining operations do not meet
their forecasted gold production targets in any specified period
or if the Mines shut down or discontinue their operations on a
temporary or permanent basis. The Mines may not commence
commercial production within the time frames anticipated, if at
all, and there can be no assurance that the gold production from
such properties will ultimately meet forecasts or targets. At any
time, any of the operators of the Mines or their successors may
decide to suspend or discontinue operations.
GOVERNMENT REGULATIONS
The Mines are subject to various foreign laws and regulations govern-
ing prospecting, exploration, development, production, exports,
taxes, labour standards, waste disposal, protection and remediation
of the environment, reclamation, historic and cultural resources
preservation, mine safety and occupation health, handling, storage
and transportation of hazardous substances and other matters. The
costs of discovering, evaluating, planning, designing, developing,
constructing, operating and closing the Mines in compliance with
such laws and regulations are significant. It is possible that the
costs and delays associated with compliance of such laws and
regulations could become such that the owners or operators of the
Mines would not proceed with the development of or continue to
operate the Mines. Moreover, it is possible that future regulatory
developments, such as increasingly strict environmental protection
laws, regulations and enforcement policies thereunder, and claims
for damages to property and persons resulting from the Mines could
result in substantial costs and liabilities in the future.
INTERNATIONAL OPERATIONS
The Aurizona Mine is located in Brazil, the Santa Elena Mine is
located in Mexico, the Summit Mine is located in the United
States of America, and each of the Ming Mine, the Black Fox Mine,
Bachelor Lake Mine, and the Bracemac-McLeod Mine is located
in Canada and as such the Mines are exposed to various levels of
political, economic and other risks and uncertainties. These risks
and uncertainties include, but are not limited to, terrorism, hostage
taking, military repression, crime, political instability, currency
controls, extreme fluctuations in currency exchange rates, high
rates of inflation, labour unrest, the risks of war or civil unrest,
expropriation and nationalization, renegotiation or nullification
of existing concessions, licenses, permits, approvals and contracts,
illegal mining, changes in taxation policies, restrictions on foreign
exchange and repatriation, and changing political conditions, and
governmental regulations. Changes, if any, in mining or investment
policies or shifts in political attitude in Mexico, Brazil, the United
States of America or Canada may adversely affect the operations
or profitability of the Mines in these countries. Operations may
be affected in varying degrees by government regulations with
respect to, but not limited to, restrictions on production, price
controls, export controls, currency remittance, income taxes,
expropriation of property, foreign investment, maintenance of
claims, environmental legislation, land use, land claims of local
people, water use, mine safety and the rewarding of contracts to
local contractors or require foreign contractors to employ citizens
of, or purchase supplies from, a particular jurisdiction. Failure to
comply strictly with applicable laws, regulations and local practices
relating to mineral right applications and tenure, could result in
loss, reduction or expropriation of entitlements, or the imposition
of additional local or foreign parties as joint venture partners with
carried or other interests. The occurrence of these various factors
and uncertainties cannot be accurately predicted and could have
an adverse effect on the Mines.
24
INCOME TAXES
The Company has incorporated a subsidiary in Barbados, Sandstorm Gold (Barbados) Limited, which entered into Gold Streams in con-
nection with the Aurizona, Santa Elena, and Summit transactions. No assurance can be given that new taxation rules will not be enacted
or that existing rules will not be applied in a manner which could result in the Company’s future profits being subject to taxation.
COMMODITY PRICES
The price of the common shares, warrants, and the Company’s
financial results may be significantly adversely affected by a decline
in the price of gold. The price of gold fluctuates widely, especially
in recent years, and is affected by numerous factors beyond the
Company’s control, including but not limited to, the sale or purchase
of gold by various central banks and financial institutions, interest
rates, exchange rates, inflation or deflation, fluctuation in the value
of the United States dollar and foreign currencies, global and regional
supply and demand, and the political and economic conditions of
major gold-producing countries throughout the world. In the event
that the prevailing market price of gold is less than $500 per ounce
(subject to an inflationary adjustment beginning in 2013, not to
exceed 2% per annum) in the case of the Brigus Gold Stream, $500
per ounce in the case of the Bachelor Lake Gold Stream, $400 per
ounce (subject to a 1% annual inflationary adjustment beginning on
February 9, 2014) in the case of the Aurizona Gold Stream, $400 per
ounce (subject to a 1% annual inflationary adjustment beginning 3
years after the mine achieves commercial production) in the case
of the Summit Gold Stream, $350 per ounce (subject to a 1% annual
inflationary adjustment beginning on July 13, 2014) in the case of
the Santa Elena Gold Stream, and $350 per ounce in the case of the
Bracemac-McLeod Gold Stream, the purchase price will be the then
prevailing market price per ounce of gold and the Company will
not generate positive cash flow or earnings on those Gold Streams.
Changes in Accounting Policies
EARLY ADOPTED JANUARY 1, 2010
The IASB issued amendments to IFRS 1: First-time Adoption of IFRS regarding severe hyperinflation and the removal of fixed dates for
first-time adopters. This amendment is effective July 1, 2011 with earlier application permitted.
The IASB issued amendments to IFRS 7: Financial Instruments: Disclosures for the transfer of financial assets. This amendment is effective
July 1, 2011 with earlier application permitted.
The IASB issued IFRS 9: Financial Instruments which establishes the requirements for recognizing and measuring financial assets and
financial liabilities. This new standard is effective January 1, 2015 with earlier application permitted.
The IASB issued amendments to IAS 12: Income Taxes for the recovery of underlying assets. This amendment is effective January 1, 2012
with earlier application permitted
The Company elected to early adopt all the above standards and amendments effective January 1, 2010.
FUTURE CHANGES IN ACCOUNTING POLICIES
The IASB issued a number of new and revised accounting standards
which are effective for annual periods beginning on or after January
1, 2013, with early adoption permitted. These standards include
the following:
• IFRS 10, Consolidated Financial Statements;
• IFRS 11, Joint Arrangements;
• IFRS 12, Disclosure of Interests in Other Entities;
• IFRS 13, Fair Value Measurement;
• Amended IAS 27, Separate Financial Statements; and
• Amended IAS 28, Investments in Associates and Joint Ventures.
In June 2011, the IASB also issued amended IAS 1, Presentation
of Financial Statements, which is effective for annual periods
beginning on or after July 1, 2012.
These new and revised accounting standards have not yet been
adopted by Sandstorm, and the Company has not yet completed the
process of assessing the impact that they will have on its financial
statements, or whether to early adopt any of the new requirements.

25
Reserves and Resources
The Reserves and Resources in this MD&A reflect the reserves and resources for the mines at which the Company has Gold Streams,
adjusted where applicable to reflect the Company’s percentage entitlement to gold produced from the mines.
Proven and Probable Reserves Attributable to Sandstorm (1)
PROVEN PROBABLE PROVEN & PROBABLE
Tonnes kt
Grade Au g/t
Contained oz
Tonnes kt
Grade Au g/t
Contained oz
Tonnes kt
Grade Au g/t
Contained oz
Santa Elena Open Pit (11 – 15)
- - - 692 1.96 43,560 692 1.96 43,560
Ming (18 – 21) 209 3.24 21,636 183 2.61 15,340 392 2.40 36,976
Black Fox
Stockpile & Open Pit (30 – 38)
42 1.60 2,214 379 3.20 39,350 421 3.04 41,564
Underground (30 – 38) - - - 352 5.90 67,201 352 5.90 67,201
Bachelor Lake (40 – 42) 39 8.33 10,349 130 7.10 29,687 168 7.38 40,036
Summit (44 – 46) - - - 171 0.14 24,405 171 0.14 24,405
Bracemac-McLeod (48 – 50, 54 – 55)
488 0.39 6,120 164 0.54 2,853 652 0.43 8,973
Total 40,319 222,396 262,715
Note: Luna has not updated its mineral reserves estimate for the Aurizona Gold Operation based on the new mineral resources discussed
below. For greater clarity, Luna’s mineral reserves estimate effective as of July 13, 2010 previously disclosed by the Company is based on
an earlier mineral resource estimate which did not include the additional drilling data.
Measured and Indicated Resources Attributable to Sandstorm (1,2)
MEASURED INDICATED MEASURED & INDICATED
Tonnes kt
Grade Au g/t
Contained oz
Tonnes kt
Grade Au g/t
Contained oz
Tonnes kt
Grade Au g/t
Contained oz
Aurizona (3 – 10) 1,833 1.13 66,470 11,429 1.28 471,750 13,262 1.26 538,220
Santa Elena (11 – 14, 16) Underground
- - - 198 1.83 11,666 198 1.83 11,666
Ming (17, 21 – 28) 411 2.47 32,664 3,004 0.35 34,262 3,415 0.61 66,926
Black Fox
Open Pit (29 – 38) - - - 380 4.40 54,264 380 4.40 54,264
Underground (29 – 38) - - - 301 7.20 69,502 301 7.20 69,502
Bachelor Lake (39, 40, 43) 39 8.80 10,901 130 7.49 31,270 169 7.79 42,171
Bracemac-McLeod (47 – 49, 51 – 53, 55)
455 0.45 6,580 180 0.48 3,248 635 0.48 9,828
Total 116,615 675,962 792,577

26
NOTES:1. All Mineral Reserves and Mineral Resources have been calculated in accordance with the standards of the Canadian Institute of Mining,
Metallurgy and Petroleum (“CIM”) and NI 43-101.
2. Mineral Resources which are not Mineral Reserves do not demonstrate economic viability.
For the Aurizona Mine:
3. Aurizona Mineral Reserves are fully included in the Mineral
Resources.
4. Piaba pit constrained resources are reported at a cut-off grade of
0.30 g/t Au inside a pit optimization shell based on a gold price
of $1,500 per ounce.
5. Piaba underground resources are reported at a cut-off grade of
0.75 g/t Au outside the pit optimization shell. The cut-off grade
has been calculated at a gold price of $1,500 per ounce.
6. Tatajuba database consists of 4,740 meters in 45 diamond drill
holes (2008). The Tatajuba resources are not constrained by a pit
optimization shell and are reported at a cutoff grade of 0.30 g/t Au.
7. 25g/t Au capping at Piaba and 10 g/t Au capping at Tatajuba.
Block dimensions are 10m x 10m in the xy plane and 3m on the z
axis. Piaba database consists of 69,578 meters consisting of 335
diamond drill holes and 142 reverse circulation holes and 374
auger drill holes.
8. All Mineral Resources have been estimated in accordance with
the CIM Standards and NI 43-101.
9. Mineral resources that are not mineral reserves do not have a
demonstrated economic viability.
10. The Mineral Resource estimates set out in the above table have
been reviewed and verified by Leah Mach, C.P.G., M.Sc., Principal
Resource Geologist of SRK Consulting (US) (“SRK”), who is a quali-
fied person under NI 43-101.
Inferred Resources attributable to Sandstorm (1,2)
INFERRED
Tonnes kt Grade Au g/t Contained oz
Aurizona (3 – 10) 2,589 1.47 122,400
Santa Elena Underground (11 – 14, 16)
376 1.53 18,494
Ming (17, 21 – 28) 591 1.83 34,695
Black Fox
Open Pit (29 – 38) 80 2.60 6,717
Underground (29 – 38) 14 5.80 2,585
Bachelor Lake (39, 40, 43) 85 6.52 17,873
Summit (44 – 46) 16 0.14 2,261
Bracemac-McLeod () 460 1.06 15,673
Total 251,738
For the Santa Elena Mine:
11. Santa Elena Mineral Resources are inclusive of Mineral Reserves.
12. All Mineral Reserves and Resources have been estimated in ac-
cordance with NI 43-101.
13. The Mineral Reserve estimates set out in the table above have
been reviewed and verified by Nathan Eric Fier, C.P.G., P.Eng.,
Chief Operating Officer of SilverCrest, who is a qualified person
under NI 43-101.
14. Mineral Reserves and Resources are reported as of January 2012.
15. Based on $1,000 per ounce of gold and $18 per ounce of silver,
cut-off grade of 0.38 grams per tonne gold equivalent with ap-
plied metallurgical recoveries. Ag:Au is 55:1. Estimated 1,336,000
ore tonnes were mined at Santa Elena in 2010 and 2011 grading
1.41 grams per tonne gold and 46.51 grams per tonne silver and
subtracted from Probable Reserves. All numbers are rounded.
Excludes potential metal inventory for leach pad re- treatment
during Expansion.
16. Based on $1,000 per ounce of gold and $18 per ounce of silver,
cut-off grade is 1.77 grams per tonne gold equivalent with applied
metallurgical recoveries. Ag:Au is 55:1.
27
For the Ming Mine:
17. Ming Mineral Reserves are fully included in the Mineral Resources.
18. Mineral Reserves are reported as of August 9, 2010.
19. The mineral reserves have been reviewed and verified by Larry
Pilgrim, P.Geo., Chief Geologist of Rambler, who is a qualified
person under NI 43-101.
20. Cut-off grade of 1.25 grams per tonne gold.
21. Numbers have been rounded.
22. Mineral Resources are reported as of August 9, 2010.
23. Mineral Resources that are not Mineral Reserves do not have
demonstrated economic viability.
24. The mineral resource estimates have been reviewed and verified
by Larry Pilgrim, P.Geo., Chief Geologist of Rambler, who is a
qualified person under NI 43-101.
25. An underground cut-off was set at $70 per tonne for all longhole
mining methods.
26. Cut-off reserves are based on 15% dilution, 90% mining recovery,
copper recovery of 92.4%, and gold recovery of 66.4%.
27. Cut-off grades of 1.0% copper for the massive sulphides, 1.25
grams per tonne of gold for the 1806 zone, and 1.25% copper for
the stringer sulphides.
28. Mineral resources are estimated using long-term prices of $1,000
per ounce of gold.
For the Black Fox Mine:
29. Black Fox Mineral Reserves are fully included in the Mineral
Resources.
30. Black Fox Reserves and Resources are reported as of October
31, 2010.
31. The mineral reserves and resources have been reviewed and
verified by Howard Bird, Vice President, Exploration of Brigus,
who is a qualified person under NI 43-101.
32. Cut-off grade for the open-pit reserves and resources is 0.88 grams
per tonne gold.
33. Cut-off grade for the underground reserves and resources is 2.54
grams per tonne gold.
34. Metal prices used for initial cut-off calculations are $1,150 per
ounce for 88% of the gold sold and $500 per ounce of gold sold
through the Black Fox Gold Stream.
35. The estimated underground reserves include 10% unplanned
dilution at 0 grams per tonne from the backfill and 15% planned
dilution at one gram per tonne from the walls for a total dilution
of 25%. The estimated open pit reserves include 30% dilution at 0
grams per tonne and a 95% mining recovery factor for both. The
higher average gold grades for the open pit and underground in
the Indicated Resources compared to the Probable Reserves are
the result of no dilution being applied to Indicated Resources.
36. The mineral resources were estimated using the ordinary krig-
ing method.
37. The mineral reserves were estimated from the life of mine plan,
which defined sustaining capital requirements and mine operat-
ing costs, to demonstrate that these reserves can be economically
extracted and processed. Mining losses and dilution were deter-
mined based on sub-surface geotechnical conditions, the mining
method and equipment capabilities for each area of the mine.
38. Contained metal in estimated reserves remains subject to metal-
lurgical recovery losses.
For the Bachelor Lake Mine:
39. Bachelor Lake mineral reserves are fully included in the Mineral
Resources.
40. The mineral reserve and resource estimates for the Bachelor Lake
Mine set out in the table above have been reviewed and verified
by Pascal Hamelin, Vice President of Metanor, who is a qualified
persons under NI 43-101. The Mineral Reserves are classified as
proven and probable, and are based on the CIM Standards.
41. The underground mineral reserves have been calculated using a
cut-off grade of 3.43 grams per ton, recovery of 90%, and dilution
of 10% in the stoping areas.
42. Proven and Probable Mineral Reserves are a subset of Measured
and Indicated Mineral Resources.
43. Mineral Resources are not known with the same degree of certainty
as Mineral Reserves and do not have demonstrated economic
viability.

28
Cautionary Language Regarding Reserves and Resources
The Technical Reports supporting the scientific and technical information contained in this document are available at
www.sedar.com under the profile of Luna, SilverCrest, Rambler, Brigus, Metanor, Santa Fe, and Donner for the Aurizona
Mine, Santa Elena Mine, Ming Mine, Black Fox Mine, Bachelor Lake Mine, Summit Mine, and Bracemac-McLeod Mine
respectively. Mineral Resources which are not Mineral Reserves, do not have demonstrated economic viability.
For the Summit Mine:
44. Summit Mineral Reserves and Resources are reported as of De-
cember 2010.
45. The mineral reserves and resources have been reviewed and
verified by Douglas F. Irving, P.Eng, who is a qualified person
under NI 43-101.
For the Bracemac-McLeod Mine:
47. Bracemac-McLeod Mineral Reserves are fully included in the
Mineral Resources.
48. Bracemac-McLeod Reserves and Resources are reported as of
September 2010.
49. The mineral reserves and resources have been approved by Robin
Adair, Vice President Exploration for Donner, who is a qualified
person under NI 43-101.
50. After applying dilution, losses and a 95% mining recovery, the
tonnage of each stope was integrated into the mineral reserves
provided its net smelter return value was greater than or equal to
$65 per tonne, which represents the average preliminary operating
cost estimated for the Bracemac-McLeod Property (comprised of
mining, ore processing and general and administration costs).
This process did not modify the resource block model envelopes.
51. Bracemac-Mineral Resources are estimated under the definition
of the Australian Code for Mineral Resources and Ore Reserves
Reporting of Exploration Results, using a net smelter return (“NSR”)
cut-off value of $43.77.
52. Metal prices used in the calculation of the NSR are: $0.80 per
pound of zinc, $2.50 per pound of copper, $12.00 per ounce
of silver and $1,000 per ounce of gold, using an exchange rate
of C$1.00 = US$1.04.
53. Except for the inferred mineral resource category, the resource
calculation used the inverse distance squared method for all
zones, using the Gemcom software. The results were then
transferred into the Surpac software to initiate engineering
design and scheduling. Inferred mineral resources in the McLeod
Deep zone were estimated using a 3D polygonal method, with
the Gemcom software.
54. Gold is recovered as a by-product of the copper concentrates
and as such, recovery is estimated at 29%.
55. Sandstorm is also entitled to the Gold equivalent of other
precious metals not reflected in the gold Bracemac-McLeod
Mineral Reserves and Resources.
46. The mineral reserves and resources are inplace, diluted material.
The individual intercept grades have been cut to a maximum
of 0.45 ounce Au and 45 ounce Ag per ton.

SANDSTORM GOLD LTD. 2011 Annual Report SECTION ThREE FINANCIALS 29
29
This MD&A contains “forward-looking
statements” or “forward-looking
information” within the meaning of
applicable securities legislation. Forward-
looking information is provided as of the
date of this MD&A and Sandstorm does
not intend, and does not assume any
obligation, to update this forward-looking
information, except as required by law.
Generally, forward-looking information can
be identified by the use of forward-looking
terminology such as “plans”, “expects” or
“does not expect”, “is expected”, “budget”,
“scheduled”, “estimates”, “forecasts”, “in-
tends”, “anticipates” or “does not anticipate”,
or “believes”, or variations of such words and
phrases or statements that certain actions,
events or results “may”, “could”, “would”,
“might” or “will be taken”, “occur” or “be
achieved”. Forward-looking information
is based on reasonable assumptions that
have been made by Sandstorm as at the
date of such information and is subject to
known and unknown risks, uncertainties
and other factors that may cause the actual
results, level of activity, performance or
achievements of Sandstorm to be materially
different from those expressed or implied by
such forward-looking information, including
ForwardLooking Statements
but not limited to: the impact of general
business and economic conditions; delays
in the construction of the Ming Mine, the
Bachelor Lake Mine or the Bracemac-McLeod
Property; the absence of control over min-
ing operations from which Sandstorm will
purchase gold and risks related to those
mining operations, including risks related
to international operations, government and
environmental regulation, actual results of
current exploration activities, conclusions
of economic evaluations and changes in
project parameters as plans continue to be
refined; problems inherent to the market-
ability of minerals; industry conditions,
including fluctuations in the price of metals,
fluctuations in foreign exchange rates and
fluctuations in interest rates; government
entities interpreting existing tax legislation
or enacting new tax legislation in a way
which adversely affects Sandstorm; stock
market volatility; competition; as well as
those factors discussed in the section entitled
“Risks to Sandstorm” herein.
Forward-looking information in this MD&A
includes, among other things, disclosure
regarding: Sandstorm’s existing seven Gold
Streams well as its future outlook, the min-
eral reserve and mineral resource estimates
for each of the Aurizona Mine, the Santa
Elena Mine, the Ming Mine, the Black Fox
Mine, the Bachelor Lake Mine, the Summit
Mine, and the Bracemac-McLeod Property.
Forward-looking information is based on
assumptions management believes to be
reasonable, including but not limited to the
continued operation of the mining opera-
tions from which Sandstorm will purchase
gold, no material adverse change in the
market price of commodities, that the mining
operations will operate in accordance with
their public statements and achieve their
stated production outcomes, and such other
assumptions and factors as set out therein.
Although Sandstorm has attempted to iden-
tify important factors that could cause actual
actions, events or results to differ materially
from those contained in forward-looking
information, there may be other factors that
cause actions, events or results not to be as
anticipated, estimated or intended. There
can be no assurance that such information
will prove to be accurate, as actual results
and future events could differ materially
from those anticipated in such information.
Accordingly, readers should not place undue
reliance on forward-looking information.

Section ThreeFINANCIALS

31
Independent Auditor’s Report
TO THE SHAREHOLDERS OF SANDSTORM GOLD LTD.
We have audited the accompanying consolidated financial statements of Sandstorm Gold Ltd., which comprise the consolidated statements
of financial position as at December 31, 2011, December 31, 2010 and January 1, 2010, and the consolidated statements of comprehensive
income (loss), changes in equity, and cash flows for the years ended December 31, 2011 and December 31, 2010, and a summary of significant
accounting policies and other explanatory information.
Management’s Responsibility for the Consolidated Financial Statements
Management is responsible for the preparation and fair presentation of these consolidated financial statements in accordance with
International Financial Reporting Standards, and for such internal control as management determines is necessary to enable the prepara-
tion of consolidated financial statements that are free from material misstatement, whether due to fraud or error.
Auditor’s Responsibility
Our responsibility is to express an opinion on these consolidated financial statements based on our audits. We conducted our audits
in accordance with Canadian generally accepted auditing standards. Those standards require that we comply with ethical requirements
and plan and perform the audit to obtain reasonable assurance about whether the consolidated financial statements are free from
material misstatement.
An audit involves performing procedures to obtain audit evidence about the amounts and disclosures in the consolidated financial
statements. The procedures selected depend on the auditor’s judgment, including the assessment of the risks of material misstate-
ment of the consolidated financial statements, whether due to fraud or error. In making those risk assessments, the auditor considers
internal control relevant to the entity’s preparation and fair presentation of the consolidated financial statements in order to design
audit procedures that are appropriate in the circumstances, but not for the purpose of expressing an opinion on the effectiveness of
the entity’s internal control. An audit also includes evaluating the appropriateness of accounting policies used and the reasonableness
of accounting estimates made by management, as well as evaluating the overall presentation of the consolidated financial statements.
We believe that the audit evidence we have obtained in our audits is sufficient and appropriate to provide a basis for our audit opinion.
Opinion
In our opinion, the consolidated financial statements present fairly, in all material respects, the financial position of Sandstorm Gold
Ltd. as at December 31, 2011, December 31, 2010 and January 1, 2010 and its financial performance and its cash flows for the years ended
December 31, 2011 and December 31, 2010 in accordance with International Financial Reporting Standards.
“Deloitte & Touche LLP”
Chartered AccountantsMarch 13, 2012Vancouver, Canada
2800 - 1055 Dunsmuir Street4 Bentall CentreP.O. Box 49279Vancouver BC V7X 1P4Canada
Tel: 604-669-4466Fax: 604-685-0395www.deloitte.ca

SANDSTORM GOLD LTD. 2011 Annual Report SECTION ThREE FINANCIALS 32
32
CONSOLIDATED STATEMENTS OF FINANCIAL POSITION
Expressed in U.S. dollars ($000s)
ASSETS Note December 31, 2011December 31, 2010
(Note 17)January 1, 2010
(Note 17)
Current
Cash $ 13,073 $ 28,533 $ 36,709
Trade and other receivables 26 136 25
Prepaid expenses 24 21 27
$ 13,123 $ 28,690 $ 36,761
Non-current
Mineral interests 7 128,982 100,570 37,373
Investments 8 8,362 - -
Deferred income tax assets 10 1,343 2,438 -
Other 982 34 3
Total assets $ 152,792 $ 131,732 $ 74,137
LIABILITIES
Current
Trade and other payables $ 834 $ 806 $ 570
Warrant Liability 17 - - 4,657
$ 834 $ 806 $ 5,227
EQUITY
Share capital 9 $ 125,466 $ 117,199 $ 57,364
Reserves 9 20,435 20,474 15,455
Retained earnings (deficit) 5,742 (6,747) (3,909)
Accumulated other comprehensive income
315 - -
$ 151,958 $ 130,926 $ 68,910
Total liabilities and equity $ 152,792 $ 131,732 $ 74,137
Contractual obligations (Note 14)
Subsequent event (Note 18)
“Nolan Watson”, Director
ON BEHALF OF THE BOARD:
“David DeWitt”, Director
- The accompanying notes are an integral part of these consolidated annual financial statements -

SANDSTORM GOLD LTD. 2011 Annual Report SECTION ThREE FINANCIALS 33
33
CONSOLIDATED STATEMENTS OF COMPREHENSIVE INCOME (LOSS)
Expressed in U.S. dollars ($000s)
NoteYear Ended
December 31, 2011
Year Ended December 31, 2010
(Note 17)
Sales $ 29,967 $ 3,148
Cost of sales (7,777) (919)
Depletion (5,524) (344)
(13,301) (1,263)
Gross profit $ 16,666 $ 1,885
Expenses and other income
Administration expenses 11 (2,528) (1,552)
Project evaluation (93) (274)
Share-based payment 9(b) (1,599) (589)
Foreign exchange (loss) gain (74) 1,376
Income from deferral of production guarantee 7(c) 1,101 -
Income from operations $ 13,473 $ 846
Loss on fair value of warrant liability 17 - (4,304)
Income (loss) before taxes $ 13,473 (3,458)
Income tax (expense) recovery 10 (984) 620
Net income (loss) for the year $ 12,489 $ (2,838)
Other comprehensive income
Unrealized gain on investments - common shares held, net of tax
8 315 -
Total comprehensive income for the year $ 12,804 $ (2,838)
Basic earnings per share 9(f) $ 0.04 $ (0.01)
Diluted earnings per share 9(f) $ 0.03 $ (0.01)
Weighted average number of common shares outstanding
Basic 9(f) 324,460,872 252,554,473
Diluted 9(f) 381,194,373 252,554,473
- The accompanying notes are an integral part of these consolidated annual financial statements -

SANDSTORM GOLD LTD. 2011 Annual Report SECTION ThREE FINANCIALS 34
34
CONSOLIDATED STATEMENTS OF CASH FLOWS
Expressed in U.S. dollars ($000s)
Cash flow from (used in): NoteYear Ended 2011 Year Ended 2010
(Note 17)
Operating activities
Net income (loss) for the year $ 12,489 $ (2,838)
Items not affecting cash:
» Depletion and depreciation 5,566 347
» Deferred income tax expense (recovery) 984 (1,553)
» Loss on warrant liability - 4,304
» Deferred tax recovery related to financing costs - 933
» Share-based payment 1,599 589
» Gain on fair value adjustment of investments (173) -
» Unrealized foreign exchange loss (gain) 44 (1,375)
Changes in non-cash working capital 12 153 56
20,662 463
Investing activities
Acquisition of mineral interests (33,973) (63,510)
Acquisition of Investments (7,768)
Acquisition of other assets (953) (4)
(42,694) (63,514)
Financing activities
Proceeds on issue of shares and exercise of warrants, options, and compensation warrants
6,609 58,405
Share issue costs 28 (4,417)
Spin-out of shares held in Sandstorm Metals & Energy Ltd. to shareholders – cash payment
16 - (493)
6,637 53,495
Effect of exchange rate changes on cash (65) 1,380
Net decrease in cash (15,460) (8,176)
Cash – beginning of the year 28,533 36,709
Cash - end of the year $ 13,073 $ 28,533
- The accompanying notes are an integral part of these consolidated annual financial statements -

SANDSTORM GOLD LTD. 2011 Annual Report SECTION ThREE FINANCIALS 35
35
CONSOLIDATED STATEMENTS OF CHANGES IN EQUITY
Expressed in U.S. dollars ($000s)
Share Capital Reserves
Note Number AmountShare
Options
Share Purchase Warrants
Compen-sation
Warrants
Retained Earnings (Deficit)
Accumulated Other Compre-hensive Income Total
At January 1, 2010 225,938,380 $ 57,364 $ 462 $ 12,948 $ 2,045 $ (3,909) $ - $ 68,910
Public offering 78,768,100 51,409 - 4,430 - - - 55,839
Spin-out of subsidiary 16 - (502) - - - - - (502)
Share issue costs - (4,417) - - - - - (4,417)
Deferred income tax recovery of issue costs
- 1,818 - - - - - 1,818
Options exercised 9(b) 6,667 3 - - - - - 3
Warrants exercised 9(c) 13,350,000 11,524 - - - - - 11,524
Share based payment 9(b) - - 589 - - - - 589
Total comprehensive loss - - - - - (2,838) - (2,838)
At December 31, 2010 318,063,147 $117,199 $1,051 $17,378 $ 2,045 $(6,747) $ - $130,926
Compensation warrants exercised
5,787,024 2,492 - 1,105 (1,687) - - 1,910
Deferred income tax recovery of issue costs
- (7) - - - - - (7)
Options exercised 9(b) 110,000 70 (17) - - - - 53
Share based payment - - 1,599 - - - - 1,599
Share issue costs - 28 - - - - - 28
Warrants exercised 9(c) 7,739,900 5,684 - (1,039) - - - 4,645
Total comprehensive income
- - - - - 12,489 315 12,804
At December 31, 2011 331,700,071 $ 125,466 $ 2,633 $ 17,444 $ 358 $ 5,742 $ 315 $ 151,958
- The accompanying notes are an integral part of these consolidated annual financial statements -

SANDSTORM GOLD LTD. 2011 Annual Report SECTION ThREE FINANCIALS 36
36
Notes To The Consolidated Annual Financial StatementsDECEMBER 31, 2011 | EXPRESSED IN U.S. DOLLARS
1. NATURE OF OPERATIONS
Sandstorm Gold Ltd. (“Sandstorm” or “the Company”) was incorporated under the Business Corporations Act of British Columbia on
March 23, 2007 under the name Sandstorm Resources Ltd. Effective February 17, 2011, the Company changed its name to Sandstorm
Gold Ltd. The Company is a resource based company that seeks to acquire gold streams (“Gold Streams”) from companies that have
advanced stage development projects or operating mines. In return for making a one-time up front payment to acquire a Gold Stream,
Sandstorm receives the right to purchase, at a fixed price per unit, a percentage of a mine’s production for the life of the mine.
The head office, principal address and registered office of the Company are located at Suite 1400, 400 Burrard Street, Vancouver,
British Columbia, V6C 3A6.
These audited annual consolidated financial statements were authorized for issue by the board of directors of the Company on
March 13, 2012.
2. BASIS OF PRESENTATION
( A ) STATEMENT OF COMPLIANCE
These consolidated financial statements, including comparatives, represent the first annual financial statements prepared in ac-
cordance with International Financial Reporting Standards (“IFRS”) issued by the International Accounting Standards Board (“IASB”)
and interpretations of the IFRS Interpretations Committee (“IFRIC”) issued as of December 31, 2011. The Company adopted IFRS
in accordance with IFRS 1, “First-time Adoption of International Financial Reporting Standards” (“IFRS 1”) as discussed in Note 17.
( B ) BASIS OF PRESENTATION
These consolidated annual financial statements have been prepared on a historical cost basis except for certain financial instruments
which are measured at fair value.
The consolidated financial statements are presented in United States dollars, and all values are rounded to the nearest thousand
except as otherwise indicated.
NOTES TO ThE CONSOLIDATED FINANCIAL STATEMENTS

NOTES TO THE CONSOLIDATED FINANCIAL STATEMENTS 37
3. SUMMARY OF SIGNIFICANT ACCOUNTING POLICIES
( A ) PRINCIPLES OF CONSOLIDATION
These consolidated annual financial statements include the accounts of the Company and its wholly owned subsidiaries Sandstorm
Gold (Barbados) Limited, Sandstorm Gold (Canada) Ltd, and Sandstorm Gold (US) Inc. Subsidiaries are fully consolidated from the
date the Company obtains control, and continue to be consolidated until the date that control ceases. Control is achieved when
the Company has the power to govern the financial and operating policies of an entity so as to obtain benefits from its activities.
All intercompany balances, transactions, revenues and expenses have been eliminated on consolidation.
( B ) FOREIGN CURRENCY TRANSLATION
The reporting and the functional currency of the Company and its subsidiaries is the U.S. dollar as this is the principal currency of
the economic environment in which they operate. Transactions in foreign currencies are initially recorded at the exchange rate at
the date of transaction. Monetary assets and liabilities denominated in foreign currencies are translated using the closing rate as
at the reporting date.
( C ) FINANCIAL INSTRUMENTS
The Company has adopted IFRS 9, Financial Instruments, effective January 1, 2010. The Company’s financial instruments consist of
cash, trade and other receivables, investments, trade and other payables, and the warrant liability. The warrant liability represented
the derivative liability that arose from warrants issued with an exercise price denominated in Canadian dollars as the Company would
have received a variable amount of cash in its functional currency of U.S. dollars when those warrants were exercised. All financial
instruments are initially recorded at fair value. All financial instruments are initially recorded at fair value and designated as follows:
The warrant liability is classified as fair value through profit and loss (“FVTPL”). The warrant liability is a derivative whose fair value is
determined using the Black-Scholes option pricing model (“BSM”) and its value is derived from the underlying security. Investments
in common shares held are classified as fair value through other comprehensive income. Cash and trade and other receivables are
classified as financial assets at amortized cost and trade and other payables are classified as other financial liabilities and these are
measured at amortized cost using the effective interest method.
Transaction costs on initial recognition of financial instruments classified as FVTPL are expensed as incurred. Transaction costs
incurred on initial recognition of financial instruments classified as loans and receivables and other financial liabilities are included
in the initial fair value amount.
Financial assets are derecognized when the contractual rights to the cash flows from the asset expire. Financial liabilities are derec-
ognized only when the Company’s obligations are discharged, cancelled or they expire. All gains and losses as a result of changes
in fair value for FVTPL financial instruments are included in net income (loss) in the period they occur.
( D ) IMPAIRMENT OF FINANCIAL ASSETS
The Company assesses at each reporting date whether there is any objective evidence that a financial asset of a group of financial
assets is impaired. Financial assets are considered to be impaired if objective evidence indicates that a change in the market, economic
or legal environment in which the Company invested has had a negative effect on the estimated future cash flows of that asset. An
impairment loss for a financial asset measured at amortized cost is calculated as the difference between its carrying amount and the
present value of the estimated future cash flows discounted at the original effective interest rates. Impairment losses are recognized
in profit and loss. For financial assets measured at amortized cost, any reversal of impairment is recognized in profit and loss.
( E ) GOLD INVENTORY
Gold inventory is valued at the lower of specifically identifiable cost and net realizable value. Costs included are the agreed upon
purchase price under the Gold Stream and depletion of the applicable mineral interest.

NOTES TO THE CONSOLIDATED FINANCIAL STATEMENTS 38
( F ) MINERAL INTERESTS
Agreements for which settlements are called for in gold, the amount of which is based on production at the mines and capitalized on
a property by property basis, are recorded at cost less accumulated depletion and impairment loss, if any. The cost of these assets is
allocated to reserves, resources, and exploration potential which are estimated based on information compiled by qualified persons
as defined under National Instrument 43-101. Periodic changes in the reserve estimates may impact the carrying amount of mineral
interests, recognition of deferred tax assets, and depletion expense. The value allocated to reserves is classified as depletable and
is depreciated on a unit-of delivery basis over the estimated recoverable proven and probable reserves at the mine corresponding
to the specific agreement. The value associated with resources and exploration potential is the value beyond proven and probable
reserves at acquisition and is classified as non-depletable until such time as it is transferred to the depletable category as a result
of the conversion of resources or exploration potential into reserves.
( G ) IMPAIRMENT OF MINERAL INTERESTS
Evaluation of the carrying values of each mineral property is undertaken when events or changes in circumstances indicate that the
carrying values may not be recoverable. If any indication of impairment exists, the recoverable amount is estimated to determine
the extent of any impairment loss. The recoverable amount is the higher of the fair value costs to sell and value in use. Estimated
values in use are calculated using estimated production, sales prices, and a discount rate. Estimated production is determined
using current reserves compiled by qualified persons. Estimated sales prices are determined using an average of long-term metal
price forecasts by analysts. The discount rate is estimated using the average discount rate used by analysts to value precious metal
royalty companies. If it is determined that the recoverable amount is less than the carrying value then an impairment is recorded
with a charge to net income (loss).
An assessment is made at each reporting period if there is any indication that a previous impairment loss may no longer exist or
has decreased. If indications are present, the carrying amount of the mineral interest is increased to the revised estimate of its
recoverable amount, but so that the increased carrying amount does not exceed the carrying amount net of depletion that would
have been determined had no impairment loss been recognized for the mineral interest in previous periods.
( H ) INCOME TAXES
Current income tax assets and liabilities are measured at the amount expected to be recovered from or paid to the taxation authori-
ties. The tax rates and tax laws used are those that are substantively enacted at the reporting date.
Deferred income taxes are provided using the liability method on temporary differences at the reporting date between the tax bases
of assets and liabilities and their carrying amounts for accounting. The change in the net deferred income tax asset or liability is
included in income except for deferred income tax relating to equity items which is recognized directly in equity. The income tax
effects of differences in the periods when revenue and expenses are recognized, in accordance with Company accounting practices,
and the periods they are recognized for income tax purposes are reflected as deferred income tax assets or liabilities. Deferred
income tax assets and liabilities are measured using the substantively enacted statutory income tax rates which are expected to
apply to taxable income in the years in which the assets are realized or the liabilities settled. A deferred tax asset is recognized for
unused tax losses, tax credits and deductible temporary differences to the extent that it is probable that future taxable profits will
be available against which they can be utilized.
Deferred income tax assets and liabilities are offset only if a legally enforceable right exists to offset current tax assets against li-
abilities and the deferred tax assets and liabilities relate to income taxes levied by the same taxation authority on the same taxable
entity and are intended to be settled on a net basis.
The determination of current and deferred taxes requires interpretations of tax legislation, estimates of expected timing of reversal
of deferred tax assets and liabilities, and estimates of future earnings.
( I ) SHARE CAPITAL AND SHARE PURCHASE WARRANTS
The proceeds from the issue of units are allocated between common shares and share purchase warrants with an exercise price
denominated in U.S. dollars on a pro-rata basis based on relative fair values. The fair value of common shares is based on the market
closing price on the date the units are issued and the fair value of share purchase warrants is determined using the quoted market
price or if the warrants are not traded, using the BSM as of the date of issuance. Equity instruments issued to agents as financing
costs are measured at their fair value at the date the services were provided.

NOTES TO THE CONSOLIDATED FINANCIAL STATEMENTS 39
( J ) REVENUE RECOGNITION
Revenue from the sale of precious metals is recognized when persuasive evidence of an arrangement exists, title and risk passes to
the buyer, the amount of revenue can be measured reliably, it is probable that the economic benefits associated with the sale will
flow to the entity and the costs incurred in respect of the transaction can be measured reliably. Revenue from the sale of gold may
be subject to adjustment upon final settlement of estimated metal prices, weights, and assays. Adjustments to revenue from metal
prices are recorded monthly and other adjustments are recorded on final settlement and are offset against revenue when incurred.
( K ) EARNINGS (LOSS) PER SHARE
Basic earnings (loss) per share is computed by dividing the net income (loss) available to common shareholders by the weighted
average number of common shares issued and outstanding during the period. Diluted earnings (loss) per share is calculated assuming
that outstanding share options and share purchase warrants, with an average market price that exceeds the average exercise prices
of the options and warrants for the period, are exercised and the proceeds are used to repurchase shares of the Company at the
average market price of the common shares for the period.
( L ) SHARE-BASED PAYMENTS
All share-based awards made to employees are recorded at fair value and measured using the BSM at the date of grant.
Share-based awards made to non-employees are measured using the fair value of goods and services received. If this value cannot
be estimated reliably, the fair value of equity instruments granted determined by the BSM is used. The fair value is measured the
date the goods and services are received.
The BSM requires management to estimate the expected volatility and term of the equity instrument, the risk-free rate of return
over the term, expected dividends, and the number of equity instruments expected to ultimately vest. Volatility is estimated using
the historical stock price of the Company or a peer if there is insufficient data using the Company’s stock price history, the expected
term is estimated using historical exercise data, and the expected number of equity instruments expected to vest is estimated using
historical forfeiture data.
The costs of share-based awards are charged to profit and loss, with a corresponding increase in Share Option Reserves over the
vesting period on a graded basis with each tranche being measured separately. For share-based awards measured using the BSM, the
expected number of equity instruments expected to vest is adjusted each reporting period. No expense is recognized for share-based
awards that do not ultimately vest. Previously recognized expenses for vested share-based awards are not subsequently reversed for
forfeitures and unexercised stock-based awards.
If and when share-based awards are ultimately exercised, the applicable amounts in Share Option Reserves are transferred to Share
Capital.
( M ) RELATED PARTY TRANSACTIONS
Parties are considered related if one party has the ability, directly or indirectly, to control the other party or exercise significant
influence over the other party in making financial and operating decisions. Parties are also considered related if they are subject to
common control or significant influence. A transaction is considered a related party transaction when there is a transfer of resources
or obligations between related parties.
( N ) SEGMENT REPORTING
An operating segment is a component of the Company that engages in business activities from which it may earn revenues and
incur expenses. All operating segments’ results are reviewed regularly by the Company’s Chief Executive Officer to make decisions
about resources to be allocated to the segment and assess its performance, and for which discrete financial information is available.

NOTES TO THE CONSOLIDATED FINANCIAL STATEMENTS 40
4. KEY SOURCES OF ESTIMATION UNCERTAINTY AND CRITICAL ACCOUNTING JUDGMENTS
The preparation of the Company’s audited consolidated financial statements in conformity with IFRS requires management to make
judgments, estimates and assumptions that affect the reported amounts of assets, liabilities and contingent liabilities at the date of the
consolidated financial statements and reported amounts of revenues and expenses during the reporting period. Estimates and assump-
tions are continuously evaluated and are based on management’s experience and other factors, including expectations of future events
that are believed to be reasonable under the circumstances. However, actual outcomes can differ from these estimates.
Information about significant areas of estimation uncertainty and judgements made by management in preparing the consolidated
financial statements are described below.
( A ) ACCOUNTING FOR MINERAL INTERESTS
The Company’s business is the acquisition of base metal and energy purchase agreements. Management accounts for these agree-
ments as mineral interests as they consider the associated mining risks when evaluating the assets to be acquired and assessing the
mineral interests over the life of the related mine.
( B ) ATTRIBUTABLE RESERVE AND RESOURCE ESTIMATES
Gold interests are a significant asset of the Company, with a carrying value of $129.0 million at December 31, 2011. This amount
represents the capitalized expenditures related to the acquisition of the gold interests net of amortization. The Company estimates
the reserves and resources relating to each agreement. Reserves are estimates of the amount of gold that can be economically and
legally extracted from the mining properties at which the Company has precious metal purchase agreements, adjusted where ap-
plicable to reflect the Company’s percentage entitlement to gold produced from such mines. The Company estimates its reserves
and resources based on information compiled by appropriately qualified persons relating to the geological data on the size, depth
and shape of the ore body, and require complex geological judgments to interpret the data. The estimation of recoverable reserves is
based upon factors such as estimates of foreign exchange rates, commodity prices, future capital requirements, and production costs
along with geological assumptions and judgments made in estimating the size and grade of the ore body. Changes in the reserve or
resource estimates may impact upon the carrying value of the Company’s gold interests and depletion charges.
( C ) DEPLETION
The Company’s gold interests are depleted on a units-of-delivery basis, with estimated recoverable reserves and resources being
used to determine the depletion rate for each of the Company’s gold interests. These calculations require the use of estimates and
assumptions, including the amount of recoverable reserves based on management’s estimate of resources which are converted to
reserves. Changes in the estimated recoverable reserves, resources or exploration potential will directly impact the depletion rate
used. Changes to depletion rates are accounted for prospectively.
( D ) INCOME TAXES
The interpretation of existing tax laws or regulations in Canada and Barbados or any of the countries in which the mining opera-
tions are located or to which shipments of gold are made requires the use of judgment. Differing interpretation of these laws or
regulations could result in an increase in the Company’s taxes, or other governmental charges, duties or impositions. In addition,
the recoverability of deferred income tax assets, including expected periods of reversal of temporary differences and expectations
of future taxable income, are assessed by management at the end of each reporting period.

NOTES TO THE CONSOLIDATED FINANCIAL STATEMENTS 41
5. FUTURE CHANGES IN ACCOUNTING POLICIES
The IASB issued a number of new and revised accounting standards which are effective for annual periods beginning on or after
January 1, 2013, with early adoption permitted. These standards include the following:
• IFRS 10, Consolidated Financial Statements;
• IFRS 11, Joint Arrangements;
• IFRS 12, Disclosure of Interests in Other Entities;
• IFRS 13, Fair Value Measurement;
• Amended IAS 27, Separate Financial Statements; and
• Amended IAS 28, Investments in Associates and Joint Ventures.
In June 2011, the IASB also issued amended IAS 1, Presentation of Financial Statements, which is effective for annual periods begin-
ning on or after July 1, 2012.
These new and revised accounting standards have not yet been adopted by Sandstorm, and the Company has not yet completed the
process of assessing the impact that they will have on its financial statements, or whether to early adopt any of the new requirements.
6. FAIR VALUE OF FINANCIAL INSTRUMENTS
FAIR VALUE OF WARRANT LIABILITY
The loss on the warrant liability was determined using the following weighted-average Black-Scholes model assumptions:
December 31, 2011 December 31, 2010
Share price - C$0.80
Exercise price - C$0.195
Expected dividend yield - 0%
Expected stock price volatility - 40%
Risk-free interest rate - 0.12%
Expected life of options - 0.17 years
FAIR VALUE HIERARCHY
The fair value hierarchy establishes three levels to classify the inputs of valuation techniques used to measure fair value. The three
levels of the fair value hierarchy are described below:
Level 1 | Unadjusted quoted prices in active markets that are accessible at the measurement date for identical, unrestricted assets
or liabilities. Investments In common shares and warrants held that have direct listings on an exchange are classified as Level 1.
Level 2 | Quoted prices in markets that are not active, quoted prices for similar assets or liabilities in active markets, or inputs that
are observable, either directly or indirectly, for substantially the full term of the asset or liabilities. Investments in common shares
and warrants held that are not listed on an exchange are classified as Level 2.
Level 3 | Prices or valuation techniques that require inputs that are both significant to fair value measurement and unobservable
(supported by little or no market activity).
As at December 31, 2011, investments including common shares and warrants, were classified under Level 1. As at December 31, 2010
cash was classified under Level 1 and the fair value of warrant liability valuation inputs were classified under Level 2.

NOTES TO THE CONSOLIDATED FINANCIAL STATEMENTS 42
CREDIT RISK
The Company’s credit risk is limited to cash and trade and other receivables in the ordinary course of business. The Company
sells gold exclusively to large corporations with strong credit ratings and the balance of trade and other receivables owed to the
Company in the ordinary course of business is not significant. There were no trade receivables which were past due at December
31, 2011. Therefore, the Company is not exposed to significant credit risk and overall, the Company’s credit risk has not changed
significantly from the prior year.
CURRENCY RISK
The Company is exposed to the fluctuations of the Canadian to U.S. dollar as from time to time, as it holds investments denominated
in the Canadian dollar. As at December 31, 2011 and 2010, the Company held an insignificant portion of its financial instruments in
Canadian dollars and was not exposed to significant currency risk.
OTHER RISKS
The Company is not subject to significant interest rate or other price risks and the Company’s exposure to these risks has not
changed significantly from the prior year.
7. MINERAL INTERESTS( A ) CARRYING AMOUNT
As of December 31, 2011:
Cost Accumulated Depletion
In $000s Opening Additions Ending Opening Depletion EndingCarrying Amount
Aurizona, Brazil $ 19,977 $ - $ 19,977 $ 296 $ 1,032 $ 1,328 $ 18,649
Bachelor Lake, Canada - 20,845 20,845 - - - 20,845
Black Fox, Canada 56,470 54 56,524 - 2,614 2,614 53,910
Bracemac-McLeod, Canada - 32 32 - - - 32
Ming, Canada 7,062 13,006 20,068 - - - 20,068
Santa Elena, Mexico 13,342 - 13,342 42 1,431 1,473 11,869
Summit, U.S.A. 4,063 - 4,063 7 447 454 3,609
Total $100,914 $ 33,937 $ 134,851 $ 345 $ 5,524 $ 5,869 $ 128,982
As of December 31, 2010:
Cost Accumulated Depletion
In $000s Opening Additions Ending Opening Depletion EndingCarrying Amount
Aurizona $ 19,963 $ 14 $ 19,977 $ - $ 295 $ 295 $ 19,682
Bachelor Lake - - - - - - -
Black Fox - 56,470 56,470 - - - 56,470
Bracemac-McLeod - - - - - - -
Ming - 7,062 7,062 - - - 7,062
Santa Elena 13,346 (4) 13,342 - 42 42 13,300
Summit and other 4,064 (1) 4,063 - 7 7 4,056
Total $ 37,373 $ 63,541 $ 100,914 $ - $ 344 $ 344 $ 100,570
The carrying amount for the mineral interests as at January 1, 2010 is equal to the opening cost balance described in the December
31, 2010 table above.

NOTES TO THE CONSOLIDATED FINANCIAL STATEMENTS 43
( B ) DEPLETABLE VS. NON-DEPLETABLE BALANCES
The value allocated to reserves is classified as depletable and is depreciated on a units-delivered basis over the estimated recoverable
proven and probable reserves at the mine. The value associated with resources and exploration potential is the value beyond proven
and probable reserves allocated at acquisition and is classified as non-depletable until such time as it is transferred to the depletable
category, generally as a result of the conversion of resources or exploration potential into reserves.
As of December 31, 2011
In $000s Depletable Non-depletable Total
Aurizona $ 15,695 $ 2,954 $ 18,649
Bachelor Lake 19,457 1,387 20,844
Black Fox 50,526 3,385 53,911
Bracemac-McLeod 32 - 32
Ming 13,389 6,679 20,068
Santa Elena 9,640 2,229 11,869
Summit 3,317 292 3,609
Total $ 112,056 $ 16,926 $ 128,982
As of December 31, 2010
In $000s Depletable Non-depletable Total
Aurizona $ 16,727 $ 2,955 $ 19,682
Bachelor Lake - - -
Black Fox 53,088 3,382 56,470
Bracemac-McLeod - - -
Ming 5,008 2,054 7,062
Santa Elena 10,105 3,195 13,300
Summit and other 4,056 - 4,056
Total $ 88,984 $ 11,586 $ 100,570
January 1, 2010
In $000s Depletable Non-depletable Total
Aurizona $ 16,936 $ 3,027 $ 19,963
Santa Elena 10,149 3,197 13,346
Summit and other 4,054 10 4,064
Total $ 31,139 $ 6,234 $ 37,373
( C ) SUMMARY OF GOLD STREAMS
AURIZONA MINE
The Company has a Gold Stream agreement to purchase 17% of the life of mine gold produced from Luna Gold Corp.’s open-pit
Aurizona mine, located in Brazil (the “Aurizona Mine”) for a per ounce cash payment equal to the lesser of $400 and the then
prevailing market price of gold.

NOTES TO THE CONSOLIDATED FINANCIAL STATEMENTS 44
BACHELOR LAKE MINE
On January 17, 2011 the Company entered into a Gold Stream agreement with Metanor Resources Inc. (“Metanor”) to purchase 20%
of the life of mine gold produced from Metanor’s Bachelor Lake gold mine located in Quebec, Canada (“Bachelor Lake Mine”) for
an up front payment of $20.0 million plus ongoing per ounce payments equal to the lesser of $500 and the then prevailing market
price per ounce of gold. Metanor has provided a guarantee that Sandstorm will receive a minimum of $20.0 million in pre-tax cash
flow over the next six years.
BLACK FOX MINE
The Company has a Gold Stream agreement to purchase 12% of the life of mine gold produced from Brigus Gold Corp.’s (“Brigus”)
open pit and underground Black Fox mine, located in Canada (the “Black Fox Mine”) and 10% of the life of mine gold produced
from Brigus’ Black Fox extension, which includes a portion of Brigus’ Pike River concessions for a per ounce cash payment equal to
the lesser of $500 and the then prevailing market price of gold. Brigus has the option until January 1, 2013 to repurchase 50% of the
Brigus Gold Stream by making a $36.6 million payment to the Company, upon receipt of which, the percentage of gold the Company
is entitled to purchase will decrease to 6% for the Black Fox Mine and 4.5% for the Black Fox extension.
BRACEMAC-MCLEOD MINE
On July 12, 2011, the Company entered into a Gold Stream agreement with Donner Metals Ltd. (“Donner”) via a back-to-back agreement
with Sandstorm Metals & Energy Ltd. (“Sandstorm Metals & Energy”) to purchase 17.5% of the life of mine gold and gold equivalent
of silver (“Gold Equivalent”) produced from the Bracemac-McLeod Property located in Quebec, Canada which is operated by Xstrata
Canada Corporation (“the Bracemac-McLeod Mine”). Donner is the owner of a 35% joint venture interest in the Bracemac-McLeod Mine.
For consideration, the Company will make an up front payment of $5.0 million on June 30, 2012 plus ongoing per ounce of gold or
Gold Equivalent payments equal to the lesser of $350 and the then prevailing market price of gold. Donner has provided a guarantee,
via a back-to-back agreement with Sandstorm Metals & Energy, that the Company will receive a minimum of $5.0 million in pre-tax
cash flows between 2013 and 2016 from the Bracemac-McLeod Gold Stream.
Donner has the option until July 13, 2013 to repurchase 50% of the Bracemac-McLeod Gold Stream by making a $3.5 million payment
to the Company, upon receipt of which, the percentage of gold and Gold Equivalent the Company is entitled to purchase will
decrease to 8.75%.
MING MINE
The Company has a Gold Stream agreement to purchase approximately 25% of the first 175,000 ounces of gold produced and 12% of
the life of mine gold produced thereafter, from Rambler Metals & Mining plc’s (“Rambler”) Ming mine, located in Canada (the “Ming
Mine”). There are no ongoing per ounce payments required by Sandstorm in respect of the Ming Mine Gold Stream. In the event
that the metallurgical recoveries of gold at the Ming Mine are below 85%, the percentage of gold that Sandstorm shall be entitled
to purchase shall be increased proportionally.
SANTA ELENA MINE
The Company has a Gold Stream agreement to purchase 20% of the life of mine gold produced from SilverCrest Mines Inc.’s open
pit Santa Elena mine, located in Mexico (the “Santa Elena Mine”) for a per ounce cash payment equal to the lesser of $350 and the
then prevailing market price of gold.
SUMMIT MINE
The Company has a Gold Stream agreement to purchase 50% of the first 10,000 ounces of gold produced, and 22% of the life of mine
gold produced thereafter, from Santa Fe Gold Corporation’s Summit mine, located in the United States of America (the “Summit
Mine”) for a per ounce cash payment equal to the lesser of $400 and the then prevailing market price of gold. In 2011, the Company
agreed to defer the production guarantee to June 2012, in exchange for the delivery of 817 ounces of gold at $400 per ounce. The
Company recognized $1.1 million in other income with a corresponding receivable, which was collected in 2011.

NOTES TO THE CONSOLIDATED FINANCIAL STATEMENTS 45
8. INVESTMENTS
In $000s historical CostDecember 31, 2011
Fair Value Change in Fair Value
January 1, 2011 and December 31, 2010
Fair Value
Common shares held 7,504 $ 7,923 419 $ -
Warrants held 266 439 173 -
7,770 $ 8,362 592 $ -
The fair value of the investments is calculated as the quoted market price of the share or warrant multiplied by the quantity of
the shares or warrants held by the Company. During the year ended December 31, 2011, the Company acquired 18.9 million common
shares and 7.3 million warrants for total consideration of $7.8 million.
9. SHARE CAPITAL AND RESERVES( A ) SHARES ISSUED
The Company is authorized to issue an unlimited number of common shares without par value.
( B ) STOCK OPTIONS
The Company has an incentive stock option plan (the “Option Plan”) whereby the Company may grant stock options to eligible
employees, officers, directors and consultants at an exercise price, expiry date, and vesting conditions to be determined by the board
of directors. The maximum expiry date is five years from the grant date. All options are equity settled. The Option Plan provides for
the issuance of up to 10% of the Company’s issued common shares as at the date of the grant.
During the year ended December 31, 2011, the Company issued 6,190,000 (2010 – 6,980,000) share purchase options to employees with
fair value of $2,617,405 (2010 – $1,527,523) and a weighted average fair value per option of $0.42 (2010 – $0.23). These options vest over
a three year period and the fair value was determined using the BSM with the following assumptions:
Black-Scholes weighted average assumptionsYear ended
December 31, 2011Year ended
December 31, 2010
Grant date share price and exercise price C$1.27 C$0.68
Expected dividend yield 0.00% 0.00%
Expected volatility 51% 47%
Risk-free interest rate 1.14% 1.57%
Expected life of options 3 years 3 years
The expected volatility assumption is based on the historical and implied volatility of the Company’s Canadian dollar common
share price on the TSX Venture Exchange.
A summary of the Company’s options and the changes for the period are as follows:
Number of OptionsWeighted average
exercise price (C$)
Options outstanding at January 1, 2010 6,350,000 0.44
Granted 6,980,000 0.68
Exercised (6,667) 0.45
Forfeited (3,333) 0.45
Options outstanding at December 31, 2010 13,320,000 0.57
Granted 6,190,000 1.26
Exercised (110,000) 0.47
Forfeited (50,000) 0.68
Options outstanding at December 31, 2011 19,350,000 0.79

NOTES TO THE CONSOLIDATED FINANCIAL STATEMENTS 46
A summary of the Company’s options as of December 31, 2011 is as follows:
Number outstanding Exercisable Price per Share (C$) Expiry Date
40,000 40,000 $0.10 July 31, 2012
3,500,000 3,500,000 $0.45 June 16, 2014
700,000 700,000 $0.44 July 6, 2014
2,000,000 2,000,000 $0.435 July 28, 2014
100,000 66,667 $0.67 May 19, 2015
6,820,000 4,546,667 $0.68 November 26, 2015
455,000 - $1.26 August 25, 2016
5,735,000 - $1.27 November 25, 2016
19,350,000 10,853,334
The weighted-average share price at date of exercise for the year ended December 31, 2011 was C$0.94 (2010 – C$0.79)
A summary of share-based payment recognized is as follows:
In $000s Year ended December 31, 2011 Year ended December 31, 2010
Employees $ (1,599) $ (443)
Non-employees - (146)
$ (1,599) $ (589)
( C ) SHARE PURCHASE WARRANTS
A summary of the Company’s warrants and the changes for the year are as follows:
Number of Warrants
Warrants outstanding at January 1, 2010 112,694,186
Issued 19,692,025
Exercised (13,350,000)
Warrants outstanding at December 31, 2010 119,036,211
Issued upon exercise of Compensation Warrants 2,893,511
Exercised (7,739,900)
Warrants outstanding at December 31, 2011 114,189,822
A summary of the Company’s warrants as of December 31, 2011 is as follows:
Number Price per Share Expiry Date
94,500,297 $0.60 April 23, 2014
19,689,525 $1.00 October 19, 2015
114,189,822

NOTES TO THE CONSOLIDATED FINANCIAL STATEMENTS 47
( D ) COMPENSATION WARRANTS
Each Compensation Warrant entitles the holder to acquire one unit comprised of one common share of the Company and one-half
of a share purchase warrant. Each Compensation Warrant has an exercise price of $0.33 and each full share purchase warrant issued
upon exercise of the Compensation Warrants will entitle the holder to purchase one common share at a price of $0.60 until April
23, 2014.
A summary of the Company’s Compensation Warrants and the changes for the year are as follows:
Number of Compensation Warrants
Compensation Warrants outstanding at January 1, 2010 and December 31, 2010 7,014,574
Exercised (5,787,024)
Compensation Warrants outstanding at December 31, 2011 1,227,550
( E ) RESTRICTED SHARE PLAN
On April 4, 2011, the Company adopted a restricted share plan (the “Restricted Share Plan”) whereby the Company may grant restricted
share rights to eligible employees, officers, directors and consultants at an expiry date to be determined by the board of directors.
Each restricted share right entitles the holder to receive a common share of the Company without any further consideration. The
Restricted Share Plan provides for the issuance of up to 4,000,000 restricted share rights outstanding at a given time. As of December
31, 2011 and 2010, no restricted share rights had been granted by the Company under the Restricted Share Plan.
( F ) DILUTED EARNINGS (LOSS) PER SHARE
Diluted earnings (loss) per share is calculated based on the following:
In $000s Year ended December 31, 2011 Year ended December 31, 2010
Net income (loss) $ 12,489 $ (2,838)
Add: loss on warrant liability - -
Net income (loss) for purposes of determining diluted income (loss) per share
$ 12,489 $ (2,838)
Basic weighted average number of shares 324,460,872 252,554,473
Effect of dilutive securities
» Compensation warrants - shares 3,148,687 -
» Compensation warrants - warrants 255,278 -
» Stock options 6,541,284 -
» Warrants 46,788,252 -
Diluted weighted average number of common shares
381,194,373 252,554,473
The following lists the stock options and share purchase warrants excluded from the computation of diluted weighted average
number of common shares as they were anti-dilutive:
Year ended December 31, 2011 Year ended December 31, 2010
Compensation warrants - shares - 4,182,566
Compensation Warrants - warrants - 220,135
Stock options 6,190,000 2,455,229
Warrants - 35,370,101

NOTES TO THE CONSOLIDATED FINANCIAL STATEMENTS 48
10. INCOME TAXES
The income tax expense differs from the amount that would result from applying the federal and provincial income tax rate to the
net income (loss) before income taxes. These differences result from the following items:
In $000s Year ended December 31, 2011 Year ended December 31, 2010
Income (loss) before income taxes $ 13,473 $ (3,458)
Canadian federal and provincial income tax rates 26.5% 28.5%
Income tax expense (recovery) based on the above rates
3,570 (985)
Increase (decrease) due to:
» Non-deductible expenses 403 599
» Difference between statutory and foreign tax rates (3,164) (139)
» Other 175 -
» Recognition of previously unrecognized tax assets - (95)
Deferred tax expense $ 984 $ (620)
The components of deferred income taxes recognized on the statement of financial position are as follows:
In $000s As at December 31, 2011 As at December 31, 2010
Deferred Income Tax Assets
» Mineral interests - 27
» Non-capital losses 1,260 593
» Share issue costs 1,811 1,818
Deferred income tax assets 3,071 2,438
Unrecognized tax benefits - -
Total deferred income tax assets
Deferred Income Tax Liabilities
» Mineral Interest 1,579 -
»Long term investments in shares and warrants 149 -
Total deferred income tax liabilities 1,728 -
Total deferred income tax asset, net 1,343 2,438
At January 1, 2010, the Company had unrecognized benefits on deferred tax assets relating to deductible temporary differences and
unused tax losses of $1.3 million.
The Company has deductible temporary differences, unused tax losses, and unused tax credits expiring as follows:
In $000s Location Amount Expiration
Non-capital loss carry-forwards Canada $ 7,004 2029-2031
Non-capital loss carry-forwards Barbados 907 2018-2020

NOTES TO THE CONSOLIDATED FINANCIAL STATEMENTS 49
11. ADMINISTRATION EXPENSES
The administration expenses for the Company are as follows:
In $000s Year ended December 31, 2011 Year ended December 31, 2010
Corporate administration $ (702) $ (481)
Employee benefits and salary (1,659) (771)
Finance income 26 96
Professional fees (367) (155)
Other income (expenses) 174 -
Spin-out fees - (241)
$ (2,528) $ (1,552)
12. SUPPLEMENTAL CASH FLOW INFORMATION
In $000s Year ended December 31, 2011 Year ended December 31, 2010
Change in non-cash working capital
» Trade and other receivables $ 138 $ (114)
» Prepaid expenses (3) 5
» Trade and other payables 18 165
Net increase in cash $ 153 $ 56
13. KEY MANAGEMENT PERSONNEL COMPENSATION
The remuneration of directors, those persons having authority and responsibility for planning, directing and controlling activities
of the Company are as follows:
In $000s Year ended December 31, 2011 Year ended December 31, 2010
Short-term employee benefits $ (1,407) $ (955)
Share-based payments (1,280) (426)
Total key management compensation expense $ (2,687) $ (1,381)

NOTES TO THE CONSOLIDATED FINANCIAL STATEMENTS 50
14. CONTRACTUAL OBLIGATIONS( A ) GOLD STREAMS
In connection with its Gold Streams, the Company has committed to purchase the following:
Gold Stream % of life of mine gold
Per ounce cash payment: lesser of below and the then
prevailing market price of goldInflationary adjustment to per
ounce cash payment
Aurizona 17% $4001% annual inflationary
adjustment beginning on February 9, 2014
Bachelor Lake 20% $500 None
Black Fox 12% $500An inflationary adjustment
beginning in 2013, not to exceed 2% per annum
Bracemac-McLeod (i) 17.5% $350 None
Ming25% of the first 175,000 ounces of
gold produced, and 12% thereafter$nil N/A
Santa Elena 20% $3501% annual inflationary
adjustment beginning July 13, 2014
Summit50% of the first 10,000 ounces of
gold produced, and 22% thereafter$400
1% annual inflationary adjustment beginning 3
years after the mine achieves commercial production
(i) In connection with the Bracemac-McLeod Gold Stream, the Company has committed an up front payment of $5.0 million by June 30, 2012.
( B ) SANDSTORM METALS & ENERGY
The Company has a commitment to Sandstorm Metals & Energy (“Sandstorm Metals & Energy”) to share a reasonable allocation
agreed to by both companies of costs paid by Sandstorm Metals & Energy that are incurred for the benefit of Sandstorm. Sandstorm
Metals & Energy is contractually obligated to make annual rental payments ranging from $0.2 million to $0.4 million during 2012-2016
and Sandstorm will reimburse Sandstorm Metals & Energy for a reasonable allocation of these rental costs.
15. SEGMENTED INFORMATION
The Company’s reportable segments are summarized in the tables below:
Year ended December 31, 2011
In $000s SalesCost of
sales Depletion Other incomeNet income
(loss)Cash from operations
Aurizona $ 11,332 $2,808 $ 1,032 $ - $ 7,492 $ 8,783
Bachelor Lake - - - - - -
Black Fox 9,863 3,052 2,614 - 4,197 6,810
Bracemac-McLeod
- - - - - -
Ming - - - - - -
Santa Elena 7,790 1,677 1,431 - 4,682 6,113
Summit 982 240 447 1,101 1,396 1,845
Corporate - - - - (5,278) (2,889)
Consolidated $ 29,967 $ 7,777 $ 5,524 $ 1,101 $ 12,489 $ 20,662

NOTES TO THE CONSOLIDATED FINANCIAL STATEMENTS 51
Year ended December 31, 2010
In $000s SalesCost of
sales Depletion Other incomeNet income
(loss)Cash from (used)
in operations
Aurizona $ 2,729 $ 807 $ 295 $ - $ 1,625 $ 1,769
Bachelor Lake - - - - - -
Black Fox - - - - - -
Bracemac-McLeod - - - - - -
Ming - - - - - -
Santa Elena 256 65 42 - 149 190
Summit 163 47 7 - 111 68
Corporate - - - - (4,723) (1,564)
Consolidated $ 3,148 $ 919 $ 344 $ - $ (2,838) $ 463
Total Assets Total Assets
In $000s December 31, 2011 December 31, 2010
Aurizona $ 18,649 $ 19,682
Bachelor Lake 20,844 -
Black Fox 53,911 56,470
Bracemac-McLeod 32 -
Ming 20,068 7,062
Santa Elena 11,869 13,300
Summit 3,609 4,113
Corporate 23,810 31,105
Consolidated $ 152,792 $ 131,732
16. SPIN-OUT OF SANDSTORM METALS & ENERGY
On January 4, 2010, Sandstorm incorporated a wholly owned subsidiary Sandstorm Metals & Energy. On May 13, 2010, Sandstorm
transferred its option agreement on the Eagle Lake property owned by Eagle Plains Resources Ltd. located in Saskatchewan, Canada
and working capital of C$500,000 to Sandstorm Metals & Energy in exchange for 6,836,810 common shares of Sandstorm Metals &
Energy. Sandstorm thereafter distributed all of its common shares held in Sandstorm Metals & Energy to Sandstorm shareholders.
As a result, Sandstorm Metals & Energy is no longer a subsidiary of Sandstorm.
17. FIRST TIME ADOPTION OF IFRS
The Company has adopted IFRS on January 1, 2011 with a transition date of January 1, 2010. Under IFRS 1, IFRS are applied retrospec-
tively at the transition date with all adjustments to assets and liabilities as stated under Canadian Generally Accepted Accounting
Principles (“GAAP”) taken to retained earnings (deficit) unless certain exemptions are applied. The accounting policies summarized
In Note 3 have been applied in preparing the consolidated financial statements for all periods presented and at the date of transition.
Presented below are reconciliations to IFRS of the assets, liabilities, equity, total comprehensive loss and cash flows of the Company
from those previously reported under GAAP.

NOTES TO THE CONSOLIDATED FINANCIAL STATEMENTS 52
( A ) TOTAL ASSETSIn $000s Note December 31, 2010 January 1, 2010
Total assets under GAAP and IFRS $ 131,732 $ 74,137
( B ) TOTAL LIABILITIESIn $000s Note December 31, 2010 January 1, 2010
Total liabilities under GAAP $ 806 $ 570
Adjustments for differing accounting treatments:
» Warrant liability F(i) - 4,657
Total liabilities under IFRS $ 806 $ 5,227
( C ) TOTAL EQUITYIn $000s Note December 31, 2010 January 1, 2010
Total equity under GAAP $ 130,926 $ 73,567
Adjustments for differing accounting treatments:
Warrant liability F(i) - (4,657)
Total equity under IFRS $ 130,926 $ 68,910
( D ) TOTAL COMPREHENSIVE LOSSIn $000s Note Year Ended December 31, 2010
Total comprehensive (loss) under GAAP $ 2,399
Adjustments for differing accounting treatments:
Warrant liability F(i) (4,304)
Deferred tax recovery related to financing costs F(ii) (933)
Total comprehensive loss under IFRS $ (2,838)
( E ) CASH FLOWS
There are no material differences between the cash flow statements presented under IFRS and previous GAAP.
( F ) NOTE TO IFRS RECONCILIATIONS
i. Warrant Liability
Under GAAP, warrants are accounted for at their carrying value within equity. Under IFRS, warrants with an exercise price denominated
in a currency other than the Company’s functional currency meet the definition of a derivative liability and are recorded as a financial
liability at fair value and subsequently mark-to-market each period. The warrants issued in the April 2008 private placement (the
“April 2008 Warrants”) had an exercise price denominated in Canadian dollars, which was the Company’s functional currency when
these warrants were issued. Effective April 1, 2009, the Company changed its functional currency from the Canadian dollar to the
U.S. dollar, and in accordance with IFRS, the April 2008 Warrants ceased to meet the definition of an equity instrument and were
recorded at fair value as a derivative liability, with the difference between the fair value and the carrying value, upon transition,
being recognized in equity. Subsequent changes in the fair value of the April 2008 Warrants were recognized as gains or losses in
the Statement of Comprehensive Income (Loss) until they were exercised by April 2010.
The Company used the exemption for first-time adoption of IFRS 1, Appendix D18 not to recognize any financial liabilities resulting
from its warrants issued prior to January 1, 2010 with an exercise price denominated in Canadian dollar which were exercised prior
to January 1, 2010.

NOTES TO THE CONSOLIDATED FINANCIAL STATEMENTS 53
ii. Deferred Income Taxes
During the year ended December 31, 2010, the Company recognized a deferred income tax asset for financing costs incurred prior
to 2010. Prior to 2010, the Company applied a full valuation allowance against these deferred income tax assets. Under GAAP, the
impact of recognizing a deferred income tax asset related to financing costs is recognized in the Statement of Comprehensive Income
(Loss), however, under IFRS the recognition of such deferred income tax benefit is offset against financing costs in the Statement
of Equity. This difference resulted in a reclassification of $0.9 million from deficit to share capital as of December 31, 2010 and an
adjustment of $0.9 million from comprehensive income (loss) to share capital for the year ended December 31, 2010.
iii. Cumulative translation adjustment
The Company used the exemption for first-time adoption of IFRS under Appendix D13 to reclassify its translation differences of
$0.2 million previously recognized in other comprehensive income under GAAP to deficit as of January 1, 2010. The net impact on
total equity was $nil.
18. SUBSEQUENT EVENT
On January 12, 2012, the Company announced that it has entered into a revolving credit agreement with The Bank of Nova Scotia,
which will allow the Company to borrow up to $50 million (“the Revolving Loan”). The Revolving Loan has a term of three years,
which is extendable by mutual consent of The Bank of Nova Scotia and the Company. The Revolving Loan will be used for the
acquisition of gold streams. The amounts drawn on the Revolving Loan are subject to interest at LIBOR plus 3.00%-4.25% per annum,
and the undrawn portion of the Revolving Loan is subject to a standby fee of 0.75%-1.05% per annum, dependent on the Company’s
leverage ratio.