
2011 Admissions Funnel Report - · PDF fileNoel-Levitz Report on Undergraduate Enrollment...
16
Noel-Levitz Report on Undergraduate Enrollment Trends 2010 Admissions Funnel Benchmarks for Four-Year Public and Private Institutions To assist campuses with accurately forecasting enrollments, this report continues Noel-Levitz’s long-standing research into admissions funnel conversion and yield rates. The report is based on a Web-based survey of college and university admissions officials in September and October, 2010, in which respondents reported fall 2010 and fall 2009 data. For context, data from previous Noel-Levitz surveys are offered for comparison. Among the highlights: • Yield rates (from admit to enroll) for first-year and transfer students continued their downward trend for private colleges, while yield rates for public universities are either leveling off or following no noticeable trend lines. • The rising “secret shopper” applicant trend reported earlier by Noel-Levitz—and the corresponding rise in inquiry-to-applicant conversion rates for first-year and transfer students—continued to gain steam. For fall 2010, fully one-third of first-year applicants and approximately half of transfer applicants did not identify themselves to their chosen institution(s) until they submitted an application. • Admitted, first-year applicants who applied online continued to yield at lower rates than mail-in admitted applicants, while first-year, in-state admitted applicants continued to yield at higher rates than out-of-state and international admitted applicants. • Up to 22 percent of first-year students failed to complete their applications, led by online applicants at private colleges. Readers are encouraged to use the benchmarks in this report to more accurately predict enrollment yields, to set accurate goals, and more. For guidance on how to use the benchmarks, see page 12 and additional resources at www.noellevitz.com/ChangingFunnel. What is an admissions funnel? For those who are unfamiliar, an admissions funnel is a predictive set of metrics for forecasting enrollment yields. The funnel captures the rates of movement of prospective students toward enrollment at key intervals, such as the percentage of admitted students who enroll. See more examples inside. • •
-
Upload
nguyentram -
Category
Documents
-
view
220 -
download
7
Transcript of 2011 Admissions Funnel Report - · PDF fileNoel-Levitz Report on Undergraduate Enrollment...

Noel-Levitz Report on Undergraduate Enrollment Trends
2010 Admissions Funnel Benchmarks for Four-Year Public and Private Institutions To assist campuses with accurately forecasting enrollments, this report continues Noel-Levitz’s
long-standing research into admissions funnel conversion and yield rates. The report is based
on a Web-based survey of college and university admissions offi cials in September and October,
2010, in which respondents reported fall 2010 and fall 2009 data. For context, data from previous
Noel-Levitz surveys are offered for comparison. Among the highlights:
• Yield rates (from admit to enroll) for fi rst-year and transfer students continued their downward
trend for private colleges, while yield rates for public universities are either leveling off or
following no noticeable trend lines.
• The rising “secret shopper” applicant trend reported earlier by Noel-Levitz—and the
corresponding rise in inquiry-to-applicant conversion rates for fi rst-year and transfer
students—continued to gain steam. For fall 2010, fully one-third of fi rst-year applicants
and approximately half of transfer applicants did not identify themselves to their chosen
institution(s) until they submitted an application.
• Admitted, fi rst-year applicants who applied online continued to yield at lower rates than
mail-in admitted applicants, while fi rst-year, in-state admitted applicants continued to
yield at higher rates than out-of-state and international admitted applicants.
• Up to 22 percent of fi rst-year students failed to complete their applications, led by online
applicants at private colleges.
Readers are encouraged to use the benchmarks in this report to more accurately predict
enrollment yields, to set accurate goals, and more. For guidance on how to use the benchmarks,
see page 12 and additional resources at www.noellevitz.com/ChangingFunnel.
What is an admissions funnel? For those who are unfamiliar, an admissions funnel is a predictive set of metrics for forecasting enrollment yields. The funnel captures the rates of movement of prospective students toward enrollment at key intervals, such as the percentage of admitted students who enroll. See more examples inside.
••

Don’t miss the
additional data
and insights
from Noel-Levitz
consultants in the
Appendix of this
report.
Table of Contents
Funnel benchmarks for fi rst-year students …………….…………….…….. 3
“Secret shopper” applicants who didn’t identify themselves
before applying ……………………………………........................………... 4
Funnel benchmarks for transfer students ……...……………......………… 5
Benchmarks by type of application …………………...........…….……...… 6
Benchmarks for in-state, out-of-state, and international
fi rst-year students ………………………………….....................….....……. 8
Appendix
Appendix A: Additional fi ndings ………………………………………….…… 9
—Find additional data not included elsewhere in this report
—Compare all fi ndings for four-year public vs. four-year private
institutions
Appendix B: How to use the benchmarks in this report ………….....….. 12
—Read insights from Noel-Levitz consultants
—See especially the fi fth point on the importance of using multiple
funnels to more accurately forecast yields
2 © 2010 Noel-Levitz, Inc. • 2010 Admissions Funnel Benchmarks for Four-Year Public and Private Institutions
View more reports and papers online
Visit www.noellevitz.com/BenchmarkReports to access our complete series
of Benchmark Poll Reports. For more of our consultants’ insights on the changing
admissions funnel, visit www.noellevitz.com/ChangingFunnel.
Applicants
Inquiries
3 Channels of Entry
Prospects
TM
Although it is changing, the admissions funnel paradigm continues to help enrollment teams accurately forecast enrollment just as well or better than any other system of metrics. For guidance on using the funnel, see the Appendix, pages 12-13.

Freshman yield rates continue to decline for private colleges but may
have leveled off for public universities
As shown in Table 1 in blue, the latest two years of yield data reported by four-year public university respondents
show that FTIC yield rates may have leveled off for this sector, though they continue to be much lower than in
2003 and 2004. In contrast, the highlighted FTIC data in Table 2 for private colleges continue a clear pattern of
steady decline.
© 2010 Noel-Levitz, Inc. • www.noellevitz.com 3
Table 1: Public Universities—FTIC First-Year Student Funnel Rates
Median Funnel Rates 2010 2009 2008 2007 2006 2005 2004 2003
Inquiry to application 35% 34% 33% 31% 28% 25% 27% 24%Application to admit(all applications) 66% 65% 66% 67% 70% 73% 70% 72%
Application to admit (completed applications only)
82% 85% 71% 74% 83% 83% NA NA
Admit to enroll (yield) 41% 43% 38% 39% 42% 43% 47% 49%
Deposited/confi rmed to enroll
93% (Melt: 7%)
91% (Melt: 9%)
92% (Melt: 8%)
93% (Melt: 7%)
92% (Melt: 8%)
92% (Melt: 8%) NA NA
Table 2: Private Colleges and Universities—FTIC First-Year Student Funnel Rates
Median Funnel Rates 2010 2009 2008 2007 2006 2005 2004 2003
Inquiry to application 15% 15% 13% 13% 14% 13% 12% 10%Application to admit(all applications) 66% 65% 71% 73% 70% 72% 75% 76%
Application to admit (completed applications only)
86% 86% 87% 87% 91% 87% NA NA
Admit to enroll (yield) 29% 29% 31% 33% 35% 35% 36% 36%
Deposited to enroll
88% (Melt: 12%)
88% (Melt: 12%)
90% (Melt: 10%)
91% (Melt: 9%)
90% (Melt: 10%)
89% (Melt: 11%) NA NA
Private colleges are seeing declining freshman yields and a slight increase in freshman melt rates as shown in the last two rows of Table 2 above. In addition, public and private institutions continue to see an upward inquiry-to-applicant trend (see the next section on “secret shoppers”).
In a separate study last spring, nearly two-thirds of public and private institution respondents expected higher-than-usual
summer melt in 2010 compared to previous summers,1 likely due to the mini-trend shown above between 2007 and 2009.
However, for public universities, summer melt actually came in lower in 2010 than in 2009 and lower than the four
preceding years. In addition, 2010 summer melt held steady with 2009 for private colleges, though it was still higher
than in earlier years.
Defi nition of an inquiry: An inquiry was defi ned in this study as a student who had contacted the institution through any source (phone, e-mail, inquiry card, Web site contact, sent test scores, application for admission, etc.). This included all fi rst-contact inquiries, including students who made their fi rst recorded contact when they submitted an application.
Note: Data from 2008 and earlier are based on earlier reports from Noel-Levitz.1 Noel-Levitz. (2010). 2010 deposits/confi rmed students as of May 1 at four-year institutions. Coralville, IA: Author. Retrieved from www.noellevitz.com/benchmarkreports.
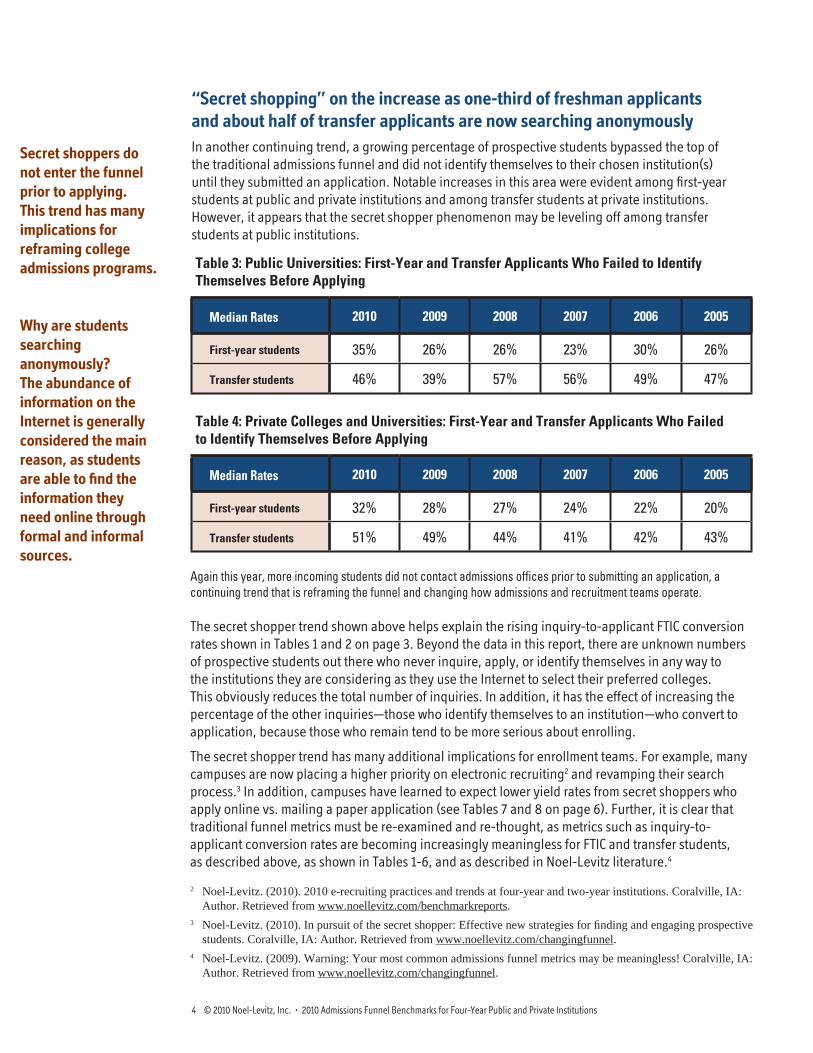
“Secret shopping” on the increase as one-third of freshman applicants
and about half of transfer applicants are now searching anonymously
In another continuing trend, a growing percentage of prospective students bypassed the top of
the traditional admissions funnel and did not identify themselves to their chosen institution(s)
until they submitted an application. Notable increases in this area were evident among fi rst-year
students at public and private institutions and among transfer students at private institutions.
However, it appears that the secret shopper phenomenon may be leveling off among transfer
students at public institutions.
4 © 2010 Noel-Levitz, Inc. • 2010 Admissions Funnel Benchmarks for Four-Year Public and Private Institutions
Secret shoppers do
not enter the funnel
prior to applying.
This trend has many
implications for
reframing college
admissions programs.
Why are students
searching
anonymously?
The abundance of
information on the
Internet is generally
considered the main
reason, as students
are able to fi nd the
information they
need online through
formal and informal
sources.
Table 3: Public Universities: First-Year and Transfer Applicants Who Failed to Identify Themselves Before Applying
Median Rates 2010 2009 2008 2007 2006 2005
First-year students 35% 26% 26% 23% 30% 26%
Transfer students 46% 39% 57% 56% 49% 47%
Table 4: Private Colleges and Universities: First-Year and Transfer Applicants Who Failed to Identify Themselves Before Applying
Median Rates 2010 2009 2008 2007 2006 2005
First-year students 32% 28% 27% 24% 22% 20%
Transfer students 51% 49% 44% 41% 42% 43%
Again this year, more incoming students did not contact admissions offi ces prior to submitting an application, a continuing trend that is reframing the funnel and changing how admissions and recruitment teams operate.
The secret shopper trend shown above helps explain the rising inquiry-to-applicant FTIC conversion
rates shown in Tables 1 and 2 on page 3. Beyond the data in this report, there are unknown numbers
of prospective students out there who never inquire, apply, or identify themselves in any way to
the institutions they are considering as they use the Internet to select their preferred colleges.
This obviously reduces the total number of inquiries. In addition, it has the effect of increasing the
percentage of the other inquiries—those who identify themselves to an institution—who convert to
application, because those who remain tend to be more serious about enrolling.
The secret shopper trend has many additional implications for enrollment teams. For example, many
campuses are now placing a higher priority on electronic recruiting2 and revamping their search
process.3 In addition, campuses have learned to expect lower yield rates from secret shoppers who
apply online vs. mailing a paper application (see Tables 7 and 8 on page 6). Further, it is clear that
traditional funnel metrics must be re-examined and re-thought, as metrics such as inquiry-to-
applicant conversion rates are becoming increasingly meaningless for FTIC and transfer students,
as described above, as shown in Tables 1-6, and as described in Noel-Levitz literature.4
2 Noel-Levitz. (2010). 2010 e-recruiting practices and trends at four-year and two-year institutions. Coralville, IA: Author. Retrieved from www.noellevitz.com/benchmarkreports.3 Noel-Levitz. (2010). In pursuit of the secret shopper: Effective new strategies for fi nding and engaging prospective students. Coralville, IA: Author. Retrieved from www.noellevitz.com/changingfunnel.4 Noel-Levitz. (2009). Warning: Your most common admissions funnel metrics may be meaningless! Coralville, IA: Author. Retrieved from www.noellevitz.com/changingfunnel.

© 2010 Noel-Levitz, Inc. • www.noellevitz.com 5
Transfer student yield rates decline for private colleges, too
As shown in Table 6 in blue, the latest two years of transfer student yield data reported by four-year
private college respondents show a continued decline, paralleling the decline in freshman yield
rates reported earlier in Table 1 on page 3. However, for public universities, no noticeable trend is
evident in Table 5, similar to the FTIC fi ndings reported earlier.
Table 5: Public Universities—Transfer Student Funnel Rates
Median Funnel Rates 2010 2009 2008 2007 2006 2005
Inquiry to application 79% 80% 72% 72% 71% 61%Application to admit(all applications) 64% 66% 61% 61% 66% 72%
Application to admit (completed applications only)
88% 88% 82% 82% 91% 87%
Admit to enroll (yield) 66% 65% 63% 63% 68% 69%
Deposited/confi rmed to enroll
88% (Melt: 12%)
86% (Melt: 14%)
90% (Melt: 10%)
89% (Melt: 11%)
89% (Melt: 11%)
87% (Melt: 13%)
Table 6: Private Colleges and Universities—Transfer Student Funnel Rates
Median Funnel Rates 2010 2009 2008 2007 2006 2005
Inquiry to application 48% 49% 43% 42% 47% 40%Application to admit(all applications) 56% 58% 58% 57% 59% 60%
Application to admit (completed applications only)
90% 90% 88% 80% 91% 90%
Admit to enroll (yield) 53% 54% 54% 56% 57% 57%
Deposited to enroll
86% (Melt: 14%)
87% (Melt: 13%)
88% (Melt: 12%)
89% (Melt: 11%)
88% (Melt: 12%)
88% (Melt: 12%)
Private colleges are seeing declining transfer student yields and a slight increase in transfer student melt rates as shown in the last two rows of Table 6 above, paralleling the fi ndings for freshmen reported earlier on page 3. In addition, both public and private institutions continue to see an upward inquiry-to-applicant trend among transfer students, again paralleling the freshman fi ndings.
Defi nition of a transfer student: For this study, a transfer student was simply defi ned as a student who previously attended college at another institution prior to enrolling.
Some of the same
trends that were
evident among
fi rst-year students
were also evident
among transfer
students, though
conversion and
yield rates for
transfer students
were quite
different.
How do your
numbers compare?
Are you seeing
higher or lower
percentages?

6 © 2010 Noel-Levitz, Inc. • 2010 Admissions Funnel Benchmarks for Four-Year Public and Private Institutions
Yield rates on
different types of
applicants are quite
different and can
signifi cantly impact
fi nal enrollment.
Nearly 30 percent
of applicants using
outside applications*
other than the
Common Application
failed to complete
their applications,
consistent with
earlier Noel-Levitz
fi ndings in 2008 and
2006.
Online applicants continue to yield at lower rates than mail-in applicants
In another continuing trend, the yield rate on fi rst-year, admitted students who completed an online
application was lower than the yield rate on admitted students who completed a paper application
for both public and private institutions in fall 2010, as shown in Tables 7 and 8 below. These fi ndings
were consistent with earlier Noel-Levitz fi ndings in fall 2008 and fall 2006. Of course, this does not
mean that institutions should cease to offer online applications. Noel-Levitz continues to encourage
the use of online applications as a complement to traditional paper and other application forms.
Rather, the fi ndings mean that campuses should expect admitted online applicants to yield at a lower
rate than students who apply using paper applications.
Table 7: Public Universities—Fall 2010 FTIC First-Year Student Funnel Rates by Type of Application
Median Funnel Rates Online Application
Paper/Mail Application
Common Application
Outside Application*
Application to admit(all applications) 69% 64% NA NA
Application to admit (completed applications only)
82% 81% NA NA
Admit to enroll (yield) 37% 47% NA NA
Applicants not completing application process
11% 18% NA NA
Deposited/confi rmed to enroll
92% (Melt: 8%)
95% (Melt: 5%) NA NA
Table 8: Private Colleges and Universities—Fall 2010 FTIC First-Year Student Funnel Rates by Type of Application
Median Funnel Rates Online Application
Paper/Mail Application
Common Application
Outside Application*
Application to admit(all applications) 60% 65% 75% 51%
Application to admit (completed applications only)
87% 80% 82% 83%
Admit to enroll (yield) 33% 36% 18% 19%Applicants not completing application process
22% 17% 9% 29%
Deposited to enroll
88% (Melt: 12%)
88% (Melt: 12%)
89% (Melt: 11%)
90% (Melt: 10%)
Admitted online applicants continued to yield at lower rates than their paper counterparts, especially at public institutions, where 37 percent of admitted online applicants enrolled vs. 47 percent of admitted paper applicants.
* The “Outside Application” column is for any applications received from freshmen via an outside agency (other than Common Application) such as the Royall FastTrack application.

© 2010 Noel-Levitz, Inc. • www.noellevitz.com 7
Percentage of freshmen who fail to complete their applications rises
A comparison of the 2010 data below with parallel data from 2008 and 2006 reveals that the
number of FTIC applicants who fail to complete their applications is rising. In 2010, at public
universities, 11 percent of online applicants failed to complete their application and 18 percent
of paper applicants failed to complete their application. This compared with 10 percent of online
applicants and 13 percent of paper applicants, respectively, in 2008, and with 12 percent of
online applicants and 10 percent of paper applicants, respectively, in 2006.
At private colleges, a similar pattern is evident. As shown below, 22 percent of online applicants
failed to complete their applications and 17 percent of paper applicants failed to complete
their applications. This compared with 18 percent of online applicants and 14 percent of paper
applicants in 2008 and with 19 percent of online applicants and 11 percent of paper applicants
in 2006.
An exception to this trend was evident among private college applicants using the online
Common Application. As shown on Table 8 on page 6, just 9 percent of those applicants failed
to complete their applications in 2010. This was lower than the percentages reported in
previous Noel-Levitz studies: 12 percent and 11 percent in 2008 and 2006, respectively.
However, applicants using the Common Application have consistently yielded at a much
lower rate than applicants using an institutional application.
In general,
more and more
applicants are
failing to complete
their applications.
However, students
using the Common
Application appear
to be defying this
trend.
Table 9: Public Universities: FTIC First-Year Students Who Failed to Complete Their Applications
Median Rates 2010 2008 2006
Online applications 11% 10% 12%
Paper applications 18% 13% 10%
Table 10: Private Colleges and Universities: FTIC First-Year Students Who Failed to Complete Their Applications
Median Rates 2010 2008 2006
Online applications 22% 18% 19%
Paper applications 17% 14% 11%
Up to 22 percent of students failed to complete their applications, led by online applicants at private colleges.
8 © 2010 Noel-Levitz, Inc. • 2010 Admissions Funnel Benchmarks for Four-Year Public and Private Institutions
Knowing the yield
rates for applicants
based on where
they live—whether
it’s in-state, out-of-
state, international,
or more specifi c
designations—can
be very helpful in
forecasting fi nal
enrollment because
students’ enrollment
behaviors have
proven to vary by
their locations.
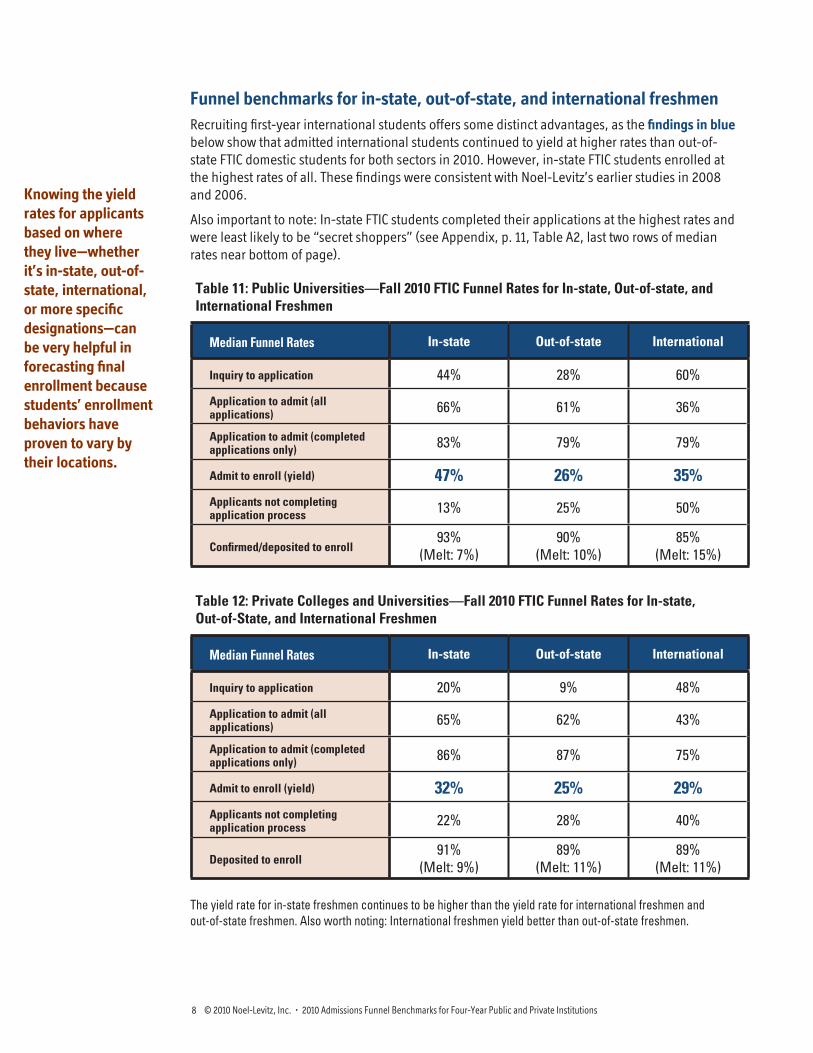
Funnel benchmarks for in-state, out-of-state, and international freshmen
Recruiting fi rst-year international students offers some distinct advantages, as the fi ndings in blue
below show that admitted international students continued to yield at higher rates than out-of-
state FTIC domestic students for both sectors in 2010. However, in-state FTIC students enrolled at
the highest rates of all. These fi ndings were consistent with Noel-Levitz’s earlier studies in 2008
and 2006.
Also important to note: In-state FTIC students completed their applications at the highest rates and
were least likely to be “secret shoppers” (see Appendix, p. 11, Table A2, last two rows of median
rates near bottom of page).
Table 11: Public Universities—Fall 2010 FTIC Funnel Rates for In-state, Out-of-state, and International Freshmen
Median Funnel Rates In-state Out-of-state International
Inquiry to application 44% 28% 60%
Application to admit (all applications) 66% 61% 36%
Application to admit (completed applications only) 83% 79% 79%
Admit to enroll (yield) 47% 26% 35%Applicants not completing application process 13% 25% 50%
Confi rmed/deposited to enroll93%
(Melt: 7%) 90%
(Melt: 10%)85%
(Melt: 15%)
The yield rate for in-state freshmen continues to be higher than the yield rate for international freshmen and out-of-state freshmen. Also worth noting: International freshmen yield better than out-of-state freshmen.
Table 12: Private Colleges and Universities—Fall 2010 FTIC Funnel Rates for In-state, Out-of-State, and International Freshmen
Median Funnel Rates In-state Out-of-state International
Inquiry to application 20% 9% 48%
Application to admit (all applications) 65% 62% 43%
Application to admit (completed applications only) 86% 87% 75%
Admit to enroll (yield) 32% 25% 29%Applicants not completing application process 22% 28% 40%
Deposited to enroll91%
(Melt: 9%) 89%
(Melt: 11%)89%
(Melt: 11%)

Appendix A: Additional findings
This section lists the complete fi ndings of this study, including additional data not reported in the main section. Note that we
have included “n” counts in these tables so you can see the precise number of responding institutions for each item. Even
where these counts are low, our judgment is that they are helpful, though we encourage you to make your own judgments.
© 2010 Noel-Levitz, Inc. • www.noellevitz.com 9
Table A1: Recruitment Funnel Ratios: FTIC First-Year and Transfer Students at Four-Year Public and Four-Year Private Institutions
Four-Year Public Four-Year PrivateFirst-Year Students Fall 2010
First-Year Students Fall 2009
Transfer Students Fall 2010
Transfer Students Fall 2009
First-Year Students Fall 2010
First-Year Students Fall 2009
Transfer Students Fall 2010
Transfer Students Fall 2009
Conversion rate from inquiry to application
Median 34.6% 34.1% 78.8% 79.7% 14.7% 14.6% 47.8% 49.1%First Quartile 24.7% 23.9% 61.7% 53.5% 9.4% 9.2% 36.5% 35.3%Third Quartile 42.8% 42.2% 97.3% 100.0% 22.0% 21.8% 65.4% 68.7%
N 27 24 23 19 126 122 112 110
Admit rate from application to admit
Median 66.3% 65.3% 64.0% 66.3% 65.5% 65.4% 55.7% 57.9%First Quartile 57.7% 57.7% 52.1% 50.2% 53.1% 54.5% 44.8% 46.2%Third Quartile 72.4% 77.9% 70.5% 75.1% 74.9% 75.9% 65.6% 67.2%
N 40 37 38 34 141 136 137 133
Admit rate from complete application to admit
Median 82.1% 85.1% 88.4% 87.7% 86.4% 86.4% 89.9% 89.9%First Quartile 67.8% 69.4% 75.0% 67.8% 75.3% 75.7% 71.2% 75.7%Third Quartile 90.0% 92.8% 95.4% 95.2% 93.6% 94.8% 96.5% 94.9%
N 29 26 26 23 122 119 114 112
Yield rate from admission to enrollment
Median 40.8% 42.8% 65.8% 65.3% 29.3% 28.8% 52.6% 53.6%First Quartile 34.5% 35.5% 61.8% 61.5% 21.6% 21.8% 45.5% 45.6%Third Quartile 48.0% 49.5% 70.4% 71.5% 40.4% 41.6% 60.3% 61.2%
N 40 38 39 35 142 137 138 134
Melt rate from deposit/confi rmed to enrollment
Median 6.9% 8.6% 12.2% 14.4% 11.8% 11.7% 14.3% 12.6%First Quartile 4.4% 6.2% 3.6% 8.2% 7.1% 7.5% 9.1% 9.4%Third Quartile 10.1% 11.9% 16.4% 16.6% 16.5% 17.2% 18.4% 20.3%
N 18 18 11 10 91 84 85 76
Percentage of applicants not completing application process
Median 16.9% 14.3% 25.2% 23.2% 21.6% 21.7% 34.6% 31.6%First Quartile 5.9% 5.7% 17.9% 13.9% 14.0% 12.5% 22.2% 21.4%Third Quartile 24.3% 22.6% 30.6% 28.0% 34.0% 29.5% 43.8% 46.5%
N 30 26 26 23 121 118 113 111
Percentage of students not identifying themselves before application
Median 34.9% 26.2% 45.8% 39.2% 32.1% 28.3% 50.8% 48.7%First Quartile 20.6% 12.9% 17.5% 27.6% 20.8% 17.4% 34.4% 31.1%Third Quartile 47.6% 40.6% 66.2% 60.1% 45.3% 41.2% 65.7% 65.6%
N 20 19 15 15 89 78 70 64
Funnel Rates

10 © 2010 Noel-Levitz, Inc. • 2010 Admissions Funnel Benchmarks for Four-Year Public and Private Institutions
Table A2: Recruitment Funnel Ratios for FTIC First-Year Students by Type of Application, Fall 2010
Four-Year Public Four-Year Private
Your Institution’s
Online Application
Your Institution’s
Paper Application
Common Application
Another Outside
Agency’s Application*
Your Institution’s
Online Application
Your Institution’s
Paper Application
Common Application
Another Outside
Agency’s Application*
Admit rate from application to admit
Median 69.2% 64.0% NA NA 60.2% 64.8% 74.8% 51.1%First Quartile 57.5% 52.7% – – 48.1% 48.7% 61.9% 42.2%Third Quartile 78.9% 78.6% – – 72.1% 76.0% 81.4% 69.8%
N 22 20 – – 73 65 36 27
Admit rate from complete application to admit
Median 82.1% 81.4% NA NA 86.9% 79.8% 82.1% 82.7%First Quartile 61.0% 65.3% – – 72.9% 61.6% 76.2% 71.3%Third Quartile 85.4% 88.2% – – 95.3% 93.2% 92.1% 96.4%
N 15 13 – – 61 56 29 21
Yield rate from admission to enrollment
Median 37.3% 47.2% NA NA 32.9% 35.9% 17.9% 19.4%First Quartile 32.7% 38.0% – – 26.1% 28.6% 13.8% 15.0%Third Quartile 44.7% 55.2% – – 44.0% 47.2% 24.2% 31.1%
N 22 20 – – 72 63 35 24
Melt rate from deposit/confi rmed to enrollment
Median 7.7% 4.6% NA NA 11.5% 11.6% 11.0% 10.0%First Quartile 4.7% 2.7% – – 7.6% 6.3% 7.6% 7.9%Third Quartile 13.8% 12.5% – – 17.9% 16.3% 14.2% 14.2%
N 12 9 – – 61 51 32 17
Percentage of applicants not completing application process
Median 11.1% 18.0% NA NA 22.2% 16.7% 9.1% 28.6%First Quartile 1.0% 8.4% – – 14.9% 11.1% 6.6% 20.7%Third Quartile 18.4% 28.9% – – 35.1% 28.6% 13.7% 45.1%
N 16 14 – – 76 56 29 23
* The “Outside Application” column is for any applications received from freshmen via an outside agency (other than Common Application) such as the Royall FastTrack application.
Funnel Rates

© 2010 Noel-Levitz, Inc. • www.noellevitz.com 11
Table A3: Recruitment Funnel Ratios for In-State Vs. Out-of-State Vs. International FTIC First-Year Students, Fall 2010
Four-Year Public Four-Year Private
In-State First-Year Students
Out-of-State First-Year Students
International First-Year Students
In-State First-Year Students
Out-of-State First-Year Students
International First-Year Students
Conversion rate from inquiry to application
Median 44.0% 27.8% 59.8% 20.4% 8.8% 47.7%First Quartile 25.7% 23.1% 31.6% 14.2% 5.1% 24.3%Third Quartile 49.8% 47.7% 90.5% 27.8% 17.4% 63.2%
N 14 14 10 89 89 79
Admit rate from application to admit
Median 65.6% 60.9% 35.5% 64.8% 62.2% 43.3%First Quartile 59.7% 53.1% 28.5% 51.8% 51.2% 28.6%Third Quartile 75.1% 70.0% 54.6% 74.8% 74.8% 57.9%
N 28 28 24 108 108 97
Admit rate from complete application to admit
Median 83.4% 79.3% 78.6% 86.3% 87.4% 75.0%First Quartile 71.6% 65.7% 69.7% 74.7% 74.1% 60.5%Third Quartile 90.2% 91.4% 92.0% 94.4% 94.5% 97.2%
N 20 20 17 88 87 74
Yield rate from admission to enrollment
Median 47.2% 25.9% 34.7% 32.2% 25.1% 28.6%First Quartile 40.3% 21.7% 29.2% 25.0% 17.9% 18.0%Third Quartile 53.4% 36.4% 47.2% 45.9% 34.3% 45.7%
N 28 27 22 107 107 93
Melt rate from deposit/confi rmed to enrollment
Median 7.3% 9.5% 14.6% 8.6% 11.1% 11.1%First Quartile 4.7% 5.7% 10.9% 5.0% 6.3% 0.0%Third Quartile 9.9% 15.8% 18.8% 14.4% 16.4% 22.2%
N 15 15 10 93 94 78
Percentage of applicants not completing application process
Median 13.0% 25.4% 50.0% 22.2% 27.5% 39.6%First Quartile 4.8% 10.0% 9.7% 13.9% 15.1% 17.0%Third Quartile 24.4% 35.4% 62.9% 32.6% 38.2% 57.7%
N 19 19 16 87 86 76
Percentage of students not identifying themselves before application
Median 29.9% 43.4% 71.6% 30.3% 36.5% 58.6%First Quartile 21.7% 25.2% 51.5% 22.0% 24.6% 34.5%Third Quartile 39.7% 47.8% 81.6% 47.5% 54.2% 75.7%
N 13 12 10 64 63 46
Funnel Rates

12 © 2010 Noel-Levitz, Inc. • 2010 Admissions Funnel Benchmarks for Four-Year Public and Private Institutions
Appendix B: How to use the benchmarks in this report
As the benchmarks in this report have shown, and as the illustration shows below,
prospective students are entering the funnel in different ways and moving through it at
different rates. To help navigate this swirling environment, we recommend the following.
1. Continue to collect and use funnel data to predict enrollment despite the limitations of
these data. Even though the environment is changing and funnel metrics are evolving,
admissions funnel data remain one of the best resources available to project enrollment.
By tracking your institution’s historic conversion rates at each stage of the admissions
cycle, you can better predict where your future enrollment will end up as each day and
week of the admissions cycle unfolds.
2. Fine-tune your enrollment predictions by comparing your admissions funnel data to the
data in this report, including to the data in Appendix A. To do this, place the benchmarks
in this report alongside your institution’s own trend data to test and confi rm any trends
that you are seeing in your prospective students’ behaviors.
3. Sharpen your admissions strategy by using the benchmarks to more quickly identify
strengths and challenges/opportunities, and to keep building more effi cient and
effective programs for student recruitment and admission. For example, in places where
you see that your funnel rate is signifi cantly lower than a given benchmark, you may fi nd
that you need to initiate new activities aimed at raising your rate. Or, in cases where you
see that your rate is above a given benchmark, you may decide to build on that area as a
particular strength of your admissions/recruitment/marketing program.
4. Use multiple funnels. As this report has demonstrated, different types of students convert
and yield at different rates, so it is no longer possible to use a “one-size-fi ts-all” funnel.
We recommend that most four-year public and private campuses should, at minimum,
be using separate funnels for traditional-age freshmen, transfers, in-state, out-of-state,
3 Channels of Entry Here is one important way the funnel is changing
Prospective students enter the funnel at different times and in different ways. Read more about the changing admissions funnel by downloading the resources listed on the next page.
Applicants
Inquiries
Prospects
C
ATM
This report answers questions such as:• Is it just my
institution’s students that are behaving this way or are other four-year campuses (public or private) seeing similar percentages of students inquiring/applying/matriculating?
• How much should I expect yield and funnel rates to differ for in-state vs. out-of-state students vs. international students, and for freshmen vs. transfer students and online vs. paper applicants?
Questions? Want to discuss your funnels or yields?Please contact Jim Mager, Ph.D., Noel-Levitz senior associate consultant, at [email protected] or by calling 1-800-876-1117.

© 2010 Noel-Levitz, Inc. • www.noellevitz.com 13
international, and paper vs. online applicants. In addition, separate funnels should be
used for those who enter at the application stage (secret shoppers) vs. those who enter at
the inquiry stage.
5. Set more realistic enrollment goals based on multiple funnels. By using multiple
funnels and knowing what to expect based on your institution’s past trend data and the
benchmarks in this report, your enrollment team should be able to set more realistic goals
and subgoals for the populations you are targeting, including goals for specifi c funnel
conversion rates.
6. Take your funnels to the next level. External benchmarks cannot explain everything
that is happening. Because your institution’s students are unique, it’s important to keep
tracking and fi nding unique factors that infl uence your institutions’ funnel rates, based
solely on your institution’s trend data even where outside benchmarks are unavailable.
While this evaluation process may sound time-consuming, the payoff is often worthwhile
as it allows institutions to more accurately predict enrollment for each term.
7. Beware the fundamental limitations of the funnel model. Secret shoppers do not enter
the funnel prior to applying. This trend has many implications for reframing college
admissions programs, including: 1) the need to treat a portion of the applicant pool
similarly to how you would treat inquiries, and 2) the need to place greater emphasis on
purchased names as a way to identify prospective students, and 3) the need to develop
new metrics, such as the percentage of purchased names who enroll and the percentage
of non-secret-shopper inquiries who apply.
For further reading Visit www.noellevitz.com/ChangingFunnel to access the following papers and reports with our consultants’ insights on new approaches to the funnel:
2010 Noel-Levitz White Paper: In Pursuit of the Secret Shopper: Effective New Strategies for Finding and Engaging Prospective Students
2009 Article: Warning: Your Most Common Admissions Funnel Metrics May be Meaningless!
2009 Noel-Levitz White Paper: A New Way to Measure Student Success
2009 Noel-Levitz White Paper: Retooling the Enrollment Funnel: Strategies and Metrics for a New Era

14 © 2010 Noel-Levitz, Inc. • 2010 Admissions Funnel Benchmarks for Four-Year Public and Private Institutions
Responding institutions Representatives from 193 four-year, U.S. colleges and universities participated in Noel-Levitz’s national electronic survey of undergraduate enrollment, retention, and admissions funnel success, which was distributed to all four-year, degree-granting institutions in September and October of 2010. The respondents included 43 four-year public institutions and 150 four-year private institutions. The names of the participating institutions appear below.
To download the corresponding fall 2010 enrollment and retention report, visit www.noellevitz.com/BenchmarkReports.
Thank you to those
who participated.
Sign up to receive
additional reports
and information
updates by e-mail at
www.noellevitz.com/
Subscribe.
4-year public institutionsAbraham Baldwin Agricultural College (GA)Arizona State University (AZ)California Polytechnic State University-
San Luis Obispo (CA)Delaware State University (DE)Emporia State University (KS)Frostburg State University (MD)Georgia Institute of Technology (GA)Illinois State University (IL)Indiana State University (IN)Indiana University-Purdue University
Indianapolis (IN)James Madison University (VA)Kent State University Tuscarawas
Campus (OH)Louisiana Tech University (LA)Missouri State University (MO)Northern Michigan University (MI)Ohio State University at Lima Campus,
The (OH)Ohio State University Main Campus, The (OH) Southern Utah University (UT)State University of New York at Fredonia (NY)State University of New York at Stony
Brook (NY)Tarleton State University (TX)Texas Tech University (TX)University of Central Arkansas (AR)University of Central Missouri (MO)University of Iowa, The (IA)University of Michigan-Ann Arbor (MI)University of Minnesota-Rochester (MN)University of Missouri-Columbia (MO)University of Nevada, Reno (NV)University of New Mexico Main Campus (NM)University of Pittsburgh at Bradford (PA)University of Science and Arts of
Oklahoma (OK)University of South Carolina Columbia (SC)University of South Dakota, The (SD)University of Southern Mississippi, The (MS)University of Texas-Pan American (TX)University of Vermont (VT)University of Washington (WA)University of Wisconsin-River Falls (WI)West Texas A & M University (TX)Western Michigan University (MI)Westfi eld State University (MA)Wright State University Main Campus (OH)
4-year private institutionsNote: A few two-year private colleges are included among the four-year private institutions.
Abilene Christian University (TX)Alvernia University (PA)Alverno College (WI)Antioch University Los Angeles (CA)Aquinas College (MI)Art Institute of Boston at Lesley University,
The (MA)Ashland University (OH)Atlanta Christian College (GA)Augsburg College (MN)Azusa Pacifi c University (CA)Baldwin-Wallace College (OH)Baylor University (TX)Belhaven University (MS)Benjamin Franklin Institute of Technology (MA)Berea College (KY)Bethel College (IN)Boston University (MA)Brigham Young University Hawaii (HI)Bryan College (TN)Burlington College (VT)Butler University (IN)Caldwell College (NJ)California College of the Arts (CA)California Lutheran University (CA)Canisius College (NY)Capital University (OH)Cardinal Stritch University (WI)Carroll University (WI)Cedarville University (OH)Central College (IA)Chatham University (PA)Christian Brothers University (TN)Clarke University (IA)Cleveland Chiropractic College-
Kansas City (KS)Cleveland Institute of Art (OH)Coe College (IA)College of Saint Benedict (MN)Columbia College (SC) Columbia College Chicago (IL)Concordia University Chicago (IL)Corcoran College of Art and Design (DC)Cornell College (IA)Cornerstone University (MI)Crown College (MN)Delaware Valley College (PA)Dillard University (LA)Dominican University of California (CA)Drexel University (PA)East Texas Baptist University (TX)Edgewood College (WI)Eureka College (IL)Evangel University (MO)
Flagler College (FL)Fresno Pacifi c University (CA)Georgetown College (KY)Georgian Court University (NJ)Guilford College (NC)Hamline University (MN)Holy Cross College (IN)Holy Family University (PA)Hood College (MD)Hope College (MI)Indiana Institute of Technology (IN)Indiana Wesleyan University (IN)Jacksonville University (FL)Keystone College (PA)La Roche College (PA)Lakeview College of Nursing (IL)Lancaster Bible College (PA)Lenoir-Rhyne University (NC)LeTourneau University (TX)Lewis and Clark College (OR)Loyola Marymount University (CA)Marist College (NY)Marquette University (WI)Marymount College (CA)Master’s College and Seminary, The (CA)Menlo College (CA)Mercer University (GA)Milligan College (TN)Mills College (CA)Mount Ida College (MA)Mount Mercy University (IA)Mount St. Mary’s University (MD)Mount Vernon Nazarene University (OH)National-Louis University (IL)Oklahoma City University (OK)Oral Roberts University (OK)Otterbein University (OH)Pacifi c Northwest College of Art (OR)Palm Beach Atlantic University (FL)Paul Smith’s College of Arts and
Sciences (NY)Post University (CT)Prescott College (AZ)Principia College (IL)Providence College (RI)Queens University of Charlotte (NC)Quincy University (IL)Randolph College (VA)Regent University (VA)Ripon College (WI)Robert Morris University (PA)Rockhurst University (MO)Rocky Mountain College (MT)Saint Joseph’s University (PA)Saint Louis University (MO)Saint Martin’s University (WA)Saint Norbert College (WI)Saint Peter’s College (NJ)Seattle University (WA)Simpson University (CA)

Soka University of America (CA)Southwestern Assemblies of God
University (TX)Southwestern College (KS)Spartanburg Methodist College (SC)Spring Arbor University (MI)St. Ambrose University (IA)St. John Fisher College (NY)Suffolk University (MA)Susquehanna University (PA)Sweet Briar College (VA)Syracuse University Main Campus (NY)Texas Wesleyan University (TX)Tiffi n University (OH)Tulane University (LA)University of Dallas (TX)University of Dayton (OH)University of Denver (CO)University of Findlay, The (OH)University of Mary Hardin-Baylor (TX)University of Mobile (AL)University of Portland (OR)University of Saint Francis (IN)University of St. Francis (IL)University of St. Thomas (TX)University of the Southwest (NM)Vaughn College of Aeronautics and
Technology (NY)Waynesburg University (PA)Western New England College (MA)Westminster College (MO)Wheelock College (MA)White Earth Tribal and Community
College (MN)Whitworth University (WA)Widener University (PA)William Jessup University (CA)Wilson College (PA)Wisconsin Lutheran College (WI)Xavier University (OH)York College of Pennsylvania (PA)Young Harris College (GA)
© 2010 Noel-Levitz, Inc. • www.noellevitz.com 15
Improve your
admissions funnel
success with a
complimentary
telephone
consultation
Readers are invited to contact Noel-Levitz to schedule a complimentary, 30-minute consultation by telephone with an experienced enrollment and/or retention strategist. We’ll listen carefully to what’s happening with your funnel and share insights with you based on our consulting work with campuses nationwide. To schedule an appointment, contact us at 1-800-876-1117 or [email protected].

Contact us at:2350 Oakdale BoulevardCoralville, Iowa 52241-9702
Phone: 800-876-1117319-626-8380
E-mail: [email protected]
Web: www.noellevitz.com
All material in this paper is copyright © by Noel-Levitz, Inc. Permission is required to redistribute information from Noel-Levitz, Inc., either in print or electronically. Please contact us at [email protected] about reusing material from this paper.
P0431211
Find it online. Find it online. This report is posted online at: www.noellevitz.com/BenchmarkReportsSign up to receive additional reports and updates. Visit our Web page: www.noellevitz.com/Subscribe
16 © 2010 Noel-Levitz, Inc. • 2010 Admissions Funnel Benchmarks for Four-Year Public and Private Institutions
Questions about this report?We hope you have found this report to be helpful and informative. If you have questions or would like more information about the fi ndings, please contact Jim Mager, Noel-Levitz senior associate consultant, at 1-800-876-1117 or [email protected].
About Noel-Levitz and our higher education research
A trusted partner to higher education, Noel-Levitz focuses on strategic planning for enrollment and
student success. We work side by side with campus executive teams to facilitate planning and to help
implement the resulting plans.
For more than 20 years, we have conducted national surveys to assist campuses with benchmarking
their performance. This includes benchmarking marketing/recruitment and student success practices,
monitoring student and campus usage of the Web and electronic communications, and comparing
institutional budgets, policies, and outcomes. There is no charge or obligation for participating and
responses to all survey items are strictly confi dential. Participants have the advantage of receiving the
fi ndings fi rst, as soon as they become available.
For more information, visit www.noellevitz.com.
How to cite this report
Noel-Levitz. (2010). Fall 2010 admissions funnel benchmarks for four-year public and private institutions. Coralville, Iowa: Author. Retrieved from: www.noellevitz.com/ChangingFunnel
••
Related reports from Noel-Levitz
Benchmark Poll Report Serieswww.noellevitz.com/BenchmarkReports
E-Expectations Report Serieswww.noellevitz.com/E-ExpectationsSeries
Latest Discounting Reportwww.noellevitz.com/DiscountReport
National Student Satisfaction-Priorities Reportswww.noellevitz.com/SatisfactionBenchmarks
National Freshman Attitudes Reportswww.noellevitz.com/FreshmanAttitudes
Please watch for
our next survey
and report on
admissions funnel
conversion and
yield rates in
fall 2012.