2010 Fact Book - Minot State University · AIP of Minot State University is pleased to present the...
87
2010 Fact Book
Transcript of 2010 Fact Book - Minot State University · AIP of Minot State University is pleased to present the...

2010 Fact Book
- i -
Minot State University 500 University Avenue West Minot, North Dakota 58707
2010 Fact Book
Acknowledgements: The Office of Academic and Institutional Projects would like to extend a heartfelt thank you to personnel in the following offices who supplied data and information for the 2010 Fact Book:
Academic Affairs
Student Affairs
North Dakota University System
Gordon B. Olson Library
Center for Extended Learning
Registrar’s
Advancement
Human Resources
Administration and Finance
Graduate School

- ii -
Preface Mission Statement The Office of Academic and Institutional Projects at Minot State University supports the university’s planning and decision-making efforts so that the university can fulfill its larger mission. The office responds to requests from constituencies of the university in order to support decision making, assessment, policy analysis, effective management, projections and planning. It also responds to requests for information from outside agencies and other institutions and generates annual Factbooks and reports showing trends and comparisons to the North Dakota University System. The goals of AIP are to ensure that reports and analyses are accurate, timely and useful to Minot State University students, administrators, faculty and staff. To guarantee that MSU’s mission is carried forward, the institutional research director works carefully to ensure that files dealing with student course and personnel data are as accurate and consistent as possible. AIP of Minot State University is pleased to present the 2010 Fact Book. This is an annual and cumulative production providing an ongoing view of trends and documents areas of growth and development, diversity and challenge.
Cari A. Olson, MS, institutional research director
2010 Fact Book Highlights Student Enrollment Faculty Trends Degree Highlights 2010 MSU Finance
- iii -
Table of Contents
Acknowledgments ................................................................................................................ i Preface and Fact Book 2010 Highlights ............................................................................. ii Table of Contents ................................................................................................................. iii Accrediting Agencies ........................................................................................................... 1 Administration ..................................................................................................................... 2 Board of Regents Executive Committee .......................................................................... 3 MSU Alumni Association Board of Directors and Members ........................................... 3 MSU Development Foundation Board of Directors and Members .................................. 4 NDUS Administrative Officers ........................................................................................ 5 Minot State University Organizational Chart ................................................................... 6 Vice President for Academic Affairs Organizational Chart ............................................. 7 MSU Administrative Offices ............................................................................................ 8-9 MSU Student Information .................................................................................................. 10 North Dakota University System Fall Enrollment 1997-2010 ......................................... 11 Enrollment by Classification and Gender 2010 ................................................................ 12 Student Enrollment Highlights 2008-2010 ....................................................................... 13 Student Enrollment Highlights: FTE/Total 2006-2010 .................................................... 14 Fall Enrollment – Headcount 1997-2010 ......................................................................... 15 Head Count Enrollment/Full-Time Equivalent, Headcount by Status/Year 1997-2010 .. 16 Head Count Enrollment by Level ..................................................................................... 17 Full Time Undergraduates by Status 1997-2010 .............................................................. 18 Part-Time Undergraduate Enrollment 1997-2010 ............................................................ 19 Total Undergraduates 1999-2009 and Total Graduates 1999-2010 ................................. 20 Enrollment by Gender 1997-2010 .................................................................................... 21 Full and Part-Time Graduates and Undergraduates by Gender 2008-10 ......................... 22 Enrollment Totals by Ethnicity 1997-2010 ...................................................................... 23 Enrollment by Residency 1997-2010 ............................................................................... 24 New Students, Transfers, and OTAS 1997-2010 ............................................................. 25 OTAS Full and Part Time by Gender and Totals 1997-2010 ........................................... 26 Map of Enrolled Students by North Dakota County Fall 2010 ........................................ 27 Enrollment by North Dakota County 1997-2010 ............................................................. 28-29 Map of Freshman Students by North Dakota County Fall 2010 ...................................... 30 Freshman by North Dakota County 1997-2010 ............................................................... 31-32 Enrolled Students by State of Origin 1997-2010 .............................................................. 33 Enrolled Students by State of Origin Fall 2010 ................................................................ 34 International Student Enrollment and Classification Fall 2010 ........................................ 35 Center for Extended Learning Headcounts Fall 2001-2010 ............................................. 36-37 New Freshman Applications and Enrollment Patterns 1999-2010 ................................... 38 Retention of New Freshmen 1998-2010 ........................................................................... 38 New Transfer Applications and Enrollment Patterns 1999-2010 ..................................... 38 Institutional Average GPA Undergraduate and Graduate 1998-2010 .............................. 39 Comparison of ACT Averages ........................................................................................ 40 Student Housing by Residence and Average Costs of Residence 2002-2010 .................. 41 Residence Hall Disciplinary Actions 2000 - 2010 ........................................................... 41 Minot State University Crime Statistics – Calendar Year 1999–2010 ............................. 42
- iv -
Majors and Degree Information ........................................................................................ 43 Declared Majors College of Arts and Sciences 1998–2010 ............................................. 44-45 Declared Majors College of Education and Health Sciences 1998–2010 ........................ 45 Declared Majors College of Business and the Graduate School 1998–2010 ................... 46 Degrees Conferred College of Arts and Sciences 1998-2010 .......................................... 47-48 Second Majors Reported to IPEDS College of Arts and Sciences 2005-2010 ................. 49-50 Degrees Conferred College of Education and Health Science 1998-2010 ....................... 49 Second Majors Reported to IPEDS College of Education and Health Science 2005-10 . 50 Degrees Conferred College of Business 1998-2010 ......................................................... 51 Second Majors Reported to IPEDS College of Business 2005-10 ................................... 51 Certificate Programs 2000-2010 ....................................................................................... 52 Graduation Rates .............................................................................................................. 52 Graduate Programs and Graduate Certificate 2001-2010 ................................................. 53 Degrees Conferred Undergraduate and Graduate 1998-2010 by First Majors ................. 54 Undergraduate Degrees by Degree Type by First Majors 2004-2010 .............................. 55 Graduates by College 1998-2010 by First Major ............................................................. 55 MSU Faculty and Staff Information .................................................................................. 56 Faculty Status and Gender Distribution 1998-2010 ......................................................... 57 Total Faculty by Year and Status (full or part time and non-teaching) ............................ 57 MSU Average Faculty Salaries by Rank 1998-2010 ........................................................ 58 MSU Staff by Job Family and Gender Fall 2010 ............................................................. 58 Full-time Faculty by Rank and Gender Distribution 1998-2010 ...................................... 59 MSU Tenured Faculty by Rank and Gender 1998-2010 .................................................. 59 Headcount of Faculty in FT and PT categories by Highest Degree ................................. 60
MSU Financial Information ............................................................................................... 61 Tuition and Fee Comparison 2000 to 2009-2010 ............................................................ 62 Tuition and Fee Compared to Household Income 2000 to 2009-2010 ............................ 62 MSU Cost per Student - FY 2001 to FY 2010 ................................................................. 63 Operating and Contributed Income Ratio - FY 2001 to FY 2010 .................................... 64 Grants and Contracts - 1997-1998 to 2009-2010 ............................................................ 65 Combined Endowment Assets 1999 to 2010 .................................................................... 66 Student Fees and Financial Aid .......................................................................................... 67 Tuition and Fees, Semester Rates – 2001-2002 through 2009-2010 ............................... 68 Student Activity Fee Distribution - 2009-2010 ................................................................ 69 Awarded and Type of Aid and Dollar Amount ................................................................ 70 Financial Aid Trends 1999-2000 through 2009-2010 ...................................................... 71 Information Resources ........................................................................................................ 72 Library Holdings 1999 to 2010 ........................................................................................ 73 Library-use Figures .......................................................................................................... 73 Types of Materials Ordered 1999 to 2010 ........................................................................ 74 Access of Web Pages 2002 to 2010 ................................................................................. 74 Electronic Reserves 2002–2006, Book Expenditures 1998–2010 .................................... 75 Circulation of Library Materials 2000 to 2010 ................................................................. 75 Circulation of Material by User Class 2000 to 2010 ........................................................ 75 Information Technology Central Report ............................................................................... 76-78 Sources .................................................................................................................................. 79 Glossary ................................................................................................................................ 80
- 1 -
Accrediting Agencies The Higher Learning Commission
North Central Association of Colleges and Schools 30 N. LaSalle Street, Ste 2400, Chicago, IL (800) 621-7440
National Council for Accreditation of Teacher Education 2010 Massachusetts Avenue NW, Suite 500, Washington, D.C., 20036-1023
National Association of Schools of Music 11250 Roger Bacon Drive, Suite 21, Reston, VA 20190-5248
Council on Education of the Deaf Kent State University, Kent, OH 44242-0001
Council on Academic Accreditation of the American Speech-Language-Hearing Association 10801 Rockville Pike, Rockville, MD 20852-3279
Council on Social Work Education–Baccalaureate level 1600 Duke Street, Alexandria, VA 22314-3421
International Assembly for Collegiate Business Education PO Box 25217, Overland Park, KS 66225, (913) 631-3009
National League for Nursing Accrediting Commission, Inc. Broadway 33rd Floor, New York, NY 10006
National Association of School Psychologists
PO Box 791089, Baltimore, MD 21279-1089
North Dakota Board of Nursing 919 7th Street, Suite 504, Bismarck, ND 58504-5881

- 2 -
Minot State University
Administration

- 3 -
Board of Regents Executive Committee
Executive Chair ------------------------------------------------------------ David Reiten Past Executive Chair ------------------------------------------------------ Kathy Aas MSU President ------------------------------------------------------------- David Fuller Treasurer -------------------------------------------------------------------- Brain Foisy Secretary -------------------------------------------------------------------- Marv Semrau Chair-Elect ----------------------------------------------------------------- Valerie Bruels Member-at-Large --------------------------------------------------------- Leslie Coughlin
MSU Alumni Association Board of Directors
Executive Committee Past President -------------------------------------------------------------- Brenda Foster Co-President ---------------------------------------------------------------- Linda Christianson Co-President ---------------------------------------------------------------- Deb Schultz Vice President for Promotions ------------------------------------------- Rob Anderson Vice President for Events ------------------------------------------------- Kelly Hayhurst Vice President for Outreach ---------------------------------------------- Angela Zerr Director of Annual Giving and Alumni Relations -------------------- Tawnya Bernsdorf MSU President ------------------------------------------------------------ David Fuller
Members
Robert Anderson
Amy Artz
Kristi Berg
Leslie Barney
Randy Burckhard
Linda Christianson
Larry Eidsness
Denise Faulkner
Greg Fjeld
Brenda Foster
Ryan Hertz
Kelly Hayhurst
Kelsey Holt
Judy Kitzman
Gloria Lockken
Lisa M. Olson
Tonya Pearson
Alison Repnow
Chuck Repnow
Jan Repnow
Deb Schultz
Ellen Simmons
Angela Zerr
Mike Gietzen DelRae Zimmerman

- 4 -
MSU Development Foundation Board of Directors Executive Director -------------------------------------------------------- Marv Semrau President -------------------------------------------------------------------- Maynard Sandberg Vice President -------------------------------------------------------------- Vacant Treasurer -------------------------------------------------------------------- Brian Foisy Investment Advisory Committee ---------------------------------------- Tom Probst Special Gifts Committee -------------------------------------------------- Bruce Walker Development Strategies Committee------------------------------------- Doris Slaaten MSU President ------------------------------------------------------------- David Fuller
Members
Jon Backes
Diane Bryantt
Rich Campbell
Eric Clausen
Brian Foisy
David Fuller
Langer Gokey
Kathy Aas
Maynard Sandberg
Doris Slaaten
Myron Thompson
Bruce Walker
Brenda Foster
Marv Semrau Tom Probst Robert Sando
- 5 -
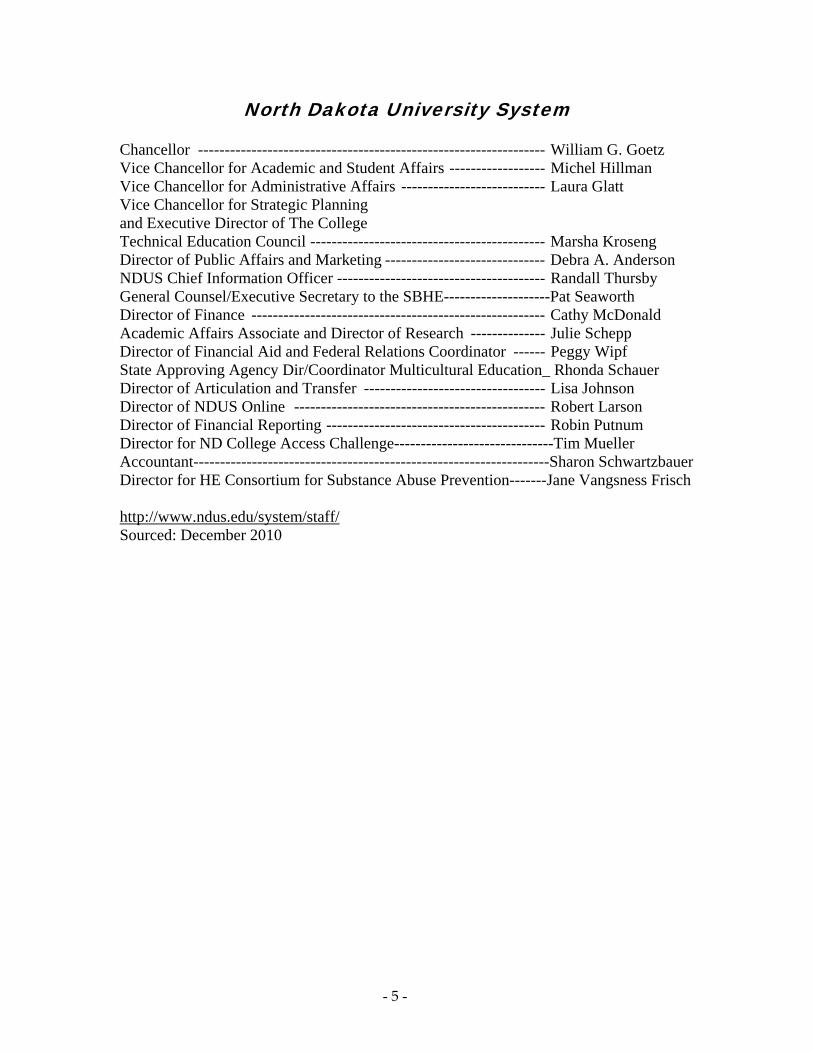
North Dakota University System Chancellor ----------------------------------------------------------------- William G. Goetz Vice Chancellor for Academic and Student Affairs ------------------ Michel Hillman Vice Chancellor for Administrative Affairs --------------------------- Laura Glatt Vice Chancellor for Strategic Planning and Executive Director of The College Technical Education Council -------------------------------------------- Marsha Kroseng Director of Public Affairs and Marketing ------------------------------ Debra A. Anderson NDUS Chief Information Officer --------------------------------------- Randall Thursby General Counsel/Executive Secretary to the SBHE--------------------Pat Seaworth Director of Finance ------------------------------------------------------- Cathy McDonald Academic Affairs Associate and Director of Research -------------- Julie Schepp Director of Financial Aid and Federal Relations Coordinator ------ Peggy Wipf State Approving Agency Dir/Coordinator Multicultural Education_ Rhonda Schauer Director of Articulation and Transfer ---------------------------------- Lisa Johnson Director of NDUS Online ----------------------------------------------- Robert Larson Director of Financial Reporting ----------------------------------------- Robin Putnum Director for ND College Access Challenge------------------------------Tim Mueller Accountant-------------------------------------------------------------------Sharon Schwartzbauer Director for HE Consortium for Substance Abuse Prevention-------Jane Vangsness Frisch http://www.ndus.edu/system/staff/ Sourced: December 2010

- 6 -
Head Coaches
Assistant Athletic Director for Advancement
Assistant Athletic Director
for Compliance and Student Life
Sports Information Director
Beaver Booster Board
David Fuller, PhD MSU President
Minot State University Organizational Chart
Mark LymanPublic Information
Richard Jenkins, EdD Vice President Student Affairs
Career Services
Multicultural Services
Student
Publications
Student Services
Student Housing
Student Center
TRIO Programs
Marv Semrau Vice President Advancement
Alumni
Board of Regents
Development Foundation
Institutional Marketing
Publications & Design
Selmer Moen, PhD Interim Vice President
Academic Affairs
Rick Hedberg, MS Athletic Director
Brian Foisy, MS Vice President
Administration and Finance
Academic Deans
Dean of Admissions
Registrar’s Office
Gordon B. Olson Library
Academic and Institutional Projects
Center for Extended
Learning
Graduate School and Research and Sponsored
Programs
International Programs
Honors Program
Center for Engaged Teaching and Learning
(See page 7 for details)
Bookstore
Business Office
Food Services
Grants and Contracts Accounting
Information Technology Center
Facilities Management Post Office
Human Resources
Financial Aid

- 7 -

- 8 -
Minot State University Academic Affairs Organizational Chart
Linda Cresap, Dean Graduate School
Research and Sponsored Programs
Addiction Studies/Psychology
and Social Work
Communication Disorders
Special Education
Nursing
Teacher Education
and Human Performance
Conrad Davidson, Dean College of Arts and Sciences
Biology
Criminal Justice
Humanities
Music
Math and Computer Science
NW Art Center
Science
Social Science
Kevin Harmon, Dean Admissions
Recruiting Services
Admissions
Neil Nordquist, Dean College of Education and Health Sciences
Selmer Moen Interim Vice President
Academic Affairs
Kris Warmoth, Dean Center for
Extended Learning
Online Education
Distance Education
Dual Credit Education
Office of Instructional Technology
Professional and
Community Education
Accounting and Finance
Business Administration
Business Information Technology
Severson Academy
JoAnn Linrud, Dean College of Business
Registrar’s Office North Dakota Center for Persons with Disabilities
Gordon B. Olson Library Academic and Institutional Projects
Center for Engaged Teaching and Learning
International Programs Honor’s Program
Rural Crime and Justice Center

- 9 -

- 10 -
Administrative Offices Academic Affairs Interim Vice President for Academic Affairs ---------------------------------- Selmer Moen Executive Director, ND Center for Persons with Disabilities --------------- Brent Askvig Director, Financial Aid ------------------------------------------------------------ Dale Gehring Director, Library ------------------------------------------------------------------- Stephen Banister Registrar ----------------------------------------------------------------------------- Rebecca Porter Dean of Admissions --------------------------------------------------------------- Kevin Harmon Director, Institutional Research -------------------------------------------------- Cari Olson
College of Arts and Sciences Dean --------------------------------------------------------------------------------- Conrad Davidson Chair, Division of Humanities --------------------------------------------------- Linda Olson Chair, Department of Mathematics and Computer Science ------------------ Laurie Geller Chair, Division of Music --------------------------------------------------------- Kenneth Bowles Chair, Department of Science --------------------------------------------------- Ryan Winburn Chair, Department of Biology --------------------------------------------------- Christopher Keller Chair, Division of Social Science ------------------------------------------------ Dan Ringrose Chair, Department of Criminal Justice ----------------------------------------- William Archambeault Director, Honors Program -------------------------------------------------------- Lynne Rumney Director, Northwest Arts Center ------------------------------------------------- Avis Veikley Executive Director, Rural Crime and Justice Center -------------------------- Rodney Hair College of Business Dean -------------------------------------------------------------------------------- JoAnn Linrud Chair, Department of Accounting and Finance ------------------------------- Patricia Fedje Chair, Department of Business Information Technology -------------------- Lori Willoughby Chair, Business Administration -------------------------------------------------- Gary Ross College of Education and Health Sciences Dean --------------------------------------------------------------------------------- Neil Nordquist Interim Chair, Department of Communication Disorders -------------------- Leisa Harmon Chair, Department of Teacher Education and Human Performance -------- Warren Gamas Coordinator, Master of Education Program ----------------------------------- Deb Jensen Coordinator, Elementary Education Program ---------------------------------- Lisa Borden-King Coordinator, Physical Education and Human Performance Program ------- David Rochholz Coordinator, Teacher Education Core ------------------------------------------- Rebecca Anhorn Director, Advisement and Field Placement ------------------------------------- Elaine Larson Chair, Department of Addiction Studies/Psych/Social Work ---------------- Donald Burke Director, School Psychology ----------------------------------------------------- Casey Coleman Director, Addiction Studies ------------------------------------------------------- Vicki Michels Director, Social Work ------------------------------------------------------------- Charlene Bruley Chair, Department of Nursing ---------------------------------------------------- Kelly Buettner-Schmidt Chair, Department of Special Education----------------------------------Alan Ekblad

- 11 -
Administrative Offices
Graduate School and Research and Sponsored Programs Dean ...................................................................................................Linda Cresap Student Affairs
Vice President for Student Affair---------------------------------------- Richard Jenkins Director, Multicultural Support Services ------------------------------- Dennis Parisien Director, Student Health Center ----------------------------------------- Caren Barnett Director, Student Life ----------------------------------------------------- Lisa Eriksmoen Director, Student Center -------------------------------------------------- Leon Perzinski Director, Student Success Center ---------------------------------------- Lynda Bertsch Coordinator, Student Activities ------------------------------------------ Ann Rivera Coordinator, Disability Services ----------------------------------------- Evelyn Klimpel Student Publications ------------------------------------------------------ Frank McCahill Nurse Practitioner --------------------------------------------------------- Heidi Peterson Counselor, Student Development --------------------------------------- Nancy Mickelson Coordinator, Fitness Center ---------------------------------------------- Paul Brekke Coordinator, Residence Life----------------------------------------------Heather Stroupe-Smith Administration and Finance
Vice President for Administration and Finance ----------------------- Brian Foisy Controller ------------------------------------------------------------------- Jonelle Watson Director, Facilities Management ---------------------------------------- Roger Kluck Director, Publications and Design Services ---------------------------- Sandy Nordstrom Director, Student Center -------------------------------------------------- Leon Perzinski Director, Information Technology Center ------------------------------ Cathy Horvath Manager, Bookstore ------------------------------------------------------- Sandra Foley University Athletics
Director, Athletics --------------------------------------------------------- Rick Hedberg Head Women’s Basketball ----------------------------------------------- Sheila Green Gerding Head Men’s Basketball -------------------------------------------------- Peter Stewarti Head Men’s/Women’s Golf ---------------------------------------------- Dwight Farrell Head Volleyball ----------------------------------------------------------- Johnna Torr Head Women’s Soccer ---------------------------------------------------- Jason Spain Head Cross Country ------------------------------------------------------- Stu Melby Head Football -------------------------------------------------------------- Paul Rudolph Head Softball --------------------------------------------------------------- Bill Triplett Head Baseball ------------------------------------------------------------- Brock Weppler Head Wrestling ------------------------------------------------------------ Robin Ersland

- 12 -
Minot State University
Student Information

- 13 -
North Dakota University System Fall Enrollment by Headcount 1997-2010
Institution 1997 1998 1999 2000 2001 2002 2003 2004 2005 2006 20071 2008 2009 2010
Bismarck State College
2,481 2,594 2,743 2,744 3,044 3,168 3,430 3,546 3,370 3,477 3,591 3,788 4,020 4,177
Dickinson State University
1,736 1,800 1,867 2,012 2,101 2,326 2,461 2,479 2,516 2,572 2,670 2,730 2,767 2,688
Lake Region State College
738 826 805 902 1,308 1,340 1,473 1,464 1,471 1,508 1,520 1,657 1,702 1,913
Mayville State University
705 740 851 776 755 746 817 897 912 832 769 789 887 982
Dakota College at Bottineau
421 447 508 451 526 609 620 602 523 605 637 655 748 863
Minot State University
3,294 3,156 3,155 3,081 3,515 3,625 3,825 3,851 3,798 3,712 3,424 3,432 3,649 3,866
ND State College of Science
2,542 2,469 2,345 2,425 2,292 2,439 2,468 2,481 1,852 2,490 2,417 2,545 2,651 2,833
North Dakota State University
9,408 9,536 9,638 9,894 10,538 11,146 11,623 12,026 12,099 12,258 12,527 13,229 14,189 14,407
University of North Dakota
10,363 10,369 10,590 11,031 11,764 12,423 13,034 13,187 12,954 12,834 12,559 12,748 13,172 14,194
Valley City State University
1,054 1,081 1,077 1,090 1,005 1,022 998 944 1,035 1,037 982 1,019 1,083 1,285
Williston State College
788 674 714 687 748 770 871 937 947 912 731 850 949 932
Total 33,350 33,692 34,293 35093 37,596 39,614 41,620 42,414 42,082 42,237 41,827 43,442 45,817 48,120
Source: North Dakota University System Office: 2009 Fall Enrollment Report http://www.ndus.edu/uploads/document-library/1785/FALL-2009-ENROLLMENT-FOR-NEWS--RELEASE.PDF
Data Source: North Dakota University System. Headcount is the total number of students enrolled regardless of the number of credit hours. NDUS reports the headcount as the number of students enrolled on the 4th week of classes in the term. 1 “Enrollment at some institutions includes students who were registered but had not made payment or been granted an extension based on documented good cause as of the census date. This includes 24 students at NDSU, 40 students at UND, 71 students at NDSCS and 239 students at LRSC for a total of 374 students.” (Creating a University System for the 21st Century, 2007 Fall Enrollments, November 2007, p. 1)

U
F
S
J
STUG
M
Undergradu
First Year
Sophomore
Junior
Senior Total UndergraduGraduate
MSU Totals
* Totadata.
Enrollm
ate 2007
388
239
181
345
ate 1153
57
1210 Registrar’s O
als include two
Tot
ment by CHeadc
Male
2008 200
415 46
276 24
175 21
366 34
1232 127
54 64
1286 134Office: Enrollment
freshmen who
otal Stude
Registrar’s
-
Classificcount 200
09 2010
69 503
45 284
6 216
46 365
6 1368
4 67
40 1435 t Report ID# NDUo did not report
ents by Ac
Office: Enrollme
2007
- 14 -
cation a007, 2008,
Fe
2007 2008
521 569
417 396
370 352
679 623
1987 1940
227 206
2214 2146UH2SRA pg 5 (4t
t gender. Data
Academic
nt Report ID# ND
2008 2009
and Gend8, 2009, 20
emale
8 2009 20
626 6
414 4
363 3
666 7
0 2069 2
240 2
6 2309 24th Week Data) from 2005 wa
Status 20
DUH2SRA pg 5 (
9 2010
der Fall 2010
010 2007
649 909
436 656
359 551
739 1024
183 3140
248 284
431 3424
as initial year o
2007-2010
(4th Week Data)
l 2010
Total
2008 200
984 109
672 659
527 579
989 101
3172 334
260 304
3432 364
of PeopleSoft
0
09 2010
95 1152
9 720
9 575
12 1104
45 3551
4 315
49 3866

- 15 -
Minot State University Enrollment Highlights Fall 2010 to Fall 2009 Data
s Head Count Full-time Part Time Total Scheduled Cr Hr 2010 2009 Change 2010 2009 Change 2010 2009 Change 2010 2009 Change
Freshmen Male 503 469 34 223 248 -25 280 221 59 4484.5 4615.0 -130.5 Female 649 626 23 374 341 33 275 285 -10 6865.5 6388.0 477.5
Total 1152 1095 57 597 589 8 555 506 49 11350.0 11003.0 347
Sophomore Male 284 245 39 250 212 38 34 33 1 3886.5 3320.0 566.5 Female 436 414 22 367 331 36 69 83 -14 6016.0 5561.0 455.0 Total 720 659 61 617 543 74 103 116 -13 9902.5 8881.5 1021.0
Junior Male 216 216 0 173 173 0 43 43 0 2853.5 2816.5 37 Female 359 363 -4 290 275 15 69 88 -19 4835.0 4685.5 149.5 Total 575 579 -4 463 448 15 112 131 -19 7688.5 7502.0 186.5
Senior Male 365 346 19 261 252 9 104 94 10 4495.5 4196.0 299.5 Female 739 666 73 508 468 40 231 198 33 8844.5 8098.5 746.0 Total 1104 1012 92 769 720 49 335 292 43 13340.0 12294.5 1045.5
TOTAL UNDERGRADUATES Male 1368 1276 92 907 885 22 461 391 70 15720.0 14947.5 772.5 Female 2183 2069 114 1539 1415 124 644 654 -10 26561.0 24733.0 1828.0 Total 3551 3345 206 2446 2300 146 1105 1045 60 42281.0 39681.0 2600.0
TOTAL GRADUATES Male 67 64 3 26 24 2 41 40 1 455.0 459.0 -4 Female 248 240 8 85 92 -7 163 148 15 1746.0 1778.0 -32 Total 315 304 11 111 116 -5 204 188 16 2201.0 2237.0 -36
MINOT STATE UNIVERSITY TOTAL Male 1435 1340 95 933 909 24 502 431 71 16175.0 15406.5 768.5 Female 2431 2309 122 1624 1507 117 807 802 5 28307.0 26511.0 1796 Total 3866 3649 217 2557 2416 141 1309 1233 76 44482.0 41917.5 2564.5
Registrar’s Office: Enrollment Report ID# NDUH2SRA pg 5 (4th Week Data) * FTE/Total refers to full-time equivalent of total credit hour production (Total undergraduate credit hours divided by 16 or Total graduate credit hours divided by 12.). “Total credit hours” is the number of credit hours the full-time and part-time students enrolled in. http://www.csgnetwork.com/percentchangecalc.html FTE numbers were calculated by dividing total credit hours from first table by 15 for undergraduates and by 12 for graduates. Prior to 2006, the calculation was 16 for undergraduates and 9 graduates.

- 16 -
Minot State University Student Enrollment Highlights: FTE/Total*
2007-2010
The calculations are based upon 15 credit hours for full-time undergraduate students and 12 credit hours for graduate students.
2007 Fall Semester 2008 Fall Semester 2009 Fall Semester 2010 Fall Semester
07 FT + FTE of
Part Time
Total Scheduled
Credit Hours
FTE of Total
Credit Hours
2008 Fall
Semester FT +
FTE of PT
Total Scheduled
Credit Hours
FTE of
Total Credit Hours
2009 Fall
Semester FT +
FTE of PT
Total Scheduled
Credit Hours
FTE of Total
Credit Hours
2010 Fall
SemesterFT +
FTE of PT
Total Scheduled
Credit Hours
FTE of Total
Credits
Freshmen 664.26 9,764.5 650.96 695.61 10,206.50 680.43 749.37 11003.0 733.54 769.08 11350.00 756.67
Sophomore 588.19 8,769.5 584.62 607.53 9,065.50 604.37 596.36 8881.50 592.10 668.23 9902.50 660.18
Junior 485.73 7,239 482.6 460.40 6,910.50 460.70 508.10 7502.0 500.14 514.67 7688.50 512.56
Senior 851.06 12,391 826.07 827.04 12,100.50 806.71 845.03 12294.5 819.64 912.20 13340.00 889.33 Total Undergrad. 2,589.24 38,164 2,544.25 2590.58 38,283.00 2552.21 2698.86 39681.00 2645.42 2864.18 42281.00 2818.74
Graduate
Graduate 187.74 2,223 185.24 167.09 2,019.00 168.25 184.16 2237.0 186.40 183.91 2201.00 183.41 Institutional Total FTE 2,776.98 40,387.00 2,729.49 2,757.67 40,302.00 2,720.46 2883.0 41918.0 2831.82 3048.09 44482.00 3002.15
Source: Report NDUH2SRA- Headcounts and FTE Enrollments- Official Enrollment Report, received from Registrar’s Office September 2010.
- 17 -
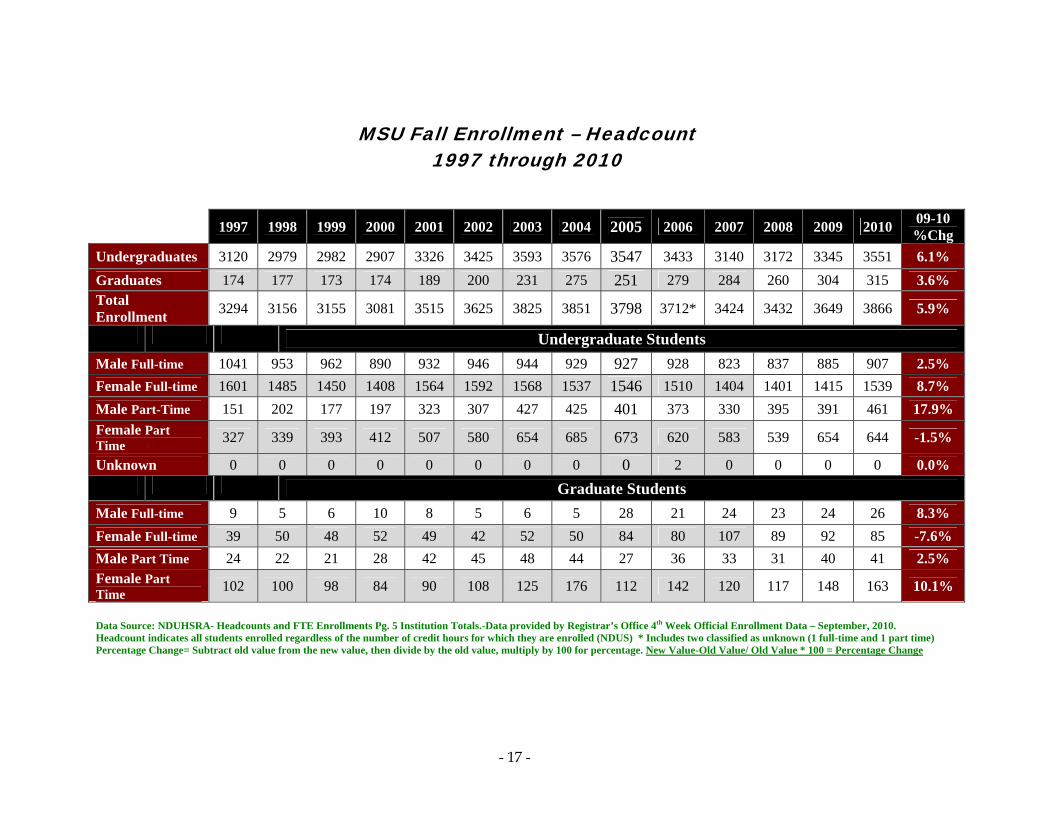
MSU Fall Enrollment – Headcount 1997 through 2010
1997 1998 1999 2000 2001 2002 2003 2004 2005 2006 2007 2008 2009 2010
09-10 %Chg
Undergraduates 3120 2979 2982 2907 3326 3425 3593 3576 3547 3433 3140 3172 3345 3551 6.1%
Graduates 174 177 173 174 189 200 231 275 251 279 284 260 304 315 3.6% Total Enrollment
3294 3156 3155 3081 3515 3625 3825 3851 3798 3712* 3424 3432 3649 3866 5.9%
Undergraduate Students
Male Full-time 1041 953 962 890 932 946 944 929 927 928 823 837 885 907 2.5%
Female Full-time 1601 1485 1450 1408 1564 1592 1568 1537 1546 1510 1404 1401 1415 1539 8.7%
Male Part-Time 151 202 177 197 323 307 427 425 401 373 330 395 391 461 17.9%
Female Part Time 327 339 393 412 507 580 654 685 673 620 583 539 654 644 -1.5%
Unknown 0 0 0 0 0 0 0 0 0 2 0 0 0 0 0.0%
Graduate Students
Male Full-time 9 5 6 10 8 5 6 5 28 21 24 23 24 26 8.3%
Female Full-time 39 50 48 52 49 42 52 50 84 80 107 89 92 85 -7.6%
Male Part Time 24 22 21 28 42 45 48 44 27 36 33 31 40 41 2.5% Female Part Time 102 100 98 84 90 108 125 176 112 142 120 117 148 163 10.1%
Data Source: NDUHSRA- Headcounts and FTE Enrollments Pg. 5 Institution Totals.-Data provided by Registrar’s Office 4th Week Official Enrollment Data – September, 2010. Headcount indicates all students enrolled regardless of the number of credit hours for which they are enrolled (NDUS) * Includes two classified as unknown (1 full-time and 1 part time) Percentage Change= Subtract old value from the new value, then divide by the old value, multiply by 100 for percentage. New Value-Old Value/ Old Value * 100 = Percentage Change

- 18 -
MSU Headcount (HC) and Full-time Equivalent (FTE) 1997-2010
Graduate and Undergraduate Combined
Data Source: NDUHSRA- Headcounts and FTE Enrollments Pg. 5 Institution Totals.-Data provided by Registrar’s Office 4th Week Official Enrollment Data – September 23rd, 2010. Headcount indicates all students enrolled regardless of the number of credit hours for which they are enrolled (NDUS) Percentage Change= Subtract old value from the new value, then divide by the old value, multiply by 100 for percentage. New Value-Old Value/ Old Value * 100 = Percentage Change
Year Headcount%
Change FTE*
% Change
1997 3294 ---- 2727 ----
1998 3156 -4.0 2597 -4.8
1999 3155 0.0 2588 -0.3
2000 3081 -2.3 2491 -3.7
2001 3515 14.1 2739 10.0
2002 3625 3.1 2789 1.8
2003 3825 5.5 2839 1.8
2004 3851 0.7 2844 0.2
2005 3798 -0.8 2884 1.4
New FTE formula initiated in 2006
2006 3712 -2.3 2928 n/a
2007 3424 -7.8 2730 -6.8
2008 3432 .23 2720.46 -0.3
2009 3649 6.3 2831.82 4.09
2010 3866 5.9 3002.15 6.01

Hea
Freshman,
Freshman, 1
Freshman,
Freshman,
Freshman
Freshma
Freshm
Freshma
Fres
Freshma
Freshman
Freshma
Freshma
Freshm
adcoun
Headco
1997, 782
1998, 670
1999, 766
2000, 770
n, 2001, 926
an, 2002, 996
an, 2003, 1121
an, 2004, 1058
shman, 2005, 1
an, 2006, 1098
n, 2007, 909
an, 2008, 984
an, 2009, 1095
man, 2010, 1152
Sophmo
Sophmore,
Sophmore
Sophmor
Sop
So
S
So
Sophm
Soph
So
Freshma
-
nt En199
ounts include al
1
1462
8
5
2
ore, 1997, 701
, 1998, 708
e, 1999, 626
re, 2000, 652
hmore, 2001, 8
phmore, 2002
Sophmore, 20
Sophmore, 200
Sophmo
ophmore, 2006
more, 2007, 65
hmore, 2008, 6
ophmore, 2009
Sophmore, 20
Junio
Junior, 1
Junior, 1
Junior, 20
Junio
Jun
n Sophmo
- 19 -
nrollm97-201
ll students enro
807
, 781
003, 771
04, 794
ore, 2005, 677
6, 651
56
672
9, 659
010, 720
r, 1997, 626
1998, 608
1999, 581
000, 407
Junior, 2001, 5
Junior, 2002
Junior, 20
Junior, 200
Junior
Junior, 2006,
or, 2007, 551
nior, 2008, 527
Junior, 2009, 5
Junior, 201
Sen
Sen
Senior,
S
ore Junior
ment b10 olled (FT and P
7
592
, 647
03, 644
04, 623
r, 2005, 527
, 664
7
579
0, 575
Senior, 1997, 9
nior, 1998, 906
nior, 1999, 936
, 2000, 897
Senior, 20
Senior,
Sen
Senio
Sen
Senior, 2
enior, 2007, 10
Senior, 2008,
Senior, 200
Senior,
Gra
Gradu
Gradu
Graduate,
G
G
UG Special
by Lev
PT)
933
6
6
001, 921
, 2002, 904
ior, 2003, 966
or, 2004, 997
ior, 2005, 881
2006, 1020
024
989
09, 1012
, 2010, 1104
aduate, 1997, 1
ate, 1998, 177
ate, 1999, 173
2000, 174
Graduate, 20
Graduate,
Gradu
Gradu
Gradua
Graduate
Graduate, 2007
Graduate, 2008
Graduate,
Gradu
l Senior
vel
174
7
3
001, 189
, 2002, 200
uate, 2003, 231
uate, 2004, 275
ate, 2005, 251
e, 2006, 279
7, 284
8, 260
2009, 304
uate, 2010, 315
Graduate
1
5
5

- 20 -
MSU Full-time Undergraduates by Status 1997-2010
1997 1998 1999 2000 2001 2002 2003 2004 2005 2006 2007 2008 2009 2010First Year 658 547 614 620 663 680 647 617 862 654 542 560 589 597 Male 272 236 249 263 261 287 271 251 339 283 238 210 248 223
Female 386 311 365 357 402 393 376 366 523 371 304 350 341 374
Sophomore 612 592 523 535 563 639 598 600 545 521 534 557 543 617 Male 234 233 217 211 256 243 215 249 223 195 202 235 212 250
Female 378 359 306 324 307 396 383 351 322 326 332 322 331 367
Junior 541 501 490 407 471 513 513 476 415 529 425 408 448 463 Male 221 200 180 149 159 188 193 161 154 206 144 138 173 173
Female 320 301 310 258 312 325 320 315 261 323 281 270 275 290
Senior 783 753 747 697 705 662 721 730 651 734 726 713 720 769 Male 295 269 303 253 245 217 255 255 211 244 239 254 252 261
Female 488 484 444 444 460 445 466 475 440 490 487 459 468 508
UG Special 48 45 38 39 31 44 34 43 0 0 0 0 0 0
Male 19 15 13 14 11 11 10 13 Status not included in PeopleSoft.
Female 29 30 25 25 20 33 24 30
Source: NDUHSRA- Headcounts and FTE Enrollments Pg. 5 Institution Totals- Registrar’s Office 4th Week Official Enrollment Reports. Undergraduate Special (UG Special) refers to an individual who has previously earned a bachelor’s degree and is taking additional undergraduate coursework. PeopleSoft includes these students in Senior Status.
Note: Undergrad special category was added to the senior category for this graphic for 1997 to 2004.
Total Full-Time Students
First Year Sophomore Junior Senior

- 21 -
MSU Part-Time Undergraduates by Status 1997-2010
1997 1998 1999 2000 2001 2002 2003 2004 2005 2006 2007 2008 2009 2010
First Year 124 123 152 150 263 316 474 441 600 442 367 424 506 555
Male 36 44 49 60 122 119 226 198 232 195 150 205 221 280
Female 88 79 103 90 141 197 248 243 368 247 217 219 285 275
Sophomores 89 116 103 117 181 142 173 194 132 130 122 115 116 103
Male 36 42 34 31 73 55 65 68 44 32 37 41 33 34
Female 53 74 69 86 108 87 108 126 88 98 85 74 83 69
Juniors 85 107 91 101 121 134 131 147 112 135 126 119 131 112
Male 26 34 22 26 37 36 46 47 39 46 37 37 43 43
Female 59 73 69 75 84 98 85 100 73 89 89 82 88 69
Senior 150 153 189 200 216 242 245 267 230 286 298 276 292 335
Male 44 68 63 66 73 78 73 95 86 100 106 112 94 104
Female 106 85 126 134 143 164 172 172 144 186 192 164 198 231
Undergrad. Special 30 42 35 41 49 53 58 61
See note. Male 9 14 9 14 18 19 17 17
Female 21 28 26 27 31 34 41 44
Source: NDUHSRA- Headcounts and FTE Enrollments Pg. 5 Institution Totals- Registrar’s Office 4th Week Official Enrollment Reports. Note: Undergraduate Special (UG Special) refers to an individual who has previously earned a bachelor’s degree and is taking additional undergraduate coursework. *Note: PeopleSoft software initiated in 2005. Undergraduate Special category no longer exists. These individuals are now included as seniors. To compare data for the seniors in 2005, the 2004 number used is the Senior + UG Special. Note: Undergraduate Special numbers were added to senior status for this chart.
Total Part Time StudentsFirst Year Sophomores Juniors Senior
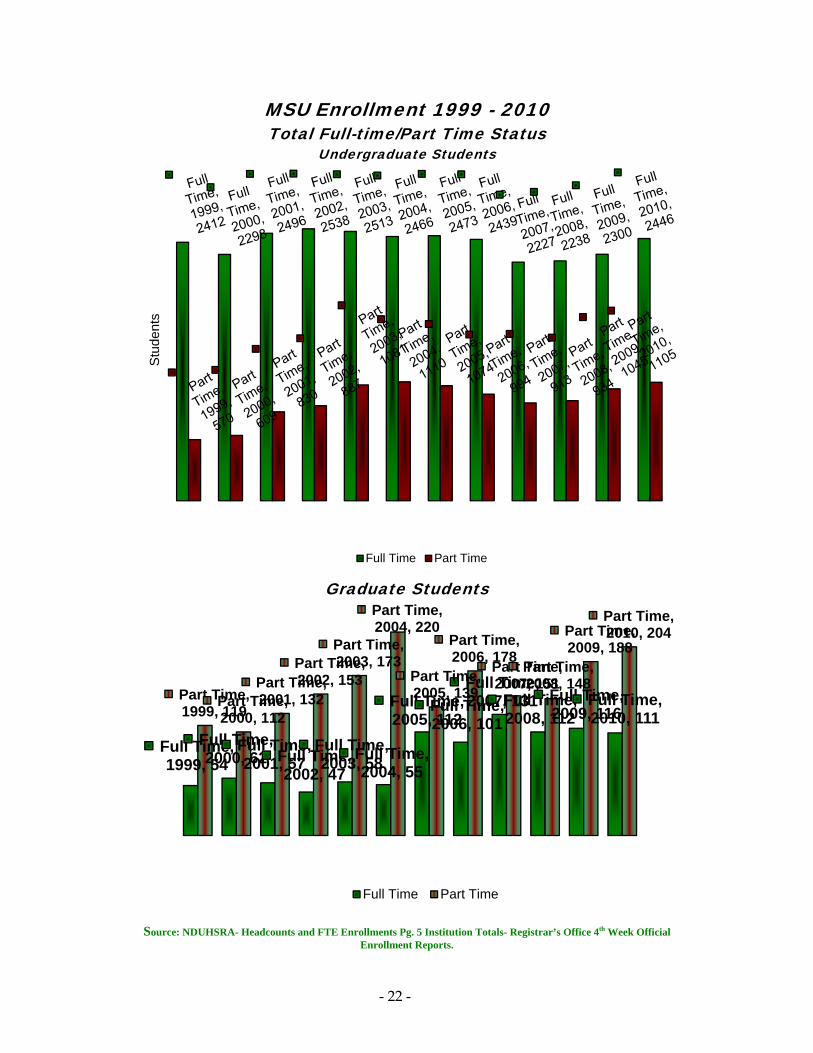
- 22 -
MSU Enrollment 1999 - 2010 Total Full-time/Part Time Status
Undergraduate Students
Graduate Students
Source: NDUHSRA- Headcounts and FTE Enrollments Pg. 5 Institution Totals- Registrar’s Office 4th Week Official
Enrollment Reports.
Stu
dent
s
Full Time Part Time
Full Time, 1999, 54
Full Time, 2000, 62
Full Time, 2001, 57Full Time,
2002, 47
Full Time, 2003, 58
Full Time, 2004, 55
Full Time, 2005, 112
Full Time, 2006, 101
Full Time, 2007, 131Full Time,
2008, 112
Full Time, 2009, 116
Full Time, 2010, 111
Part Time, 1999, 119
Part Time, 2000, 112
Part Time, 2001, 132
Part Time, 2002, 153
Part Time, 2003, 173
Part Time, 2004, 220
Part Time, 2005, 139
Part Time, 2006, 178
Part Time, 2007, 151
Part Time, 2008, 148
Part Time, 2009, 188
Part Time, 2010, 204
Full Time Part Time
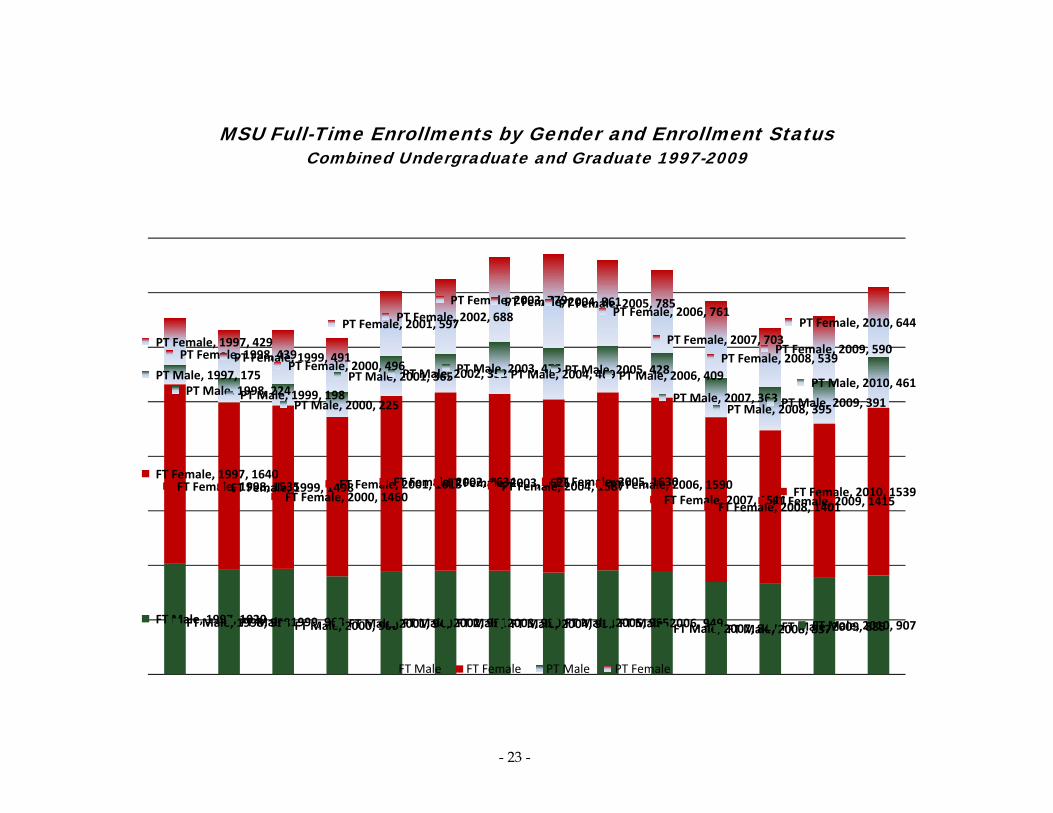
- 23 -
MSU Full-Time Enrollments by Gender and Enrollment Status Combined Undergraduate and Graduate 1997-2009
FT Male, 1997, 1020FT Male, 1998, 958FT Male, 1999, 968FT Male, 2000, 900FT Male, 2001, 940FT Male, 2002, 951FT Male, 2003, 950FT Male, 2004, 934FT Male, 2005, 955FT Male, 2006, 949FT Male, 2007, 847FT Male, 2008, 837FT Male, 2009, 885FT Male, 2010, 907
FT Female, 1997, 1640FT Female, 1998, 1535FT Female, 1999, 1498
FT Female, 2000, 1460FT Female, 2001, 1613FT Female, 2002, 1634FT Female, 2003, 1621FT Female, 2004, 1587FT Female, 2005, 1630FT Female, 2006, 1590
FT Female, 2007, 1511FT Female, 2008, 1401FT Female, 2009, 1415FT Female, 2010, 1539
PT Male, 1997, 175PT Male, 1998, 224PT Male, 1999, 198
PT Male, 2000, 225
PT Male, 2001, 365PT Male, 2002, 352PT Male, 2003, 475PT Male, 2004, 469PT Male, 2005, 428PT Male, 2006, 409
PT Male, 2007, 363PT Male, 2008, 395PT Male, 2009, 391
PT Male, 2010, 461
PT Female, 1997, 429PT Female, 1998, 439PT Female, 1999, 491
PT Female, 2000, 496
PT Female, 2001, 597PT Female, 2002, 688PT Female, 2003, 779PT Female, 2004, 861PT Female, 2005, 785
PT Female, 2006, 761
PT Female, 2007, 703PT Female, 2008, 539
PT Female, 2009, 590
PT Female, 2010, 644
FT Male FT Female PT Male PT Female

- 24 -
Enrollment by Gender 2009-10
Full-time - Enrolled in 12-24 Semester Hours Part-time - Enrolled in 1-11 Semester Hours
Series1, Male, 907,
37%
Series1, Female,
1539, 63%
Full-Time Undergraduate Enrollment
Series1, Male, 461,
42%
Series1, Female, 644, 58%
Part- Time Undergraduate Enrollment
Series1, Male, 461,
42%
Series1, Female, 644, 58%
Full-Time Graduate Enrollment
Series1, Male, 41,
20%
Female80%
Part- Time Graduate Enrollment
- 25 -
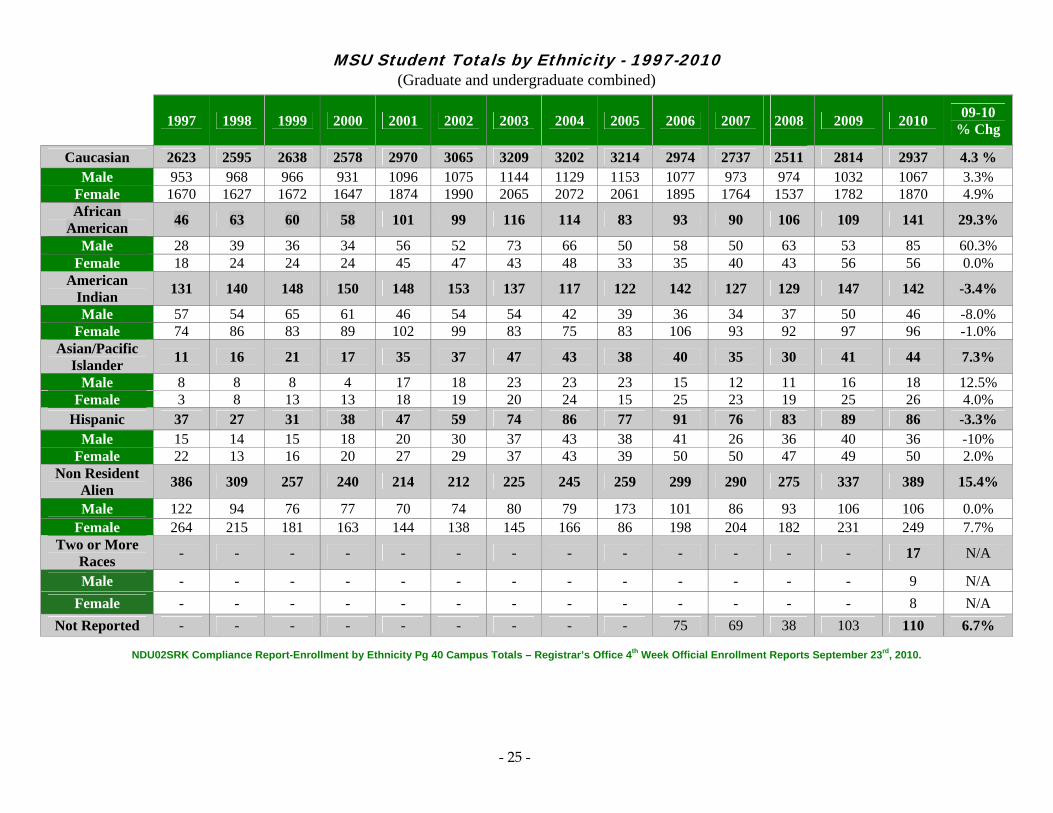
MSU Student Totals by Ethnicity - 1997-2010 (Graduate and undergraduate combined)
NDU02SRK Compliance Report-Enrollment by Ethnicity Pg 40 Campus Totals – Registrar’s Office 4th Week Official Enrollment Reports September 23rd, 2010.
1997 1998 1999 2000 2001 2002 2003 2004 2005 2006 2007
2008
2009 2010 09-10
% Chg
Caucasian 2623 2595 2638 2578 2970 3065 3209 3202 3214 2974 2737 2511 2814 2937 4.3 % Male 953 968 966 931 1096 1075 1144 1129 1153 1077 973 974 1032 1067 3.3%
Female 1670 1627 1672 1647 1874 1990 2065 2072 2061 1895 1764 1537 1782 1870 4.9% African
American 46 63 60 58 101 99 116 114 83 93 90 106 109 141 29.3%
Male 28 39 36 34 56 52 73 66 50 58 50 63 53 85 60.3% Female 18 24 24 24 45 47 43 48 33 35 40 43 56 56 0.0%
American Indian
131 140 148 150 148 153 137 117 122 142 127 129 147 142 -3.4%
Male 57 54 65 61 46 54 54 42 39 36 34 37 50 46 -8.0% Female 74 86 83 89 102 99 83 75 83 106 93 92 97 96 -1.0%
Asian/Pacific Islander
11 16 21 17 35 37 47 43 38 40 35 30 41 44 7.3%
Male 8 8 8 4 17 18 23 23 23 15 12 11 16 18 12.5% Female 3 8 13 13 18 19 20 24 15 25 23 19 25 26 4.0%
Hispanic 37 27 31 38 47 59 74 86 77 91 76 83 89 86 -3.3% Male 15 14 15 18 20 30 37 43 38 41 26 36 40 36 -10%
Female 22 13 16 20 27 29 37 43 39 50 50 47 49 50 2.0% Non Resident
Alien 386 309 257 240 214 212 225 245 259 299 290 275 337 389 15.4%
Male 122 94 76 77 70 74 80 79 173 101 86 93 106 106 0.0% Female 264 215 181 163 144 138 145 166 86 198 204 182 231 249 7.7%
Two or More Races
- - - - - - - - - - - - - 17 N/A
Male - - - - - - - - - - - - - 9 N/A
Female - - - - - - - - - - - - - 8 N/A
Not Reported - - - - - - - - - 75 69 38 103 110 6.7%

- 26 -
MSU Students by Residency 1997-2010
1997 1998 1999 2000 2001 2002 2003 2004 2005 2006 2007 2008 2009 2010 % chg Total North
Dakota 2369 2319 2383 2334 2544 2630 2661 2650 3165 2972* 2777 2779 2913 2970 1.9%
Male 861 866 888 832 878 895 895 866 1126 1053 967 1020 1057 1089 3.0%
Female 1508 1453 1495 1502 1666 1735 1766 1784 2039 1917 1810 1759 1856 1881 1.3% Total ND Military
269 267 236 227 438 446 609 592
Male 106 107 72 77 206 181 288 277
Female 163 160 164 150 232 265 321 315 Total Non-Resident
656 570 536 520 533 549 555 609 633 740 647 653 736 896 21.7%
Male 258 209 206 216 221 227 243 260 257 305 243 266 283 346 22.2%
Female 398 361 330 304 312 322 312 349 376 435 404 387 453 550 21.4%
Canadian Residents
298 299 237 210 177 178 190 219 225 255 234 280 293 309 5.4%
British Columbia
2 3 4 2 3 5 7 8 7 14 5 4 5 12 140%
Alberta 16 20 14 9 10 9 14 15 3 12 12 23 27 33 22.2%
Saskatchewan 207 207 162 148 122 114 117 151 173 176 163 166 183 189 3.2%
Manitoba 73 67 55 50 42 48 48 41 37 44 43 58 61 67 9.8%
Ontario 0 2 1 1 0 2 3 3 4 7 8 8 6 7 16.5% New
Brunswick 0 0 1 0 0 0 1 1 1 0 0 0 0 0 0.0%
Quebec 0 0 0 0 0 0 0 0 0 2 3 2 3 2 -33.3% Source: NDU02SRD Student Data Statistics- Enrollment Residency- 4th Week Official Enrollment Reports provided by Registrar’s Office – September 23rd 2010. Note: PeopleSoft does not separate ND mMilitary from ND residents. Total nonresident includes all enrollments minus ND and military. * Includes two students who did not identify gender. The “Total Non-Resident” category contains all students that are not residents of ND, including: out-of-state and international (including Canadian). http://www.csgnetwork.com/percentchangecalc.html

- 27 -
MSU New Students, Transfers, and
Older than Average Students (OTAS) 1997-2010
1997 1998 1999 2000 2001 2002 2003 2004 2005 2006 2007 2008 2009 2010 %
Change
Total New Freshman
470 418 525 511 506 552 543 549 471 483 445 437 438 483 10.2%
Male 178 164 210 219 203 231 211 215 206 205 197 158 189 171 -9.5%
Female 292 254 315 292 303 321 332 334 265 278 248 279 249 312 25.3% NDU02SRK- Enrollment 1st Time Graduate-4th Week Official Enrollment Reports
Total Transfers
369 347 336 328 419 429 449 456 382 279 278 270 328 341 3.9%
Male 176 144 145 138 170 172 203 188 138 100 85 91 114 129 13.1%
Female 193 203 191 190 249 257 246 268 244 179 193 179 214 212 -0.9% Source: Report NDU02SRD- Student Data Statistics- Enrollment-
Total OTAS 898 863 818 776 1026 1058 1126 1152 1142 1089 1106 1138 1034 1029 -0.4%
Male 318 326 294 271 361 358 400 418 412 406 396 412 401 391 -2.4%
Female 580 537 524 505 665 700 726 734 730 683 710 726 633 638 .78% NDUH2SRN Enrollment Summary by Age & NDU02SRK
New Grad Students 79 88 65 91 91 0.0%
Male
16 20 18 21 23 9.5%
Female 63 68 47 70 68 -2.8%
NDU02SRD- Student Data Statistics- Enrollment Source: Report NDU02SRD- Student Data Statistics- Enrollment- and NDUH2SRN Enrollment Summary by Age and NDU02SRK- Enrollment 1st Time Graduate-4th Week Official Enrollment Reports provided by the Registrar’s Office- September 23rd,2009. Older Than Average Student (OTAS): undergraduate 25 years and older. **Note: Data in Fact Books 2001-2004 previously included only the data for full-time OTA undergraduate students. The numbers in this chart now include both full and part-time students for all years presented. Breakdowns of full and part-time students are presented graphically, by year, on the next page.
(OTA =student 25 or greater)
Sour
NDUHN
EnrollmSummby Age
WeeOffic
EnrollmRepo
Providethe
RegistrOffic
MS
age
)
rce: H2SR
ment
mary e- 4th ek cial ment ort ed by e rar’s ce.
SU OlderE
M
Ma
Ma
Ma
Ma
M
M
Ma
Ma
Mal
Ma
Mal
Male , 199
Male , 200
Male
Male
Ma
M
Ma
M
Ma
M
M
M
-
r Than AEnrollmen
Male, 1999, 21
le, 2000, 178
ale, 2001, 189
ale, 2002, 19
ale, 2003, 20
ale, 2004, 20
Male, 2005, 20
ale, 2006, 19
ale, 2007, 19
e, 2008, 169
ale, 2009, 188
e, 2010, 169
Full-Tim
99, 82
00, 93
e , 2001, 172
e , 2002, 164
ale , 2003, 199
ale , 2004, 212
ale , 2005, 205
Male , 2006, 215
ale , 2007, 205
Male , 2008, 243
ale , 2009, 212
Male , 2010, 222
Female21
Fema2
Part-T
- 28 -
Averageent: 1999
12
8
9
4
01
06
07
1
1
8
Fem
Fem
Fe
Feme Undergra
Male
Fema
e , 1999, 12
le , 2000, 217
Fema3
Fem
Time Unde
Male
Female
e Studen– 2010
Female, 19312
male, 2000, 288
Female, 2364
Female, 2355
Female, 2344
Female, 2347
Female, 2335
Female, 200320
Female, 200327
male, 2008, 307
emale, 2009293
male, 2010, 295
aduate OT
ale
le , 2001, 301
ale , 2002, 345
Female , 20382
Female , 2387
Female , 2395
Female , 2363
Female , 2383
Fema
Female , 200340
Female , 20343
ergraduate
nt (OTAS)
999,
001,
2002,
2003,
2004,
2005,
06,
07,
,
TAS
003,
2004,
2005,
006,
007,
ale , 2008, 419
09,
010,
OTAS
)

- 29 -
Enrolled Undergraduate and Graduate Students By North Dakota County: Fall 2010
N=3,551 UG and N= 315 G Data Source: 4th Week Official Enrollment Report : NDUH2SRG
_________
gggg
2 UG
7 UG
1 UG
64 UG3 G
2 UG 1 G
16 UG1 G
137 UG16 G 30 UG
15 G
5 UG
4 UG
7 UG
5 UG2 G
2 UG
4 UG1 G
1 UG
23 UG6 G
1 UG 1 G
3 UG
7 UG
4 UG 1G
76 UG3 G
1 UG 1G
14 UG3 G 30 UG
4 G
29 UG5 G
45 UG10 G
67 UG5 G
1 UG
3 UG
1 UG 1 G
23 UG2 G
12 UG2 G
2 UG
43 UG 2 G
1 UG
43 UG1 G
5 UG
7 UG
17 UG5 G
1 UG
6 UG3 G
7 UG
2 UG3 G
4 UG 2G
2022 UG88 G
23 UG 1 G
73 UG 11 G
1 G
1 UG
1 UG
1 UG

- 30 -
North Dakota Graduate and Undergraduate Students by North Dakota County: 1997-2009
1997 1998 1999 2000 2001 2002 2003 2004 2005 2006 2007 2008 2009 2010
Adams 4 4 4 2 4 9 6 2 4 2 2 1 0 1
Barnes 0 0 0 0 0 0 0 0 0 0 0 1 3 2
Benson 6 9 13 11 12 11 16 13 16 18 17 16 6 7
Billings 0 0 0 0 0 0 0 0 0 0 0 1 1 1
Bottineau 96 112 102 95 95 87 94 87 88 71 76 61 62 67
Bowman 0 0 0 0 0 0 0 0 0 0 0 5 5 3
Burke 23 28 23 19 24 20 27 31 32 28 24 15 21 17
Burleigh 52 74 140 126 132 139 162 177 182 181 167 149 146 153
Cass 7 5 6 5 7 30 11 21 41 38 29 28 40 45
Cavalier 6 11 14 18 16 15 13 17 13 11 9 7 4 5
Dickey 0 0 0 0 0 0 0 0 0 0 0 1 3 4
Divide 15 18 15 18 8 14 10 14 15 8 12 10 6 7
Dunn 2 4 2 6 7 8 10 9 12 9 12 4 9 7
Eddy 0 0 0 0 0 0 0 0 0 0 0 2 2 2
Emmons 0 0 0 0 0 0 0 0 0 0 0 5 8 5
Foster 0 0 0 0 0 0 0 0 0 0 0 0 1 1 Golden Valley
0 0 0 0 0 0 0 0 0 0 0 1 1 0
Grand Forks 7 12 15 17 11 10 15 20 23 21 23 16 28 29
Grant 0 0 0 0 0 0 0 0 0 0 0 2 1 2
Griggs 0 0 0 0 0 0 0 0 0 0 0 0 0 1
Hettinger 1 2 4 5 2 5 7 7 10 9 6 5 4 3
Kidder 0 0 0 0 0 0 0 0 0 0 0 4 4 7
La Moure 0 0 0 0 0 0 0 0 0 0 0 5 1 5
Logan 0 0 0 0 0 0 0 0 0 0 0 0 1 0
McHenry 75 109 100 105 122 110 112 124 105 102 91 84 90 79
McIntosh 0 0 0 0 0 0 0 0 0 0 0 6 3 2
McKenzie 20 23 13 21 20 21 23 26 17 18 19 14 12 17
McLean 55 70 81 77 86 78 75 75 70 53 51 51 47 34
Mercer 29 30 30 39 36 37 36 49 44 46 34 32 34 34
Morton 13 24 50 42 32 34 46 48 54 53 47 45 52 55
Mountrail 55 58 56 48 64 61 64 67 76 71 81 75 79 72
Nelson 0 0 0 0 0 0 0 0 0 0 0 1 2 1
Oliver 0 0 0 0 0 0 0 0 0 0 0 3 4 3
Pembina 3 4 8 8 4 5 4 4 5 4 3 1 2 2
Pierce 41 39 42 44 33 30 32 32 26 36 30 30 34 25
Ramsey 10 20 18 17 21 29 23 28 33 30 26 21 21 14
Ransom 0 0 0 0 0 0 0 0 0 0 0 2 2 2
Renville 38 50 57 52 74 80 74 68 67 47 42 39 41 45
Richland 2 1 0 2 2 4 8 4 11 5 6 2 2 1

- 31 -
Rolette 69 99 101 112 118 81 78 77 75 81 69 50 59 52
St Louis 0 0 0 0 0 0 0 0 0 0 0 0 1 0
Sargent 0 0 0 0 0 0 0 0 0 0 0 0 0 2
Sheridan 5 5 6 8 9 6 6 7 5 4 2 1 3 5
Sioux 0 0 0 0 0 0 0 0 0 0 0 0 5 7
Slope 0 0 0 0 0 0 0 0 0 0 0 0 0 1
Stark 18 10 20 19 16 22 16 27 26 39 33 32 23 22
Steele 0 0 0 0 0 0 0 0 0 0 0 1 1 1
Stutsman 11 7 5 7 5 8 10 12 10 10 9 10 11 9
Towner 7 9 10 5 7 6 9 10 11 8 9 8 4 7
Traill 0 0 0 0 0 0 0 0 0 0 0 4 3 5
Walsh 2 3 6 5 9 6 6 5 7 7 7 8 7 6
Ward 1959 1515 1445 1404 1752 1887 2009 1893 1865 1725 1709 1871 1979 2110
Wells 20 22 21 19 21 19 20 21 15 15 21 17 18 24
Williams 78 96 81 77 98 95 88 103 104 94 79 77 77 84
Total ND 2825 2980 3104 Data Source: NDUH2SRG- North Dakota Official Enrollment Reports provided by Registrar’s Office.
Counties not included above (average by 1997/2005/2006/2007): Barnes (3/7/8/1), Billings (0.25/0/1/0), Bowman (4/4/10/8), Dickey (1,75/1/1), Eddy (1.125/1/1), Emmons (3.875/10/10), Foster (3.375/3/3), Golden Valley (1.875/2), Grant (2.25/2/3), Griggs (1.625/5/4), Kidder (2/0/5), LaMoure (2.75/04), Logan (0.875/0/2), McIntosh (2/3/1), Nelson (2.375/0/2), Oliver (2.75/4/2), Ransom (0.75/2/4), Sargent (1.5/3/5), Sioux (1.5/7/2), Slope (0.625/2/2), Steele (0.5/4/2), Traill (1.5/5/7).
- 32 -
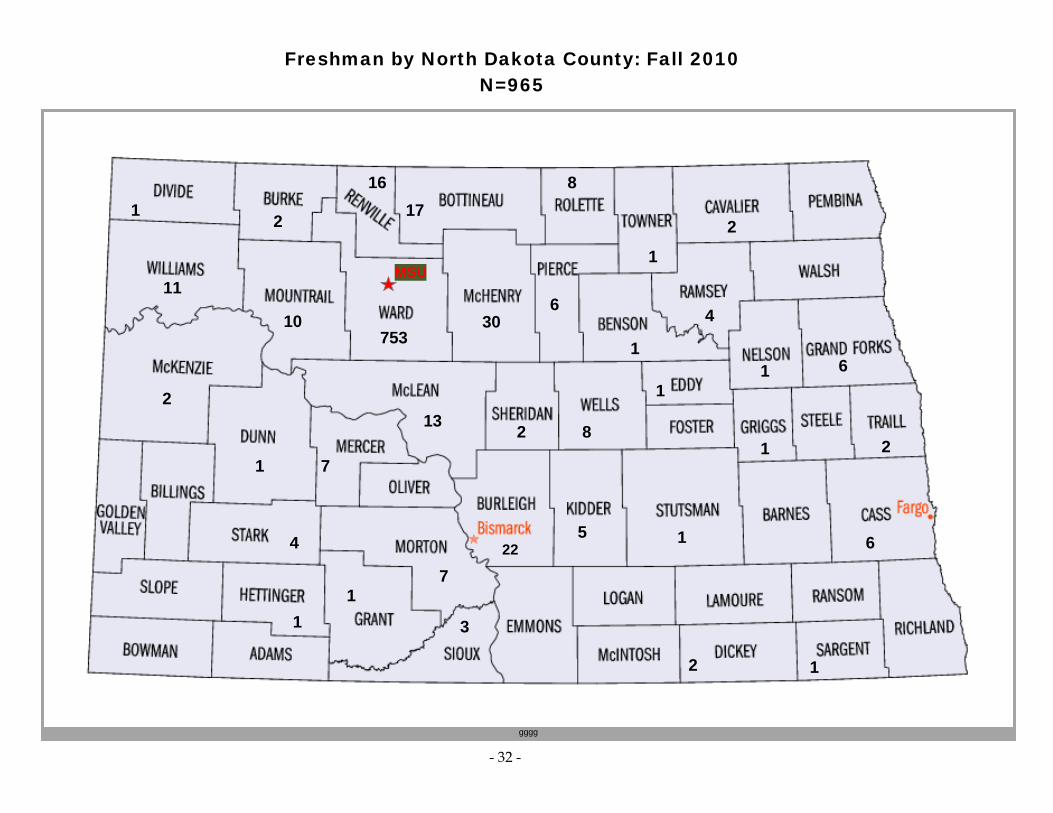
Freshman by North Dakota County: Fall 2010 N=965
_________
gggg
172
6
2
1
6
5
30
213
7
7
10
1
64
16 8
2
3
4 1
753
8
11MSU
22
1
2 1
1
1
1
1
1
1
2
- 33 -
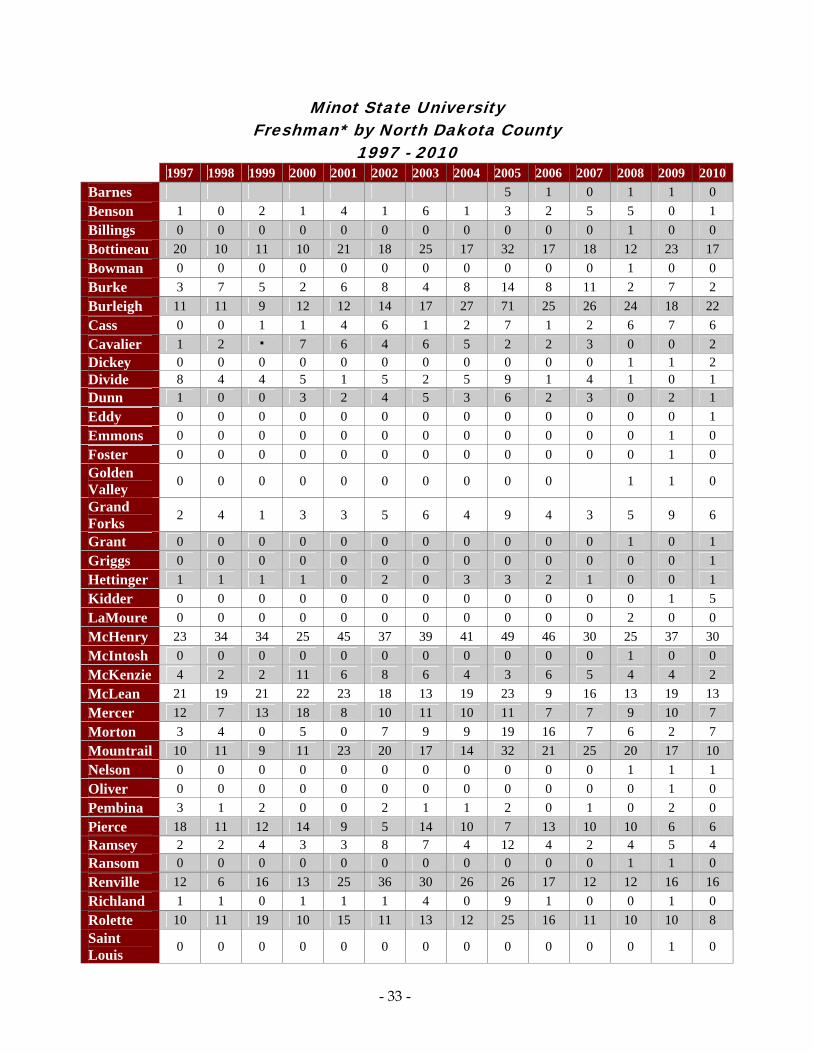
Minot State University Freshman* by North Dakota County
1997 - 2010 1997 1998 1999 2000 2001 2002 2003 2004 2005 2006 2007 2008 2009 2010
Barnes 5 1 0 1 1 0
Benson 1 0 2 1 4 1 6 1 3 2 5 5 0 1
Billings 0 0 0 0 0 0 0 0 0 0 0 1 0 0
Bottineau 20 10 11 10 21 18 25 17 32 17 18 12 23 17
Bowman 0 0 0 0 0 0 0 0 0 0 0 1 0 0
Burke 3 7 5 2 6 8 4 8 14 8 11 2 7 2
Burleigh 11 11 9 12 12 14 17 27 71 25 26 24 18 22
Cass 0 0 1 1 4 6 1 2 7 1 2 6 7 6
Cavalier 1 2 7 6 4 6 5 2 2 3 0 0 2
Dickey 0 0 0 0 0 0 0 0 0 0 0 1 1 2 Divide 8 4 4 5 1 5 2 5 9 1 4 1 0 1
Dunn 1 0 0 3 2 4 5 3 6 2 3 0 2 1
Eddy 0 0 0 0 0 0 0 0 0 0 0 0 0 1
Emmons 0 0 0 0 0 0 0 0 0 0 0 0 1 0
Foster 0 0 0 0 0 0 0 0 0 0 0 0 1 0
Golden Valley
0 0 0 0 0 0 0 0 0 0 1 1 0
Grand Forks
2 4 1 3 3 5 6 4 9 4 3 5 9 6
Grant 0 0 0 0 0 0 0 0 0 0 0 1 0 1
Griggs 0 0 0 0 0 0 0 0 0 0 0 0 0 1
Hettinger 1 1 1 1 0 2 0 3 3 2 1 0 0 1
Kidder 0 0 0 0 0 0 0 0 0 0 0 0 1 5
LaMoure 0 0 0 0 0 0 0 0 0 0 0 2 0 0
McHenry 23 34 34 25 45 37 39 41 49 46 30 25 37 30
McIntosh 0 0 0 0 0 0 0 0 0 0 0 1 0 0
McKenzie 4 2 2 11 6 8 6 4 3 6 5 4 4 2
McLean 21 19 21 22 23 18 13 19 23 9 16 13 19 13
Mercer 12 7 13 18 8 10 11 10 11 7 7 9 10 7
Morton 3 4 0 5 0 7 9 9 19 16 7 6 2 7
Mountrail 10 11 9 11 23 20 17 14 32 21 25 20 17 10
Nelson 0 0 0 0 0 0 0 0 0 0 0 1 1 1
Oliver 0 0 0 0 0 0 0 0 0 0 0 0 1 0
Pembina 3 1 2 0 0 2 1 1 2 0 1 0 2 0
Pierce 18 11 12 14 9 5 14 10 7 13 10 10 6 6
Ramsey 2 2 4 3 3 8 7 4 12 4 2 4 5 4
Ransom 0 0 0 0 0 0 0 0 0 0 0 1 1 0
Renville 12 6 16 13 25 36 30 26 26 17 12 12 16 16
Richland 1 1 0 1 1 1 4 0 9 1 0 0 1 0
Rolette 10 11 19 10 15 11 13 12 25 16 11 10 10 8
Saint Louis
0 0 0 0 0 0 0 0 0 0 0 0 1 0

- 34 -
Sargent 0 0 0 0 0 0 0 0 0 0 0 0 0 1
Sheridan 2 1 2 1 1 0 1 4 2 1 0 0 2 2
Sioux 0 0 0 0 0 0 0 0 0 0 0 0 1 3
Stark 9 0 2 4 4 6 6 7 14 13 7 9 7 4
Stutsman 5 0 0 2 0 5 2 2 4 2 3 1 4 1
Towner 3 2 3 1 4 1 2 0 6 1 2 3 0 1
Traill 0 0 0 0 0 0 0 0 0 0 0 2 0 2
Walsh 0 0 3 0 4 3 2 3 2 1 0 0 2 0
Ward 451 394 446 424 506 566 653 582 746 596 540 620 674 753
Wells 7 7 11 4 6 4 5 7 3 4 11 4 8 8
Williams 14 16 18 13 23 18 21 28 49 19 16 15 21 11 Total ND 834 928 965
Data Source: NDUH2SRG- North Dakota Official Enrollment Reports provided by Registrar’s Office.
Other country totals for 8 years / total for 2007: Adams (7/2), Billings (3/0), Bowman (14/3), Dickey (2/0), Eddy (3/0), Emmons (7/2), Foster (7/1), Golden Valley (4/0), Grant (9/1), Griggs (4/1), Kidder (5/0), LaMoure (1/0), Logan (1/0), McIntosh (4/0), Nelson (5/1), Oliver (5/0), Ransom (3/1), Sargent (4/0), Sioux (3/1), Slope (2/0), Steele (2/0), Traill (4/1).
* Freshman students are defined as any first-time students and any other student who has not yet obtained sufficient credits to advance to sophomore standing. Data source for 2007: PeopleSoft Report ID # NDUH2SRG

- 35 -
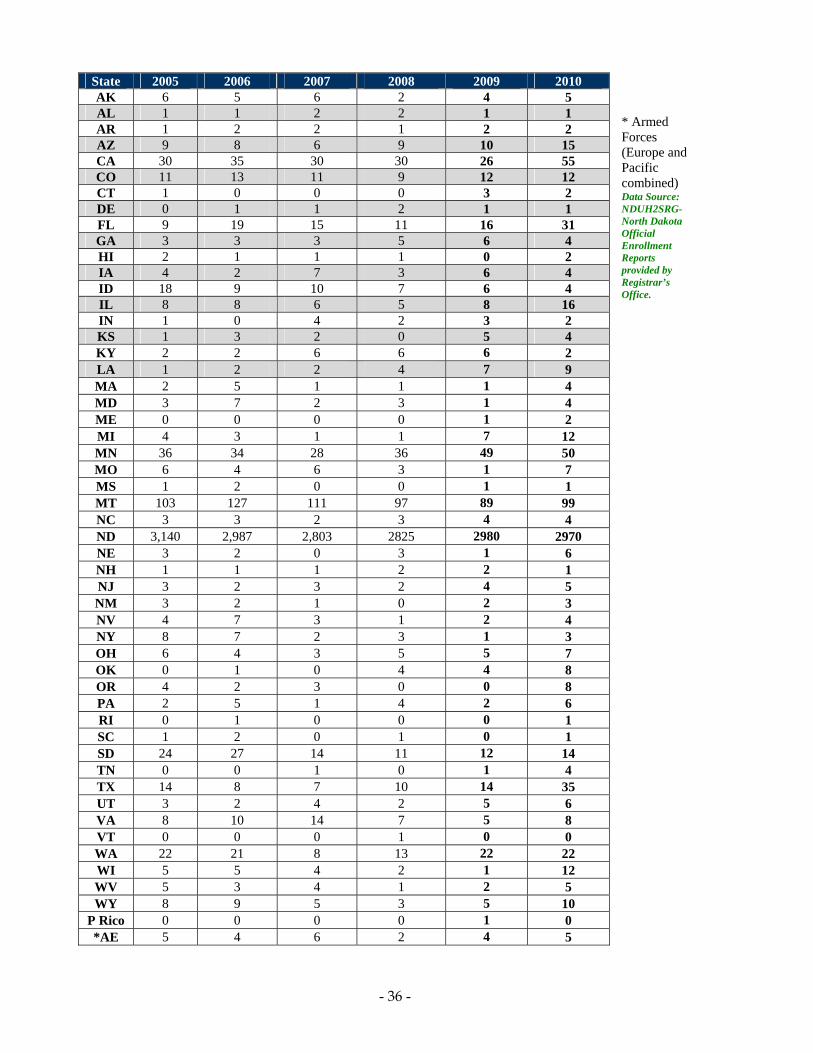
MSU Enrolled Students by State of Origin Fall 2010 (n = 3866)
- 36 -
* Armed Forces (Europe and Pacific combined) Data Source: NDUH2SRG- North Dakota Official Enrollment Reports provided by Registrar’s Office.
State 2005 2006 2007 2008 2009 2010 AK 6 5 6 2 4 5 AL 1 1 2 2 1 1 AR 1 2 2 1 2 2 AZ 9 8 6 9 10 15 CA 30 35 30 30 26 55 CO 11 13 11 9 12 12 CT 1 0 0 0 3 2 DE 0 1 1 2 1 1 FL 9 19 15 11 16 31 GA 3 3 3 5 6 4 HI 2 1 1 1 0 2 IA 4 2 7 3 6 4 ID 18 9 10 7 6 4 IL 8 8 6 5 8 16 IN 1 0 4 2 3 2 KS 1 3 2 0 5 4 KY 2 2 6 6 6 2 LA 1 2 2 4 7 9 MA 2 5 1 1 1 4 MD 3 7 2 3 1 4 ME 0 0 0 0 1 2 MI 4 3 1 1 7 12 MN 36 34 28 36 49 50 MO 6 4 6 3 1 7 MS 1 2 0 0 1 1 MT 103 127 111 97 89 99 NC 3 3 2 3 4 4 ND 3,140 2,987 2,803 2825 2980 2970 NE 3 2 0 3 1 6 NH 1 1 1 2 2 1 NJ 3 2 3 2 4 5 NM 3 2 1 0 2 3 NV 4 7 3 1 2 4 NY 8 7 2 3 1 3 OH 6 4 3 5 5 7 OK 0 1 0 4 4 8 OR 4 2 3 0 0 8 PA 2 5 1 4 2 6 RI 0 1 0 0 0 1 SC 1 2 0 1 0 1 SD 24 27 14 11 12 14 TN 0 0 1 0 1 4 TX 14 8 7 10 14 35 UT 3 2 4 2 5 6 VA 8 10 14 7 5 8 VT 0 0 0 1 0 0 WA 22 21 8 13 22 22 WI 5 5 4 2 1 12 WV 5 3 4 1 2 5 WY 8 9 5 3 5 10
P Rico 0 0 0 0 1 0 *AE 5 4 6 2 4 5
- 37 -
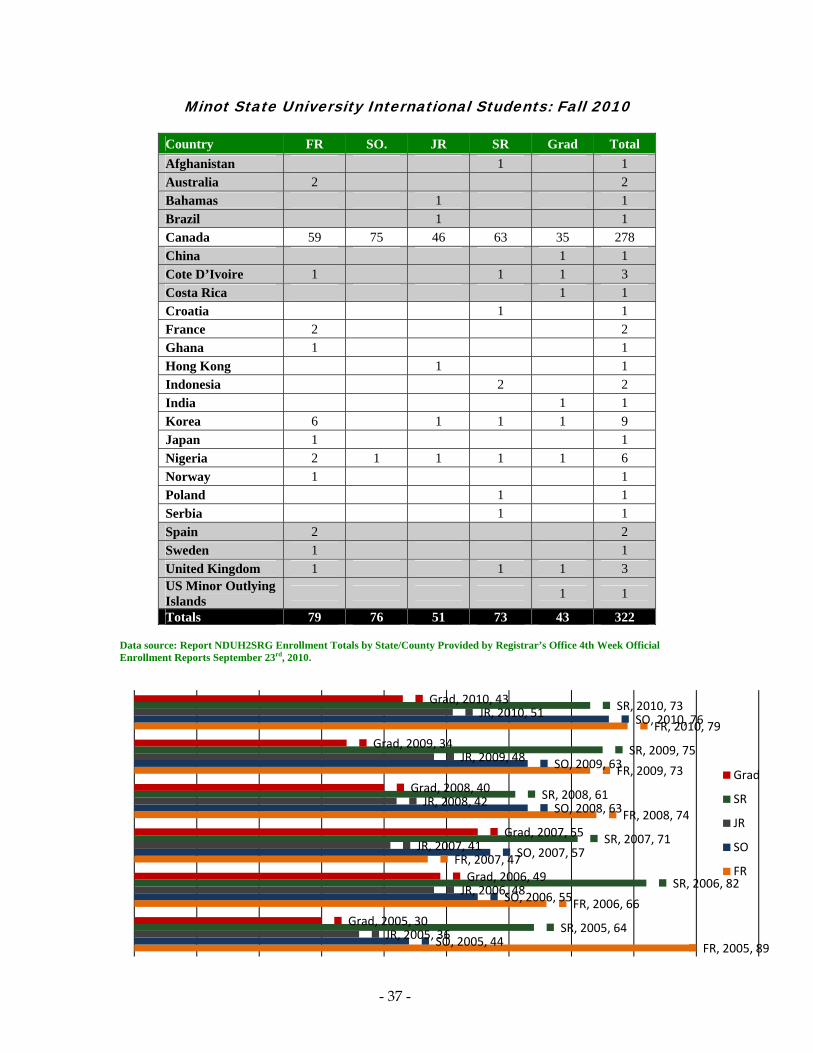
Minot State University International Students: Fall 2010
Country FR SO. JR SR Grad Total
Afghanistan 1 1
Australia 2 2
Bahamas 1 1
Brazil 1 1
Canada 59 75 46 63 35 278
China 1 1
Cote D’Ivoire 1 1 1 3
Costa Rica 1 1
Croatia 1 1 France 2 2
Ghana 1 1
Hong Kong 1 1
Indonesia 2 2
India 1 1
Korea 6 1 1 1 9
Japan 1 1
Nigeria 2 1 1 1 1 6
Norway 1 1
Poland 1 1
Serbia 1 1
Spain 2 2
Sweden 1 1
United Kingdom 1 1 1 3 US Minor Outlying Islands
1 1
Totals 79 76 51 73 43 322 Data source: Report NDUH2SRG Enrollment Totals by State/County Provided by Registrar’s Office 4th Week Official Enrollment Reports September 23rd, 2010.
FR, 2005, 89
FR, 2006, 66
FR, 2007, 47
FR, 2008, 74
FR, 2009, 73
FR, 2010, 79
SO, 2005, 44
SO, 2006, 55
SO, 2007, 57
SO, 2008, 63
SO, 2009, 63
SO, 2010, 76
JR, 2005, 36
JR, 2006, 48
JR, 2007, 41
JR, 2008, 42
JR, 2009, 48
JR, 2010, 51
SR, 2005, 64
SR, 2006, 82
SR, 2007, 71
SR, 2008, 61
SR, 2009, 75
SR, 2010, 73
Grad, 2005, 30
Grad, 2006, 49
Grad, 2007, 55
Grad, 2008, 40
Grad, 2009, 34
Grad, 2010, 43
Grad
SR
JR
SO
FR
M
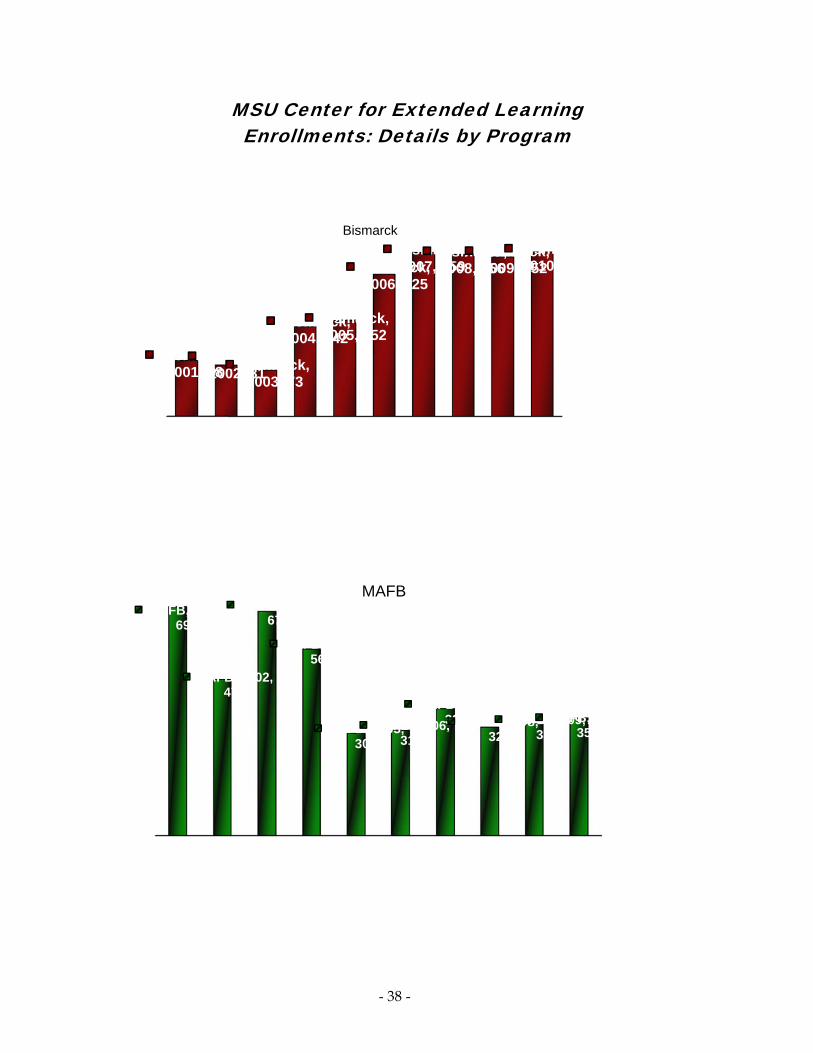
Bismarck,2001, 88
Bism200
MAFB, 2001, 691
MAFB4
MSU CeEnrollm
, marck, 02, 81
Bismarck2003, 73
Bis200
B, 2002, 471
MAFB, 200677
MAF
-
enter forlments: D
k,
marck, 04, 142
Bismarck2005, 152
Bis200
Bisma
03,
FB, 2004, 563
MAFB, 20308
M
MA
- 38 -
r ExtendDetails b
k, 2
smarck, 06, 225
Bismarck2007, 25
Bis200
rck
005, MAFB, 2006, 318
MAFB,38
AFB
ded Lear by Prog
k, 59smarck, 08, 256
Bismarc2009, 25
Bi20
, 2007, 83MAFB, 2008
327MAF
arning
gram
ck, 52ismarck, 010, 260
8, FB, 2009, 337
MAFB, 20355
10,

E
IVN, 2
Ce
O20
MSU CeEnrollme
2001, 56IVN, 2002,
IVN,
Correspondence, 2001,
109
Corresence,
12
Ce
Online, 001, 673
Online2002, 12
20
-
enter forents: Det
472003, 22
IVN, 200132
IVN,
Interacti
spond2002,
21
Correspondence, 2003,
183Corresence,
13
e, 214
Online, 003, 1539
Onlin2004, 1
2
- 39 -
r Extendtails by
04,
, 2005, 87
IVN, 20152
IV
ve Video Netw
d
spond2004,
31
Corresponence, 2005
132CorreenceC
Corresponde
ne, 1910
Online, 2005, 2153
Onli2006,
2
Online
ded Lear Program
006, VN, 2007,
181
IVN, 2008IVN
work
d5,
esponde, 2006, 79Correspondence, 2007
64Correence
1
ence
ine, 2407Online,
2007, 2087
Onli2008,
arning
m (cont.)
8, 60N, 2009, 84IVN, 2010
d,
esponde, 2008, 18
Correspondence, 2009
24
Correence
3
ine, 2195
Online, 2009, 2484
On2010
0, 75
d9,
esponde, 2010, 37
line, , 2392

- 40 -
New First-year Student Applications and Enrollment Patterns 1999-2010
1999 2000 2001 2002 2003 2004 2005 2006* 2007 2008 2009 2010
Applied 750 764 757 743* 713 753 645 690 641 643 724 837
Enrolled 525 511 506 552 543 527 471 448 436 437 438 483
Denied 24 26 25 37 45 39 19 16 24 23 38 55 %
Enrolled 70.0 67.0 67.0 74.0 76.0 70.0 73.0 64.9 68 68% 60.5% 57.7%
Data Source: Registrar’s Office: IPEDS Fall Admissions Part C Characteristics Survey-4th Week Official Enrollment Numbers. The DENY data is gathered from ADM query 0009 Program Action Codes *Data in the 2006 column is changed in the 2007Fact Book. The data received from Admissions for 2006 had included students for fall and spring terms vs. fall semester only. The data now represents fall only data.
Retention of First-year Students 1998-2010
Term Full-time
First Time Freshmen Term Still Enrolled
Retention Percentage
Fall 98 418 Fall 99 264 63% Fall 99 525 Fall 00 301 57% Fall 00 511 Fall 01 315 62% Fall 01 506 Fall 02 321 63% Fall 02 551 Fall 03 321 58%
New Calculation: 1998 – 2002 Calculation for Retention: All new freshmen who return the following year. *2004 Calculation for Retention: New freshmen enrolled Fall 2003 (12 semester hours or more) and returned for any number of credits in Fall 2004.
Fall 03 396 Fall 04 248 *62.7% Fall 04 393 Fall 05 274 70.0% Fall 05 445 Fall 06 279 62.7% Fall 06 483 Fall 07 292 60% Fall 07 419 Fall 08 291 69% Fall 08 406 Fall 09 284 70.0% Fall 09 419 Fall 10 296 71%
Source: People+Soft NDU02SRK – NDU02SRL and IPEDS Spring Report Part E. Previous years indicated duplicated numbers and withdrawal students for 4th week.
New Transfer Application and Enrollment Patterns 1999-2010
New Transfer
1999 2000 2001 2002 2003 2004 2005 2006 2007 2008
2009
2010
Applied 654 639 559 563 551 616 633 527 546 448 550 608
Enrolled 336 328 419 429 449 493 584 443 355 358 329 336 % Enrolled
51.4 51.3 75.0 76.0 81.5 80.0 92.3 84.1 65.0 79.9 59.8 55.3%
Source: Registrar’s Office IPEDS Report Part C- Transfer Student Characteristics- Rebecca Porter (Enrollment Services) New applicants week b –week.

- 41 -
Minot State University Cumulative Average GPA: 1999 – 2010
Undergraduate
98-99 99-00 00-01 01-0 02-03 03-04 04-05 05-06 06-07 07-08 Fall 09 Fall 10
Freshman 2.26 2.23 2.31 2.28 2.31 2.36 2.51 2.62 ** 2.47 2.64 2.42
Sophomore 2.69 2.59 2.64 2.72 2.65 2.73 2.76 2.55 ** 2.83 2.80 2.83
Junior 2.90 2.85 2.83 2.90 2.91 2.87 2.94 2.52 ** 2.99 3.09 2.99
Senior 3.04 3.03 3.04 3.04 3.04 3.08 3.07 2.80 ** 3.13 3.02 3.10
UG Special 3.15 3.20 3.17 3.19 3.28 3.25 3.23 ** ** ** ** **
Average 2.93 2.92 2.93 2.91 2.93 2.96 2.99 2.62 2.95 3.01 2.89 2.83
** Undergraduate Specialist is no longer tracked in the software. These students are now included with students with senior status. Source: CO_FACTBOOK_GPA Based on previous fall end of term GPA’S.
Graduate Student GPA 1998-2010
98-99 99-00 00-01 01-02 01-03 03-04 04-05 05-06 06-07 07-08 Fall 09 Fall 10
3.81 3.76 3.73 3.70 3.72 3.71 3.75 3.15 3.82 3.73 3.63 3.47 Source: CO_FACTBOOK_GPA Based on previous fall end of term GPA’S. Confirmed with the Graduate School
- 42 -
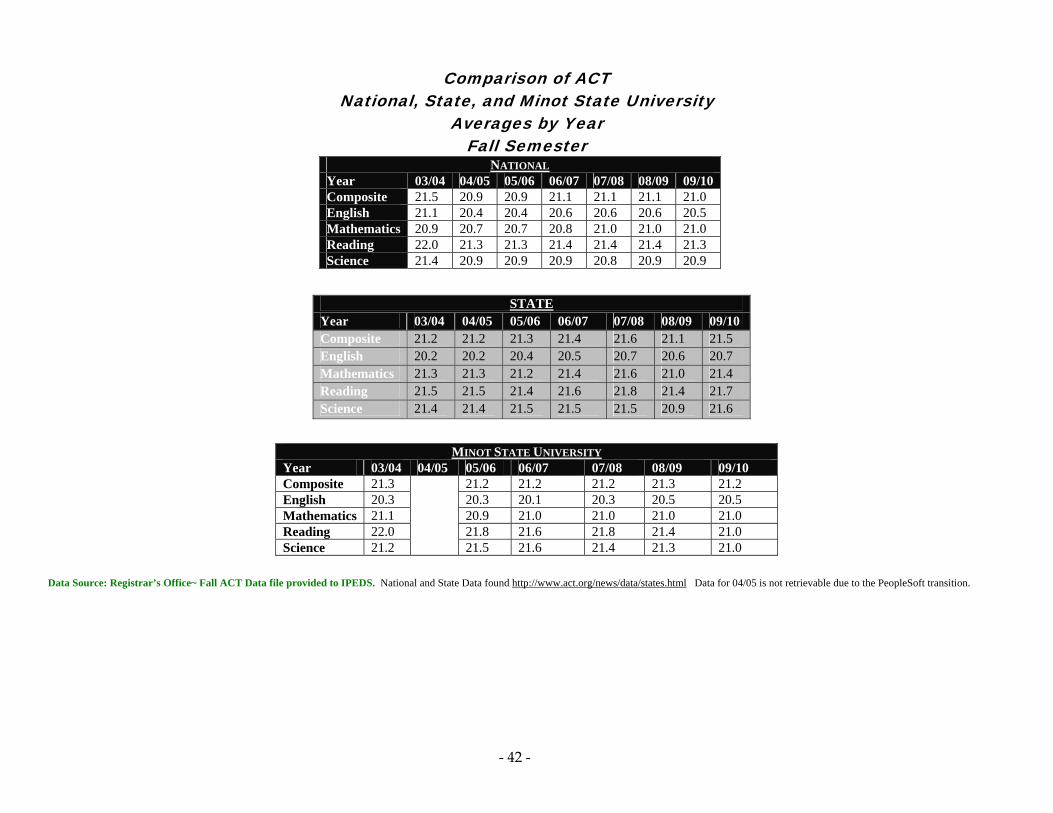
Comparison of ACT
National, State, and Minot State University Averages by Year
Fall Semester NATIONAL
Year 03/04 04/05 05/06 06/07 07/08 08/09 09/10 Composite 21.5 20.9 20.9 21.1 21.1 21.1 21.0 English 21.1 20.4 20.4 20.6 20.6 20.6 20.5 Mathematics 20.9 20.7 20.7 20.8 21.0 21.0 21.0 Reading 22.0 21.3 21.3 21.4 21.4 21.4 21.3 Science 21.4 20.9 20.9 20.9 20.8 20.9 20.9
STATE
Year 03/04 04/05 05/06 06/07 07/08 08/09 09/10 Composite 21.2 21.2 21.3 21.4 21.6 21.1 21.5 English 20.2 20.2 20.4 20.5 20.7 20.6 20.7 Mathematics 21.3 21.3 21.2 21.4 21.6 21.0 21.4 Reading 21.5 21.5 21.4 21.6 21.8 21.4 21.7 Science 21.4 21.4 21.5 21.5 21.5 20.9 21.6
Data Source: Registrar’s Office~ Fall ACT Data file provided to IPEDS. National and State Data found http://www.act.org/news/data/states.html Data for 04/05 is not retrievable due to the PeopleSoft transition.
MINOT STATE UNIVERSITY Year 03/04 04/05 05/06 06/07 07/08 08/09 09/10 Composite 21.3 21.2 21.2 21.2 21.3 21.2 English 20.3 20.3 20.1 20.3 20.5 20.5 Mathematics 21.1 20.9 21.0 21.0 21.0 21.0 Reading 22.0 21.8 21.6 21.8 21.4 21.0 Science 21.2 21.5 21.6 21.4 21.3 21.0

- 43 -
MSU Student Housing Fall 2002 – 2010 By Residence Facility
Residence Cap 2002 2003 2004 2005 2006 2007 2008 2009 %
Change
Women’s Cook Hall 188 157 129 161 138 145 121 120 140
Dakota Hall 96 65 72 72 73 47 28 41 37
Men’s
McCulloch Hall
145 119 117 97 94 103 90 85 108
Co-Ed
C.P. Lura Manor
144 101 99 111 111 74 79 82 116
Apartment
Pioneer Hall 40 39 30 35 33 39 40 34 40
Campus Heights
30 30 30 30 21 28 30 27 30
Suite-Style Living
Crane Hall 88 n/a n/a n/a n/a 51 66 51 61
Total 731 511 477 506 460 487 454 440 532 Data Source: Pat Hrichena and Lisa Eriksmoen~ Residence Life (Housing) Data Retrieved December 2010.
http://www.csgnetwork.com/percentchangecalc.html Percentage Change Calculator Cap. = capacity.
Average Cost for Residence Hall Room per Semester
2002 2003 2004 2005 2006 2007 2008 2009 2010
Single $922.50 $967.50 $1,008.00 $1037.50 $1531.25 $1680.00 $1468.00 1468.00
Double $
615.00 $
645.00 $ 672.50 $700.00 $785.00 $817.50 $817.50 817.50
Data Source: Pat Hrichena and Lisa Eriksmoen~ Residence Life (Housing) Data Retrieved December 2010.
MSU Residence Hall Disciplinary Action Fall 2000 to Fall 2009
Fal
l 00
Sp
01
Fal
l 01
Sp
02
Fal
l 02
Sp
03
Fal
l 03
Sp
04
Fal
l 04
Sp
05
Fal
l 05
Sp
06
Fal
l 06
Sp
07
Fal
l 07
Sp
08
Fal
l 08
Sp
09
Fal
l 09
Fal
l 10
Visitation 34 29 52 28 67 15 45 23 41 39 56 22 46 22 50 18 37 8 49
Alcohol 29 10 45 37 24 24 60 10 39 24 11 20 55 11 45 23 16 18 29
Miscellaneous 21 26 52 41 64 69 79 43 70 58 34 10 66 42 91 26 54 32 57
Data Source: Pat Hrichena and Lisa Eriksmoen~ Residence Life (Housing) Data Retrieved December 2010.

- 44 -
Visitation: Opposite sex guest in building past guest hours.
Miscellaneous: Fights, parties, smoking. Data Source: Director of Facilities (2000-2005), Student Affairs 2006 data.
Minot State University Crime Statistics* Jan-Dec 1999 to Jan–Dec 2009
Jan-
Dec 1999
Jan-Dec 2000
Jan-Dec 2001
Jan-Dec 2002
Jan-Dec 2003
Jan-Dec 2004
Jan –Dec 2005
Jan-Dec 2006
Jan- Dec 2007
Jan- Dec 2008
Jan- Dec 2009
Crimes
Murder None None None None None None None None None None None
Forcible Sex Offenses
None None None None 1 None None None None None None
Robbery None None None None None None None None None None None
Aggravated Assault
None None None None None None None None 3 None None
Burglary 2 None None 1 2 2 6 20 9 3 6
Motor Vehicle Theft
None None 3 3 2 None 2 None None 1 None
Arrests
Liquor Law Violation
29 43 69 73 76 63 36 86 31 33 36
Drug Abuse 4 4 4 None 5 6 2 None 2 5 6
Weapons 1 1 1 1 1 1 2 None None None 5
Source: Campus Safety and Security Bulletin 2009- Facilities Management Data Source: Assistant Vice President for Facilities Management (2000-2005), Student Affairs (2006 data).
*Arrests or reported crimes on campus, on property of university-affiliate organizations or affecting university-sanctioned events. Data is computed on the calendar year not the academic or fiscal year.

- 45 -
Minot State University
Declared Majors Degrees Conferred
Certificates Conferred

- 46 -
College of Arts and Sciences: Declared Major-Spring Term
Majors are combined where indicated (BA/BSE)
Program 1998 1999 2000 2001 2002 2003 2004 2005 2006 2007 2008 2009 2010
Art (BA/BSE) 33 63 58 56 63 69 78 97 68* 66 71 69 56 Arts Administration (BS)
0 0 1 1 1 5 0
Fine Arts 4 2 3 2 5 Biology/Biology Education
66 71 62 58 73 76 75 90 125* 122 112 110 125
Broadcasting (BA) 45 45 53 36 48 50 54 39 70* 51 51 48 51 Chemistry (BA/BSE) 7 12 10 12 14 15 22 27 283* 70 57 59 60 Clinical Laboratory Science
20 22 21 15 11 6 4 9 8* 10 14 10 10
Communication (BA) 0 2 9* 9 6 4 3 Communication Arts (BA/BSE) 29 28 29 23 25 30 34 21 7* 5 8 8 5
Computer Science (BS) 79 100 102 112 124 109 93 113 98* 67 61 62 59 Criminal Justice (BS) 178 160 189 205 237 239 258 262 257 209 189 158 156 Earth Science/Geology 17 18 17 15 6 9 14 17 17 20 21 23 26 Earth Science Education (BSE) 0 0 0 0 9 7 4 2 2 1 2 2 1
Economics (BA) 11 9 11 8 7 8 8 7 6 3 2 0 1
English (BA/BSE) 79 62 64 63 77 64 62 80 62* 74 66 68 72 (28 pre)
Foreign Language (BA/BSE) 1 0 0 0 0 0 0 0 * 2 0 1 3
German (BA/BSE) 3 4 4 4 8 10 7 8 5 8 4 2 4
French (BA/BSE) 1 4 5 2 1 6 7 3 4 3 4 2 0
Spanish (BA/BSE) 10 11 15 9 13 17 15 18 8* 16 11 9 6
General Studies (BGS) 333 322 347 363 547 690 825* 282 138 132 196 173 185
History (BA/BSE) 50 57 48 46 60 58 76 93 65 96 83 78 80 (37 pre)
Mathematics (BA/BSE) 39 50 30 32 47 45 54 81 57* 65 53 50 40 (14 pre)
Multimedia Studies (BS) 0 14 19 8 9 9* 3 6 5 3
Music (BA/BSE) 50 58 66 67 64 61 61 64 42* 52 51 64 57 (22 pre)
Pre-Chiropractic 13 13 8 6 5 6 8 9
Now
enr
olle
d as
bio
logy
, che
mis
try,
hi
stor
y (l
aw),
phy
sics
, etc
.
Pre-Dental Hygiene 4 4 3 3 3 7 4 4
Pre-Dentistry 4 5 3 3 11 10 11 14
Pre-Engineering 17 20 10 15 8 6 4 12
Pre-Law 7 9 9 8 8 7 6 3
Pre-Medical 19 19 16 18 18 14 12 15
Pre-Mortuary 6 4 5 4 2 1 3 0 Pre-Occupational Therapy
5 6 1 3 2 2 1 0
Pre-Optometry 7 1 4 1 3 5 3 2
Pre-Pharmacy 9 7 6 4 13 13 7 6
Pre-Physical Therapy 10 14 12 9 6 6 8 9 Pre-Veterinary Medicine
7 4 6 7 5 7 10 10

- 47 -
Pre-Wildlife Studies 1 1 3 1 1 2 1 0 Physical Science (BA/BSE) 3 3 5 5 8 3 3 2 0* 2 2 0 2
Physics (BA/BSE) 5 6 5 8 10 6 7 13 21* 17 18 21 24 Radiologic Technology (BS) 52 53 45 51 50 74 58 70 65 68 52 50 50
Social Science (BA/BSE) 45 27 22 27 33 32 30 22 13* 25 18 13 16 (9 PRE)
Sociology (BA/BSE) 16 19 18 18 27 30 32 32 31* 27 25 29 29 Theatre Arts (BA) 0 3 15* 17 17 17 20 Total Majors by College
1281 1311 1312 1317 1661 1819 1967 1550 1490 1243 1204 1142 1149
Data Source: NDUH2SRE Major Minor Reports by College Provided by Registrar’s Office *Data inconsistencies due to PeopleSoft conversion Note: During the 2005-2006 academic years, the Legacy Data System was replaced by PeopleSoft. Historical data collection (1998-2006) included graduate students in the totals for communication disorders, criminal justice, elementary education, management, mathematics and music. Starting in spring 2005, the data includes second majors.
College of Education and Health Sciences Declared Major - Spring Terms
Program 1998 1999 2000 2001 2002 2003 2004 2005 2006 2007 2008 2009 2010
Addiction Studies (BS) 2 31 14 13 19 24 32 34 28 36 35 37 37
Communication Disorders (BS) 122 106 105 108 98 112 144 157 200* 180 121 143 140
Communication Disorders Ed. (BSE) New 2001 0 0 0 0 14 6 0 0 0 0
Corporate Fitness (BS) 35 48 42 37 31 31 35 40 44* 58 56 64 73
Developmental Disabilities (AS/BS) 3 6 4 2 5 9 11 8 34* 6 16 12 11
Education of the Deaf (BSE) 36 40 29 43 29 31 22 12 4* 4 3 4 1
Ed. of the Mentally Retarded (BSE) 48 35 22 30 33 46 28 42 55* 55 64 64 67
Elementary Education (BSE) 382 338 307 289 305 315 268 304 323* 260 240 215 243
Nursing (BSN) 190 185 169 174 227 239 246 300 142* 256 247 229 254
Physical Education (BSE) 77 69 49 66 59 67 80 84 29* 89 93 101 93
Psychology (BA/BSE) 144 120 128 129 127 101 99 131 136 118 115 (5 BSE)
113 75 (3 BSE)
Social Work (BSW) 112 118 96 89 93 77 64 62 88 100 97 95 113
Total Majors by College 1151 1096 965 980 1026 1052 1029 1188 1166 1162 1087 1077 1107 Data Source: NDUH2SRE Major Minor Reports by College Provided by Registrar’s Office *Data inconsistencies due to PeopleSoft conversion Note: During the 2005-2006 academic years, the Legacy Data System was replaced by PeopleSoft. Historical data collection (1998-2006) included graduate students in the totals for communication disorders, criminal justice, elementary education, management, mathematics and music. Starting in spring 2005, the data includes 2nd majors.

- 48 -
College of Business: Declared Major - Spring Terms
Program 1998 1999 2000 2001 2002 2003 2004 2005 2006 2007 2008 2009 2010
Accounting (BS) 130 128 121 110 116 125 135 132 256* 111 113 113 120 Applied Bus. Info. Tech. (BAS)
6 17 24* 21 20 18 19
Applied Management (BAS) 2 11 11* 21 22 19 15
Business Ed. (BSE) 33 30 36 46 31 26 30 36 7* 23 21 19 18
Finance (BS) 73 74 64 61 76 96 93 88 163* 81 67 61 53
General Business (BAS) 0 0 0 0 0 10
International Business (BS) 0 6 11 22 23 28 15 13 6 3 3 51 81
Management (BS) 246 239 264 269 273 287 310 333 326* 339 359 313 294
Management Info. Systems (BS) 66 93 106 84 125 125 132 120 78 67 49 55 57
Marketing (BS) 53 51 55 58 54 42 45 75 74* 81 81 74 85 Virtual Business (BS) 0 0 0 0 0 0 0 2 0 2 1 5 3
Total Majors by College 601 621 657 650 698 739 768 827 945 749 736 728 745 Data Source: NDUH2SRE Major Minor Reports by College Provided by Registrar’s Office
*Data inconsistencies due to PeopleSoft conversion Note: During the 2005-2006 academic years, the Legacy Data System was replaced by PeopleSoft. Historical data collection (1998-2006) included graduate students in the totals for communication disorders, criminal justice, elementary education, management, mathematics and music. Starting in spring 2005, the data includes second majors.
Graduate School: Declared Major -Spring Terms
Data Source: Data Source: NDUH2SRE Major Minor Reports by College Provided by Registrar’s Office
Program 97/98 98/99 99/00 00/01 01/02 02/03 03/04 04/05 05/06 06/07 07/08 08/09 09/10 Communication Dis 1 7 25 13 14 14 39 49 53 48 49 49 48 Criminal Justice 4 9 7 18 12 12 10 13 9 10 10 9 7 Education 8 35 23 34 31 44 52 50 61 Information Sys. 15 48 28 28 25 36 Management 20 26 30 48 59 51 52 21 34 71 50 37 30 Mathematics Masters
5 1 1 1 4 3 6 13 19 1 25 28 19
Music Ed. 4 2 1 1 1 0 0 1 1 0 0 0 0 School Psych. 17 16 19 20 20 16 15 17 19 15 13 16 13 Science Ed. 1 0 2 1 0 1 4 1 0 0 0 5 9 Special Ed. 5 11 18 15 21 28 26 49 45 56 53 70 79
Total Graduates 57 72 103 117 139 160 175 213 259 273 280 289 302

- 49 -
Degrees Conferred College of Arts and Sciences
Program 97/98 98/99 99/00 00/01 01/02 02/03 03/04 04/05 05/06 06/07 07/08 08/09 09/10
Art (BA) 2 5 3 6 5 9 2 7 3 4 6 2 8 Art (BFA) New in 2004 Arts Administration (BS) New in 2002 0 0 0 0 0 0 0
Art Education (BSE) 2 3 0 0 0 1 2 1 1 3 1 3 2 Biology (BA) 3 6 7 9 8 7 10 7 13 12 8 10 1 Biology Education (BSE) 4 2 0 2 3 2 3 2 3 0 1 2 4
Broadcasting (BA) 4 8 9 6 3 4 14 7 9 3 4 12 9 Chemistry (BA) 0 2 0 0 0 1 1 3 1 4 7 7 3 Chemistry Education (BSE)
0 0 1 0 0 0 2 0 0 0 0 0 0
Clinical Laboratory Science (BS)
2 3 4 0 5 3 0 0 1 1 2 2 2
Communication Arts (BA)
6 3 5 2 1 2 4 Inactivated 1 0 1 2
Communication (BA) New in 2004 0 0 2 0 1 0 1
Communication Arts (BSE)
1 0 1 1 2 0 0 0 1 1 0 0 0
Computer Science (BS) 9 17 12 10 20 11 9 10 15 7 7 6 9
Criminal Justice (BS) 46 55 61 55 53 43 47 41 53 47 48 43 40
Earth Science (BA) 0 2 0 0 0 0 0 0 0 0 0 0 0 Earth Science Education (BSE)
0 0 0 1 0 2 0 0 1 1 0 0 0
Economics (BA) 1 4 4 4 4 2 5 0 1 2 1 0 0 English (BA) 3 9 6 2 3 4 8 4 4 7 5 8 1 English Education (BSE) 6 7 6 7 2 4 3 3 6 6 3 5 2
Foreign Language (BA) 1 2 3 0 0 0 0 0 0 0 0 0 0
Foreign Language/German (BA)
Split in 1999
0 0 1 2 0 3 0 0 0 4 0
Foreign Language/French (BA)
0 1 0 1 0 0 1 0 0 0 0
Foreign Language/Spanish (BA)
0 0 0 0 1 1 0 1 2 1 0
Foreign Language/German (BSE)
0 0 1 1 0 0 1 0 0 0 0
Foreign Language/French (BSE)
0 0 0 0 0 0 0 0 0 1 1
Foreign Language/Spanish (BSE)
1 0 2 0 0 2 0 0 1 0 0
General Studies (BGS) 3 8 13 19 13 16 28 15 25 27 20 24
Geology (BA) 0 0 1 2 0 1 1 2 0 0 28 2 5

- 50 -
History (BA) 3 5 6 3 5 5 4 4 5 3 4 6 7 History Education (BSE) 5 2 7 4 5 1 6 2 1 4 11 7 6
Mathematics (BA) 8 5 2 2 3 5 4 4 1 2 5 2 5 Mathematics Education (BSE)
5 5 5 2 3 2 5 2 5 6 6 6 10
Multimedia Studies (BS) New 1999 0 0 1 2 0 0 0 0 1 1
Music (BA) 2 1 0 5 6 2 5 4 3 0 3 0 2 Music Education (BSE) 2 6 7 8 7 7 5 3 7 6 2 4 5
Physical Science (BA) 0 0 0 0 0 0 0 2 0 0 0 0 0
Physical Science Ed. (BSE)
1 1 0 1 1 3 0 0 0 0 0 0 0
Physics (BA) 0 1 0 0 1 1 1 1 0 0 1 0 1 Physics Education (BSE) 0 0 1 1 0 0 0 0 1 0 0 9 1
Radiologic Technology (BS)
8 9 15 5 5 4 8 12 14 7 6 11 5
Social Science (BA) 4 4 1 1 2 4 2 2 0 1 1 1 0
Social Science Education (BSE) 6 4 5 3 6 2 9 1 0 4 0 1 3
Sociology (BA) 5 4 10 3 6 3 8 5 7 6 9 8 10 Theatre Arts (BA) New 2004 0 0 1 2 1 3 1 Total Graduates by College
142 183 196 165 175 153 199 150 186 168 163 188 171
Data Source: Completions Data for NDUS Provided by Registrar’s Office Data Sources: Graduation data for first majors is from the annual publication “North Dakota University System: Programs Offered/Completed at North Dakota Institutions of
Postsecondary Education.”

- 51 -
Second Majors Reported to IPEDS Arts and Sciences
Data for second majors is from the MSU Registrar’s Office from the document reported to the National Center for Education Statistics’ Integrated Postsecondary Education Data System (IPEDS).
CIP College of Arts & Sciences 2005 2006 2007 2008 2009 2010
50.0701 Art 2 0 0 0 0 0 09.0701 Broadcasting 0 0 0 1 1 1 13.1311 Mathematics Education 1 0 0 0 0 0 27.0101 Mathematics 3 1 2 2 3 1 50.0901 Music 0 3 1 1 0 1 51.0907 Medical Radiological Tech 1 0 0 0 0 0 13.1302 Art Education 0 0 0 0 1 0 13.1316 Science Education 0 1 0 0 0 0 13.1328 History Education 0 2 2 2 0 1 16.0501 German 1 1 0 0 1 0 16.0905 Spanish 0 1 1 1 0 0 40.0501 Chemistry 1 0 0 1 0 0 26.0101 Biology 0 0 0 1 1 0 40.0801 Physics 0 0 0 1 0 0 51.1005 Clinical Lab Sciences 0 1 0 0 0 0 50.0501 Theater Arts 0 0 0 0 1 0 54.0101 History 0 2 0 1 0 0 13.1006 Education of MR 0 0 0 0 0 0 43.0104 Criminal Justice 0 0 0 1 0 3 11.0101 Computer Science 0 0 1 1 1 0 11.0401 Information Science 0 0 1 1 0 0 10.9999 Multimedia Studies 0 0 0 0 0 0 09.0101 Communication Studies 0 0 1 1 0 0 Total 9 15 9 15 9 7
Source: IPEDS Survey ~ Registrar’s Data http://surveys.nces.ed.gov/ipeds/

- 52 -
College of Education and Health Sciences
Program 97/98 98/99 99/00 00/01 01/02 02/03 03/04 04/05 05/06 06/07 07/08 08/09 09/10
Addiction Studies (BS)
6 14 7 2 1 4 3 6 7 5 1 4 5
Communication Disorders (BS)
41 22 23 22 18 7 16 16 20 25 30 17 26
Communication Disorders Education (BSE)
New 2001 1 0 9 0 0 0 0 0 0 0
Corporate Fitness (BS)
9 11 20 11 8 7 12 2 9 12 10 11 9
Developmental Disabilities (AS)
1 0 6 2 2 1 1 1 2 3 1 0 0
Developmental Disabilities (BS)
1 0 3 1 0 0 1 4 3 3 2 9 3
Education of the Deaf (BSE)
10 8 5 7 3 4 0 3 2 1 0 0 0
Education of the Mentally Retarded (BSE)
16 15 13 11 3 8 8 5 8 3 7 10 11
Elementary Education (BSE)
93 93 63 75 55 72 47 61 48 36 56 48 42
Nursing (BSN) 35 32 32 33 31 51 33 46 46 48 34 42 33
Physical Education (BSE)
12 8 15 11 7 11 13 3 5 18 12 9 20
Psychology (BA) 29 26 22 17 30 29 10 19 12 13 20 17 18
Psychology Education (BSE)
New Program 2001 1 1 0 0 0 0 2 4 1 0
Social Work (BSW) 39 39 24 26 18 21 17 11 11 14 21 24 17
Total Graduates by College
292 268 233 220 177 224 161 177 173 183 198 192 184
Data Source: Completions Data for NDUS Provided by Registrar’s Office Degrees Reported to IPEDS as First Majors. Reported in NDUS Degrees Offered/Degrees Completed. This originates in the MSU Registrar’s Office.
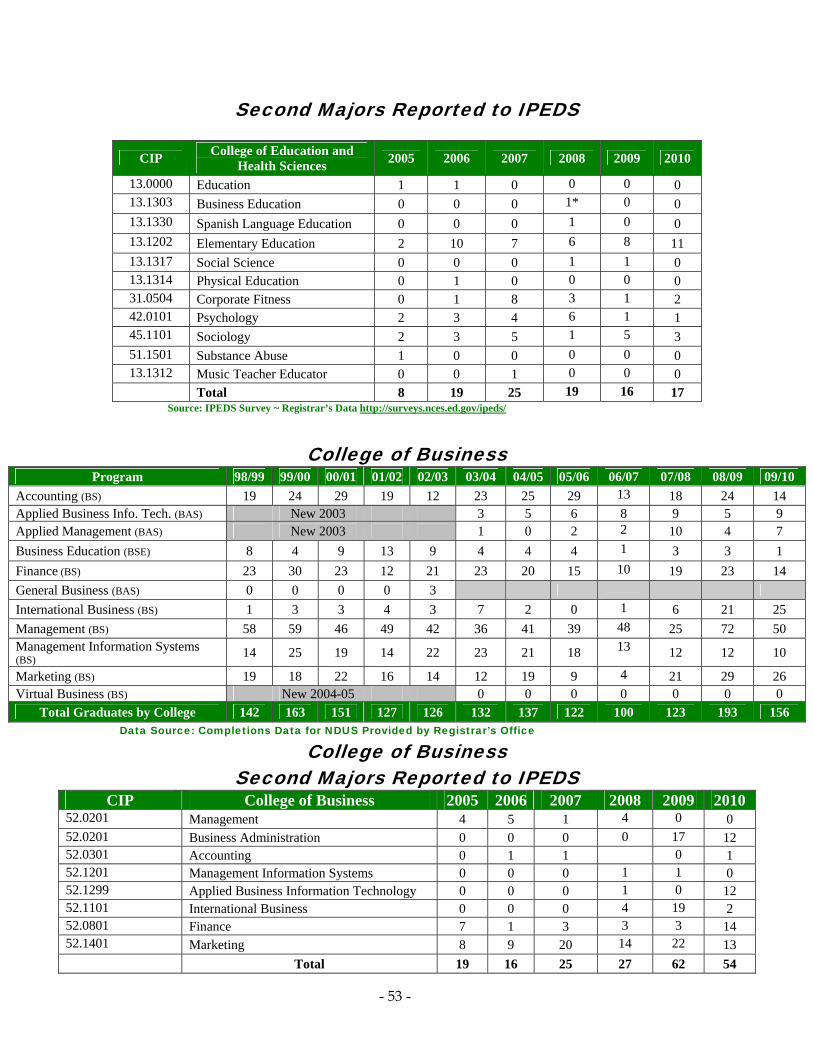
- 53 -
Second Majors Reported to IPEDS
CIP College of Education and
Health Sciences 2005 2006 2007 2008 2009 2010
13.0000 Education 1 1 0 0 0 0 13.1303 Business Education 0 0 0 1* 0 0 13.1330 Spanish Language Education 0 0 0 1 0 0 13.1202 Elementary Education 2 10 7 6 8 11 13.1317 Social Science 0 0 0 1 1 0 13.1314 Physical Education 0 1 0 0 0 0 31.0504 Corporate Fitness 0 1 8 3 1 2 42.0101 Psychology 2 3 4 6 1 1 45.1101 Sociology 2 3 5 1 5 3 51.1501 Substance Abuse 1 0 0 0 0 0 13.1312 Music Teacher Educator 0 0 1 0 0 0
Total 8 19 25 19 16 17 Source: IPEDS Survey ~ Registrar’s Data http://surveys.nces.ed.gov/ipeds/
College of Business
Program 98/99 99/00 00/01 01/02 02/03 03/04 04/05 05/06 06/07 07/08 08/09 09/10
Accounting (BS) 19 24 29 19 12 23 25 29 13 18 24 14 Applied Business Info. Tech. (BAS) New 2003 3 5 6 8 9 5 9 Applied Management (BAS) New 2003 1 0 2 2 10 4 7
Business Education (BSE) 8 4 9 13 9 4 4 4 1 3 3 1
Finance (BS) 23 30 23 12 21 23 20 15 10 19 23 14
General Business (BAS) 0 0 0 0 3
International Business (BS) 1 3 3 4 3 7 2 0 1 6 21 25
Management (BS) 58 59 46 49 42 36 41 39 48 25 72 50 Management Information Systems (BS) 14 25 19 14 22 23 21 18 13 12 12 10
Marketing (BS) 19 18 22 16 14 12 19 9 4 21 29 26 Virtual Business (BS) New 2004-05 0 0 0 0 0 0 0
Total Graduates by College 142 163 151 127 126 132 137 122 100 123 193 156 Data Source: Completions Data for NDUS Provided by Registrar’s Office
College of Business Second Majors Reported to IPEDS
CIP College of Business 2005 2006 2007 2008 2009 2010 52.0201 Management 4 5 1 4 0 0 52.0201 Business Administration 0 0 0 0 17 12 52.0301 Accounting 0 1 1 0 1 52.1201 Management Information Systems 0 0 0 1 1 0 52.1299 Applied Business Information Technology 0 0 0 1 0 12 52.1101 International Business 0 0 0 4 19 2 52.0801 Finance 7 1 3 3 3 14 52.1401 Marketing 8 9 20 14 22 13
Total 19 16 25 27 62 54
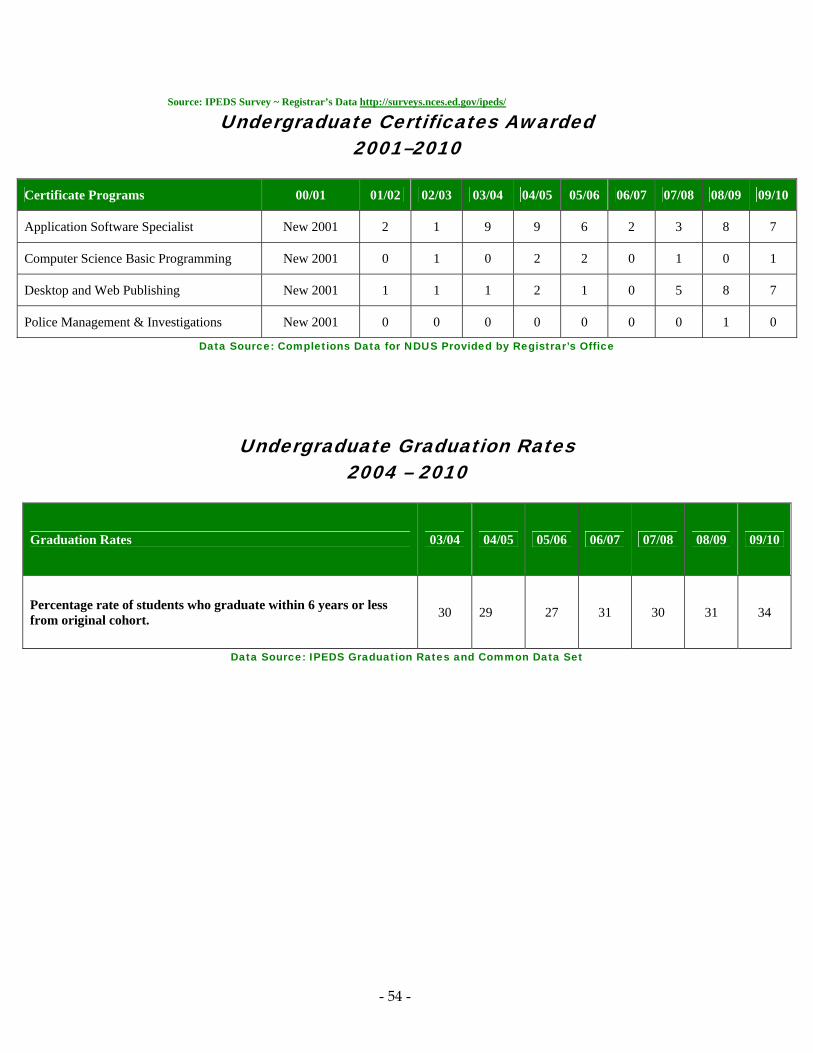
- 54 -
Source: IPEDS Survey ~ Registrar’s Data http://surveys.nces.ed.gov/ipeds/
Undergraduate Certificates Awarded 2001–2010
Certificate Programs 00/01 01/02 02/03 03/04 04/05 05/06 06/07 07/08 08/09 09/10
Application Software Specialist New 2001 2 1 9 9 6 2 3 8 7
Computer Science Basic Programming New 2001 0 1 0 2 2 0 1 0 1
Desktop and Web Publishing New 2001 1 1 1 2 1 0 5 8 7
Police Management & Investigations New 2001 0 0 0 0 0 0 0 1 0
Data Source: Completions Data for NDUS Provided by Registrar’s Office
Undergraduate Graduation Rates 2004 – 2010
Graduation Rates 03/04 04/05 05/06 06/07 07/08 08/09 09/10
Percentage rate of students who graduate within 6 years or less from original cohort.
30 29 27 31 30 31 34
Data Source: IPEDS Graduation Rates and Common Data Set

- 55 -
Graduate Degrees Conferred: 1998 through 2010 Program 97/98 98/99 99/00 00/01 01/02 02/03 03/04 04/05 05/06 06/07 07/08 08/09 09/10 Communication Disorders (MS)
36 38 29 33 30 25 19 18 25 14 31 23 25
Criminal Justice (MS) 1 4 0 2 0 1 4 3 2 3 2 4 2
Education (MED) New 2001-02
4 6 10 11 11 10 20 13
Elementary Education (MS)
14 35 18 4 30 0 6 0 0 0 0 0 0
English Education* (MAT) New 0 0 3 7 0 1 0 1 0 0 1 0
Information Systems (MS) New 2003-04
6 8 10 11
Management (MS) 5 6 5 15 22 47 41 22 18 28 17 46 23 Mathematics Education (MAT)
9 9 5 3 7 2 8 4 5 2 6 7 5
Music Education (MME) 0 3 5 0 0 0 3 0 1 4 1 0 2
School Psychology (EDSPEC)
6* 2* 8 4 8 5 5 2 8 6 1 3 4
Science Education (MAT) 3 0 2 1 0 1 1 0 1 1 0 1 0
Special Education (MS) 21 15 18 12 11 4 10 12 16 13 20 19 22
Totals 95 112 90 77 115 89 104 71 88 88 96 134 107
*English Education – New 1997 – 1 cohort authorized.
Graduate Certificates Awarded: 2000-2001 through 2009-2010
Certificate 00/01 01/02 02/03 03/04 04/05 05/06 06-07 07/08 08/09 09/10
Technology for Managers
New 2001
0 0 0 0 0 0 0 0 0

U1
G
Undergraduate1997‐1998, 535
Undergradu1998‐1999,
Und199
Graduate, 1991998, 95
Graduat1999
G
MDegre
M
e, 5
uate, , 593dergraduate, 99‐2000, 592Undergra
2000‐200U2
7‐te, 1998‐, 112Graduate, 1999
2000, 90Gradua
20
Year
1997-199
1998-1991999-2002000-2002001-2002002-2002003-2002004-2002005-2002006-2002007-2002008-2002009-20
-
Minot Starees Con
Minot StaDegree
199
aduate, 01, 535Undergraduate2001‐2002, 478
Underg2002‐2
9‐ate, 2000‐01, 77
Graduate, 22002, 11Grad
Unde
Un
98
99 00 01 02 03 04 05 06 07 09 09 10
- 56 -
tate Univnferred 1
tate Unives Confe998-2010
e, 8
graduate, 003, 504Undergradua2003‐2004, 4Unde
2004
2001‐15duate, 2002‐2003, 89
Graduate,2004, 1
G
rgraduate
ndergraduat
535
593 592 535 478 504 492 464 481 449 498 564 513
versity 1998-20
versity erred 0
ate, 492ergraduate, ‐2005, 464
Undergradu2005‐2006, Und
200
, 2003‐104raduate, 20042005, 71
Graduat2006
G
Graduate
te Gra
95
112 90 77
115 89
104 71 88 88 96
134 103
010
uate, 481dergraduate, 06‐2007, 449
Undergra2007‐200
U2
4‐te, 2005‐6, 88Graduate, 200
2007, 88Gradu
20
aduate
duate, 08, 498
ndergraduate008‐2009, 564
Undergra2009‐201
06‐uate, 2007‐008, 96
Graduate, 22009, 13Graduate2010,
, 4aduate, 10, 513
2008‐34, 2009‐103
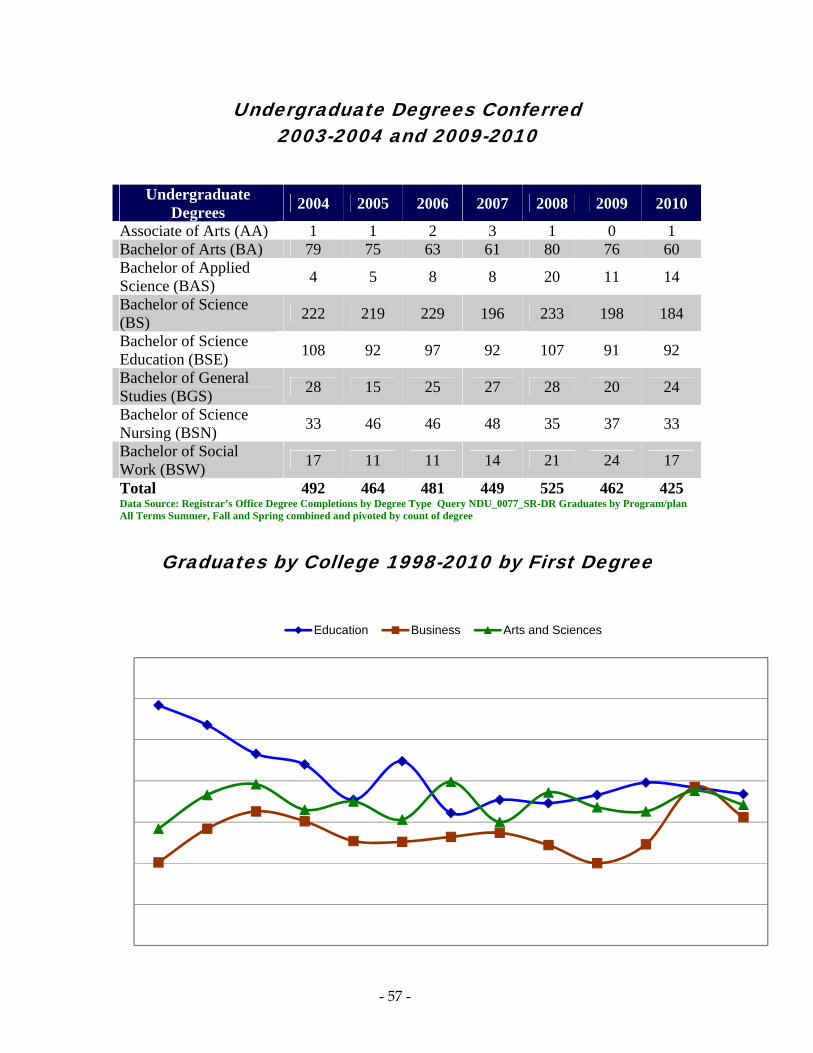
- 57 -
Undergraduate Degrees Conferred 2003-2004 and 2009-2010
Undergraduate Degrees
2004 2005 2006 2007 2008 2009 2010
Associate of Arts (AA) 1 1 2 3 1 0 1 Bachelor of Arts (BA) 79 75 63 61 80 76 60 Bachelor of Applied Science (BAS)
4 5 8 8 20 11 14
Bachelor of Science (BS)
222 219 229 196 233 198 184
Bachelor of Science Education (BSE)
108 92 97 92 107 91 92
Bachelor of General Studies (BGS)
28 15 25 27 28 20 24
Bachelor of Science Nursing (BSN)
33 46 46 48 35 37 33
Bachelor of Social Work (BSW)
17 11 11 14 21 24 17
Total 492 464 481 449 525 462 425 Data Source: Registrar’s Office Degree Completions by Degree Type Query NDU_0077_SR-DR Graduates by Program/plan All Terms Summer, Fall and Spring combined and pivoted by count of degree
Graduates by College 1998-2010 by First Degree
Education Business Arts and Sciences

- 58 -
Minot State University
Faculty and Staff
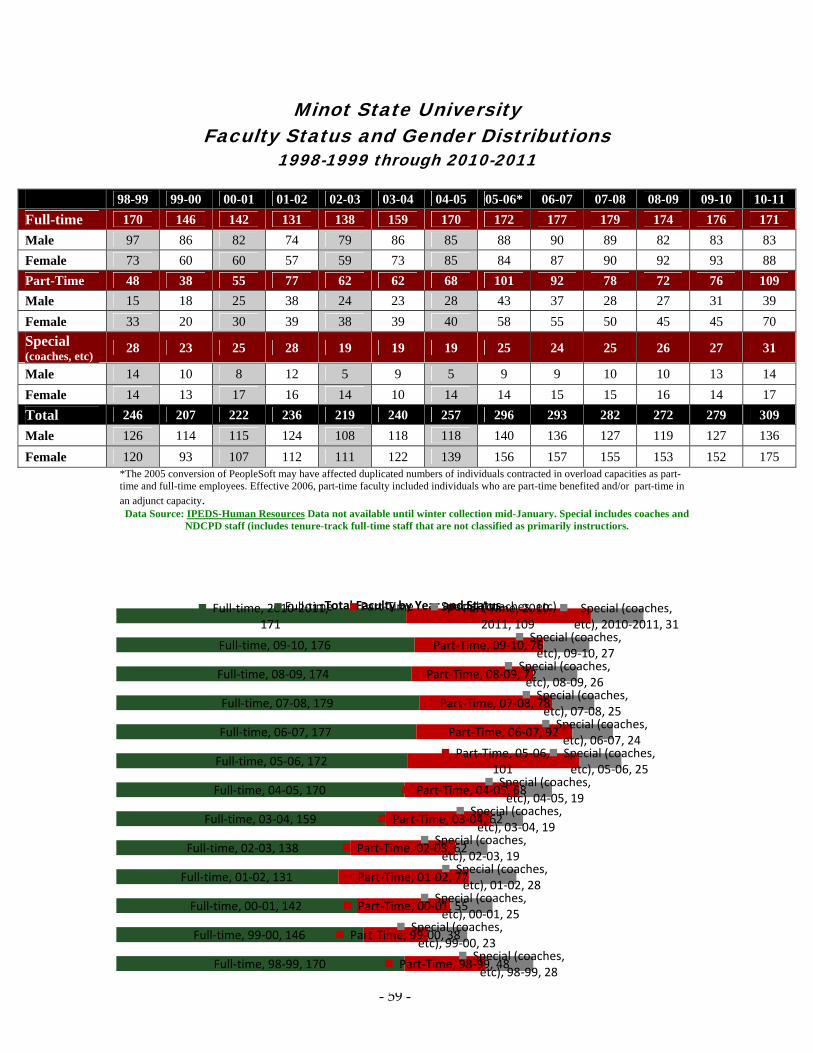
- 59 -
Minot State University Faculty Status and Gender Distributions
1998-1999 through 2010-2011
98-99 99-00 00-01 01-02 02-03 03-04 04-05 05-06* 06-07 07-08 08-09 09-10 10-11
Full-time 170 146 142 131 138 159 170 172 177 179 174 176 171
Male 97 86 82 74 79 86 85 88 90 89 82 83 83
Female 73 60 60 57 59 73 85 84 87 90 92 93 88
Part-Time 48 38 55 77 62 62 68 101 92 78 72 76 109
Male 15 18 25 38 24 23 28 43 37 28 27 31 39
Female 33 20 30 39 38 39 40 58 55 50 45 45 70
Special (coaches, etc) 28 23 25 28 19 19 19 25 24 25 26 27 31
Male 14 10 8 12 5 9 5 9 9 10 10 13 14
Female 14 13 17 16 14 10 14 14 15 15 16 14 17
Total 246 207 222 236 219 240 257 296 293 282 272 279 309
Male 126 114 115 124 108 118 118 140 136 127 119 127 136
Female 120 93 107 112 111 122 139 156 157 155 153 152 175 *The 2005 conversion of PeopleSoft may have affected duplicated numbers of individuals contracted in overload capacities as part-time and full-time employees. Effective 2006, part-time faculty included individuals who are part-time benefited and/or part-time in
an adjunct capacity. Data Source: IPEDS-Human Resources Data not available until winter collection mid-January. Special includes coaches and
NDCPD staff (includes tenure-track full-time staff that are not classified as primarily instructiors.
Full‐time, 98‐99, 170
Full‐time, 99‐00, 146
Full‐time, 00‐01, 142
Full‐time, 01‐02, 131
Full‐time, 02‐03, 138
Full‐time, 03‐04, 159
Full‐time, 04‐05, 170
Full‐time, 05‐06, 172
Full‐time, 06‐07, 177
Full‐time, 07‐08, 179
Full‐time, 08‐09, 174
Full‐time, 09‐10, 176
Full‐time, 2010‐2011, 171
Part‐Time, 98‐99, 48
Part‐Time, 99‐00, 38
Part‐Time, 00‐01, 55
Part‐Time, 01‐02, 77
Part‐Time, 02‐03, 62
Part‐Time, 03‐04, 62
Part‐Time, 04‐05, 68
Part‐Time, 05‐06, 101
Part‐Time, 06‐07, 92
Part‐Time, 07‐08, 78
Part‐Time, 08‐09, 72
Part‐Time, 09‐10, 76
Part‐Time, 2010‐2011, 109
Special (coaches, etc), 98‐99, 28
Special (coaches, etc), 99‐00, 23
Special (coaches, etc), 00‐01, 25
Special (coaches, etc), 01‐02, 28
Special (coaches, etc), 02‐03, 19
Special (coaches, etc), 03‐04, 19
Special (coaches, etc), 04‐05, 19
Special (coaches, etc), 05‐06, 25
Special (coaches, etc), 06‐07, 24
Special (coaches, etc), 07‐08, 25
Special (coaches, etc), 08‐09, 26
Special (coaches, etc), 09‐10, 27
Special (coaches, etc), 2010‐2011, 31
Total Faculty by Year and StatusFull‐time Part‐Time Special (coaches, etc)
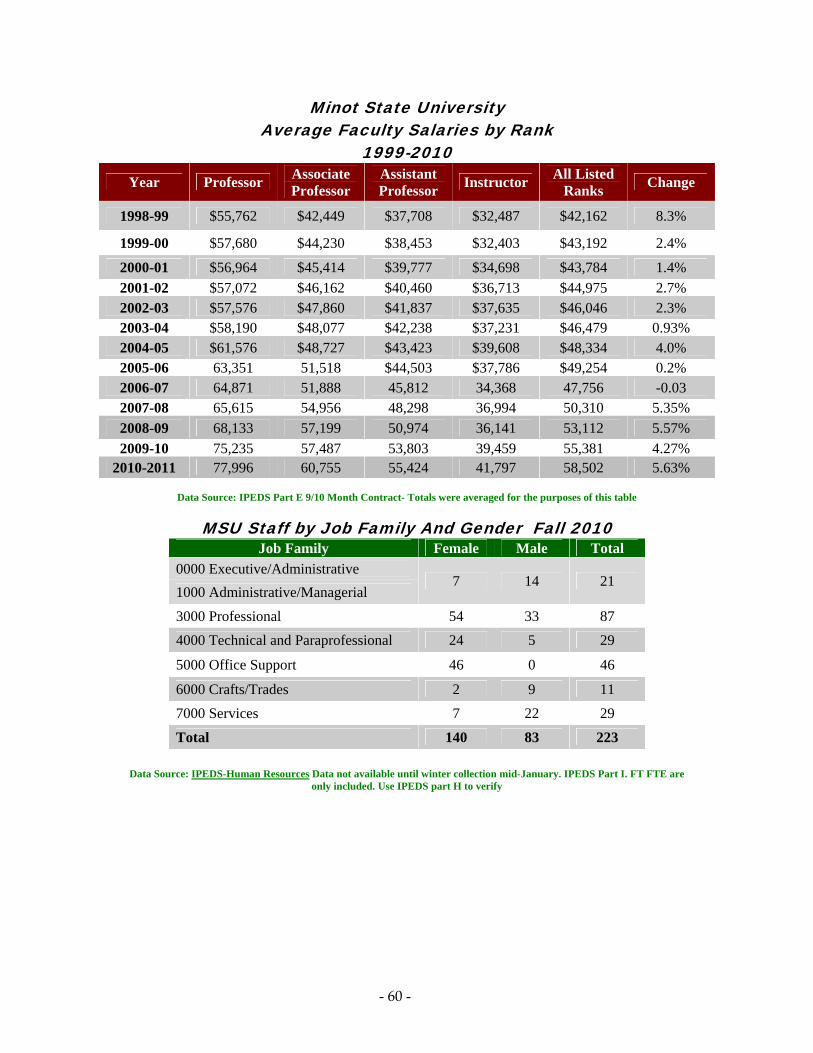
- 60 -
Minot State University
Average Faculty Salaries by Rank 1999-2010
Year Professor Associate Professor
Assistant Professor
Instructor All Listed
Ranks Change
1998-99 $55,762 $42,449 $37,708 $32,487 $42,162 8.3%
1999-00 $57,680 $44,230 $38,453 $32,403 $43,192 2.4%
2000-01 $56,964 $45,414 $39,777 $34,698 $43,784 1.4%
2001-02 $57,072 $46,162 $40,460 $36,713 $44,975 2.7% 2002-03 $57,576 $47,860 $41,837 $37,635 $46,046 2.3% 2003-04 $58,190 $48,077 $42,238 $37,231 $46,479 0.93% 2004-05 $61,576 $48,727 $43,423 $39,608 $48,334 4.0% 2005-06 63,351 51,518 $44,503 $37,786 $49,254 0.2% 2006-07 64,871 51,888 45,812 34,368 47,756 -0.03 2007-08 65,615 54,956 48,298 36,994 50,310 5.35%
2008-09 68,133 57,199 50,974 36,141 53,112 5.57%
2009-10 75,235 57,487 53,803 39,459 55,381 4.27% 2010-2011 77,996 60,755 55,424 41,797 58,502 5.63%
Data Source: IPEDS Part E 9/10 Month Contract- Totals were averaged for the purposes of this table
MSU Staff by Job Family And Gender Fall 2010 Job Family Female Male Total
0000 Executive/Administrative 7 14 21
1000 Administrative/Managerial
3000 Professional 54 33 87
4000 Technical and Paraprofessional 24 5 29
5000 Office Support 46 0 46
6000 Crafts/Trades 2 9 11
7000 Services 7 22 29
Total 140 83 223
Data Source: IPEDS-Human Resources Data not available until winter collection mid-January. IPEDS Part I. FT FTE are
only included. Use IPEDS part H to verify

- 61 -
Full-time Faculty Rank and Gender Distribution 1998-1999 through 2010-2011
98-99
99-00
00-01
01-02
02-03
03-04
04-05
05-06
06-07
07-08
08-09
09- 10
10-11
Professor Male 22 22 19 21 19 20 20 23 24 26 24 25 27
Female 3 2 4 5 5 6 7 6 5 6 6 6 6 Total 25 22 23 26 24 26 27 29 29 32 30 31 33
Associate Professor Male 27 24 22 23 23 26 28 26 26 26 26 23 21
Female 18 18 16 15 17 16 13 15 15 15 18 20 21 Total 45 42 38 38 40 42 41 41 41 41 44 43 42
Assistant Professor Male 35 36 38 31 36 33 32 30 31 24 19 22 25
Female 33 36 37 35 34 35 36 37 36 41 41 42 37 Total 68 72 75 66 70 68 68 67 67 65 60 64 62
Instructor/Lecturer Male 7 8 10 11 4 7 9 10 9 13 13 13 10
Female 8 13 19 15 11 16 24 25 31 29 28 25 24 Total 15 21 29 26 15 23 33 35 40 42 41 38 34 Total 153 157 165 156 149 159 169 172 177 180 180 176 171
Data Source: IPEDS-Human Resources Data not available until winter collection mid-January. IPEDS Part G (Add all sec. Tenured, non-tenured, on-track)
Data Source: IPEDS-Human Resources Data not available until winter collection mid-January.
Professor, 98‐99, 25Professor, 99‐00, 22Professor, 00‐01, 23Professor, 01‐02, 26Professor, 02‐03, 24Professor, 03‐04, 26Professor, 04‐05, 27Professor, 05‐06, 29Professor, 06‐07, 29Professor, 07‐08, 32Professor, 08‐09, 30Professor, 09‐10, 31Professor, 10‐11, 33
Associate Professor, 98‐99, 45Associate Professor,
99‐00, 42Associate Professor,
00‐01, 38
Associate Professor, 01‐02, 38
Associate Professor, 02‐03, 40
Associate Professor, 03‐04, 42
Associate Professor, 04‐05, 41
Associate Professor, 05‐06, 41
Associate Professor, 06‐07, 41
Associate Professor, 07‐08, 41
Associate Professor, 08‐09, 44
Associate Professor, 09‐10, 43
Associate Professor, 10‐11, 42
Assistant Professor, 98‐99, 68Assistant Professor,
99‐00, 72Assistant Professor,
00‐01, 75Assistant Professor,
01‐02, 66
Assistant Professor, 02‐03, 70
Assistant Professor, 03‐04, 68
Assistant Professor, 04‐05, 68
Assistant Professor, 05‐06, 67
Assistant Professor, 06‐07, 67
Assistant Professor, 07‐08, 65
Assistant Professor, 08‐09, 60
Assistant Professor, 09‐10, 64Assistant Professor,
10‐11, 62
Instructor/Lecturer, 98‐99, 15
Instructor/Lecturer, 99‐00, 21
Instructor/Lecturer, 00‐01, 29
Instructor/Lecturer, 01‐02, 26
Instructor/Lecturer, 02‐03, 15
Instructor/Lecturer, 03‐04, 23
Instructor/Lecturer, 04‐05, 33
Instructor/Lecturer, 05‐06, 35
Instructor/Lecturer, 06‐07, 40
Instructor/Lecturer, 07‐08, 42
Instructor/Lecturer, 08‐09, 41
Instructor/Lecturer, 09‐10, 38Instructor/Lecturer,
10‐11, 34
Professor Associate Professor Assistant Professor Instructor/Lecturer

- 62 -
Minot State University Tenured Faculty: Rank and Gender
1998-1999 through 2010-2011
98-99 99-00 00-01 01-02 02-03 03-04 04-05 05-06 06-07 07-08 08-09 09-10 10-11
Professor 22 22 22 21 20 25 23 28 28 29 28 30 32
Male 19 20 18 17 16 19 18 22 23 23 22 24 26
Female 3 2 4 4 4 6 5 6 5 6 6 6 6
Associate Professor
36 35 33 33 34 35 33 35 36 31 38 39 38
Male 21 21 19 20 20 22 20 24 23 20 23 22 19
Female 15 14 14 13 14 13 13 11 13 11 15 17 19
Assistant Professor
28 28 30 28 27 27 25 23 26 26 30 34 32
Male 10 11 9 10 10 9 8 5 7 7 8 9 9
Female 18 17 21 18 17 18 17 18 19 19 22 25 23
Total 86 85 85 82 81 87 81 86 90 86 96 103 102
Total Male 50 52 46 47 46 50 46 51 53 50 43 55 54
Total Female 36 33 39 35 35 37 35 35 37 36 53 48 48
Data Source: IPEDS-Human Resources Data not available until winter collection mid-January. IPEDS Part G- Just Tenured
Section .
Total Male, 99‐00, 52
Total Male, 00‐01, 46
Total Male, 01‐02, 47
Total Male, 02‐03, 46
Total Male, 03‐04, 50
Total Male, 04‐05, 46
Total Male, 05‐06, 51
Total Male, 06‐07, 53
Total Male, 07‐08, 50
Total Male, 08‐09, 43
Total Male, 09‐10, 55
Total Male, 10‐11, 54
Total Female, 99‐00, 33
Total Female, 00‐01, 39
Total Female, 01‐02, 35
Total Female, 02‐03, 35
Total Female, 03‐04, 37
Total Female, 04‐05, 35
Total Female, 05‐06, 35
Total Female, 06‐07, 37
Total Female, 07‐08, 36
Total Female, 08‐09, 53
Total Female, 09‐10, 48
Total Female, 10‐11, 48
Total Tenured Faculty by Year and Gender
Total Female Total Male

- 63 -
Minot State University
Financial Information

- 64 -
Tuition and Fees Comparison Tuition and Required Fees for Resident Undergraduate
A Regional Comparison 1 2001-02 through 2010-11
Year
Minot State Variance to Regional Average
Dollars Percent 2001-2002 -$479 -15.7% 2002-2003 -$500 -14.9% 2003-2004 -$516 -13.8% 2004-2005 -$395 -9.6% 2005-2006 -$276 -6.3% 2006-2007 -$112 -2.4% 2007-2008 -$140 -2.9% 2008-2009 -$141 -2.7% 2009-2010 -$31 -.6% 2010-2011 -$46 -.8%
1 Regional averages include: CO, IA, KS, MN, MO, MT, NE, OK, SD, WI, and WY.
Data Source: NDUS Student Affordability Report.
Tuition and Fees Compared to Household Income
Resident Undergraduate Tuition and Required Fees As a percent of Median Household Income 1, 2
2000-01 through 2008-09
Year Minot State Regional ND
2000-2001 7.1% 7.4% 2001-2002 7.4% 7.2% 2002-2003 8.0% 7.9% 2003-2004 8.9% 9.0% 2004-2005 9.5% 9.2% 2005-2006 10.0% 10.4% 2006-2007 10.3% 10.6% 2007-2008 10.4% 11.6% 2008-2009 12.3% 10.9% 2009-2010 11.8% 10.9% 2010-2011 11.3% 11.7%
1Tuition and Required Fees/median household income. 2 Regional average includes: CO, IA, KS, MN, MO, MT, NE, OK, SD, WI, and WY. Data Source: NDUS Student Affordability Report. And NDUS Accountability Board Level Report

- 65 -
Minot State University–Cost per Student General Fund and Total Fund Revenue per FTE Student: FY 2010
Calculation 1: Unrestricted General Fund/FTE Student1 $ Total Fund/FTE Student2 $ Calculation 2: Combined Unrestricted & Restricted General Fund/FTE Student3 $ Total Fund/FTE Student4 $ _____________________________________________
1 unrestricted state transfers ÷ FTE students. 2 Total unrestricted revenues + state transfers ÷ FTE students 3 Combined unrestricted and restricted state transfers ÷ FTE students 4 Combined unrestricted and restricted revenue + state transfers ÷ FTE students._______ Data Source: NDUS Accountability Board Level Report- MSU Business Office Controller
Calculation (See above) FY 2001 FY 2002 FY 2003 FY 2004 FY 2005 FY 2006 FY 2007 FY 2008 FY 2009
1
General Fund/FTE Student1
$5,201 $ 4,626 $ 4,646 $ 4,366 $4,431 4,470 4,566 5,143
Total Fund/FTE Student2
$10,683 $ 8,891 $ 9,138 $ 9,269 $5,467 9,992 10,699 11,070
2
General Fund/FTE Student1
$ 5,319 $ 4,626 $ 4,646 $ 4,366 $4,431 4,470 4,566 5,143
Total Fund/FTE Student2
$13,135 $11,610 $12,326 $12,366 $13,504 12,936 14,597 14,708
Administrative, Instructional, and Other Costs per Student
Administrative, Instructional and Other Unrestricted Costs per FTE Student - FY 2010
Core Services1 $ Supporting Services & Student Aid2 $ Administration & Plant Services3 $ Total $ ___________________________________________ 1 Core Services: Total unrestricted E and G expenditures and mandatory transfers for instruction + research + public services ÷ FTE students. 2 Support services and student aid: Total unrestricted E and G expenditures and mandatory transfers for academic support + student services + scholarships and fellowships ÷ FTE Students. 3 Administrative and physical plant: Total unrestricted E and G expenditures and mandatory transfers for institutional support + operation and maintenance of physical plant ÷ FTE students. Data Sources: NDUS Accountability Reports- Board Level Data and MSU Business Office Controller
FY 2001 FY 2002 FY 2003 FY 2004 FY 2005 FY 2006 FY 2007 FY 2008 FY 2009
Core Services $ 5,006 $ 5,786 $ 6,216 $ 6, 481 7,299 7,056 7,411 7,878 Supporting Services & Aid
$ 1,600 $ 2, 017 $ 2,094 $ 1,887 1,346 1,426 1,366 1,623
Admin & Plant Services
$ 1,876 $ 1,555 $ 1,684 $ 1,298 2,251 2,301 2,507 2,628
Total $ 8, 482 $ 9,358 $ 9,994 $ 9,666 $10,896 10,783 11,304 12,129

- 66 -
Operating and Contributed Income Ratio FY 2010
Unrestricted & Restricted Revenues Revenues Tuition and Fees $ 14,010,695 Federal grants and contracts 6,924,802 State grants and contracts 1,612,607 Nongovermental Grants and Contracts 53,271 Sales and services – Ed. Depts. 998,866 Auxiliary enterprise 3,147,506 Other operating revenue 61,967 Total $ 26,809,734 Total Revenue & State Transfers $ 43,897,346 Operating and Contributed Income 61% Ratio Data Source: NDUS Accountability Board Level Report and MSU Business Office Controller
FY 2004 FY 2005 FY 2006 FY 2007 FY 2008 FY 2009
Tuition and Fees 8,625,793 10,349,602 11,552,372 12,822,623 13,357,109 13,760,441
Federal grants & contracts
7,828,760 8,437,742 7,275,993 8,542,804 8,007,051 5,522,708
State grants and contracts
437,636 584,798 726,121 1,243,051 929,208 851,984
Nongovernmental Gifts and Contracts
(420,778) 218,771 29,767 93,231 75,468 54,980
Sales and services – Ed. Depts.
2,034,927 1,162,785 867,379 1,052,816 1,007,316 954,182
Auxiliary enterprise
3,912,993 3,922,964 3,797,750 4,091,866 2,305,196 2,535,009
Other operating revenue
144,268 9,205 49,779 44,619 58,777 56,826
Total 22,563,599 24,685,867 24,299,161 27,891,010 25,740,125 23,736,130
Total Revenue & State**
35,877,045 37,464,349 37,884,810 41,871,399 40,787,686 40,787,686
Operating & Contributed Income Ratio***
63% 66% 64% 67% 63% 58%
Data Source: NDUS Annual Financials Reports: Supplementary Information Report by Institution * *Sum of Total and State Appropriations
*** Total /Total Revenue and State
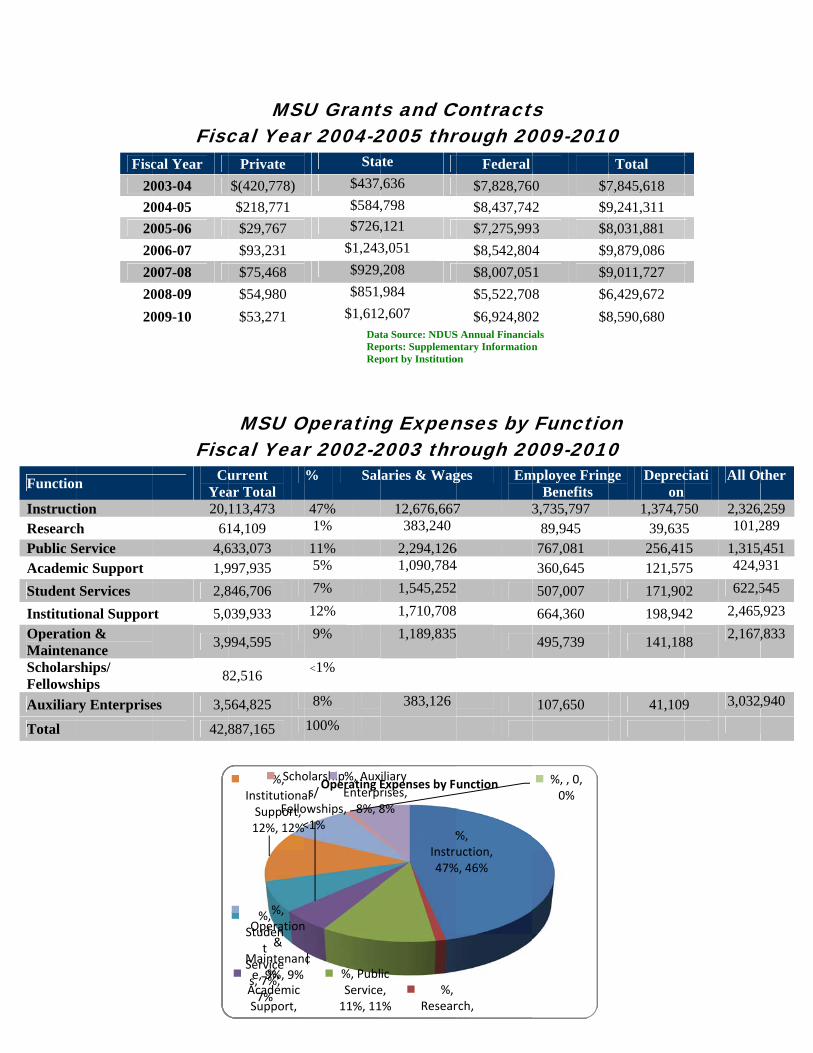
Function
InstructResearcPublic SAcadem
Student
InstitutiOperatioMaintenScholarsFellowsh
Auxiliar
Total
Fisc
20
20
20
20
20
20
20
n
tion h
Service mic Support
Services
ional Supporon &
nance ships/ hips
ry Enterprise
Fisc
Fisc
cal Year
003-04
004-05
005-06
006-07
007-08
008-09
009-10
CuYea20,
614,61,9
2,8
rt 5,0
3,9
8
es 3,5
42,
MSUcal Year
MSU Ocal Year
Private
$(420,778)
$218,771
$29,767
$93,231
$75,468
$54,980
$53,271
urrent ar Total 113,473 14,109 633,073 997,935
846,706
039,933
994,595
82,516
564,825
887,165
%, Academic Support, % %
%, Studen
t Services, 7%, 7%
%, InstitutionaSupport, 12%, 12%
%, Operation
& Maintenane, 9%, 9%
Scho
Fello<
-
SU Grantar 2004-2
Operatingar 2002-2
Sta
$437,
$584,
$726,
$1,243
$929,
$851,
$1,612DatRepRep
% Sal
47% 1%
11% 5%
7%
12%
9%
<1%
8%
100%
%, PublService11%, 11
al
n
c
olarships/
owships, <1%
%, AuxEnterp8%, 8
Operating E
- 67 -
ts and C2005 thr
ng Expen2003 thr
ate
,636
,798
,121
3,051
,208
,984
2,607 ta Source: NDUSports: Supplemenport by Institutio
laries & Wag
12,676,667383,240
2,294,1261,090,784
1,545,252
1,710,708
1,189,835
383,126
%Instru47%
%, Resear1% 1
ic e, 1%
iliary rises, 8%
Expenses by F
Contractsrough 20
nses by rough 20
Federal
$7,828,76
$8,437,742
$7,275,99
$8,542,804
$8,007,05
$5,522,70
$6,924,802S Annual Financiantary Informationon
ges Em
7 3
6 4
2
%, uction, %, 46%
rch, 1%
unction
ts
009-2010
Functio009-2010
0 $7
2 $9
3 $8
4 $9
1 $9
8 $6
2 $8als n
mployee FringBenefits
3,735,797 89,945
767,081 360,645
507,007
664,360
495,739
107,650
%, , 0, 0%
0
on
0
Total
7,845,618
9,241,311
8,031,881
9,879,086
9,011,727
6,429,672
8,590,680
ge Deprecon
1,374,739,635
256,41121,57
171,90
198,94
141,18
41,109
ciati All O
50 2,3265 101,2
5 1,31575 424,9
02 622,5
42 2,465
88 2,167
9 3,032
ther
,259 289
,451 931
545
,923
,833
,940

Serie
S
es1, 1999, 9,21
Series1, 2000, Se
F
18,091
9,728,650eries1, 2001, 9,
Serie
An
Fiscal Year
1999 2000 2001 2002 2003 2004 2005 2006 2007 2008 2009 2010
Data SourDev
*As reported
,561,561
s1, 2002, 9,279
Series1, 2
-
Combnd Develop
(Mark
*Am
$9,2$9,72$9,56$9,27
$10,9$11,5$12,1$13,2$14,1$11,2$10,5$11,3
rce: Percent Chavelopment Foundad in September 30 each y
9,462
2003, 10,949,4
Series1, 20
Combined
- 68 -
bined Endopment Fouket Value)
mount
18,091 28,650 61,561 79,462
949,429 509,272 151,411 220,439 132,813 242,169 531,910 350,258 ange Calculator aation and MSU Gyea
29
004, 11,509,272
Series1, 2005
Se
d Endowment
owment Asundation 1
% Cha
---5.5%-1.7%-3.0%18%5.1%5.6%8.8%6.9%
-20.45-6.325.23%
and MSU ScheduGift Investments
2
5, 12,151,411
eries1, 2006, 13
SerieAssets
Assets 1999 – 201
ange
- % % %
% % % % % 5%
2% %
ule of
3,220,439
es1, 2007, 14,1
Series1,
10
132,813
2008, 11,242,1
Series1, 20
Series1169
09, 10,531,910
1, 2010, 11,350
0
0,258

- 69 -
Minot State University
Student Fees
and Financial Aid
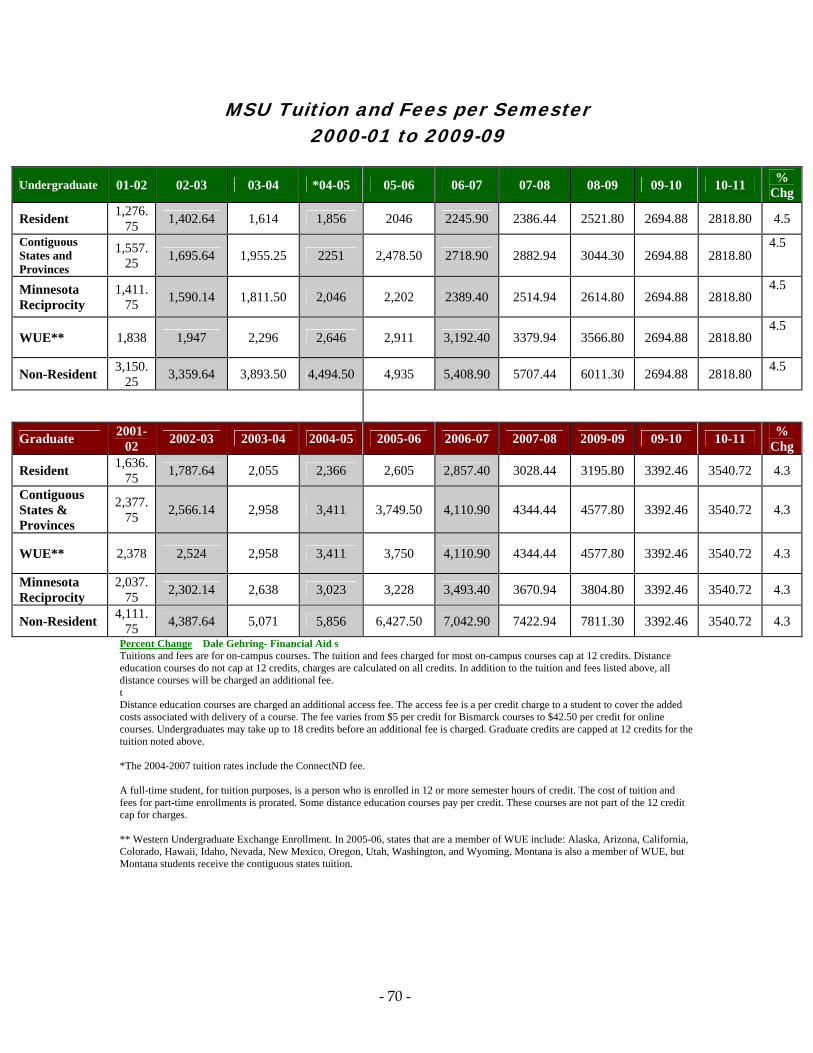
- 70 -
MSU Tuition and Fees per Semester 2000-01 to 2009-09
Undergraduate 01-02 02-03 03-04 *04-05 05-06 06-07 07-08 08-09 09-10 10-11 %
Chg
Resident 1,276.
75 1,402.64 1,614 1,856 2046 2245.90 2386.44 2521.80 2694.88 2818.80 4.5
Contiguous States and Provinces
1,557.25
1,695.64 1,955.25 2251 2,478.50 2718.90 2882.94 3044.30 2694.88 2818.80 4.5
Minnesota Reciprocity
1,411.75
1,590.14 1,811.50 2,046 2,202 2389.40 2514.94 2614.80 2694.88 2818.80 4.5
WUE** 1,838 1,947 2,296 2,646 2,911 3,192.40 3379.94 3566.80 2694.88 2818.80 4.5
Non-Resident 3,150.
25 3,359.64 3,893.50 4,494.50 4,935 5,408.90 5707.44 6011.30 2694.88 2818.80 4.5
Graduate 2001-
02 2002-03 2003-04 2004-05 2005-06 2006-07 2007-08 2009-09 09-10 10-11
% Chg
Resident 1,636.
75 1,787.64 2,055 2,366 2,605 2,857.40 3028.44 3195.80 3392.46 3540.72 4.3
Contiguous States & Provinces
2,377.75
2,566.14 2,958 3,411 3,749.50 4,110.90 4344.44 4577.80 3392.46 3540.72 4.3
WUE** 2,378 2,524 2,958 3,411 3,750 4,110.90 4344.44 4577.80 3392.46 3540.72 4.3
Minnesota Reciprocity
2,037.75
2,302.14 2,638 3,023 3,228 3,493.40 3670.94 3804.80 3392.46 3540.72 4.3
Non-Resident 4,111.
75 4,387.64 5,071 5,856 6,427.50 7,042.90 7422.94 7811.30 3392.46 3540.72 4.3
Percent Change Dale Gehring- Financial Aid s Tuitions and fees are for on-campus courses. The tuition and fees charged for most on-campus courses cap at 12 credits. Distance education courses do not cap at 12 credits, charges are calculated on all credits. In addition to the tuition and fees listed above, all distance courses will be charged an additional fee. t Distance education courses are charged an additional access fee. The access fee is a per credit charge to a student to cover the added costs associated with delivery of a course. The fee varies from $5 per credit for Bismarck courses to $42.50 per credit for online courses. Undergraduates may take up to 18 credits before an additional fee is charged. Graduate credits are capped at 12 credits for the tuition noted above. *The 2004-2007 tuition rates include the ConnectND fee. A full-time student, for tuition purposes, is a person who is enrolled in 12 or more semester hours of credit. The cost of tuition and fees for part-time enrollments is prorated. Some distance education courses pay per credit. These courses are not part of the 12 credit cap for charges.
** Western Undergraduate Exchange Enrollment. In 2005-06, states that are a member of WUE include: Alaska, Arizona, California, Colorado, Hawaii, Idaho, Nevada, New Mexico, Oregon, Utah, Washington, and Wyoming. Montana is also a member of WUE, but Montana students receive the contiguous states tuition.

- 71 -
MSU Student Activity Fee Distribution: 2004–2010 The student activity fee is included in the amounts stated on the previous page. The per-semester fee for full-time students is separated into two portions: the university fee and the Student Government activity fee. The university fee supports activities that benefit the student body as a whole, while the Student Government activity fee goes toward supporting specific activities. The tables below provide a breakdown of the allocation of these fees. These are charged per semester.
University Fee 04-05 05-06 06-07 07-08 08-09 09-10 10-11
Student Center 7.50 7.50 7.50 7.350 7.50 0.00 0.00
Student Health 20.00 20.00 20.00 40.00 40.00 35.00 35.00
Gordon B. Olson Library
15.00 15.00 15.00 15.00 15.00 0.00 0.00
University endowment
1.50 1.50 1.50 1.50 1.50 1.50 1.50
Athletics 36.50 42.50 42.50 52.50 60.50 65.40 80.40 Health and Wellness Center
0.00 0.00 0.00 0.00 0.00 125.97 125.97
Total 80.50 86.50 86.50 86.50 124.50 227.87 313.87
Student Government Activity Fee
04-05 05-06 06-07 07-08 08-09
09-10
10-11
Art Gallery 1.75 1.93 2.90 2.90 2.90 0.00 0.00 Theatre Arts 2.61 2.61 2.61 2.61 2.61 2.61 2.61 Music 2.75 2.75 3.50 3.50 3.50 0.00 3.50 Student Tours 3.07 3.07 3.07 3.07 3.07 3.07 4.00 Student Government Association
16.60 16.60 16.60 21.00 27.00 27.00 27.00
Student Activities 8.20 8.20 10.00 15.00 25.00 25.00 25.00 Publications 8.08 8.08 10.08 10.08 10.08 10.08 10.08 KMSU 3.25 3.25 3.25 3.25 3.25 3.25 3.25 Placement 9.80 9.80 17.00 17.00 17.00 22.00 26.00 Fitness Center 0.00 5.00 25.00 25.00 25.00 25.00 45.00 Homecoming 0.00 4.00 4.00 6.00 9.00 9.00 9.00 Multicultural Center 2.00 2.00 2.00 4.00 4.00 4.00 4.00 Building Renovations 10.00 10.00 10.00 10.00 10.00 10.00 10.00 Orientation 2.00 2.00 2.00 0.00 0.00 0.00 0.00 Reserve 2.03 2.03 2.03 2.03 2.03 0.00 0.00 Student Clubs 0.00 2.00 2.00 2.00 5.00 5.00 5.00 Hockey Club 0.00 5.00 7.00 7.00 10.00 10.00 12.00 Mentoring 0.00 0.00 0.00 1.50 1.50 1.50 1.50 Tutoring 0.00 0.00 0.00 3.00 3.00 3.00 3.00
Beaver Athletic Band 0.00 0.00 0.00 0.00 2.50 2.50 2.90
Total 72.14 88.32 123.04 138.94 166.44 163.01 196.34Data Source: Office of the Vice President for Student Services – VPSS Student Handbook
http://www.minotstateu.edu/student_handbook.pdf

- 72 -
Type of Aid and Dollar Amount by Year
Academic Year
Work Study
Perkins SEOG Pell Grant Stafford
Loan Total
1999-00 212,062 464,597 116,571 2,451,964 7,061,669 10,306,863
2000-01 217,063 397,089 114,784 2,653,456 7,587,671 10,970,063
2001-02 203,240 424,820 119,090 3,082,967 7,946,557 11,776,674
2002-03 235,136 600,835 151,777 3,482,579 8,158,218 12,628,545
2003-04 280,767 620,393 160,088 3,373,066 9,837,158 14,271,472
2004-05 211,054 609,178 119,375 3,179,660 9,197,139 13,316,406
2005-06 204,128 390,183 158,731 2,778,715 11,300,779 14,832,536
2006-07 169,616 308,403 113,024 2,614,624 10,613,747 13,819,414
2007-08 147,415 441,995 110,400 2,709,891 11,054,729 14,464,420
2008-09 123,373 457,753 122,255 2,744,696 11,369,905 14,817,982
2009-10 161,269 486,816 119,050 3,886,671 11,537,403 16,191,209
Data Source: Minot State University Office of Financial Aid and previously released MSU Factbooks.
\
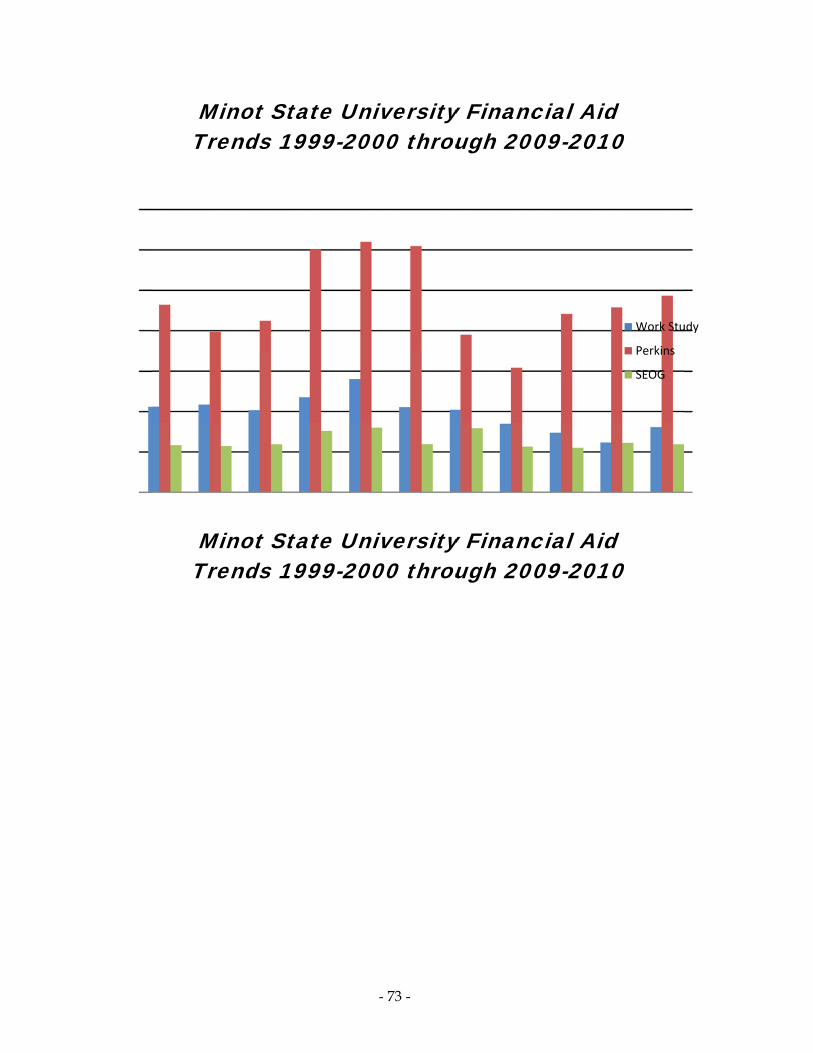
MinTre
MinTre
inot Staends 19
inot Staends 19
-
ate Univ999-200
ate Univ999-200
- 73 -
iversity00 throu
iversity00 throu
y Financough 200
y Financough 200
cial Aid009-201
cial Aid009-201
d 10
d 10
Work Stu
Perkins
SEOG
S
udy
Pell Grant
Stafford Loan

- 74 -
Minot State University
Information Resources
Data for the Gordon B. Olson Library obtained through the library.
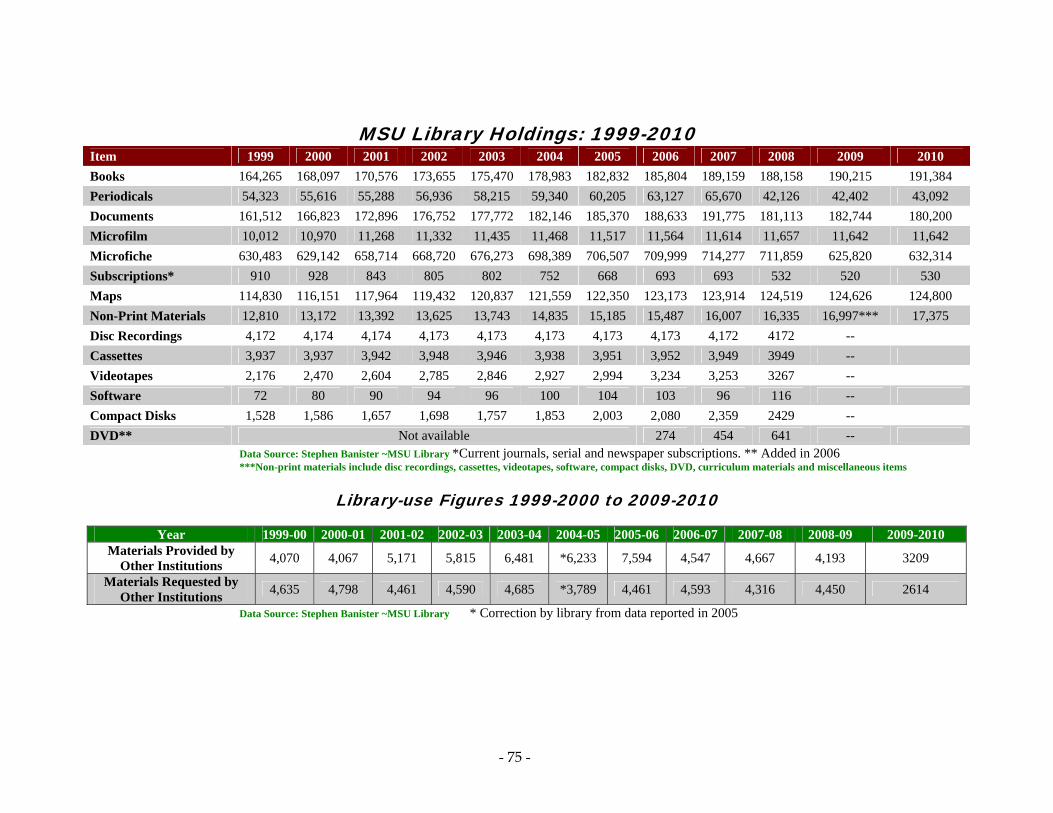
- 75 -
MSU Library Holdings: 1999-2010 Item 1999 2000 2001 2002 2003 2004 2005 2006 2007 2008 2009 2010
Books 164,265 168,097 170,576 173,655 175,470 178,983 182,832 185,804 189,159 188,158 190,215 191,384
Periodicals 54,323 55,616 55,288 56,936 58,215 59,340 60,205 63,127 65,670 42,126 42,402 43,092
Documents 161,512 166,823 172,896 176,752 177,772 182,146 185,370 188,633 191,775 181,113 182,744 180,200
Microfilm 10,012 10,970 11,268 11,332 11,435 11,468 11,517 11,564 11,614 11,657 11,642 11,642
Microfiche 630,483 629,142 658,714 668,720 676,273 698,389 706,507 709,999 714,277 711,859 625,820 632,314
Subscriptions* 910 928 843 805 802 752 668 693 693 532 520 530
Maps 114,830 116,151 117,964 119,432 120,837 121,559 122,350 123,173 123,914 124,519 124,626 124,800
Non-Print Materials 12,810 13,172 13,392 13,625 13,743 14,835 15,185 15,487 16,007 16,335 16,997*** 17,375
Disc Recordings 4,172 4,174 4,174 4,173 4,173 4,173 4,173 4,173 4,172 4172 --
Cassettes 3,937 3,937 3,942 3,948 3,946 3,938 3,951 3,952 3,949 3949 --
Videotapes 2,176 2,470 2,604 2,785 2,846 2,927 2,994 3,234 3,253 3267 --
Software 72 80 90 94 96 100 104 103 96 116 --
Compact Disks 1,528 1,586 1,657 1,698 1,757 1,853 2,003 2,080 2,359 2429 --
DVD** Not available 274 454 641 -- Data Source: Stephen Banister ~MSU Library *Current journals, serial and newspaper subscriptions. ** Added in 2006 ***Non-print materials include disc recordings, cassettes, videotapes, software, compact disks, DVD, curriculum materials and miscellaneous items
Library-use Figures 1999-2000 to 2009-2010
Year 1999-00 2000-01 2001-02 2002-03 2003-04 2004-05 2005-06 2006-07 2007-08 2008-09 2009-2010 Materials Provided by
Other Institutions 4,070 4,067 5,171 5,815 6,481 *6,233 7,594 4,547 4,667 4,193 3209
Materials Requested by Other Institutions
4,635 4,798 4,461 4,590 4,685 *3,789 4,461 4,593 4,316 4,450 2614
Data Source: Stephen Banister ~MSU Library * Correction by library from data reported in 2005
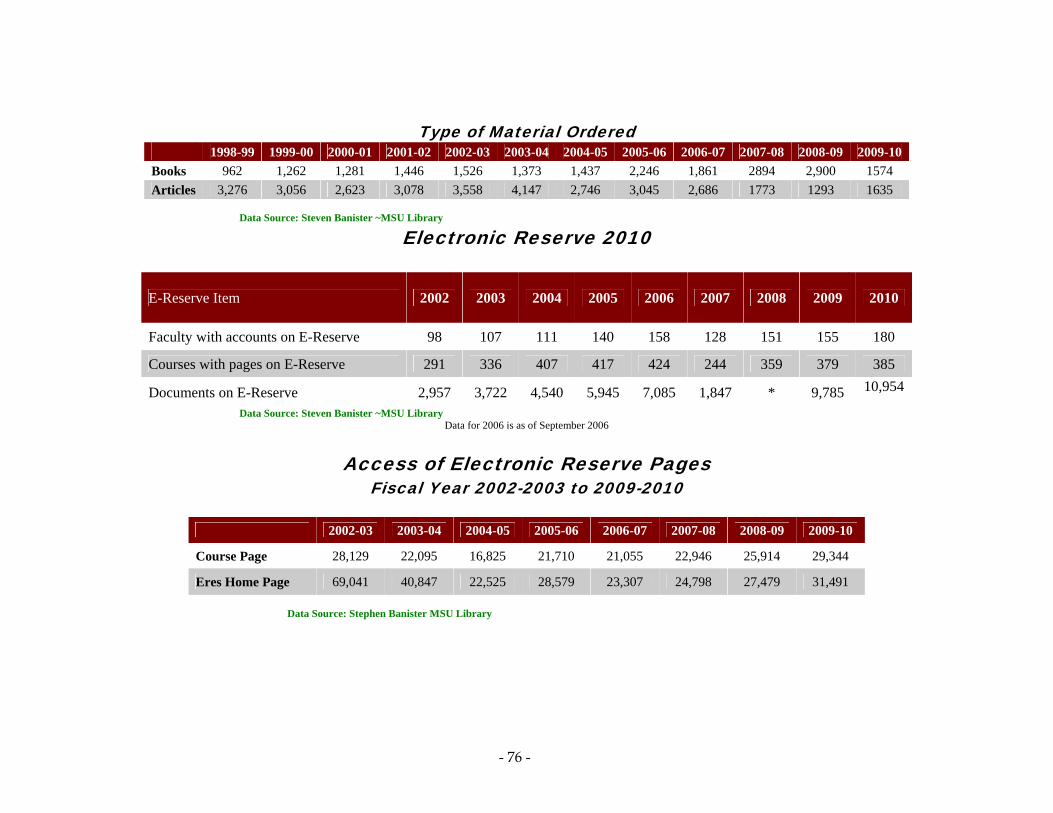
- 76 -
Type of Material Ordered 1998-99 1999-00 2000-01 2001-02 2002-03 2003-04 2004-05 2005-06 2006-07 2007-08 2008-09 2009-10
Books 962 1,262 1,281 1,446 1,526 1,373 1,437 2,246 1,861 2894 2,900 1574
Articles 3,276 3,056 2,623 3,078 3,558 4,147 2,746 3,045 2,686 1773 1293 1635
Data Source: Steven Banister ~MSU Library
Electronic Reserve 2010
E-Reserve Item 2002 2003 2004 2005 2006 2007 2008
2009
2010
Faculty with accounts on E-Reserve 98 107 111 140 158 128 151 155 180
Courses with pages on E-Reserve 291 336 407 417 424 244 359 379 385
Documents on E-Reserve 2,957 3,722 4,540 5,945 7,085 1,847 * 9,785 10,954
Data Source: Steven Banister ~MSU Library Data for 2006 is as of September 2006
Access of Electronic Reserve Pages Fiscal Year 2002-2003 to 2009-2010
2002-03 2003-04 2004-05 2005-06 2006-07 2007-08 2008-09 2009-10
Course Page 28,129 22,095 16,825 21,710 21,055 22,946 25,914 29,344
Eres Home Page 69,041 40,847 22,525 28,579 23,307 24,798 27,479 31,491
Data Source: Stephen Banister MSU Library

- 77 -
MSU Book Expenditures
Year 1998-99 1999-00 2000-01 2001-02 2002-03 2003-04 2004-05 2005-06 2006-07 2007-08 2008-09 2009-10
Book Expenditure $109,256.25 $103,264.20 $83,462.90 $91,303.35 $42,977.27 $78,832.53 $105,871.33 $96,666.05 $97,099.08 60,283.14 $59,243.06 60,381.21
Items Ordered 2,483 2,593 2,278 2,341 1,311 2,514 3,849 2,600 2,945 1,228 1,582 1,380 Average Cost/Book $44.00 $39.82 $36.64 $39.00 $32.78 $31.36 $27.51 $37.18 $32.97 $49.09 $37.45 $43.75
Data Source: Stephen Banister ~MSU Library
Circulation of Library Materials
1998-99 1999-00 2000-01 2001-02 2002-03 2003-04 2004-05 2005-06 2006-07 2007-08 2008-09 2009-10
Number 35,179 32,507 31,025 29,264 29,487 30,521 30,468 23,377 21,111 18,919 20,246* 19,489
% Chg -25.0 -7.6 -4.6 -5.7 0.76 3.5 -0.2 -23.3 -9.7 -10.3 7.0 -3.7 Data Source: Stephen Banister~MSU Library http://www.csgnetwork.com/percentchangecalc.html Percentage Change Calculator *Includes item renewals
Circulation of Material by User Class
User 2000-01 2001-02 2002-03 2003-04 2004-05 2005-06 2006-07 2007-08 2008-09 2009-10
Students 21,220 19,510 19,629 21,022 21,076 15,257 14,058 13,334 12,641 12,714
Faculty 6,296 6,461 6,707 6,279 6,447 6,216 5,672 4,266 5,024 5007
Local Patron 1,540 1,322 1,261 1,108 1,001 1,022 469 639 759* 969
Interlibrary Loan
Not reported 912 680 790* 799
Data Source: Stephen Banister ~MSU Library *Includes item renewals

- 78 -
Information Technology Central (ITC) FACTBOOK: Technology at Minot State University Information Technology (IT) is a strategic necessity for Minot State University. Fundamental tools (e‐mail, calendaring, file sharing, Web access, etc.) are important for administrative, academic, research functions and day‐to‐day operations. High speed networking, high performance computing, collaboration voice and data tools, and other advanced technology services create innovative opportunities for the institution. A reliable and redundant network infrastructure is the backbone on which all other services depend. IT infrastructure refers to the entire technology architecture that supports student, faculty and staff computing activities on campus and from a distance. Components that make up the current technology architecture include, but are not limited to, switched and routed network backbone, wireless Internet access, production support servers and appliances (e‐mail, calendar and voicemail integration, file and print, backup, Web, network support, directory services, authentication, firewall, filtering/bandwidth management, intrusion detection, patch management, antivirus gateway, spam filtering, remote access control, rapid application deployment, network/application resource monitoring and secure network access). The network infrastructure is the key component to support expanding technology development across campus. The wired network needs to remain a reliable, robust and secure transport system to meet the needs of the campus community and support access to the latest voice, data and video technology. Today, all edge switches support transfer rates up to 1 Gigabyte per second (1000 Mbps) from the core to the desktop. A planned centralized data center and fiber rebuild will improve overall efficiencies and performance and bring core transfer rates to 10 Gigabytes per second (Gbps). Infrastructure holds information technology systems together and allows systems to communicate with each other over a network. MSU participates in STAGENet, the state‐funded wide‐area network (WAN) consortium. STAGENet offers reliable, cost‐effective network services, enables convergence of voice, data and video, and provides linkage through Internet2 and the Northern Tier Network to national and international research and development networks. A critical component of the current and future technology infrastructure is security. In the past, access to computing and network resources was maintained in a relatively controlled environment with minimal remote or online access. Making information available over the network and Web has increased the risk of unauthorized access or inappropriate use of information. Data security measures have been implemented to secure data, especially with regard to the campus document imaging system. ImageNow has alleviated the time‐consuming inefficiencies of manually filing and retrieving documents for the financial aid, registrar’s and enrollment services offices.. User authentication is required to access the campus wireless network. The campus ID card system is designed to simplify access to services, events and secure locations throughout campus. Security cameras are strategically located in campus buildings and outside in view of
- 79 -
open parking lots, etc., to maximize visual security for all campus constituents. Other security and data protection initiatives in place relate to regular patching of critical systems, robust antivirus and SPAM filtering and reliable archives (real‐time offsite storage, disk‐to‐disk‐to‐tape) of important data in the event of hardware or application failure. The Notifind emergency notification system is in place to ensure timely notifications to all faculty, staff and students in the event of an emergency. Blue lights, campus‐wide speaker system and “panic” buttons, located in strategic areas, are currently in the planning stage. Information technology is an important component of the instructional and learning experience and is integral to research, teaching and learning. MSU supports over 350 computers in twelve generalaccess and teaching labs on campus and at the Minot Air Force Base Education Center. Software for campus labs is distributed and maintained from a common set of software images, which provides timely distribution of software images, rapid install application packages and critical Windows and antivirus signature file updates. Numerous niche labs exist in support of specialized training for students (arts, sciences, humanities, nursing, education, business, etc.). Internet‐capable learning spaces and kiosks are strategically located across campus to engage informally students in learning opportunities. Computer systems equipped with assistive technologies including Jaws, ZoomText, 21‐inch monitors, monitor lifts, etc., are available in open‐access computer labs for persons with disabilities. Each student has a campus Live@Edu e‐mail account, hosted by Microsoft, to receive official campus communications regarding add/drop deadlines, registration information, financial aid, campus events, emergency notices and more. The Live@Edu account provides access to additional services including online space for file storage, file sharing and collaboration. Students attending Minot State University join a community of people devoted to creating and sharing information — activities that can be enhanced by information technology. Whether a full‐ or part‐time student, living on campus or commuting, technology is available that allows for communication, personal development and getting together (in person and virtually). BlackBoard CE 8 is the campus course management system supporting over 200 Web‐based courses as well as “blended courses” in which faculty enhance their face‐to‐face classes with interactive online learning experiences. Six‐degree programs are currently available completely online. Online orientation and full library services are available to all students, whether on campus or taking classes from a distance. A lecture‐capture solution that integrates with Blackboard is being proposed to further connect the physical classroom experience with the online environment. Collaborative teaching tools provide an interactive and engaged teaching and learning environment for faculty and students. Microsoft sharepoint services creates a single access point for faculty and students to engage in document sharing and team‐based learning. Other Web‐based collaboration tools are available to students, staff and faculty including blogs and wiki sites. Maple T.A. complements the online course management system by providing Web‐based testing and assessment targeted for mathematics, science or any course that requires mathematics. An Adobe Connect meeting server is available for use by faculty and administrators to bring real‐world functionality to online meetings and provide faculty and students the opportunity to communicate and collaborate instantly. A majority of the classrooms on campus are equipped with permanently installed video projection systems and other technology enhancements. Classroom technology, whether

- 80 -
permanently installed or delivered on demand, is available in all academic buildings. Five classroom locations have videoconferencing capability, including high definition. A full‐time IVN coordinator provides the scheduling and daily support for all video‐enabled classrooms. IT staff register and certify the required wiring and equipment for new video‐enhanced classrooms. Videoconferencing software is available for both PCs and Macs to allow users to join a traditional IVN class in session from their home or office or collaborate via “Meet Me,” thereby, bridging the “on site” requirement gap. Centralized IT staff provides support for a broad range of technology‐enhanced services for faculty, staff and students. Increased availability of and access to computing resources requires equally robust support services that make it easier for all students to succeed. MSU recognizes the strong connection between the quality of education and the quality of technology services available to students. ITC is a centrally located service organization comprised of a director, senior systems administrator, network operations manager, campus lab/desktop coordinator, electronics specialist, help desk coordinator, wiring technician and Web designer/developer. In addition to working in their areas of specialization, all technicians provide desktop support and actively test and evaluate new server‐ and network‐based technologies to achieve increased flexibility and improve system responsiveness. The help desk is a significant component of ITC. The office is open six days per week and is the university's first line of support relative to computer software and hardware issues, the use of instructional technology, access to server support services and resolution of network‐related problems. Help desk services for students include hardware and software installation, equipment checkout (laptop, desktop, digital camera, projector, mini hub, etc.), removal of spyware and computer viruses, file storage, Web space, software downloads, etc. McAfee and other software titles are available to all students free of charge. Academic pricing for many Microsoft and Adobe/Macromedia software titles is available through a partnership with Barnes & Noble and Journey Ed. Wired and wireless Internet access is available in the residence halls and across campus free of charge. There are over 1,200 active data ports and 60 wireless access points. MSU has implemented numerous information services and systems, transforming the way the campus engages in educational and business processes. Active‐directory authentication streamlines the process for rolling out new and innovative services. The 18‐year‐old Avaya telephone system has been replaced with the Shoretel system to provide call management. Microsoft Exchange Server currently provides e‐mail, calendaring and voicemail on a single integrated system. Exchange along with Microsoft Office Communications Server (OCS) for full “unified communications” is a major accomplishment for Minot State University. Unified communications simplifies and improves the way employees communicate. When a staff member receives a voicemail message, he or she can choose how to access it, whether through an e‐mail client or from landline or cell phone. A staff member is able to determine the sender’s availability or “presence” and respond immediately through instant message, audio call or video conference. Unified communications extends that same functionality to any telephone or mobile device. Filename: Facbook_IT_fy10 Rev: 01/05/2011 Data Source: Cathy Horvath, information technology director and Kris Warmoth, dean of CEL

- 81 -
Data Sources
Data utilized to compile information for the Minot State University 2010 Fact Book include the following sources:
o Academic and Institutional Projects, Minot State University
o Advancement, Minot State University
o Student Affairs, Minot State University
o Alumni Office, Minot State University
o Business Office, Minot State University
o Center for Extended Learning, Minot State University
o Computer Center, Minot State University
o Gordon B. Olson Library, Minot State University
o Grants and Contracts Office, Minot State University
o Information Technology Center, Minot State University
o MSU Fact Books – 1998 through 2009
o MSU Integrated Postsecondary Education Data Statistics Reports – Registrar’s Office
o MSU Fourth Week Reports, September 2010
o North Dakota University System Office, Bismarck, ND
o President’s Office, Minot State University
o Registrar’s Office, Minot State University
o Undergraduate Catalog, Minot State University
o United States Department of Education Institute of Education Sciences, National
Center for Education Statistics, Integrated Postsecondary Education Data System (IPEDS)

- 82 -
Glossary
The following definitions are taken directly from the U.S. Department of Education’s NCES/IPEDS Web site. For more definitions, use IPEDS Web site: http://nces.ed.gov/ipeds/glossary/index.asp?charindex Degree: An award conferred by a college, university or other postsecondary education institution as official recognition for the successful completion of a program of studies. First-year: A student who has completed less than the equivalent of one full year of undergraduate work; that is, less than 30 semester hours (in a 120-hour degree program) or less than 900 contact hours. Freshman: A first-year undergraduate student. Full-time Equivalent: A measurement equal to one student enrolled full-time for one academic year. Total FTE enrollment includes full-time plus the calculated equivalent of the part-time enrollment. The full-time equivalent of the part-time students can be estimated using different factors depending on the type and control of institution and level of student. Full-time Student: Undergraduate — a student enrolled for 12 or more semester credits, or 12 or more quarter credits, or 24 or more contact hours a week each term. Graduate — a student enrolled for nine or more semester credits, or nine or more quarter credits, or a student involved in thesis or dissertation preparation that is considered full-time by the institution. Graduate: A student who holds a bachelor's or first-professional degree or equivalent, and is taking courses at the post-baccalaureate level. These students may or may not be enrolled in graduate programs. Graduation Rate: The rate required for disclosure and/or reporting purposes under Student Right-to-Know policy. This rate is calculated as the total number of completers within 150 percent of normal time divided by the revised cohort minus any allowable exclusion. Retention Rate: A measure of the rate at which students persist in their educational program at an institution, expressed as a percentage. For four-year institutions, this is the percentage of first-time bachelor’s (or equivalent) degree-seeking undergraduates from the previous fall who are again enrolled in the current fall. For all other institutions, this is the percentage of first-time degree/certificate-seeking students from the previous fall who either re-enrolled or successfully completed their program by the current fall. Undergraduate: A student enrolled in a four- or five-year bachelor's degree program, an associate's degree program or a vocational or technical program below the baccalaureate.