2007 Fuel Cell Technologies Market Report
22
2007 FUEL CELL TECHNOLOGIES MARKET REPORT JULY 2009
Transcript of 2007 Fuel Cell Technologies Market Report

2007 FUEL CELL TECHNOLOGIES MARKET REPORT
JULY 2009

Table of Contents
Introduction 1 Worldwide Fuel Cell Shipments Increased 70% from 2006 to 2007 3 Percent Production Increase Highest in North America in 2007 4 North American Units Shipped Increased Three-Fold 6 Commercial Viability of Stationary Units Accompanied by Fewer Demonstrations 7 Large Stationary Units Continue to Increase in Size 8 Small Stationary Shipments Increase Led by Increases in PEM Units Manufactured in North America 9
Fuel Rulemaking Improves DMFC Outlook 10 Forklift Shipments Dipped in Preparation for Commercialization 11 GM, Honda Join Daimler in Targeting Deployment of Hundreds of New Fuel Cell Vehicles 12 Delivered Hydrogen and Electrolysis Outpace Natural Gas for New Hydrogen Fueling Stations 13 Studies Indicate Potential of Fuel Cell and Hydrogen Technologies and Policy Needs to Meet Potential 14 Appendix: Sources of Data Presented in this Report 17
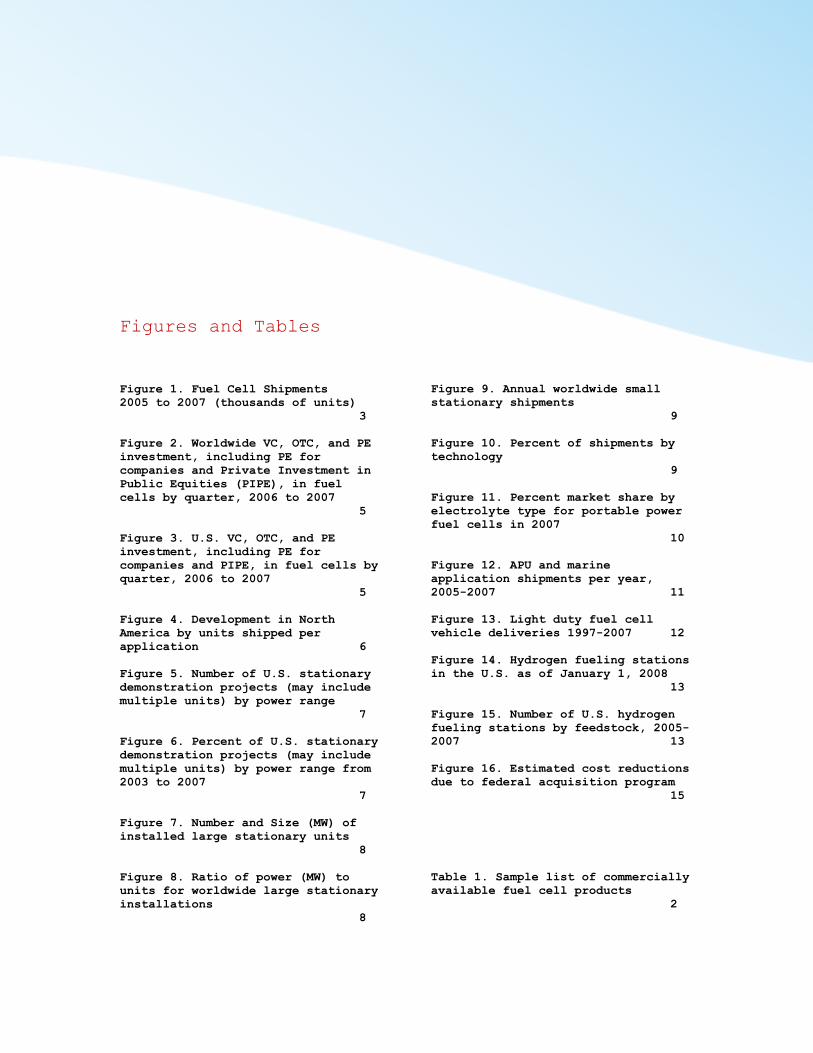
Figures and Tables
Figure 1. Fuel Cell Shipments 2005 to 2007 (thousands of units) 3 Figure 2. Worldwide VC, OTC, and PE investment, including PE for companies and Private Investment in Public Equities (PIPE), in fuel cells by quarter, 2006 to 2007 5 Figure 3. U.S. VC, OTC, and PE investment, including PE for companies and PIPE, in fuel cells by quarter, 2006 to 2007 5 Figure 4. Development in North America by units shipped per application 6 Figure 5. Number of U.S. stationary demonstration projects (may include multiple units) by power range 7 Figure 6. Percent of U.S. stationary demonstration projects (may include multiple units) by power range from 2003 to 2007 7 Figure 7. Number and Size (MW) of installed large stationary units 8 Figure 8. Ratio of power (MW) to units for worldwide large stationary installations 8
Figure 9. Annual worldwide small stationary shipments 9 Figure 10. Percent of shipments by technology 9 Figure 11. Percent market share by electrolyte type for portable power fuel cells in 2007 10 Figure 12. APU and marine application shipments per year, 2005-2007 11 Figure 13. Light duty fuel cell vehicle deliveries 1997-2007 12 Figure 14. Hydrogen fueling stations in the U.S. as of January 1, 2008 13 Figure 15. Number of U.S. hydrogen fueling stations by feedstock, 2005-2007 13 Figure 16. Estimated cost reductions due to federal acquisition program 15 Table 1. Sample list of commercially available fuel cell products 2

Acknowledgements
For their support and guidance, the authors thank the staff of the U.S. DOE’s Hydrogen, Fuel Cell and Infrastructure Technologies Program, especially Pete Devlin, Fred Joseck, JoAnn Milliken, Mike Mills, and Sunita Satyapal. For reviewing elements of this report, we thank Bob Rose of the U.S. Fuel Cell Council, as well as JoAnn Milliken and Sunita Satyapal of DOE. Special thanks go to the staff and researchers at the California Fuel Cell Partnership, Chevron, Fuel Cells 2000, Fuel Cell Today, h2stations.org, the National Hydrogen Association, the National Renewable Energy Laboratory, New Energy Finance, Next Energy, Pacific Northwest National Laboratory, and the University of Delaware, who have collected data on fuel cell technologies, without which this report would not be possible. Authors This report was compiled primarily by Kevin McMurphy of SENTECH, Inc., with significant guidance and input from Kerry-Ann Adamson and Lisa Callaghan Jerram of Fuel Cell Today.

1
Introduction
The fuel cell industry, which has experienced continued increases in sales, is an emerging clean energy industry with the potential for significant growth in the stationary, portable, and transportation sectors. Fuel cells produce electricity in a highly efficient electrochemical process from a variety of fuels with low to zero emissions. This report describes data compiled in 2008 on trends in the fuel cell industry for 2007 with some comparison to two previous years. The report begins with a discussion of worldwide trends in units shipped and financing for the fuel cell industry for 2007. It continues by focusing on the North American and U.S. markets. After providing this industry-wide overview, the report identifies trends for each of the major fuel cell applications – stationary power, portable power, and transportation – including data on the range of fuel cell technologies – polymer electrolyte membrane fuel cell (PEMFC), solid oxide fuel cell (SOFC), alkaline fuel cell (AFC), molten carbonate fuel cell (MCFC),
phosphoric acid fuel cell (PAFC), and direct-methanol fuel cell (DMFC) – used for these applications. Stationary power includes any application in which the fuel cells are operated at a fixed location, either for primary or for backup power. Portable power applications include the use of fuel cells for any portable device. Transportation applications include motive power and auxiliary power units (APUs) for highway and off-road vehicles, as well as specialty vehicles (e.g. forklifts), which are typically not included in the transportation sector. Next, the report discusses industry trends in hydrogen stations for automotive applications. Finally, the report examines other news relevant to the industry, including hydrogen and fuel cell studies and tax incentives for the use of fuel cells and combined heat and power (CHP) technologies.
Acronym List
AFC alkaline fuel cell AFFC Automotive Fuel Cell
Collaborative APU auxiliary power unit CHP combined heat and
power DMFC direct methanol fuel
cell DOE Department of Energy FCV fuel cell vehicle MCFC molten carbonate fuel
cell NRC National Research
Council ORNL Oak Ridge National
Laboratory PAFC phosphoric acid fuel
cell PEM polymer electrolyte
membrane R&D research and
development RD&D research,
development, and demonstration
SOFC solid oxide fuel cell UPS uninterruptible power
supply USFCC U.S. Fuel Cell
Council

2
Because fuel cell and hydrogen technologies are still part of an emerging industry, much of the industry effort is funded through government research, development, and demonstration (RD&D) programs. However, as this report addresses the trends in the commercial market for fuel cells, these programs are not included. The U.S. Department of Energy (DOE) compiled the data in this report from a variety of sources. These sources include Fuel Cell Today, New Energy Finance, Fuel Cells 2000, and the U.S. Fuel Cell Council (USFCC). The data, a summary of which is presented in the Appendix, represent a subset of all fuel cell industry players. Additionally, the limited data presented in this report highlight the need for a larger set of publicly available data, which DOE plans to obtain in fiscal year 2009. Emphasis, therefore, should be placed on trends suggested by the data rather than the absolute values. Finally, each section of this document focuses on historical market information, with an emphasis on 2007, and does not seek to forecast future trends. Commercial Products Available from Many Fuel Cell Producers
The U.S. Fuel Cell Council compiled an updated list in 2007 of commercially available products. In order to be considered commercial, the product must meet three criteria: (1) offered for sale to the public; (2) offered with a written warranty, supported by service capability; and (3) meets approved industry standards or is certified by an established industry body. Commercial products are offered in all three applications using many of the available fuel cell types. A sample of these commercial products includes:
Table 1: Sample list of commercially available fuel cell products
Manufacturer Product Name Application Electrolyte Output
Ballard Mark 902 Transportation PEM 85 kW Fuel Cell Energy
DFC 1500MA Stationary MC 1.2 MW
Hydrogenics HyPM Power Packs Portable PEM/hybrid 12 kW IdaTech ElectraGen 5 Stationary PEM 5 kW Jadoo N-Gen Portable PEM 100 W 12 VDC MTI Micro Mobion 30M Portable PEM 30 W Nuvera HDL-82 Transportation PEM 82 kW Plug Power GenDrive – 3000 Series Transportation PEM 9 – 11 kW ReliOn T-1000 Stationary PEM 600 – 1200 kW SFC EFOY 1200 Transportation DMFC 1,200 Wh/day UltraCell XX25 Portable PEM 25 W UTC Power Pure Cell™ Model 200 Stationary PA 200 kW

3
Worldwide Fuel Cell Shipments Increased 70% from 2006 to 2007
The worldwide fuel cell industry saw increased shipments in 2007 (Figure 1, from the 2008 Fuel Cell Today Industry Review), with growth in each of the three major segments (transportation, portable power, and stationary applications) and across each electrolyte type. Shipments rose 70% from more than 7,000 units in 2006 to approximately 12,000 units in 2007. Of the three segments, transportation shipments increased by the largest percentage, seeing nearly twice as many shipments in 2007 as in 2006. This increase was due primarily to increased shipments of APUs for both marine and recreational vehicles, such as SFC’s EFOY™. Shipments for stationary applications have seen steady growth of roughly 1,000 units per year for the past two years, reflecting a trend from demonstration units to commercial units. These commercial units include the DFC line of fuel cells from Fuel Cell Energy and the Pure Cell™ System from UTC Power. Meanwhile, growth in the portable power segment has been mixed, with a large increase in units shipped from 2006 to 2007, including a significant number of toys and demonstration kits. Copyright: Fuel Cell Today
Figure 1. Fuel Cell Shipments 2005 to 2007 (thousands of units)
4
Percent Increase in Units Shipped Highest in North America in 2007
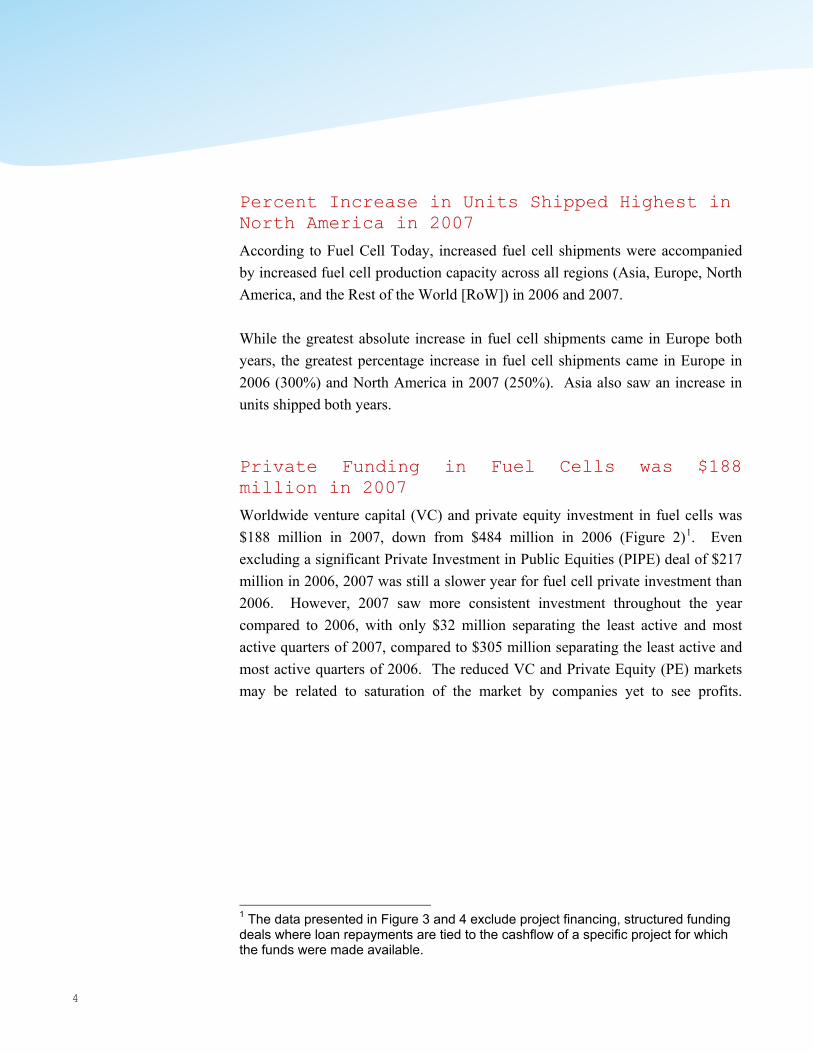
According to Fuel Cell Today, increased fuel cell shipments were accompanied by increased fuel cell production capacity across all regions (Asia, Europe, North America, and the Rest of the World [RoW]) in 2006 and 2007. While the greatest absolute increase in fuel cell shipments came in Europe both years, the greatest percentage increase in fuel cell shipments came in Europe in 2006 (300%) and North America in 2007 (250%). Asia also saw an increase in units shipped both years. Private Funding in Fuel Cells was $188 million in 2007
Worldwide venture capital (VC) and private equity investment in fuel cells was $188 million in 2007, down from $484 million in 2006 (Figure 2)1
1 The data presented in Figure 3 and 4 exclude project financing, structured funding deals where loan repayments are tied to the cashflow of a specific project for which the funds were made available.
. Even excluding a significant Private Investment in Public Equities (PIPE) deal of $217 million in 2006, 2007 was still a slower year for fuel cell private investment than 2006. However, 2007 saw more consistent investment throughout the year compared to 2006, with only $32 million separating the least active and most active quarters of 2007, compared to $305 million separating the least active and most active quarters of 2006. The reduced VC and Private Equity (PE) markets may be related to saturation of the market by companies yet to see profits.

5
Figure 3 shows U.S. private investment for 2006 and 2007. While U.S. private investment accounted for 88% of worldwide investment in 2006, this percentage dropped to 52% in 2007. Furthermore, although U.S. investment accounted for more than 80% of private investment in all quarters of 2006, U.S. investment accounted for less than 75% of private investment in all quarters of 2007.
Source: New Energy Finance
Figure 2. Worldwide Venture Capital (VC), Over-the-Counter (OTC), and Private Equity (PE) investment,
including PE for companies and Private Investment in Public Equities (PIPE), in fuel cells by quarter, 2006 to
2007
Source: New Energy Finance
Figure 3. U.S. VC, OTC, and PE investment, including PE for companies and PIPE, in fuel cells
by quarter, 2006 to 2007
6
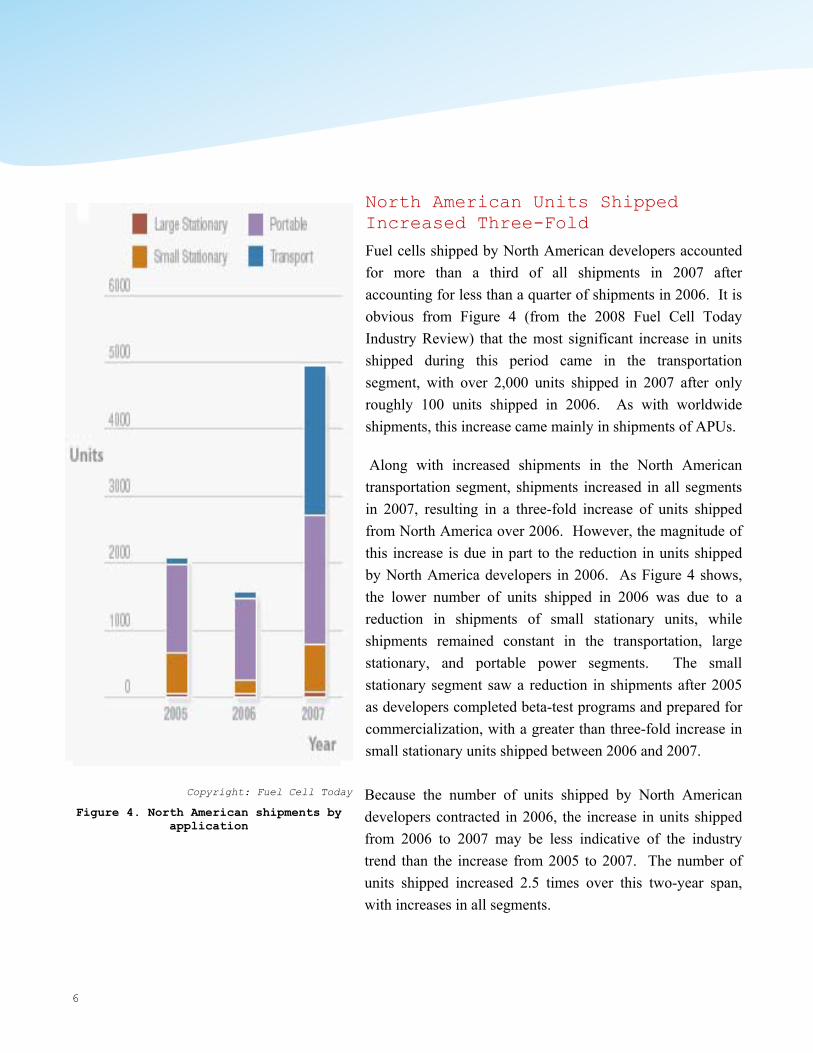
North American Units Shipped Increased Three-Fold
Fuel cells shipped by North American developers accounted for more than a third of all shipments in 2007 after accounting for less than a quarter of shipments in 2006. It is obvious from Figure 4 (from the 2008 Fuel Cell Today Industry Review) that the most significant increase in units shipped during this period came in the transportation segment, with over 2,000 units shipped in 2007 after only roughly 100 units shipped in 2006. As with worldwide shipments, this increase came mainly in shipments of APUs. Along with increased shipments in the North American transportation segment, shipments increased in all segments in 2007, resulting in a three-fold increase of units shipped from North America over 2006. However, the magnitude of this increase is due in part to the reduction in units shipped by North America developers in 2006. As Figure 4 shows, the lower number of units shipped in 2006 was due to a reduction in shipments of small stationary units, while shipments remained constant in the transportation, large stationary, and portable power segments. The small stationary segment saw a reduction in shipments after 2005 as developers completed beta-test programs and prepared for commercialization, with a greater than three-fold increase in small stationary units shipped between 2006 and 2007. Because the number of units shipped by North American developers contracted in 2006, the increase in units shipped from 2006 to 2007 may be less indicative of the industry trend than the increase from 2005 to 2007. The number of units shipped increased 2.5 times over this two-year span, with increases in all segments.
Copyright: Fuel Cell Today
Figure 4. North American shipments by application

7
Commercial Viability of Stationary Units Accompanied by Fewer Demonstrations
In addition to shipments, the number of non-commercial demonstrations can serve as an indicator of commercial viability, with fewer demonstration projects as companies realize commercialization. As shown in Figure 5, the number of U.S. stationary demonstration projects fell from a relatively stable level of more than 50 projects in 2003, 2004, and 2005, to 33 projects in 2006, a decrease of 39%, and then to 10 projects in 2007, a further decrease of almost 70%. The reduction in both demonstration projects and units shipped in 2006 may have signaled a flagging U.S. stationary fuel cell market. However, the rebound in North American small stationary fuel cell shipments in 2007 (Figure 4), coupled with the second decrease in U.S. demonstration projects in 2007, suggests that fuel cell companies used 2006 to prepare for commercialization as beta-test programs came to a close. Regardless of the number of demonstration projects, the proportion of projects in each power range has remained relatively unchanged, as seen in Figure 6. This trend suggests that even as the fuel cell industry begins to experience some commercial success, companies in each stationary market segment continue to see either value in or a need for pre-commercial RD&D.
Source: Fuel Cells 2000
Figure 6. Percent of U.S. stationary demonstration projects (may include multiple units) by power range from 2003 to 2007
Source: Fuel Cells 2000
Figure 5. Number of U.S. stationary demonstration projects (may include multiple units) by power range

8
Large Stationary Units Continue to Increase in Size
While the proportion of U.S. demonstration projects in each power range has not changed since 2003, the size of installed large stationary units worldwide has steadily increased. This increase in installation size has led to an increase in power of installed units per year, even as the number of units has decreased over the past three years, as shown in Figure 7. Subsequently, 2007 saw the continuation of a trend in increasing power of installed units that started in 2001. This trend to units of greater size is demonstrated more clearly by the ratio of power (MW) to units, as shown in Figure 8. This ratio nearly doubled from 2006 to 2007.
Copyright: Fuel Cell Today
Figure 7. Number and aggregate amount (MW) of installed large stationary units
Copyright: Fuel Cell Today
Figure 8. Ratio of power (MW) to units for worldwide large
stationary installations
MW
/ un
it
Year

9
Small Stationary Shipments Increase Led by Increases in PEM Units Manufactured in North America
Even as the number of small stationary units shipped in North America was decreasing in 2006, the number of units shipped worldwide increased from under 1000 in 2005 to over 1500 in 2006. This worldwide trend continued in 2007 with over 2000 units shipped (Figure 9), due in part to the rebound in North American shipments. As seen in Figure 10, the vast majority of these units continue to be PEM technology, with 90% of all units shipped in 2007 using PEM technology, up from 80% in 2003. This segment, for which more than 50% of manufacturing has come from North America, has been dominated by backup and uninterruptible power supply (UPS) units, with a recent upward trend in CHP units. CHP applications have found particular support in Japan, where the Ministry of Economy, Trade and Industry spent ¥3.5 million ($29,000) per unit in 2007 to subsidize the installation of 930 systems, compared to ¥4.5 million ($38,000) per unit in 2006 to subsidize 777 systems.
Copyright: Fuel Cell Today
Figure 10. Percent of shipments by technology Copyright: Fuel Cell Today
Figure 9. Annual worldwide small stationary shipments

10
Fuel Rulemaking Improves DMFC Outlook
In 2007, rulings by two transportation regulatory organizations opened the door for future portable fuel cell markets. The International Civil Aviation Organization (ICAO) modified its rules to allow the use of methanol, butane, and formic acid on airplanes effective January 1, 2007, with publication of the ICAO Technical Instructions for the Safe Transport of Dangerous Goods by Air. While many countries automatically follow the lead of the ICAO, use of these fuels in the U.S. required a subsequent ruling by the U.S. Department of Transportation (DOT). The Pipeline and Hazardous Material Safety Administration agency of DOT issued a proposed rulemaking on September 20, 2007, to modify Title 49 of the Federal Code of Regulations to follow the ICAO ruling. A final rulemaking was expected in 2008, but as of this writing (April 2009), the final rulemaking is still pending. In addition, on November 16, 2007, the ICAO went one step further to approve use of all fuel cells and fuel cell fuels on passenger and cargo aircraft both in cargo and carry-on baggage. This ruling became effective January 1, 2009.
While these rulemakings have improved the outlook for DMFC portable power devices, hydrogen-fueled PEM devices continued to lead the segment in shipments in 2006 and 2007, as shown in Figure 11. PEM units led shipments in this segment due in large part to PEM demonstration kits and toys.
Copyright: Fuel Cell Today
Figure 11. Percent market share by electrolyte type for
portable power fuel cells in 2007

11
Forklift Shipments Dipped in Preparation for Commercialization
According to the Fuel Cell Today Niche Transport Survey, forklift shipments ranked third highest among applications in the niche transportation segment between 2005 and 2007, behind APUs and marine applications. While APU and marine application shipments continued to grow in 2007 (as shown in Figure 12), shipments of forklifts decreased in 2007. However, this decrease in forklift shipments is considered a prelude to commercialization, much as the decrease in small stationary shipments in 2006 preceded a rebound in 2007 as the companies in that segment proceeded with commercialization. Accoring to analysts at Fuel Cell Today, over the next five years, shipments of forklift fuel cells are expected to increase from the current fairly suppressed levels into thousands per annum. This improved market potential is driven by a strong life-cycle cost benefit of using fuel cell forklifts over battery forklifts, based on reduced charge times and improved end-of-shift power for fuel cell forklifts.
Copyright: Fuel Cell Today
Figure 12. APU and marine application shipments per year, 2005-2007
12
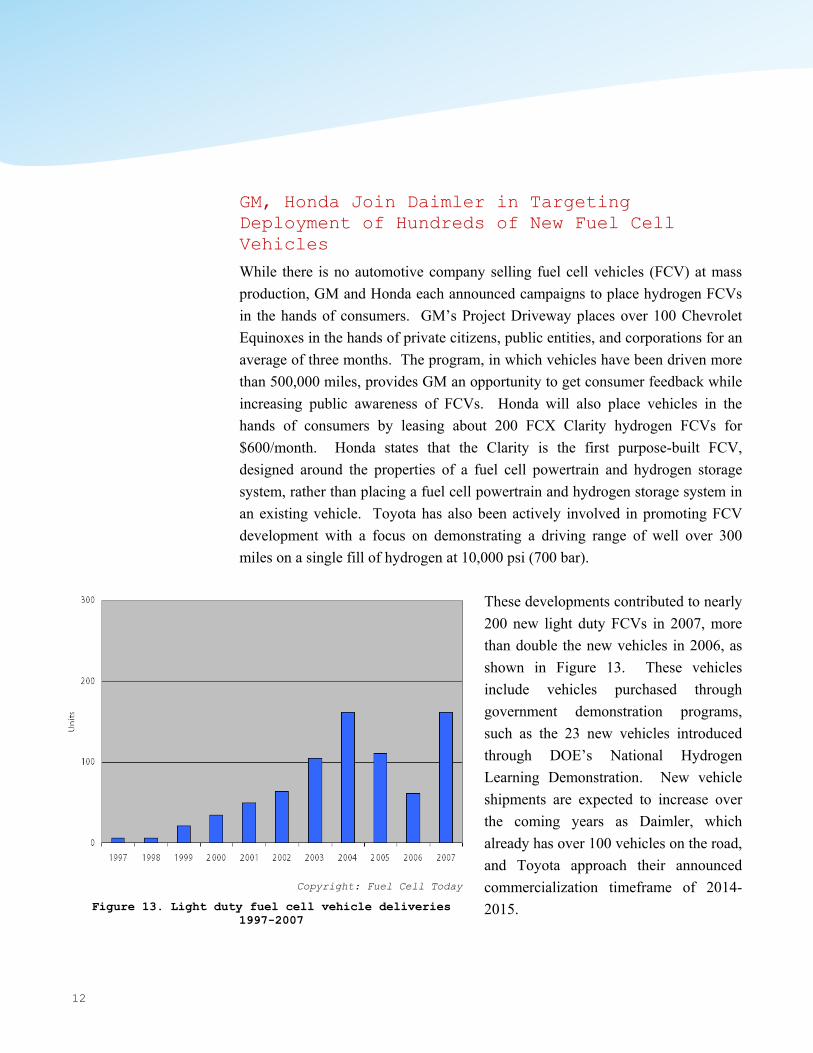
GM, Honda Join Daimler in Targeting Deployment of Hundreds of New Fuel Cell Vehicles
While there is no automotive company selling fuel cell vehicles (FCV) at mass production, GM and Honda each announced campaigns to place hydrogen FCVs in the hands of consumers. GM’s Project Driveway places over 100 Chevrolet Equinoxes in the hands of private citizens, public entities, and corporations for an average of three months. The program, in which vehicles have been driven more than 500,000 miles, provides GM an opportunity to get consumer feedback while increasing public awareness of FCVs. Honda will also place vehicles in the hands of consumers by leasing about 200 FCX Clarity hydrogen FCVs for $600/month. Honda states that the Clarity is the first purpose-built FCV, designed around the properties of a fuel cell powertrain and hydrogen storage system, rather than placing a fuel cell powertrain and hydrogen storage system in an existing vehicle. Toyota has also been actively involved in promoting FCV development with a focus on demonstrating a driving range of well over 300 miles on a single fill of hydrogen at 10,000 psi (700 bar).
These developments contributed to nearly 200 new light duty FCVs in 2007, more than double the new vehicles in 2006, as shown in Figure 13. These vehicles include vehicles purchased through government demonstration programs, such as the 23 new vehicles introduced through DOE’s National Hydrogen Learning Demonstration. New vehicle shipments are expected to increase over the coming years as Daimler, which already has over 100 vehicles on the road, and Toyota approach their announced commercialization timeframe of 2014-2015.
Copyright: Fuel Cell Today
Figure 13. Light duty fuel cell vehicle deliveries 1997-2007

13
Source: Renewable Energy Databook
Figure 14. Hydrogen fueling stations in the U.S. as of January 1, 2008
Delivered Hydrogen and Electrolysis Outpace Natural Gas for New Hydrogen Fueling Stations
A successful transition to hydrogen-fueled vehicles will require a hydrogen fueling infrastructure. There are currently approximately 60 hydrogen fueling stations in the U.S (Figure 14). More than 60 percent of these stations are in California, Michigan, and New York, with more than 40 percent of stations in California alone. New stations were built in six out of 10 regions in 2007. To put these numbers in perspective, there are more than 100 gasoline stations in Washington, DC, alone, and roughly 160,000 stations throughout the country. In addition, there are no commercial hydrogen filling stations. Many of the existing hydrogen filling stations are either private or part of government-funded demonstration projects. In order to establish commercial stations, the cost of hydrogen will have to be competitive with the cost of gasoline. An independent review panel found in 2006 that distributed hydrogen production from reforming natural gas could meet the DOE’s $2 to $3/gge cost target. Distributed production of hydrogen would enable hydrogen FCV introduction without the need for more capital-intensive central production facilities or the delivery infrastructure those facilities require. Despite the cost benefits of distributed hydrogen production from natural gas, the majority of
0
10
20
30
40
50
60
70
1999 2000 2001 2002 2003 2004 2005 2006 2007
Delivered H2
Natural Gas On-Site ReformingUnknown
Multiple Sources
Mobile H2
Electrolysis
Source: Hydrogen Analysis Resource Center
Figure 15. Number of U.S. hydrogen fueling stations by feedstock, 2005-2007
14
new stations in 2006 and 2007 used hydrogen produced on-site from electrolysis or delivered hydrogen (both “Delivered H2”, stations that store delivered hydrogen in on-site storage, and “Mobile H2”, stations that dispense hydrogen from the trailer truck in which the hydrogen is delivered), as seen in Figure 15. Furthermore, only 2 natural gas stations have been added since 2005, while 21 electrolysis and mobile hydrogen fueling stations have been added during that time.
Studies Indicate Potential of Fuel Cell and Hydrogen Technologies and Policy Needs to Meet Potential
As fuel cell and hydrogen technology industry players have announced commercial products and commercialization dates, three studies released in 2007 and 2008 indicate the potential, challenges, and potential solutions to those challenges for commercialization. The National Research Council (NRC) Committee on Assessment of Resource Needs for Fuel Cell and Hydrogen Technologies performed a study of the Transition to Alternative Transportation Technologies - A Focus On Hydrogen.2
2 National Research Council, Transitions to Alternative Transportation Technologies -A Focus on Hydrogen, Pre-publication version available from National Academies website http://www.nap.edu/catalog.php?record_id=12222
This study investigated the maximum practicable number of hydrogen-fueled vehicles in the U.S. by 2020 and beyond, determining the potential benefits of this transition and the costs and policies required to make this transition. The committee found that in a case they called Hydrogen Success, in which the DOE technical targets are met, 2 million FCVs could be on the road by 2020, 60 million by 2035, and 200 million by 2050, roughly 60% of the vehicle fleet. This transition, the study found, would result in a reduction from 150 billion gallons of gasoline per year to 50 billion gallons of gasoline per year in 2050 and 1.7 Gigatons of CO2 per year to 0.7 Gigatons of CO2 per year in the same timeframe. According to the NRC study, government costs for both vehicle subsidies and infrastructure is estimated to be $55 billion over 15 years to enable FCVs to be competitive in the 2023 timeframe. This includes roughly $8 billion for fueling infrastructure and $40 billion for vehicles.

15
Oak Ridge National Laboratory (ORNL) coordinated another study of the barriers to fuel cell vehicle commercialization and the policies required to overcome these barriers.3
Consistent with the NRC study, the ORNL study found that FCV adoption could lead to reductions in U.S. gasoline consumption from 140 billion gallons of gasoline per year to 30 billion gallons of gasoline per year by 2050 and, with carbon policies, reduce CO2 emissions of the U.S. transportation sector from 1.6 Gigatons of CO2 to as little as 0.6 Gigatons of CO2 in the same timeframe. The cost of government incentives to enable this transition was similar to that in the NRC study, ranging from $10 billion to $45 billion from 2012 to 2025, resulting in a sustainable FCV market after 2025 without further government policies. This public investment, coupled with significant private investment, would result in FCVs accounting for as much as 90% of the U.S. light duty vehicle fleet by 2050. However, the study found that without policy incentives for the introduction of FCVs, “the automotive industry would need to invest tens of billions of dollars and sustain billions in annual losses over more than a decade, with profitability delayed until 2022 or beyond.” Such a scenario would make it unlikely that the U.S. would establish a sustainable FCV market. Peak annual costs were estimated to be between $1 and $6 billion. This is roughly similar to the cost for ethanol subsidies which are projected to be $6 billion in 2012. Regardless of cost, there remains controversy over the likelihood of overcoming the challenges to widespread deployment of FCVs, including hydrogen production, delivery and storage as well as fuel cell cost and performance.
As of 2008, a tax credit was available to both business and non-business property owners installing fuel cells for the lesser of $3,000 per kW or 30% of the installed fuel cell cost, requiring that business property owners install fuel cells of greater than 30% electrical efficiency. In addition, a tax credit was available for 30% of the cost (up to $200,000) of stations that dispensed more than 85% hydrogen. As identified earlier, some non-automotive fuel cell applications are closer to commercialization than the light duty FCV market. Another study by ORNL
3 D. Greene, et al., Transition to Hydrogen Fuel Cell Vehicles & the Potential Hydrogen Energy Infrastructure Requirements, Oak Ridge National Laboratory, March 2008, www-cta.cta.ornl.gov/cta/Publications/Reports/ORNL_TM_2008_30.pdf.

16
investigated the effect of government acquisitions on two such a markets: backup power and material handling equipment.4
This study found that a government acquisition program investing between $8 million and $38 million between 2008 and 2020 could reduce the cost of fuel cell technologies by a factor of three in some applications (Figure 16). These cost reductions are a result of economies of scale and learning-by-doing.
Such studies show the potential of sustained “market transformation” activities to increase deployments – to help reduce costs, strengthen a supplier base, enable the required infrastructure, and foster workforce development in fuel cell manufacturing, installation, and support service sectors worldwide.
4 David Greene, ORNL; K.G. Duleep, Energy and Environmental Analysis, Inc., Bootstrapping a Sustainable North American PEM Fuel Cell Industry: Could a Federal Acquisition Program Make a Difference?, 2008.
Source: ORNL
Figure 16. Estimated cost reductions due to federal acquisition program
Appendix: Sources of Data Presented in this Report Worldwide and North American Shipments and Production Capacity
These data were collected by Fuel Cell Today and presented in The 2008 Fuel Cell Today Industry Review. Figures 1 and 4 are presented here in the same format with no additional calculations. The Fuel Cell Today data comes from the company’s proprietary database of fuel cell company activities. All graphs from Fuel Cell Today are being used under copyright agreeement. Further copying or editing of this material from this report is expressly forbidden without prior authorization from Fuel Cell Today. To discuss use of copyrighted images please contact Anissa at [email protected] .
Commercially Available Product Selection
The USFCC maintains a database of commercially available products compiled from its members. This list is available from the USFCC and includes over 40 products from companies in the U.S., Canada, and Europe. Fuel Cell Private Funding
The data presented are from the New Energy Finance Desktop, a product of New Energy Finance. Demonstration Project Trends
Demonstration project data is from the Fuel Cells 2000 State Fuel Cell Database. Large and Small Stationary, Portable, Forklift, and Automotive Fuel Cell Trends
The data in this section are from Fuel Cell Today surveys, available at http://www.fuelcelltoday.com/online/surveys. Figures 7 and 8 are from the 2008 Large Stationary Survey; Figures 9 and 10 from the 2008 Small Stationary Survey; Figure 11 was developed for this report by Fuel Cell Today; Figure 12 from the 2008 Nich Transport Survey: Volume 2; and Figure 13 from the 2008 Light Duty Vehicle Survey. All graphs from Fuel Cell Today are being used under copyright agreeement. Further copying or editing of this material from this report is expressly forbidden without prior authorization from Fuel Cell Today. To discuss use of copyrighted images please contact Anissa at [email protected] . Hydrogen Fueling Stations
Data on hydrogen fueling stations was compiled from Fuel Cells 2000, h2stations.org, the National Hydrogen Association, the California Fuel Cell Partnership, Chevron, the University of Delaware, Next Energy, the Pacific Northwest National Laboratory, and the National Renewable Energy Laboratory.
1 7
Hydrogen, Fuel Cell, and Infrastructure Technologies Web Sites U.S. Department of Energy Hydrogen, Fuel Cells, and Infrastructure Technologies Program www.eere.energy.gov/hydrogenandfuelcells/
Fuel Cell Today www.fuelcelltoday.com
U.S. Fuel Cell Council www.usfcc.com
National Renewable Energy Laboratory Hydrogen and Fuel Cells Research www.nrel.gov/hydrogen
Hydrogen Analysis Resource Center hydrogen.pnl.gov/cocoon/morf/hydrogen
National Hydrogen Association www.hydrogenassociation.org
California Fuel Cell Partnership www.fuelcellpartnership.org
Key Report Contacts For more information on this report, please contact:
Kevin McMurphy, SENTECH Inc. 202-586-8058; [email protected]
Kerry-Ann Adamson, Fuel Cell Today +44 (0)1763 25 6320; [email protected]
Lisa Callaghan Jerram, Fuel Cell Today 301-610-7740; [email protected]
On the CoverFuel cell forklifts—such as this one powered by a system from Hydrogenics—offer a clean, reliable, and cost-effective alternative to incumbent technologies.
Hydrogenics
For more information contact: EERE Information Center1-877-EERE-INF (1-877-337-3463)www.eere.energy.gov/informationcenter
Printed with a renewable-source ink on paper containing at least 50% wastepaper, including 10% post consumer waste.
Prepared by the National Renewable Energy Laboratory (NREL)NREL is a national laboratory of the U.S. Department of EnergyOffice of Energy Efficiency and Renewable EnergyOperated by the Alliance for Sustainable Energy, LLC
DOE/GO-102009-2865July 2009