PEMFC R&D at the DOE Fuel Cell Technologies Program · 1 | Fuel Cell Technologies Program Source:...
22
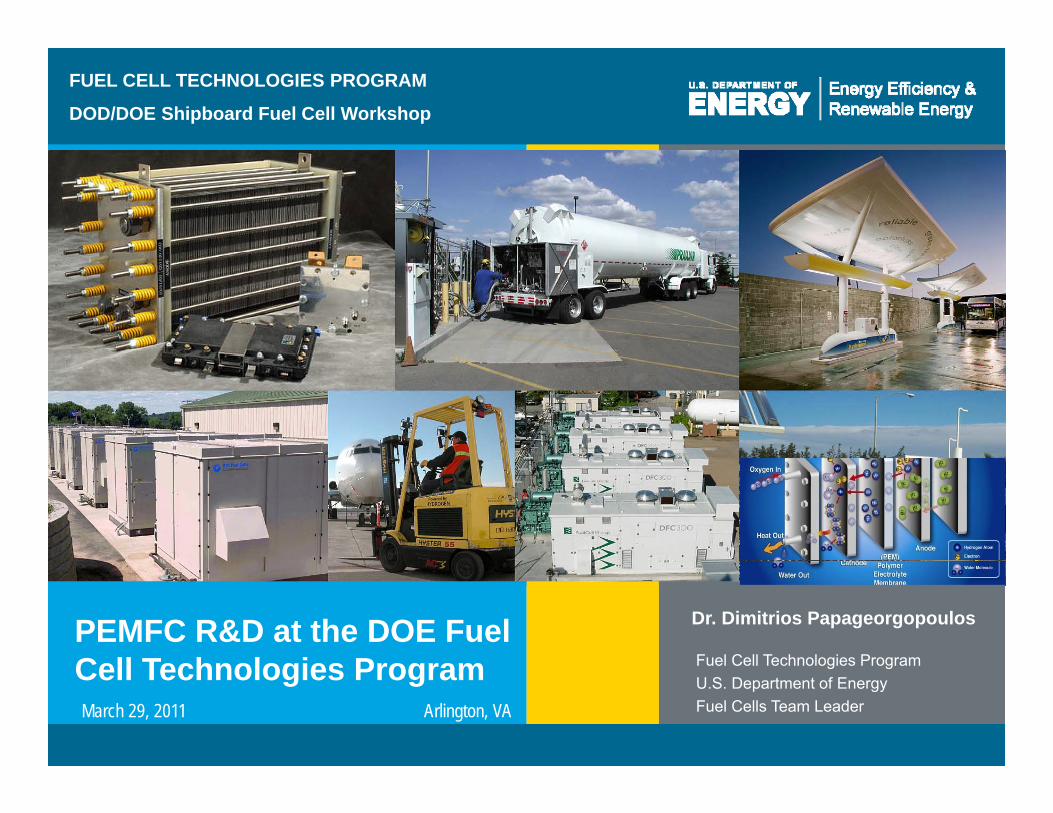
FUEL CELL TECHNOLOGIES PROGRAM DOD/DOE Shipboard Fuel Cell Workshop PEMFC R&D at the DOE Fuel Cll T h l i P Dr. Dimitrios Papageorgopoulos Fuel Cell Technologies Program Cell T echnologies Program Fuel Cell Technologies Program U.S. Department of Energy Fuel Cells Team Leader March 29, 2011 Arlington, VA
Transcript of PEMFC R&D at the DOE Fuel Cell Technologies Program · 1 | Fuel Cell Technologies Program Source:...
1 | Fuel Cell Technologies Program Source: US DOE 3/3/2011 eere.energy.gov
FUEL CELL TECHNOLOGIES PROGRAM
DOD/DOE Shipboard Fuel Cell Workshop
PEMFC R&D at the DOE Fuel C ll T h l i P
Dr. Dimitrios Papageorgopoulos
Fuel Cell Technologies Program Cell Technologies Program Fuel Cell Technologies Program U.S. Department of Energy Fuel Cells Team Leader March 29, 2011 Arlington, VA
- —
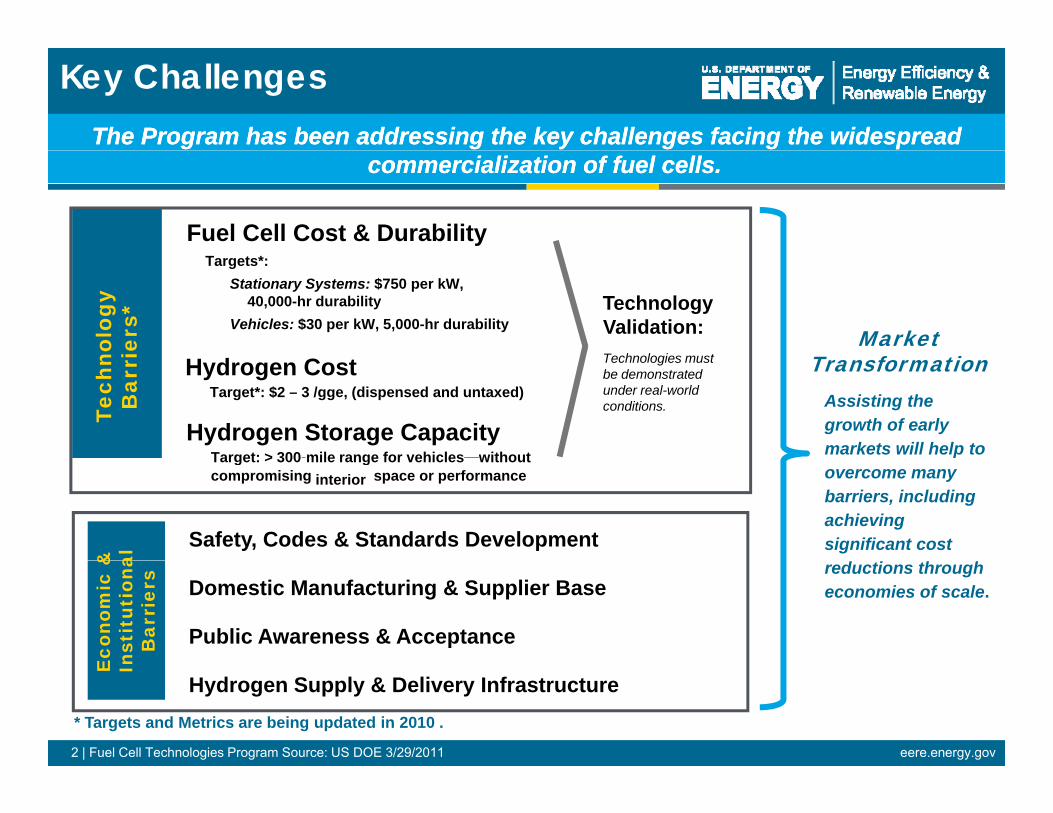
Key Challenges The Program has been addressing the key challenges facing the widespreadThe Program has been addressing the key challenges facing the widespread
commercialization of fuel cells.commercialization of fuel cells.
Fuel Cell Cost & Durability
nolo
gy
iers
*
Targets*: Stationary Systems: $750 per kW,
40,000-hr durability Vehicles: $30 per kW, 5,000-hr durability
Technology Validation: T h l i t
Tech
nB
arri Hydrogen Cost
Target*: $2 – 3 /gge, (dispensed and untaxed)
Technologies must be demonstrated under real-world conditions.
Hydrogen Storage Capacity Target: > 300-mile range for vehicles—without
& al
Safety, Codes & Standards Development
Target: > 300 mile range for vehicles without compromising interior space or performance
Eco
nom
ic &
ns
titu
tion
a B
arri
ers Domestic Manufacturing & Supplier Base
Public Awareness & Acceptance
E In
Hydrogen Supply & Delivery Infrastructure * Targets and Metrics are being updated in 2010 .
Market Transformation
Assisting the growth of early markets will help to overcome many barriers, including achieving significant cost reductions through economies of scale.
2 | Fuel Cell Technologies Program Source: US DOE 3/29/2011 eere.energy.gov
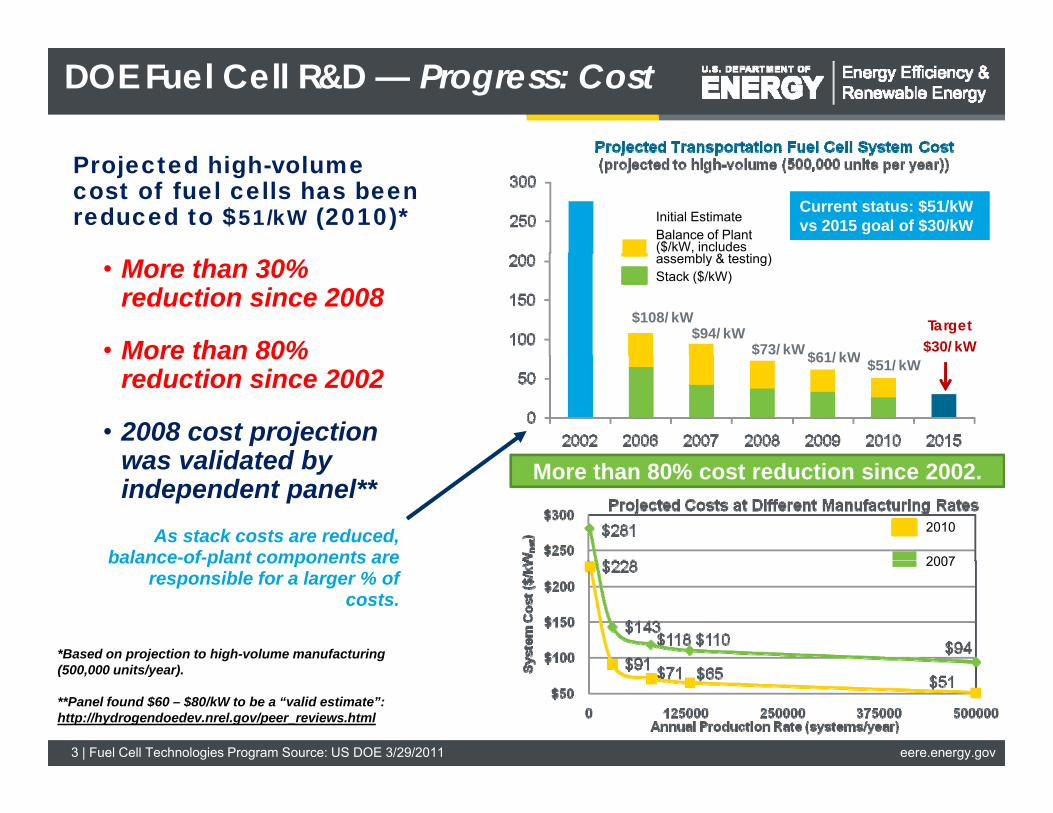
Current status: $51/kWvs 2015 goal of $30/kW
$/kW
DOE Fuel Cell R&D — Progress: Cost
Projected high-volume cost of fuel cells has been reduced to $51/kW (2010)*
• More than 30% reduction since 2008
• More than 80% More than 80% reduction since 2002
• 2008 cost projectionwas validated bywas validated by independent panel**
As stack costs are reduced, balance-of-plant components are balance of plant components are
responsible for a larger % of costs.
*Based on projection to high-volume manufacturing (500,000 units/year).
**Panel found $60 – $80/kW to be a “valid estimate”: http://hydrogendoedev.nrel.gov/peer_reviews.html
Balance of Plant ( , includes
Current status: $51/kW vs 2015 goal of $30/kW Initial Estimate
( ,assembly & testing) Stack ($/kW)
Target $30/kW
$61/kW$73/kW$94/kW
$108/kW
$51/kW$61/kW$ /
2010
2007
More than 80% cost reduction since 2002.
2007
3 | Fuel Cell Technologies Program Source: US DOE 3/29/2011 eere.energy.gov
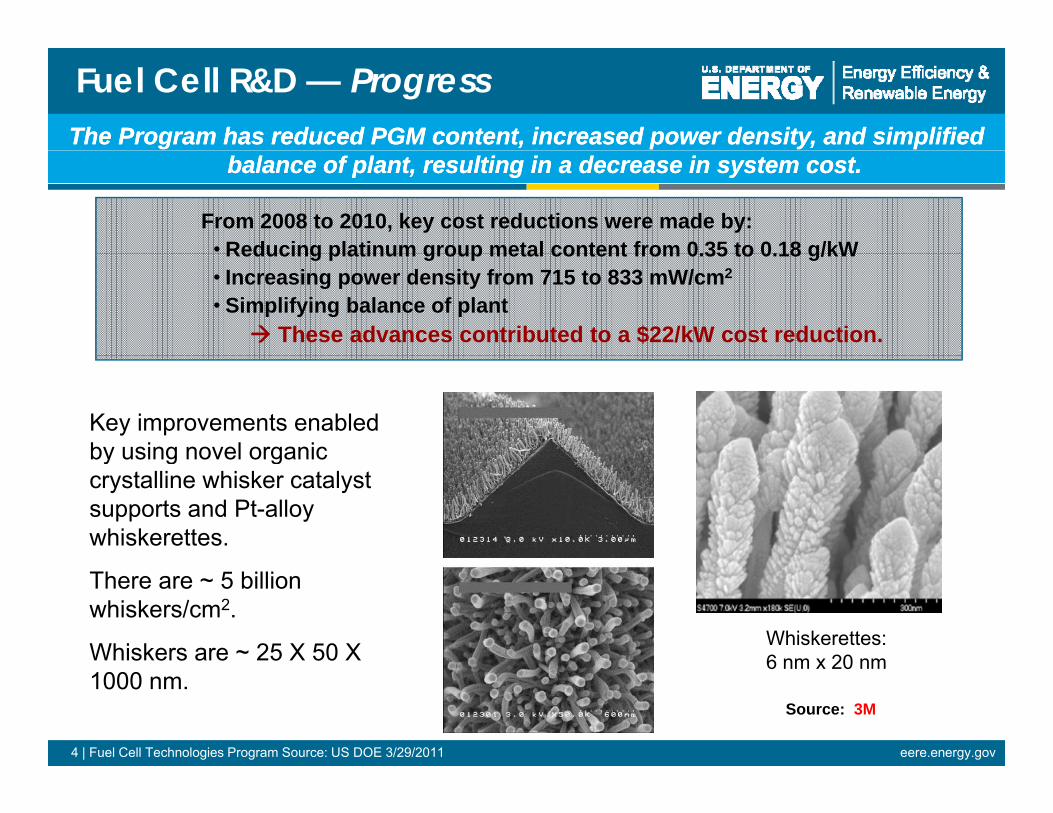
The Program has reduced PGM content, increased power density, and simplifiedThe Program has reduced PGM content, increased power density, and simplified
Fuel Cell R&D — Progress
balance of plant, resulting in a decrease in system cost.balance of plant, resulting in a decrease in system cost.
From 2008 to 2010, key cost reductions were made by: • Reducing platinum group metal content from 0 35 to 0 18 g/kWReducing platinum group metal content from 0.35 to 0.18 g/kW • Increasing power density from 715 to 833 mW/cm2
• Simplifying balance of plant Æ These advances contributed to a $22/kW cost reduction.
Key improvements enabled by using novel organicby using novel organic crystalline whisker catalyst supports and Pt-alloy whiskerettes.
There are ~ 5 billion whiskers/cm2.
Whiskers are ~ 25 X 50 X 1000 nm.
Whiskerettes: 6 nm x 20 nm6 nm x 20 nm
Source: 3M
4 | Fuel Cell Technologies Program Source: US DOE 3/29/2011 eere.energy.gov
–
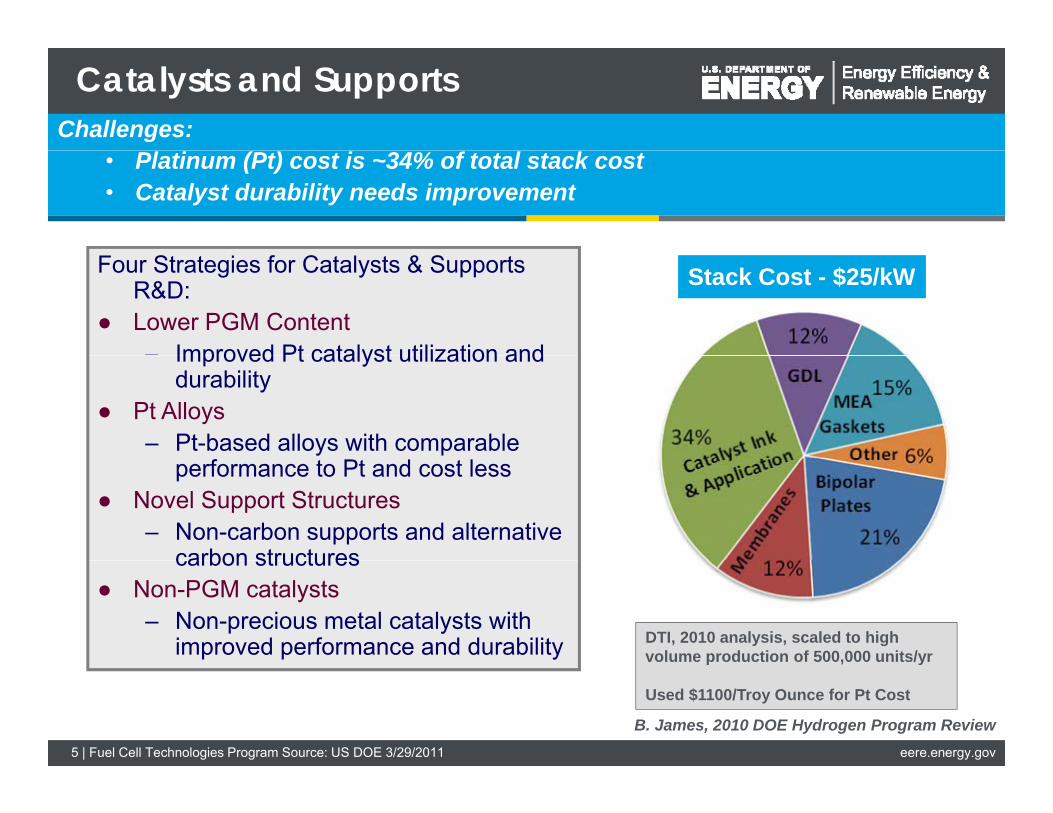
Stack Cost - $25/kW
Catalysts and Supports Challenges:
• Platinum (Pt) cost is ~34% of total stack cost • Catalyst durability needs improvement
Four Strategies for Catalysts & Supports R&D:
● Lower PGM Content – Improved Pt catalyst utilization and Improved Pt catalyst utilization and
durability ● Pt Alloys
– Pt-based alloys with comparable performance to Pt and cost less
● Novel Support Structures – Non-carbon supports and alternative
carbon structurescarbon structures ● Non-PGM catalysts
– Non-precious metal catalysts with improved performance and durability
Stack Cost - $25/kW
DTI, 2010 analysis, scaled to high volume production of 500,000 units/yrp , y
Used $1100/Troy Ounce for Pt Cost
B. James, 2010 DOE Hydrogen Program Review 5 | Fuel Cell Technologies Program Source: US DOE 3/29/2011 eere.energy.gov
-
bl d d ti i PGM t tbl d d ti i PGM t t
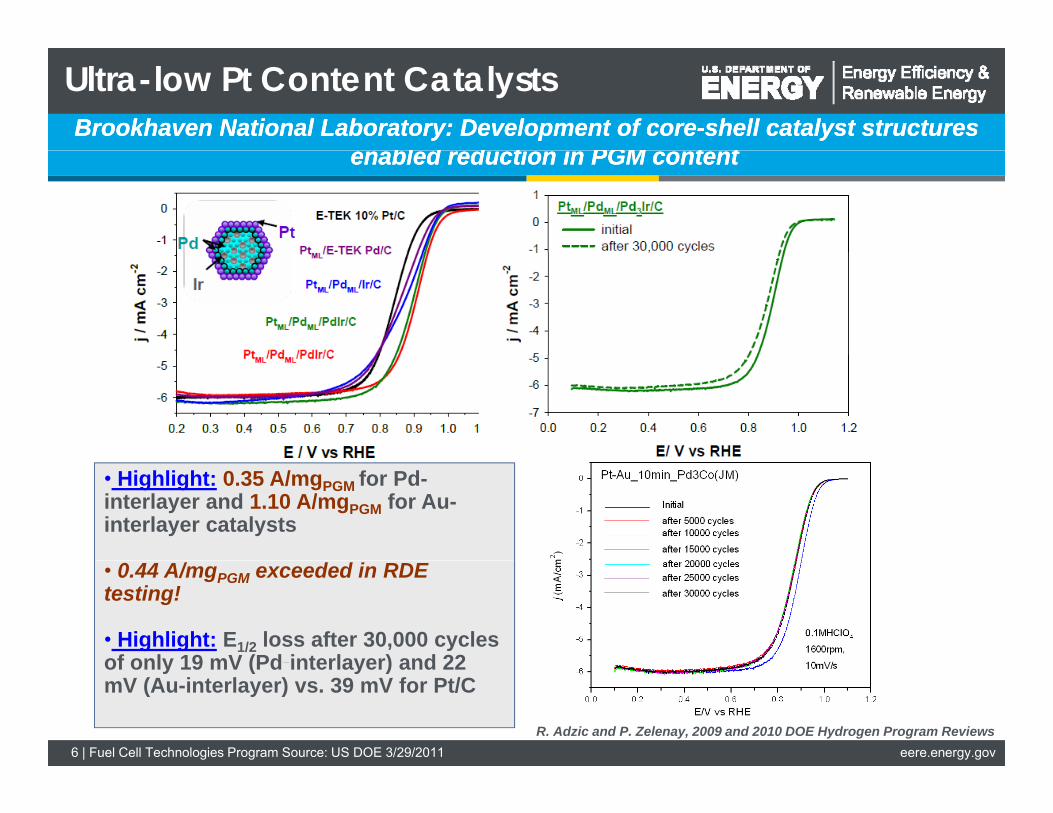
Ultra-low Pt Content Catalysts Brookhaven National Laboratory: Development of coreBrookhaven National Laboratory: Development of core--shell catalyst structuresshell catalyst structures
enabled reduction in PGM contentenabled reduction in PGM content
• Highlight: 0.35 A/mgPGM for Pdinterlayer and 1.10 A/mgPGM for Auinterlayer catalysts
• 0.44 A/mgPGM exceeded in RDE testing!
• Highlight: E1/2 loss after 30,000 cyclesof only 19 mV (Pd-interlayer) and 22
R. Adzic and P. Zelenay, 2009 and 2010 DOE Hydrogen Program Reviews
of only 19 mV (Pd interlayer) and 22 mV (Au-interlayer) vs. 39 mV for Pt/C
6 | Fuel Cell Technologies Program Source: US DOE 3/29/2011 eere.energy.gov
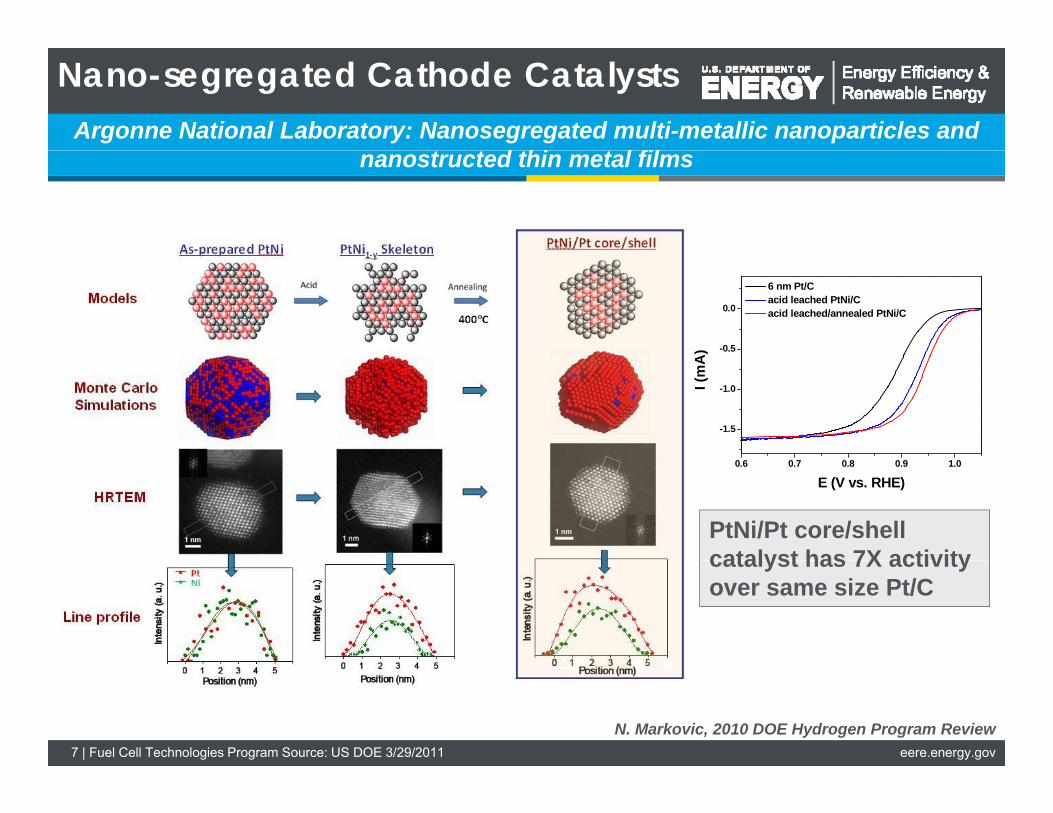
d hi l fil
Nano-segregated Cathode Catalysts Argonne National Laboratory: Nanosegregated multi-metallic nanoparticles and
nanostructed thin metal films
-0.5
0.0
6 nm Pt/C acid leached PtNi/C acid leached/annealed PtNi/C
A)
-1.5
-1.0 I (m
A
0.6 0.7 0.8 0.9 1.0
E (V vs. RHE)
PtNi/Pt core/shell catalyst has 7X activitycatalyst has 7X activity over same size Pt/C
N. Markovic, 2010 DOE Hydrogen Program Review 7 | Fuel Cell Technologies Program Source: US DOE 3/29/2011 eere.energy.gov
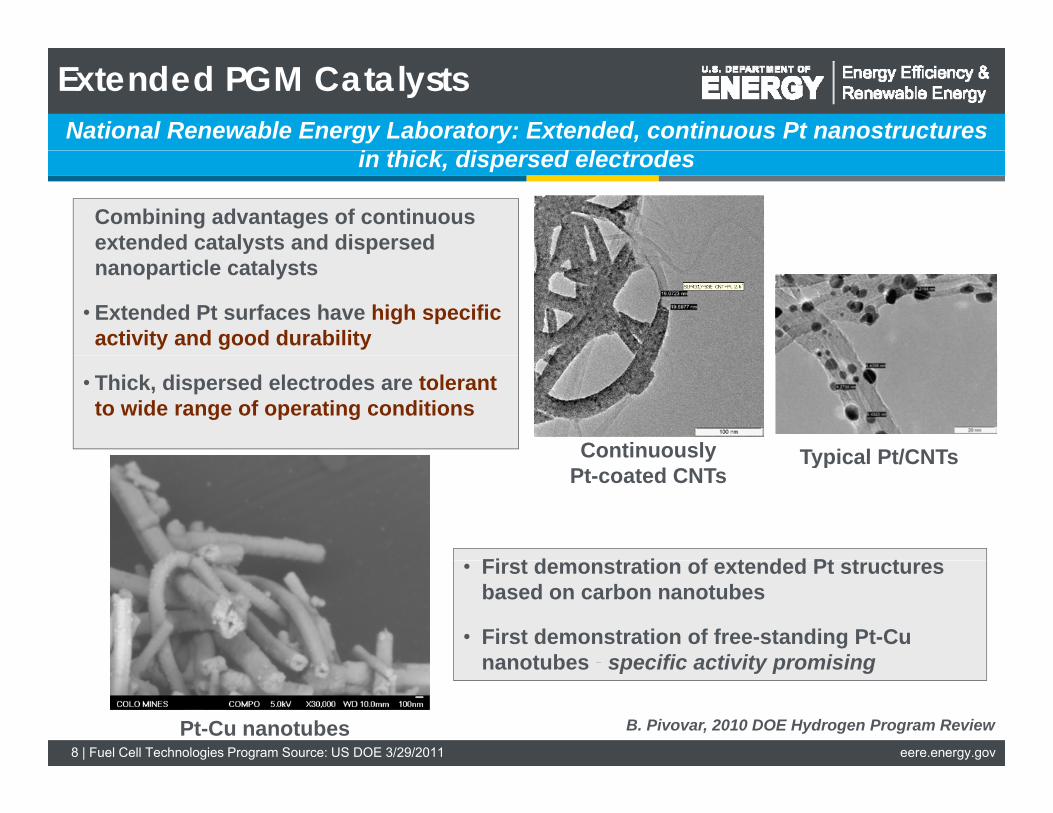
-
i hi k di d l d
Extended PGM Catalysts National Renewable Energy Laboratory: Extended, continuous Pt nanostructures
in thick, dispersed electrodes
Combining advantages of continuous extended catalysts and dispersedy p nanoparticle catalysts
• Extended Pt surfaces have high specific activity and good durability
Continuously
• Thick, dispersed electrodes are tolerant to wide range of operating conditions
y Typical Pt/CNTs Typical Pt/CNTs Pt-coated CNTs
Fi t d t ti f t d d Pt t t• First demonstration of extended Pt structures based on carbon nanotubes
• First demonstration of free-standing Pt-Cu nanotubes - specific activity promising nanotubes specific activity promising
B. Pivovar, 2010 DOE Hydrogen Program Review Pt-Cu nanotubes 8 | Fuel Cell Technologies Program Source: US DOE 3/29/2011 eere.energy.gov
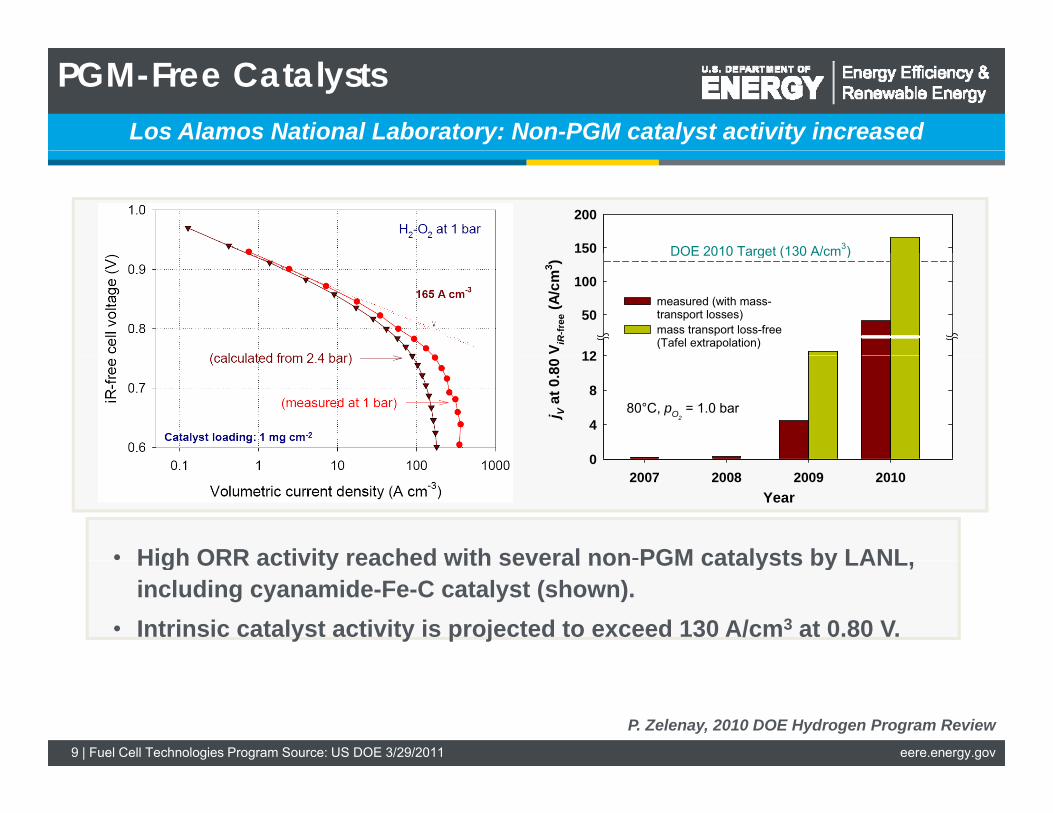
-
Los Alamos National Laboratory: Non-PGM catalyst activity increased
PGM-Free Catalysts
150
200
DOE 2010 Target (130 A/cm3)
V iR-fr
ee (A
/cm
3 )
12
50
100 measured (with mass-transport losses) mass transport loss-free (Tafel extrapolation)
DOE 2010 Target (130 A/cm )
j V at
0.8
0
0
4
8
12
80°C, pO2 = 1.0 bar
• High ORR activity reached with several non-PGM catalysts by LANL
Year 2007 2008 2009 2010
0
High ORR activity reached with several non PGM catalysts by LANL, including cyanamide-Fe-C catalyst (shown).
• Intrinsic catalyst activity is projected to exceed 130 A/cm3 at 0.80 V.
P. Zelenay, 2010 DOE Hydrogen Program Review 9 | Fuel Cell Technologies Program Source: US DOE 3/29/2011 eere.energy.gov
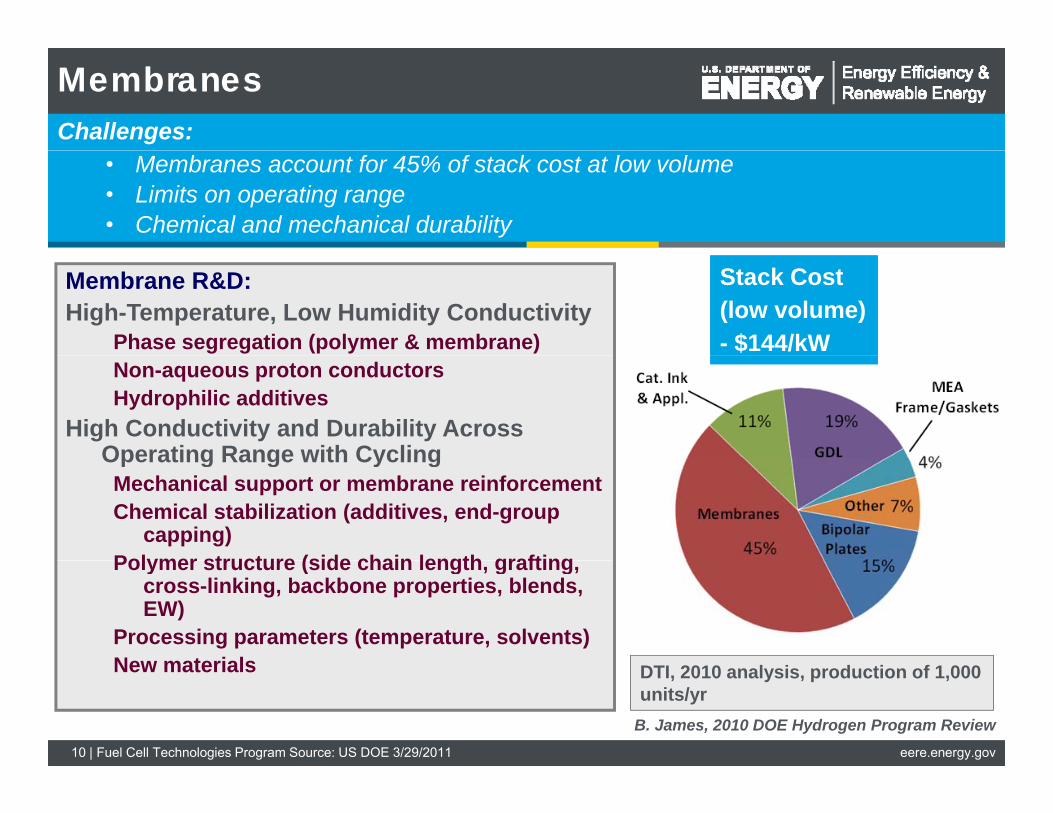
Stack Cost (low volume) - $144/kW
Membranes Challenges:
• Membranes account for 45% of stack cost at low volume • Limits on operating range • Chemical and mechanical durability
Membrane R&D: High-Temperature, Low Humidity Conductivity
Phase segregation (polymer & membrane) Non-aqueous proton conductors Hydrophilic additives
High Conductivity and Durability Across Operating Range with CyclingOperating Range with Cycling
Mechanical support or membrane reinforcement Chemical stabilization (additives, end-group
capping) Polymer structure (side chain length grafting Polymer structure (side chain length, grafting,
cross-linking, backbone properties, blends, EW)
Processing parameters (temperature, solvents) New materials New materials
Stack Cost (low volume) - $144/kW
DTI, 2010 analysis, production of 1,000 units/yr
B. James, 2010 DOE Hydrogen Program Review 10 | Fuel Cell Technologies Program Source: US DOE 3/29/2011 eere.energy.gov

t th idi t i l
Dimensionally Stabilized Membranes Giner Electrochemical Systems: Low EW PFSA materials supported with high-
strength non-acidic materials
• Engineering polymer matrix provides mechanical stability • Low-EW ionomer allows for better conductivity under low RH Low EW ionomer allows for better conductivity under low RH • Next Steps: Impregnation of thinner porous mats with low-EW
ionomer planned along with the fabrication of large-area films
2DSM
3DSM
1
0 1
1
S /cm
) .
0 01
0.1 C
ond u
ctiv
ity (S
0.01 0 20 40 60 80 100
Relative Humidity
C
700 EW 2DSM 80°C N112 80°C 3DSM HOMOPOLYMER 80°C DOE ULTIMATE GOAL 120°C Insoluble 3DSM
C. Mittelsteadt, 2010 DOE Hydrogen Program Review 11 | Fuel Cell Technologies Program Source: US DOE 3/29/2011 eere.energy.gov
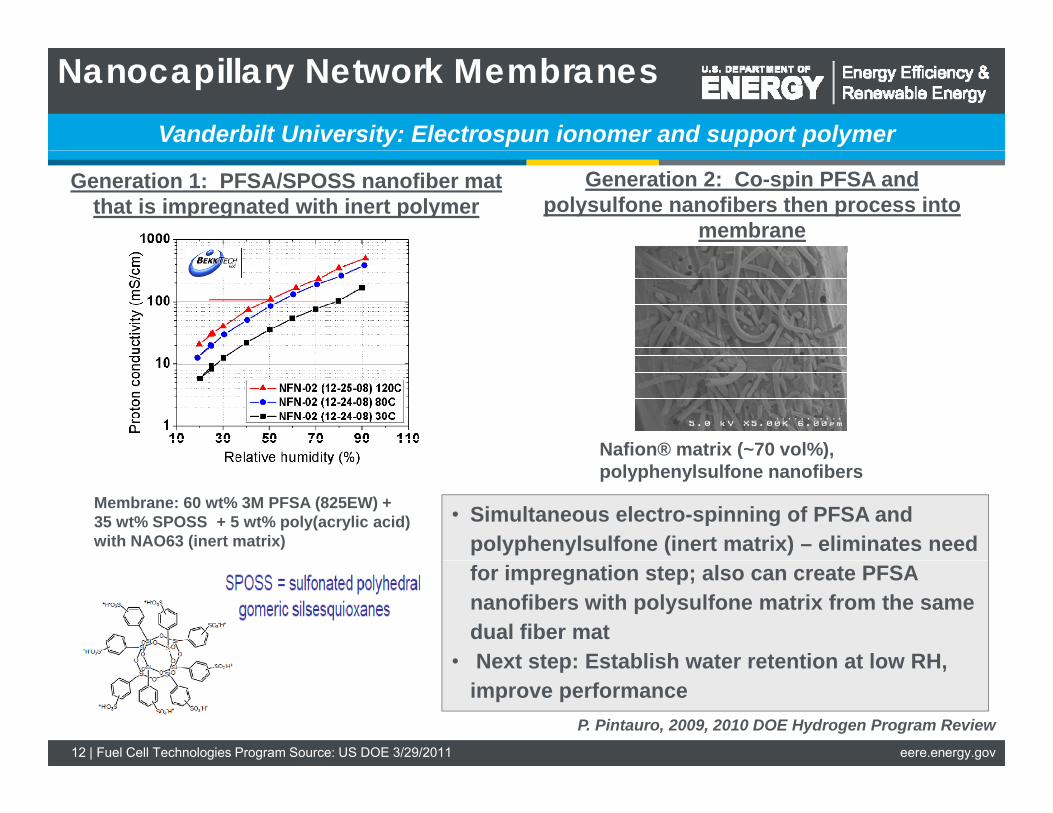
Nanocapillary Network Membranes Vanderbilt University: Electrospun ionomer and support polymer
Generation 1: PFSA/SPOSS nanofiber mat that is impregnated with inert polymer
Membrane: 60 wt% 3M PFSA (825EW) + 35 wt% SPOSS + 5 wt% poly(acrylic acid) with NAO63 (inert matrix)
Generation 2: Co-spin PFSA and polysulfone nanofibers then process into
membrane
Nafion® matrix ((~70 vol%), ), polyphenylsulfone nanofibers
• Simultaneous electro-spinning of PFSA and polyphenylsulfone (inert matrix) – eliminates need for impregnation step; also can create PFSA nanofibers with polysulfone matrix from the same dual fiber mat
• Next step: Establish water retention at low RH • Next step: Establish water retention at low RH, improve performance
P. Pintauro, 2009, 2010 DOE Hydrogen Program Review 12 | Fuel Cell Technologies Program Source: US DOE 3/29/2011 eere.energy.gov

/cm
)
Con
duct
ivity
(S
S
• Multi Acid Side-chains (MASC) allow Lower EW while maintaining higher crystallinityy y
• Starting with an 835 EW polymer, prepared a MASC PFIA ionomer with 625 EW
• Membrane has >100 mS/cm conductivityy at 120ºC, 50% RH – similar to about 700 EW PFSA
• Durability of PFIA to be evaluated
Multi-acid Side Chain Polymers 3M: Per Fluoro Imide Acid (PFIA) and Sulfonic Acid
1.000 PFIA 625 EW
825 EW
700 EW
Bis/Tris Acid 450 EW
0.100
80 °C80 °C 0.010
0 20 40 60 80 100 Relative Humidity (%RH)
0 6
0.7
0 6
0.7 H2/Air CS 2/2 80ºC dewpoint inlets
0.3
0.4
0.5
0.6
age
(Vol
ts)
8 am
ps/c
m2
0.3
0.4
0.5
0.6
(ohm
-cm
2)
6 2 5 ew PF IA 8 2 5 ew PF SA 6 2 5 ew PF IA HF R
80 C dewpoint inlets Ambient press.outlets 20um PEM thicknes
0
0.1
0.2 Volta
@
0.8
0
0.1
0.2 HFR
8 2 5 ew PF SA HF R
7070 90 110 13090 110 130 Cell Temperature (ºC)
S. Hamrock, 2010 DOE Hydrogen Program Review 13 | Fuel Cell Technologies Program Source: US DOE 3/29/2011 eere.energy.gov
14 | Fuel Cell Technologies Program Source: US DOE 3/29/2011 eere.energy.gov14
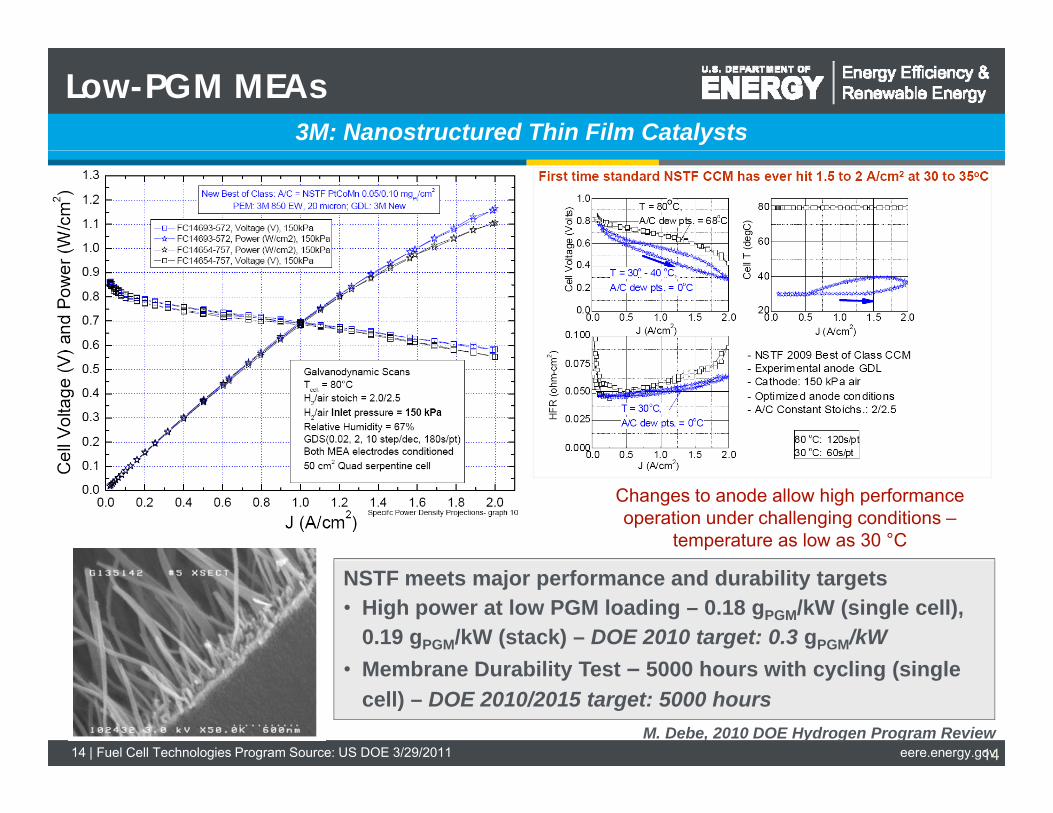
Low-PGM MEAs 3M: Nanostructured Thin Film Catalysts
Changes to anode allow high performance operation under challenging conditions –
temperature as low as 30 °C
NSTF meets major performance and durability targets • High power at low PGM loading – 0.18 gPGM/kW (single cell),
0.19 gPGM/kW (stack) – DOE 2010 target: 0.3 gPGM/kW M b D bilit T t 5000 h ith li ( i l• Membrane Durability Test – 5000 hours with cycling (single cell) – DOE 2010/2015 target: 5000 hours
M. Debe, 2010 DOE Hydrogen Program Review
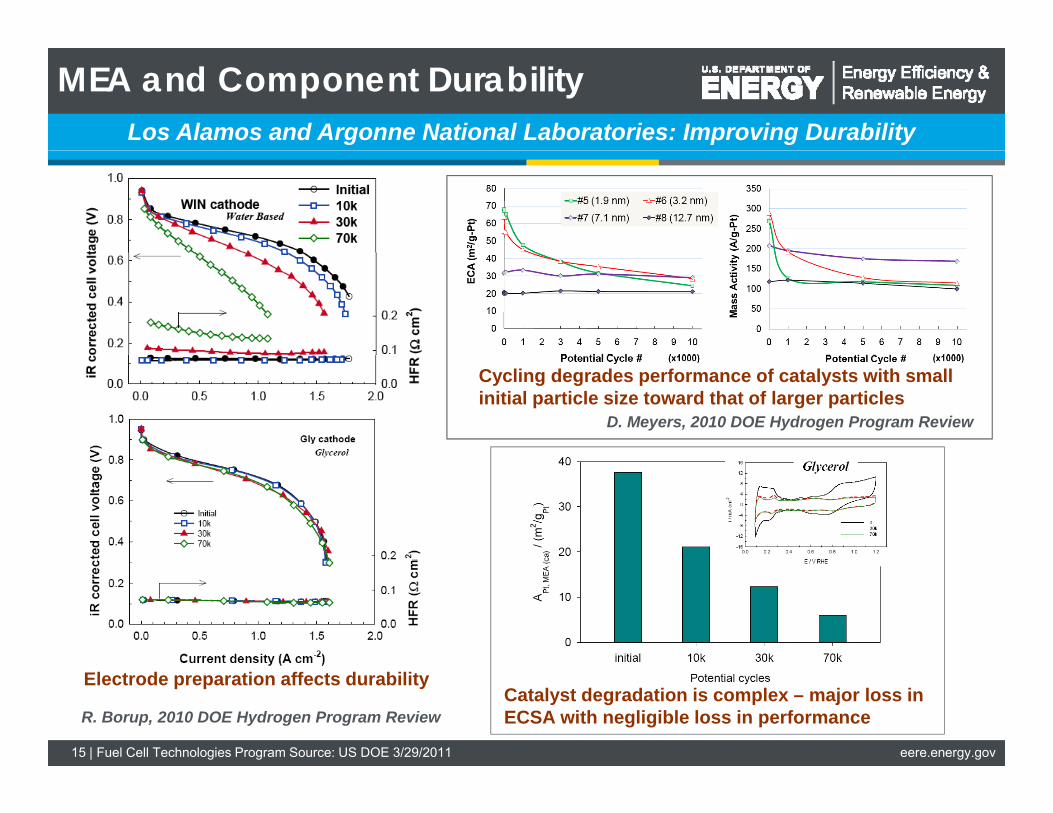
MEA and Component Durability Los Alamos and Argonne National Laboratories: Improving Durability
Cycling degrades performance of catalysts with small initial particle size toward that of larger particles
D. Meyers, 2010 DOE Hydrogen Program Review
Electrode preparation affects durability Catalyst degradation is complex – major loss in
R. Borup, 2010 DOE Hydrogen Program Review ECSA with negligible loss in performance
15 | Fuel Cell Technologies Program Source: US DOE 3/29/2011 eere.energy.gov
-
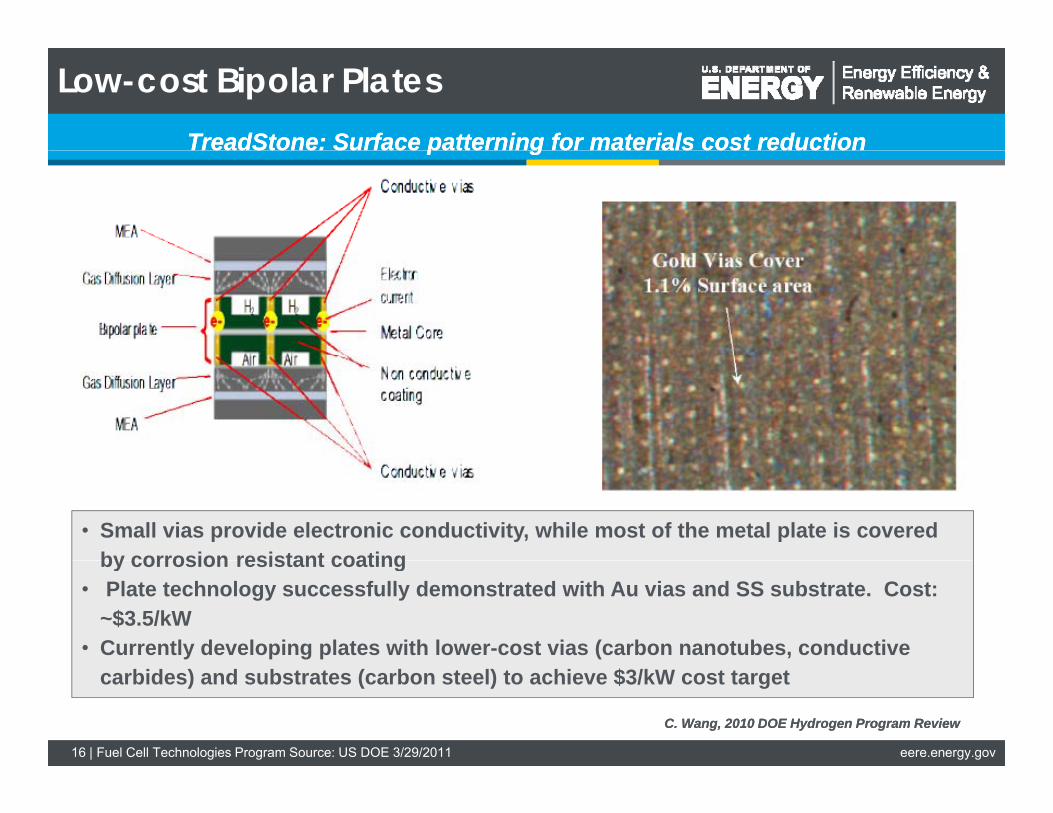
Low-cost Bipolar Plates TreadStone: Surface patterning for materials cost reductionTreadStone: Surface patterning for materials cost reductionpp gg
• Small vias provide electronic conductivity, while most of the metal plate is covered by corrosion-resistant coatingby corrosion resistant coating
• Plate technology successfully demonstrated with Au vias and SS substrate. Cost: ~$3.5/kW
• Currently developing plates with lower-cost vias (carbon nanotubes, conductive carbides) and substrates (carbon steel) to achieve $3/kW cost target
C.C. Wang, 2010Wang, 2010 DOE HydrogenDOE Hydrogen ProgramProgram ReviewReview
16 | Fuel Cell Technologies Program Source: US DOE 3/29/2011 eere.energy.gov
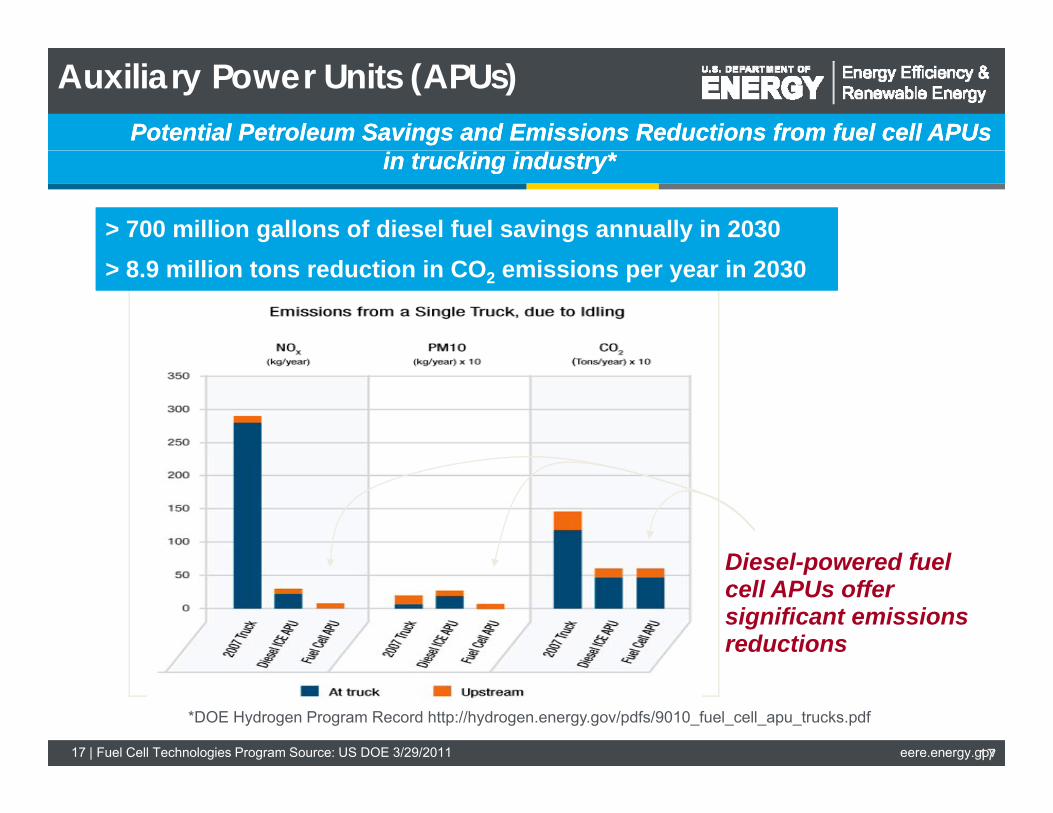
> 700 million gallons of diesel fuel savings annually in 2030> 8.9 million tons reduction in CO2 emissions per year in 2030
Auxiliary Power Units (APUs) Potential Petroleum Savings and Emissions Reductions from fuel cell APUsPotential Petroleum Savings and Emissions Reductions from fuel cell APUs
in trucking industry*in trucking industry*
> 700 million gallons of diesel fuel savings annually in 2030 > 8.9 million tons reduction in CO2 emissions per year in 2030
Diesel powered fuel-Diesel powered fuel cell APUs offer significant emissions reductions
*DOE Hydrogen Program Record http://hydrogen.energy.gov/pdfs/9010_fuel_cell_apu_trucks.pdf
17 | Fuel Cell Technologies Program Source: US DOE 3/29/2011 eere.energy.gov17
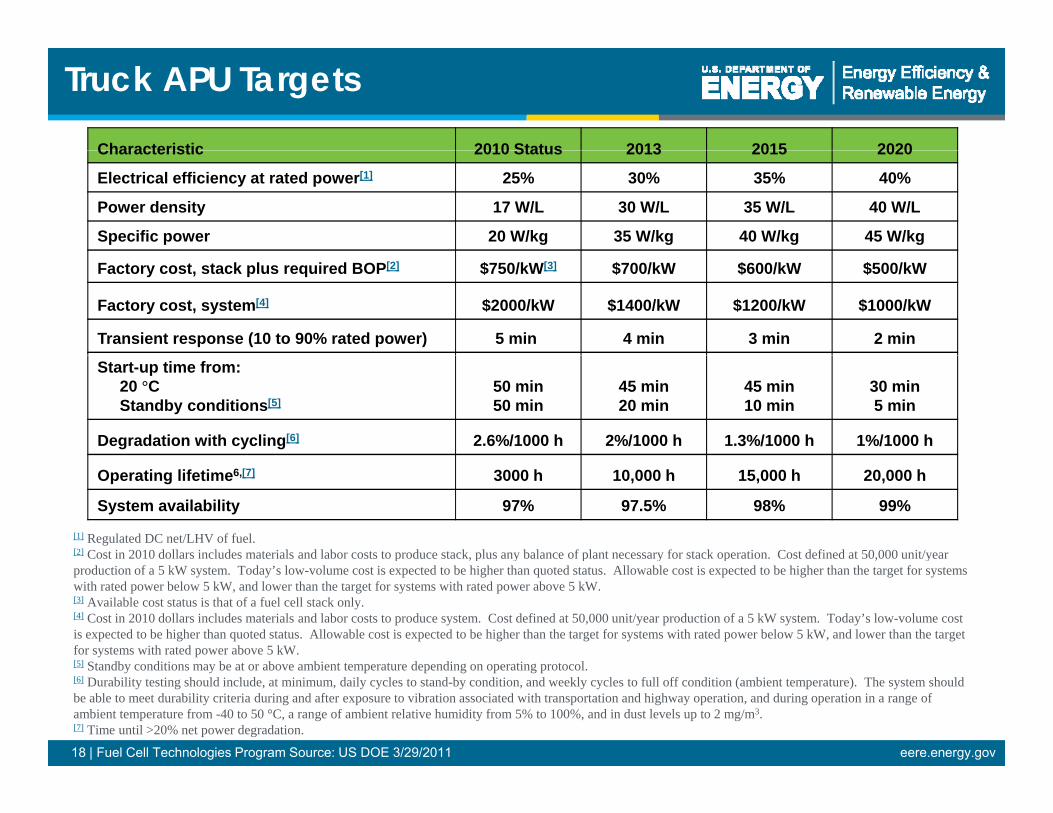
Truck APU Targets
CharacteristicCharacteristic 2010 Status 2010 Status 20132013 20152015 20202020
Electrical efficiency at rated power[1] 25% 30% 35% 40%
Power density 17 W/L 30 W/L 35 W/L 40 W/L
Specific power 20 W/kg 35 W/kg 40 W/kg 45 W/kg
Factory cost, stack plus required BOP[2] $750/kW[3] $700/kW $600/kW $500/kW
Factory cost, system[4] $2000/kW $1400/kW $1200/kW $1000/kW
Transient response (10 to 90% rated power) 5 min 4 min 3 min 2 min
Start-up time from: 20 °C Standby conditions[5]
50 min 50 min
45 min 20 min
45 min 10 min
30 min 5 min
Degradation with cycling[6] 2.6%/1000 h 2%/1000 h 1.3%/1000 h 1%/1000 h
Operating lifetime6,[7] 3000 h 10,000 h 15,000 h 20,000 h
System availability 97% 97.5% 98% 99% [1] Regulated DC net/LHV of fuel. [2] Cost in 2010 dollars includes materials and labor costs to pproduce stack, plus any balance of pplant necessary for stack opperation. Cost defined at 50,000 unit/yyear, p y y , production of a 5 kW system. Today’s low-volume cost is expected to be higher than quoted status. Allowable cost is expected to be higher than the target for systems with rated power below 5 kW, and lower than the target for systems with rated power above 5 kW. [3] Available cost status is that of a fuel cell stack only. [4] Cost in 2010 dollars includes materials and labor costs to produce system. Cost defined at 50,000 unit/year production of a 5 kW system. Today’s low-volume cost is expected to be higher than quoted status. Allowable cost is expected to be higher than the target for systems with rated power below 5 kW, and lower than the target for systems with rated power above 5 kW. [5] St [5] Standbdby conditi ditions may bbe att or abbove ambi bientt t temperatture ddependi ding on operati ting prottocoll. [6] Durability testing should include, at minimum, daily cycles to stand-by condition, and weekly cycles to full off condition (ambient temperature). The system should be able to meet durability criteria during and after exposure to vibration associated with transportation and highway operation, and during operation in a range of ambient temperature from -40 to 50 °C, a range of ambient relative humidity from 5% to 100%, and in dust levels up to 2 mg/m3. [7] Time until >20% net power degradation.
18 | Fuel Cell Technologies Program Source: US DOE 3/29/2011 eere.energy.gov
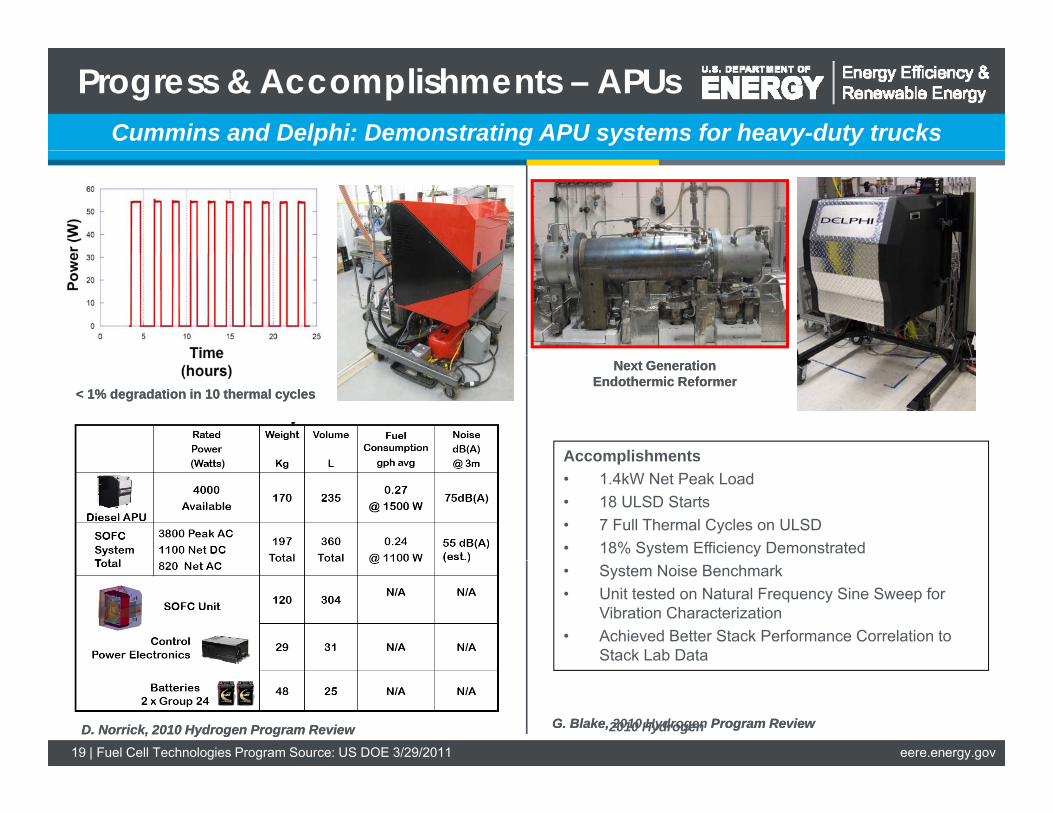
Progress & Accomplishments – APUs Cummins and Delphi: Demonstrating APU systems for heavy-duty trucks
Next GeneraNext Generationtion Endothermic ReformerEndothermic Reformer
AccomplishmentsAccomplishments • 1.4kW Net Peak Load • 18 ULSD Starts • 7 Full Thermal Cycles on ULSD • 18% System Efficiency Demonstrated • System Noise Benchmark • Unit tested on Natural Frequency Sine Sweep for
Vibration Characterization • Achieved Better Stack Performance Correlation to
Stack Lab Data
G.G. Blake,Blake, 20102010 HydrogenHydrogen ProgramProgram RevieRevieww
<< 1%1% degradationdegradation inin 10 thermal cy10 thermal cyclescles
D.D. Norrick,Norrick, 20102010 Hydrogen Program ReviewHydrogen Program Review 19 | Fuel Cell Technologies Program Source: US DOE 3/29/2011 eere.energy.gov
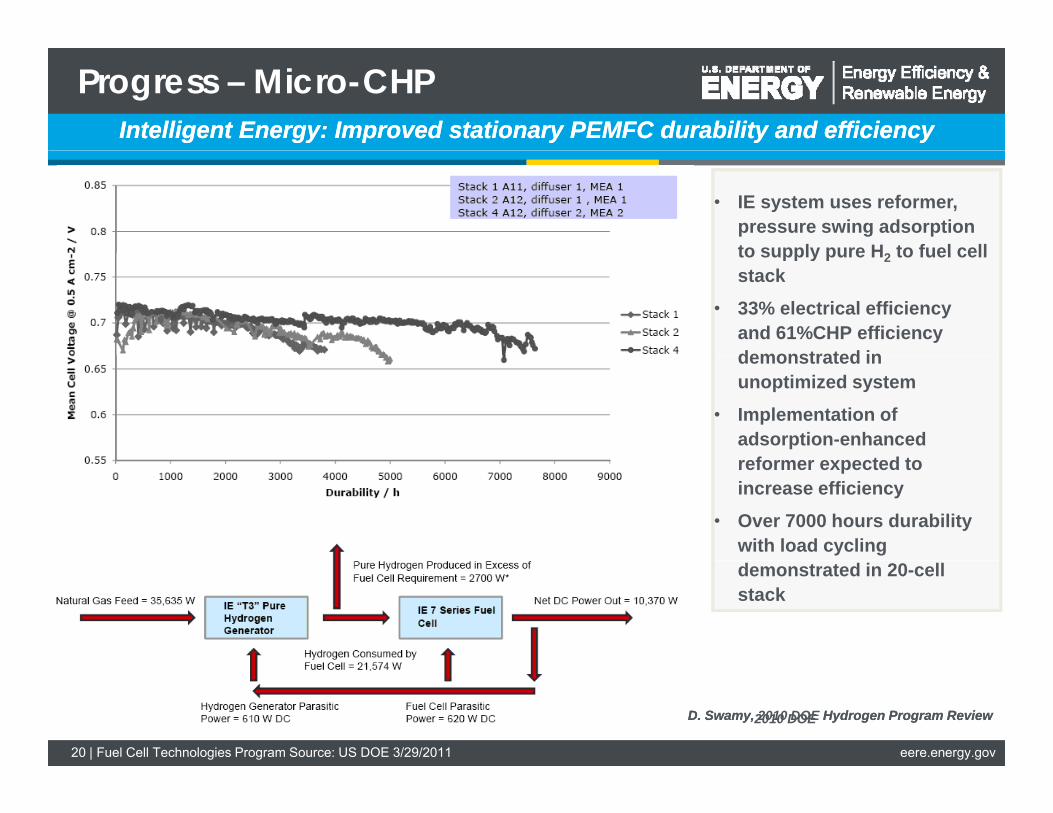
Progress – Micro-CHP Intelligent Energy: Improved stationary PEMFC durability and efficiencyIntelligent Energy: Improved stationary PEMFC durability and efficiency
• IE system uses reformer, pressure swing adsorption to supply pure H2 to fuel cellto supply pure H2 to fuel cell stack
• 33% electrical efficiency and 61%CHP efficiency demonstrated indemonstrated in unoptimized system
• Implementation of adsorption-enhanced
f t d treformer expected to increase efficiency
• Over 7000 hours durability with load cycling demonstrated in 20-cell stack
D.D. SwamySwamy,, 20102010 DOEDOE HydrogenHydrogen ProgramProgram ReviewReview
20 | Fuel Cell Technologies Program Source: US DOE 3/29/2011 eere.energy.gov
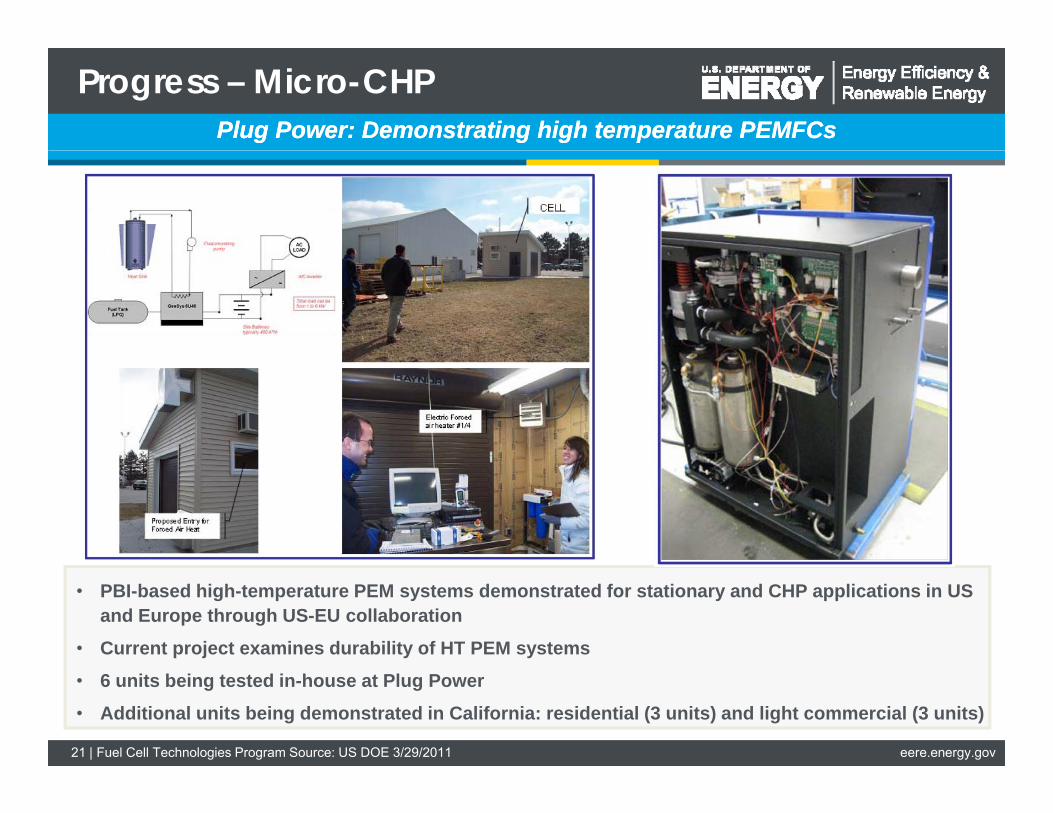
Progress – Micro-CHP Plug Power: Demonstrating high temperature PEMFCsPlug Power: Demonstrating high temperature PEMFCs
• PBI-based high-temperature PEM systems demonstrated for stationary and CHP applications in US and Europe through US-EU collaboration
• Current project examines durability of HT PEM systems
21 | Fuel Cell Technologies Program Source: US DOE 3/29/2011 eere.energy.gov
• 6 units being tested in-house at Plug Power
• Additional units being demonstrated in California: residential (3 units) and light commercial (3 units)
Thank youThank you
i f iFor more information, please contact
hydrogenandfuelcells.energy.gov
22 | Fuel Cell Technologies Program Source: US DOE 3/29/2011 eere.energy.gov