2005 full year results roadshow - Home | Nestlé Global · 5 2005 full year roadshow –...
41
2005 full year results roadshow 2005 full year roadshow – February/March 2006
Transcript of 2005 full year results roadshow - Home | Nestlé Global · 5 2005 full year roadshow –...

Name of chairman
2005 full year results roadshow
2005 full year roadshow – February/March 2006

Name of chairman2005 full year roadshow – February/March 20062
Disclaimer
This presentation contains forward looking statements which reflect Management’s current views and estimates. The forward looking statements involve certain risks and uncertainties that could cause actual results to differ materially from those contained in the forward looking statements. Potential risks and uncertainties include such factors as general economic conditions, foreign exchange fluctuations, competitive product and pricing pressures and regulatory developments.

Name of chairman2005 full year roadshow – February/March 20063
Restatement of 2004 results
• 2004 results have been restated following the first application of IFRS 2 share-based payment and the discontinued operation resulting from the announcement in December 2005 for the chilled dairy activities in Europe, where applicable.
• 2005 Full Year Organic Growth restated for chilled dairy: impact about 30 bps.

Name of chairman2005 full year roadshow – February/March 20064
Agenda
2005 key messages
EBITA evolution
A portfolio of strong brands
Nutrition, Health & Wellness –driving growth & profitability
Benefits of scale
Strategic review 2005/6
Corporate governance
Outlook

Name of chairman2005 full year roadshow – February/March 20065
2005: Delivering The Nestle Model:Improvement in key performance measures
Strong organic growth both F&B and Pharma: 6.2%
EBITA margin up 20bps to 12.9%; up CHF 1 Billion
Improvement in Return on Invested Capital: +50bps
Underlying EPS up 12.9%; dividend CHF 9, up 12.5%
Strong cash flow – 1st buy-back complete; 2nd begun
CHF 4.5 Billion returned to shareholders: up 59% vs 04
Group transformation on track – Nutrition, Health, Wellness, GLOBE, European Chilled Dairy

Name of chairman2005 full year roadshow – February/March 20066
MarketMix+ 30
Positive evolution of EBITA margin
2004
Operationalactivities
- 20
12.7
12.8Currencies
+ 10
12.8
13.1
12.9
Share-basedpayments
12.7
Portfoliooptimisation
+ 10- 10
2005

Name of chairman2005 full year roadshow – February/March 20067
EBITA influencers: 12.7% to 12.9% = + 20 bps
Positive• Efficiencies & growth +160• Mkt mix, inc Alcon +30• Portfolio
optimisation +10• Currencies +10
Total positive +210
Negative• Input costs, net of
pricing -155• One-offs: China,
Russian & UK confectionery -25
• Share-based payments -10
Total negative -190
Improvement +20bps

Name of chairman2005 full year roadshow – February/March 20068
Brands
A portfolio of strong brands:The foundation for value creation

Name of chairman2005 full year roadshow – February/March 20069
21 brands with sales over 1 billion Swiss Franc
Beverages Chocolate, confectionery and
biscuits
PetCare
Water
Prepared dishes and cooking aids

Name of chairman2005 full year roadshow – February/March 200610
21 brands with sales over 1 billion Swiss Franc
Milk products BABs
Ice cream
Pharma
Nutrition In Nutrition, Nestlé qualifies as a CHF 1 billion brand in both the Infant Nutrition and Baby Food categories. Branded Active Benefits are added to products to address a specific need state. The sales of products incorporating Prebio1 exceed CHF 1 billion.

Name of chairman2005 full year roadshow – February/March 200611
Bigger brands grow faster (Organic growth)
EUROPE AMERICAS AOA
n/a
+ 52.8
+ 5.0
+ 5.4
+ 0.2
+26.0
n/a
n/a
+ 6.3
+ 12.2
+ 6.6
+ 51.9
+ 7.8
+ 7.8
+ 11.3
n/a + 10.6 n/a

Name of chairman2005 full year roadshow – February/March 200612
Share gains in key categories
3.55.6
8.6
11.7
2.0
16.0
1.83.1
PetCareCAGR
Value (%)02-05
Ice CreamCAGR
Value (%)01-05
Soluble CoffeeCAGR (%)
95-05
WatersCAGR
Volume (%)98-05
Market
Nestlé

Name of chairman2005 full year roadshow – February/March 200613
The Transformation toNutrition, Health & Wellness
Driving growth & profitability

Name of chairman2005 full year roadshow – February/March 200614
BAB's: adding relevant nutrition, health & wellness to strong brands in a proprietary way
Vitality / Protection Immunity & Protection
Intestinal Health
Heart Health
Building StrongerBones
Long-Lasting Energy
Growth &Development
Feeling Good,& It Shows
Long-LastingAlertness
"Refuelling"Growth
Active CholesterolControl
Helps Keep Calciumin your Bones
R
EasyDigestion
Energy Release

Name of chairman2005 full year roadshow – February/March 200615
BAB's on increasing number of products

Name of chairman2005 full year roadshow – February/March 200616
0.5
1.0
1.5
2.0
2.5
3.0
98 99 00 01 02 03 04
Sal
es (
CH
F B
illion
s )
05
Accelerating sales of Branded Active Benefits
1.2
1.8
GLO
BE
GLO
BE
2.5
2.9
0.60.5
0.4
Branded Active Ingredients Branded Active Benefits
0.2

Name of chairman2005 full year roadshow – February/March 200617
Driving growth and margin through BAB's
Nesvita "Pro-Heart" with Acticol• With BAB to reduce cholesterol • 17% price premium to average
Nesvita "Pro-Digestion" with Actifibras• With BAB to smoothen digestion• 19% price premium to average
• Nestlé share in '05 grew from 33% to 37%• Roll out in 6 more markets in 2006
Adult milk segment achieved 23% Organic Growth

Name of chairman2005 full year roadshow – February/March 200618
Nutrition driving growth
• Nutrition sales* increased by 7.6%• Products with 60/40+ grow 15% faster than
Group• Sales of products with branded active benefits
increased by 20%
*Excluding 2005 product exchange. All numbers 2005

Name of chairman2005 full year roadshow – February/March 200619
F&B average
Portfolio mix improving
-3.0
0.0
3.0
6.0
9.0
12.0
15.0
-3.0 0.0 3.0 6.0 9.0 12.0
Organic Growth
RIG
Germany
France
GB Region
NPPE
Brazil
USA
NPP NA
Mexico
Waters
Dreyer's
% China
%

Name of chairman2005 full year roadshow – February/March 200620
Scale becoming a competitive advantage
• GLOBE roll-out accelerating75,000+ system users; 300+ factories; 300+ distribution centres; 200+ sales offices
• 80% of F&B using GLOBE systems by end 2006• Shared service centres operational in all Zones• Selective outsourcing started• Efficiency programmes deliver CHF 1.2 billion in 2005• Innovation Acceleration Teams & Clusters

Name of chairman2005 full year roadshow – February/March 200621
51.8% 51.2% 50.1%48.1%
44.5%43.2% 42.7% 41.7%
0%
5%
40%
45%
50%
55%
COGS in % of NPS CHF
0.6 bio Cumulative cost improvements
46.8%
CHF 1.3 bio CHF
2.2 bio CHF 3.1 bio CHF
4.0 bio CHF 5.2 bio CHF
6.4 bio CHF 7.6 bio
41.7%
CHF 8.7 bio
1996 1997 1998 1999 2000 2001 2002 2003 2004 2005
Short term cost pressure; longer term efficiencies
Efficient operations driving down COGS

Name of chairman2005 full year roadshow – February/March 200622
Bigger innovations, rolled out faster
• NAN HA going global in Infant nutrition• Beneful going pan-European• Nescafé mixes launches going global• Nestlé Ideal rolling out across emerging markets

Name of chairman2005 full year roadshow – February/March 200623
Going global in Infant Nutrition
Premium Infant Formula
• Marketed under premium brands Nan, Nidina, Nidal or Beba
• Clinically proven allergy and/or diarrhoea preventive
• The roll-out is global & will be in most markets during H1/2006
Generating double digit growth in most markets

Name of chairman2005 full year roadshow – February/March 200624
Going pan-European with Beneful
Beneful – launched 2001 in US• Developed to various need states in US:
Healthy Radiance, Healthy Growth, etc• US sales grew over 35%; market share increased• Roll-out in Europe started in 2004
Brand sales over CHF 400 million
Name of chairman2005 full year roadshow – February/March 200625
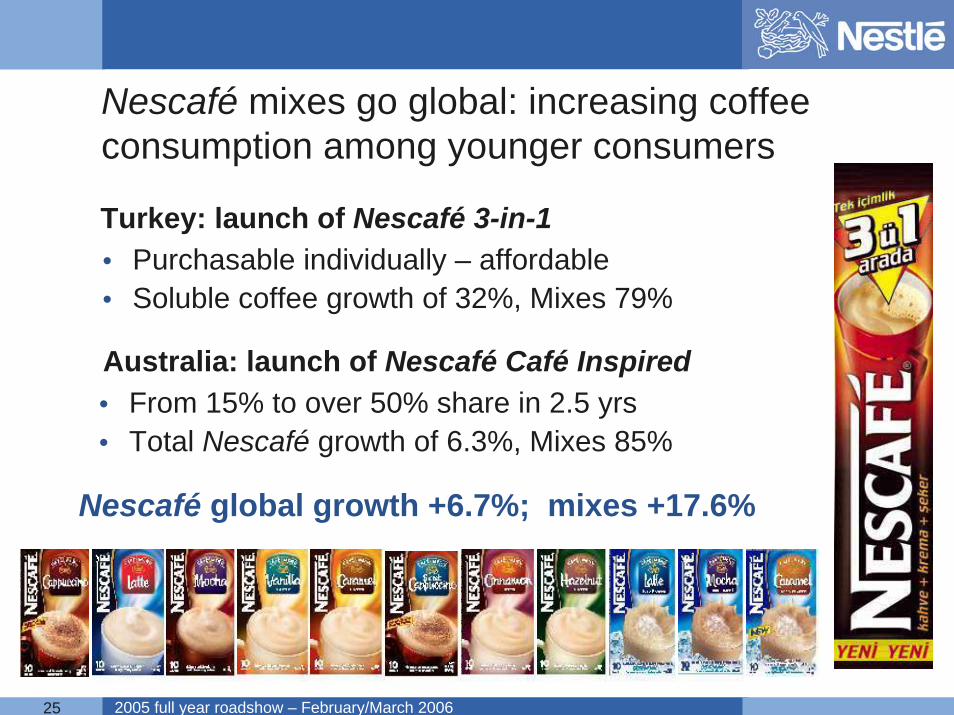
Turkey: launch of Nescafé 3-in-1• Purchasable individually – affordable• Soluble coffee growth of 32%, Mixes 79%
Australia: launch of Nescafé Café Inspired• From 15% to over 50% share in 2.5 yrs• Total Nescafé growth of 6.3%, Mixes 85%
Nescafé global growth +6.7%; mixes +17.6%
Nescafé mixes go global: increasing coffee consumption among younger consumers

Name of chairman2005 full year roadshow – February/March 200626
Nestlé Ideal rolling-out across emerging markets: responding to milk cost crisis for low income families
Milk costs rise significantly – pricing it out of reach of low income families in Latin America – risk of malnutrition in children
25% growth in affordable milks in Latin America – rolling out in AOA as well
Solution: Nestlé Ideal, engineered to a low price but with enhanced nutritional benefits: iron, calcium, vitamins A, C & D

Name of chairman2005 full year roadshow – February/March 200627
1. Long-Term Organic Growth Target 5 - 6%
Resulting in an industry outperforming, long-term total shareholder return
1998 2000 2002 2004 2006 2008 2010
EBITA Margin
1998 2000 2002 2004 2006 2008 20101998 2000 2002 2004 2006 2008 2010
2. Continued year after year improvement of EBITA margin
3. Capital efficiency / Business ROIC
The Nestlé Model

Name of chairman2005 full year roadshow – February/March 200628
• Nestlé Nutrition & steps towards a wellness future• European Chilled Dairy• Nestlé FoodServices• Corporate governance• Outlook
Strategic overview

Name of chairman2005 full year roadshow – February/March 200629
The transformational opportunity
Strategic• From transforming
commodities to added value food products
• From added value to Health, Nutrition & Wellness
Operational• Creating an agile fleet of
businesses/markets• With increased focus on
demand generation • And an efficient support
structure• Resolving under-performers

Name of chairman2005 full year roadshow – February/March 200630
Nestlé Nutrition & steps towards a wellness future
Nestlé Nutrition• Now stand alone & reporting separately• Infant, Healthcare and Performance Nutrition
•
• Targets raised for growth and profitability

Name of chairman2005 full year roadshow – February/March 200631
European Chilled Dairy
• To grow Nestlé's brand presence in Chilled Dairy Müller in Germany, Emmi in Switzerland, Lactalis in Europe
• To make Chilled Dairy as good a business for our shareholders as it is for our consumers
The objective – a creative solution
The challenge• Private label eroding branded
volumes and NCDE market shares
• Chilled Dairy production overcapacity eroding margins

Name of chairman2005 full year roadshow – February/March 200632
JV can leverage
expertise of EUR 6.0 Bio, multi-category
Chilled Business
A base for renewed growth and profitability
Brands & R&D
Brands & R&D
Marketing Expertise
Marketing Expertise
Sales EUR 1.2 Bio
Sales EUR 1.2 Bio
Lactalis Nestlé Venture
Nestlé Lactalis
Supply Chain expertise
Supply Chain expertise
Sales EUR 0.3 Bio
Sales EUR 0.3 Bio
Growth & ProfitabilityGrowth & Profitability
A healthy base for renewed growth and profitability
Immediate low risk, stable income stream for Nestlé without capital allocations

Name of chairman2005 full year roadshow – February/March 200633
The attractiveness of Food ServiceEstimated Global
Sales (CHF bio. 2004)
4.0
3.7
1.9
3.7
6.5
≅3% of OOH Global
Manufacturer Market
• Big and growing opportunity
• Relevant market CHF 400 bio
• Consumer trends drive growth
• Customer consolidation
CHF 2 trillion global consumer spend5-7% growth in major operator segments
80% in Food, 20% in Beverages
50% of US consumer F&B spend is out of home
Common menus and processes drive manufacturer relevant customised solutions
Total = 19.8

Name of chairman2005 full year roadshow – February/March 200634
Five Strategic Business Pillars
• Improve and grow the standard ingredient business
Global Beverage Regional Food
Standard
• CHF 230 bn• 0-3% growth• Average EBITA
StandardReady-to-Serve
• CHF 30 bn• 0-3% growth• High EBITA
Proprietary Solutions
Customized
• CHF 25 bn• 5-10% growth• High EBITA
• Further develop the value added solutions business
• CHF 80 bn• High growth (5-7%)• High EBITA
• ~CHF 15 bn• 4-6% growth• High EBITA

Name of chairman2005 full year roadshow – February/March 200635
iStandard: Build on existing ingredient businesses; Nescafé, Chef, Maggi, etc.
iSolutions: Roll-out of beverages & customized food solutions to major customers
iRoute to Market a critical service component, to be rolled-out market by market
iMust win markets – North America, France, Germany, UK, Japan, Oceania; growth markets e.g. China, ASEAN, India, Brazil, Mexico
iStrategic Business Division reporting to CEO
Strategy

Name of chairman2005 full year roadshow – February/March 200636
Corporate governance
Mandate to facilitate modernisation of articles
• Existing articles relate to out-dated legal context
• "Dispos" currently render major change impossible
• Shareholder survey confirmed desire for change
• Shareholder mandate will lay foundation for future modernisation with shareholder approval, despite "dispos"
• The Board believes this initiative is in shareholders' best interests
AGM 2005: a commitment to shareholdersAGM 2006: a call for action to shareholders
Name of chairman2005 full year roadshow – February/March 200637
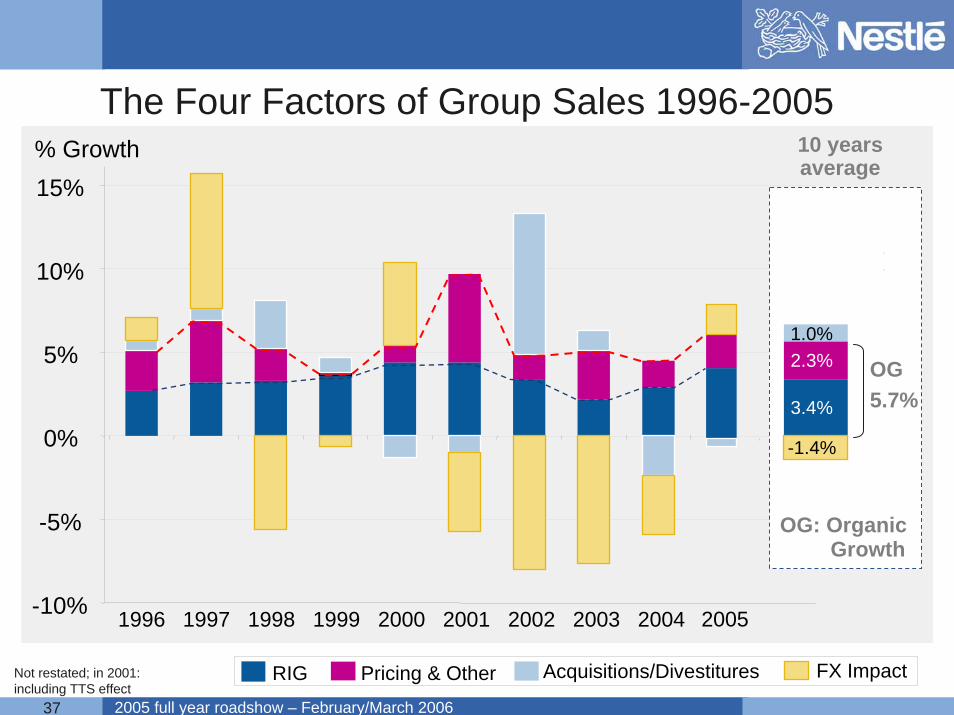
-10%
-5%
0%
5%
10%
15%% Growth
20051996 1997 1998 1999 2000 2001 2002 2003 2004
RIG Pricing & Other Acquisitions/Divestitures FX ImpactNot restated; in 2001: including TTS effect
10 yearsaverage
OG5.7%
OG: OrganicGrowth
3.4%
2.3%
-1.4%
1.0%
The Four Factors of Group Sales 1996-2005

Name of chairman2005 full year roadshow – February/March 200638
Group EBITA Margin over last 10 years
10.2% 10.3% 10.3%
11.8% 11.8%12.3% 12.5%
12.6%12.9%
11.1%
01'0002'0003'0004'0005'0006'0007'0008'0009'000
10'00011'00012'00013'00014'000
mn
CH
F
9.0%
9.5%
10.0%
10.5%
11.0%
11.5%
12.0%
12.5%
13.0%
13.5%
1996 1997 1998 1999 2000 2001 2002 2003 2004 2005
Nestlé Group EBITA and EBITA Margin from 1996 to 2005 % of Sales
EBITA(mn CHF)
Not restated; New NPS definition in 2001

Name of chairman2005 full year roadshow – February/March 200639
Actively managed capital structure benefits shareholders: cash returns
* 2006 assumes completion of 2nd buy-back programme and payment of proposed CHF 9 dividend
2.8
4.5
6.2
0
1.0
2.0
3.0
4.0
5.0
6.0
7.0
2004 2005 2006*
1.4
3.1
2.6
3.6
Dividend
Share buy-back
+59%
+39%
CHFbn

Name of chairman2005 full year roadshow – February/March 200640
Outlook
The Nestlé Model reconfirmed for 2006:5-6% organic growth, plus
consistent margin improvement

Name of chairman
2005 full year results roadshow
2005 full year roadshow – February/March 2006