2 Variables - sci.ubru.ac.th · Mamdadi...
24
1 The Application of Fuzzy Logic to Improve the Likert Scale to Measure Latent 1 Variables 2 Paothai Vonglao 1 3 Abstract 4 The purposes of this research were to study the process of improving Likert scale 5 based on fuzzy logic to measure latent variables and to compare the quality of the data as 6 measured by the improved Likert scale with data measured by the Likert scale. The 7 qualitative study and survey study were used as research methology. Data analysis include, 8 content analysis and statistics such as frequency, arithmetic mean, standard deviation, 9 standard error, consensus index and Kolmogorov-Smirnov test. It was found that the Likert 10 scale could be improved by using the Mamdadi fuzzy inference which included four 11 important steps: (1) Fuzzification, (2) Fuzzy Rule Evaluation, (3) Aggregation and (4) 12 Defuzzification. The comparison result of data analysis quality showed that the data 13 measured by the improved Likert scale was more suitable to be analyzed by arithmetic mean 14 and standard deviation than the data measured by the Likert scale. More importantly, the 15 distribution of data measured by the improved Likert scale was normal with standard error 16 lower. Therefore, it was appropriate to analyze data for statistical inference. 17 Keyword: Latent Variable, Likert Scale, Fuzzy Logic 18 1 Faculty of Science, Ubon Rachathani Rajabhat University, Ubon Rachathani 34000, 19 Thailand. 20 21 22
Transcript of 2 Variables - sci.ubru.ac.th · Mamdadi...

1
The Application of Fuzzy Logic to Improve the Likert Scale to Measure Latent 1
Variables 2
Paothai Vonglao 1 3
Abstract 4
The purposes of this research were to study the process of improving Likert scale 5
based on fuzzy logic to measure latent variables and to compare the quality of the data as 6
measured by the improved Likert scale with data measured by the Likert scale. The 7
qualitative study and survey study were used as research methology. Data analysis include, 8
content analysis and statistics such as frequency, arithmetic mean, standard deviation, 9
standard error, consensus index and Kolmogorov-Smirnov test. It was found that the Likert 10
scale could be improved by using the Mamdadi fuzzy inference which included four 11
important steps: (1) Fuzzification, (2) Fuzzy Rule Evaluation, (3) Aggregation and (4) 12
Defuzzification. The comparison result of data analysis quality showed that the data 13
measured by the improved Likert scale was more suitable to be analyzed by arithmetic mean 14
and standard deviation than the data measured by the Likert scale. More importantly, the 15
distribution of data measured by the improved Likert scale was normal with standard error 16
lower. Therefore, it was appropriate to analyze data for statistical inference. 17
Keyword: Latent Variable, Likert Scale, Fuzzy Logic 18
1 Faculty of Science, Ubon Rachathani Rajabhat University, Ubon Rachathani 34000, 19
Thailand. 20
21
22

2
บทคัดย่อ 1
การวิจยัน้ีมีวตัถุประสงคเ์พื่อศึกษาแนวทางในการพฒันามาตรวดัแบบ Likert ให้มีความเหมาะสม2
ในการวดัตวัแปรแฝงโดยการประยุกต์ใช้ตรรกศาสตร์คลุมเครือและเปรียบเทียบคุณภาพของขอ้มูลท่ีวดัได้3
จากมาตรวดัแบบ Likert ท่ีถูกปรับให้เหมาะสมโดยการประยุกตใ์ชต้รรกศาสตร์คลุมเครือ กบัขอ้มูลท่ีวดัได้4
จากมาตรวดัแบบ Likert ใช้ระเบียบวิธีการวิจัยเชิงคุณภาพ และการส ารวจ โดยใช้วิธีวิเคราะห์เน้ือหา 5
(Content analysis) และสถิติท่ีใช้ ได้แก่ ค่าเฉล่ียเลขคณิต ส่วนเบ่ียงเบนมาตรฐาน ความคลาดเคล่ือน6
มาตรฐาน(Standard Error) ดัชนีความเป็นเอกฉันท์ (Consensus Index) และ Kolmogorov-Smirnov 7
test ผลการศึกษาพบว่า วิธีการปรับตวัเลือก 5 ระดบัของมาตรวดัแบบ Likert ให้เหมาะสม ท าไดโ้ดยอาศยั8
การอนุมานฟัซซ่ี (Fuzzy Inference) แบบ Mamdadi ซ่ึงประกอบด้วยขั้นตอนท่ีส าคญั 4 ขั้น คือ ขั้นท่ี 1 9
การท าฟัซซี (Fuzzification) ขั้นท่ี 2 การประเมินค่ากฎของฟัซซ่ี (Fuzzy Rule Evaluation) ขั้นท่ี 3 การ10
รวมกฎ (Aggregation) และ ขั้นท่ี 4 การท าดีฟัซซ่ี (Defuzzification) ผลการเปรียบเทียบคุณภาพของ11
ขอ้มูลท่ีวดัได้พบว่า ขอ้มูลท่ีวดัได้จากมาตรวดัแบบ Likert ท่ีถูกปรับให้เหมาะสมโดยการประยุกต์ใช้12
ตรรกศาสตร์คลุมเครือ มีความเหมาะสมท่ีจะน ามาวิเคราะห์โดยใช้ค่าเฉล่ียเลขคณิต และส่วนเบ่ียงเบน13
มาตรฐาน มากกว่าขอ้มูลท่ีวดัไดจ้ากมาตรวดัแบบ Likert ท่ีส าคญัคือ ขอ้มูลท่ีเกบ็รวบรวมไดมี้การแจกแจง14
แบบปกติ และมีความคลาดเคล่ือนมาตรฐานน้อยกว่า จึงมีความเหมาะสมท่ีจะน าข้อมูลไปวิเคราะห์โดยใช้15
สถิติอนุมาน ต่อไป 16
ค ำส ำคัญ : ตวัแปรท่ีมีคุณลกัษณะแฝง มาตรวดัแบบ Likert ตรรกศาสตร์แบบคลุมเครือ 17
18
Introduction 19
Internal validity of a quantitative research is a measure validity. Thus, the instrument which 20
be used to collect data for the variables measurement is important. Subjective variables are 21
latent traits. They are not directly observable or measurable. Instead, they are measurable 22
through feelings, behaviors, expressions and personal opinions. To measure all these, the 23
questionnaire can be employed. The Likert scale is one of the popular instruments to 24
measure the said latent traits. The scale was introduced by Rensis Likert (1932). It consists 25
of a series of questions which are indicators of the latent traits. Each question has five scales: 26
least, less, moderate, more and most. The scores for the scale are 1, 2, 3, 4 and 5, 27

3
respectively. Edward (1975) stated that the scores in question are in the interval scale as they 1
are acquired through the psychological scaling. The latent variables are measured by 2
combined scores of all questions, which are in the interval scale (SuvimonTirakanan, 2008: 3
57). However, many scholars had argued that naturally, in the Likert scale the choice or 4
answer is only the data organized in an ordinal scale (Hodge & Gillespie, 2003; Pett, 1997). 5
As for the Likert scale, Cohen, Manion and Morrison (2000) stated that the interval range of 6
different levels are not equal in value. The Likert scale, thus, should be put in an ordinal 7
level. It is inappropriate to analyze the data by addition, subtraction, division or 8
multiplication. Furthermore, it is inappropriate to analyze data by arithmetic mean, and 9
standard deviation (Clegg, 1998). Thus it is inappropriate to measure the latent variables by 10
combining scores of all the items from Likert scale. In addition, Kannikar Sukasem and 11
Suchat Prasitratsin (2007:2) explained that researchers in general would combine the scores 12
from each item, and then use the combined scores to measure the variables, which is incorrect 13
as each item is unequal in its weight. 14
Thanks to the problems described above, many attempts were made to deal with the 15
problem and develop a suitable scale. One of the methods introduced is the fuzzy logic. It 16
was developed from a fuzzy set by Zadeh (1965). Lalla, Facchinett and Matroleo (2004) and 17
Li (2013) had applied the fuzzy logic to improve the Likert scale, which resulted in a new 18
scale known as fuzzy Likert scale(FL). He also compared an efficiency of this scale with 19
Likert Scale. It was found that measuring the variables by the fuzzy Likert scale was more 20
accurate than measuring by the general Likert scale. With the reasons described, this 21
research tried to find out the process to apply the fuzzy logic to the Likert scale to measure 22
the latent variables in a more valid and efficient manner. It is expected that the research 23
would lead to the measuring methods which are more effective and appropriate. 24
25

4
Literature Reviews 1
2
Attitude Measuring by Likert scale 3
Attitude is an important variable with latent traits. According to Luan Saiyot and Ankana 4
Saiyot (2000:52-60) attitude means emotions, and feelings of a person coming from an 5
experience in learning something called a target. From learning, there appeared a feeling of 6
like or dislikes, agreement or disagreement. That tendency runs from low to high intensity. 7
Ransis Likert (1932) was the first to propose the method to measure an attitude by combining 8
the scores of each question. This method was called summate rating (Suwimon Tirakanan, 9
2008:191-192). However, the Likert scale has a disadvantage; it is unclear whether data 10
measured are in ordinal level or interval level (Jamieson, 2004). Although Ransis Likert had 11
the assumption that based on the Likert scale, data acquired were in interval level, it can be 12
observed that the data measured by the Likert scale are in the ordinal order (Hodge & 13
Gillespie, 2003; Pett, 1997). Data in the interval level show an equal range of two 14
consecutive values. As for the feeling measured by the Likert scale the interval range 15
between two levels is different (Cohen, Manion and Morrison, 2000). As a result, the Likert 16
scale cannot estimate varying interval ranges between data (Russell and Bobko, 1992). What 17
can be measured by the Likert scale is only the information which cannot distinguish the 18
interval. Furthermore, alternative forms of the Likert scale are similar. Respondents have to 19
choose only one choice, which is unrealistic and unreliable (Hodge &Gillespie, 2003; Orvik, 20
1972) 21
Thanks to the disadvantages of the Likert scale as explained, it is apparent that the 22
data acquired may be unreliable. Several academics attempted to improve the Likert scale. 23
Chang (1994) proposed that more levels of the scale should be added so that more details 24

5
could be obtained. However, it may be difficult to respond as respondents cannot identify 1
their genuine feelings about the question (Russel and Bobko, 1992). Albaum (1997) 2
proposed two steps. First, there are only two choices: agree or disagree. After that the 3
respondents have to answer according to the intensity level: less or more. By doing this, it is 4
possible to avoid the answer of ‘moderate’. Hodge and Gillespie (2003) had proposed that 5
the question should be divided into two parts. First, the leading question was raised to 6
encourage respondents to express their feelings, which was followed by a secondary question 7
on the contents about the leading questions both positive and negative. The respondents can 8
choose from 0-10 depending on the intensity. However, this method may not be effective as 9
the respondents can get lazy to answer all the questions. Li (2013) proposed a construction of 10
the Fuzzy Likert scale (FLS). The respondents have only one choice. Its membership value 11
lies between 0-1. That is, if an opinion is inclined towards that choice, its value is set at 1. 12
On the contrary, if the opposite happens, the answer is in the ordered pair. The first is an 13
answer and the second is the value of membership. The acquired answer is adjusted into the 14
fuzzy Likert scale: 15
o
oo
A
AuFLS ……………………………. (1) 16
FLS means the fuzzy Likert scale. ou means to the level of an opinion according to the Likert 17
scale. oA means the area of membership function that is truncated by membership value. 18
Although the improved scale may provide more details and more reliability, there are 19
disadvantages. Respondents may find it hard to decide and they may get bored. As a 20
consequence they may not give genuine answers. 21
22

6
Fuzzy Logic 1
Fuzzy logic originated from the dissertation of Zadeh (1965). It is based on the principles 2
that out of all things in the world, there is a small portion of things which is certain. Things 3
are mainly uncertain. The things which are uncertain characterize two traits: being random 4
and fuzzy. 5
Fuzzy set 6
Classical set is undefined term, it characterizes a group consisting of various 7
members which are identifiable. However, there are a lot of groups which cannot be 8
explicitly identified. The group having such characteristics is called fuzzy set. It refers to 9
the set of things which cannot be identified whether the things in question are the member of 10
the set or not. Nevertheless, it is possible to say the tendency of something to be a member 11
of a set through the membership function whose value ranges between 0 and 1. If the 12
membership value of something gets closer to 1, that has a high level of membership. By 13
contrast, if the membership value gets closer to 0, it has a low level of membership. 14
Definition: if X is not empty set, x is any member of X and A is fuzzy set whose 15
membership function is A , fuzzy set A can be written in the form of a pair set as follows: 16
1,0:,/, XxXxxxA AA 17
Membership function 18
Membership function is used to determine the membership level for x . There are many 19
types of the membership function. Which type is to be used depends on suitability and 20
relevant information based on the expert’s consideration. The types include triangular 21

7
membership function trapezoidal membership function, Gaussian membership function, and 1
bell-shaped membership function. Each function has different parameter and shape. For 2
example, the triangular membership function has parameter of three values: real number3
cba ,, , for a b c . The function value can be set as follows. 4
5
/ ,
/ ,
0,
A
x a b a a x b
x c x c b b x c
elsewhere
………………………………..(2) 6
7
Figure 1 Triangular membership function with parameter a=1 ,b=2 and c=3. 8
9
Fuzzy rule 10
Any given system consists of input and output. System experts know the relations of these 11
two factors. The input is the cause and the output is the result. Both are explained in 12
linguistic variables as follows: less, moderate and more. The variable is explainable by fuzzy 13
set. To control the system, the experts will design the causal relations between input and 14
output: IF input THEN output. This is called fuzzy rule. The number of the fuzzy rules 15

8
depends on the number of linguistic variables used to explain input and output. A general 1
form of the fuzzy rules can be determined as follows. 2
Supposing that a system has n input and 1 output. Causal relation between the factors 3
can be illustrated with L rules. The Input is explained with linguistic variable: ijA4
Li ,...,3,2,1; and 1,2,3, ,j n . The output is explained with linguistic variable: iC5
; 1,2,3, , .i L Let 1 2 3, , , , nx x x x x is a value of the input and y is a value of the output. 6
A general form of rule i th of the fuzzy rule of Mamdani is as follow : 7
8
iinnii CisyTHENAisxANDANDAisxANDAisxIF 22119
10
Application of fuzzy logic 11
Fuzzy logic can be applied to decide or control system through the principle of fuzzy 12
inference. Fuzzy inference has two important methods: Mamdani fuzzy inference and 13
Sugeno fuzzy inference. In this paper, only the former is described. Mamdani fuzzy inference 14
was first proposed in 1975 by Professor Ebrahim Mamdani of London University (Mamdani 15
and Assilian, 1975). Fuzzy inference in question consists of four stages as follow : 16
Stage 1. Fuzzification: in this stage, experts take into account details concerning 17
input, output and results. The input and output are considered as input and output variables. 18
Then defined linguistic variables to explain each variable. The linguistic variables determine 19
fuzzy set and its membership function. Then, the fuzzy rules are established to show the 20
relations between input and output. 21
Stage 2. Fuzzy rule evaluation: membership function value of each rule is to be 22
established by Equation(3). 23

9
nAAAL xxxx
LnLL ,,,,min 21 21
………………………………… (3) 1
If the value of membership function of any rule is equal to zero, it will not be considered. If 2
the value of membership function is not equal to zero, the value will be used to truncate or 3
scale the shape of the output membership function in this rule. 4
Stage 3. Aggregation: fuzzy set of the output in stage 2 is combined by union 5
operation. 6
Stage 4. Defuzzification: fuzzy set which results from combined rules in stage three 7
is changed into a crisp value. There are several methods, one of which is seeking for a center 8
of gravity(COG). COG of fuzzy set A in the range ],[ ba can be done by Equation.(4). 9
b
a
A
b
a
A
dxx
xdxx
COG
……………………………………………. (4) 10
11
Methods 12
13
Participants 14
The target population was the first year students of the Faculty of Science Ubon Ratchathani 15
Rajabhat University in the academic year 2014. The total number of the students in the study 16
was 302 (Policy and plan division, 2014). 17
18
19

10
Data collection 1
The research instrument was a fifteen-item questionnaire to assess an attitude towards 2
mathematics based on a five-Likert scale. The format in question was adapted from the one 3
used by Luan Saiyot and Angkana Saiyout (2000: 98). Five experts were asked to evaluate 4
its validity. It was found that the value of index of item-objective congruence (IOC) ranged 5
from 0.6 to 1. Then, the questionnaire was tried out with 50 first year general science students 6
of the Faculty of Education Ubon Rachathani Rajabhat University in the academic year 7
2014. The items having a discrimination value of greater than 0.2 were selected. As a result, 8
the 12 items were acquired. The questionnaire of 12 items were administered with the target 9
population. Data were collected from 302 students who were the first year students in the 10
academic year 2014 concerning the attitude towards mathematics by using the questionnaire. 11
The samples were chosen from the 302 questionnaire base on simple random sampling with 12
sample size as 30, 40, 50, …, 200 respectively. Data from each sample size were collected to 13
compare the quality of data in each sample size about inference. 14
15
Data Analysis 16
The fuzzy logic was applied to improve the Likert scale by a content analysis. MATLAB 17
software was then used to acquire a suitable response based on the applied process. The 18
quality of data which were acquired from the improved Likert scale was compared with data 19
acquired from Likert and fuzzy Likert scale. Statistics used were arithmetic mean )(X , 20
standard deviation .).( DS , standard error .).( ES and consensus index (Cns) (Tastle & 21
Wierman, 2007). The consensus index can be computed by Equation(5). 22

11
x
xin
i
id
xpXCns
1log1 2
1
………………………………. (5) 1
XCns stands for consensus; X stands for an opinion; ix stands for an opinion level i ; n 2
stands for number of opinion level ; ip stands for a ratio of the sample whose opinion is at 3
level i ; xd stands for a difference of maximum and minimum an opinion; x stand for 4
mean of an opinion of all the samples. The index of consensus ranged from 0 to 1. If it is 5
close to 1, it means that the opinion of the samples is in accordance with the issue of their 6
interest. On the contrary, if it is close to 0, it means that the opinion of the samples is 7
contradictory in the issue under study. 8
9
Results 10
11
The Process to Improve the Likert Scale 12
By applying a fuzzy logic, we assume that latent variable is measureable by using the 13
question about that variable. The question should asked the respondent how much he or she 14
agreed or disagreed. An opinion should have five levels based on Likert scale: Strongly 15
disagreed, Disagree, Neither agree nor disagree, Agree and Strongly agree. All these levels 16
cannot be categorically separated. In other words, one level overlaps with others thanks to 17
ambiguous opinions. In addition, the ambiguity of opinion depends on the quality of the 18
question in terms of validity and discrimination as well. Thus, the answer is not real. Hence, 19
to measure the value of latent variables, it needs to consider sharing the validity and 20

12
discrimination with the answer of each item. Thus, we can apply a fuzzy logic to improve the 1
answer from Likert scale by using Mamdani inference in four stages. 2
Stage 1: fuzzification: in each question, it is necessary to determined three inputs: 3
opinion of respondents (O), validity (V) and discrimination (R). The output is a suitable 4
answer (T). The linguistics variables which are used to explain the opinion are Strongly dis 5
agreed (SD), Disagreed (D), Neither agree nor disagree (NN), Agreed (A) and Strongly 6
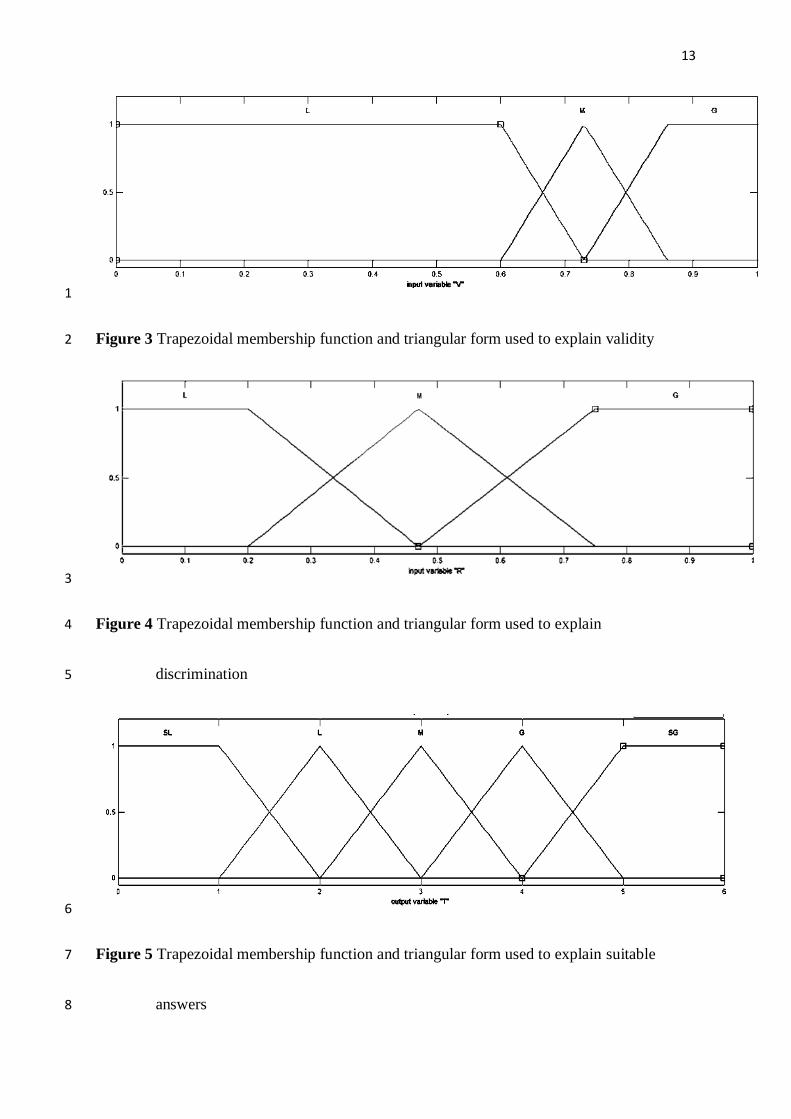
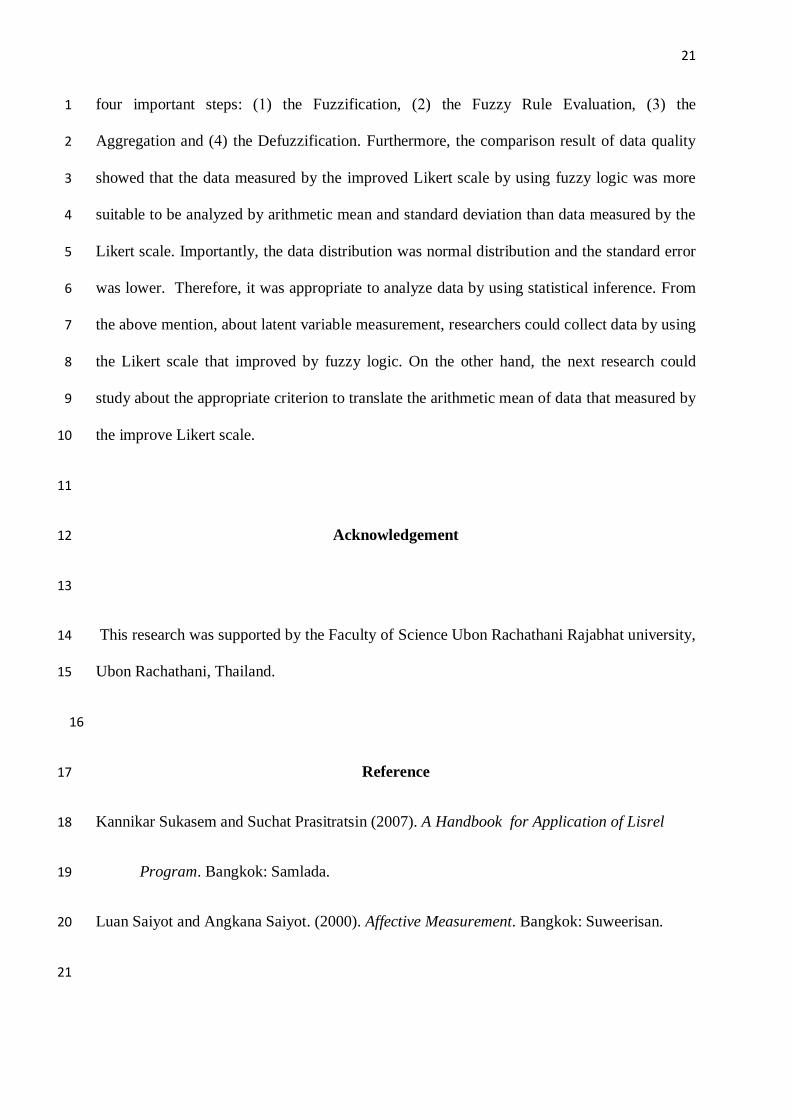
agreed (SA). Validity could be explained in terms of less (L), moderate (M) and more (G). 7
Discrimination could be explained in terms of less (L), moderate (M), and more (G). The 8
suitable answer can be explained in terms of least (SL), less (L), moderate(M), more(G) and 9
most(SG). Membership function of the linguistic variables are shown in figures 2-5. 10
11
Figure 2 Bell-shaped membership function used to explain the opinion of the respondents 12
13
14
13
1
Figure 3 Trapezoidal membership function and triangular form used to explain validity 2
3
Figure 4 Trapezoidal membership function and triangular form used to explain 4
discrimination 5
6
Figure 5 Trapezoidal membership function and triangular form used to explain suitable 7
answers 8

14
In total 29 rules of fuzzy rule are made by the experts. Some of them are given below. 1
Rule 1 IF (O is SD) and (V is L) and (R is L) THEN (T is SL) 2
Rule 2 IF (O is SD) and (V is L) and (R is L) THEN (T is L) 3
4
Rule 28 IF (O is A) and (V is G) and (R is G) THEN (T is G) 5
Rule 29 IF (O is SA) and (V is G) and (R is G) THEN (T is SG) 6
Stage 2: Fuzzy rule evaluation: the value of inputs including opinion level, validity, 7
and discrimination is used to find membership value of input from each fuzzy rule. If the 8
rule has the membership function value equal to zero, it is not considered. If the value of 9
membership function is not equal to zero, it is used to truncate the shape of the output 10
membership function. 11
Stage 3: Aggregation: fuzzy set of the output which is truncated is combined by 12
union operation. 13
Stage 4: Defuzzification: getting suitable answer by converting fuzzy set which is 14
combined in stage 3 into a crisp value through COG; the value acquired is a suitable answer 15
for the question. It is called an improved Likert scale. 16
17
18
19
20

15
Comparison of the Quality of Data 1
The answer of each item of the Likert scale that improved by using the process on prior 2
section are shown in Table 1. An attitude towards mathematics as measured by Likert scale 3
and the improved Likert scale are shown in Table 2. 4
Table 1 The Likert scale that improved by applying fuzzy logic. 5
Item IOC Discrimination Likert Scale
1 2 3 4 5
1
2
3
4
5
6
7
8
9
10
11
12
0.8
1
0.8
1
1
1
1
0.8
0.6
1
1
1
0.551
0.401
0.359
0.576
0.369
0.651
0.356
0.29
0.62
0.44
0.621
0.464
1.46
1.33
1.46
1.40
1.40
1.39
1.43
1.57
1.50
1.27
1.46
1.23
2.24
2.22
2.24
2.23
2.23
2.23
2.24
2.18
2.24
2.22
2.24
2.22
3.07
3.06
3.07
3.07
3.07
3.07
3.07
3.10
3.08
3.06
3.07
3.06
4.05
4.05
4.05
4.05
4.05
4.05
4.05
3.98
4.04
4.05
4.05
4.05
4.55
4.68
4.55
4.61
4.61
4.62
4.58
4.44
4.51
4.74
4.55
4.78
6
Table 2 Population mean and standard deviation of an attitude towards mathematics 7
measured by the Likert scale and the improved Likert scale. 8
Items Likert Scale
Improved
Likert scale
1) I study mathematics with a relative comfort
2.65 0.84 2.80 0.72
2) Solving mathematical questions is fun.
2.80 0.89 2.91 0.78
3) Solving mathematical questions is boring.
3.27 0.97 3.34 0.82
4) Learning mathematics is boring.
3.32 1.02 3.37 0.87
5) Mathematic is basic to life.
3.54 1.09 3.53 0.89
9

16
Table 2 (continued) Population mean and standard deviation of an attitude towards 1
mathematics as measured by the Likert scale and the improve Likert scale. 2
Items Likert Scale
Improved
Likert scale
6) I like calculating without the help of a calculator.
2.66 0.97 2.79 0.83
7) Mathematic knowledge is fundamental to all
subjects.
3.33 0.97 3.38 0.81
8) Mathematics is most valuable.
3.35 1.01 3.35 0.79
9) I turn my face away when I see mathematics books.
3.37 1.00 3.41 0.82
10) I like to think about or reflect on mathematics.
2.74 0.84 2.86 .75
11) Mathematics is a terrible subject.
3.46 1.00 3.48 0.82
12) Majority of people do not like mathematics.
2.68 1.12 2.78 1.03
Attitude towards mathematics
3.09 0.45 3.17 0.38
3
By using the method explained by Li (2013) to compare the quality of data, the 4
samples of 100 students are set in the research. Their attitude towards mathematics is 5
measured by the first question by using the Likert scale, fuzzy Likert scale and improved 6
Likert scale. For the improved Likert scale, the Likert scale were improved based on the 7
Mamdani inference in four stages. The result from the inference were respectively 1.46, 2.24, 8
3.07, 4.05 and 4.55. The answers of the samples are to be distributed in three cases. Statistics 9
value of data is calculated. Details can be demonstrated in Tables 3-5. 10
11
12
13

17
Table 3 Statistics according to a distribution of data as measured by the Likert scale. 1
Case Likert Scale
X ..DS Cns 1 2 3 4 5
1 0 0 100 0 0 3 0 1
2 50 0 0 0 50 3 2.01 .00
3 15 15 40 15 15 3 1.23 .58
2
Table 4 Statistics according to the distribution of data as measured by the fuzzy Likert 3
Scale. 4
Case Fuzzy Likert scale
X ..DS Cns 1 1.5 2 2.5 3 3.5 4 4.5 5
1 0 0 0 30 40 30 0 0 0 3 .39 .88
2 25 25 0 0 0 0 0 25 25 3 1.78 .16
3 10 10 10 10 20 10 10 10 10 3 1.23 .54
5
Table 5 Statistics value according to the distribution of data as measured by the improved 6
Likert Scale. 7
Case Improved Likert Scale
X ..DS Cns 1.46 2.24 3.07 4.05 4.55
1 0 0 100 0 0 3.10 0.00 1
2 50 0 0 0 50 3.01 1.56 0.00
3 15 15 40 15 15 3.07 0.99 0.55
8
From the Table 3-5, it was found that arithmetic mean of data as measured by the Likert scale 9
and the fuzzy Likert scale was equal to 3 in all cases. It shows that arithmetic mean as gained 10
by using the two scales did not reflect the fact of data. However, data as measured by the 11
improved Likert scale had different arithmetic means in all cases as 3.10, 3.01 and 3.07 12
respectively. It shows that the arithmetic mean could reflect the fact of data. In case 3 the 13
standard deviation of data as measured by the Likert scale and the fuzzy scale was equal to 14

18
1.23. It shows that the standard deviation gained by using the two scales cannot reflect the 1
fact of data. However, data as measured by using the improved Likert scale had the standard 2
deviation equal to 0.99, which had more coherent. 55.0Cns It can be explained that the 3
standard deviation used to analyze data can reflect the facts of data. 4
Table 6 Normal distribution testing by using Kolmogorov-Smirnov test. 5
Scale Absolute Positive Negative z p
Likert scale 3.098 0.452 0.08 0.079 -0.08 1.395* 0.041
Improved Likert scale 3.168 0.379 0.058 0.037 -0.058 1.012 0.257
6
Table 6 shows that data measured by the Likert scale show a distribution different from a 7
normal distribution with a statistical significance of .05. The data measured by the improved 8
Likert scale show a normal distribution at the significance of .05. 9
Table 7 Sample size, mean, standard error and standard deviation. 10
n Likert scale )098.3( Improved Likert scale ( 3.168)
X ..ES ..DS X ..ES ..DS
30 3.1556 0.07928 0.43425 3.2111 0.06712 0.36762
40 3.1167 0.07716 0.48803 3.1754 0.06237 0.39445
50 3.1750 0.06659 0.47088 3.2290 0.05561 0.39320
60 3.0806 0.05176 0.40097 3.1507 0.04347 0.33674
70 3.0250 0.06411 0.53639 3.1057 0.05362 0.44859
80 3.1542 0.05880 0.52589 3.2105 0.04932 0.4411
90 3.1185 0.04291 0.40710 3.1864 0.03663 0.34751
100 3.0867 0.04639 0.46389 3.1534 0.03840 0.38398
110 3.1136 0.04326 0.45374 3.1811 0.03616 0.37923
120 3.0785 0.04567 0.50027 3.1478 0.03791 0.41529
11
12
13
14

19
Table 7 (continued) Sample size, mean, standard error and standard deviation. . 1
n Likert scale )098.3( Improved Likert scale ( 3.168)
X ..ES ..DS X ..ES ..DS
130 3.0929 0.04261 0.48587 3.1633 0.03590 0.40933
140 3.1339 0.03806 0.45034 3.1976 0.03181 0.37640
150 3.0972 0.03873 0.47440 3.1669 0.03224 0.39482
160 3.0656 0.03359 0.42486 3.1418 0.02844 0.35977
170 3.1015 0.03582 0.46698 3.1700 0.02998 0.39088
180 3.0917 0.03472 0.46578 3.1593 0.02904 0.38961
190 3.0825 0.03495 0.48181 3.1522 0.02926 0.40328
200 3.0712 0.03157 0.44642 3.1439 0.02653 0.37519
2
Table 7 show that the standard error of the sample mean of the data measured by the improve 3
Likert scale has less value than the standard error of the sample mean of data measured by the 4
Likert scale. 5
6
Discussion 7
8
The improved Likert scale with fuzzy logic is more effective than Likert scale and fuzzy 9
Likert scale because of its scale is continuous. In addition, mean and standard deviation 10
reflect the fact of data measured by the improved Likert scale. Especially, standard deviation 11
of the data is according to the consensus index. Furthermore, standard error of data measured 12
by the improved Likert scale is less than other in all case of sample size, let sample mean 13
closer to population mean. Most importantly, distribution of data measured by the scale is 14
normal distribution, inferential statistics is appropriate to analyze the data. Thank to the 15
previous mention, data measured by the improved Likert scale can be applied for data 16
analysis by using descriptive statistics. The data analysis is more appropriate than the data as 17
measured by the Likert scale. Because of, it was found that the distribution of data measured 18

20
by the improved Likert scale is normal distribution with less standard error, which was 1
different from the data measured by Likert scale. Thus, the data measured by the improved 2
Likert scale were more appropriate to use an inferential statistics method for data analysis. 3
Furthermore, as the improved Likert scale uses a measuring tool like the Likert scale, it is 4
more convenient to collect data by the improved Likert scale than the scales proposed by 5
Chang (1994), Albaum (1997), Hodge and Gillespie (2003). Especially, it more convenient 6
to collect data than the fuzzy Likert scale which proposed by Li (2013) because the fuzzy 7
Likert scale is appropriately fitted only for some specific topic. In this case the respondents 8
usually own some quantitative data in order to assign the membership value for their answer 9
which is slightly complicated. However, constructing and improving the Likert scale with 10
fuzzy logic may cause difficulties when adjusting the scale on fuzzy inference process. The 11
validity of measurement highly depends on key factors such as appropriate membership 12
function and the suitable fuzzy rules. These factors are mainly depend on the expert’s 13
discretion. 14
15
Conclusion and Recommendation 16
17
Although Likert scale had been widely used to measure latent variable, data content from the 18
scale is only ordinal level. There are not appropriate to analyze the data by using arithmetic 19
mean and standard deviation include any inferential statistics method. The statistics method, 20
ago use to analyze data that measured by Likert scale was merely depend on the assumption 21
of Ransis Likert (1932) as the data was in interval level. This research object to transfer the 22
Likert scale to the suitable scale by using fuzzy logic. This research find that the process to 23
improve the Likert scale, can be use the fuzzy inference of the Mamdadi which included 24
21
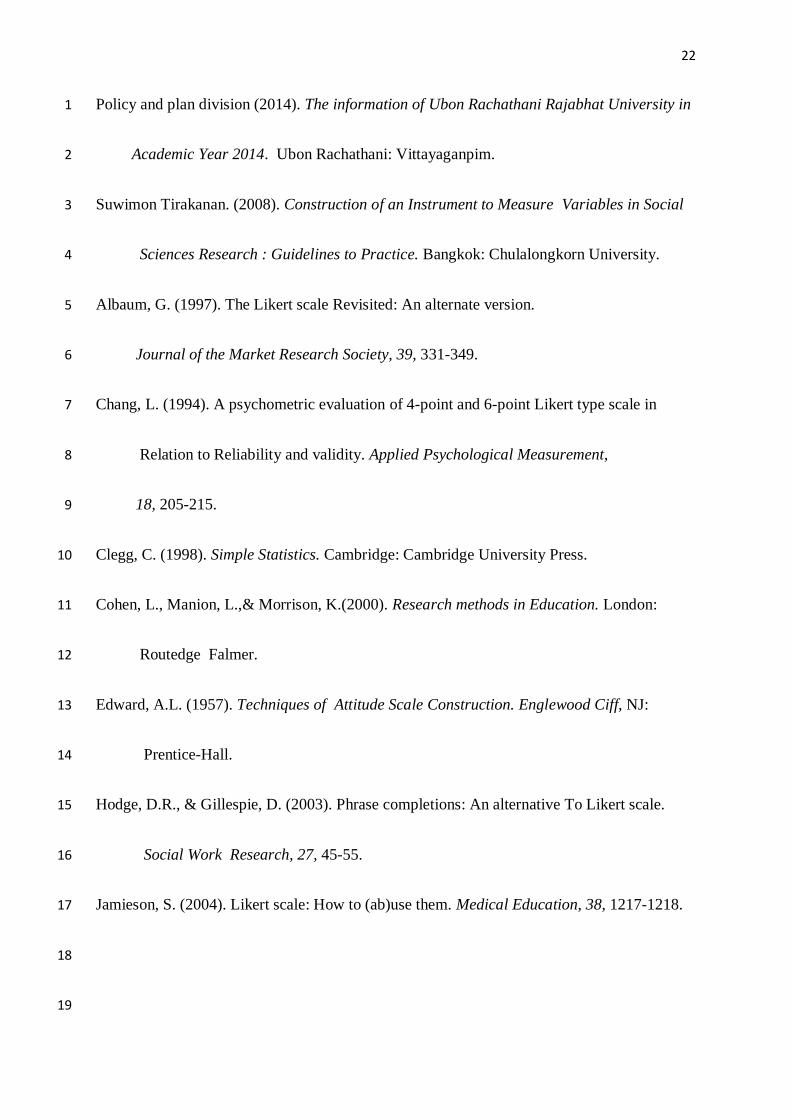
four important steps: (1) the Fuzzification, (2) the Fuzzy Rule Evaluation, (3) the 1
Aggregation and (4) the Defuzzification. Furthermore, the comparison result of data quality 2
showed that the data measured by the improved Likert scale by using fuzzy logic was more 3
suitable to be analyzed by arithmetic mean and standard deviation than data measured by the 4
Likert scale. Importantly, the data distribution was normal distribution and the standard error 5
was lower. Therefore, it was appropriate to analyze data by using statistical inference. From 6
the above mention, about latent variable measurement, researchers could collect data by using 7
the Likert scale that improved by fuzzy logic. On the other hand, the next research could 8
study about the appropriate criterion to translate the arithmetic mean of data that measured by 9
the improve Likert scale. 10
11
Acknowledgement 12
13
This research was supported by the Faculty of Science Ubon Rachathani Rajabhat university, 14
Ubon Rachathani, Thailand. 15
16
Reference 17
Kannikar Sukasem and Suchat Prasitratsin (2007). A Handbook for Application of Lisrel 18
Program. Bangkok: Samlada. 19
Luan Saiyot and Angkana Saiyot. (2000). Affective Measurement. Bangkok: Suweerisan. 20
21
22
Policy and plan division (2014). The information of Ubon Rachathani Rajabhat University in 1
Academic Year 2014. Ubon Rachathani: Vittayaganpim. 2
Suwimon Tirakanan. (2008). Construction of an Instrument to Measure Variables in Social 3
Sciences Research : Guidelines to Practice. Bangkok: Chulalongkorn University. 4
Albaum, G. (1997). The Likert scale Revisited: An alternate version. 5
Journal of the Market Research Society, 39, 331-349. 6
Chang, L. (1994). A psychometric evaluation of 4-point and 6-point Likert type scale in 7
Relation to Reliability and validity. Applied Psychological Measurement, 8
18, 205-215. 9
Clegg, C. (1998). Simple Statistics. Cambridge: Cambridge University Press. 10
Cohen, L., Manion, L.,& Morrison, K.(2000). Research methods in Education. London: 11
Routedge Falmer. 12
Edward, A.L. (1957). Techniques of Attitude Scale Construction. Englewood Ciff, NJ: 13
Prentice-Hall. 14
Hodge, D.R., & Gillespie, D. (2003). Phrase completions: An alternative To Likert scale. 15
Social Work Research, 27, 45-55. 16
Jamieson, S. (2004). Likert scale: How to (ab)use them. Medical Education, 38, 1217-1218. 17
18
19

23
Lalla, M., Facchinett, G., & Mastroleo, G.(2004). Ordinal scale and fuzzy set systems to 1
measure agreement: An application to the evaluation of teaching activity. Quality & 2
Quantity. 38, 577 - 601. 3
Li, Q. (2013). A novel Likert scale base on fuzzy set theory. Expert Systems with Application, 4
40, 1609-1618. 5
Likert, R.A. (1932). A Technique for the Measurement of attitudes. Archives of Psychology, 6
40, 5-53. 7
Mamdani, E.H. & Assilian, S. (1975). An experiment in linguistic synthesis with a fuzzy 8
Logic controller. International of Man-Machine Studies, 7(1), 1-13. 9
Orvik, J.M. (1972). Social desirability for Individual, his group, and society. Multivariate 10
Behavioral Research, 7, 3 – 32. 11
Pett, M.A. (1997). Nonparametric statistics for health care research: statistics for small 12
sample and unusual distribution. London: SAGE Publication. 13
Russell, C.J., & Bobko, P. (1992). Moderate regression analysis and Likert scales: Too 14
coarse. Journal of Applied Psychology, 77, 336 - 342. 15
Tastle, W.J., & Wierman, M.J. (2007). Consensus and dissention: A measure of ordinal 16
dispersion. International Journal of Approximate Reasoning, 45, 531 – 545. 17
Zadeh, L.A. (1965). Fuzzy set. Information and Control, 6, 338 – 353. 18
19

24