Quadratic Equations, Inequalities and Functions Module 1 Lesson 1 Quadratic Functions.

2 Quadratic Functions2.1 Transformations of Quadratic Functions
2.2 Characteristics of Quadratic Functions
2.3 Focus of a Parabola
2.4 Modeling with Quadratic Functions
Meteorologist (p. 77)
SEE the Big Idea
Electricity-Generating Dish (p. 71)
Soccer (p. 63)
Gateshead Millennium Bridge (p. 64)
Kangaroo (p. 53)
hsnb_alg2_pe_02op.indd 44hsnb_alg2_pe_02op.indd 44 2/5/15 10:04 AM2/5/15 10:04 AM
45
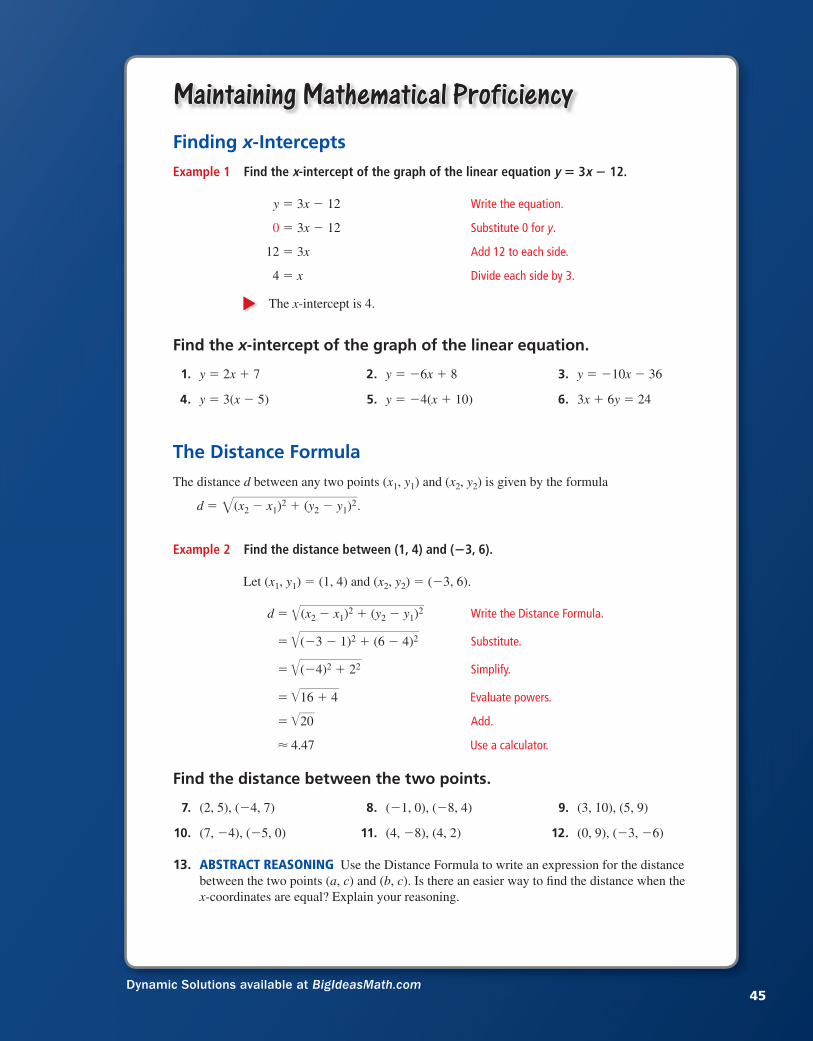
Maintaining Mathematical ProficiencyMaintaining Mathematical ProficiencyFinding x-Intercepts
Example 1 Find the x-intercept of the graph of the linear equation y = 3x − 12.
y = 3x − 12 Write the equation.
0 = 3x − 12 Substitute 0 for y.
12 = 3x Add 12 to each side.
4 = x Divide each side by 3.
The x-intercept is 4.
Find the x-intercept of the graph of the linear equation.
1. y = 2x + 7 2. y = −6x + 8 3. y = −10x − 36
4. y = 3(x − 5) 5. y = −4(x + 10) 6. 3x + 6y = 24
The Distance Formula
The distance d between any two points (x1, y1) and (x2, y2) is given by the formula
d = √——
(x2 − x1)2 + (y2 − y1)
2 .
Example 2 Find the distance between (1, 4) and (−3, 6).
Let (x1, y1) = (1, 4) and (x2, y2) = (−3, 6).
d = √——
(x2 − x1)2 + (y2 − y1)
2 Write the Distance Formula.
= √——
(−3 − 1)2 + (6 − 4)2 Substitute.
= √—
(−4)2 + 22 Simplify.
= √—
16 + 4 Evaluate powers.
= √—
20 Add.
≈ 4.47 Use a calculator.
Find the distance between the two points.
7. (2, 5), (−4, 7) 8. (−1, 0), (−8, 4) 9. (3, 10), (5, 9)
10. (7, −4), (−5, 0) 11. (4, −8), (4, 2) 12. (0, 9), (−3, −6)
13. ABSTRACT REASONING Use the Distance Formula to write an expression for the distance
between the two points (a, c) and (b, c). Is there an easier way to fi nd the distance when the
x-coordinates are equal? Explain your reasoning.
Dynamic Solutions available at BigIdeasMath.com
hsnb_alg2_pe_02op.indd 45hsnb_alg2_pe_02op.indd 45 2/5/15 10:04 AM2/5/15 10:04 AM

46 Chapter 2 Quadratic Functions
Mathematical Mathematical PracticesPractices
Mathematically profi cient students distinguish correct reasoning from fl awed reasoning.
Using Correct Logic
Core Core ConceptConceptDeductive Reasoning In deductive reasoning, you start with two or more statements that you know or
assume to be true. From these, you deduce or infer the truth of another statement.
Here is an example.
1. Premise: If this traffi c does not clear, then I will be late for work.
2. Premise: The traffi c has not cleared.
3. Conclusion: I will be late for work.
This pattern for deductive reasoning is called a syllogism.
Recognizing Flawed Reasoning
The syllogisms below represent common types of fl awed reasoning. Explain why each
conclusion is not valid.
SOLUTION
a. The ground may be wet for another reason.
b. The ground may still be wet when the rain stops.
c. The services could be funded another way.
d. People other than students use cell phones.
a. When it rains, the ground gets wet.
The ground is wet.
Therefore, it must have rained.
c. Police, schools, and roads are
necessary.
Taxes fund police, schools, and roads.
Therefore, taxes are necessary.
b. When it rains, the ground gets wet.
It is not raining.
Therefore, the ground is not wet.
d. All students use cell phones.
My uncle uses a cell phone.
Therefore, my uncle is a student.
Monitoring ProgressMonitoring ProgressDecide whether the syllogism represents correct or fl awed reasoning. If fl awed, explain why the conclusion is not valid.
1. All mammals are warm-blooded.
All dogs are mammals.
Therefore, all dogs are warm-blooded.
3. If I am sick, then I will miss school.
I missed school.
Therefore, I am sick.
2. All mammals are warm-blooded.
My pet is warm-blooded.
Therefore, my pet is a mammal.
4. If I am sick, then I will miss school.
I did not miss school.
Therefore, I am not sick.
hsnb_alg2_pe_02op.indd 46hsnb_alg2_pe_02op.indd 46 2/5/15 10:04 AM2/5/15 10:04 AM
Section 2.1 Transformations of Quadratic Functions 47
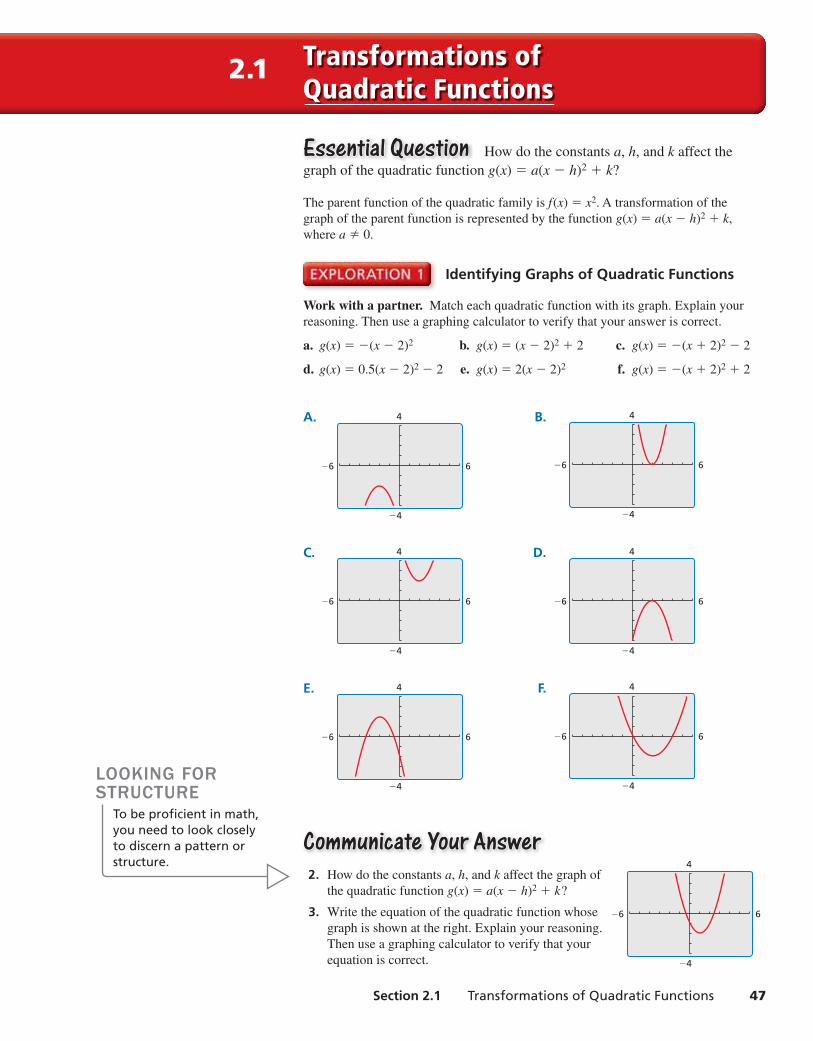
Essential QuestionEssential Question How do the constants a, h, and k affect the
graph of the quadratic function g(x) = a(x − h)2 + k?
The parent function of the quadratic family is f(x) = x2. A transformation of the
graph of the parent function is represented by the function g(x) = a(x − h)2 + k,
where a ≠ 0.
Identifying Graphs of Quadratic Functions
Work with a partner. Match each quadratic function with its graph. Explain your
reasoning. Then use a graphing calculator to verify that your answer is correct.
a. g(x) = −(x − 2)2 b. g(x) = (x − 2)2 + 2 c. g(x) = −(x + 2)2 − 2
d. g(x) = 0.5(x − 2)2 − 2 e. g(x) = 2(x − 2)2 f. g(x) = −(x + 2)2 + 2
A.
6
−4
−6
4 B.
6
−4
−6
4
C.
6
−4
−6
4 D.
6
−4
−6
4
E.
6
−4
−6
4 F.
6
−4
−6
4
Communicate Your AnswerCommunicate Your Answer 2. How do the constants a, h, and k affect the graph of
the quadratic function g(x) = a(x − h)2 + k?
3. Write the equation of the quadratic function whose
graph is shown at the right. Explain your reasoning.
Then use a graphing calculator to verify that your
equation is correct.
LOOKING FOR STRUCTURE
To be profi cient in math, you need to look closely to discern a pattern or structure.
6
−4
−6
4
2.1 Transformations of Quadratic Functions
hsnb_alg2_pe_0201.indd 47hsnb_alg2_pe_0201.indd 47 2/5/15 10:24 AM2/5/15 10:24 AM
48 Chapter 2 Quadratic Functions
2.1 Lesson What You Will LearnWhat You Will Learn Describe transformations of quadratic functions.
Write transformations of quadratic functions.
Describing Transformations of Quadratic FunctionsA quadratic function is a function that can be written in the form f(x) = a(x − h)2 + k,
where a ≠ 0. The U-shaped graph of a quadratic function is called a parabola.
In Section 1.1, you graphed quadratic functions using tables of values. You can also
graph quadratic functions by applying transformations to the graph of the parent
function f(x) = x2.
quadratic function, p. 48 parabola, p. 48 vertex of a parabola, p. 50 vertex form, p. 50
Previoustransformations
Core VocabularyCore Vocabullarry
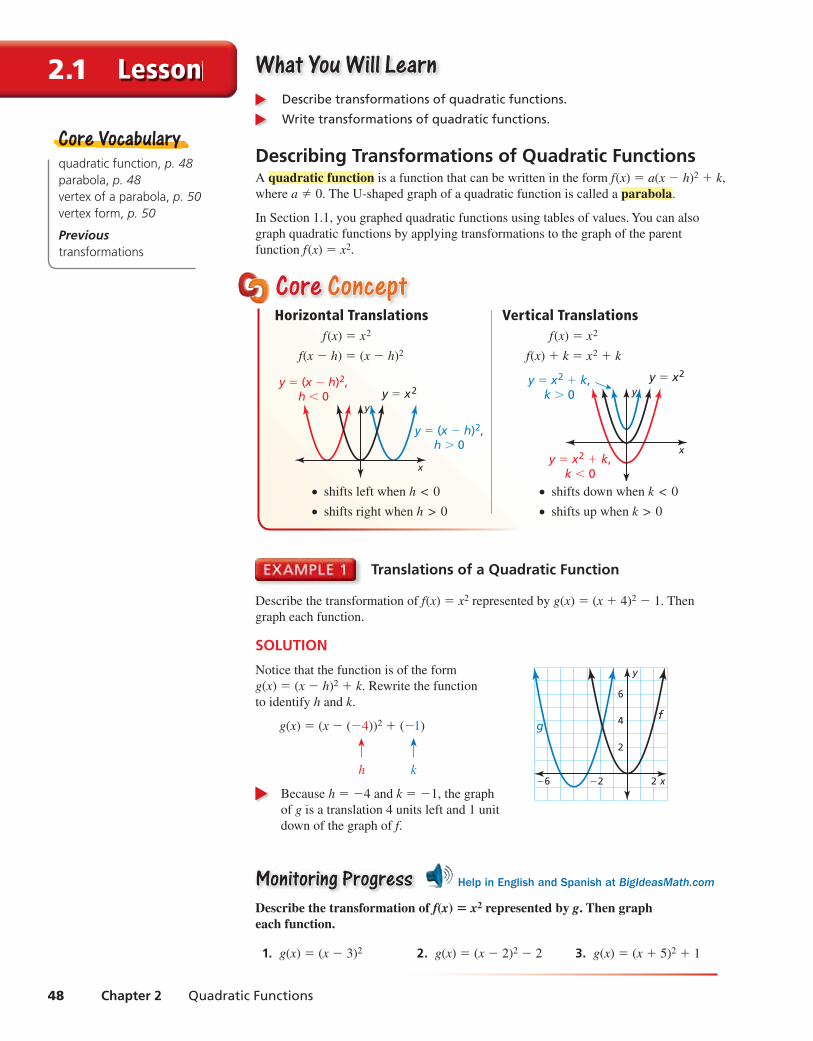
Core Core ConceptConceptHorizontal Translations f(x) = x2
f(x − h) = (x − h)2
y
y = (x − h)2,h < 0
y = (x − h)2,h > 0
y = x2
x
● shifts left when h < 0
● shifts right when h > 0
Vertical Translations f(x) = x2
f(x) + k = x2 + k
y
y = x2 + k,k < 0
y = x2 + k,k > 0
y = x2
x
● shifts down when k < 0
● shifts up when k > 0
Translations of a Quadratic Function
Describe the transformation of f(x) = x2 represented by g(x) = (x + 4)2 − 1. Then
graph each function.
SOLUTION
Notice that the function is of the form
x
y
4
6
2
−2 2−6
gf
g(x) = (x − h)2 + k. Rewrite the function
to identify h and k.
g(x) = (x − (−4))2 + (−1)
h k
Because h = −4 and k = −1, the graph
of g is a translation 4 units left and 1 unit
down of the graph of f.
Monitoring ProgressMonitoring Progress Help in English and Spanish at BigIdeasMath.com
Describe the transformation of f(x) = x2 represented by g. Then graph each function.
1. g(x) = (x − 3)2 2. g(x) = (x − 2)2 − 2 3. g(x) = (x + 5)2 + 1
hsnb_alg2_pe_0201.indd 48hsnb_alg2_pe_0201.indd 48 2/5/15 10:24 AM2/5/15 10:24 AM
Section 2.1 Transformations of Quadratic Functions 49
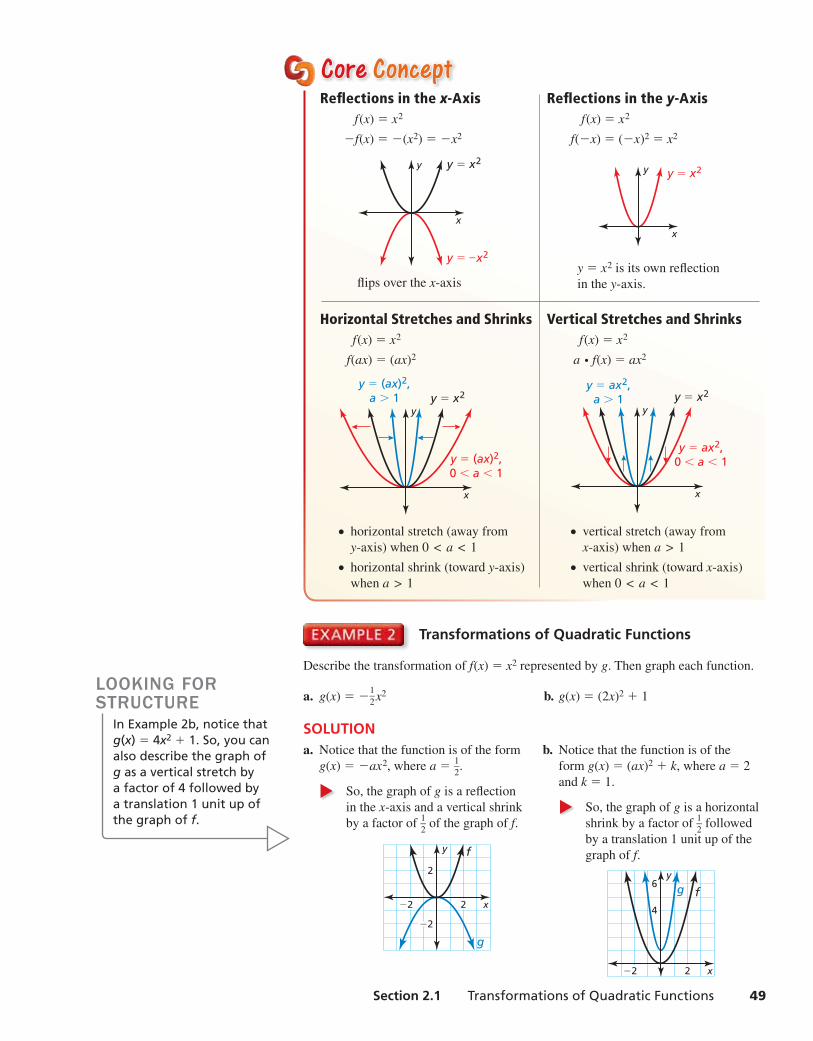
Core Core ConceptConceptRefl ections in the x-Axis f(x) = x2
−f(x) = −(x2) = −x2
x
y y = x2
y = –x2
fl ips over the x-axis
Horizontal Stretches and Shrinks f(x) = x2
f(ax) = (ax)2
x
yy = x2
y = (ax)2,0 < a < 1
y = (ax)2,a > 1
● horizontal stretch (away from
y-axis) when 0 < a < 1
● horizontal shrink (toward y-axis)
when a > 1
Refl ections in the y-Axis f(x) = x2
f(−x) = (−x)2 = x2
x
y y = x2
y = x2 is its own refl ection
in the y-axis.
Vertical Stretches and Shrinks f(x) = x2
a ⋅ f(x) = ax2
x
yy = x2
y = ax2,0 < a < 1
y = ax2,a > 1
● vertical stretch (away from
x-axis) when a > 1
● vertical shrink (toward x-axis)
when 0 < a < 1
Transformations of Quadratic Functions
Describe the transformation of f(x) = x2 represented by g. Then graph each function.
a. g(x) = − 1 — 2 x
2 b. g(x) = (2x)2 + 1
SOLUTIONa. Notice that the function is of the form
g(x) = −ax2, where a = 1 —
2 .
So, the graph of g is a refl ection
in the x-axis and a vertical shrink
by a factor of 1 —
2 of the graph of f.
x
y f
g
2
−2
2−2
b. Notice that the function is of the
form g(x) = (ax)2 + k, where a = 2
and k = 1.
So, the graph of g is a horizontal
shrink by a factor of 1 —
2 followed
by a translation 1 unit up of the
graph of f.
x
y
fg
4
6
2−2
LOOKING FOR STRUCTURE
In Example 2b, notice that g(x) = 4x2 + 1. So, you can also describe the graph of g as a vertical stretch by a factor of 4 followed by a translation 1 unit up of the graph of f.
hsnb_alg2_pe_0201.indd 49hsnb_alg2_pe_0201.indd 49 2/5/15 10:24 AM2/5/15 10:24 AM
50 Chapter 2 Quadratic Functions
Monitoring ProgressMonitoring Progress Help in English and Spanish at BigIdeasMath.com
Describe the transformation of f(x) = x2 represented by g. Then graph each function.
4. g(x) = ( 1 — 3 x ) 2 5. g(x) = 3(x − 1)2 6. g(x) = −(x + 3)2 + 2
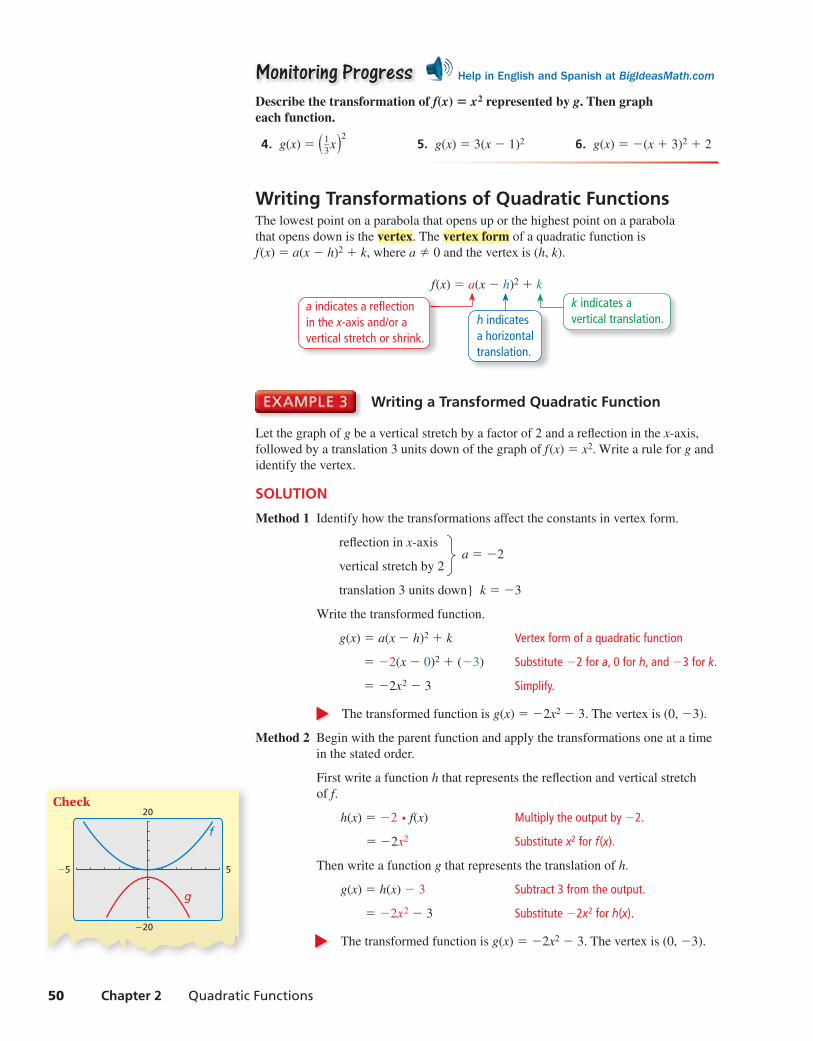
Writing Transformations of Quadratic FunctionsThe lowest point on a parabola that opens up or the highest point on a parabola
that opens down is the vertex. The vertex form of a quadratic function is
f(x) = a(x − h)2 + k, where a ≠ 0 and the vertex is (h, k).
f(x) = a(x − h)2 + k
k indicates a vertical translation.
a indicates a reflection in the x-axis and/or a vertical stretch or shrink.
h indicates a horizontal translation.
Writing a Transformed Quadratic Function
Let the graph of g be a vertical stretch by a factor of 2 and a refl ection in the x-axis,
followed by a translation 3 units down of the graph of f(x) = x2. Write a rule for g and
identify the vertex.
SOLUTION
Method 1 Identify how the transformations affect the constants in vertex form.
refl ection in x-axis a = −2
vertical stretch by 2
translation 3 units down} k = −3
Write the transformed function.
g(x) = a(x − h)2 + k Vertex form of a quadratic function
= −2(x − 0)2 + (−3) Substitute −2 for a, 0 for h, and −3 for k.
= −2x2 − 3 Simplify.
The transformed function is g(x) = −2x2 − 3. The vertex is (0, −3).
Method 2 Begin with the parent function and apply the transformations one at a time
in the stated order.
First write a function h that represents the refl ection and vertical stretch
of f.
h(x) = −2 ⋅ f(x) Multiply the output by −2.
= −2x2 Substitute x2 for f(x).
Then write a function g that represents the translation of h.
g(x) = h(x) − 3 Subtract 3 from the output.
= −2x2 − 3 Substitute −2x2 for h(x).
The transformed function is g(x) = −2x2 − 3. The vertex is (0, −3).
Check
5
−20
−5
20
g
f
hsnb_alg2_pe_0201.indd 50hsnb_alg2_pe_0201.indd 50 2/5/15 10:25 AM2/5/15 10:25 AM

Section 2.1 Transformations of Quadratic Functions 51
Writing a Transformed Quadratic Function
Let the graph of g be a translation 3 units right and 2 units up, followed by a refl ection
in the y-axis of the graph of f(x) = x2 − 5x. Write a rule for g.
SOLUTION
Step 1 First write a function h that represents the translation of f.
h(x) = f(x − 3) + 2 Subtract 3 from the input. Add 2 to the output.
= (x − 3)2 − 5(x − 3) + 2 Replace x with x − 3 in f(x).
= x2 − 11x + 26 Simplify.
Step 2 Then write a function g that represents the refl ection of h.
g(x) = h(−x) Multiply the input by −1.
= (−x)2 − 11(−x) + 26 Replace x with −x in h(x).
= x2 + 11x + 26 Simplify.
Modeling with Mathematics
The height h (in feet) of water spraying from a fi re hose can be modeled by
h(x) = −0.03x2 + x + 25, where x is the horizontal distance (in feet) from the fi re
truck. The crew raises the ladder so that the water hits the ground 10 feet farther from
the fi re truck. Write a function that models the new path of the water.
SOLUTION
1. Understand the Problem You are given a function that represents the path of
water spraying from a fi re hose. You are asked to write a function that represents
the path of the water after the crew raises the ladder.
2. Make a Plan Analyze the graph of the function to determine the translation of the
ladder that causes water to travel 10 feet farther. Then write the function.
3. Solve the Problem Use a graphing calculator to graph the original function.
Because h(50) = 0, the water originally hits the ground 50 feet from the fi re
truck. The range of the function in this context does not include negative values.
However, by observing that h(60) = −23, you can determine that a translation
23 units (feet) up causes the water to travel 10 feet farther from the fi re truck.
g(x) = h(x) + 23 Add 23 to the output.
= −0.03x2 + x + 48 Substitute for h(x) and simplify.
The new path of the water can be modeled by g(x) = −0.03x2 + x + 48.
4. Look Back To check that your solution is correct, verify that g(60) = 0.
g(60) = −0.03(60)2 + 60 + 48 = −108 + 60 + 48 = 0 ✓
Monitoring ProgressMonitoring Progress Help in English and Spanish at BigIdeasMath.com
7. Let the graph of g be a vertical shrink by a factor of 1 —
2 followed by a translation
2 units up of the graph of f(x) = x2. Write a rule for g and identify the vertex.
8. Let the graph of g be a translation 4 units left followed by a horizontal shrink by a
factor of 1 —
3 of the graph of f(x) = x2 + x. Write a rule for g.
9. WHAT IF? In Example 5, the water hits the ground 10 feet closer to the fi re truck
after lowering the ladder. Write a function that models the new path of the water.
REMEMBERTo multiply two binomials, use the FOIL Method.
First Inner
(x + 1)(x + 2) = x2 + 2x + x + 2
Outer Last
X=50 Y=0
80
−30
0
60
y = −0.03x2 + x + 25
T
ht
t
S
hsnb_alg2_pe_0201.indd 51hsnb_alg2_pe_0201.indd 51 2/5/15 10:25 AM2/5/15 10:25 AM
52 Chapter 2 Quadratic Functions
Exercises2.1 Dynamic Solutions available at BigIdeasMath.com
Monitoring Progress and Modeling with MathematicsMonitoring Progress and Modeling with MathematicsIn Exercises 3–12, describe the transformation of f(x) = x2 represented by g. Then graph each function. (See Example 1.)
3. g(x) = x2 − 3 4. g(x) = x2 + 1
5. g(x) = (x + 2)2 6. g(x) = (x − 4)2
7. g(x) = (x − 1)2 8. g(x) = (x + 3)2
9. g(x) = (x + 6)2 − 2 10. g(x) = (x − 9)2 + 5
11. g(x) = (x − 7)2 + 1 12. g(x) = (x + 10)2 − 3
ANALYZING RELATIONSHIPS In Exercises 13–16, match the function with the correct transformation of the graph of f. Explain your reasoning.
13. y = f(x − 1) 14. y = f(x) + 1
15. y = f(x − 1) + 1 16. y = f(x + 1) − 1
A.
x
y B.
x
y
C.
x
y D.
x
y
In Exercises 17–24, describe the transformation of f(x) = x2 represented by g. Then graph each function. (See Example 2.)
17. g(x) = −x2 18. g(x) = (−x)2
19. g(x) = 3x2 20. g(x) = 1 —
3 x2
21. g(x) = (2x)2 22. g(x) = −(2x)2
23. g(x) = 1 —
5 x2 − 4 24. g(x) =
1 —
2 (x − 1)2
ERROR ANALYSIS In Exercises 25 and 26, describe and correct the error in analyzing the graph of f(x) = −6x2 + 4.
25. The graph is a refl ection in the
y-axis and a vertical stretch
by a factor of 6, followed by a
translation 4 units up of the graph
of the parent quadratic function.
✗
26. The graph is a translation 4 units
down, followed by a vertical
stretch by a factor of 6 and a
refl ection in the x-axis of the graph
of the parent quadratic function.
✗
USING STRUCTURE In Exercises 27–30, describe the transformation of the graph of the parent quadratic function. Then identify the vertex.
27. f(x) = 3(x + 2)2 + 1
28. f(x) = −4(x + 1)2 − 5
29. f(x) = −2x2 + 5
30. f(x) = 1 —
2 (x − 1)2
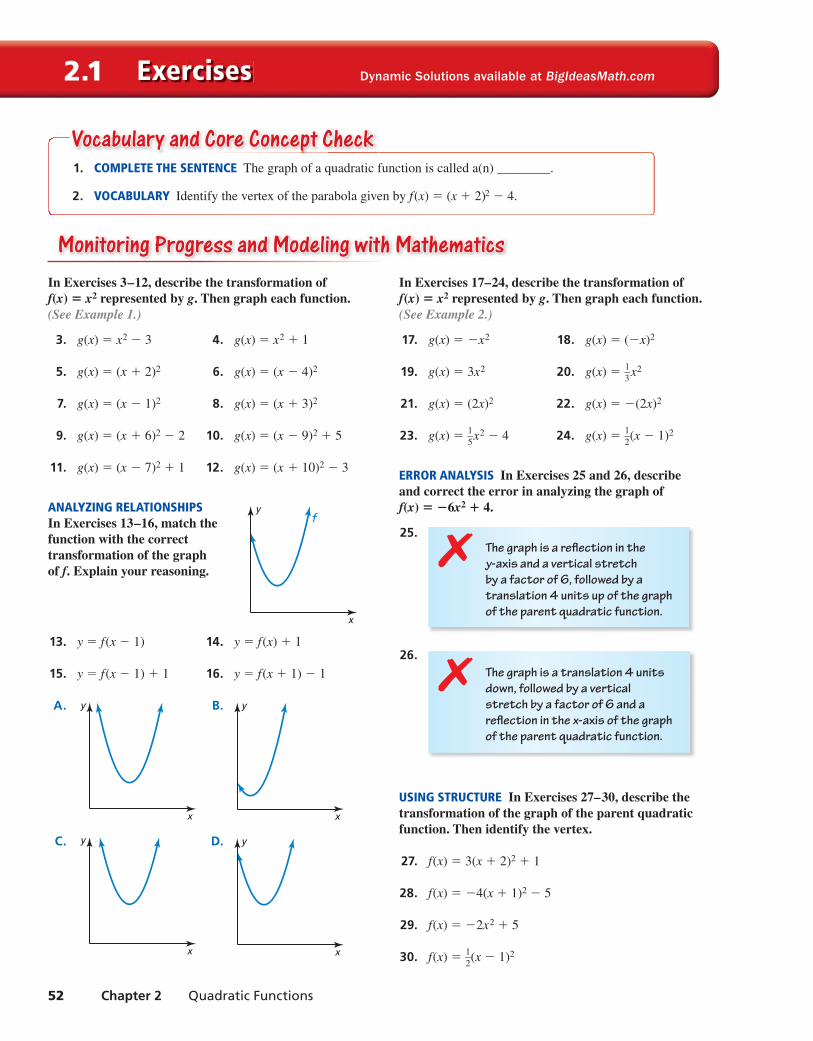
1. COMPLETE THE SENTENCE The graph of a quadratic function is called a(n) ________.
2. VOCABULARY Identify the vertex of the parabola given by f(x) = (x + 2)2 − 4.
Vocabulary and Core Concept Checkpppp
x
yf
hsnb_alg2_pe_0201.indd 52hsnb_alg2_pe_0201.indd 52 2/5/15 10:25 AM2/5/15 10:25 AM
Section 2.1 Transformations of Quadratic Functions 53
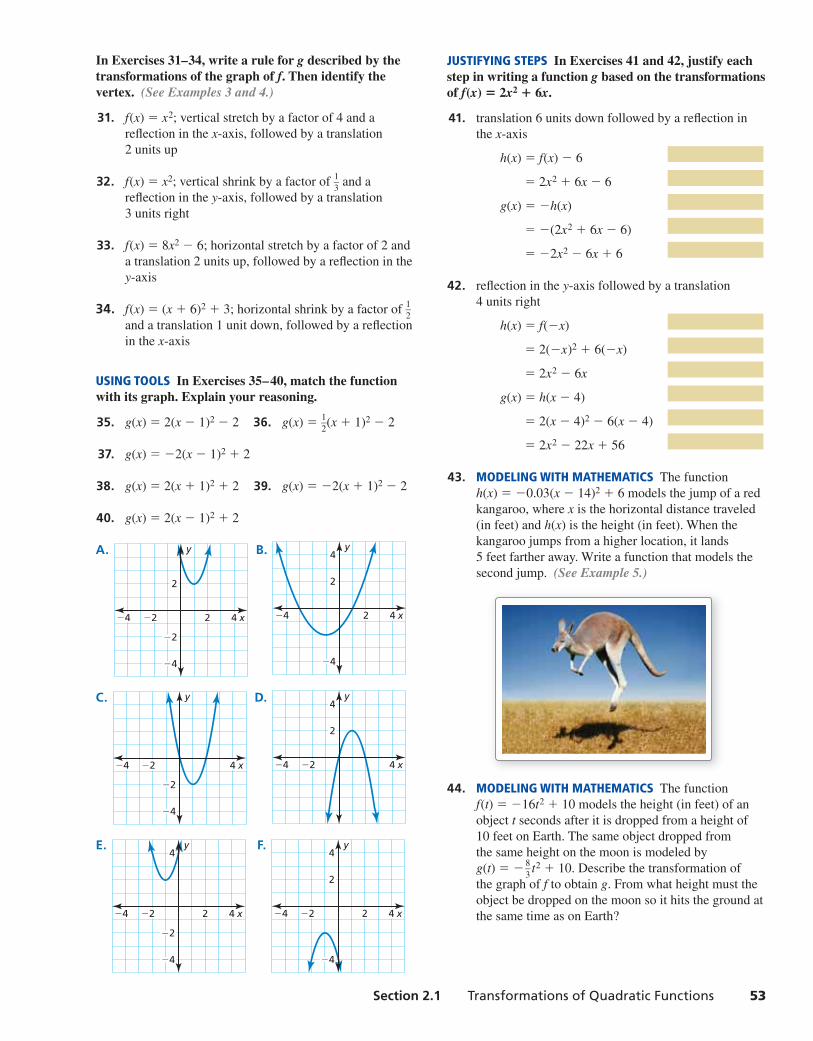
In Exercises 31–34, write a rule for g described by the transformations of the graph of f. Then identify the vertex. (See Examples 3 and 4.)
31. f(x) = x2; vertical stretch by a factor of 4 and a
refl ection in the x-axis, followed by a translation
2 units up
32. f(x) = x2; vertical shrink by a factor of 1 —
3 and a
refl ection in the y-axis, followed by a translation
3 units right
33. f(x) = 8x2 − 6; horizontal stretch by a factor of 2 and
a translation 2 units up, followed by a refl ection in the
y-axis
34. f(x) = (x + 6)2 + 3; horizontal shrink by a factor of 1 —
2
and a translation 1 unit down, followed by a refl ection
in the x-axis
USING TOOLS In Exercises 35–40, match the function with its graph. Explain your reasoning.
35. g(x) = 2(x − 1)2 − 2 36. g(x) = 1 —
2 (x + 1)2 − 2
37. g(x) = −2(x − 1)2 + 2
38. g(x) = 2(x + 1)2 + 2 39. g(x) = −2(x + 1)2 − 2
40. g(x) = 2(x − 1)2 + 2
A.
x
y
2
−4
−2
42−2−4
B.
x
y4
2
−4
42−4
C.
x
y
−2
−4
4−2−4
D.
x
y4
2
4−2−4
E.
x
y4
−4
−2
42−2−4
F.
x
y4
2
−4
42−2−4
JUSTIFYING STEPS In Exercises 41 and 42, justify eachstep in writing a function g based on the transformationsof f(x) = 2x2 + 6x.
41. translation 6 units down followed by a refl ection in
the x-axis
h(x) = f(x) − 6
= 2x2 + 6x − 6
g(x) = −h(x)
= −(2x2 + 6x − 6)
= −2x2 − 6x + 6
42. refl ection in the y-axis followed by a translation
4 units right
h(x) = f(−x)
= 2(−x)2 + 6(−x)
= 2x2 − 6x
g(x) = h(x − 4)
= 2(x − 4)2 − 6(x − 4)
= 2x2 − 22x + 56
43. MODELING WITH MATHEMATICS The function
h(x) = −0.03(x − 14)2 + 6 models the jump of a red
kangaroo, where x is the horizontal distance traveled
(in feet) and h(x) is the height (in feet). When the
kangaroo jumps from a higher location, it lands
5 feet farther away. Write a function that models the
second jump. (See Example 5.)
44. MODELING WITH MATHEMATICS The function
f(t) = −16t2 + 10 models the height (in feet) of an
object t seconds after it is dropped from a height of
10 feet on Earth. The same object dropped from
the same height on the moon is modeled by
g(t) = − 8 —
3 t2 + 10. Describe the transformation of
the graph of f to obtain g. From what height must the
object be dropped on the moon so it hits the ground at
the same time as on Earth?
hsnb_alg2_pe_0201.indd 53hsnb_alg2_pe_0201.indd 53 2/5/15 10:25 AM2/5/15 10:25 AM
54 Chapter 2 Quadratic Functions
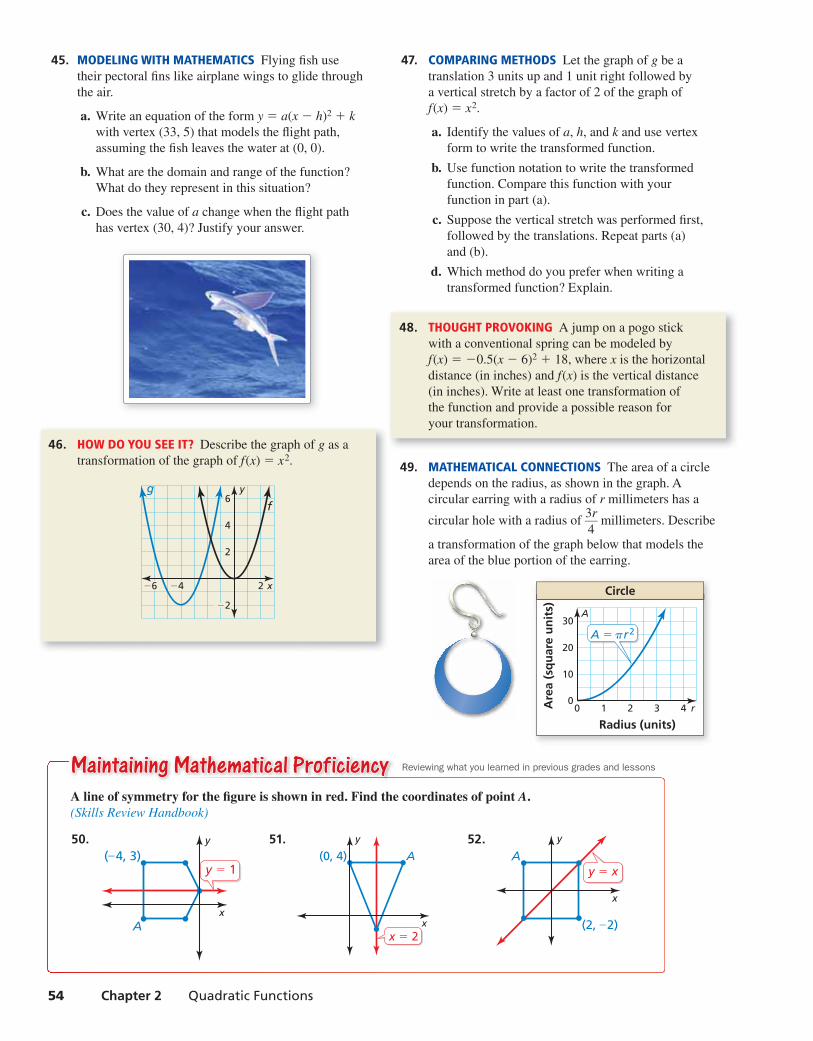
Maintaining Mathematical ProficiencyMaintaining Mathematical ProficiencyA line of symmetry for the fi gure is shown in red. Find the coordinates of point A. (Skills Review Handbook)
50.
x
y
(–4, 3)
A
y = 1
51.
x
y
(0, 4) A
x = 2
52.
x
y
(2, –2)
Ay = x
Reviewing what you learned in previous grades and lessons
45. MODELING WITH MATHEMATICS Flying fi sh use
their pectoral fi ns like airplane wings to glide through
the air.
a. Write an equation of the form y = a(x − h)2 + kwith vertex (33, 5) that models the fl ight path,
assuming the fi sh leaves the water at (0, 0).
b. What are the domain and range of the function?
What do they represent in this situation?
c. Does the value of a change when the fl ight path
has vertex (30, 4)? Justify your answer.
46. HOW DO YOU SEE IT? Describe the graph of g as a
transformation of the graph of f(x) = x2.
x
f
g y
4
6
2
−2
2−4−6
47. COMPARING METHODS Let the graph of g be a
translation 3 units up and 1 unit right followed by
a vertical stretch by a factor of 2 of the graph of
f(x) = x2.
a. Identify the values of a, h, and k and use vertex
form to write the transformed function.
b. Use function notation to write the transformed
function. Compare this function with your
function in part (a).
c. Suppose the vertical stretch was performed fi rst,
followed by the translations. Repeat parts (a)
and (b).
d. Which method do you prefer when writing a
transformed function? Explain.
48. THOUGHT PROVOKING A jump on a pogo stick
with a conventional spring can be modeled by
f(x) = −0.5(x − 6)2 + 18, where x is the horizontal
distance (in inches) and f(x) is the vertical distance
(in inches). Write at least one transformation of
the function and provide a possible reason for
your transformation.
49. MATHEMATICAL CONNECTIONS The area of a circle
depends on the radius, as shown in the graph. A
circular earring with a radius of r millimeters has a
circular hole with a radius of 3r
— 4 millimeters. Describe
a transformation of the graph below that models the
area of the blue portion of the earring.
Circle
Are
a (s
qu
are
un
its)
Radius (units)r
A
20
10
0
30
210 43
A = r2π
hsnb_alg2_pe_0201.indd 54hsnb_alg2_pe_0201.indd 54 2/5/15 10:25 AM2/5/15 10:25 AM
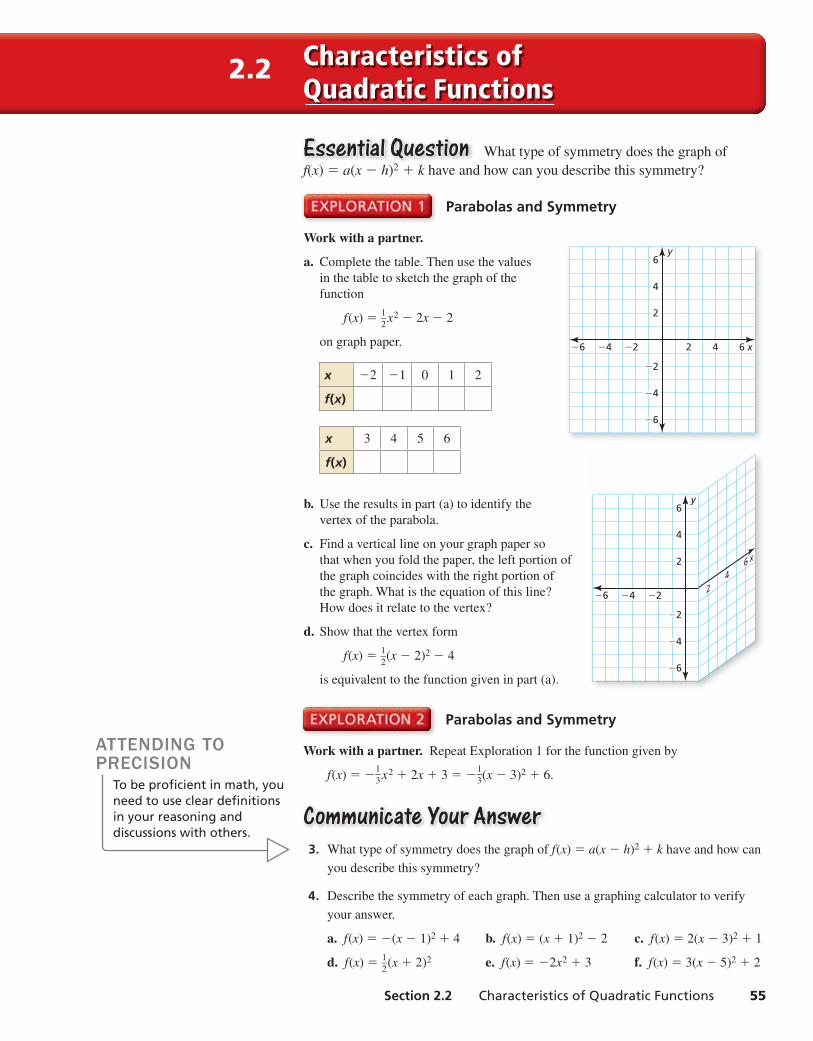
Section 2.2 Characteristics of Quadratic Functions 55
Essential QuestionEssential Question What type of symmetry does the graph of
f(x) = a(x − h)2 + k have and how can you describe this symmetry?
Parabolas and Symmetry
Work with a partner.
a. Complete the table. Then use the values
in the table to sketch the graph of the
function
f(x) = 1 —
2 x2 − 2x − 2
on graph paper.
b. Use the results in part (a) to identify the
vertex of the parabola.
c. Find a vertical line on your graph paper so
that when you fold the paper, the left portion of
the graph coincides with the right portion of
the graph. What is the equation of this line?
How does it relate to the vertex?
d. Show that the vertex form
f(x) = 1 —
2 (x − 2)2 − 4
is equivalent to the function given in part (a).
ATTENDING TO PRECISION
To be profi cient in math, youneed to use clear defi nitions in your reasoning and discussions with others.
Parabolas and Symmetry
Work with a partner. Repeat Exploration 1 for the function given by
f(x) = −1—3 x2 + 2x + 3 = −1—
3 (x − 3)2 + 6.
Communicate Your AnswerCommunicate Your Answer 3. What type of symmetry does the graph of f(x) = a(x − h)2 + k have and how can
you describe this symmetry?
4. Describe the symmetry of each graph. Then use a graphing calculator to verify
your answer.
a. f(x) = −(x − 1)2 + 4 b. f(x) = (x + 1)2 − 2 c. f(x) = 2(x − 3)2 + 1
d. f(x) = 1—2 (x + 2)2 e. f(x) = −2x2 + 3 f. f(x) = 3(x − 5)2 + 2
x
y
4
6
2
−4
−6
−2
4 62−2−4−6
x −2 −1 0 1 2
f(x)
x
46
2
y
4
6
2
−4
−6
−2
−2−4−6
x 3 4 5 6
f(x)
2.2 Characteristics of Quadratic Functions
hsnb_alg2_pe_0202.indd 55hsnb_alg2_pe_0202.indd 55 2/5/15 10:26 AM2/5/15 10:26 AM
56 Chapter 2 Quadratic Functions
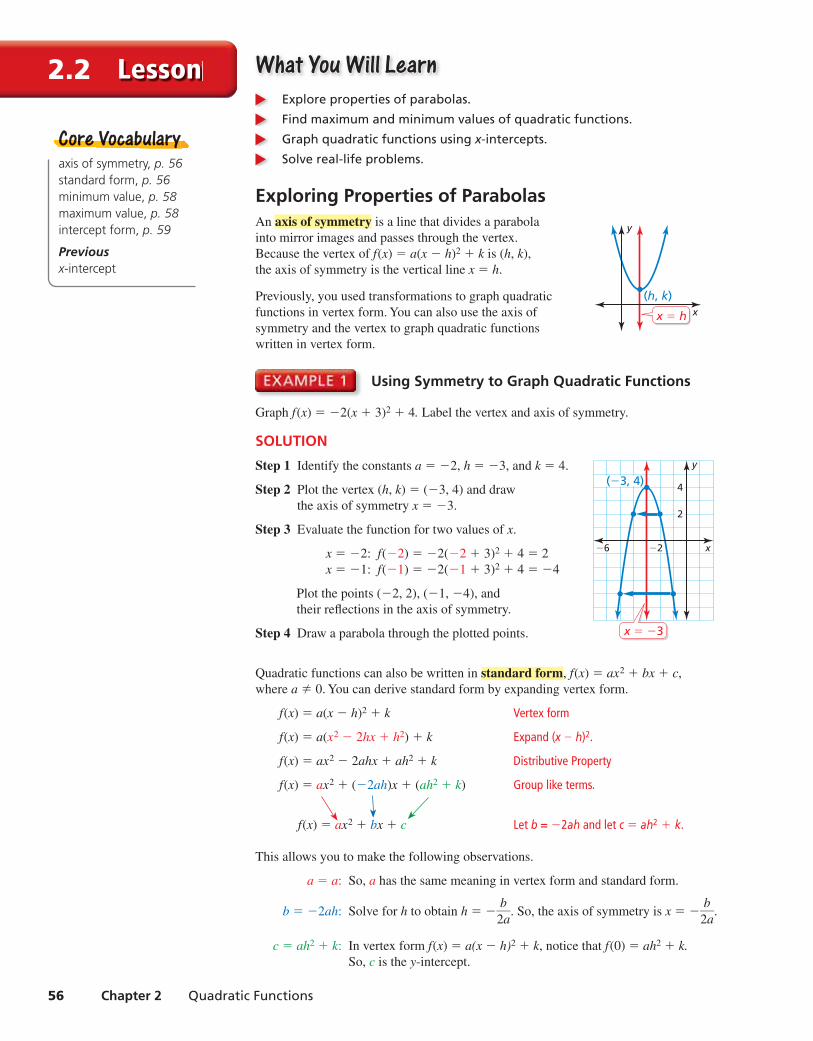
2.2 Lesson What You Will LearnWhat You Will Learn Explore properties of parabolas.
Find maximum and minimum values of quadratic functions.
Graph quadratic functions using x-intercepts.
Solve real-life problems.
Exploring Properties of ParabolasAn axis of symmetry is a line that divides a parabola
into mirror images and passes through the vertex.
Because the vertex of f(x) = a(x − h)2 + k is (h, k),
the axis of symmetry is the vertical line x = h.
Previously, you used transformations to graph quadratic
functions in vertex form. You can also use the axis of
symmetry and the vertex to graph quadratic functions
written in vertex form.
axis of symmetry, p. 56 standard form, p. 56minimum value, p. 58 maximum value, p. 58 intercept form, p. 59
Previousx-intercept
Core VocabularyCore Vocabullarry
Using Symmetry to Graph Quadratic Functions
Graph f(x) = −2(x + 3)2 + 4. Label the vertex and axis of symmetry.
SOLUTION
Step 1 Identify the constants a = −2, h = −3, and k = 4.
Step 2 Plot the vertex (h, k) = (−3, 4) and draw
the axis of symmetry x = −3.
Step 3 Evaluate the function for two values of x.
x = −2: f(−2) = −2(−2 + 3)2 + 4 = 2
x = −1: f(−1) = −2(−1 + 3)2 + 4 = −4
Plot the points (−2, 2), (−1, −4), and
their refl ections in the axis of symmetry.
Step 4 Draw a parabola through the plotted points.
Quadratic functions can also be written in standard form, f(x) = ax2 + bx + c,
where a ≠ 0. You can derive standard form by expanding vertex form.
f(x) = a(x − h)2 + k Vertex form
f(x) = a(x2 − 2hx + h2) + k Expand (x − h)2.
f(x) = ax2 − 2ahx + ah2 + k Distributive Property
f(x) = ax2 + (−2ah)x + (ah2 + k) Group like terms.
f(x) = ax2 + bx + c Let b = −2ah and let c = ah2 + k.
This allows you to make the following observations.
a = a: So, a has the same meaning in vertex form and standard form.
b = −2ah: Solve for h to obtain h = − b —
2a . So, the axis of symmetry is x = −
b —
2a .
c = ah2 + k: In vertex form f(x) = a(x − h)2 + k, notice that f(0) = ah2 + k. So, c is the y-intercept.
x
y
(h, k)
x = h
x
y
4
2
−2
(−3, 4)
−6
x = −3
hsnb_alg2_pe_0202.indd 56hsnb_alg2_pe_0202.indd 56 2/5/15 10:26 AM2/5/15 10:26 AM
Section 2.2 Characteristics of Quadratic Functions 57
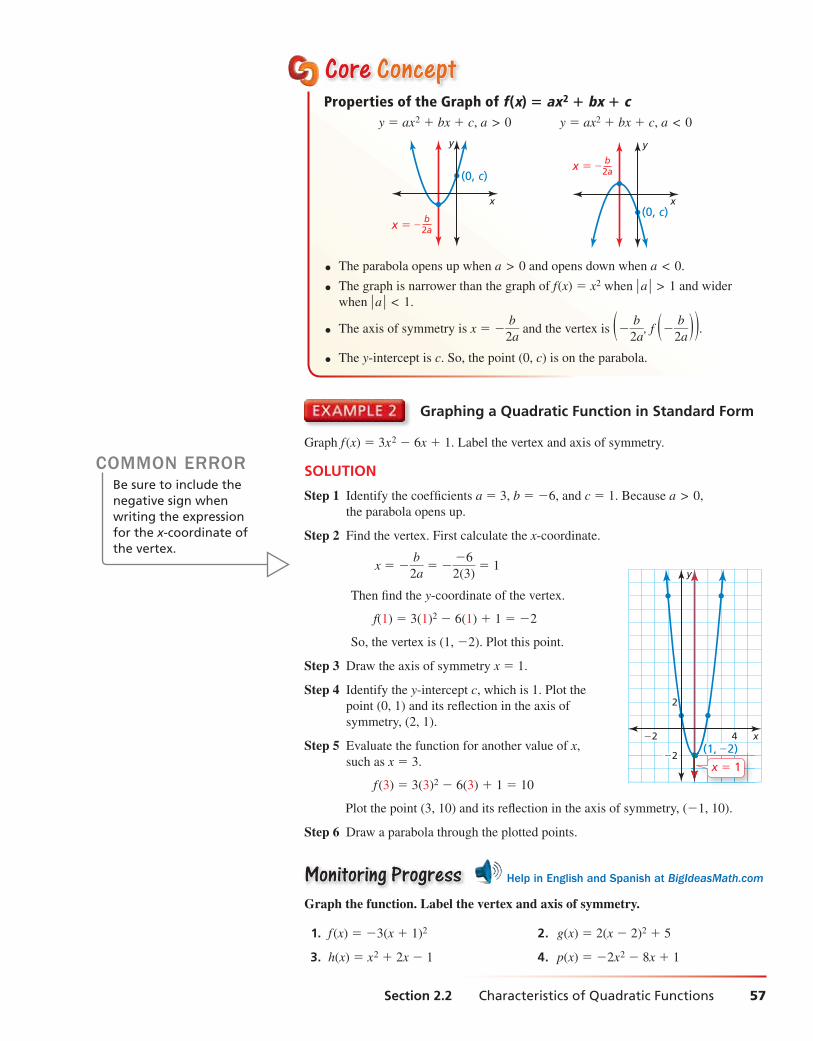
Core Core ConceptConceptProperties of the Graph of f(x) = ax2 + bx + c y = ax2 + bx + c, a > 0 y = ax2 + bx + c, a < 0
x
y
x = –
(0, c)
b2a
x
y
(0, c)
x = – b2a
● The parabola opens up when a > 0 and opens down when a < 0.
● The graph is narrower than the graph of f(x) = x2 when ∣ a ∣ > 1 and wider
when ∣ a ∣ < 1.
● The axis of symmetry is x = − b —
2a and the vertex is ( −
b —
2a , f ( −
b —
2a ) ) .
● The y-intercept is c. So, the point (0, c) is on the parabola.
Graphing a Quadratic Function in Standard Form
Graph f (x) = 3x2 − 6x + 1. Label the vertex and axis of symmetry.
SOLUTION
Step 1 Identify the coeffi cients a = 3, b = −6, and c = 1. Because a > 0,
the parabola opens up.
Step 2 Find the vertex. First calculate the x-coordinate.
x = − b —
2a = −
−6 —
2(3) = 1
Then fi nd the y-coordinate of the vertex.
f(1) = 3(1)2 − 6(1) + 1 = −2
So, the vertex is (1, −2). Plot this point.
Step 3 Draw the axis of symmetry x = 1.
Step 4 Identify the y-intercept c, which is 1. Plot the
point (0, 1) and its refl ection in the axis of
symmetry, (2, 1).
Step 5 Evaluate the function for another value of x,
such as x = 3.
f (3) = 3(3)2 − 6(3) + 1 = 10
Plot the point (3, 10) and its refl ection in the axis of symmetry, (−1, 10).
Step 6 Draw a parabola through the plotted points.
Monitoring ProgressMonitoring Progress Help in English and Spanish at BigIdeasMath.com
Graph the function. Label the vertex and axis of symmetry.
1. f (x) = −3(x + 1)2 2. g(x) = 2(x − 2)2 + 5
3. h(x) = x2 + 2x − 1 4. p(x) = −2x2 − 8x + 1
COMMON ERRORBe sure to include the negative sign when writing the expression for the x-coordinate of the vertex.
x
y
2
−2
4(1, –2)
−2( , )
x = 1
hsnb_alg2_pe_0202.indd 57hsnb_alg2_pe_0202.indd 57 2/5/15 10:26 AM2/5/15 10:26 AM
58 Chapter 2 Quadratic Functions
Finding Maximum and Minimum ValuesBecause the vertex is the highest or lowest point on a parabola, its y-coordinate is
the maximum value or minimum value of the function. The vertex lies on the axis of
symmetry, so the function is increasing on one side of the axis of symmetry and
decreasing on the other side.
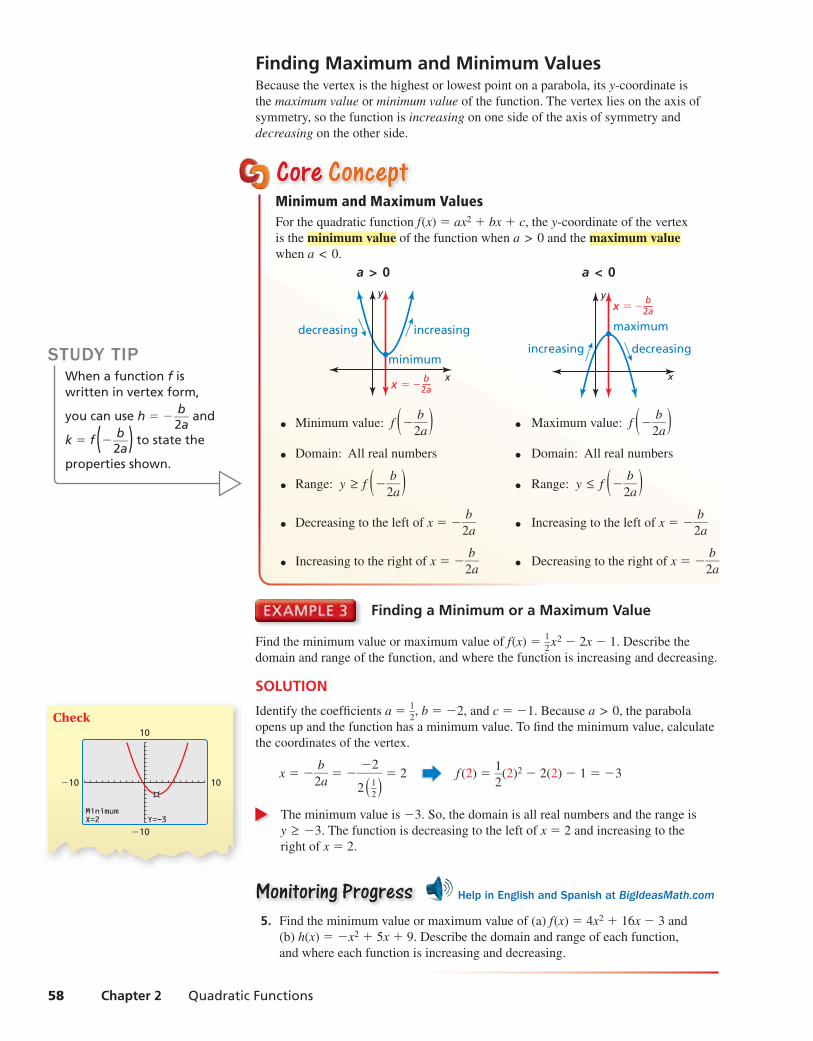
Core Core ConceptConceptMinimum and Maximum ValuesFor the quadratic function f(x) = ax2 + bx + c, the y-coordinate of the vertex
is the minimum value of the function when a > 0 and the maximum value
when a < 0.
a > 0
x
y
minimum
increasingdecreasing
x = – b2a
● Minimum value: f ( − b —
2a )
● Domain: All real numbers
● Range: y ≥ f ( − b —
2a )
● Decreasing to the left of x = − b —
2a
● Increasing to the right of x = − b —
2a
a < 0
x
y
maximum
increasing decreasing
x = – b2a
● Maximum value: f ( − b —
2a )
● Domain: All real numbers
● Range: y ≤ f ( − b —
2a )
● Increasing to the left of x = − b —
2a
● Decreasing to the right of x = − b —
2a
Finding a Minimum or a Maximum Value
Find the minimum value or maximum value of f(x) = 1 —
2 x2 − 2x − 1. Describe the
domain and range of the function, and where the function is increasing and decreasing.
SOLUTION
Identify the coeffi cients a = 1 —
2 , b = −2, and c = −1. Because a > 0, the parabola
opens up and the function has a minimum value. To fi nd the minimum value, calculate
the coordinates of the vertex.
x = − b —
2a = −
−2 —
2 ( 1 — 2 ) = 2 f (2) =
1 —
2 (2)2 − 2(2) − 1 = −3
The minimum value is −3. So, the domain is all real numbers and the range is
y ≥ −3. The function is decreasing to the left of x = 2 and increasing to the
right of x = 2.
Monitoring ProgressMonitoring Progress Help in English and Spanish at BigIdeasMath.com
5. Find the minimum value or maximum value of (a) f(x) = 4x2 + 16x − 3 and
(b) h(x) = −x2 + 5x + 9. Describe the domain and range of each function,
and where each function is increasing and decreasing.
Check
MinimumX=2 Y=-3
10
−10
−10
10
STUDY TIPWhen a function f is written in vertex form,
you can use h = − b — 2a
and
k = f ( − b — 2a
) to state the
properties shown.
hsnb_alg2_pe_0202.indd 58hsnb_alg2_pe_0202.indd 58 2/5/15 10:26 AM2/5/15 10:26 AM

Section 2.2 Characteristics of Quadratic Functions 59
Graphing Quadratic Functions Using x-InterceptsWhen the graph of a quadratic function has at least one x-intercept, the function can be
written in intercept form, f(x) = a(x − p)(x − q), where a ≠ 0.REMEMBERAn x-intercept of a graph is the x-coordinate of a point where the graph intersects the x-axis. It occurs where f(x) = 0.
Graphing a Quadratic Function in Intercept Form
Graph f(x) = −2(x + 3)(x − 1). Label the x-intercepts, vertex, and axis of symmetry.
SOLUTION
Step 1 Identify the x-intercepts. The x-intercepts are
p = −3 and q = 1, so the parabola passes
through the points (−3, 0) and (1, 0).
Step 2 Find the coordinates of the vertex.
x = p + q
— 2 =
−3 + 1 —
2 = −1
f(−1) = −2(−1 + 3)(−1 − 1) = 8
So, the axis of symmetry is x = −1 and
the vertex is (−1, 8).
Step 3 Draw a parabola through the vertex and
the points where the x-intercepts occur.
Monitoring ProgressMonitoring Progress Help in English and Spanish at BigIdeasMath.com
Graph the function. Label the x-intercepts, vertex, and axis of symmetry.
6. f(x) = −(x + 1)(x + 5) 7. g(x) = 1 —
4 (x − 6)(x − 2)
COMMON ERRORRemember that the x-intercepts of the graph of f(x) = a(x − p)(x − q) are p and q, not −p and −q.
Check You can check your answer by generating a table of values for f on a
graphing calculator.
X Y1
X=-1
-10-406860-10
-3-2
012
-1
x-intercept The values showsymmetry about x = −1.So, the vertex is (−1, 8).x-intercept
Core Core ConceptConceptProperties of the Graph of f(x) = a(x − p)(x − q)● Because f(p) = 0 and f(q) = 0, p and
q are the x-intercepts of the graph of
the function.
● The axis of symmetry is halfway between
(p, 0) and (q, 0). So, the axis of symmetry
is x = p + q
— 2 .
● The parabola opens up when a > 0 and
opens down when a < 0.
x
y
(q, 0)
(p, 0)
x =
y = a(x – p)(x – q)
p + q2
x
y
2
4
6
2(1, 0)(–3, 0)
(–1, 8)
−2−4
x = –1
hsnb_alg2_pe_0202.indd 59hsnb_alg2_pe_0202.indd 59 2/5/15 10:26 AM2/5/15 10:26 AM
60 Chapter 2 Quadratic Functions
Solving Real-Life Problems
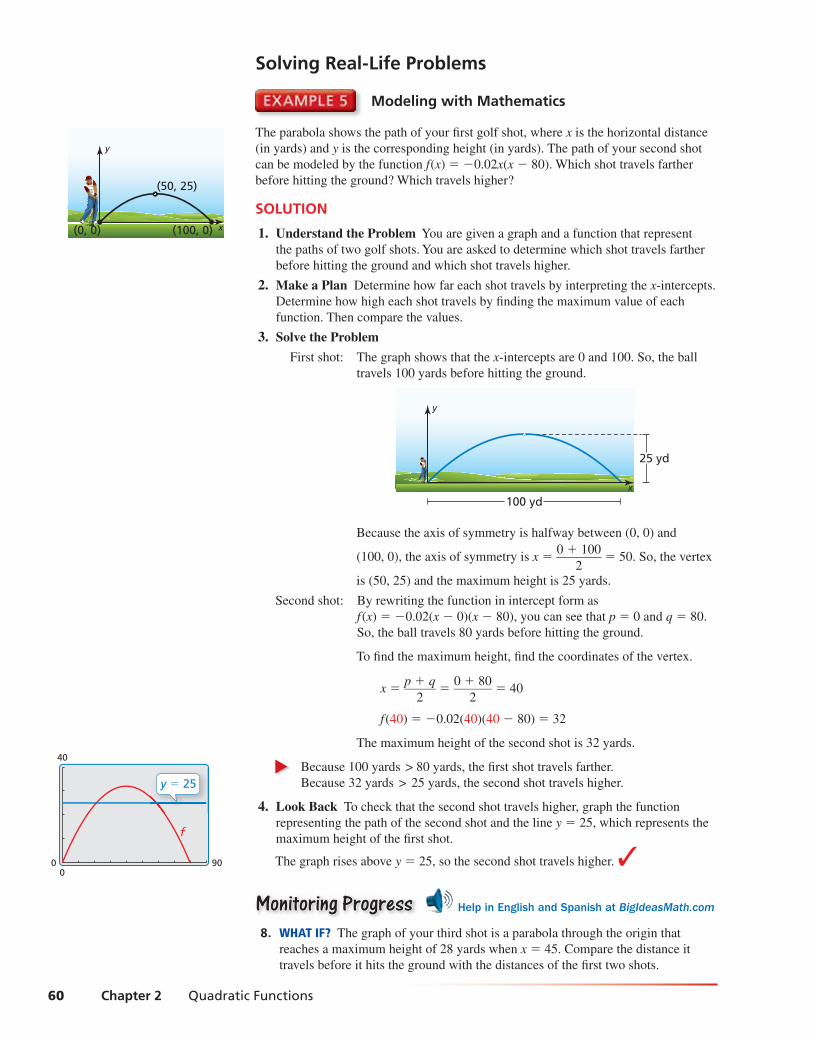
Modeling with Mathematics
The parabola shows the path of your fi rst golf shot, where x is the horizontal distance
(in yards) and y is the corresponding height (in yards). The path of your second shot
can be modeled by the function f(x) = −0.02x(x − 80). Which shot travels farther
before hitting the ground? Which travels higher?
SOLUTION
1. Understand the Problem You are given a graph and a function that represent
the paths of two golf shots. You are asked to determine which shot travels farther
before hitting the ground and which shot travels higher.
2. Make a Plan Determine how far each shot travels by interpreting the x-intercepts.
Determine how high each shot travels by fi nding the maximum value of each
function. Then compare the values.
3. Solve the Problem
First shot: The graph shows that the x-intercepts are 0 and 100. So, the ball
travels 100 yards before hitting the ground.
y
100 yd
25 yd
x
Because the axis of symmetry is halfway between (0, 0) and
(100, 0), the axis of symmetry is x = 0 + 100
— 2 = 50. So, the vertex
is (50, 25) and the maximum height is 25 yards.
Second shot: By rewriting the function in intercept form as
f (x) = −0.02(x − 0)(x − 80), you can see that p = 0 and q = 80.
So, the ball travels 80 yards before hitting the ground.
To fi nd the maximum height, fi nd the coordinates of the vertex.
x = p + q
— 2 =
0 + 80 —
2 = 40
f (40) = −0.02(40)(40 − 80) = 32
The maximum height of the second shot is 32 yards.
Because 100 yards > 80 yards, the fi rst shot travels farther.
Because 32 yards > 25 yards, the second shot travels higher.
4. Look Back To check that the second shot travels higher, graph the function
representing the path of the second shot and the line y = 25, which represents the
maximum height of the fi rst shot.
The graph rises above y = 25, so the second shot travels higher. ✓
Monitoring ProgressMonitoring Progress Help in English and Spanish at BigIdeasMath.com
8. WHAT IF? The graph of your third shot is a parabola through the origin that
reaches a maximum height of 28 yards when x = 45. Compare the distance it
travels before it hits the ground with the distances of the fi rst two shots.
x
y
(0, 0)
(50, 25)
(100, 0)
900
0
40
y = 25
f
hsnb_alg2_pe_0202.indd 60hsnb_alg2_pe_0202.indd 60 2/5/15 10:26 AM2/5/15 10:26 AM

Section 2.2 Characteristics of Quadratic Functions 61
Exercises2.2 Dynamic Solutions available at BigIdeasMath.com
In Exercises 3–14, graph the function. Label the vertex and axis of symmetry. (See Example 1.)
3. f(x) = (x − 3)2 4. h(x) = (x + 4)2
5. g(x) = (x + 3)2 + 5 6. y = (x − 7)2 − 1
7. y = −4(x − 2)2 + 4 8. g(x) = 2(x + 1)2 − 3
9. f(x) = −2(x − 1)2 − 5 10. h(x) = 4(x + 4)2 + 6
11. y = − 1 — 4 (x + 2)2 + 1 12. y =
1 —
2 (x − 3)2 + 2
13. f(x) = 0.4(x − 1)2 14. g(x) = 0.75x2 − 5
ANALYZING RELATIONSHIPS In Exercises 15–18, use the axis of symmetry to match the equation with its graph.
15. y = 2(x − 3)2 + 1 16. y = (x + 4)2 − 2
17. y = 1 —
2 (x + 1)2 + 3 18. y = (x − 2)2 − 1
A.
x
y
2
−2
4 6
x = 2
B.
x
y
4
6
2
−2−4 2
x = –1
C.
x
y
4
2
2 4
x = 3
D.
x
y
2
−6
−2x = −4
REASONING In Exercises 19 and 20, use the axis of symmetry to plot the refl ection of each point and complete the parabola.
19.
x
y3
1
−1 1 3 5
(2, 3)
(1, 2)
(0, –1)x = 2
20.
x
y
−2−4−6(–1, 1)
(–3, –3)
(–2, –2) −2
−4
x = –3
In Exercises 21–30, graph the function. Label the vertex and axis of symmetry. (See Example 2.)
21. y = x2 + 2x + 1 22. y = 3x2 − 6x + 4
23. y = −4x2 + 8x + 2 24. f(x) = −x2 − 6x + 3
25. g(x) = −x2 − 1 26. f(x) = 6x2 − 5
27. g(x) = −1.5x2 + 3x + 2
28. f(x) = 0.5x2 + x − 3
29. y = 3 —
2 x2 − 3x + 6 30. y = −
5 — 2 x
2 − 4x − 1
31. WRITING Two quadratic functions have graphs with
vertices (2, 4) and (2, −3). Explain why you can not
use the axes of symmetry to distinguish between the
two functions.
32. WRITING A quadratic function is increasing to the left
of x = 2 and decreasing to the right of x = 2. Will the
vertex be the highest or lowest point on the graph of
the parabola? Explain.
1. WRITING Explain how to determine whether a quadratic function will have a minimum value
or a maximum value.
2. WHICH ONE DOESN’T BELONG? The graph of which function does not belong with the
other three? Explain.
f(x) = 3x2 + 6x − 24
f(x) = 3x2 + 24x − 6
f(x) = 3(x − 2)(x + 4)
f(x) = 3(x + 1)2 − 27
Vocabulary and Core Concept Checkpppp
Monitoring Progress and Modeling with MathematicsMonitoring Progress and Modeling with Mathematics
hsnb_alg2_pe_0202.indd 61hsnb_alg2_pe_0202.indd 61 2/5/15 10:26 AM2/5/15 10:26 AM
62 Chapter 2 Quadratic Functions
ERROR ANALYSIS In Exercises 33 and 34, describe and correct the error in analyzing the graph of y = 4x2 + 24x − 7.
33. The x-coordinate of the vertex is
x = b —
2a =
24 —
2(4) = 3.
✗
34. The y-intercept of the graph is the
value of c, which is 7.✗
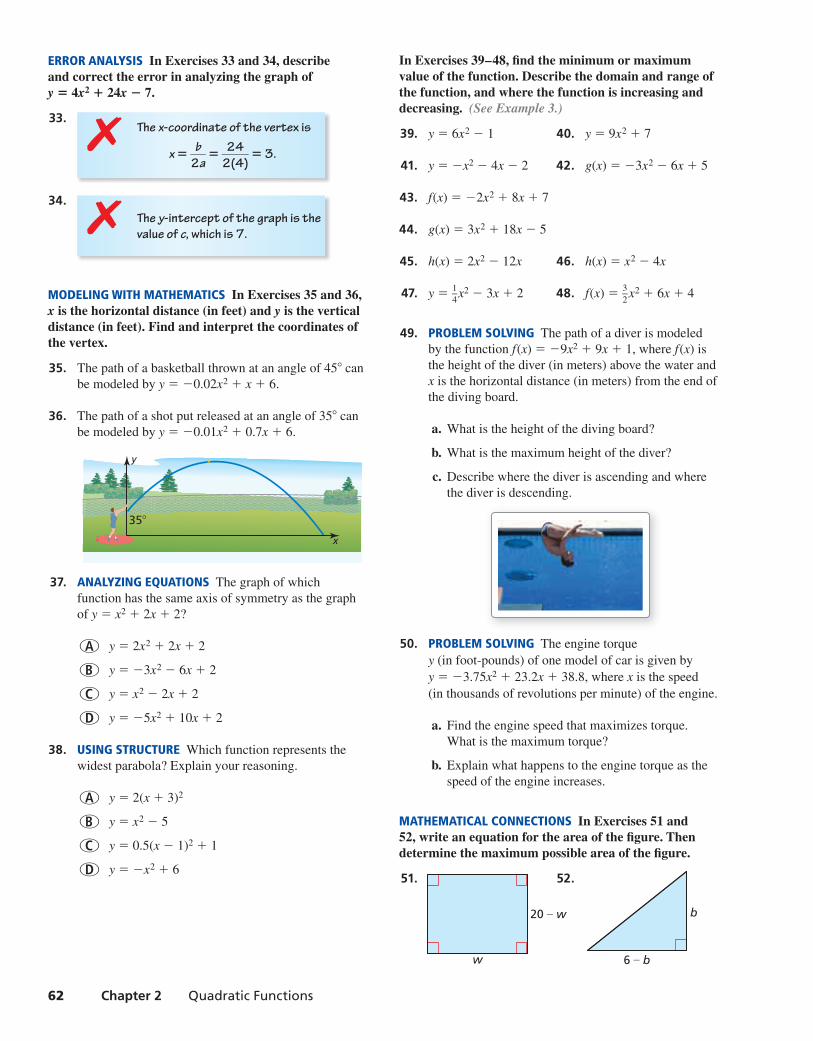
MODELING WITH MATHEMATICS In Exercises 35 and 36, x is the horizontal distance (in feet) and y is the vertical distance (in feet). Find and interpret the coordinates of the vertex.
35. The path of a basketball thrown at an angle of 45° can
be modeled by y = −0.02x2 + x + 6.
36. The path of a shot put released at an angle of 35° can
be modeled by y = −0.01x2 + 0.7x + 6.
x
35°
y
37. ANALYZING EQUATIONS The graph of which
function has the same axis of symmetry as the graph
of y = x2 + 2x + 2?
○A y = 2x2 + 2x + 2
○B y = −3x2 − 6x + 2
○C y = x2 − 2x + 2
○D y = −5x2 + 10x + 2
38. USING STRUCTURE Which function represents the
widest parabola? Explain your reasoning.
○A y = 2(x + 3)2
○B y = x2 − 5
○C y = 0.5(x − 1)2 + 1
○D y = −x2 + 6
In Exercises 39–48, fi nd the minimum or maximum value of the function. Describe the domain and range of the function, and where the function is increasing and decreasing. (See Example 3.)
39. y = 6x2 − 1 40. y = 9x2 + 7
41. y = −x2 − 4x − 2 42. g(x) = −3x2 − 6x + 5
43. f(x) = −2x2 + 8x + 7
44. g(x) = 3x2 + 18x − 5
45. h(x) = 2x2 − 12x 46. h(x) = x2 − 4x
47. y = 1 —
4 x2 − 3x + 2 48. f(x) =
3 —
2 x2 + 6x + 4
49. PROBLEM SOLVING The path of a diver is modeled
by the function f(x) = −9x2 + 9x + 1, where f(x) is
the height of the diver (in meters) above the water and
x is the horizontal distance (in meters) from the end of
the diving board.
a. What is the height of the diving board?
b. What is the maximum height of the diver?
c. Describe where the diver is ascending and where
the diver is descending.
50. PROBLEM SOLVING The engine torque
y (in foot-pounds) of one model of car is given by
y = −3.75x2 + 23.2x + 38.8, where x is the speed
(in thousands of revolutions per minute) of the engine.
a. Find the engine speed that maximizes torque.
What is the maximum torque?
b. Explain what happens to the engine torque as the
speed of the engine increases.
MATHEMATICAL CONNECTIONS In Exercises 51 and 52, write an equation for the area of the fi gure. Then determine the maximum possible area of the fi gure.
51. 52.
w
20 – w b
6 – b
hsnb_alg2_pe_0202.indd 62hsnb_alg2_pe_0202.indd 62 2/5/15 10:26 AM2/5/15 10:26 AM
Section 2.2 Characteristics of Quadratic Functions 63
In Exercises 53–60, graph the function. Label the x-intercept(s), vertex, and axis of symmetry. (See Example 4.)
53. y = (x + 3)(x − 3) 54. y = (x + 1)(x − 3)
55. y = 3(x + 2)(x + 6) 56. f(x) = 2(x − 5)(x − 1)
57. g(x) = −x(x + 6) 58. y = −4x(x + 7)
59. f(x) = −2(x − 3)2 60. y = 4(x − 7)2
USING TOOLS In Exercises 61–64, identify the x-intercepts of the function and describe where the graph is increasing and decreasing. Use a graphing calculator to verify your answer.
61. f(x) = 1 —
2 (x − 2)(x + 6)
62. y = 3 —
4 (x + 1)(x − 3)
63. g(x) = −4(x − 4)(x − 2)
64. h(x) = −5(x + 5)(x + 1)
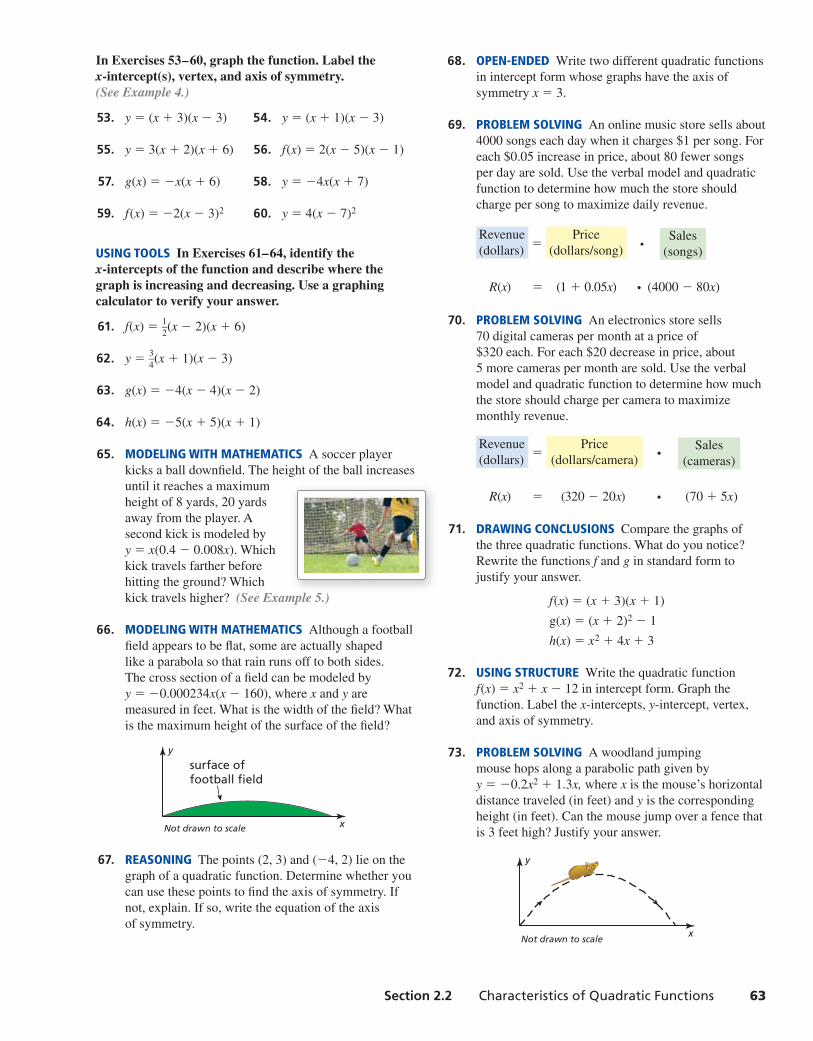
65. MODELING WITH MATHEMATICS A soccer player
kicks a ball downfi eld. The height of the ball increases
until it reaches a maximum
height of 8 yards, 20 yards
away from the player. A
second kick is modeled by
y = x(0.4 − 0.008x). Which
kick travels farther before
hitting the ground? Which
kick travels higher? (See Example 5.)
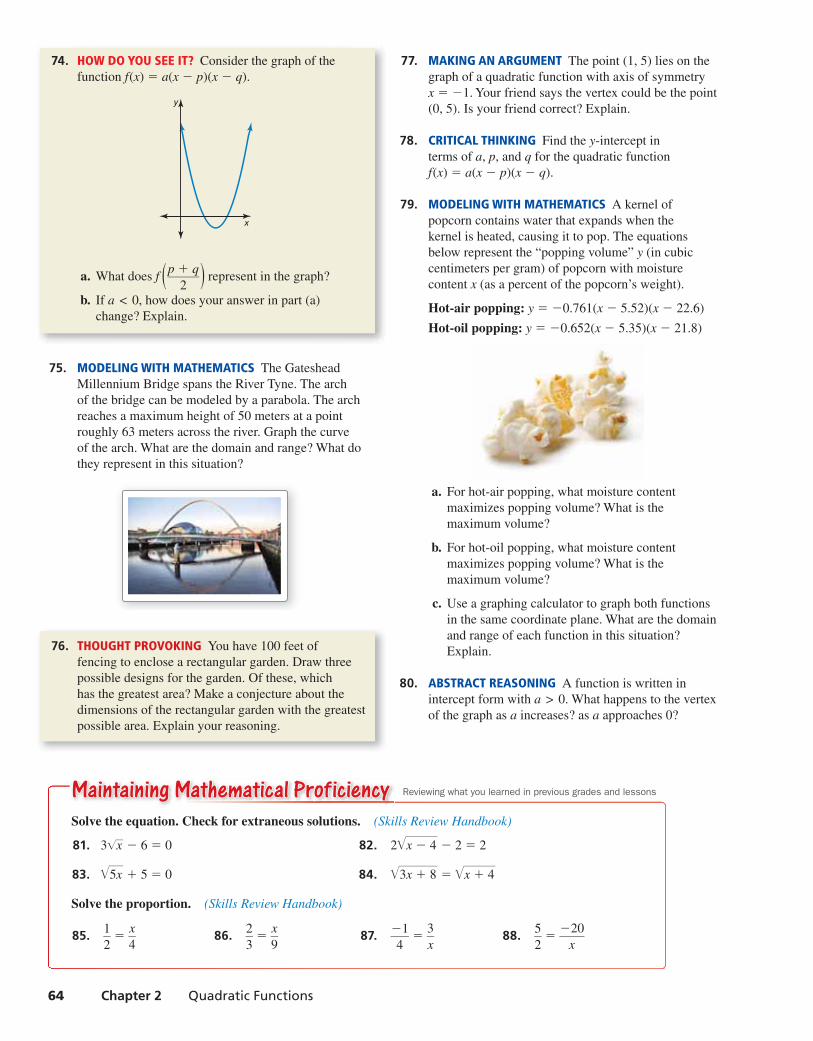
66. MODELING WITH MATHEMATICS Although a football
fi eld appears to be fl at, some are actually shaped
like a parabola so that rain runs off to both sides.
The cross section of a fi eld can be modeled by
y = −0.000234x(x − 160), where x and y are
measured in feet. What is the width of the fi eld? What
is the maximum height of the surface of the fi eld?
Not drawn to scale
y
surface offootball field
x
67. REASONING The points (2, 3) and (−4, 2) lie on the
graph of a quadratic function. Determine whether you
can use these points to fi nd the axis of symmetry. If
not, explain. If so, write the equation of the axis
of symmetry.
68. OPEN-ENDED Write two different quadratic functions
in intercept form whose graphs have the axis of
symmetry x = 3.
69. PROBLEM SOLVING An online music store sells about
4000 songs each day when it charges $1 per song. For
each $0.05 increase in price, about 80 fewer songs
per day are sold. Use the verbal model and quadratic
function to determine how much the store should
charge per song to maximize daily revenue.
Revenue
(dollars) =
Price
(dollars/song) ⋅
Sales
(songs)
R(x) = (1 + 0.05x) ⋅ (4000 − 80x)
70. PROBLEM SOLVING An electronics store sells
70 digital cameras per month at a price of
$320 each. For each $20 decrease in price, about
5 more cameras per month are sold. Use the verbal
model and quadratic function to determine how much
the store should charge per camera to maximize
monthly revenue.
Revenue
(dollars) =
Price
(dollars/camera) ⋅
Sales
(cameras)
R(x) = (320 − 20x) ⋅ (70 + 5x)
71. DRAWING CONCLUSIONS Compare the graphs of
the three quadratic functions. What do you notice?
Rewrite the functions f and g in standard form to
justify your answer.
f(x) = (x + 3)(x + 1)
g(x) = (x + 2)2 − 1
h(x) = x2 + 4x + 3
72. USING STRUCTURE Write the quadratic function
f(x) = x2 + x − 12 in intercept form. Graph the
function. Label the x-intercepts, y-intercept, vertex,
and axis of symmetry.
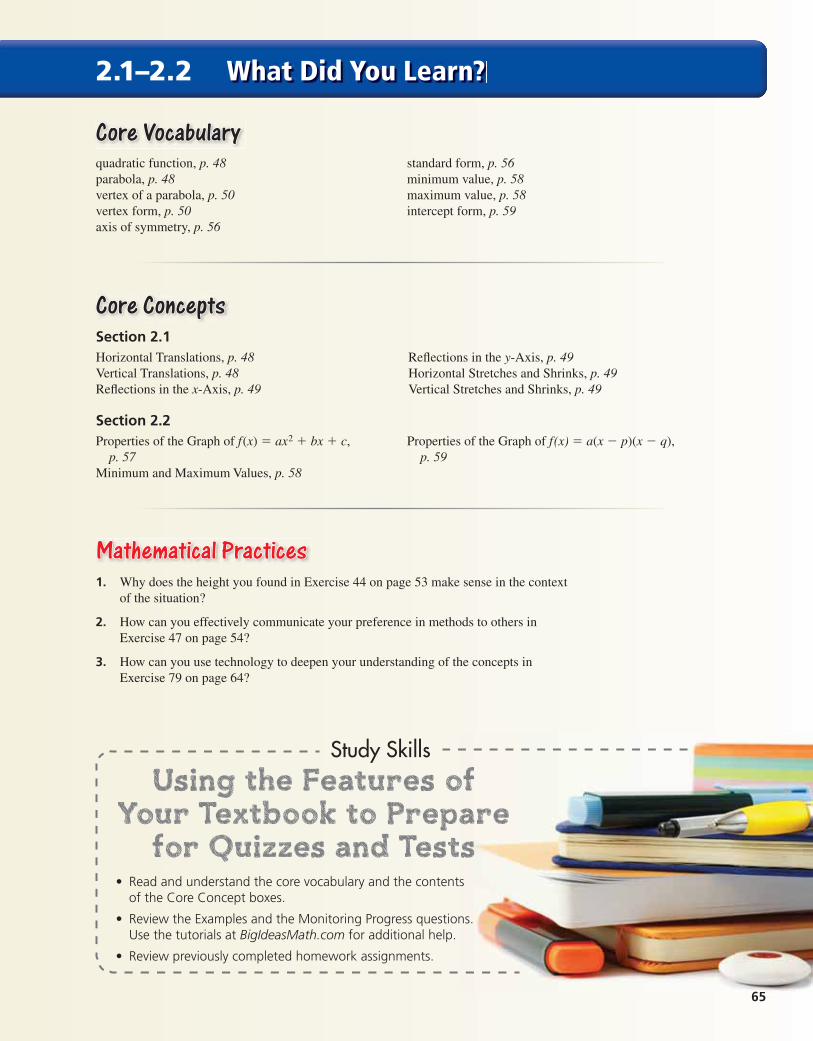
73. PROBLEM SOLVING A woodland jumping
mouse hops along a parabolic path given by
y = −0.2x2 + 1.3x, where x is the mouse’s horizontal
distance traveled (in feet) and y is the corresponding
height (in feet). Can the mouse jump over a fence that
is 3 feet high? Justify your answer.
Not drawn to scalex
y
l 5 )
hsnb_alg2_pe_0202.indd 63hsnb_alg2_pe_0202.indd 63 2/5/15 10:26 AM2/5/15 10:26 AM
64 Chapter 2 Quadratic Functions
74. HOW DO YOU SEE IT? Consider the graph of the
function f(x) = a(x − p)(x − q).
x
y
a. What does f ( p + q —
2 ) represent in the graph?
b. If a < 0, how does your answer in part (a)
change? Explain.
75. MODELING WITH MATHEMATICS The Gateshead
Millennium Bridge spans the River Tyne. The arch
of the bridge can be modeled by a parabola. The arch
reaches a maximum height of 50 meters at a point
roughly 63 meters across the river. Graph the curve
of the arch. What are the domain and range? What do
they represent in this situation?
76. THOUGHT PROVOKING You have 100 feet of
fencing to enclose a rectangular garden. Draw three
possible designs for the garden. Of these, which
has the greatest area? Make a conjecture about the
dimensions of the rectangular garden with the greatest
possible area. Explain your reasoning.
77. MAKING AN ARGUMENT The point (1, 5) lies on the
graph of a quadratic function with axis of symmetry
x = −1. Your friend says the vertex could be the point
(0, 5). Is your friend correct? Explain.
78. CRITICAL THINKING Find the y-intercept in
terms of a, p, and q for the quadratic function
f(x) = a(x − p)(x − q).
79. MODELING WITH MATHEMATICS A kernel of
popcorn contains water that expands when the
kernel is heated, causing it to pop. The equations
below represent the “popping volume” y (in cubic
centimeters per gram) of popcorn with moisture
content x (as a percent of the popcorn’s weight).
Hot-air popping: y = −0.761(x − 5.52)(x − 22.6)
Hot-oil popping: y = −0.652(x − 5.35)(x − 21.8)
a. For hot-air popping, what moisture content
maximizes popping volume? What is the
maximum volume?
b. For hot-oil popping, what moisture content
maximizes popping volume? What is the
maximum volume?
c. Use a graphing calculator to graph both functions
in the same coordinate plane. What are the domain
and range of each function in this situation?
Explain.
80. ABSTRACT REASONING A function is written in
intercept form with a > 0. What happens to the vertex
of the graph as a increases? as a approaches 0?
Maintaining Mathematical ProficiencyMaintaining Mathematical ProficiencySolve the equation. Check for extraneous solutions. (Skills Review Handbook)
81. 3 √—
x − 6 = 0 82. 2 √—
x − 4 − 2 = 2
83. √—
5x + 5 = 0 84. √—
3x + 8 = √—
x + 4
Solve the proportion. (Skills Review Handbook)
85. 1 — 2 =
x —
4 86. 2 —
3 =
x —
9 87. −1
— 4 =
3 —
x 88. 5 —
2 =
−20 —
x
Reviewing what you learned in previous grades and lessons
hsnb_alg2_pe_0202.indd 64hsnb_alg2_pe_0202.indd 64 2/5/15 10:26 AM2/5/15 10:26 AM
6565
Study Skills
2.1–2.2 What Did You Learn?
Core VocabularyCore Vocabularyquadratic function, p. 48 standard form, p. 56parabola, p. 48 minimum value, p. 58vertex of a parabola, p. 50 maximum value, p. 58vertex form, p. 50 intercept form, p. 59axis of symmetry, p. 56
Core ConceptsCore ConceptsSection 2.1Horizontal Translations, p. 48 Refl ections in the y-Axis, p. 49Vertical Translations, p. 48 Horizontal Stretches and Shrinks, p. 49Refl ections in the x-Axis, p. 49 Vertical Stretches and Shrinks, p. 49
Section 2.2Properties of the Graph of f(x) = ax2 + bx + c, Properties of the Graph of f(x) = a(x − p)(x − q), p. 57 p. 59Minimum and Maximum Values, p. 58
Mathematical PracticesMathematical Practices1. Why does the height you found in Exercise 44 on page 53 make sense in the context
of the situation?
2. How can you effectively communicate your preference in methods to others in
Exercise 47 on page 54?
3. How can you use technology to deepen your understanding of the concepts in
Exercise 79 on page 64?
• Read and understand the core vocabulary and the contents of the Core Concept boxes.
• Review the Examples and the Monitoring Progress questions. Use the tutorials at BigIdeasMath.com for additional help.
• Review previously completed homework assignments.
Using the Features of Your Textbook to Prepare
for Quizzes and Tests
hsnb_alg2_pe_02mc.indd 65hsnb_alg2_pe_02mc.indd 65 2/5/15 10:04 AM2/5/15 10:04 AM

66 Chapter 2 Quadratic Functions
2.1–2.2 Quiz
Describe the transformation of f(x) = x2 represented by g. (Section 2.1)
1.
x
y
4
42−2
gf 2.
x
y4
2
−2−6
gf
3.
x
y
2
4−2g
f
Write a rule for g and identify the vertex. (Section 2.1)
4. Let g be a translation 2 units up followed by a refl ection in the x-axis and a vertical stretch
by a factor of 6 of the graph of f(x) = x2.
5. Let g be a translation 1 unit left and 6 units down, followed by a vertical shrink by a factor
of 1 —
2 of the graph of f(x) = 3(x + 2)2.
6. Let g be a horizontal shrink by a factor of 1 —
4 , followed by a translation 1 unit up and 3 units
right of the graph of f(x) = (2x + 1)2 − 11.
Graph the function. Label the vertex and axis of symmetry. (Section 2.2)
7. f(x) = 2(x − 1)2 − 5 8. h(x) = 3x2 + 6x − 2 9. f(x) = 7 − 8x − x2
Find the x-intercepts of the graph of the function. Then describe where the function is increasing and decreasing. (Section 2.2)
10. g(x) = −3(x + 2)(x + 4) 11. g(x) = 1 —
2 (x − 5)(x + 1) 12. f (x) = 0.4x(x − 6)
13. A grasshopper can jump incredible distances, up to 20 times its length. The height
(in inches) of the jump above the ground of a 1-inch-long grasshopper is given
by h(x) = − 1 — 20 x
2 + x, where x is the horizontal distance (in inches) of the jump. When
the grasshopper jumps off a rock, it lands on the ground 2 inches farther. Write a function
that models the new path of the jump. (Section 2.1)
x
y
(0, 0) (20, 0)Not drawn to scale
14. A passenger on a stranded lifeboat shoots a distress fl are into the air. The
height (in feet) of the fl are above the water is given by f(t) = −16t(t − 8),
where t is time (in seconds) since the fl are was shot. The passenger shoots a
second fl are, whose path is modeled in the graph. Which fl are travels higher?
Which remains in the air longer? Justify your answer. (Section 2.2)
x
y
(0, 0) (7, 0)
(3.5, 196)
hsnb_alg2_pe_02mc.indd 66hsnb_alg2_pe_02mc.indd 66 2/5/15 10:04 AM2/5/15 10:04 AM
Section 2.3 Focus of a Parabola 67
Focus of a Parabola2.3
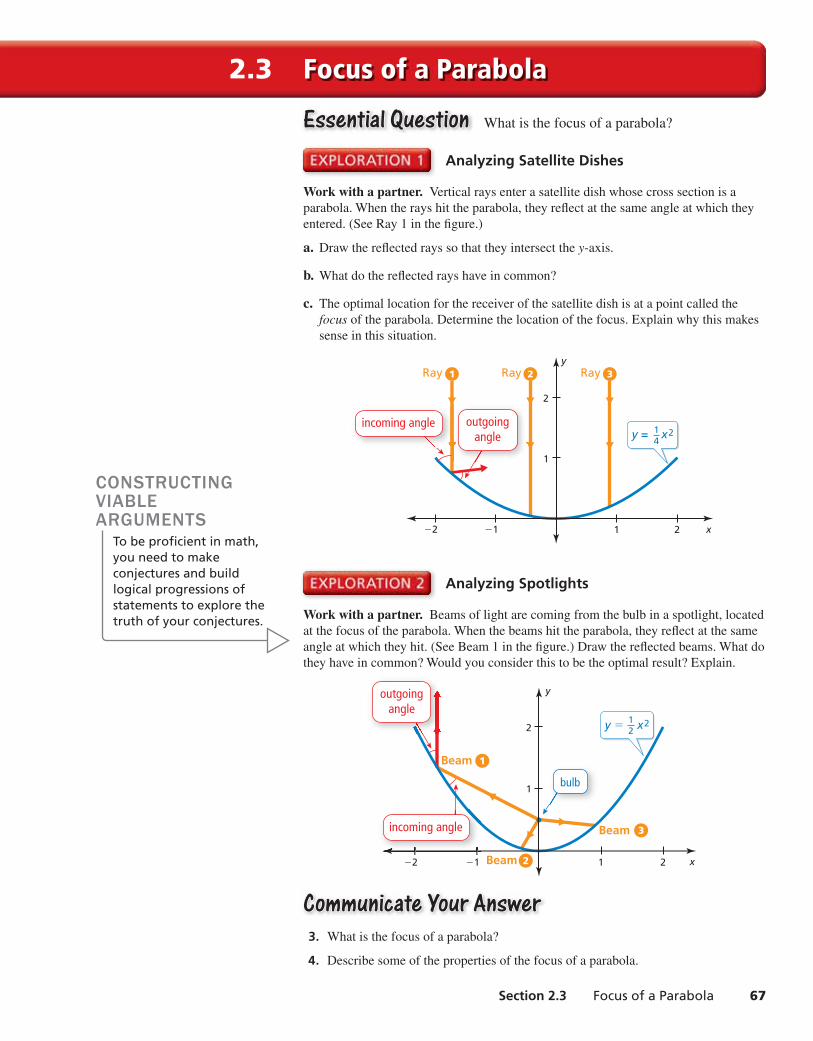
Essential QuestionEssential Question What is the focus of a parabola?
Analyzing Satellite Dishes
Work with a partner. Vertical rays enter a satellite dish whose cross section is a
parabola. When the rays hit the parabola, they refl ect at the same angle at which they
entered. (See Ray 1 in the fi gure.)
a. Draw the refl ected rays so that they intersect the y-axis.
b. What do the refl ected rays have in common?
c. The optimal location for the receiver of the satellite dish is at a point called the
focus of the parabola. Determine the location of the focus. Explain why this makes
sense in this situation.
−1−2 1 2
1
2
y = x214
x
yRay Ray Ray
incoming angle outgoingangle
Analyzing Spotlights
Work with a partner. Beams of light are coming from the bulb in a spotlight, located
at the focus of the parabola. When the beams hit the parabola, they refl ect at the same
angle at which they hit. (See Beam 1 in the fi gure.) Draw the refl ected beams. What do
they have in common? Would you consider this to be the optimal result? Explain.
−1−2 1 2
1
2 y = x212
x
y
Beam
Beam
Beam
bulb
incoming angle
outgoingangle
Communicate Your AnswerCommunicate Your Answer 3. What is the focus of a parabola?
4. Describe some of the properties of the focus of a parabola.
CONSTRUCTING VIABLE ARGUMENTS
To be profi cient in math, you need to make conjectures and build logical progressions of statements to explore the truth of your conjectures.
hsnb_alg2_pe_0203.indd 67hsnb_alg2_pe_0203.indd 67 2/5/15 10:27 AM2/5/15 10:27 AM
68 Chapter 2 Quadratic Functions
2.3 Lesson What You Will LearnWhat You Will Learn Explore the focus and the directrix of a parabola.
Write equations of parabolas.
Solve real-life problems.
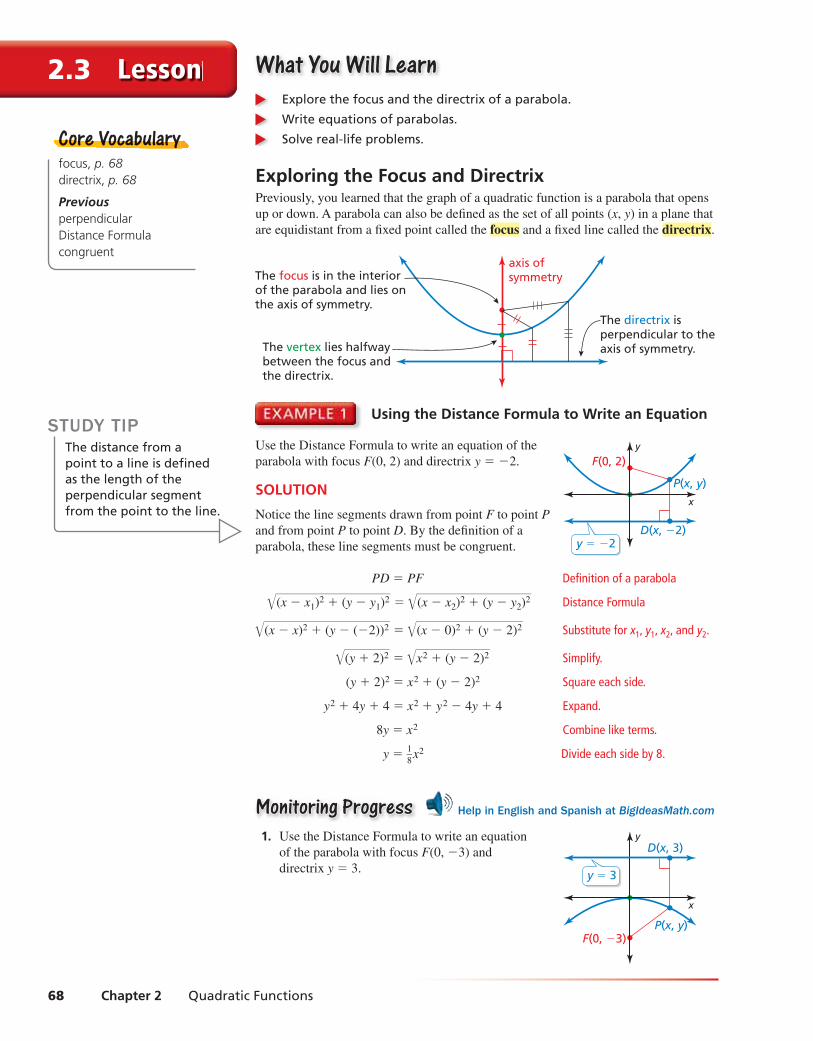
Exploring the Focus and DirectrixPreviously, you learned that the graph of a quadratic function is a parabola that opens
up or down. A parabola can also be defi ned as the set of all points (x, y) in a plane that
are equidistant from a fi xed point called the focus and a fi xed line called the directrix.
axis ofsymmetry
The directrix isperpendicular to theaxis of symmetry.
The focus is in the interiorof the parabola and lies onthe axis of symmetry.
The vertex lies halfwaybetween the focus andthe directrix.
focus, p. 68directrix, p. 68
PreviousperpendicularDistance Formulacongruent
Core VocabularyCore Vocabullarry
Using the Distance Formula to Write an Equation
Use the Distance Formula to write an equation of the
parabola with focus F(0, 2) and directrix y = −2.
SOLUTION
Notice the line segments drawn from point F to point P
and from point P to point D. By the defi nition of a
parabola, these line segments must be congruent.
PD = PF Defi nition of a parabola
√——
(x − x1)2 + (y − y1)
2 = √——
(x − x2)2 + (y − y2)
2 Distance Formula
√——
(x − x)2 + (y − (−2))2 = √——
(x − 0)2 + (y − 2)2 Substitute for x1, y1, x2, and y2.
√—
(y + 2)2 = √——
x2 + (y − 2)2 Simplify.
(y + 2)2 = x2 + (y − 2)2 Square each side.
y2 + 4y + 4 = x2 + y2 − 4y + 4 Expand.
8y = x2 Combine like terms.
y = 1 —
8 x2 Divide each side by 8.
Monitoring ProgressMonitoring Progress Help in English and Spanish at BigIdeasMath.com
1. Use the Distance Formula to write an equation
of the parabola with focus F(0, −3) and
directrix y = 3.
STUDY TIPThe distance from a point to a line is defi ned as the length of the perpendicular segment from the point to the line.
x
y
F(0, 2)
P(x, y)
D(x, −2)y = −2
x
y
F(0, −3)P(x, y)
D(x, 3)
y = 3
hsnb_alg2_pe_0203.indd 68hsnb_alg2_pe_0203.indd 68 2/5/15 10:27 AM2/5/15 10:27 AM
Section 2.3 Focus of a Parabola 69
You can derive the equation of a parabola that opens up or down with vertex (0, 0),
focus (0, p), and directrix y = −p using the procedure in Example 1.
√——
(x − x)2 + (y − (−p))2 = √——
(x − 0)2 + (y − p)2
(y + p)2 = x2 + (y − p)2
y2 + 2py + p2 = x2 + y2 − 2py + p2
4py = x2
y = 1 —
4p x2
The focus and directrix each lie ∣ p ∣ units from the vertex. Parabolas can also open left
or right, in which case the equation has the form x = 1 —
4p y2 when the vertex is (0, 0).
LOOKING FOR STRUCTURE
Notice that y = 1 — 4p
x2 is
of the form y = ax2. So, changing the value of p vertically stretches or shrinks the parabola.
STUDY TIPNotice that parabolas opening left or right do not represent functions.
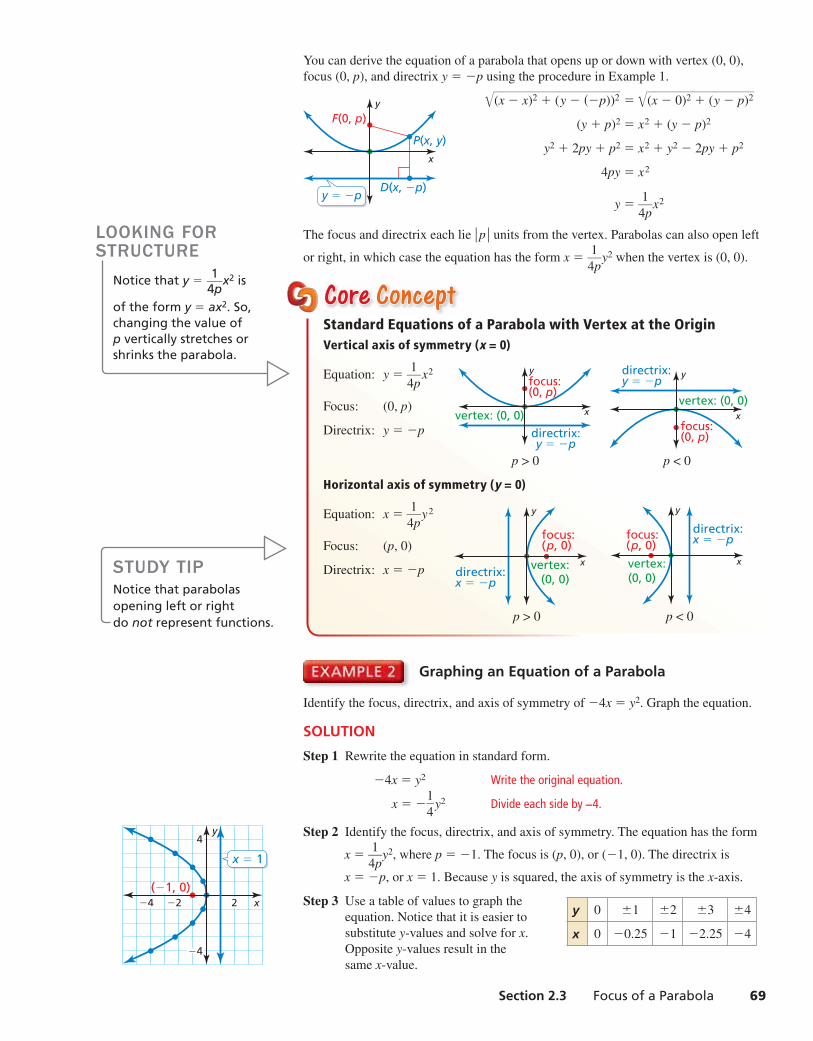
Core Core ConceptConceptStandard Equations of a Parabola with Vertex at the OriginVertical axis of symmetry (x = 0)
Equation: y = 1 —
4p x2
x
yfocus:(0, p)
directrix:y = −p
vertex: (0, 0)
x
y
focus:(0, p)
directrix:y = −p
vertex: (0, 0)Focus: (0, p)
Directrix: y = −p
p > 0 p < 0
Horizontal axis of symmetry (y = 0)
Equation: x = 1 —
4p y2
x
y
focus:(p, 0)
directrix:x = −p
vertex:(0, 0)
x
y
focus:(p, 0)
directrix:x = −p
vertex:(0, 0)
Focus: (p, 0)
Directrix: x = −p
p > 0 p < 0
Graphing an Equation of a Parabola
Identify the focus, directrix, and axis of symmetry of −4x = y2. Graph the equation.
SOLUTION
Step 1 Rewrite the equation in standard form.
−4x = y2 Write the original equation.
x = − 1 —
4 y2 Divide each side by –4.
Step 2 Identify the focus, directrix, and axis of symmetry. The equation has the form
x = 1 —
4p y2, where p = −1. The focus is (p, 0), or (−1, 0). The directrix is
x = −p, or x = 1. Because y is squared, the axis of symmetry is the x-axis.
Step 3 Use a table of values to graph the
equation. Notice that it is easier to
substitute y-values and solve for x.
Opposite y-values result in the
same x-value.
x
y
F(0, p)
P(x, y)
D(x, −p)y = −p
x
y4
−4
2−2−4(−1, 0)
x = 1
y 0 ±1 ±2 ±3 ±4
x 0 −0.25 −1 −2.25 −4
hsnb_alg2_pe_0203.indd 69hsnb_alg2_pe_0203.indd 69 2/5/15 10:27 AM2/5/15 10:27 AM
70 Chapter 2 Quadratic Functions
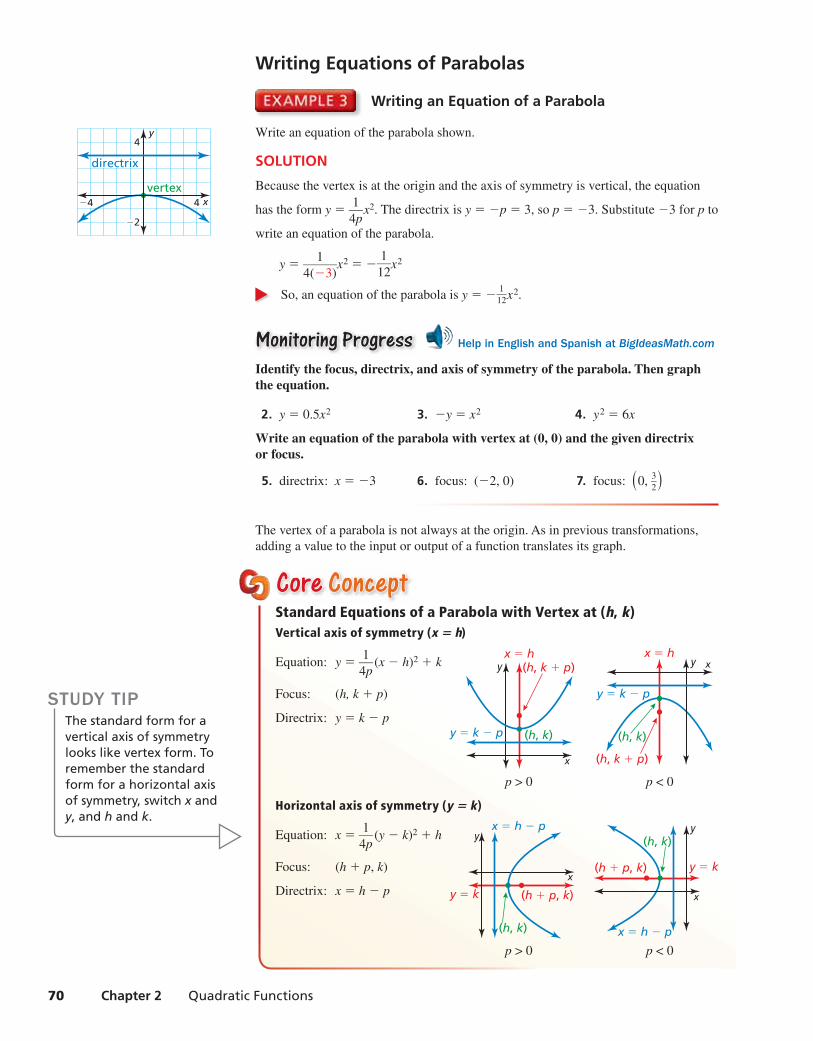
Writing an Equation of a Parabola
Write an equation of the parabola shown.
SOLUTION
Because the vertex is at the origin and the axis of symmetry is vertical, the equation
has the form y = 1 —
4p x2. The directrix is y = −p = 3, so p = −3. Substitute −3 for p to
write an equation of the parabola.
y = 1 —
4(−3) x2 = −
1 —
12 x2
So, an equation of the parabola is y = − 1 — 12 x
2.
Monitoring ProgressMonitoring Progress Help in English and Spanish at BigIdeasMath.com
Identify the focus, directrix, and axis of symmetry of the parabola. Then graph the equation.
2. y = 0.5x2 3. −y = x2 4. y2 = 6x
Write an equation of the parabola with vertex at (0, 0) and the given directrix or focus.
5. directrix: x = −3 6. focus: (−2, 0) 7. focus: ( 0, 3 —
2 )
The vertex of a parabola is not always at the origin. As in previous transformations,
adding a value to the input or output of a function translates its graph.
Writing Equations of Parabolas
Core Core ConceptConceptStandard Equations of a Parabola with Vertex at (h, k)Vertical axis of symmetry (x = h)
Equation: y = 1 —
4p (x − h)2 + k
x
y
(h, k)
(h, k + p)x = h
y = k − p
xyx = h
y = k − p
(h, k)
(h, k + p)
Focus: (h, k + p)
Directrix: y = k − p
p > 0 p < 0
Horizontal axis of symmetry (y = k)
Equation: x = 1 —
4p (y − k)2 + h
x
y
y = k
x = h − p
(h, k)
(h + p, k)
x
y
y = k
x = h − p
(h, k)
(h + p, k)Focus: (h + p, k)
Directrix: x = h − p
p > 0 p < 0
STUDY TIPThe standard form for a vertical axis of symmetry looks like vertex form. To remember the standard form for a horizontal axis of symmetry, switch x and y, and h and k.
x
y4
−2
4−4
directrix
vertex
hsnb_alg2_pe_0203.indd 70hsnb_alg2_pe_0203.indd 70 2/5/15 10:27 AM2/5/15 10:27 AM

Section 2.3 Focus of a Parabola 71
Writing an Equation of a Translated Parabola
Write an equation of the parabola shown.
SOLUTION
Because the vertex is not at the origin and the axis of symmetry is horizontal, the
equation has the form x = 1 —
4p (y − k)2 + h. The vertex (h, k) is (6, 2) and the focus
(h + p, k) is (10, 2), so h = 6, k = 2, and p = 4. Substitute these values to write an
equation of the parabola.
x = 1 —
4(4) (y − 2)2 + 6 =
1 —
16 (y − 2)2 + 6
So, an equation of the parabola is x = 1 —
16 (y − 2)2 + 6.
Solving a Real-Life Problem
An electricity-generating dish uses a parabolic refl ector to concentrate sunlight onto a
high-frequency engine located at the focus of the refl ector. The sunlight heats helium
to 650°C to power the engine. Write an equation that represents the cross section of the
dish shown with its vertex at (0, 0). What is the depth of the dish?
SOLUTION
Because the vertex is at the origin, and the axis of symmetry is vertical, the equation
has the form y = 1 —
4p x2. The engine is at the focus, which is 4.5 meters above the
vertex. So, p = 4.5. Substitute 4.5 for p to write the equation.
y = 1 —
4(4.5) x2 =
1 —
18 x2
The depth of the dish is the y-value at the dish’s outside edge. The dish extends
8.5 —
2 = 4.25 meters to either side of the vertex (0, 0), so fi nd y when x = 4.25.
y = 1 —
18 (4.25)2 ≈ 1
The depth of the dish is about 1 meter.
Monitoring ProgressMonitoring Progress Help in English and Spanish at BigIdeasMath.com
8. Write an equation of a parabola with vertex (−1, 4) and focus (−1, 2).
9. A parabolic microwave antenna is 16 feet in diameter. Write an equation that
represents the cross section of the antenna with its vertex at (0, 0) and its focus
10 feet to the right of the vertex. What is the depth of the antenna?
x
y
4
8
4 12 16
vertex focus
Solving Real-Life ProblemsParabolic refl ectors have cross
sections that are parabolas.
Incoming sound, light, or other
energy that arrives at a parabolic
refl ector parallel to the axis of
symmetry is directed to the focus
(Diagram 1). Similarly, energy that is emitted from the focus of a parabolic refl ector
and then strikes the refl ector is directed parallel to the axis of symmetry (Diagram 2).
Diagram 1
Focus
Diagram 2
Focus
x
y
4.5 m
8.5 m
engine
hsnb_alg2_pe_0203.indd 71hsnb_alg2_pe_0203.indd 71 2/5/15 10:27 AM2/5/15 10:27 AM
72 Chapter 2 Quadratic Functions
Exercises2.3 Dynamic Solutions available at BigIdeasMath.com
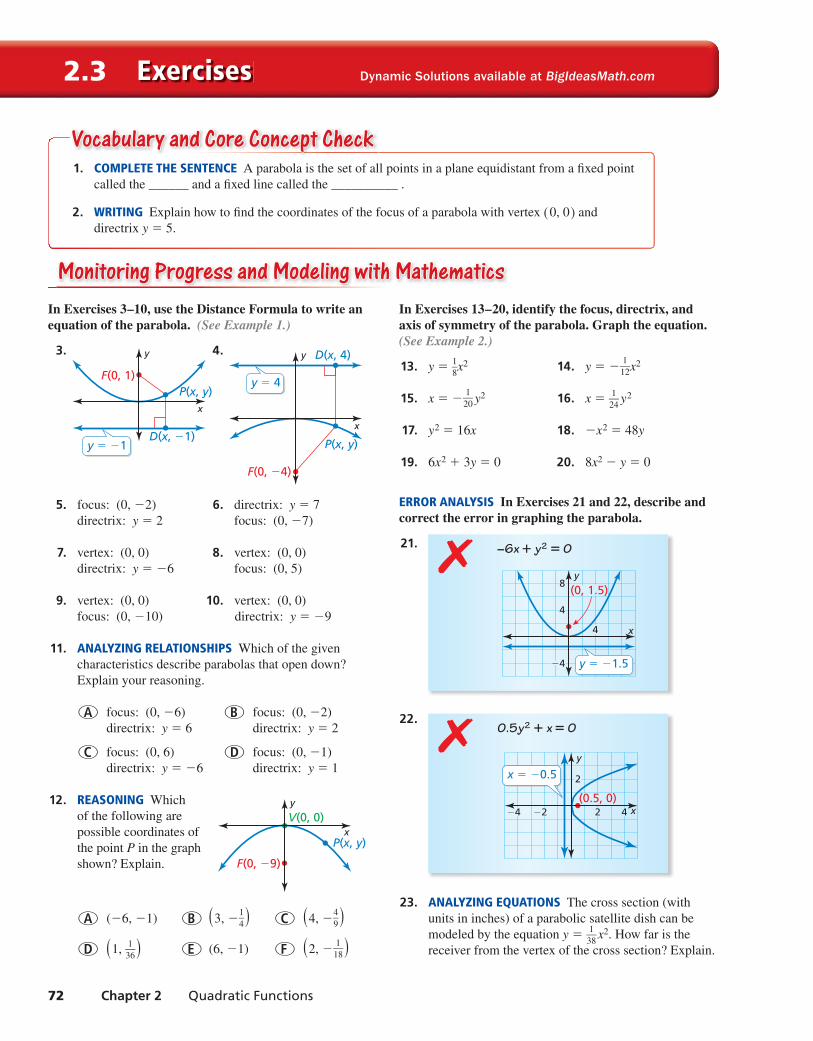
In Exercises 3–10, use the Distance Formula to write an equation of the parabola. (See Example 1.)
3. 4.
5. focus: (0, −2) 6. directrix: y = 7
directrix: y = 2 focus: (0, −7)
7. vertex: (0, 0) 8. vertex: (0, 0)
directrix: y = −6 focus: (0, 5)
9. vertex: (0, 0) 10. vertex: (0, 0)
focus: (0, −10) directrix: y = −9
11. ANALYZING RELATIONSHIPS Which of the given
characteristics describe parabolas that open down?
Explain your reasoning.
○A focus: (0, −6) ○B focus: (0, −2)
directrix: y = 6 directrix: y = 2
○C focus: (0, 6) ○D focus: (0, −1)
directrix: y = −6 directrix: y = 1
12. REASONING Which
of the following are
possible coordinates of
the point P in the graph
shown? Explain.
○A (−6, −1) ○B ( 3, − 1 — 4 ) ○C ( 4, −
4 — 9 )
○D ( 1, 1 —
36 ) ○E (6, −1) ○F ( 2, −
1 — 18 )
In Exercises 13–20, identify the focus, directrix, and axis of symmetry of the parabola. Graph the equation. (See Example 2.)
13. y = 1 —
8 x2 14. y = −
1 — 12 x
2
15. x = − 1 — 20 y
2 16. x = 1 —
24 y2
17. y2 = 16x 18. −x2 = 48y
19. 6x2 + 3y = 0 20. 8x2 − y = 0
ERROR ANALYSIS In Exercises 21 and 22, describe and correct the error in graphing the parabola.
21. –6x + y2 = 0
x
y
4
8
4
(0, 1.5)
−4 y = −1.5
✗
22. 0.5y2 + x = 0
x
y
2
2 4(0.5, 0)
−2−4
x = −0.5
✗
23. ANALYZING EQUATIONS The cross section (with
units in inches) of a parabolic satellite dish can be
modeled by the equation y = 1 —
38 x2. How far is the
receiver from the vertex of the cross section? Explain.
Monitoring Progress and Modeling with MathematicsMonitoring Progress and Modeling with Mathematics
1. COMPLETE THE SENTENCE A parabola is the set of all points in a plane equidistant from a fi xed point
called the ______ and a fi xed line called the __________ .
2. WRITING Explain how to fi nd the coordinates of the focus of a parabola with vertex ( 0, 0 ) and
directrix y = 5.
Vocabulary and Core Concept CheckVocabulary and Core Concept Check
x
D(x, −1)
P(x, y)F(0, 1)
y
y = −1
D(x, 4)
P(x, y)
F(0, −4)
x
y
y = 4
x
y
P(x, y)
V(0, 0)
F(0, −9)
hsnb_alg2_pe_0203.indd 72hsnb_alg2_pe_0203.indd 72 2/5/15 10:27 AM2/5/15 10:27 AM

Section 2.3 Focus of a Parabola 73
24. ANALYZING EQUATIONS The cross section (with
units in inches) of a parabolic spotlight can be
modeled by the equation x = 1 —
20 y2. How far is the bulb
from the vertex of the cross section? Explain.
In Exercises 25–28, write an equation of the parabola shown. (See Example 3.)
25.
x
y = −8
y
directrix
vertex
26.
27. 28.
In Exercises 29–36, write an equation of the parabola with the given characteristics.
29. focus: (3, 0) 30. focus: ( 2 — 3 , 0 )
directrix: x = −3 directrix: x = − 2 — 3
31. directrix: x = −10 32. directrix: y = 8 —
3
vertex: (0, 0) vertex: (0, 0)
33. focus: ( 0, − 5 — 3 ) 34. focus: ( 0,
5 —
4 )
directrix: y = 5 —
3 directrix: y = −
5 — 4
35. focus: ( 0, 6 —
7 ) 36. focus: ( −
4 — 5 , 0 )
vertex: (0, 0) vertex: (0, 0)
In Exercises 37–40, write an equation of the parabola shown. (See Example 4.)
37. 38.
x
y
4
8
vertexfocus
−4
−8
−12
x
y
2
4
2 6
vertex focus
−2
39. 40.
x
y
2
3
−1−2 1 2
vertex
focus
x
y
focus
−2 2−6vertex
−10
−14
−10
In Exercises 41–46, identify the vertex, focus, directrix, and axis of symmetry of the parabola. Describe the transformations of the graph of the standard equation with p = 1 and vertex (0, 0).
41. y = 1 —
8 (x − 3)2 + 2 42. y = −
1 — 4 (x + 2)2 + 1
43. x = 1 —
16 (y − 3)2 + 1 44. y = (x + 3)2 − 5
45. x = −3(y + 4)2 + 2 46. x = 4(y + 5)2 − 1
47. MODELING WITH MATHEMATICS Scientists studying
dolphin echolocation simulate the projection of a
bottlenose dolphin’s clicking sounds using computer
models. The models originate the sounds at the focus
of a parabolic refl ector. The parabola in the graph
shows the cross section of the refl ector with focal
length of 1.3 inches and aperture width of 8 inches.
Write an equation to represent the cross section
of the refl ector. What is the depth of the refl ector?
(See Example 5.)
x
y
focal length
aperture
F
x
y = y
directrix
vertex
34
x
x =
y
directrix
vertex
52
x
x = −2
y
directrix
vertex
hsnb_alg2_pe_0203.indd 73hsnb_alg2_pe_0203.indd 73 2/5/15 10:27 AM2/5/15 10:27 AM
74 Chapter 2 Quadratic Functions
Maintaining Mathematical ProficiencyMaintaining Mathematical ProficiencyWrite an equation of the line that passes through the points. (Section 1.3)
55. (1, −4), (2, −1) 56. (−3, 12), (0, 6) 57. (3, 1), (−5, 5) 58. (2, −1), (0, 1)
Use a graphing calculator to fi nd an equation for the line of best fi t. (Section 1.3)
59. x 0 3 6 7 11
y 4 9 24 29 46
60. x 0 5 10 12 16
y 18 15 9 7 2
Reviewing what you learned in previous grades and lessons
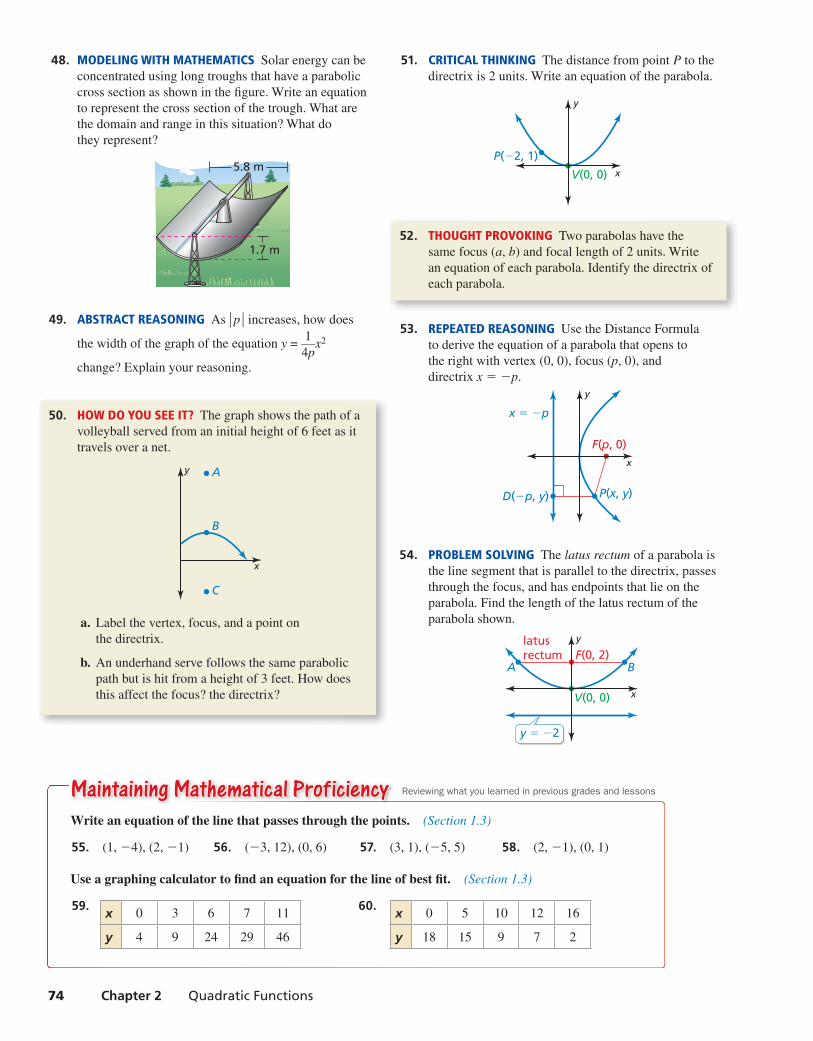
48. MODELING WITH MATHEMATICS Solar energy can be
concentrated using long troughs that have a parabolic
cross section as shown in the fi gure. Write an equation
to represent the cross section of the trough. What are
the domain and range in this situation? What do
they represent?
1.7 m
5.8 m
49. ABSTRACT REASONING As ∣ p ∣ increases, how does
the width of the graph of the equation y = 1 —
4p x2
change? Explain your reasoning.
50. HOW DO YOU SEE IT? The graph shows the path of a
volleyball served from an initial height of 6 feet as it
travels over a net.
x
y A
B
C
a. Label the vertex, focus, and a point on
the directrix.
b. An underhand serve follows the same parabolic
path but is hit from a height of 3 feet. How does
this affect the focus? the directrix?
51. CRITICAL THINKING The distance from point P to the
directrix is 2 units. Write an equation of the parabola.
x
y
P(−2, 1)
V(0, 0)
52. THOUGHT PROVOKING Two parabolas have the
same focus (a, b) and focal length of 2 units. Write
an equation of each parabola. Identify the directrix of
each parabola.
53. REPEATED REASONING Use the Distance Formula
to derive the equation of a parabola that opens to
the right with vertex (0, 0), focus (p, 0), and
directrix x = −p.
x
y
F(p, 0)
P(x, y)D(−p, y)
x = −p
54. PROBLEM SOLVING The latus rectum of a parabola is
the line segment that is parallel to the directrix, passes
through the focus, and has endpoints that lie on the
parabola. Find the length of the latus rectum of the
parabola shown.
x
y
V(0, 0)
F(0, 2)A B
latusrectum
y = −2
hsnb_alg2_pe_0203.indd 74hsnb_alg2_pe_0203.indd 74 2/5/15 10:27 AM2/5/15 10:27 AM
Section 2.4 Modeling with Quadratic Functions 75
Modeling with Quadratic Functions2.4
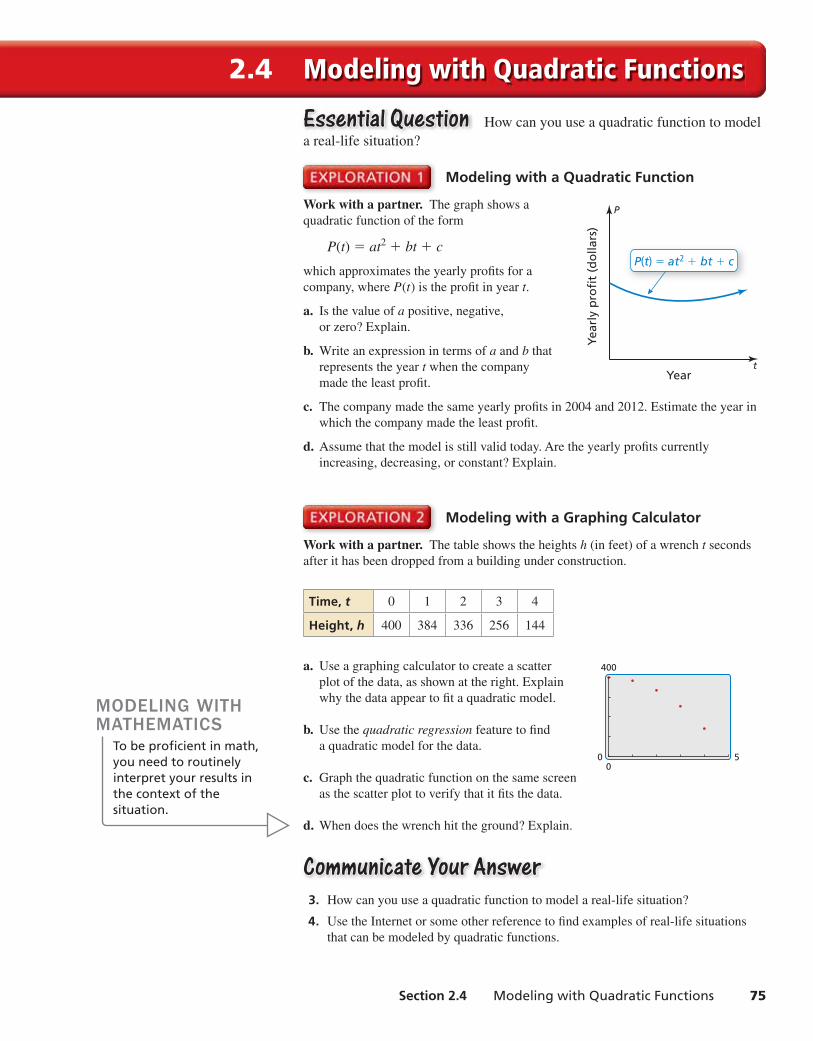
Modeling with a Quadratic Function
Work with a partner. The graph shows a
quadratic function of the form
P(t) = at2 + bt + c
which approximates the yearly profi ts for a
company, where P(t) is the profi t in year t.
a. Is the value of a positive, negative,
or zero? Explain.
b. Write an expression in terms of a and b that
represents the year t when the company
made the least profi t.
c. The company made the same yearly profi ts in 2004 and 2012. Estimate the year in
which the company made the least profi t.
d. Assume that the model is still valid today. Are the yearly profi ts currently
increasing, decreasing, or constant? Explain.
Essential QuestionEssential Question How can you use a quadratic function to model
a real-life situation?
Modeling with a Graphing Calculator
Work with a partner. The table shows the heights h (in feet) of a wrench t seconds
after it has been dropped from a building under construction.
Time, t 0 1 2 3 4
Height, h 400 384 336 256 144
a. Use a graphing calculator to create a scatter
plot of the data, as shown at the right. Explain
why the data appear to fi t a quadratic model.
b. Use the quadratic regression feature to fi nd
a quadratic model for the data.
c. Graph the quadratic function on the same screen
as the scatter plot to verify that it fi ts the data.
d. When does the wrench hit the ground? Explain.
Communicate Your AnswerCommunicate Your Answer 3. How can you use a quadratic function to model a real-life situation?
4. Use the Internet or some other reference to fi nd examples of real-life situations
that can be modeled by quadratic functions.
MODELING WITH MATHEMATICS
To be profi cient in math, you need to routinely interpret your results in the context of the situation.
t
P
Yea
rly
pro
fit
(do
llars
)
Year
P(t) = at2 + bt + c
50
0
400
hsnb_alg2_pe_0204.indd 75hsnb_alg2_pe_0204.indd 75 2/5/15 10:27 AM2/5/15 10:27 AM

76 Chapter 2 Quadratic Functions
2.4 Lesson What You Will LearnWhat You Will Learn Write equations of quadratic functions using vertices, points,
and x-intercepts.
Write quadratic equations to model data sets.
Writing Quadratic EquationsPreviousaverage rate of changesystem of three linear equations
Core VocabularyCore Vocabullarry
Core Core ConceptConceptWriting Quadratic EquationsGiven a point and the vertex (h, k) Use vertex form:
y = a(x − h)2 + k
Given a point and x-intercepts p and q Use intercept form:
y = a(x − p)(x − q)
Given three points Write and solve a system of three
equations in three variables.
Writing an Equation Using a Vertex and a Point
The graph shows the parabolic path of a performer who is shot out of a cannon, where
y is the height (in feet) and x is the horizontal distance traveled (in feet). Write an
equation of the parabola. The performer lands in a net 90 feet from the cannon. What
is the height of the net?
SOLUTION
From the graph, you can see that the vertex (h, k) is (50, 35) and the parabola passes
through the point (0, 15). Use the vertex and the point to solve for a in vertex form.
y = a(x − h)2 + k Vertex form
15 = a(0 − 50)2 + 35 Substitute for h, k, x, and y.
−20 = 2500a Simplify.
−0.008 = a Divide each side by 2500.
Because a = −0.008, h = 50, and k = 35, the path can be modeled by the equation
y = −0.008(x − 50)2 + 35, where 0 ≤ x ≤ 90. Find the height when x = 90.
y = −0.008(90 − 50)2 + 35 Substitute 90 for x.
= −0.008(1600) + 35 Simplify.
= 22.2 Simplify.
So, the height of the net is about 22 feet.
Monitoring ProgressMonitoring Progress Help in English and Spanish at BigIdeasMath.com
1. WHAT IF? The vertex of the parabola is (50, 37.5). What is the height of the net?
2. Write an equation of the parabola that passes through the point (−1, 2) and has
vertex (4, −9).
Human Cannonball
Hei
gh
t (f
eet)
Horizontal distance(feet)
x
y
20
10
0
40
30
4020
(50, 35)
(0,15)
0 8060
hsnb_alg2_pe_0204.indd 76hsnb_alg2_pe_0204.indd 76 2/5/15 10:27 AM2/5/15 10:27 AM
Section 2.4 Modeling with Quadratic Functions 77
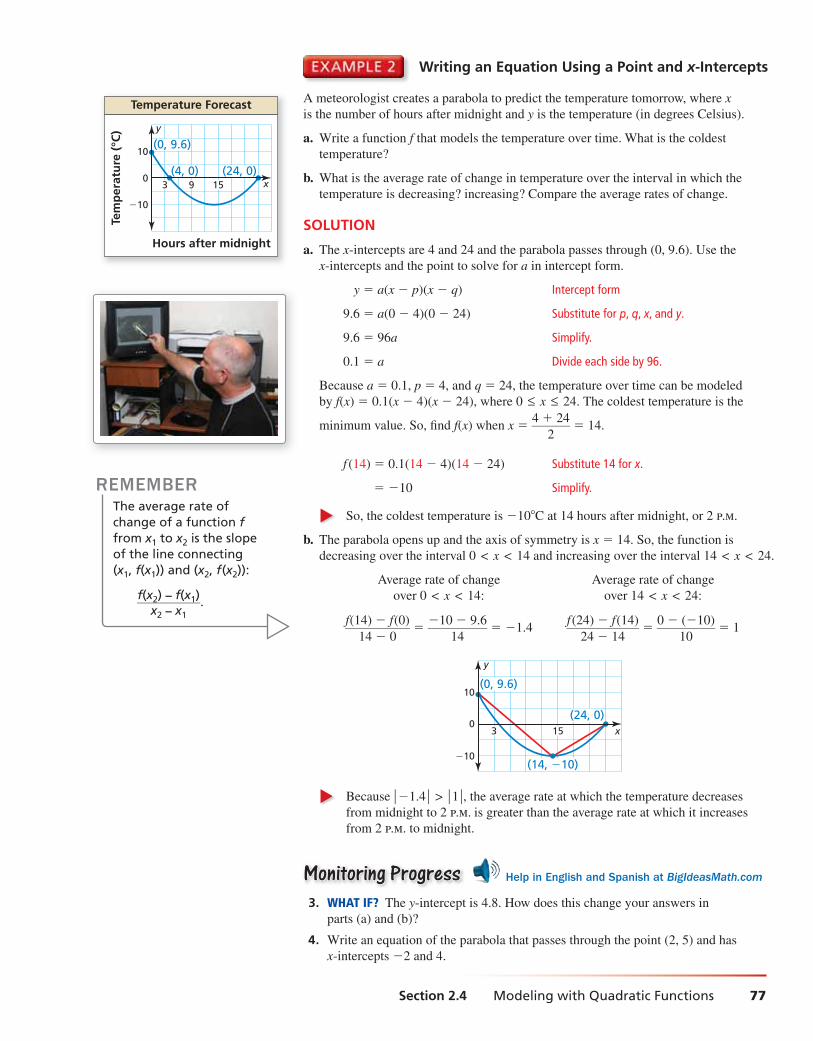
Writing an Equation Using a Point and x-Intercepts
A meteorologist creates a parabola to predict the temperature tomorrow, where x
is the number of hours after midnight and y is the temperature (in degrees Celsius).
a. Write a function f that models the temperature over time. What is the coldest
temperature?
b. What is the average rate of change in temperature over the interval in which the
temperature is decreasing? increasing? Compare the average rates of change.
SOLUTION
a. The x-intercepts are 4 and 24 and the parabola passes through (0, 9.6). Use the
x-intercepts and the point to solve for a in intercept form.
y = a(x − p)(x − q) Intercept form
9.6 = a(0 − 4)(0 − 24) Substitute for p, q, x, and y.
9.6 = 96a Simplify.
0.1 = a Divide each side by 96.
Because a = 0.1, p = 4, and q = 24, the temperature over time can be modeled
by f(x) = 0.1(x − 4)(x − 24), where 0 ≤ x ≤ 24. The coldest temperature is the
minimum value. So, fi nd f(x) when x = 4 + 24
— 2 = 14.
f (14) = 0.1(14 − 4)(14 − 24) Substitute 14 for x.
= −10 Simplify.
So, the coldest temperature is −10°C at 14 hours after midnight, or 2 p.m.
b. The parabola opens up and the axis of symmetry is x = 14. So, the function is
decreasing over the interval 0 < x < 14 and increasing over the interval 14 < x < 24.
Average rate of change Average rate of change
over 0 < x < 14: over 14 < x < 24:
f(14) − f(0)
— 14 − 0
= −10 − 9.6
— 14
= −1.4 f (24) − f(14)
—— 24 − 14
= 0 − (−10)
— 10
= 1
−10
0
10
y
x3 15
(24, 0)
(0, 9.6)
(14, −10)
Because ∣ −1.4 ∣ > ∣ 1 ∣ , the average rate at which the temperature decreases
from midnight to 2 p.m. is greater than the average rate at which it increases
from 2 p.m. to midnight.
Monitoring ProgressMonitoring Progress Help in English and Spanish at BigIdeasMath.com
3. WHAT IF? The y-intercept is 4.8. How does this change your answers in
parts (a) and (b)?
4. Write an equation of the parabola that passes through the point (2, 5) and has
x-intercepts −2 and 4.
REMEMBERThe average rate of change of a function f from x1 to x2 is the slope of the line connecting (x1, f(x1)) and (x2, f(x2)):
f(x2) – f(x1) —— x2 – x1
.
Temperature ForecastTe
mp
erat
ure
(°C
)
−10
0
10
y
x
Hours after midnight
3 9 15(24, 0)(4, 0)
(0, 9.6)
hsnb_alg2_pe_0204.indd 77hsnb_alg2_pe_0204.indd 77 2/5/15 10:28 AM2/5/15 10:28 AM
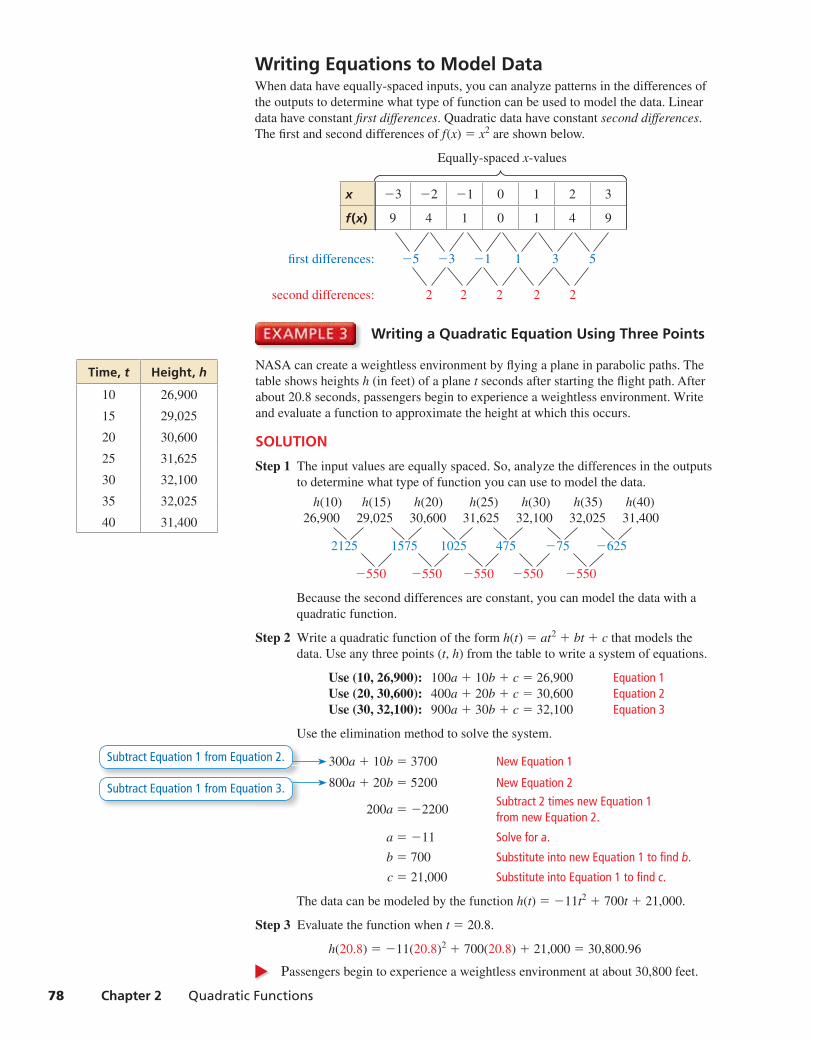
78 Chapter 2 Quadratic Functions
Writing Equations to Model DataWhen data have equally-spaced inputs, you can analyze patterns in the differences of
the outputs to determine what type of function can be used to model the data. Linear
data have constant fi rst differences. Quadratic data have constant second differences.
The fi rst and second differences of f(x) = x2 are shown below.
Equally-spaced x-values
x −3 −2 −1 0 1 2 3
f(x) 9 4 1 0 1 4 9
fi rst differences: −5 −3 −1 1 3 5
second differences: 2 2 2 2 2
Writing a Quadratic Equation Using Three Points
NASA can create a weightless environment by fl ying a plane in parabolic paths. The
table shows heights h (in feet) of a plane t seconds after starting the fl ight path. After
about 20.8 seconds, passengers begin to experience a weightless environment. Write
and evaluate a function to approximate the height at which this occurs.
SOLUTION
Step 1 The input values are equally spaced. So, analyze the differences in the outputs
to determine what type of function you can use to model the data.
h(10) h(15) h(20) h(25) h(30) h(35) h(40)
26,900 29,025 30,600 31,625 32,100 32,025 31,400
2125 1575 1025 475 −75 −625
−550 −550 −550 −550 −550
Because the second differences are constant, you can model the data with a
quadratic function.
Step 2 Write a quadratic function of the form h(t) = at2 + bt + c that models the
data. Use any three points (t, h) from the table to write a system of equations.
Use (10, 26,900): 100a + 10b + c = 26,900 Equation 1Use (20, 30,600): 400a + 20b + c = 30,600 Equation 2Use (30, 32,100): 900a + 30b + c = 32,100 Equation 3
Use the elimination method to solve the system.
300a + 10b = 3700 New Equation 1
800a + 20b = 5200 New Equation 2
200a = −2200 Subtract 2 times new Equation 1 from new Equation 2.
a = −11 Solve for a.
b = 700 Substitute into new Equation 1 to fi nd b.
c = 21,000 Substitute into Equation 1 to fi nd c.
The data can be modeled by the function h(t) = −11t2 + 700t + 21,000.
Step 3 Evaluate the function when t = 20.8.
h(20.8) = −11(20.8)2 + 700(20.8) + 21,000 = 30,800.96
Passengers begin to experience a weightless environment at about 30,800 feet.
Subtract Equation 1 from Equation 2.
Subtract Equation 1 from Equation 3.
Time, t Height, h
10 26,900
15 29,025
20 30,600
25 31,625
30 32,100
35 32,025
40 31,400
hsnb_alg2_pe_0204.indd 78hsnb_alg2_pe_0204.indd 78 2/5/15 10:28 AM2/5/15 10:28 AM
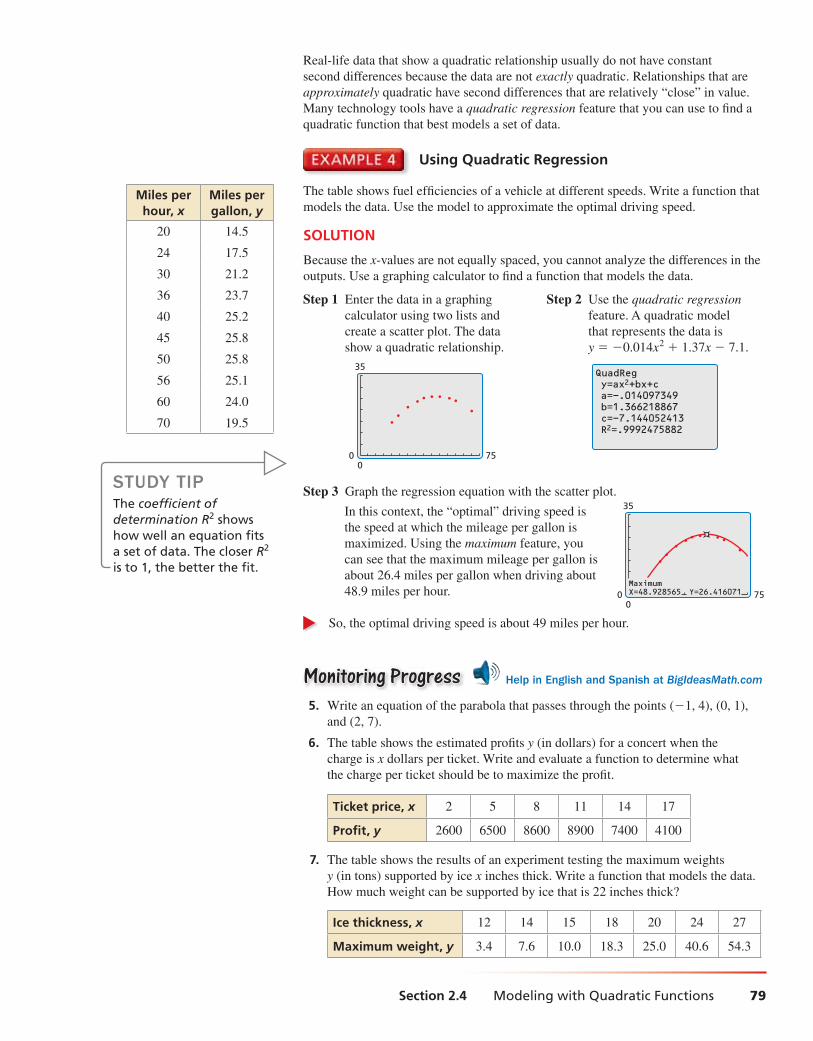
Section 2.4 Modeling with Quadratic Functions 79
Using Quadratic Regression
The table shows fuel effi ciencies of a vehicle at different speeds. Write a function that
models the data. Use the model to approximate the optimal driving speed.
SOLUTION
Because the x-values are not equally spaced, you cannot analyze the differences in the
outputs. Use a graphing calculator to fi nd a function that models the data.
Step 3 Graph the regression equation with the scatter plot.
In this context, the “optimal” driving speed is
the speed at which the mileage per gallon is
maximized. Using the maximum feature, you
can see that the maximum mileage per gallon is
about 26.4 miles per gallon when driving about
48.9 miles per hour.
So, the optimal driving speed is about 49 miles per hour.
Monitoring ProgressMonitoring Progress Help in English and Spanish at BigIdeasMath.com
5. Write an equation of the parabola that passes through the points (−1, 4), (0, 1),
and (2, 7).
6. The table shows the estimated profi ts y (in dollars) for a concert when the
charge is x dollars per ticket. Write and evaluate a function to determine what
the charge per ticket should be to maximize the profi t.
Ticket price, x 2 5 8 11 14 17
Profi t, y 2600 6500 8600 8900 7400 4100
7. The table shows the results of an experiment testing the maximum weights
y (in tons) supported by ice x inches thick. Write a function that models the data.
How much weight can be supported by ice that is 22 inches thick?
Ice thickness, x 12 14 15 18 20 24 27
Maximum weight, y 3.4 7.6 10.0 18.3 25.0 40.6 54.3
Real-life data that show a quadratic relationship usually do not have constant
second differences because the data are not exactly quadratic. Relationships that are
approximately quadratic have second differences that are relatively “close” in value.
Many technology tools have a quadratic regression feature that you can use to fi nd a
quadratic function that best models a set of data.
Step 1 Enter the data in a graphing
calculator using two lists and
create a scatter plot. The data
show a quadratic relationship.
750
0
35
Step 2 Use the quadratic regression
feature. A quadratic model
that represents the data is
y = −0.014x2 + 1.37x − 7.1.
QuadRegy=ax2+bx+ca=-.014097349b=1.366218867c=-7.144052413R2=.9992475882
STUDY TIPThe coeffi cient of determination R2 shows how well an equation fi ts a set of data. The closer R2 is to 1, the better the fi t.
Miles per hour, x
Miles per gallon, y
20 14.5
24 17.5
30 21.2
36 23.7
40 25.2
45 25.8
50 25.8
56 25.1
60 24.0
70 19.5
MaximumX=48.928565 Y=26.416071 750
0
35
hsnb_alg2_pe_0204.indd 79hsnb_alg2_pe_0204.indd 79 2/5/15 10:28 AM2/5/15 10:28 AM
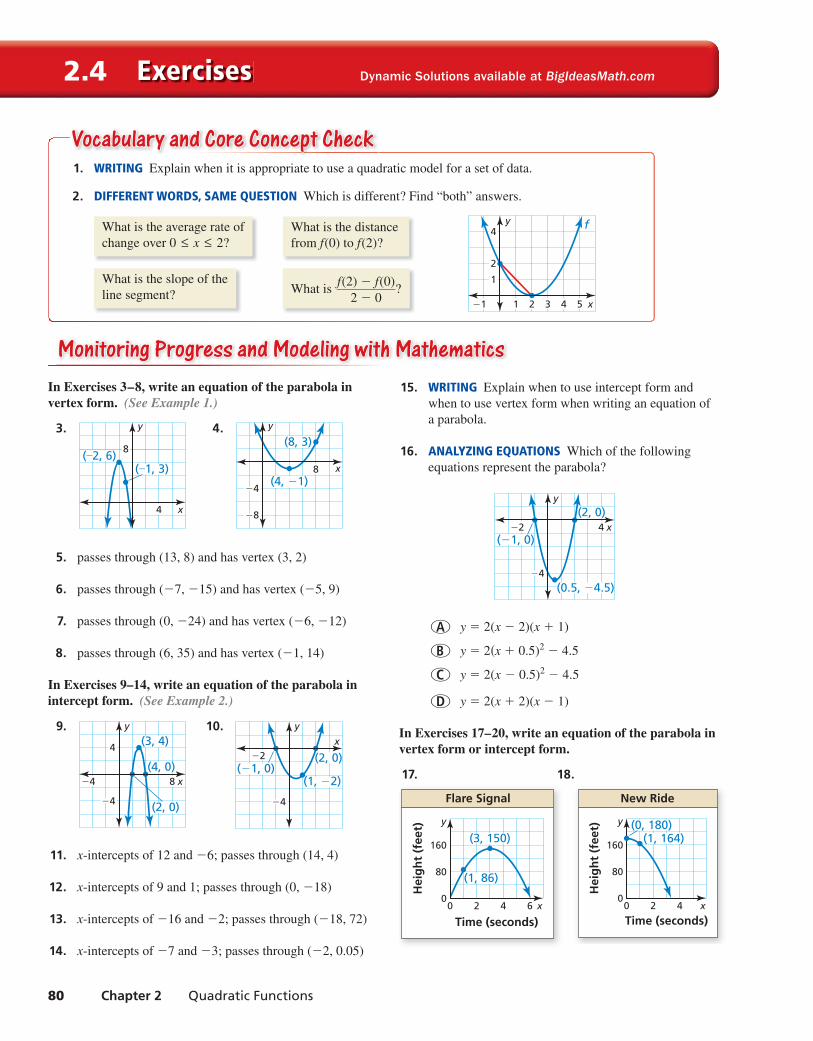
80 Chapter 2 Quadratic Functions
Exercises2.4
Vocabulary and Core Concept CheckVocabulary and Core Concept Check
Dynamic Solutions available at BigIdeasMath.com
Monitoring Progress and Modeling with MathematicsMonitoring Progress and Modeling with MathematicsIn Exercises 3–8, write an equation of the parabola in vertex form. (See Example 1.)
3.
x
y
8
4
(–1, 3)(–2, 6)
4.
x
y
−4
−8
8(4, −1)
(8, 3)
5. passes through (13, 8) and has vertex (3, 2)
6. passes through (−7, −15) and has vertex (−5, 9)
7. passes through (0, −24) and has vertex (−6, −12)
8. passes through (6, 35) and has vertex (−1, 14)
In Exercises 9–14, write an equation of the parabola in intercept form. (See Example 2.)
9.
x
y
4
−4
8−4
(2, 0)
(3, 4)
(4, 0)
10. x
y
(2, 0)
(1, −2)
−4
−2(−1, 0)
11. x-intercepts of 12 and −6; passes through (14, 4)
12. x-intercepts of 9 and 1; passes through (0, −18)
13. x-intercepts of −16 and −2; passes through (−18, 72)
14. x-intercepts of −7 and −3; passes through (−2, 0.05)
15. WRITING Explain when to use intercept form and
when to use vertex form when writing an equation of
a parabola.
16. ANALYZING EQUATIONS Which of the following
equations represent the parabola?
x
y
−4
4−2(2, 0)
(0.5, −4.5)
(−1, 0)
○A y = 2(x − 2)(x + 1)
○B y = 2(x + 0.5)2 − 4.5
○C y = 2(x − 0.5)2 − 4.5
○D y = 2(x + 2)(x − 1)
In Exercises 17–20, write an equation of the parabola in vertex form or intercept form.
17. 18.
1. WRITING Explain when it is appropriate to use a quadratic model for a set of data.
2. DIFFERENT WORDS, SAME QUESTION Which is different? Find “both” answers.
What is the average rate of
change over 0 ≤ x ≤ 2?
What is the distance
from f(0) to f(2)?
What is the slope of the
line segment?
What is
f(2) − f(0) —
2 − 0 ?
x
y4
2
1
4 5321−1
f
New Ride
Hei
gh
t (f
eet)
0
80
160
Time (seconds)420
(1, 164)(0, 180)
x
y
Flare Signal
Hei
gh
t (f
eet)
0
80
160
Time (seconds)4 6 x
y
20
(1, 86)
(3, 150)
hsnb_alg2_pe_0204.indd 80hsnb_alg2_pe_0204.indd 80 2/5/15 10:28 AM2/5/15 10:28 AM
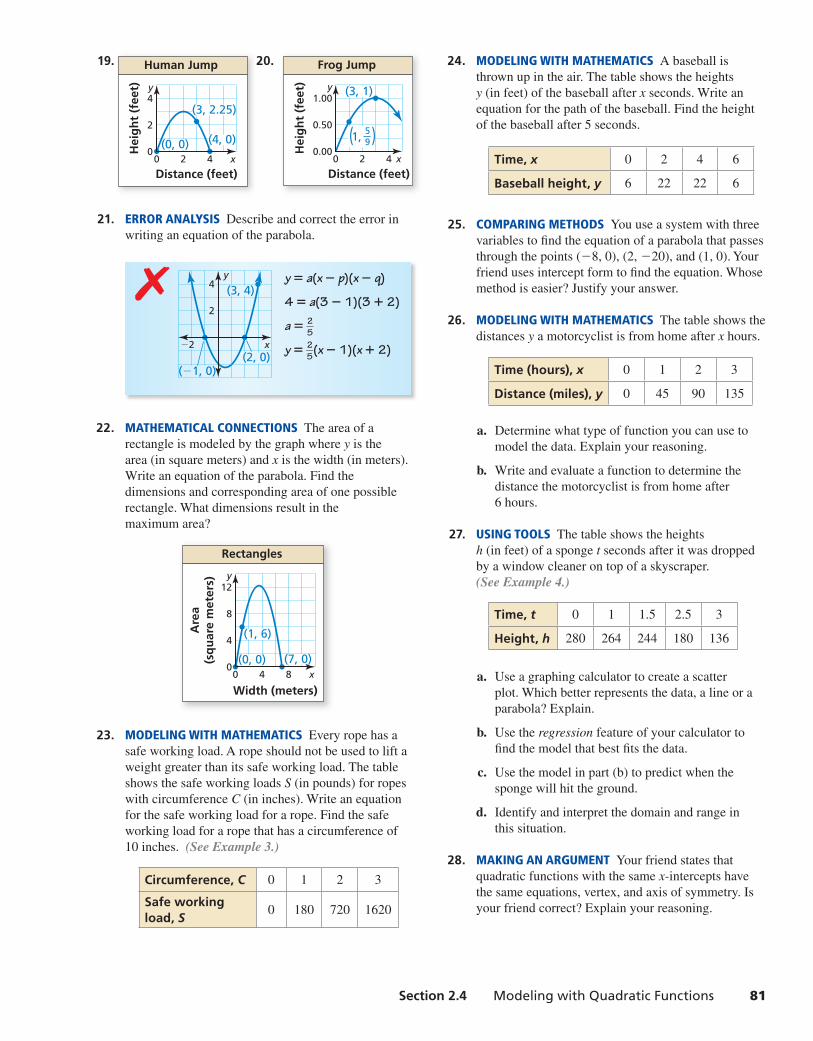
Section 2.4 Modeling with Quadratic Functions 81
19. 20.
21. ERROR ANALYSIS Describe and correct the error in
writing an equation of the parabola.
(2, 0)(−1, 0)
(3, 4)
x
y4
2
−2
y = a(x − p)(x − q)
4 = a(3 − 1)(3 + 2)
a = 2 — 5
y = 2 — 5
(x − 1)(x + 2)
✗
22. MATHEMATICAL CONNECTIONS The area of a
rectangle is modeled by the graph where y is the
area (in square meters) and x is the width (in meters).
Write an equation of the parabola. Find the
dimensions and corresponding area of one possible
rectangle. What dimensions result in the
maximum area?
Rectangles
Are
a(s
qu
are
met
ers)
0
4
8
12
Width (meters)84
(0, 0)
(1, 6)
(7, 0)0 x
y
23. MODELING WITH MATHEMATICS Every rope has a
safe working load. A rope should not be used to lift a
weight greater than its safe working load. The table
shows the safe working loads S (in pounds) for ropes
with circumference C (in inches). Write an equation
for the safe working load for a rope. Find the safe
working load for a rope that has a circumference of
10 inches. (See Example 3.)
Circumference, C 0 1 2 3
Safe working load, S
0 180 720 1620
24. MODELING WITH MATHEMATICS A baseball is
thrown up in the air. The table shows the heights
y (in feet) of the baseball after x seconds. Write an
equation for the path of the baseball. Find the height
of the baseball after 5 seconds.
Time, x 0 2 4 6
Baseball height, y 6 22 22 6
25. COMPARING METHODS You use a system with three
variables to fi nd the equation of a parabola that passes
through the points (−8, 0), (2, −20), and (1, 0). Your
friend uses intercept form to fi nd the equation. Whose
method is easier? Justify your answer.
26. MODELING WITH MATHEMATICS The table shows the
distances y a motorcyclist is from home after x hours.
Time (hours), x 0 1 2 3
Distance (miles), y 0 45 90 135
a. Determine what type of function you can use to
model the data. Explain your reasoning.
b. Write and evaluate a function to determine the
distance the motorcyclist is from home after
6 hours.
27. USING TOOLS The table shows the heights
h (in feet) of a sponge t seconds after it was dropped
by a window cleaner on top of a skyscraper.
(See Example 4.)
Time, t 0 1 1.5 2.5 3
Height, h 280 264 244 180 136
a. Use a graphing calculator to create a scatter
plot. Which better represents the data, a line or a
parabola? Explain.
b. Use the regression feature of your calculator to
fi nd the model that best fi ts the data.
c. Use the model in part (b) to predict when the
sponge will hit the ground.
d. Identify and interpret the domain and range in
this situation.
28. MAKING AN ARGUMENT Your friend states that
quadratic functions with the same x-intercepts have
the same equations, vertex, and axis of symmetry. Is
your friend correct? Explain your reasoning.
Frog Jump
Hei
gh
t (f
eet)
0.00
0.50
1.00
Distance (feet)420
(3, 1)
1, 59( )
x
y
Human Jump
Hei
gh
t (f
eet)
0
2
4
Distance (feet)420
(4, 0)
(3, 2.25)
(0, 0)x
y
hsnb_alg2_pe_0204.indd 81hsnb_alg2_pe_0204.indd 81 2/5/15 10:28 AM2/5/15 10:28 AM

82 Chapter 2 Quadratic Functions
Maintaining Mathematical ProficiencyMaintaining Mathematical ProficiencyFactor the trinomial. (Skills Review Handbook)
38. x2 + 4x + 3 39. x2 − 3x + 2 40. 3x2 − 15x + 12 41. 5x2 + 5x − 30
Reviewing what you learned in previous grades and lessons
In Exercises 29–32, analyze the differences in the outputs to determine whether the data are linear, quadratic, or neither. Explain. If linear or quadratic, write an equation that fi ts the data.
29. Price decrease (dollars), x
0 5 10 15 20
Revenue ($1000s), y
470 630 690 650 510
30. Time (hours), x 0 1 2 3 4
Height (feet), y 40 42 44 46 48
31. Time (hours), x 1 2 3 4 5
Population (hundreds), y
2 4 8 16 32
32. Time (days), x 0 1 2 3 4
Height (feet), y 320 303 254 173 60
33. PROBLEM SOLVING The graph shows the number y of
students absent from school due to the fl u each day x.
Flu Epidemic
Nu
mb
er o
f st
ud
ents
0
4
8
12
16
y
Days4 6 8 10 12 x2
(0, 1)
(6, 19)
0
a. Interpret the meaning of the vertex in this
situation.
b. Write an equation for the parabola to predict the
number of students absent on day 10.
c. Compare the average rates of change in the
students with the fl u from 0 to 6 days and
6 to 11 days.
34. THOUGHT PROVOKING Describe a real-life situation
that can be modeled by a quadratic equation. Justify
your answer.
35. PROBLEM SOLVING The table shows the heights y of
a competitive water-skier x seconds after jumping off
a ramp. Write a function that models the height of the
water-skier over time. When is the water-skier 5 feet
above the water? How long is the skier in the air?
Time (seconds), x 0 0.25 0.75 1 1.1
Height (feet), y 22 22.5 17.5 12 9.24
36. HOW DO YOU SEE IT? Use the graph to determine
whether the average rate of change over each interval
is positive, negative, or zero.
x
y
4
6
8
4 62−2
a. 0 ≤ x ≤ 2 b. 2 ≤ x ≤ 5
c. 2 ≤ x ≤ 4 d. 0 ≤ x ≤ 4
37. REPEATED REASONING The table shows the number
of tiles in each fi gure. Verify that the data show a
quadratic relationship. Predict the number of tiles in
the 12th fi gure.
Figure 1 Figure 2 Figure 3 Figure 4
Figure 1 2 3 4
Number of Tiles 1 5 11 19
hsnb_alg2_pe_0204.indd 82hsnb_alg2_pe_0204.indd 82 2/5/15 10:28 AM2/5/15 10:28 AM
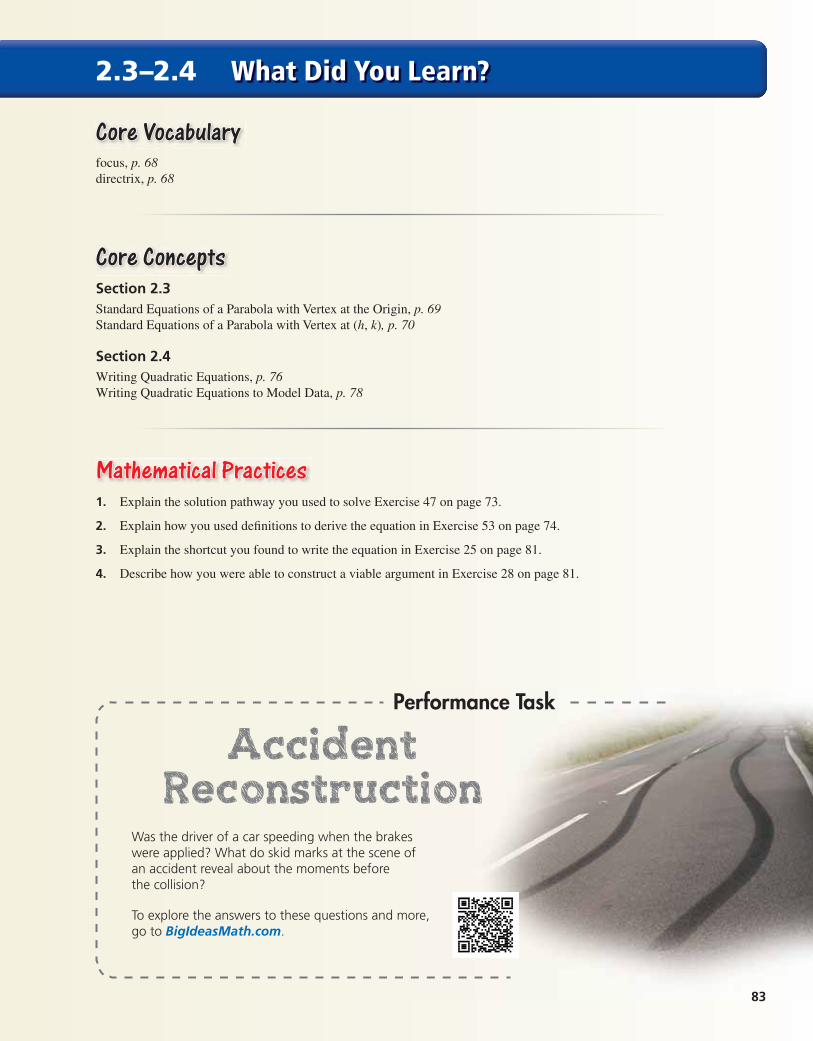
2.3–2.4 What Did You Learn?
Core VocabularyCore Vocabularyfocus, p. 68directrix, p. 68
Core ConceptsCore ConceptsSection 2.3Standard Equations of a Parabola with Vertex at the Origin, p. 69Standard Equations of a Parabola with Vertex at (h, k), p. 70
Section 2.4Writing Quadratic Equations, p. 76Writing Quadratic Equations to Model Data, p. 78
Mathematical PracticesMathematical Practices1. Explain the solution pathway you used to solve Exercise 47 on page 73.
2. Explain how you used defi nitions to derive the equation in Exercise 53 on page 74.
3. Explain the shortcut you found to write the equation in Exercise 25 on page 81.
4. Describe how you were able to construct a viable argument in Exercise 28 on page 81.
Performance Task
Accident Reconstruction
Was the driver of a car speeding when the brakes were applied? What do skid marks at the scene of an accident reveal about the moments before the collision?
To explore the answers to these questions and more, go to BigIdeasMath.com.
83
hsnb_alg2_pe_02ec.indd 83hsnb_alg2_pe_02ec.indd 83 2/5/15 10:03 AM2/5/15 10:03 AM

Chapter Review
Transformations of Quadratic Functions (pp. 47–54)
Let the graph of g be a translation 1 unit left and 2 units up of the graph of f(x) = x2 + 1. Write a rule for g.
g(x) = f(x − (−1)) + 2 Subtract −1 from the input. Add 2 to the output.
= (x + 1)2 + 1 + 2 Replace x with x + 1 in f(x).
= x2 + 2x + 4 Simplify.
The transformed function is g(x) = x2 + 2x + 4.
Describe the transformation of f(x) = x2 represented by g. Then graph each function.
1. g(x) = (x + 4)2 2. g(x) = (x − 7)2 + 2 3. g(x) = −3(x + 2)2 − 1
Write a rule for g.
4. Let the graph of g be a horizontal shrink by a factor of 2 —
3 , followed by a translation 5
units left and 2 units down of the graph of f(x) = x2.
5. Let the graph of g be a translation 2 units left and 3 units up, followed by a refl ection in the y-axis
of the graph of f (x) = x2 − 2x.
Characteristics of Quadratic Functions (pp. 55–64)
Graph f(x) = 2x2 − 8x + 1. Label the vertex and axis of symmetry.
Step 1 Identify the coeffi cients a = 2, b = −8, and c = 1. Because a > 0, the parabola opens up.
Step 2 Find the vertex. First calculate
x
y
−4
−6
(2,−7)
−2
6−2
x = 2the x-coordinate.
x = − b —
2a = −
−8 —
2(2) = 2
Then fi nd the y-coordinate of the vertex.
f(2) = 2(2)2 − 8(2) + 1 = −7
So, the vertex is (2, −7). Plot this point.
Step 3 Draw the axis of symmetry x = 2.
Step 4 Identify the y-intercept c, which is 1. Plot the point (0, 1) and its refl ection
in the axis of symmetry, (4, 1).
Step 5 Evaluate the function for another value of x, such as x = 1.
f (1) = 2(1)2 − 8(1) + 1 = −5
Plot the point (1, −5) and its refl ection in the axis of symmetry, (3, −5).
Step 6 Draw a parabola through the plotted points.
Graph the function. Label the vertex and axis of symmetry. Find the minimum or maximum value of f. Describe where the function is increasing and decreasing.
6. f (x) = 3(x − 1)2 − 4 7. g(x) = −2x2 + 16x + 3 8. h(x) = (x − 3)(x + 7)
222.1
2.2
Dynamic Solutions available at BigIdeasMath.com
84 Chapter 2 Quadratic Functions
hsnb_alg2_pe_02ec.indd 84hsnb_alg2_pe_02ec.indd 84 2/5/15 10:03 AM2/5/15 10:03 AM
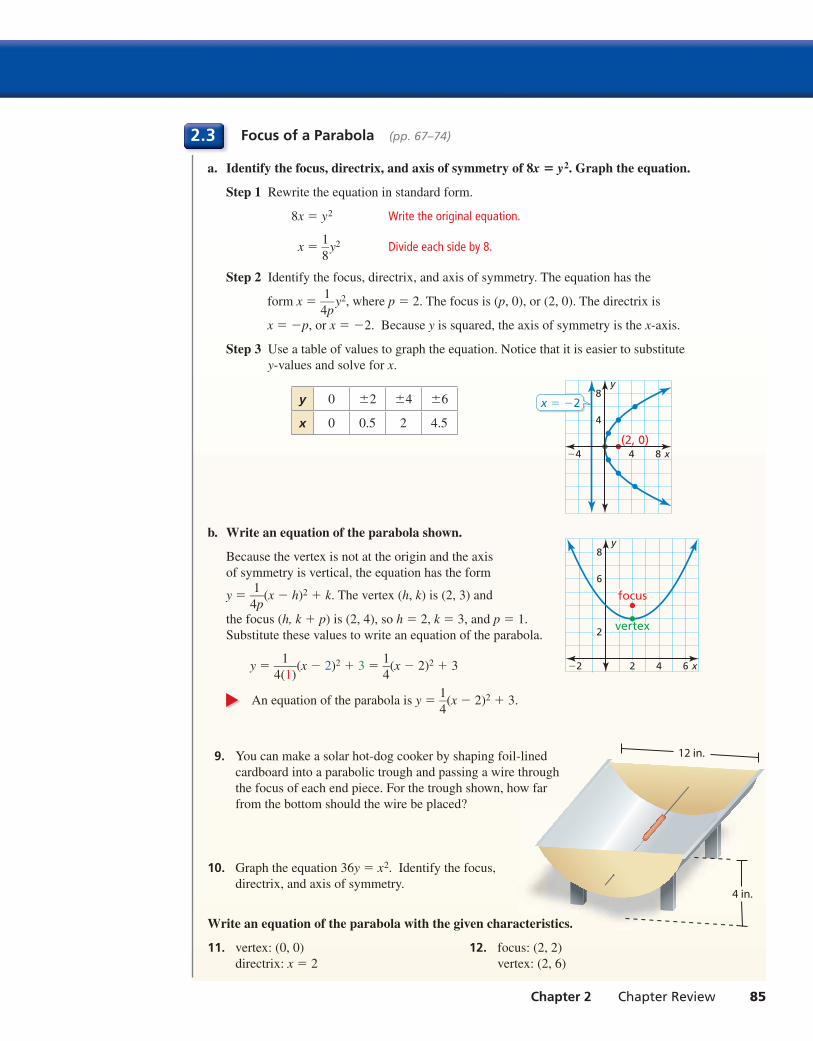
Focus of a Parabola (pp. 67–74)
a. Identify the focus, directrix, and axis of symmetry of 8x = y2. Graph the equation.
Step 1 Rewrite the equation in standard form.
8x = y2 Write the original equation.
x = 1 —
8 y2 Divide each side by 8.
Step 2 Identify the focus, directrix, and axis of symmetry. The equation has the
form x = 1 —
4p y2, where p = 2. The focus is (p, 0), or (2, 0). The directrix is
x = −p, or x = −2. Because y is squared, the axis of symmetry is the x-axis.
Step 3 Use a table of values to graph the equation. Notice that it is easier to substitute
y-values and solve for x.
y 0 ±2 ±4 ±6
x 0 0.5 2 4.5
x
y8
4
84(2, 0)
−4
x = −2
b. Write an equation of the parabola shown.
Because the vertex is not at the origin and the axis
vertex
focus
x
y
6
8
2
4 62−2
of symmetry is vertical, the equation has the form
y = 1 —
4p (x − h)2 + k. The vertex (h, k) is (2, 3) and
the focus (h, k + p) is (2, 4), so h = 2, k = 3, and p = 1.
Substitute these values to write an equation of the parabola.
y = 1 —
4(1) (x − 2)2 + 3 =
1 —
4 (x − 2)2 + 3
An equation of the parabola is y = 1 —
4 (x − 2)2 + 3.
9. You can make a solar hot-dog cooker by shaping foil-lined
cardboard into a parabolic trough and passing a wire through
the focus of each end piece. For the trough shown, how far
from the bottom should the wire be placed?
10. Graph the equation 36y = x2. Identify the focus,
directrix, and axis of symmetry.
Write an equation of the parabola with the given characteristics.
11. vertex: (0, 0) 12. focus: (2, 2)
directrix: x = 2 vertex: (2, 6)
2.3
acteristics.
4 in.
12 in.
Chapter 2 Chapter Review 85
hsnb_alg2_pe_02ec.indd 85hsnb_alg2_pe_02ec.indd 85 2/5/15 10:03 AM2/5/15 10:03 AM
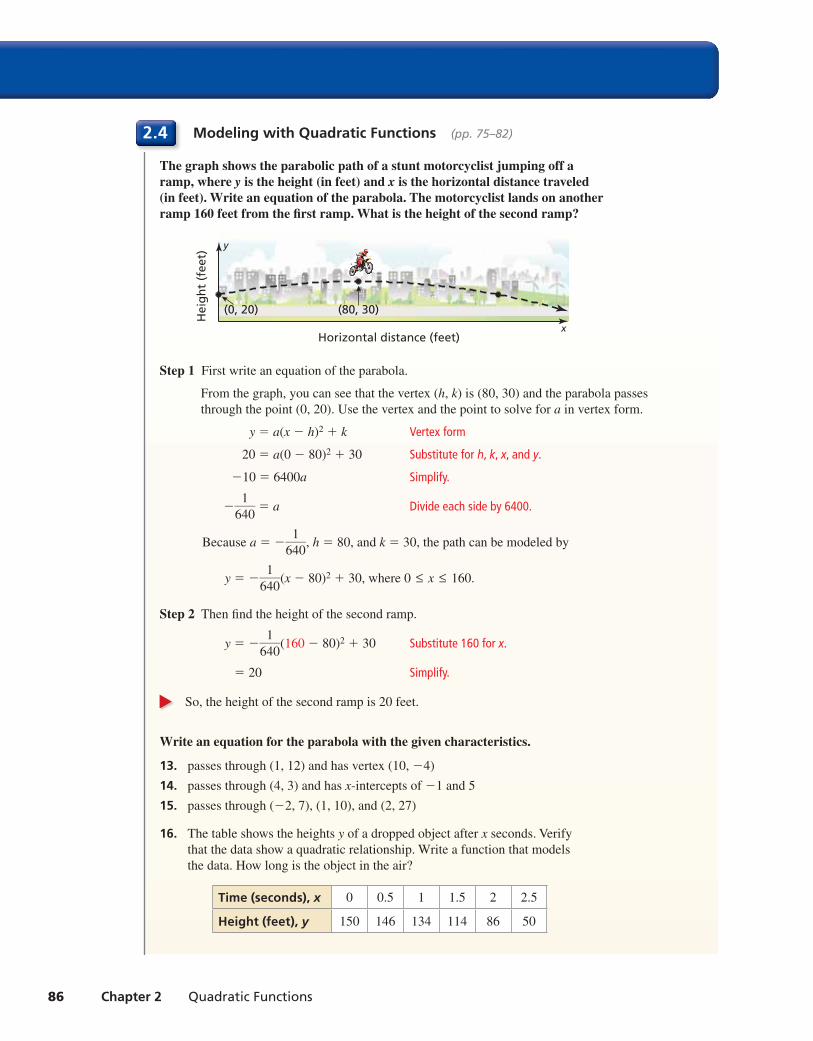
Modeling with Quadratic Functions (pp. 75–82)
The graph shows the parabolic path of a stunt motorcyclist jumping off a ramp, where y is the height (in feet) and x is the horizontal distance traveled (in feet). Write an equation of the parabola. The motorcyclist lands on another ramp 160 feet from the fi rst ramp. What is the height of the second ramp?
x
y
(0, 20) (80, 30)
Horizontal distance (feet)
Hei
gh
t (f
eet)
Step 1 First write an equation of the parabola.
From the graph, you can see that the vertex (h, k) is (80, 30) and the parabola passes
through the point (0, 20). Use the vertex and the point to solve for a in vertex form.
y = a(x − h)2 + k Vertex form
20 = a(0 − 80)2 + 30 Substitute for h, k, x, and y.
−10 = 6400a Simplify.
− 1 —
640 = a Divide each side by 6400.
Because a = − 1 —
640 , h = 80, and k = 30, the path can be modeled by
y = − 1 —
640 (x − 80)2 + 30, where 0 ≤ x ≤ 160.
Step 2 Then fi nd the height of the second ramp.
y = − 1 —
640 (160 − 80)2 + 30 Substitute 160 for x.
= 20 Simplify.
So, the height of the second ramp is 20 feet.
Write an equation for the parabola with the given characteristics.
13. passes through (1, 12) and has vertex (10, −4)
14. passes through (4, 3) and has x-intercepts of −1 and 5
15. passes through (−2, 7), (1, 10), and (2, 27)
16. The table shows the heights y of a dropped object after x seconds. Verify
that the data show a quadratic relationship. Write a function that models
the data. How long is the object in the air?
Time (seconds), x 0 0.5 1 1.5 2 2.5
Height (feet), y 150 146 134 114 86 50
2.4
86 Chapter 2 Quadratic Functions
hsnb_alg2_pe_02ec.indd 86hsnb_alg2_pe_02ec.indd 86 2/5/15 10:03 AM2/5/15 10:03 AM
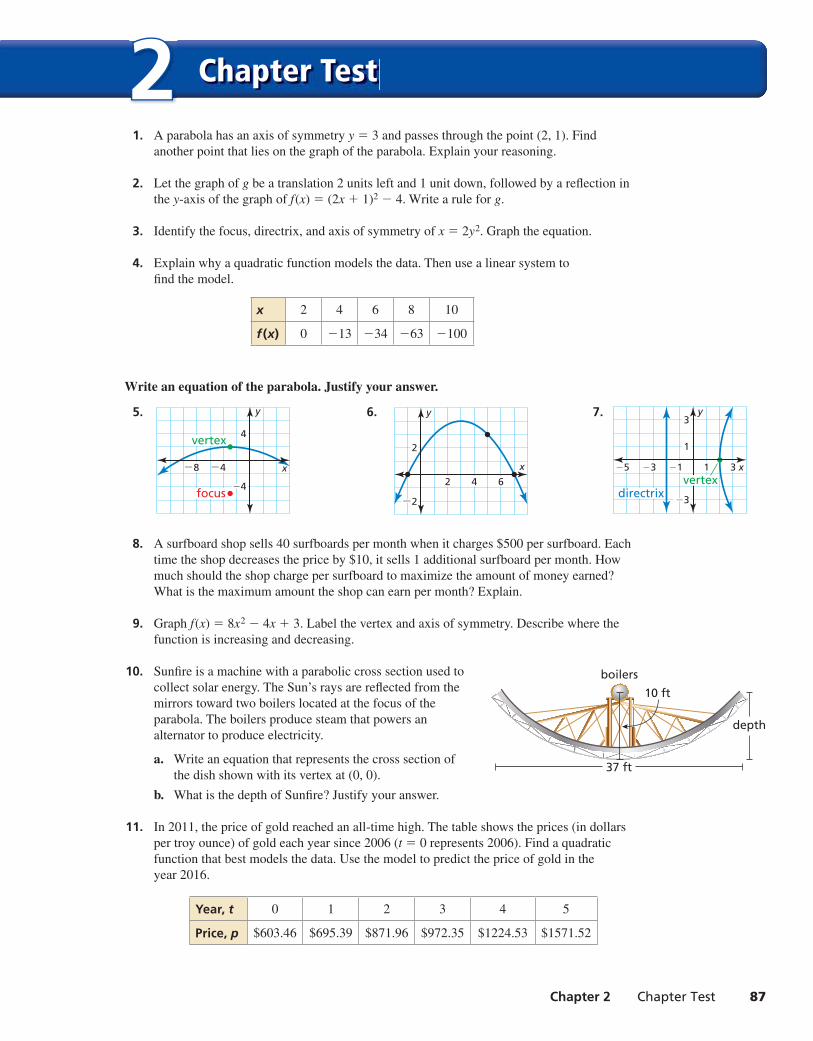
Chapter Test22 1. A parabola has an axis of symmetry y = 3 and passes through the point (2, 1). Find
another point that lies on the graph of the parabola. Explain your reasoning.
2. Let the graph of g be a translation 2 units left and 1 unit down, followed by a refl ection in
the y-axis of the graph of f(x) = (2x + 1)2 − 4. Write a rule for g.
3. Identify the focus, directrix, and axis of symmetry of x = 2y2. Graph the equation.
4. Explain why a quadratic function models the data. Then use a linear system to
fi nd the model.
x 2 4 6 8 10
f (x) 0 −13 −34 −63 −100
Write an equation of the parabola. Justify your answer.
5.
x
y
4
−4−8
focus−4
vertex
6.
x
y
2
2 4 6
−2
7.
x
y
1
3
−3 −1−5 1 3
directrix −3
vertex
8. A surfboard shop sells 40 surfboards per month when it charges $500 per surfboard. Each
time the shop decreases the price by $10, it sells 1 additional surfboard per month. How
much should the shop charge per surfboard to maximize the amount of money earned?
What is the maximum amount the shop can earn per month? Explain.
9. Graph f(x) = 8x2 − 4x + 3. Label the vertex and axis of symmetry. Describe where the
function is increasing and decreasing.
10. Sunfi re is a machine with a parabolic cross section used to
collect solar energy. The Sun’s rays are refl ected from the
mirrors toward two boilers located at the focus of the
parabola. The boilers produce steam that powers an
alternator to produce electricity.
a. Write an equation that represents the cross section of
the dish shown with its vertex at (0, 0).
b. What is the depth of Sunfi re? Justify your answer.
11. In 2011, the price of gold reached an all-time high. The table shows the prices (in dollars
per troy ounce) of gold each year since 2006 (t = 0 represents 2006). Find a quadratic
function that best models the data. Use the model to predict the price of gold in the
year 2016.
Year, t 0 1 2 3 4 5
Price, p $603.46 $695.39 $871.96 $972.35 $1224.53 $1571.52
37 ft
depth
10 ft
boilers
Chapter 2 Chapter Test 87
hsnb_alg2_pe_02ec.indd 87hsnb_alg2_pe_02ec.indd 87 2/5/15 10:03 AM2/5/15 10:03 AM
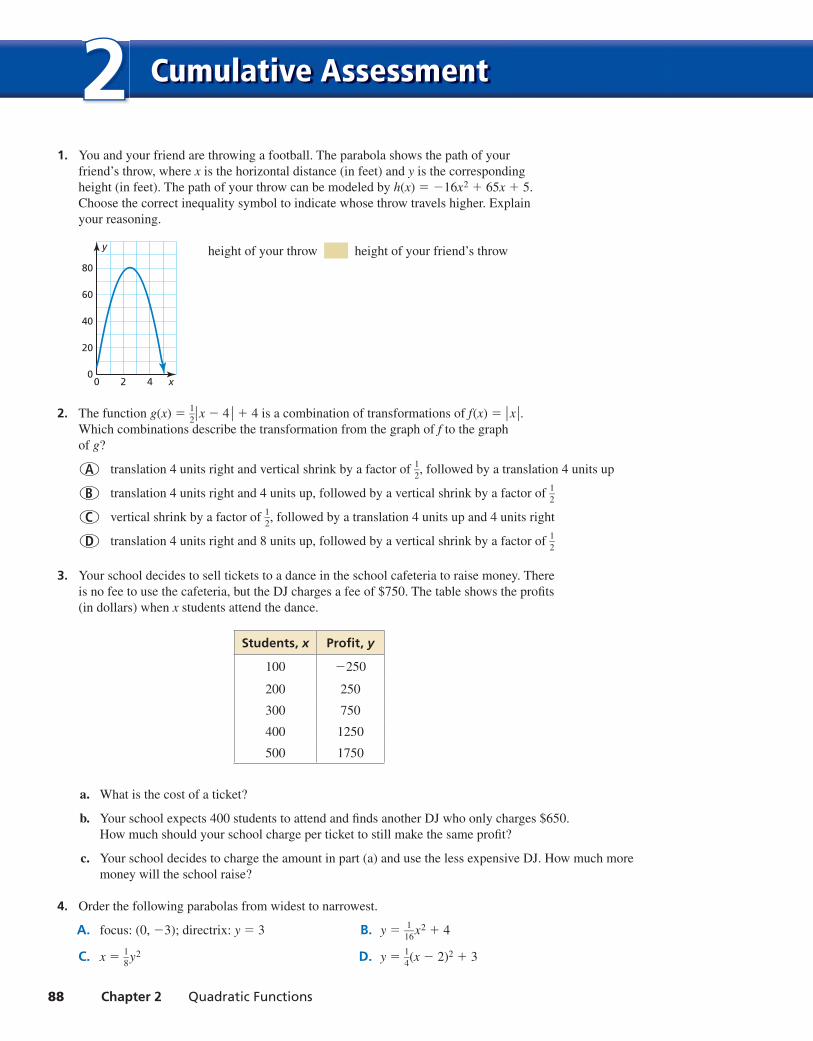
22 Cumulative Assessment
1. You and your friend are throwing a football. The parabola shows the path of your
friend’s throw, where x is the horizontal distance (in feet) and y is the corresponding
height (in feet). The path of your throw can be modeled by h(x) = −16x2 + 65x + 5.
Choose the correct inequality symbol to indicate whose throw travels higher. Explain
your reasoning.
x
y
40
20
0
80
60
420
height of your throw height of your friend’s throw
2. The function g(x) = 1 —
2 ∣ x − 4 ∣ + 4 is a combination of transformations of f(x) = ∣ x ∣ .
Which combinations describe the transformation from the graph of f to the graph
of g?
○A translation 4 units right and vertical shrink by a factor of 1 —
2 , followed by a translation 4 units up
○B translation 4 units right and 4 units up, followed by a vertical shrink by a factor of 1 —
2
○C vertical shrink by a factor of 1 —
2 , followed by a translation 4 units up and 4 units right
○D translation 4 units right and 8 units up, followed by a vertical shrink by a factor of 1 —
2
3. Your school decides to sell tickets to a dance in the school cafeteria to raise money. There
is no fee to use the cafeteria, but the DJ charges a fee of $750. The table shows the profi ts
(in dollars) when x students attend the dance.
Students, x Profi t, y
100 −250
200 250
300 750
400 1250
500 1750
a. What is the cost of a ticket?
b. Your school expects 400 students to attend and fi nds another DJ who only charges $650.
How much should your school charge per ticket to still make the same profi t?
c. Your school decides to charge the amount in part (a) and use the less expensive DJ. How much more
money will the school raise?
4. Order the following parabolas from widest to narrowest.
A. focus: (0, −3); directrix: y = 3 B. y = 1 —
16 x2 + 4
C. x = 1 —
8 y2 D. y =
1 —
4 (x − 2)2 + 3
88 Chapter 2 Quadratic Functions
hsnb_alg2_pe_02ec.indd 88hsnb_alg2_pe_02ec.indd 88 2/5/15 10:03 AM2/5/15 10:03 AM
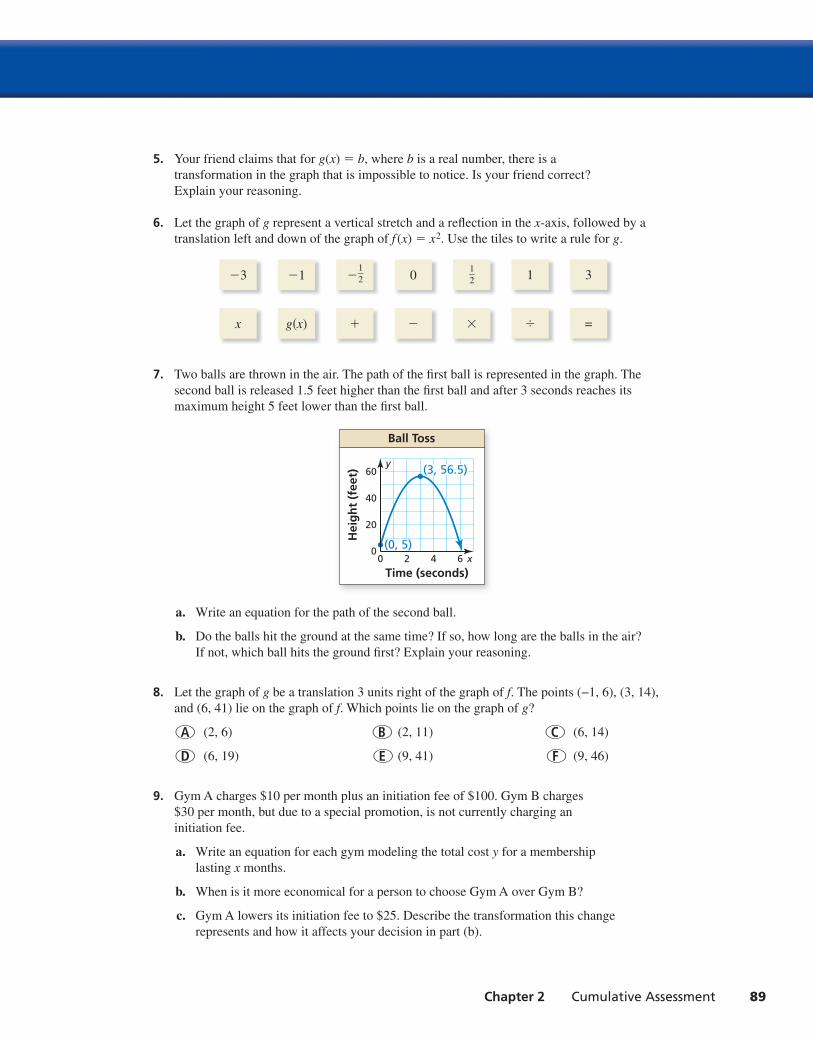
5. Your friend claims that for g(x) = b, where b is a real number, there is a
transformation in the graph that is impossible to notice. Is your friend correct?
Explain your reasoning.
6. Let the graph of g represent a vertical stretch and a refl ection in the x-axis, followed by a
translation left and down of the graph of f (x) = x2. Use the tiles to write a rule for g.
−3 −1 − 1 — 2 0
1 — 2 1 3
x g(x) + − × ÷ =
7. Two balls are thrown in the air. The path of the fi rst ball is represented in the graph. The
second ball is released 1.5 feet higher than the fi rst ball and after 3 seconds reaches its
maximum height 5 feet lower than the fi rst ball.
x
y
40
20
0
60
42
Time (seconds)
Hei
gh
t (f
eet)
0 6(0, 5)
(3, 56.5)
Ball Toss
a. Write an equation for the path of the second ball.
b. Do the balls hit the ground at the same time? If so, how long are the balls in the air?
If not, which ball hits the ground fi rst? Explain your reasoning.
8. Let the graph of g be a translation 3 units right of the graph of f. The points (−1, 6), (3, 14),
and (6, 41) lie on the graph of f. Which points lie on the graph of g?
○A (2, 6) ○B (2, 11) ○C (6, 14)
○D (6, 19) ○E (9, 41) ○F (9, 46)
9. Gym A charges $10 per month plus an initiation fee of $100. Gym B charges
$30 per month, but due to a special promotion, is not currently charging an
initiation fee.
a. Write an equation for each gym modeling the total cost y for a membership
lasting x months.
b. When is it more economical for a person to choose Gym A over Gym B?
c. Gym A lowers its initiation fee to $25. Describe the transformation this change
represents and how it affects your decision in part (b).
Chapter 2 Cumulative Assessment 89
hsnb_alg2_pe_02ec.indd 89hsnb_alg2_pe_02ec.indd 89 2/5/15 10:03 AM2/5/15 10:03 AM