10.2 Quadratic Functions. 10.2 – Quadratic Functions Goals / “I can…” I can graph quadratic...
16
10.2 Quadratic Functions
-
Upload
lee-armstrong -
Category
Documents
-
view
222 -
download
2
Transcript of 10.2 Quadratic Functions. 10.2 – Quadratic Functions Goals / “I can…” I can graph quadratic...
10.2
Quadratic Functions

10.2 – Quadratic Functions
Goals / “I can…”I can graph quadratic functions of the form
y = ax + bx + cI can graph quadratic inequalities
2
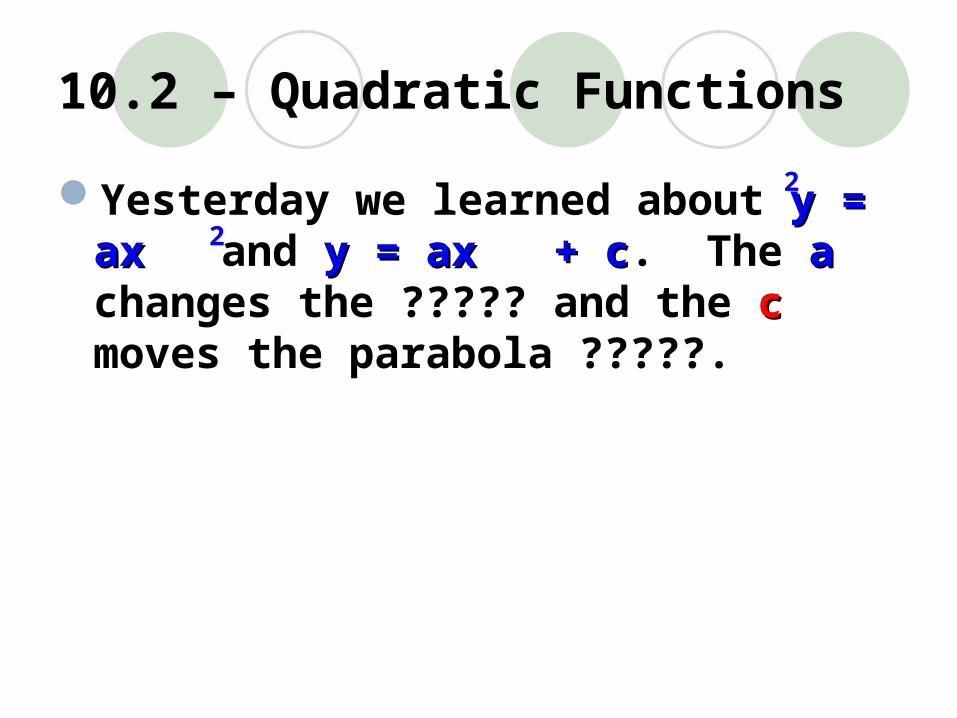
10.2 – Quadratic Functions
Yesterday we learned about y = axy = ax and y = ax + cy = ax + c. The aa changes the ????? and the cc moves the parabola ?????.
2
2
10.2 – Quadratic Functions
Today we look at y = ax + bx + c. The bx moves the parabola horizontally, changing the location of the line of symmetry.
2
10.2 – Quadratic Functions
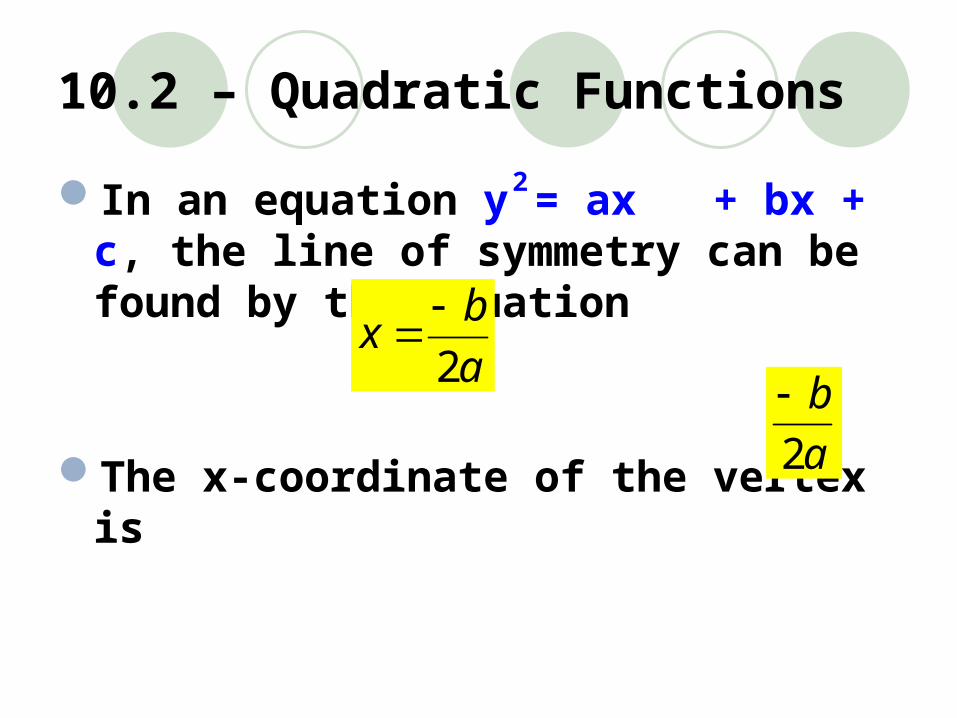
In an equation y = ax + bx + c, the line of symmetry can be found by the equation
The x-coordinate of the vertex is
2
a
bx
2
a
b
2
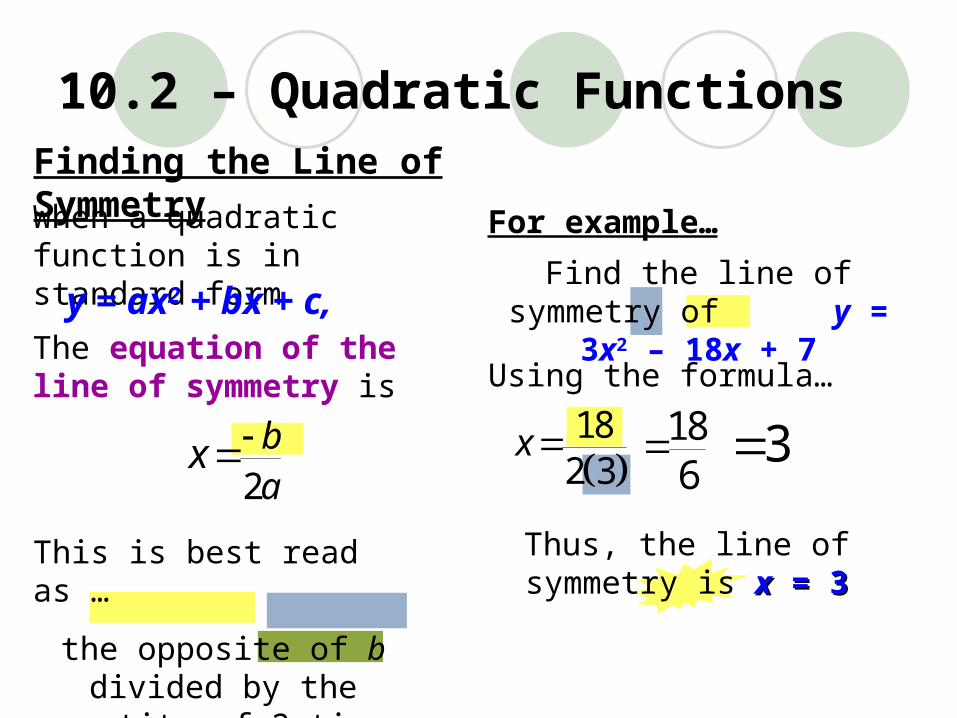
Find the line of symmetry of y = 3x2 – 18x + 7
Finding the Line of SymmetryWhen a quadratic function is in standard form
The equation of the line of symmetry is
y = ax2 + bx + c,
2ba
x
For example…
Using the formula…
This is best read as …
the opposite of b divided by the quantity of 2 times a.
18
2 3x 18
6 3
Thus, the line of symmetry is xx = 3 = 3
10.2 – Quadratic Functions
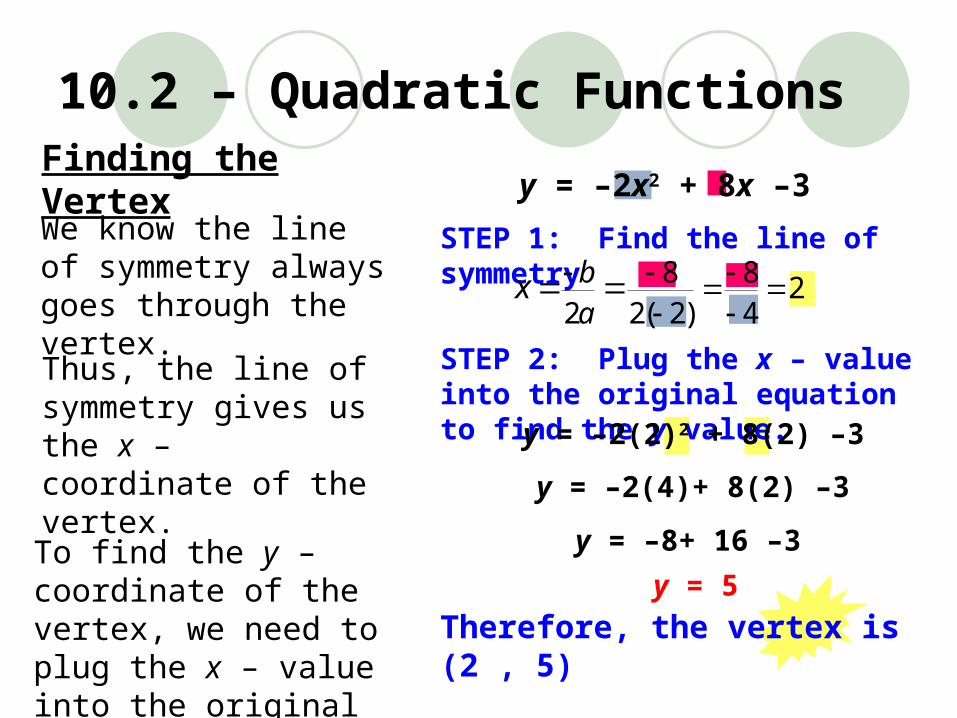
Finding the VertexWe know the line of symmetry always goes through the vertex.
Thus, the line of symmetry gives us the x – coordinate of the vertex.
To find the y – coordinate of the vertex, we need to plug the x – value into the original equation.
STEP 1: Find the line of symmetry
STEP 2: Plug the x – value into the original equation to find the y value.
y = –2x2 + 8x –3
8 8 22 2( 2) 4
ba
x
y = –2(2)2 + 8(2) –3
y = –2(4)+ 8(2) –3
y = –8+ 16 –3
y = 5
Therefore, the vertex is (2 , 5)
10.2 – Quadratic Functions
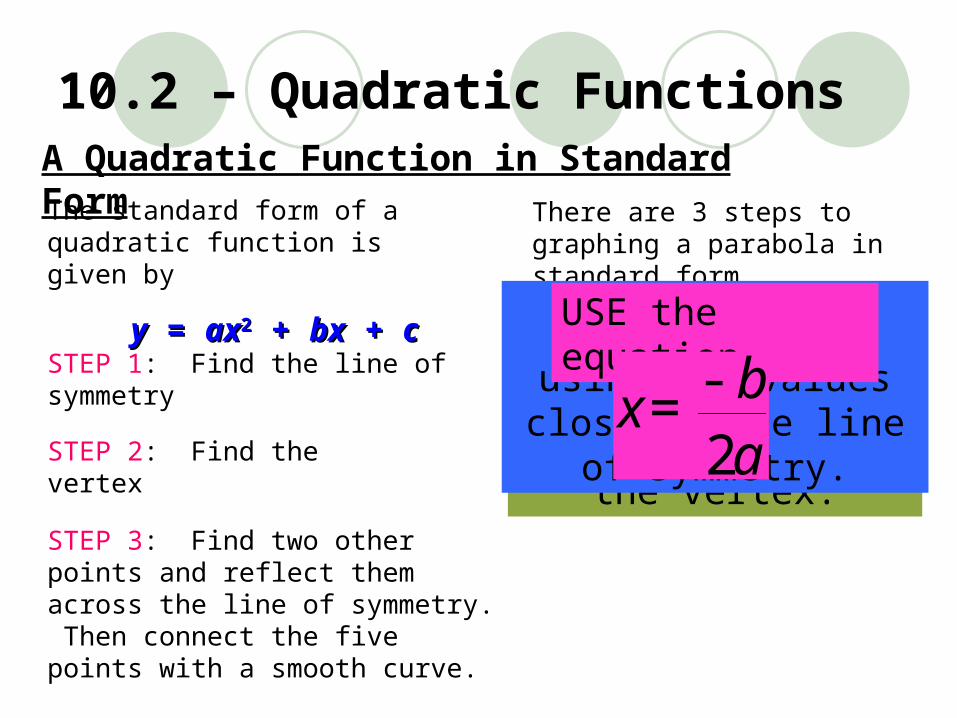
A Quadratic Function in Standard FormThe standard form of a quadratic function is given by
yy = = axax22 + + bxbx + + cc
There are 3 steps to graphing a parabola in standard form.
STEP 1: Find the line of symmetry
STEP 2: Find the vertex
STEP 3: Find two other points and reflect them across the line of symmetry. Then connect the five points with a smooth curve.
Plug in the line of symmetry (x – value) to
obtain the y – value of the vertex.
MAKE A TABLE
using x – values close to the line of symmetry.
USE the equation
2bxa
-=
10.2 – Quadratic Functions
10.2 – Quadratic Functions
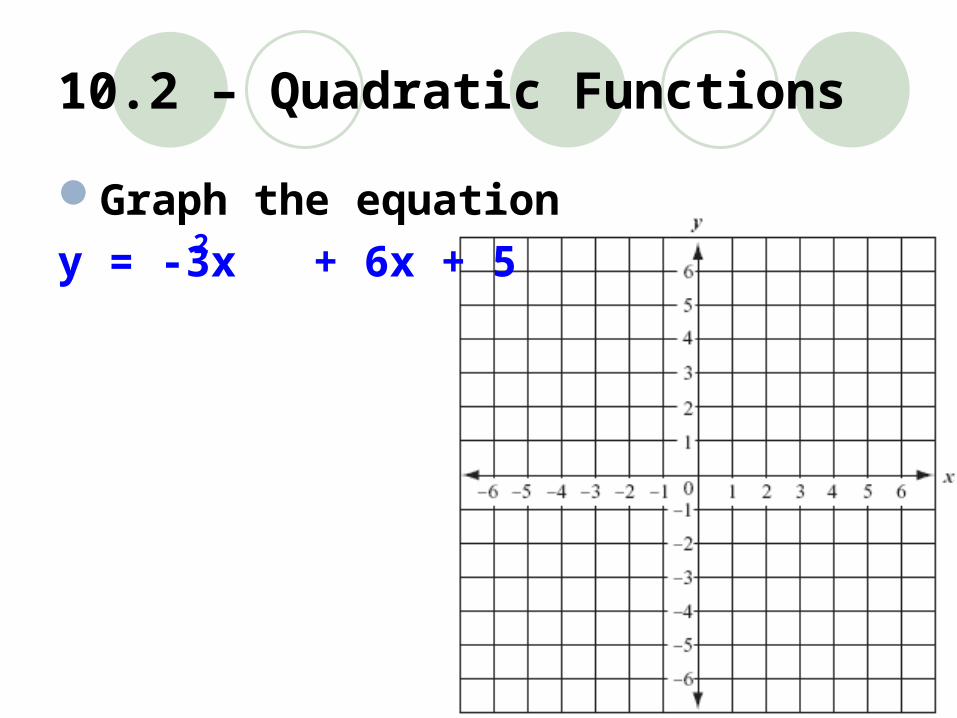
Graph the equation
y = -3x + 6x + 52
10.2 – Quadratic Functions
Graphing Quadratic InequalitiesGraphing a parabola with an inequalityinequality is
similar to a line. We use solid and dashed lines and we shade above (greater) or below (less) the line.
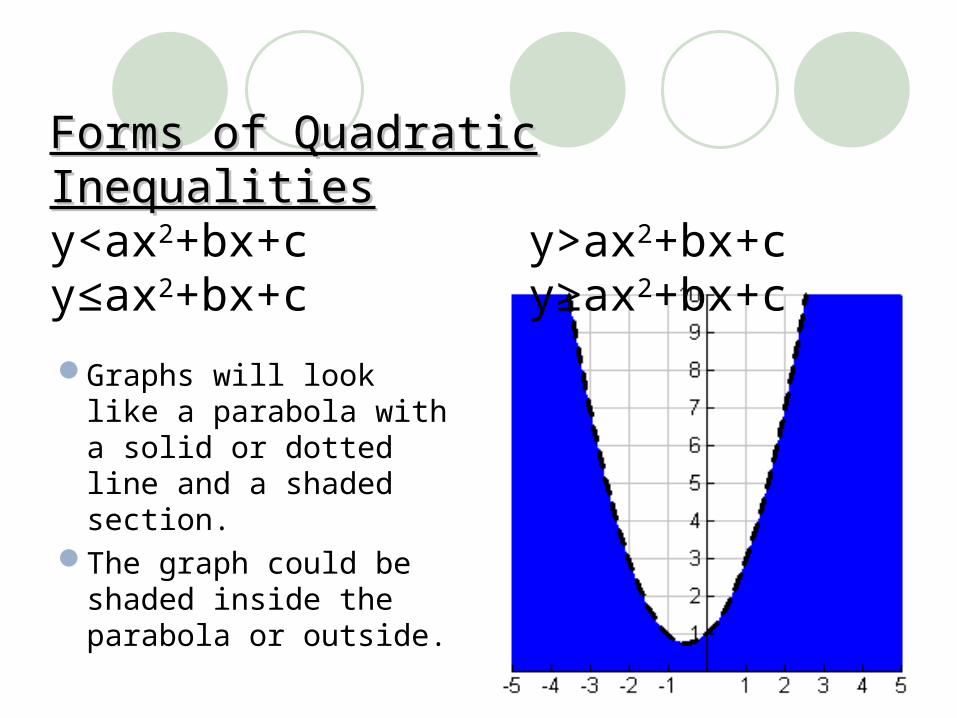
Graphs will look like a parabola with a solid or dotted line and a shaded section.
The graph could be shaded inside the parabola or outside.
Forms of Quadratic InequalitiesForms of Quadratic Inequalitiesy<ax2+bx+c y>ax2+bx+cy≤ax2+bx+c y≥ax2+bx+c
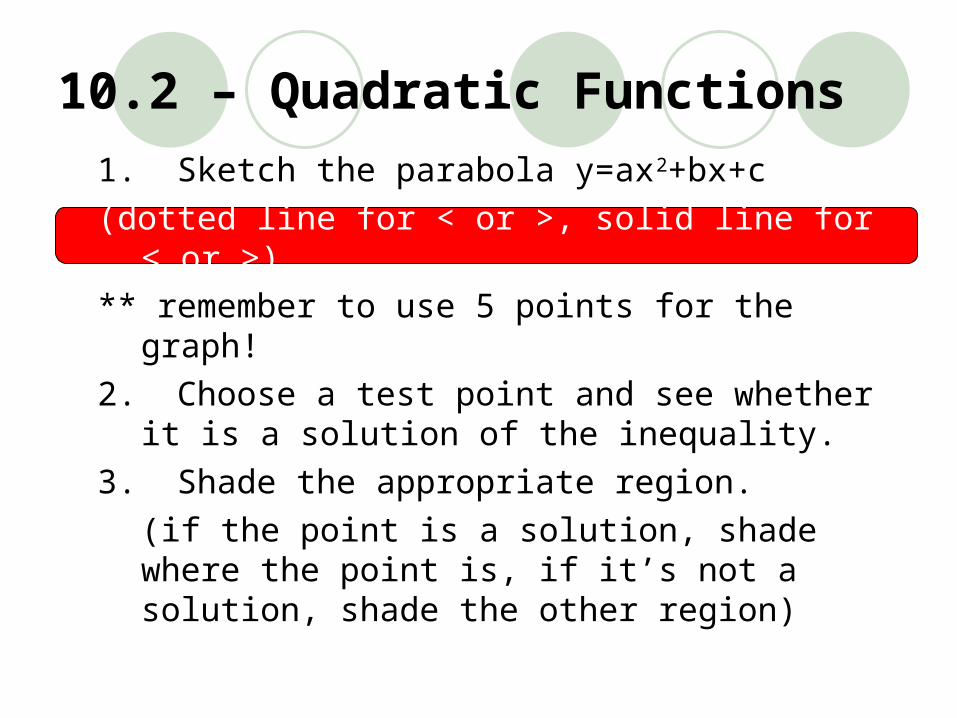
1. Sketch the parabola y=ax2+bx+c
(dotted line for < or >, solid line for ≤ or ≥)
** remember to use 5 points for the graph!
2. Choose a test point and see whether it is a solution of the inequality.
3. Shade the appropriate region.
(if the point is a solution, shade where the point is, if it’s not a solution, shade the other region)
10.2 – Quadratic Functions
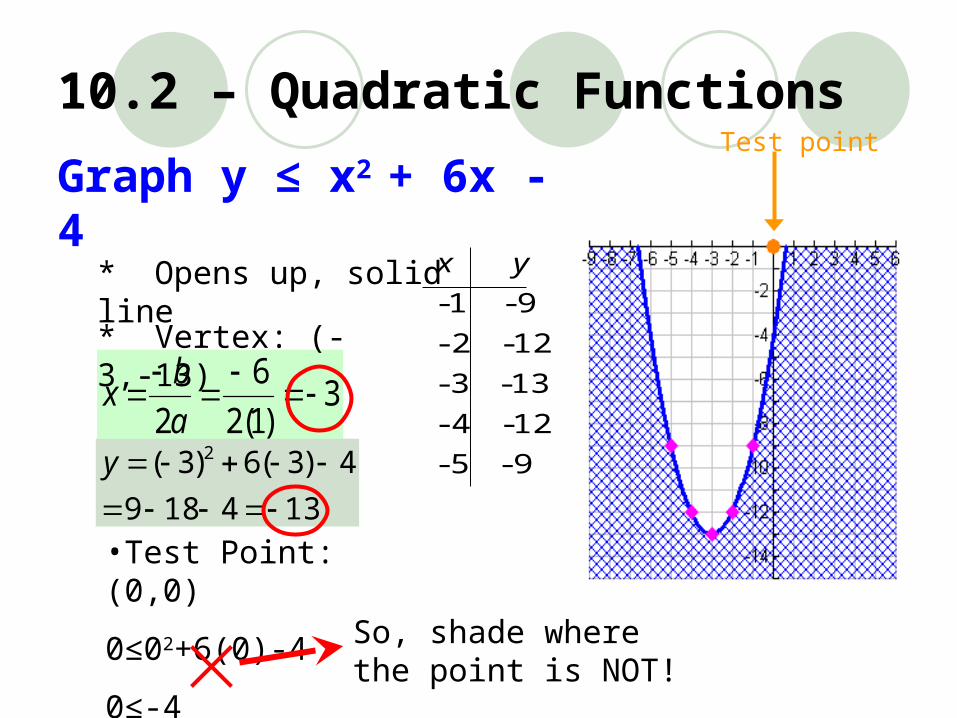
Graph y ≤ x2 + 6x - 4
3)1(2
6
2
a
bx
* Vertex: (-3,-13)
* Opens up, solid line
134189
4)3(6)3( 2
y 9- 5-
12- 4-
13- 3-
12- 2-
9- 1-
yx
•Test Point: (0,0)
0≤02+6(0)-4
0≤-4 So, shade where the point is NOT!
Test point
10.2 – Quadratic Functions
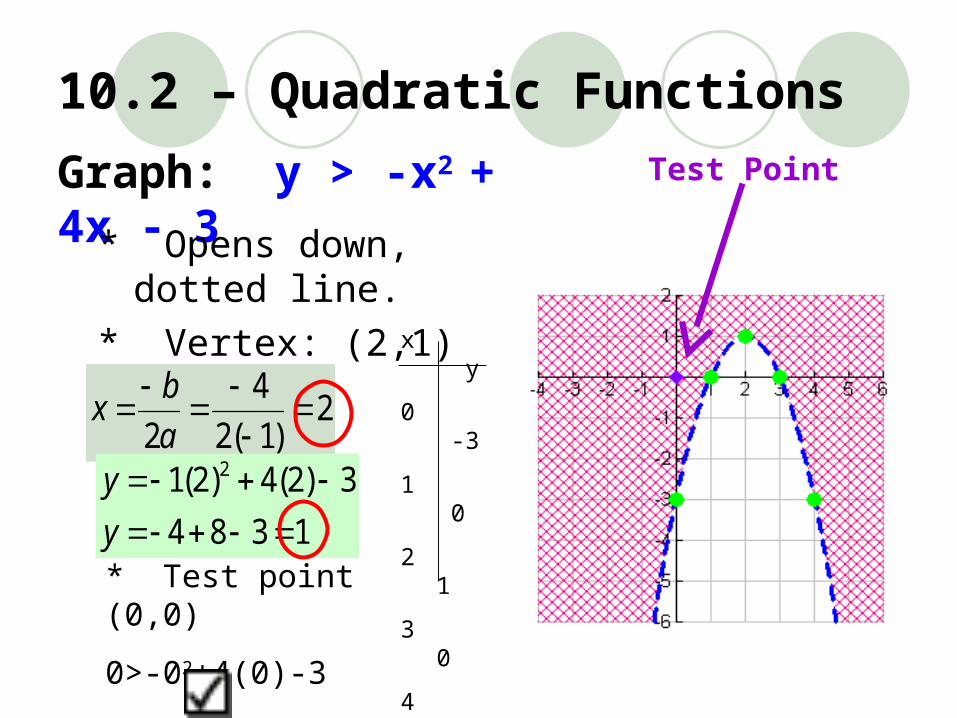
Graph: y > -x2 + 4x - 3* Opens down, dotted
line.
* Vertex: (2,1)
2)1(2
4
2
a
bx
1384
3)2(4)2(1 2
y
y
* Test point (0,0)
0>-02+4(0)-3
0>-3
x y
0 -3
1 0
2 1
3 0
4 -3
Test Point
10.2 – Quadratic Functions
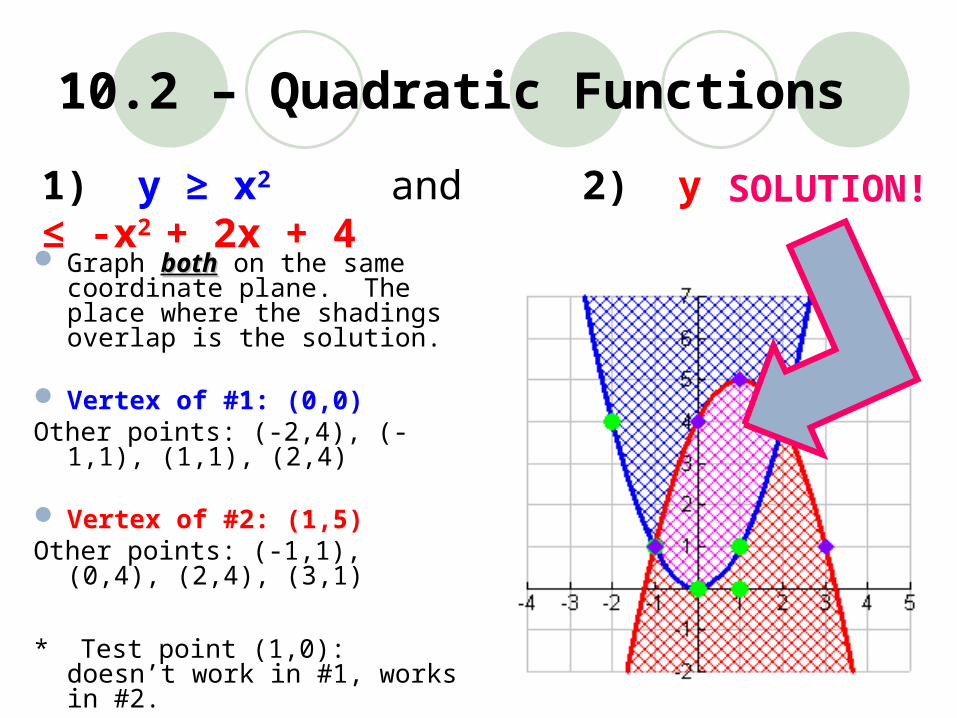
1) y ≥ x2 and 2) y ≤ -x2 + 2x + 4 Graph bothboth on the same
coordinate plane. The place where the shadings overlap is the solution.
Vertex of #1: (0,0)Other points: (-2,4), (-1,1), (1,1),
(2,4)
Vertex of #2: (1,5)Other points: (-1,1), (0,4), (2,4),
(3,1)
* Test point (1,0): doesn’t work in #1, works in #2.
SOLUTION!
10.2 – Quadratic Functions
10.2 – Quadratic Functions
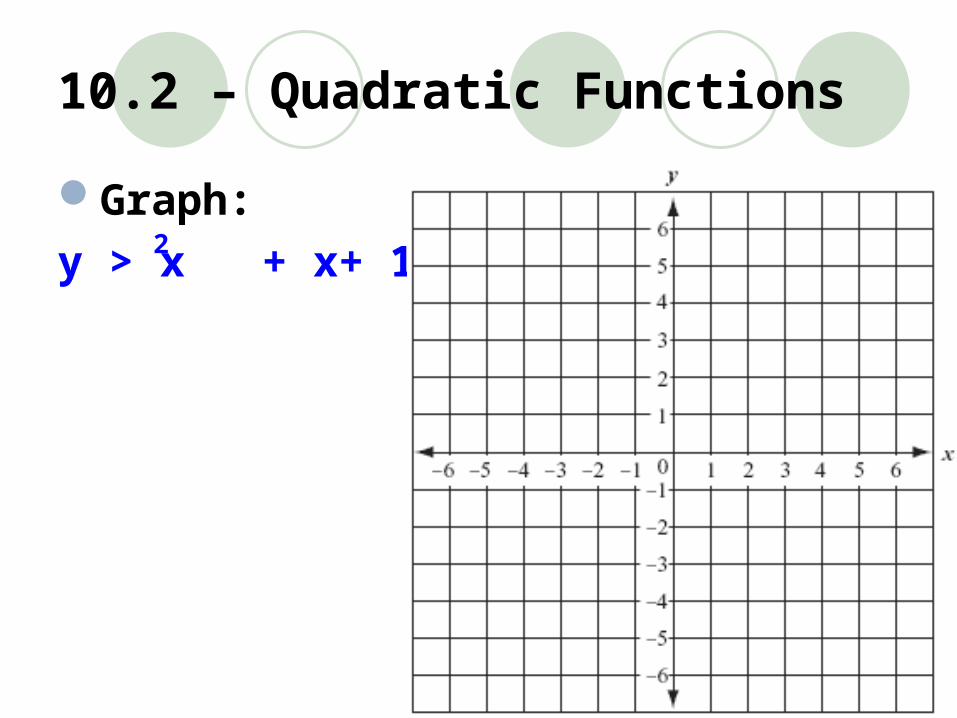
Graph:
y > x + x+ 12