2 Measurements in Hong Kong using LED Based Long Path ... fileMonthly averaged LP-DOAS and OMI...
21
Manuscript prepared for Atmos. Meas. Tech. with version 3.2 of the L A T E X class copernicus.cls. Date: 13 February 2012 NO 2 Measurements in Hong Kong using LED Based Long Path Differential Optical Absorption Spectroscopy K.L. Chan 1 , D. P ¨ ohler 2 , G. Kuhlmann 1 , A. Hartl 1 , U. Platt 2 , and M.O. Wenig 1 1 School of Energy and Environment, City University of Hong Kong 2 Institute for Environmental Physics, Heidelberg University Correspondence to: K.L. Chan ([email protected]) Abstract. In this study we present the first long term measurements of atmospheric nitrogen diox- ide (NO 2 ) using a LED based Long Path Differential Optical Absorption Spectroscopy (LP-DOAS) instrument. This instrument is measuring continuously in Hong Kong since December 2009, first in a setup with a 550 m absorption path and then with a 3820 m path at about 30m to 50 m above street level. The instrument is using a high power blue light LED with peak intensity at 450 nm coupled 5 into the telescope using a Y-fibre bundle. The LP-DOAS instrument measures NO 2 levels in the Kowloon Tong and Mongkok district of Hong Kong and we compare the measurement results to mixing ratios reported by monitoring stations operated by the Hong Kong Environmental Protection Department in that area. Hourly averages of coinciding measurements are in reasonable agreement (R=0.74). Furthermore, we used the long-term data set to validate the Ozone Monitoring Instru- 10 ment (OMI) NO 2 data product. Monthly averaged LP-DOAS and OMI measurements correlate well (R=0.84) when comparing the data for the OMI overpass time. We analyzed weekly patterns in both data sets and found that the LP-DOAS detects a clear weekly cycle with a reduction on weekends during rush hour peaks, whereas OMI is not able to observe this weekly cycle due to its fix overpass time (13:30 - 14:30 local time). 15 1 Introduction Nitrogen dioxide (NO 2 ) is one of the most important trace gases in the atmosphere with impact on atmospheric chemical processes and public health. Nitrogen oxides (NO x ), defined as the sum of nitrogen oxide (NO) and nitrogen dioxide (NO 2 ), participate in the catalytic formation of ozone (O 3 ) in the troposphere. Acid rain caused by NO x is known to have adverse impact on forest, freshwater 20 1
-
Upload
duongduong -
Category
Documents
-
view
218 -
download
1
Transcript of 2 Measurements in Hong Kong using LED Based Long Path ... fileMonthly averaged LP-DOAS and OMI...

Manuscript prepared for Atmos. Meas. Tech.with version 3.2 of the LATEX class copernicus.cls.Date: 13 February 2012
NO2 Measurements in Hong Kong using LED BasedLong Path Differential Optical AbsorptionSpectroscopyK.L. Chan1, D. Pohler2, G. Kuhlmann1, A. Hartl1, U. Platt2, and M.O. Wenig1
1School of Energy and Environment, City University of Hong Kong2Institute for Environmental Physics, Heidelberg University
Correspondence to: K.L. Chan([email protected])
Abstract. In this study we present the first long term measurements of atmospheric nitrogen diox-
ide (NO2) using a LED based Long Path Differential Optical Absorption Spectroscopy (LP-DOAS)
instrument. This instrument is measuring continuously in Hong Kong since December 2009, first in
a setup with a 550 m absorption path and then with a 3820 m path at about 30m to 50 m above street
level. The instrument is using a high power blue light LED with peak intensity at 450 nm coupled5
into the telescope using a Y-fibre bundle. The LP-DOAS instrument measures NO2 levels in the
Kowloon Tong and Mongkok district of Hong Kong and we compare the measurement results to
mixing ratios reported by monitoring stations operated by the Hong Kong Environmental Protection
Department in that area. Hourly averages of coinciding measurements are in reasonable agreement
(R=0.74). Furthermore, we used the long-term data set to validate the Ozone Monitoring Instru-10
ment (OMI) NO2 data product. Monthly averaged LP-DOAS and OMI measurements correlate well
(R=0.84) when comparing the data for the OMI overpass time. We analyzed weekly patterns in both
data sets and found that the LP-DOAS detects a clear weekly cycle with a reduction on weekends
during rush hour peaks, whereas OMI is not able to observe this weekly cycle due to its fix overpass
time (13:30 - 14:30 local time).15
1 Introduction
Nitrogen dioxide (NO2) is one of the most important trace gases in the atmosphere with impact on
atmospheric chemical processes and public health. Nitrogen oxides (NOx), defined as the sum of
nitrogen oxide (NO) and nitrogen dioxide (NO2), participate in the catalytic formation of ozone (O3)
in the troposphere. Acid rain caused by NOx is known to have adverse impact on forest, freshwater20
1

and soil, harming insects and aquatic life-forms, as well as causing damage to buildings and having
a negative impact on public health. NO2 may also play an important role in radiative warming of
the earth’s atmosphere (Solomon et al., 1999). Besides natural sources and biomass burning, fossil
fuel combustion is estimated to contribute about 50 % to the global NOx emission (Lee et al., 1997).
In Hong Kong, the atmospheric NO2 levels are strongly related to traffic volume (Lau et al., 2008)25
and power generation. Due to prevailing easterlies in Hong Kong, most of the power plants are
built in the western part of Hong Kong to minimize the impact on the populated area. As in most
metropolitan areas the NO2 level varies rapidly with time. Having an accurate NO2 measurement
with high temporal resolution is very important for air quality monitoring and pollution management.
Differential Optical Absorption Spectroscopy (DOAS), introduced by Platt et al. (1979), is a spec-30
troscopic measurement technique which has been used successfully for decades for atmospheric
trace gas retrieval. DOAS allows direct and sensitive detection of multiple trace gases simultane-
ously without influencing their chemical interactions. It uses distinct narrow band absorption struc-
tures of the different trace gases for quantitative detection and concentration estimation by separating
them from the broad band parts caused mainly by atmospheric scattering and broad band absorption.35
In this paper, details of our experimental setup of the LED based fibre long path DOAS instrument
are presented. The data are automatically analyzed for NO2 and published on our website in near
real time (airquality.e2.cityu.edu.hk/Data). The LP-DOAS NO2 measurements are compared to the
mixing ratios measured by a nearby monitoring station which is operated by the Hong Kong Environ-
mental Protection Department (EPD), as well as the NO2 data measured by the Ozone Monitoring40
Instrument (OMI) on board NASA’s Aura satellite.
2 Experimental Setup and Retrieval Procedure
A sketch of the fibre LP-DOAS instrument setup is shown in Figure 1. The LP-DOAS setup consists
of a blue LED light source, a telescope acting as sending and receiving unit and an array of retro
reflectors (7 single quartz glass prisms each 63 mm in diameter) at the other end of the absorption45
path. Following the approach by Merten et al. (2011), the optical fibers were used as transmitter for
the light between light source and telescope and telescope and spectrograph, respectively. The fibers
are connected in a Y-bundle (5 m length) with six 200µm transmitting fibers (NA=0.22) from the
LED light source surrounding one 200µm receiving fiber which is connected to the spectrometer.
The high power LED is placed on a heat sink in order to stabilize the temperature. The light of the50
high power blue LED (CREE XR-E 7090 royal blue, 440-455 nm FWHM) with ∼600 mW radiant
flux (at 700 mA) is collimated into the six fibres by a quartz glass lens with f=25 mm. The combined
Y-fiber end is placed close to the focal point of the telescope’s main mirror of 20 cm diameter and
60 cm focal length and thus produces an almost parallel light beam. Two stepper motors allow
precise adjustment of the telescope to the retro reflector array. Light coming back from the retro55
2

Fig. 1. Schematic diagram of the experimental setup of the fibre LP-DOAS.
reflector array is collected by the receiving fibre and redirected to a Triax 320 spectrometer (Jobin
Yvon, f-number=4.0, 1200 l/mm grating and blaze 500 nm, f=320 mm, wavelength range from 400
to 462 nm, thermostated to 30◦C). The detector is a HMT (Hoffmann Messtechnik) 1024 pixel
photodiode array detector (with Hamamatsu S3904-1024 chip) temperature stabilized to 0◦C. The
200µm fibre acts as entrance slit, resulting in a spectral resolution of 0.4 nm (FWHM). To guarantee60
a homogeneous illumination of the spectrometer a mode mixer is applied by bending and vibrating
the fibre (Stutz and Platt, 1997).
In this study, two measurement setups were realized (see Figure 2). Setup 1 was operational
from December 2009 till November 2010 with a total absorption path of 550 m across the City
University of Hong Kong (CityU) campus. Both the instrument and the reflector were located on top65
of university buildings at opposite ends of the campus. Setup 2 is operational since December 2010
with a total absorption path of 3820 m. The instrument is located at CityU and the retro reflector is
installed at the 22nd floor of the Langham Place Hotel at 70 m height in the center of Kowloon in
Mong Kok. The measurement path covers the University campus, residential areas and areas with
heavy traffic.70
A measurement sequence starts with taking an atmospheric spectrum with a maximum of 10
scans followed by 10 scans of the LED reference spectrum. One scan is a spectrum with peak
intensity about 60 % saturation of the detector and typically requires 60 ms to 1000 ms depending
on visibility and instrument setup. The total sampling time for 10 scans is limited to 30 s, if longer
scans are necessary, the number of scans is reduced. The LED reference spectrum is taken by using75
3

Fig. 2. Map of Kowloon, Hong Kong, from Open Street Map (http://www.openstreetmap.org) . The two blue
lines indicate the measuring path for the two setups. The two red markers indicate the location of the Shum
Shui Po and Mongkok EPD monitoring station.
a shortcut system consisting of an aluminum diffuser plate that is moved several millimeters in
front of the fibre bundle, the measurement of the LED spectrum normally take less than 1 s. The
narrow band structures of the LED reference spectra are used to account for changes in the detector
and the LED itself in order to improve the quality of the DOAS fit. Afterwards an atmospheric
background spectrum is taken by blocking the LED using a shutter with a fixed integration time of80
1 s and 1 scan. A full measurement sequence takes between 30 s and 60 s depending on visibility
conditions. For the LP-DOAS measurement and data evaluation the software DOASIS (Kraus, 2005)
(doasis.iup.uni-heidelberg.de) is used.
The calibration of the spectrograph is performed using the emission lines of a Mercury lamp and
a Xenon glow lamp. The Mercury emission line at 435.84 nm is used to convolve the literature85
reference spectra to the instrument resolution. The measured data are evaluated by the DOASIS
4

software. All spectra are corrected for offset, dark current and background before the DOAS fit. The
measurement spectrum is then divided by the corresponding LED reference spectrum before taking
the logarithm. In order to remove the broad band structures from the spectrum, a high pass filter is
applied by subtracting a binomial filter of the order of 1000, corresponding to Gaussian smoothing90
with σ= 22 (in channels). Remaining broad band structures are removed by fitting and subtracting
a second order polynomial during the DOAS fit.
In order to correct for small uncertainties in the wavelength mapping, we use one set of shift and
squeeze parameters for all references spectra. The latter are taken from: NO2 (Voigt et al., 2002),
Glyoxal (CHOCHO) (Volkamer et al., 2005), O3 (Voigt et al., 2001), O4 (Greenblatt et al., 1990)95
and H2O (Hitran 2006, see Rothman et al., 2003). For the non-linear optimization DOASIS uses a
Levenberg-Marquard fit and b-splines for interpolation. The reference spectra are treated with the
same high pass filter as applied for the measurement spectra. The spectral fit is performed in the
wavelengths from 436.3 nm to 460.5 nm which includes several strong NO2 absorption lines. The
measured slant columns are converted to mixing ratios by dividing the slant columns by the total100
absorption length and the air density. Simultaneous pressure and temperature measurements are
used for the air density calculation. A DOAS fit example of the LP-DOAS measurement is shown
in Figure 3 with NO2 slant column density of 1.84×10¹⁷ ± 1.53×10¹⁵ molec/cm2 with respect to
volume mixing ratio of 19.23 ± 0.16 ppbv. Based on findings by Stutz and Platt (1996) the numerical
error of the fit is multiplied by a factor of 3 to obtain an estimate of the measurement error (1σ)105
which is typically about 0.3 ppbv. The detection limit is defined by 2 times this measurement error
(Stutz and Platt, 1996). We compared this detection limit to an estimate gained from analyzing the
higher frequency variations in our time series. The latter are assumed to be dominated by instrument
noise as path averaged NO2 columns should vary on larger time scales. Applying a high pass filter
with a threshold of 10 minutes to the data of one day, we obtain a variance of the remaining high110
frequency structure of about 0.5 ppbv, which agrees well with the estimate of the measurement error
from the DOAS evaluation. This value is considered to be the upper limit of the measurement
error. Typically, the error of the NO2 measurement is in the order of 1 % and thus ignoreable in
the following discussions. The LP-DOAS measurement error is not plotted in the comparison time
series, since they are too small to be visible.115
3 Results
The LP-DOAS has been measuring for more than 16 months, providing atmospheric NO2 informa-
tion with high temporal resolution. The data show strong daily, weekly and seasonal variability with
lower NO2 levels in summer and higher values in autumn and winter. Mean daily cycles of NO2
for weekdays and Sunday show different characteristics. The typical daily cycle of NO2 in an urban120
area shows one peak in the morning and one peak in the evening rush hour. The lowest and highest
5

440 445 450 455 460-0.040
-0.035
-0.030
-0.025
-0.020
-0.015
-0.010
-0.005
0.000
0.005
0.010
0.015
0.020
0.025
Opt
ical
Den
sity
Wavelength (nm)
a) NO2
440 445 450 455 460-0.0025
-0.0020
-0.0015
-0.0010
-0.0005
0.0000
0.0005
0.0010
0.0015
Opt
ical
Den
sity
Wavelength (nm)
b) CHOCHO
440 445 450 455 460-0.0025
-0.0020
-0.0015
-0.0010
-0.0005
0.0000
0.0005
0.0010
0.0015
Opt
ical
Den
sity
Wavelength (nm)
c) H2O
440 445 450 455 460-0.0025
-0.0020
-0.0015
-0.0010
-0.0005
0.0000
0.0005
0.0010
0.0015
Opt
ical
Den
sity
Wavelength (nm)
d) O3
440 445 450 455 460-0.0025
-0.0020
-0.0015
-0.0010
-0.0005
0.0000
0.0005
0.0010
0.0015
Opt
ical
Den
sity
Wavelength (nm)
e) O4
440 445 450 455 460-0.0025
-0.0020
-0.0015
-0.0010
-0.0005
0.0000
0.0005
0.0010
0.0015
Opt
ical
Den
sity
Wavelength (nm)
f) Residual
Fig. 3. Example of the NO2 retrieval form a spectrum taken on 17 December 2010 at 09:54 (HKT). The optical
density of the scaled cross-sections (red curves) and the sum of the scaled cross-section and the residual (blue
curves) of (a) NO2, (b) CHOCHO, (c) H2O, (d) O3 and (e) O4. (f) shows the residual.
6

NO2 levels usually occur in the early morning and the evening rush hour, respectively. Details of
the daily and weekly cycle of NO2 will be discussed in section 3.3. The annually averaged NO2
mixing ratio measured by the LP-DOAS is about 23.5 ppbv, which is slightly higher than the WHO
guideline annual value (21 ppbv), but considerably lower than the Hong Kong air quality annual125
objective value (42.5 ppbv). The maximum and minimum NO2 mixing ratio measured within the
entire measuring period are 110.9 ppbv and 2.6 ppbv, respectively.
During this study, we also analyzed the relationship between NO2 mixing ratios, wind direction
and wind speed. In general, the NO2 mixing ratio is slightly higher when there are westerly winds,
most likely due to transport from Hong Kong power plants. We could not observe a clear relation for130
wind from the industrial area in the Pearl River Delta NW of Hong Kong. This indicates that high
NO2 levels in Hong Kong do not arise from transport from these areas but have a local origin. We
also find that the NO2 levels decrease with increasing wind speed for all wind directions. Stronger
winds prevent locally produced NO2 from accumulating.
3.1 Comparison with In-situ Monitoring Data135
In this section, we compare NO2 measurements between the LP-DOAS and a nearby air quality
monitoring station operated by the Hong Kong Environmental Protection Department (EPD) in Sham
Shui Po about 1.6 km from our measuring site (www.epd-asg.gov.hk/english/backgd/quality.html).
The monitoring station is located on top of the Sham Shui Po police station at about 17 meters above
ground. The monitoring instrument is a chemiluminescence analyzer with a Molybdenum converter140
which measures atmospheric NO2 by converting NO2 to NO. Roadside measurements of another
EPD station with the same type of instrument located in Mongkok are given in the following as well.
The location of both EPD stations are marked in Figure 2.
Time series of daily averaged ambient NO2 mixing ratios obtained by the LP-DOAS and the
EPD monitoring station from December 2009 till March 2011 are shown in Figure 4a. Figure 4b145
and c show the EPD measurements and hourly averaged LP-DOAS measurements for the two setups,
respectively. For setup 2 data from the EPD roadside monitoring station in Mongkok are also shown.
NO2 levels show similar characteristic: Both time series show a pronounced daily and annual cycle
with lower NO2 levels in summer. Ground level NO2 in urban area is generally lower in summer
due to a shorter NO2 lifetime.150
Figure 5a shows that the Pearson correlation coefficient between the CityU LP-DOAS and Sham
Shui Po EPD data set is 0.71, the total error weighted least square regression has a slope of 0.81
with an offset of 16.01 ppbv. On average the EPD monitor in Shum Shui Po measures mixing
ratios that are 11.5 ppbv higher than the LP-DOAS. This might be explained by the difference in
the environment of the measuring sites. The EPD monitoring station is located in Sham Shui Po,155
a commercial area with heavy traffic, while the LP-DOAS instrument was set up in Kowloon Tong
with the absorption path covering the University Campus and residential area.
7
1/4/2010T F
3/4/2010S S
5/4/2010M T
7/4/2010W T
9/4/2010F S11/4/2010
S M13/4/2010
T W15/4/2010
T F17/4/2010
S S19/4/2010
M T21/4/2010
W T23/4/2010
F S25/4/2010
S M27/4/2010
T W29/4/2010
T F1/5/2010
S0
20
40
60
80
100
NO
2 Mix
ing
Rat
io (p
pbv)
Date
LP-DOAS Individual LP-DOAS Hourly EPD SSP
a)
28/2/2010S
1/3/2010M
2/3/2010T
3/3/2010W
4/3/2010T
5/3/2010F
6/3/2010S
7/3/2010
0
10
20
30
40
50
NO
2 Mix
ing
Rat
io (p
pbv)
Date
LP-DOAS Individual LP-DOAS Hourly EPD SSP
b)
27/2/2011S
28/2/2011M
1/3/2011T
2/3/2011W
3/3/2011T
4/3/2011F
5/3/2011S
6/3/2011
0
20
40
60
80
100
120
140
NO
2 Mix
ing
Rat
io (p
pbv)
Date
LP-DOAS Individual LP-DOAS Hourly EPD SSP EPD MK
c)
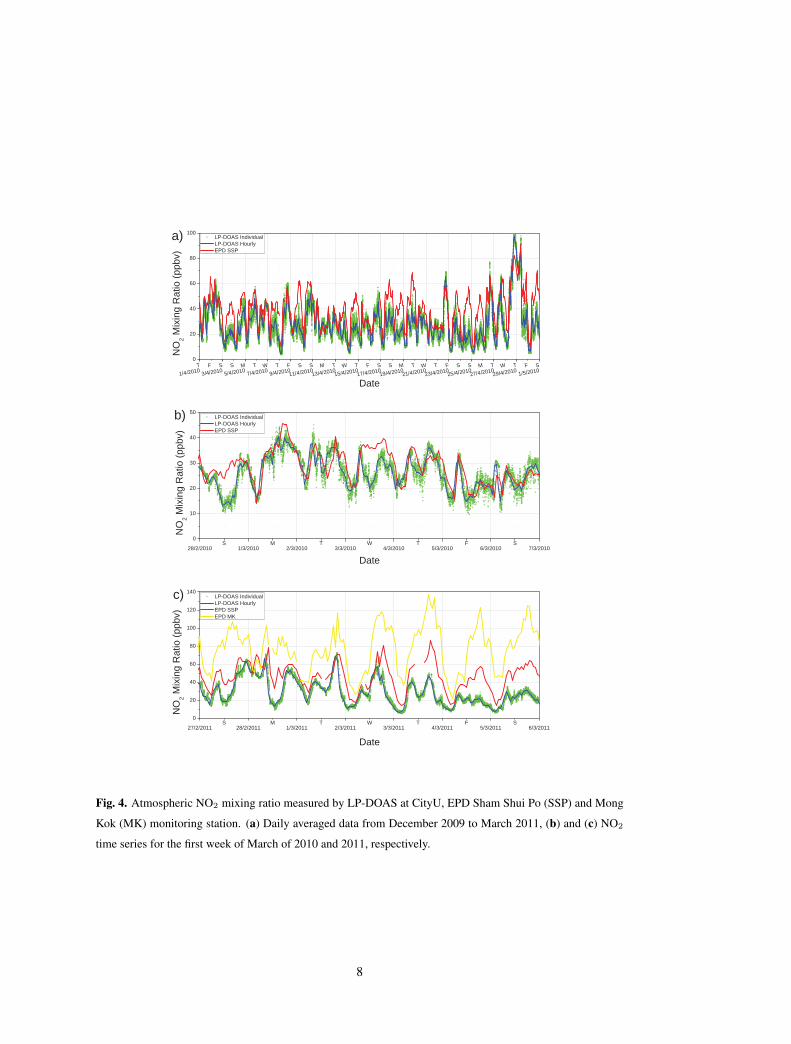
Fig. 4. Atmospheric NO2 mixing ratio measured by LP-DOAS at CityU, EPD Sham Shui Po (SSP) and Mong
Kok (MK) monitoring station. (a) Daily averaged data from December 2009 to March 2011, (b) and (c) NO2
time series for the first week of March of 2010 and 2011, respectively.
8

0 10 20 30 40 50 60 70 80 90 1000
10
20
30
40
50
60
70
80
90
100
Y = 0.810X + 16.012R = 0.707
Correlation LP/SSP Total Least Square Fit LP/SSP Reference Line
EP
D N
O2 M
ixin
g R
atio
(ppb
v)
LP-DOAS NO2 Mixing Ratio (ppbv)
a)
0 10 20 30 40 50 60 70 80 90 1000
102030405060708090
100110120130140150
Correlation LP/SSP Correlation MK/SSP Total Least Square Fit LP/SSP Total Least Square Fit MK/SSP Reference Line
EP
D N
O2 M
ixin
g R
atio
(ppb
v)
LP-DOAS NO2 Mixing Ratio (ppbv)
Y = 1.121X + 37.257R = 0.621
Y = 0.903X + 18.344R = 0.786
b)
Fig. 5. (a) Correlation between mixing ratios measured by the LP-DOAS (LP) with CityU path (setup 1, 550 m
path) and the EPD Sham Shui Po (SSP) monitoring station, for data from December 2009 to November 2010.
(b) Correlation between mixing ratios measured by the LP-DOAS (LP) with Langham Place path (setup 2,
3820 m path) and the EPD Sham Shui Po (SSP, black dots) and Mongkok (MK, cyan dots) monitoring station,
for data from December 2010 to March 2011.
9

The Pearson correlation coefficient between the LP-DOAS with path from CityU to Langham
Place Hotel and EPD measurements in Sham Shui Po is 0.79, decreasing to 0.62 for the correlation
between the LP-DOAS and Mongkok EPD roadside measurements, see Figure 5b. On average the160
Sham Shui Po and Mongkok EPD values are 15.6 ppbv and 40.7 ppbv higher than the LP-DOAS.
Measured mixing ratios decreasing with increasing measurement height suggesting that the main
emission sources and formation of NO2 are very close to the ground and probably dominated by
traffic emissions. This result agrees with the observation that the EPD roadside monitoring stations
typically measure higher NO2 levels than the average station (Lau et al., 2008).165
Figure 4 illustrates that most of the time the NO2 mixing ratios recorded by the EPD monitoring
station correlate well with the LP-DOAS measurements. However, the EPD monitoring station mea-
surements occasionally show a considerable disagreement compared to the LP-DOAS measurements
(e.g. Figure 4b, 28 February and 3 March, 2010). This phenomenon may arise from the fact that
emissions at the street level could be trapped by an inversion and cannot reach the height of the LP-170
DOAS. The discrepancy can also be explained by the differences in the measuring technique. The
LP-DOAS remote sensing measures atmospheric NO2 without any cross sensitivity to other nitrogen
species, whereas the chemiluminescence analyzing technique is reported to suffer from significant
interference by other nitrogen compounds. The conversion of these compounds can lead to over-
estimation of the measured NO2 level up to 50 % in heavily polluted urban areas like Hong Kong175
(Dunlea et al., 2007). Additionally, the chemiluminescence measurement is a point measurement,
while the LP-DOAS measures the average NO2 mixing ratio along an absorption path. Therefore,
the LP-DOAS is less influenced by a single emission source and local fluctuations.
3.2 Satellite Measurement Validation
Satellite measurements of atmospheric trace gases are indispensable for providing global maps of180
trace gas distributions. However, there are very few satellite validation studies over South China. In
order to find out how representative satellite derived NO2 columns are for ground level mixing ratios
in Hong Kong, we compare the LP-DOAS NO2 data to OMI satellite measurements.
3.2.1 The Ozone Monitoring Instrument
OMI is an imaging spectrometer measuring atmospheric trace gases such as NO2 and O3 (Levelt185
et al., 2006). It is on board the Earth Observing System’s (EOS) Aura satellite which was launched
on 15 July 2004 and is collecting data since 9 August 2004, providing more than 6 years of daily
global NO2 maps (Boersma et al., 2001). The Aura satellite orbits at an altitude of 705 km are
in a sun-synchronous polar orbit with an exact 16 day repeat cycle and a local equator crossing
time of 13:45 (local time) on the ascending node. The instrument consists of two nadir viewing190
imaging spectrometers measuring the UV/VIS spectral range from 264 nm to 504 nm with a spectral
resolution between 0.45 nm and 1.0 nm FWHM. The spectral sampling is two to three times the
10

spectral resolution. OMI provides measurements at 60 positions across the orbital track every 2
seconds. In the global observation mode, these 60 measurements cover a swath of approximately
2600 km. The ground pixel size of OMI at nadir is about 320 km2 (13 km × 24 km) and increases195
to about 6400 km2 (40 km × 160 km) at the two ends of the track. The change in ground pixel size,
and hence spatial resolution, must be taken into account when analyzing and interpreting OMI data.
A more detailed description of the OMI instrument can be found in Levelt et al. (2006).
3.2.2 OMI Tropospheric NO2 VCD Retrieval
In this study, NASA’s OMI tropospheric NO2 data product is used (Bucsela et al., 2006). The NO2200
slant column density (SCD) is retrieved by fitting the OMI spectrum for wavelengths ranging from
405 nm to 465 nm using the DOAS technique. For the OMI NO2 data product three trace gas refer-
ence spectra, NO2 (Vandaele et al., 1998), O3 (Burrows et al., 1999) and H2O (Harder and Brault,
1997), are fitted to the measured spectra. The air-mass factor (AMF), defined as the ratio of the
SCD to the vertical column density (VCD), is needed in order to convert SCD into VCD (Solomon205
et al., 1987). The AMF calculation depends on the viewing geometry, surface albedo, atmospheric
scattering and the NO2 vertical profile (Palmer et al., 2001). AMFs are calculated on the basis of an-
nual mean NO2 profiles obtained from the GEOS-Chem model (Bey et al., 2001) and pre-calculated
altitude-dependent AMFs (Bucsela et al., 2006). The stratospheric and tropospheric amounts of
NO2 are separated by assuming the tropospheric NO2 varies on a much smaller spatial scale than the210
stratospheric NO2. Polluted regions are masked and the remaining stratospheric field is smoothed
and interpolated using a zonal planetary wave analysis. This smoothed field is subtracted from the
VCDs in order to calculate the tropospheric NO2 amount by applying a corrected tropospheric AMF.
For cloud contaminated pixels profiles are extrapolated to the ground (Bucsela et al., 2006).
3.2.3 Gridded OMI NO2 Data215
Since there might be multiple OMI pixels overlapping each other, the OMI tropospheric NO2 VCDs
are gridded onto a high resolution longitude-latitude grid, in order to have a better comparison be-
tween the OMI NO2 and the LP-DOAS measurements. For the comparison a 0.02◦ × 0.02◦ grid
(approximately 2.22 km × 2.05 km for Hong Kong) is used. The gridded product is based on all
VCDs observed within a day for cloud cover less than 40 %. For overlapping OMI pixels a weighted220
average is stored in the grid cell. Weighting the VCDs with a factor 1/VCD2err would minimize the
resulting average errors. However, the AMF calculation constitutes the largest error source, which
leads to the NO2 VCD uncertainties being proportional to the VCDs. Weighting with 1/VCD2err
yields an average bias toward low VCD values. Following the approach introduced by Wenig et al.
(2008), we adopt a weighting scheme which only depends on the error caused by the cloud cover C225
11

and the OMI pixel size A for the calculation of VCDGRID
V CDGRID =ΣV CD×W
ΣWwith W =
1
A(1.5×10¹⁵(1+3C))2(1)
This gridding scheme can also enhance the details in the gridded product by giving smaller OMI
pixels higher weights (Wenig et al., 2008).
3.2.4 Converting Tropospheric VCD to Ground Level Mixing Ratio230
The OMI tropospheric NO2 VCDs are converted to ground level mixing ratios using the OMI a-
priori vertical NO2 profile which is an annually averaged tropospheric profile from September 1996
to August 1997 derived from a global 3-D chemical transport model (CTM) GEOS-Chem (Bey
et al., 2001). The profile used to convert OMI NO2 VCDs to ground mixing ratios is shown in
Figure 6. An annual mean (from July 2009 to June 2010), winter (December, January and February)235
and summer (June, July and August) vertical NO2 profiles from GEOS-Chem are also shown and
used for comparison.
3.2.5 Cloud Filtering
Clouds shield ground level NO2 and make satellite measurements difficult. In order to allow better
comparison with the LP-DOAS data, OMI measurements significantly influenced by clouds have to240
be filtered out. To get a balance between having enough measurements left and minimizing cloud
contamination, only OMI data with cloud fractions smaller than 40 % are used in this study. LP-
DOAS data from 13:30 to 14:30 local time (which is the OMI overpass time for Hong Kong and
hence is expected to have the best agreement with OMI data) are used for comparison with the
gridded OMI data sets within 15 km from the measurement site (which is approximately the average245
OMI pixel size), see Figure 7. OMI data within 50 km are shown for illustrations as well. In order
to reduce the influence of clouds and local spatial variations, monthly mean data are used for the
comparison.
3.2.6 Comparison of Monthly Values
Figure 8 shows the monthly averaged LP-DOAS data for the OMI overpass time from 13:30 to250
14:30 and the OMI data converted to ground mixing ratios within a 15 km radius of CityU. Both
data sets (LP-DOAS and OMI) show a very similar annual cycle with lower NO2 values in summer
and higher NO2 values in autumn and winter. The Pearson correlation between the monthly means
of LP-DOAS measurements and OMI data within 15 km is 0.84. In order to show the influence of
temporal averaging, monthly averages for all LP-DOAS data are shown in Figure 8, too. As NO2255
shows high temporal variability, increasing the averaging time would include data that OMI is not
able to capture and hence less correlated with each other. OMI data averaged for a 50 km radius
illustrates the influence of spatial averaging. As can be seen in Figure 7, Hong Kong is at the edge
12

10-11
10-10
10-9
10-8
300
400
500
600
700
800
900
1000
NO2 Mixing Ratio (v/v)
Pre
ssur
e (h
Pa)
GEOS-Chem annual averageGEOS-Chem summerGEOS-Chem winterOMI a-priori
Fig. 6. Vertical profile of NO2 for VCDs to ground level mixing ratio conversion. The green, red and blue curve
show the annual mean (from July 2009 to June 2010), winter (December, January and February) and summer
(June, July and August) vertical profile of NO2 over Hong Kong obtanined from GEOS-Chem simulation. The
magenta curve shows the a-priori vertical profile used in the OMI retrieval of NO2 over Hong Kong.
13
111.5 112 112.5 113 113.5 114 114.5 115 115.5 11621
21.5
22
22.5
23
23.5
24
24.5
25
Longitude
Latit
ude
Guang Zhou
Fo Shan
Dong Guan
Jiang Men
Zhong Shan
Zhu Hai
MacauHong Kong
Ying De
Shao Guan
Shen Zhen
OM
I Tro
p N
O2 V
CD
(m
olec
/cm
2 )
0
5
10
15x 10
15
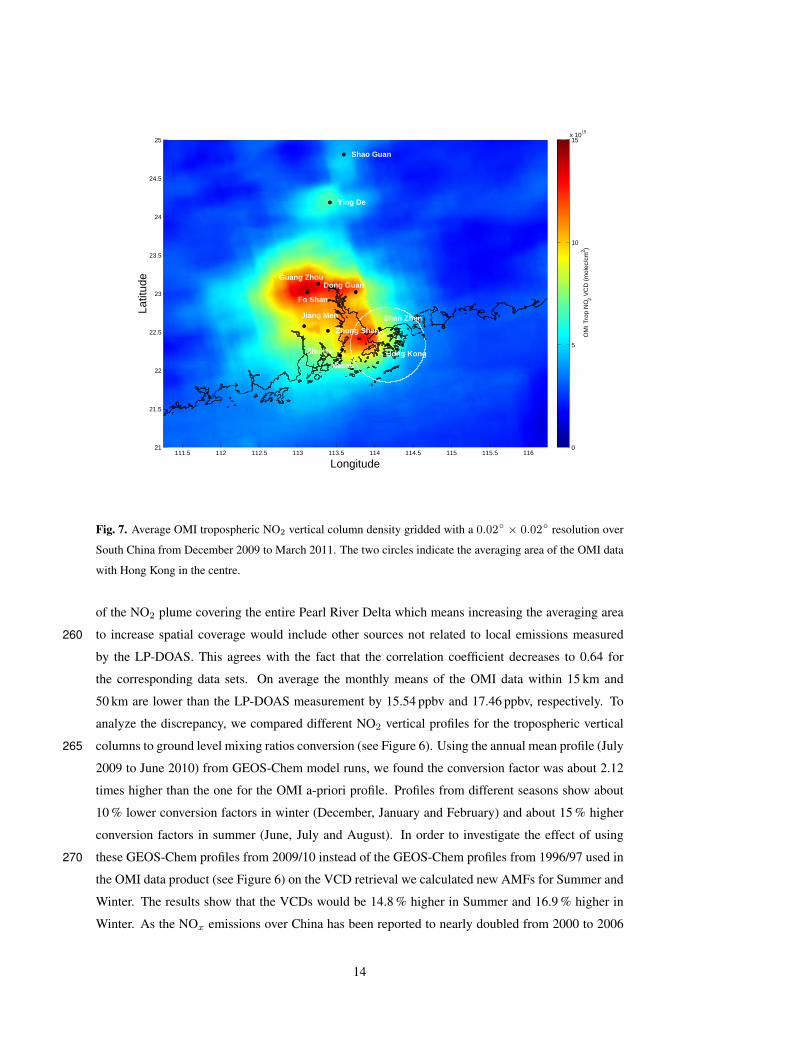
Fig. 7. Average OMI tropospheric NO2 vertical column density gridded with a 0.02◦ × 0.02◦ resolution over
South China from December 2009 to March 2011. The two circles indicate the averaging area of the OMI data
with Hong Kong in the centre.
of the NO2 plume covering the entire Pearl River Delta which means increasing the averaging area
to increase spatial coverage would include other sources not related to local emissions measured260
by the LP-DOAS. This agrees with the fact that the correlation coefficient decreases to 0.64 for
the corresponding data sets. On average the monthly means of the OMI data within 15 km and
50 km are lower than the LP-DOAS measurement by 15.54 ppbv and 17.46 ppbv, respectively. To
analyze the discrepancy, we compared different NO2 vertical profiles for the tropospheric vertical
columns to ground level mixing ratios conversion (see Figure 6). Using the annual mean profile (July265
2009 to June 2010) from GEOS-Chem model runs, we found the conversion factor was about 2.12
times higher than the one for the OMI a-priori profile. Profiles from different seasons show about
10 % lower conversion factors in winter (December, January and February) and about 15 % higher
conversion factors in summer (June, July and August). In order to investigate the effect of using
these GEOS-Chem profiles from 2009/10 instead of the GEOS-Chem profiles from 1996/97 used in270
the OMI data product (see Figure 6) on the VCD retrieval we calculated new AMFs for Summer and
Winter. The results show that the VCDs would be 14.8 % higher in Summer and 16.9 % higher in
Winter. As the NOx emissions over China has been reported to nearly doubled from 2000 to 2006
14

Date
NO
2 Mix
ing
Rat
io (
ppbv
)
Dec Jan Feb Mar Apr May Jun Jul Aug Sep Oct Nov Dec Jan Feb Mar0
5
10
15
20
25
30
35
40
45
50LP-DOAS OMI OverpassLP-DOAS Monthly AverageOMI <= 15kmOMI <= 50km
2010 2011
Fig. 8. Monthly mean ground level NO2 mixing ratio. LP-DOAS data are temporal averages around OMI
overpass times (blue curve). Monthly averages for all LP-DOAS data is shown for reference (magenta curve).
OMI data are spatial averages over pixels within a 15 km (red curve) and 50 km (green curve) radius of the
instrument. The light gray and gray regions indicate the variability (1 standard deviation) of LP-DOAS data
during OMI overpass time and OMI data within a 15 km, respectively. The shadowed regions indicate months
where OMI data are very sparse (less than 3 data points per month due to the cloud filtering).
(Zhang et al., 2007), this suggests that the a-priori profile used in the OMI retrieval might be out of
date and causing underestimation.275
The light gray and gray regions shown in Figure 8 represent the 1σ variability of the NO2 mixing
ratios within the months measured by the LP-DOAS and OMI, respectively, while the error bars
of the OMI data represent the 1σ uncertainties of the OMI measurements. The error bars for the
LP-DOAS measurements are too small to be shown. The averaged variability of the NO2 mixing
ratios in winter (December, January and February), spring (March, April and May), summer (June,280
July and August) and autumn (September, October and November) are 10.6 ppbv, 9.8 ppbv, 7.3 ppbv
and 13.2 ppbv, respectively. The errors of the monthly OMI data are calculated by the standard error
propagation and base on the assumption that all errors are randomly distributed. The error bars are
larger for the months when only a small number of data points were available due to cloud filtering,
e.g., February, April and May of 2010. In most of the months, the error bars of OMI data, either285
within 15 km or within 50 km, do not overlap with the LP-DOAS data, which indicated that there
are some unknown systematic errors either in the OMI retrieval (Wenig et al., 2008) or the VCDs
to ground level mixing ratios conversion, or both. One possible reason for the lower OMI values
over Hong Kong compared to the LP-DOAS measurements is that the OMI a-priori profile used for
15
Mon Tue Wed Thu Fri Sat Sun0.65
0.70
0.75
0.80
0.85
0.90
0.95
1.00
1.05
1.10
1.15
1.20
1.25
Nor
mal
ized
NO
2 Mix
ing
Rat
io
Weekday
LP-DOAS OMI overpass OMI <= 15km LP-DOAS Daily Average OMI <= 50km LP-DOAS 0830-0930
a)
Mon Tue Wed Thu Fri Sat Sun0.65
0.70
0.75
0.80
0.85
0.90
0.95
1.00
1.05
1.10
1.15
1.20
1.25
Nor
mal
ized
NO
2 Mix
ing
Rat
io
Weekday
LP-DOAS 0830-0930 LP-DOAS OMI overpass EPD SSP 0900 EPD SSP OMI overpass EPD MK 0900 EPD MK OMI overpass
b)
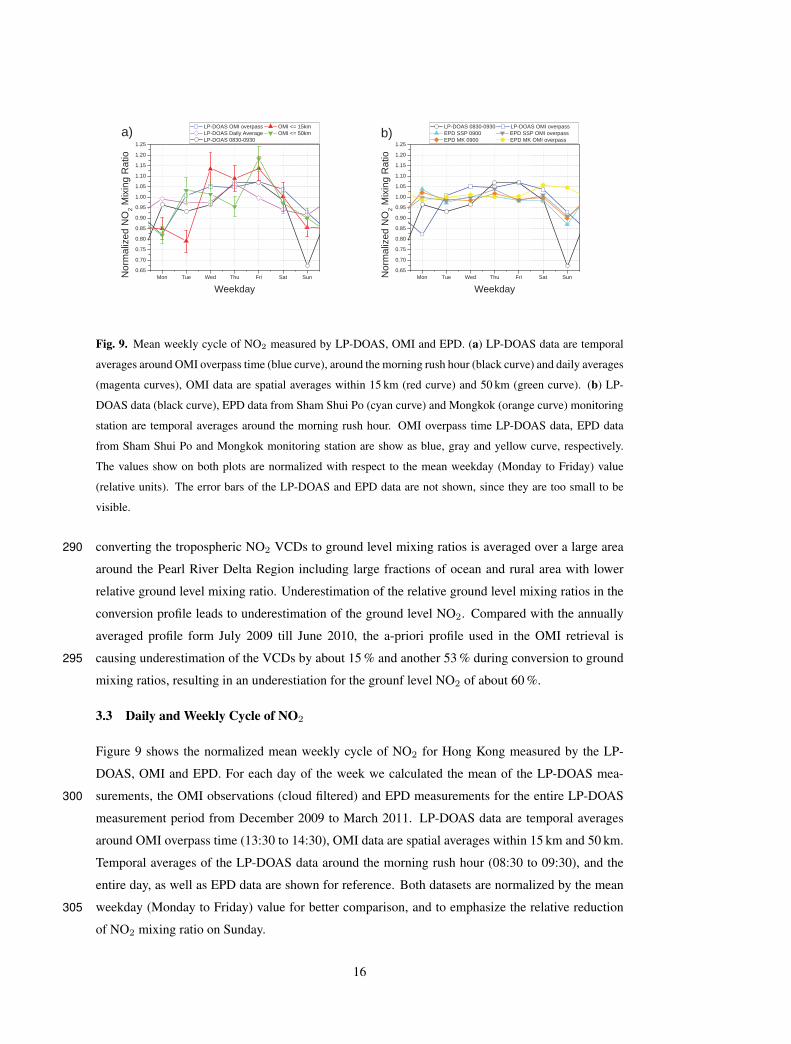
Fig. 9. Mean weekly cycle of NO2 measured by LP-DOAS, OMI and EPD. (a) LP-DOAS data are temporal
averages around OMI overpass time (blue curve), around the morning rush hour (black curve) and daily averages
(magenta curves), OMI data are spatial averages within 15 km (red curve) and 50 km (green curve). (b) LP-
DOAS data (black curve), EPD data from Sham Shui Po (cyan curve) and Mongkok (orange curve) monitoring
station are temporal averages around the morning rush hour. OMI overpass time LP-DOAS data, EPD data
from Sham Shui Po and Mongkok monitoring station are show as blue, gray and yellow curve, respectively.
The values show on both plots are normalized with respect to the mean weekday (Monday to Friday) value
(relative units). The error bars of the LP-DOAS and EPD data are not shown, since they are too small to be
visible.
converting the tropospheric NO2 VCDs to ground level mixing ratios is averaged over a large area290
around the Pearl River Delta Region including large fractions of ocean and rural area with lower
relative ground level mixing ratio. Underestimation of the relative ground level mixing ratios in the
conversion profile leads to underestimation of the ground level NO2. Compared with the annually
averaged profile form July 2009 till June 2010, the a-priori profile used in the OMI retrieval is
causing underestimation of the VCDs by about 15 % and another 53 % during conversion to ground295
mixing ratios, resulting in an underestiation for the grounf level NO2 of about 60 %.
3.3 Daily and Weekly Cycle of NO2
Figure 9 shows the normalized mean weekly cycle of NO2 for Hong Kong measured by the LP-
DOAS, OMI and EPD. For each day of the week we calculated the mean of the LP-DOAS mea-
surements, the OMI observations (cloud filtered) and EPD measurements for the entire LP-DOAS300
measurement period from December 2009 to March 2011. LP-DOAS data are temporal averages
around OMI overpass time (13:30 to 14:30), OMI data are spatial averages within 15 km and 50 km.
Temporal averages of the LP-DOAS data around the morning rush hour (08:30 to 09:30), and the
entire day, as well as EPD data are shown for reference. Both datasets are normalized by the mean
weekday (Monday to Friday) value for better comparison, and to emphasize the relative reduction305
of NO2 mixing ratio on Sunday.
16

00:00 04:00 08:00 12:00 16:00 20:00 24:0010
20
30
40
50
60
70
80
90
100
NO
2 Mix
ing
Rat
io (p
pbv)
Local Time
LP-DOAS Weekdays LP-DOAS Sunday EPD SSP Weekdays EPD SSP Sunday EPD MK Weekdays EPD MK Sunday
Fig. 10. Annual mean daily NO2 cycle of the LP-DOAS, EPD Sham Shui Po and Mongkok measurements for
weekdays and Sunday for data from December 2009 to November 2010. The green, blue and red curves indicate
the mean daily NO2 cycle for weekdays of the LP-DOAS, EPD Sham Shui Po and Mongkok measurements,
respectively. The dashed green, blue and red curves indicate the mean daily NO2 cycle for Sunday of the LP-
DOAS, EPD Sham Shui Po and Mongkok measurements, respectively. The hatched region indicates the OMI
overpass time for Hong Kong.
The OMI data and LP-DOAS data during OMI overpass agree with each other and show no
significant weekly cycle. Our observation agrees with observations by Beirle et al. (2003) and Wenig
(2001) that no significant NO2 weekly cycle can be found over Hong Kong from space. However,
such a cycle can be observed in the LP-DOAS measurements as well as the EPD data during the310
morning rush hour (08:30 to 09:30). The weekly cycle shows that the NO2 level reduces by more
than 30 % on Sundays compared to weekdays. Weekly cycles obtained by the EPD monitoring
stations show a less pronounced reduction (about 15 %) on Sunday. This could be explained by the
fact that both EPD stations are loacted in commercial area which are quite busy throughtout the
whole week, while the LP-DOAS measurements cover both residential and commercial areas.315
The mean daily cycles of NO2 mixing ratios measured by the LP-DOAS, EPD Sham Shui and
Mongkok monitoring stations for weekdays and Sunday are shown in Figure 10. The LP-DOAS
measurements and the EPD data show similar characteristics with peaks in the morning and evening
17

rush hours. In general, NO2 levels reach a minimum around 5:00 (local time) in the morning,
followed by an increase from 5:00 to 9:00. The NO2 levels decreases from 9:00 to 13:00 then it320
increases again and reaches the daily maximum around 18:00. The two peaks in the morning and
the evening are due to an increase in traffic load during rush hours. Less traffic emissions and strong
irradiance converting NO2 to NO and ozone result in lower NO2 levels at noon. The measured NO2
is mainly due to traffic, as natural NO2 emissions have no weekly and no strong diurnal cycle with
typical much lower levels than observed. Power plant and industrial NO2 emissions from the Pearl325
River Delta would be expected to show a distinct dependency on wind direction which could not be
observed in our LP-DOAS measurements data.
From Figure 10, it is obvious that the daily NO2 cycle for weekdays and Saturdays are almost
the same. Most of the people in Hong Kong have to work on Saturdays, hence the traffic volume
on Saturday is similar to that of weekdays. The NO2 level reduces significantly on Sunday morning330
by more than 30 % compared to weekdays. It gradually returns to a weekday level in the afternoon.
This pattern might be be explained by the fact that the majority of the population does not have to
work on Sunday and go out in the afternoon.
Similar to the noon LP-DOAS data, OMI NO2 observations do not show any reduction on Sun-
day. This suggests that satellite data with a single overpass per day are not sufficient to interpret335
weekly cycles of components which show a strong daily variability, empathizing the importance for
geostationary satellite observation in this case.
4 Summary and Conclusion
In this paper, we described the instrumental setup and automatic data retrieval process of the LED
based long path DOAS instrument running operationally at City University of Hong Kong since340
December 2009 in order to monitor surface air pollution conditions in Hong Kong. The measured
NO2 data show strong daily, weekly and seasonal variability. The annually averaged NO2 mixing
ratio is 23.5 ppbv but regularly exceeds 42.5 ppbv (Hong Kong air quality annual objective value).
The NO2 mixing ratios vary from 2.6 ppbv to 110.9 ppbv during the entire measuring period.
Our LP-DOAS measurements are compared to the NO2 mixing ratio reported by a nearby mon-345
itoring station operated by the Hong Kong Environmental Protection Department (EPD). Hourly
averages of coinciding measurements correlate well with a correlation coefficient R=0.71 for the
550 m absorption path and 0.79 for the 3820 m path. However, the EPD measurements show higher
NO2 mixing ratio than the LP-DOAS measurements by 11.5 ppbv for the shorter path (setup 1) and
15.6 ppbv for the longer path (setup 2). This discrepancy can be explained by different measurement350
heights and locations. Previous study reported that the chemiluminescence analyzers are likely to be
overestimating the NO2 levels due to cross interferences from other nitrogen compounds.
The LP-DOAS measurements during the OMI overpass time (13:30 - 14:30) are used to vali-
18

date OMI satellite NO2 measurements over Hong Kong. Monthly averaged data of the LP-DOAS
and OMI within 15 km radius of the LP-DOAS correlate well with a correlation coefficient of 0.84355
and show that OMI measures reliable ground level NO2. However, the OMI data are on average
15.54 ppbv lower than the LP-DOAS measurements. This discrepancy is mainly due to the a-priori
NO2 vertical profile used for the OMI retrieval and conversion of OMI NO2 VCDs to ground level
mixing ratios. By comparing the OMI a-priori profile to more up to date profiles shows the a-priori
profile used in the OMI retrieval might be out of date and lead to an underestimation of the NO2360
level in Hong Kong.
Weekly cycles from OMI data and LP-DOAS data show clear differences. Daily NO2 cycles
from LP-DOAS measurements show significant peaks in the morning and evening rush hour due to
increased traffic. The weekly cycle of NO2 shows significant reduction on Sunday morning, but a
typical weekday level for the rest of the day. This explains why OMI cannot observe a weekly cycle365
for Hong Kong, since the satellite’s overpass time is around 14:00. We demonstrate that satellite
data with a single overpass per day are not in general suitable to derive weekly cycles of compounds
with strong diurnal variation.
Acknowledgements. The authors would like to thank Langham Place, Mongkok, Hong Kong for cooperating
with CityU on this project and for the installation of the retro reflector at their building. The work described370
in this paper was partial supported by a grant from the Research Grants Council of the Hong Kong Special
Administrative Region, China (Project No. CityU 102809), a grant from City University of Hong Kong (Project
No. 7008077) and the German DAAD (Project No. PPP- D/09/00817).
19

References
Beirle, S., Platt, U., Wenig, M., and Wagner, T.: Weekly cycle of NO2 by GOME measurements: a signature of375
anthropogenic sources, Atmos. Chem. Phys., 3, 2225–2232, DOI:10.5194/acp–3–2225–2003, 2003.
Bey, I., Jacob, D., Yantosca, R., Logan, J., Field, B., Fiore, A., Li, Q., Liu, H., Mickley, L., and Schultz, M.:
Global modeling of tropospheric chemistry with assimilated meteorology: Model description and evaluation,
J. Geophys. Res., 106, 23 073, DOI: 10.1029/2001JD000 807, 2001.
Boersma, K. F., Bucsela, E. J., Brinksma, E. J., and Gleason, J. F.: NO2, OMI-EOS Algorithm Theoretical380
Basis Document: Trace Gas Algorithms: NO2, 2001.
Bucsela, E., Celarier, E., Wenig, M., Gleason, J., Veefkind, P., Boersma, K., and Brinksma, E.: Algorithm for
NO2 vertical column retrieval from the Ozone Monitoring Instrument, IEEE Transactions on Geoscience and
Remote Sensing, 44, 1245–1258, 2006.
Burrows, J. P., Richter, A., Dehn, A., Deters, B., Himmelmann, S., Voigt, S., and Orphal, J.: Atmospheric385
remote sensing reference data from GOME 2 Temperature-dependent absorption cross-sections of O3 in the
231 V 794 nm range, J. Quant. Spectrosc. Radiat. Transfer, 61, 509–517, 1999.
Dunlea, E. J., Herndon, S. C., Nelson, D. D., Volkamer, R. M., San Martini, F., Sheehy, P. M., Zahniser, M. S.,
Shorter, J. H., Wormhoudt, J. C., Lamb, B. K., Allwine, E. J., Gaffney, J. S., Marley, N. A., Grutter, M.,
Marquez, C., Blanco, S., Cardenas, B., Retama, A., Ramos Villegas, C. R., Kolb, C. E., Molina, L. T., and390
Molina, M. J.: Evaluation of nitrogen dioxide chemiluminescence monitors in a polluted urban environment,
Atmos. Chem. Phys., 7, 2691–2704, 2007.
Greenblatt, G., Orlando, J., Burkholder, J., and Ravishankara, A.: Absorption measurements of oxygen between
330 and 1140 nm, J. Geophys. Res., 95, 18 577–18 582, 1990.
Harder, J. W. and Brault, J. W.: Atmospheric measurements of water vapor in the 442nm region, J. Geophys.395
Res., 102, 6245–6252, 1997.
Kraus, S.: DOASIS A Framework Design for DOAS, Ph.D. thesis, Combined Faculties for Mathematics and
for Computer Science, University of Mannheim, 2005.
Lau, J., Hung, W., Cheung, C., and Yuen, D.: Contributions of roadside vehicle emissions to general air quality
in Hong Kong, Transportation Research Part D, 13, 19–26, 2008.400
Lee, D. S., Kohler, I., Grobler, E., Rohrer, F., Sausen, R., Gallardo-Klenner, L., Olivier, J. G. J., Dentener, F. J.,
, and Bouwman, A.: Estimations of Global NOx Emissions and Their Uncertainties, Atmos. Environ., 31,
1735–1749, 1997.
Levelt, P. F., van den Oord, G. H. J., Dobber, M. R., Malkki, A., Visser, H., de Vries, J., Stammes, P., Lundell,
J. O. V., , and Saari, H.: The Ozone Monitoring Instrument, IEEE Trans. Geo. Rem. Sens., 44, 1093–1101,405
2006.
Merten, A., Tschritter, J., and Platt, U.: New Design of DOAS-Long-path Telescopes based on fiber optics,
Appl. Optics, 50, 783–754, 2011.
Palmer, P., Jacob, D., Chance, K., Martin, R., Spurr, R., Kurosu, T., I. Bey, R. Y., and Fiore, A.: Air mass factor
formulation for spectroscopic measurements from satellites: Application to formaldehyde retrievals from the410
Global Ozone Monitoring Experiment, J. Geophys. Res., 106, 14 539–14 550, 2001.
Platt, U., Perner, D., and Patz, H.: Simultaneous measurement of atmospheric CH2O, O3and NO2 by differen-
tial optical absorption, J. Geophys. Res., 84, 6329–6335, 1979.
20

Rothman, L., Barbe, A., Benner, D. C., Brown, L., Camy-Peyret, C., Carleer, M., Chance, K., Clerbaux, C.,
Dana, V., Devi, V., Fayt, A., Flaud, J.-M., Gamache, R., Goldman, A., Jacquemart, D., Jucks, K., Lafferty,415
W., Mandin, J.-Y., Massie, S., Nemtchinov, V., Newnham, D., Perrin, A., Rinsland, C., Schroeder, J., Smith,
K., Smith, M., Tang, K., Toth, R., Auwera, J. V., Varanasi, P., and Yoshino, K.: The HITRAN molecu-
lar spectroscopic database: edition of 2000 including updates through 2001, J. Quant. Spectrosc. Radiat.
Transfer, 82, 5–44, 2003.
Solomon, S., Schmeltekopf, A. L., and Sanders, R. W.: On the interpretation of zenith sky measurements, J.420
Geophys. Res., 92(D7), 8311–8319, 1987.
Solomon, S., Portmann, R. W., Sanders, R. W., Daniel, J. S., Madsen, W., Bartram, B., and Dutton, E. G.: On
the role of nitrogen dioxide in the absorption of solar radiation, J. Geophys. Res., 104, 12 047–12 058, 1999.
Stutz, J. and Platt, U.: Numerical Analysis and Estimation of the Statistical Error of Differential Optical Ab-
sorption Spectroscopy Measurements with Least-Squares methods, Appl. Optics, 35, 6041–6053, 1996.425
Stutz, J. and Platt, U.: Improving longpath differential optical absorption spectroscopy with a quartz-fiber mode
mixer, Appl. Optics, 36, 1105–1115, 1997.
Vandaele, A. C., Hermans, C., Simon, P. C., Carleer, M., Colin, R., Fally, S., Merienne, M. F., Jenouvrier, A.,
and Coquart, B.: Measurements of the NO2 absorption cross-section from 42000 cm−1 to 10000 cm−1 (238
- 1000 nm) at 220 K and 294 K, J. Quant. Spectrosc. Radiat. Transfer, 59, 171–184, 1998.430
Voigt, S., Orphal, J., Bogumil, K., and Burrows, J. P.: The temperature dependence (203-293 K) of the ab-
sorption cross sections of O3 in the 230-850 nm region measured by Fourier-transform spectroscopy, J.
Photochem. Photobiol., 143, 1–9, 2001.
Voigt, S., Orphal, J., and Burrows, J. P.: The temperature and pressure dependence of the absorption cross-
sections of NO2 in the 250-800 nm region measured by Fourier-transform spectroscopy, J. Photochem.435
Photobiol., 149, 1–7, 2002.
Volkamer, R., Spietz, P., Burrows, J., and Platt, U.: High-resolution absorption cross-section of Glyoxal in the
UV/vis and IR spectral ranges, J. Photochem. Photobiol., 172, 35. DOI: 10.1016/j.jphotochem.2004.11.011,
2005.
Wenig, M.: Satellite Measurement of Long-Term Global Tropospheric Trace Gas Distributions and Source440
Strengths - Algorithm Development and Data Analysis, Ph.D. thesis, University of Heidelberg, 2001.
Wenig, M. O., Cede, A. M., Bucsela, E. J., Celarier, E. A., Boersma, K. F., Veefkind, J. P., Brinksma, E. J.,
Gleason, J. F., and Herman, J. R.: Validation of OMI tropospheric NO2 column densities using direct-
sun mode Brewer measurements at NASA Goddard Space Flight Center, J. Geophys. Res., 133, D16S45,
DOI:10.1029/2007JD008 988, 2008.445
Zhang, Q., Streets, D. G., He, K., Wang, Y., Richter, A., Burrows, J. P., Uno, I., Jang, C. J., Chen, D., Yao, Z.,
and Lei, Y.: NOx emission trends for China, 1995-2004: The view from the ground and the view from space,
J. Geophys. Res., 112, D22 306, DOI:10.1029/2007JD008 684, 2007.
21