2 10 yr Energy Review 2_14_12 WSCAC Meeting v4.pptx
16
Massachusetts Water Resources Authority Presentation to Water Supply CAC MWRA Energy Efforts & Savings FY02 to FY11 Ten Year Summary Report February 14, 2012
Transcript of 2 10 yr Energy Review 2_14_12 WSCAC Meeting v4.pptx

Massachusetts Water Resources Authority
Presentation to
Water Supply CAC
MWRA Energy Efforts & Savings FY02 to FY11 Ten Year Summary Report
February 14, 2012

• Energy Savings and revenue total approximately $177M during FY02 – FY11
• Increase annual energy savings and revenue from $6M in FY02 to $24M in FY11
• Aggressive pursuit of rebates and grants – over $12M awarded to date
• About 45% of MWRA’s total energy cost profile derived from renewable sources
• Process opNmizaNon and implementaNon of energy audit recommendaNons projected to save almost $2M annually
• RecogniNon for energy program leadership and projecNon compleNon – MWRA awarded 8 regional and naNonal awards (2005 – 2011)
MWRA Energy Program - Summary of Accomplishments
2
3
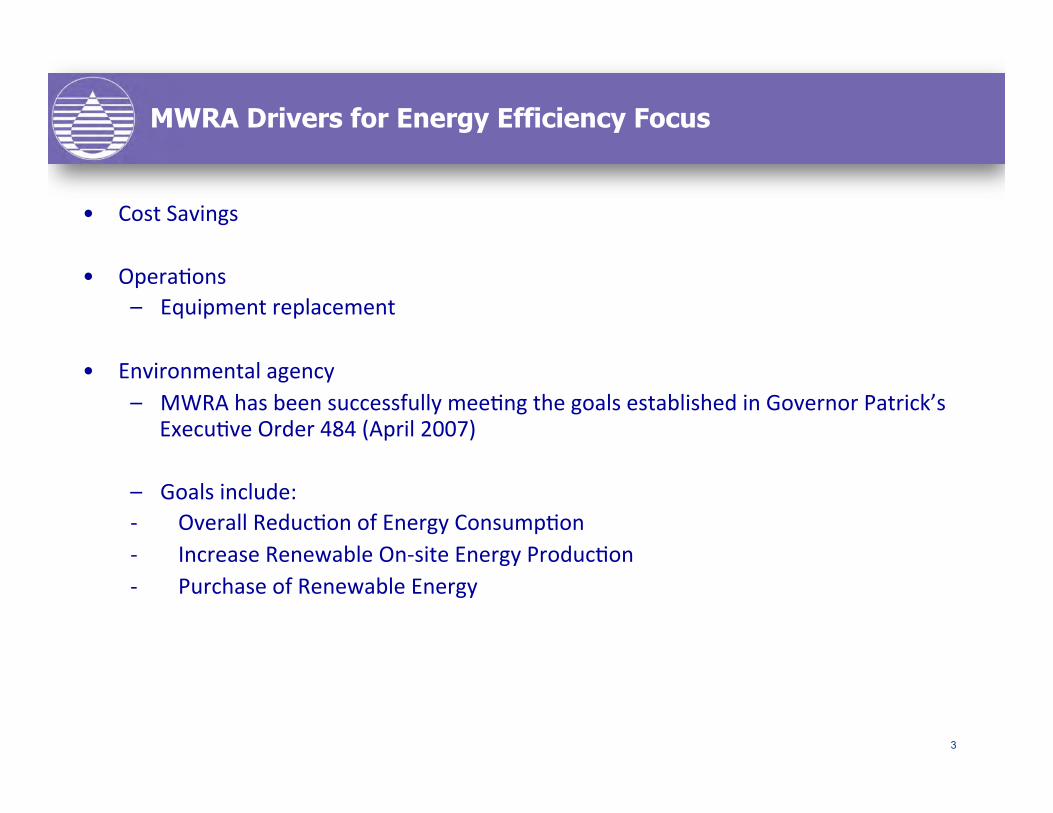
MWRA Drivers for Energy Efficiency Focus
• Cost Savings
• OperaNons – Equipment replacement
• Environmental agency – MWRA has been successfully meeNng the goals established in Governor Patrick’s
ExecuNve Order 484 (April 2007)
– Goals include: -‐ Overall ReducNon of Energy ConsumpNon -‐ Increase Renewable On-‐site Energy ProducNon -‐ Purchase of Renewable Energy

• MWRA’s total demand -‐ 210,800,000 kWh and 493,250 therms (electricity and natural gas only). Equivalent to 18,500 homes, similar to MWRA service area town the size of Arlington.
• MWRA’s costs for natural gas, electricity and diesel fuel
– $15 M (8.4% of total direct expenses) in FY02
– $20 million (9.9% of budget) in FY11
Water And Sewer Is An Energy Intensive Business
4

MWRA Energy Cost by Source FY02-FY11
5
• Price impacts in diesel fuel and electricity prices during FY06 due to Hurricane Katrina and CWTP start-‐up • Increases in electricity prices in FY08-‐FY10 due to market • Diesel fuel purchases increased in FY10 due to CTG use during spring storms
$0
$5
$10
$15
$20
$25
FY02 FY03 FY04 FY05 FY06 FY07 FY08 FY09 FY10 FY11
Natural Gas Electricity Diesel Fuel
($M)

6
MWRA’s Energy Initiatives – 10 Year CEB Impact
Source ($’s in Millions) FY02-FY11
Savings and Avoided Costs:
Avoided Fuel (DI Digas) $ 82 million Competitive Bidding vs Basic Service $ 34
DI Steam Turbine Generator $ 24 Audits/Efficiency $ 6.5
Hydropower $ 4.4 Wind $ 0.4 Solar $ 0.1
Avoided Capacity Charges $ 2.5 Total Savings/Avoided Costs $ 154 million
Revenue:
RPS Credits $ 8.0 million Load Reduction $ 6.8
Generation Sales to Grid $ 7.8 Utility Rebates/Other $ 0.7
Total Revenue $ 23 million TOTAL CEB IMPACT $ 177 million

Energy From Renewables
• Of MWRA’s total energy profile (in $), over 45% is derived from renewable sources
7
Solar
Wind Hydroelectric on-site power RPS Credits
Demand Response
Hydroelectric exported power
Steam Turbine Generator/ Methane
Purchased
MWRA Energy in $

8
Renewable Energy at MWRA

9
Methane Utilization At Deer Island
• Deer Island uNlizes 98% of the methane generated to power a steam turbine generator and backpressure turbine for plant heat and hot water
• Avoid purchase of about 5MG in fuel oil annually
• Approximately 33 MkWh/yr electricity producNon (projected FY13)
• Over $3.6M/yr electricity savings and revenue (projected FY13)
10 10 10
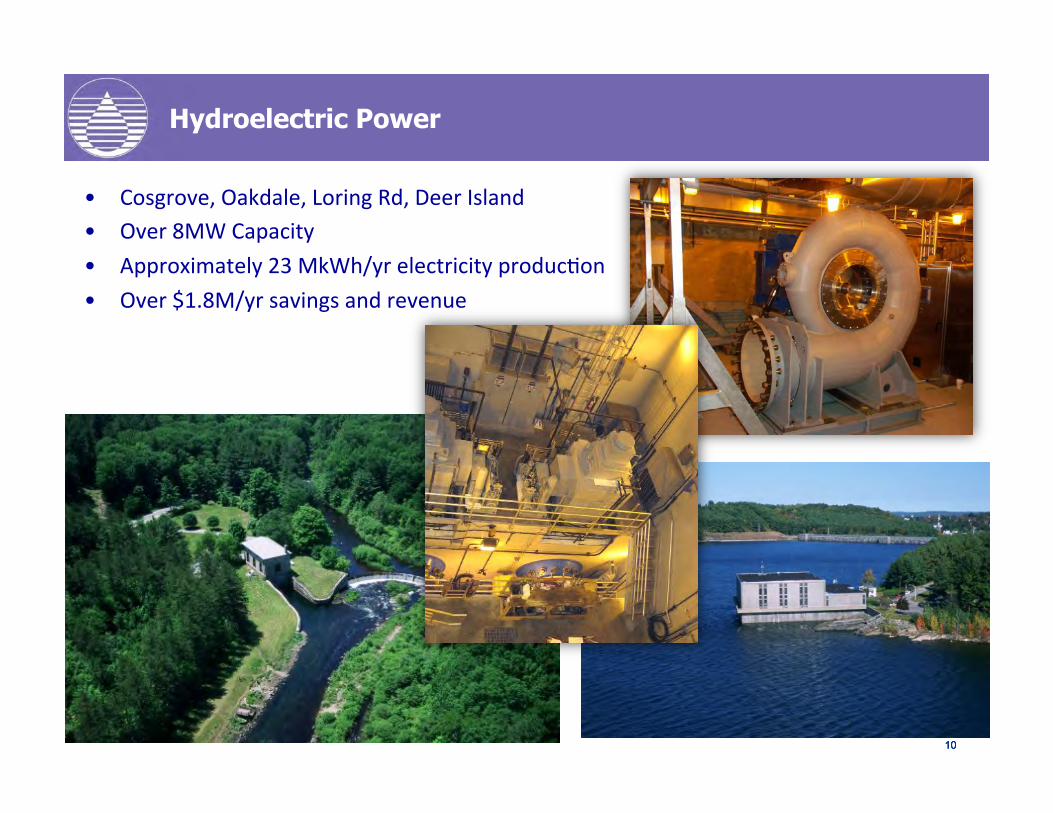
Hydroelectric Power
• Cosgrove, Oakdale, Loring Rd, Deer Island • Over 8MW Capacity
• Approximately 23 MkWh/yr electricity producNon
• Over $1.8M/yr savings and revenue

11
Wind Power
• Deer Island, Charlestown (DeLauri Pump StaNon) • 2.8 MW Capacity
• Over 5 MkWh/yr electricity producNon
• Approximately $575,000/yr savings and revenue
12
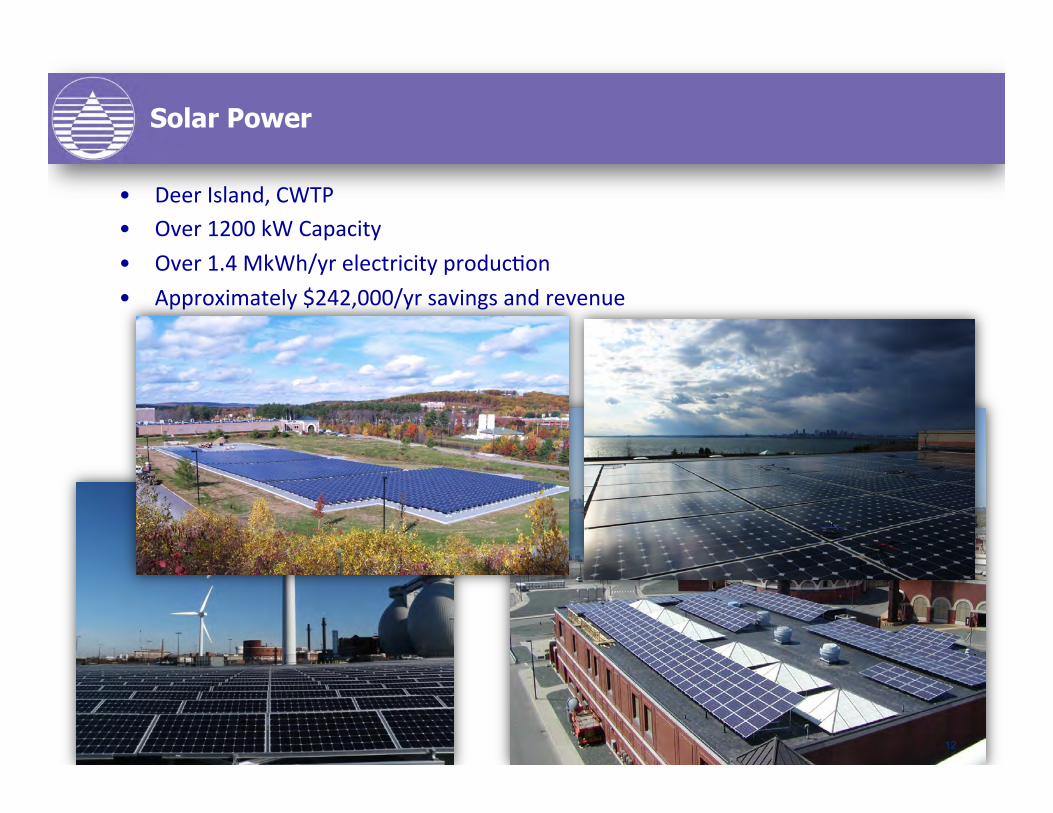
Solar Power
• Deer Island, CWTP • Over 1200 kW Capacity
• Over 1.4 MkWh/yr electricity producNon
• Approximately $242,000/yr savings and revenue

MWRA Renewable Electricity Portfolio
13
0.0%
5.0%
10.0%
15.0%
20.0%
25.0%
30.0%
35.0%
40.0%
45.0%
FY02 FY03 FY04 FY05 FY06 FY07 FY08 FY09 FY10 FY11
Electricity from
Ren
ewab
les (%
)
% Renewables including exported electricity % Renewables including exported electricity and purchased green power
* FY08 – AddiNonal purchase of NaNonal Green-‐e Power

Facility Energy Efficiency Audits
14
Completed Projects Project Currently Underway Facilities Audited, Project Being Evaluated

Maximizing Grants and Rebates
• When the American Reinvestment and Recovery Act was announced, MWRA had a number projects “shovel ready”
• MWRA received $33M in ARRA funds for water and sewer projects of which nearly $10M for renewable energy projects
• Over $2.5M various state grants
• Approximately $680,000 energy efficiency project rebates to date
15

• Hydro – ConNnue to explore hydropower development potenNal
• Wind – ConducNng feasibility study for 4th wind turbine at Deer Island
• Solar – Comprehensive solar assessment ongoing
• Demand Side Management – ConNnue energy audits, process control opNmizaNon, demand response, EMS installaNon
• Grants/Rebates – Seek funding assistance opportuniNes
• Other Sustainable Efforts – alternaNve fuel vehicles, green power purchase, energy efficient compuNng, recycling
MWRA Future Energy Initiatives
16