1Q’2016 Earnings Call - Amazon Web Services JV WITH HOWARD ENERGY PARTNERS (50% INTEREST) SIGNED...
25
EARNINGS CALL FEBRUARY 22, 2018 FOURTH QUARTER 2017
Transcript of 1Q’2016 Earnings Call - Amazon Web Services JV WITH HOWARD ENERGY PARTNERS (50% INTEREST) SIGNED...

EARNINGS CALLFEBRUARY 22, 2018
FOURTH QUARTER 2017

Recent Highlights
2
OPERATIONAL• Oil grew 68%1
• Set well productivity records in the Williston2
• Strong long-lateral results in the Delaware
FINANCIAL• Unhedged discretionary cash flow per BOE
growth of 84%1
• Unhedged adj. EBITDAX growth of 195%1
• 2.4x leverage at YE’173
TRANSACTIONAL• Announced San Juan Gallup sale, $700MM• Closed San Juan Legacy sale, $175MM • Closed Midstream JV with Howard, $349MM
1. 4Q’16 vs. 4Q’17.2. Based on latest internal and public data for HZ wells in Three Forks and Middle Bakken.3. Based on annualized 4Q’17 adjusted EBITDAX.

Midstream: Flow Assurance and Value Creation
MIDSTREAM Strategy
• 50% owned Stateline crude gathering system through JV
• Stateline takeaway agreement with Oryx IIOIL
GAS
OPTIONALITY
EQUITY
• 20% equity ownership exercised with WhiteWater
• 25% equity ownership in Oryx II pipeline1
• 50% owned gas processing facility through JV
• 100% owned gas gathering system
• Atmos WAHA takeaway agreement
• WhiteWater takeaway agreement
• ~81,000 undedicated net acres outside Stateline
• 100% owned Stateline gas & water gathering systems
• Monetization optionality
1Assumes WPX exercises equity option 2H 20183

Clay Gaspar, President & Chief Operating Officer
Operational Update

Delaware Operations: Long Laterals Outperform
5
0
25
50
75
100
125
150
175
200
225
250
275
300
325
350
375
400
0 30 60 90 120 150 180
CUM
MBO
E
Normalized Days on Production
CBR 5H (10,000’)
WOLFCAMP A WELLSCBR 6-7 PAD WELLS1
120-DAY AVG: 1,800+ BOE/D (52% OIL)
10,000’ CBR WELLS 120-DAY AVG:
2,060 BOE/D (52% OIL)
NMTX
LEAEDDY
LOVING
REEVES
SHIFT TO LONG LATERALSCBR 6-7 PAD RESULTS
CBR 6-7 PAD (WOLFCAMP A)1
CBR 4H (10,000’)
CBR 2H (6,700’)
CBR 3H (10,000’)
CBR 7H (5,700’)
1. CBR 6H was excluded from results since it was from drilled in a different bench (Wolfcamp D).
STRONG RESULTS

Delaware: Continued Strong Long-Lateral Results
6
0255075
100125150175200225250275300325350375400
0 30 60 90 120 150 180
CUM
MBO
E
Normalized Days on Production
LINDSAY 16H (WC A, 7,500’)
LINDSAY 18H (WC A, 7,500’)
LINDSAY 15H (WC A, 7,500’)
LINDSAY 14H (WC A, 4,500’)
LINDSAY 17H (WC A, 7,400’)
LINDSAY 19H (WC A, 7,500’)
LINDSAY 10-3A 1H (WC X/Y, 7,700’)
LINDSAY 10-3A1H (WC X/Y- 7,700’) 24-HR IP: 3,634 BOE 90-DAY CUM: ~242,000 BOE (55% OIL)
LINDSAY 10-15 PAD (WC A- 7,500’) 90-DAY AVG: 210 MBOE (55% OIL)
STRONG RESULTS
NMTX
LEAEDDY
LOVING
REEVES
SHIFT TO LONG LATERALSLINDSAY 10-15 PAD RESULTS
LINDSAY 10-15 PAD & LINDSAY 10-3A

7
2017 2019
ANNOUNCED JV WITH HOWARD
ENERGY PARTNERS(50% INTEREST)
SIGNED WAHA TAKEAWAY AGREEMENT WITH ATMOS
SIGNED EQUITY & TAKEAWAY AGREEMENTS
WITH WHITEWATER & ORYX II
COMPLETECRUDE GATHERING SYSTEM
(50% INTEREST)
EXERCISED OPTION WITH WHITEWATER
(20% EQUITY STAKE)
EXERCISE OPTION WITH ORYX II
(25% EQUITY STAKE)
1ST TRAIN OF GAS PROCESSING PLANT ONLINE
(MID-YEAR 2018)(50% INTEREST)
2nd TRAIN OF GAS PROCESSING PLANT ONLINE
(2019)(50% INTEREST)
Midstream Update and Timeline
2018

Williston Operations: Execute and Outperform
8
0
50
100
150
200
250
300
350
0 30 60 90 120 150 180
Continued strong results from NORTH SUNDAY ISLAND120-day cum: ~576 MBOE (81% OIL)Averaging 1,980 barrels of oil per
day after 120 days
Strong performance from 4Q MANDAREE SOUTH PAD60-day Average: ~126 MBOEAveraging 1,700 bbl/d after 60 days
Adding 3RD RIG in 2Q 2018
SOLD Mineral RightsWill receive~$20MM in 1Q
DUNN
MOUNTRAIL BEST WELLS IN THE BASIN90-day & 120-day cum production1
1. Based on latest internal and public data for HZ wells in Three Forks and Middle Bakken.
Normalized Days on Production
CUM
MBO
E

Kevin Vann, Chief Financial Officer
Financial Update

10
4Q & Full-Year 2017 Actual Results
4Q FULL-YEAR2017 2016 2017 2016
Average Daily ProductionOil (Mbbl/d) 75.2 44.7 61.3 41.5 Gas (MMcf/d) 231 200 209 199 NGLs (Mbbl/d) 16.8 10.7 13.8 10.0 Equivalent (MBOE/d) 130.6 88.7 109.8 84.6
Adjusted EBITDAX $255 $135 $710 $475
Adjusted Net Income (Loss) from Continuing Operations ($9) ($54) ($166) ($255)
Capital Expenditures $321 $160 $1,232 $584
Note: Adjusted EBITDAX and adjusted net income are non-GAAP measures. A reconciliation to relevant GAAP measures is provided in this presentation.
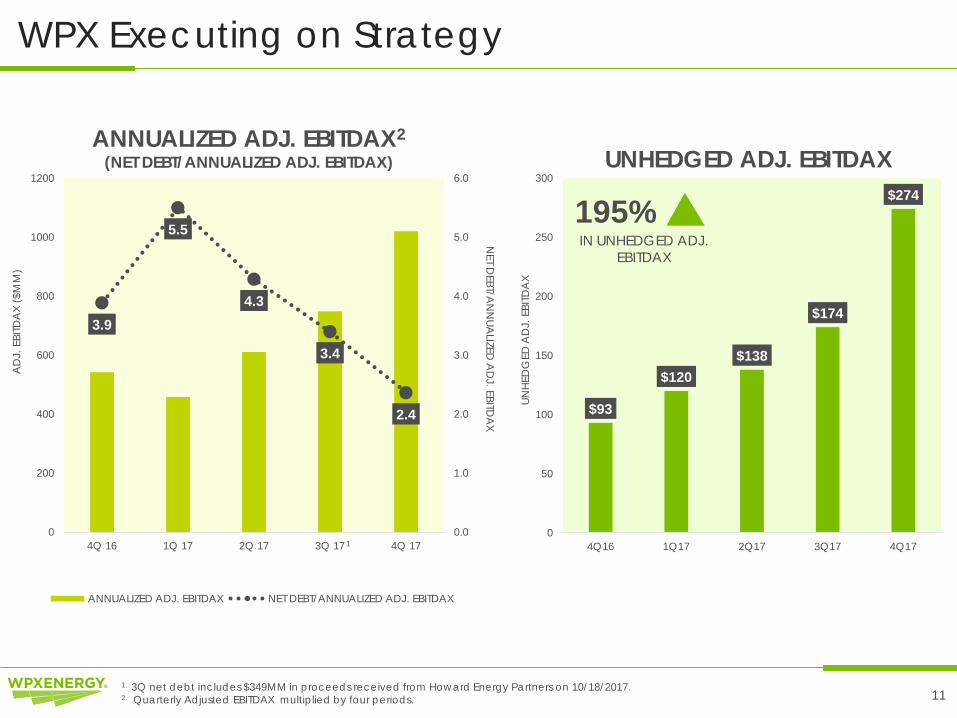
WPX Executing on Strategy
11
ANNUALIZED ADJ. EBITDAX2(NET DEBT/ANNUALIZED ADJ. EBITDAX) UNHEDGED ADJ. EBITDAX
$93
$120$138
$174
$274
0
50
100
150
200
250
300
4Q16 1Q17 2Q17 3Q17 4Q17
195%IN UNHEDGED ADJ.
EBITDAX
3.9
5.5
4.3
3.4
2.4
0.0
1.0
2.0
3.0
4.0
5.0
6.0
0
200
400
600
800
1000
1200
4Q 16 1Q 17 2Q 17 3Q 17 4Q 17
ANNUALIZED ADJ. EBITDAX NET DEBT/ANNUALIZED ADJ. EBITDAX
NET D
EBT/AN
NUA
LIZED A
DJ. EBITD
AX
UNH
EDG
ED A
DJ.
EBI
TDA
X
AD
J. E
BITD
AX
($M
M)
1. 3Q net debt includes $349MM in proceeds received from Howard Energy Partners on 10/18/2017.2. Quarterly Adjusted EBITDAX multiplied by four periods.
1

2018 Full-Year Guidance6
Production FY 2018Oil Mbbl/d 75 – 80Natural Gas MMcf/d 145 – 155NGL Mbbl/d 18 – 20Total MBOE/d 117 – 126 Net Realized Price4 FY 2018
NGL – % of WTI 34% – 38%Cap Ex ($ in Millions) FY 2018D&C / Facilities Capital $1,040 – $1,110Land Acquisition 25 – 50Midstream Opportunities 60 – 90Total Capital Continuing Ops $1,125 – $1,250
Midstream Equity Investments1 35 – 60
Total Capital and Equity Investments Continuing Ops $1,160 – $1,310
San Juan Gallup2 40
Total Capital and Equity Investments $1,200 – $1,350
Avg. Price Differentials3 FY 2018Oil – WTI per barrel ($4.50) – ($5.50)NYMEX – Nat. Gas (Mcf) ($1.00) – ($1.25)
1. 25% equity ownership in Oryx II and 20% Interest with WhiteWater recorded in the investing section of the cash flow statement, “purchase of investments”.2. San Juan Gallup capital will be reimbursed in the purchase price adjustment.3. Average price differentials ranges for oil and natural gas exclude hedges, but include basis differential and revenue adjustments.4. Percentage of realized price ranges for NGLs excludes hedges, but includes basis differential and revenue adjustments.5. Rate does not reflect any potential valuation allowance on deferred tax assets.6. San Juan Gallup is expected to be classified as discontinued operations in 2018.
Expenses FY 2018
$ per BOELOE $5.50 – $6.00GP&T $1.40 – $1.90DD&A $17.00 – $19.00G&A – Cash $2.70 – $3.10G&A – Non-Cash $0.65 – $0.75Exploration $1.50 – $1.75 Interest Expense $3.85 – $3.95
Production Tax 7% – 9%Tax Provision5 21% – 25%
12

WPX: Positioned for Long-Term Value Creation
13
FINANCIALSTRENGTH
LEVERAGE OF 1.5X DURING 2019
MIDSTREAM OPTIONALITY
VALUE CREATION/FLOW ASSURANCE
OILFOCUSED
150 MBBL/D DURING 2022
DEEP INVENTORY
OF HIGH RETURNS

Appendix

WPX Delaware Midstream Infrastructure Overview
ASSETS INCLUDED IN JV
ASSETS WHOLLY OWNED BY WPX
SIGNED TAKEAWAY AGREEMENTS
• Crude Gathering System: • ~125,000 Bbl/d
• Gas Processing Facility: • 400 MMcf/d• First 200 MMcf/d train complete mid-year 2018
• Stateline Gas & Water Gathering Systems: • ~200,000 Bbl/d of water disposal capacity• 150 MMcf/d of gas compression capacity
• ~81,000 Net Acres Outside Stateline Dedication• WPX retains all existing midstream rights in other areas
• Atmos Waha Takeaway Agreement • Up to 200,000 MMBtu/d from Waha to Katy, TX
• WhiteWater Midstream Agreement • Up to 500,000 MMBtu/d from Stateline to Waha• In-service date first half of 2018• 20% equity ownership
• Oryx II Crude Takeaway Agreement • 100,000 Bbl/d capacity • 12.5% equity ownership with option to increase to 25%
LEA
EDDY
WARD
REEVES
LOVING
PECOS
ACREAGE DEDICATION 50,000 ACRES
No drilling or volume commitment
WHITEWATER UP TO 500,000 MMBTU/D
FROM STATELINE TO WAHA
WAHA
JV AGREEMENT• GAS PROCESSING PLANT• CRUDE GATHERING
RETAINED BY WPX• WATER SYSTEM• GAS GATHERING
CULBERSON
N E W M E X I C O
T E X A S
WAHA AGREEMENTUP TO 200,000 MMBTU/D FROM WAHA TO KATY, TX
ORYX IIUP TO 100,000 BBL/D FROM STATELINE TO MIDLAND & CRANE
15

WPX Asset Overview
16
DELAWARE BASIN~131,000 net acres1
6,600+ gross locations2,3
52% oil/18% NGLS/30% gas4
CULBERSON
LEA
EDDY
WARD
REEVES
LOVING
PECOS
WINKLER
CHAVES
WPX OPERATED ACREAGE
NON-OP ACREAGE
N E W M E X I C OT E X A S
WILLIAMS
MOUNTRAIL
MCKENZIE
DUNN
MCLEAN
MERCER
WILLISTON BASIN~85,000 net acres1
~465 gross locations3
86% oil/7% NGLS/7% gas4
WPX OPERATED ACREAGE
1. Acreage as of December 31, 2017.2. Primarily based on 1-mile laterals and does not include Taylor Ranch locations.
3. Includes non-op and operated locations. 4. Based on FY 2017 production.

WPX Liquidity and Debt Maturities
17
Cash and Equivalents @ (12/31/2017) $189
Revolver Capacity $1,200
Letters of Credit ($70)
Liquidity 12/31/2017 $1,319
Senior Debt Maturities
Senior Notes Senior NotesSenior NotesSenior Notes
Liquidity
Dollars listed in millions
$350
$1,100
$500 $650
$0
$200
$400
$600
$800
$1,000
$1,200
2018 2019 2020 2021 2022 2023 2024
$ M
M

WPX Financial Transformation Continues
18
OIL(MBBL/D)
UNHEDGED ADJUSTED EBITDAX
($ IN MILLIONS)
DD&A ($ PER BOE)
G&A ($ PER BOE)
INTEREST EXPENSE($ PER BOE)
68%IN OIL VOLUMES
47%IN G&A
($ PER BOE)
33%IN INTEREST EXP
($ PER BOE)
195%IN UNHEDGED
ADJUSTED EBITDAX
20%IN DD&A
($ PER BOE)
NOTE: Percentage change is based on the change from 4Q’16 to 4Q’17.1. A portion of this rate decrease is due to ceasing depletion on natural gas producing assets in the San Juan Basin that were heldfor sale in 4Q 2017.
44.7 46.1
58.6 64.8
75.2
0
10
20
30
40
50
60
70
80
4Q16 1Q17 2Q17 3Q17 4Q17
$93
$120$138
$174
$274
$0
$50
$100
$150
$200
$250
$300
4Q16 1Q17 2Q17 3Q17 4Q17
$5.87 $5.75
$4.83 $4.61
$3.96
$-
$1
$2
$3
$4
$5
$6
$7
4Q16 1Q17 2Q17 3Q17 4Q17
$19.27 $18.11 $17.78
$16.39 $15.44
$-
$5
$10
$15
$20
$25
4Q16 1Q17 2Q17 3Q17 4Q17 $-
$1
$2
$3
$4
$5
$6
$7
$8
4Q16 1Q17 2Q17 3Q17 4Q17
G&A Cash G&A Equity Comp
1
$6.71
$5.27$4.80
$4.09$3.53
$9.68 $9.39$10.45
$16.10$17.81
$0
$2
$4
$6
$8
$10
$12
$14
$16
$18
$20
4Q16 1Q17 2Q17 3Q17 4Q17
UNHEDGED DISCRETIONARY CASH FLOW
($ PER BOE)
84%IN UNHEDGED
DISCRETIONARY CASH FLOW PER BOE

19
WPX Hedges Updated: February 20, 2018
2018 2019 2020Volume/Day Average Price Volume/Day Average Price Volume/Day Average Price
1. In addition to several crude oil swaps, WPX entered into calendar monthly average(CMA) Nymex roll swaps which provide pricing adjustments to the trade month versus the delivery month for contract pricing. CMA Nymex roll swaps for 2018 total 20,000 bbls/d at a weighted average price of $0.03. CMA Nymex roll swaps for 2019 total 20,000 bbls/d at a weighted average price of $0.11.2. Average price in $/gallon.
Crude Oil (bbl)Fixed Price Swaps1 56,979 $52.72 34,000 $52.30 - -Fixed Price Calls 13,000 $58.89 5,000 $54.08 - -
Crude Oil Basis (bbl)Midland Basis Swaps 14,496 ($0.86) 20,000 ($0.93) 5,000 ($1.16)
Natural Gas (MMBtu)Fixed Price Swaps 131,616 $2.99 50,000 $2.88 - -Fixed Price Calls 16,301 $4.75 - - - -
Natural Gas Basis (MMBtu)Houston Ship Channel Basis Swaps 42,500 ($0.08) 30,000 ($0.09) - -Permian Basis Swaps 47,500 ($0.31) 25,000 ($0.39) - -West Texas Basis Swaps 15,000 $0.93 45,000 $0.07 20,000 ($0.57)San Juan Basis Swaps 23,233 ($0.01) - - - -
Natural Gas Liquids (bbl)Mont Belvieu Ethane Swaps2 3,078 $0.29 - - - -Mont Belvieu Propane Swaps2 3,604 $0.80 - - - -Conway Propane Swaps2 900 $0.79 - - - -Mont Belvieu Iso Butane Swaps2 651 $0.91 - - - -Mont Belvieu Normal Butane Swaps2 1,701 $0.90 - - - -Mont Belvieu Natural Gasoline Swaps2 1,401 $1.31 - - - -

20
Price Realization for 2017Oil ($/bbl) Gas ($/Mcf) NGL ($/bbl)
1Q ’17 2Q’17 3Q’17 4Q ’17 1Q ’17 2Q’17 3Q’17 4Q ’17 1Q ’17 2Q’17 3Q’17 4Q ’17
Weighted-Average Sales Price $46.38 $43.60 $44.24 $52.45 $3.01 $2.65 $2.60 $2.52 $22.14 $18.98 $24.31 $28.47
Revenue Adjustments1 $(1.07) $(1.14) $(0.90) $(0.95) $(0.50) $(0.52) $(0.54) $(0.61) $(1.29) $(0.70) $(0.74) $(0.98)
Net Price2 $45.31 $42.46 $43.34 $51.50 $2.51 $2.13 $2.06 $1.91 $20.85 $18.28 $23.57 $27.49
Realized Portion of Derivatives3 $(0.77) $2.18 $1.70 $(3.57) $(0.11) $0.14 $0.18 $0.28 - - - -
Net Price Including Derivatives $44.54 $44.64 $45.04 $47.93 $2.40 $2.27 $2.24 $2.19 $20.85 $18.28 $23.57 $27.49
1. Natural gas revenue adjustments are primarily related to field compression fuel. NGL revenue adjustments include T&F and revenue sharing. Of the oil revenue adjustments, gathering deductions represent $(1.43).2. “Net Price” equals income statement product revenues by commodity, divided by volume.3. Represents the realized settlement on derivatives that occurred during each quarter.

Consolidated Statement of Operations (GAAP)
21
2016 2017(Dollars in millions) 1Q 2Q 3Q 4Q YTD 1Q 2Q 3Q 4Q YTD
Revenues:Product revenues:
Oil sales $ 97 $ 142 $ 139 $ 173 $ 551 $ 188 $ 226 $ 259 $ 356 $ 1,029 Natural gas sales 25 24 37 39 125 44 40 38 41 163 Natural gas liquid sales 5 10 12 19 46 21 23 29 42 115
Total product revenues 127 176 188 231 722 253 289 326 439 1,307 Net gain (loss) on derivatives 57 (154) 38 (148) (207) 203 116 (106) (210) 3 Commodity management 31 116 25 5 177 5 8 4 8 25 Other 1 - - - 1 - - - 1 1
Total revenues 216 138 251 88 693 461 413 224 238 1,336
Costs and expenses:Depreciation, depletion and amortization 152 163 150 158 623 147 171 169 186 673 Lease and facility operating 42 41 40 40 163 48 53 58 59 218 Gathering, processing and transportation 16 20 19 21 76 21 21 25 27 94 Taxes other than income 11 16 14 19 60 19 23 26 34 102 Exploration 9 12 10 11 42 39 21 20 21 101 General and administrative 53 55 51 55 214 43 46 42 43 174 Commodity management 39 132 31 6 208 5 8 4 10 27
Net (gain) loss-sales of assets, divestment of transportation contracts or impairment of producing properties (198) (4) 227 (3) 22 (35) (7) (56) (13) (111)Other-net 2 2 10 2 16 4 8 3 - 15
Total costs and expenses 126 437 552 309 1,424 291 344 291 367 1,293
Operating income (loss) 90 (299) (301) (221) (731) 170 69 (67) (129) 43
Interest expense (57) (53) (49) (48) (207) (47) (46) (48) (47) (188)Loss on extinguishment of debt 3 (3) - (1) (1) - - (17) - (17)Investment income and other (1) 2 - 1 2 2 - 2 (1) 3
Income (loss) from continuing operations before income taxes $ 35 $ (353) $ (350) $ (269) $ (937) $ 125 $ 23 $ (130) $ (177) $ (159)Provision (benefit) for income taxes 35 (130) (132) (98) (325) 31 (53) 20 (146) (148)
Income (loss) from continuing operations $ - $ (223) $ (218) $ (171) $ (612) $ 94 $ 76 $ (150) $ (31) $ (11)Income (loss) from discontinued operations (12) 25 (1) (1) 11 (2) - 4 (7) (5)Net income (loss) $ (12) $ (198) $ (219) $ (172) $ (601) $ 92 $ 76 $ (146) $ (38) $ (16)
Less: Dividends on preferred stock 5 6 4 3 18 4 4 3 4 15 Less: Loss on induced conversion of preferred stock - - 22 - 22 - - - - -
Net income (loss) available to WPX Energy, Inc. common stockholders $ (17) $ (204) $ (245) $ (175) $ (641) $ 88 $ 72 $ (149) $ (42) $ (31)
Amounts available to WPX Energy, Inc. common stockholders:Income (loss) from continuing operations $ (5) $ (229) $ (244) $ (174) $ (652) $ 90 $ 72 $ (153) $ (35) $ (26)Income (loss) from discontinued operations (12) 25 (1) (1) 11 (2) - 4 (7) (5)
Net income (loss) $ (17) $ (204) $ (245) $ (175) $ (641) $ 88 $ 72 $ (149) $ (42) $ (31)

Reconciliation-Adjusted Income (Loss) from Continuing Operations (Non-GAAP)
22
2016 2017(Dollars in millions) 1Q 2Q 3Q 4Q YTD 1Q 2Q 3Q 4Q YTD
Reconciliation of adjusted loss from continuing operations available to common stockholders:
Income (loss) from continuing operations available to WPX Energy, Inc. common stockholders - reported $ (5) $ (229) $ (244) $ (174) $ (652) $ 90 $ 72 $ (153) $ (35) $ (26)
Pre-tax adjustments:
Impairments reported in exploration expense $ - $ - $ - $ - $ - $ 23 $ - $ - $ - $ 23
Impairment of inventory $ - $ - $ 4 $ - $ 4 $ - $ - $ - $ - $ -Net (gain) loss-sales of assets, divestment of transportation contracts or impairment of producing properties $ (198) $ (4) $ 227 $ (3) $ 22 $ (35) $ (7) $ (56) $ (13) $ (111)
(Gain) loss on extinguishment of debt $ (3) $ 3 $ - $ 1 $ 1 $ - $ - $ 17 $ - $ 17
Accrual for Denver office lease $ - $ - $ 5 $ - $ 5 $ - $ - $ - $ - $ -
Costs related to severance and relocation $ 3 $ 7 $ 3 $ 2 $ 15 $ - $ - $ - $ - $ -
Previously capitalized costs expensed following credit facility amendment $ 4 $ - $ - $ - $ 4 $ - $ - $ - $ - $ -
Unrealized MTM (gain) loss $ 76 $ 223 $ 20 $ 190 $ 509 $ (208) $ (102) $ 120 $ 191 $ 1
Total pre-tax adjustments $ (118) $ 229 $ 259 $ 190 $ 560 $ (220) $ (109) $ 81 $ 178 $ (70)
Less tax effect for above items $ 43 $ (85) $ (96) $ (71) $ (208) $ 83 $ 40 $ (30) $ (67) $ 25
Impact of state deferred tax rate change $ 14 $ - $ - $ 1 $ 15 $ (6) $ - $ - $ (6) $ (12)
Impact of state tax valuation allowance (annual effective tax rate method) $ 8 $ - $ - $ - $ 8 $ (6) $ (34) $ 36 $ 4 $ -
Impact of federal rate change1 $ - $ - $ - $ - $ - $ - $ - $ - $ (83) $ (83)
Adjustment for estimated annual effective tax rate method $ - $ - $ - $ - $ - $ - $ (26) $ 26 $ - $ -
Loss on induced conversion of preferred stock $ - $ - $ 22 $ - $ 22 $ - $ - $ - $ - $ -
Total adjustments, after tax $ (53) $ 144 $ 185 $ 120 $ 397 $ (149) $ (129) $ 113 $ 26 $ (140)
Adjusted loss from continuing operations available to common stockholders $ (58) $ (85) $ (59) $ (54) $ (255) $ (59) $ (57) $ (40) $ (9) $ (166)
1. Includes $92 million for the provisional impact of the Tax Cuts and Jobs Act offset by the impact of the pretax adjustments above.
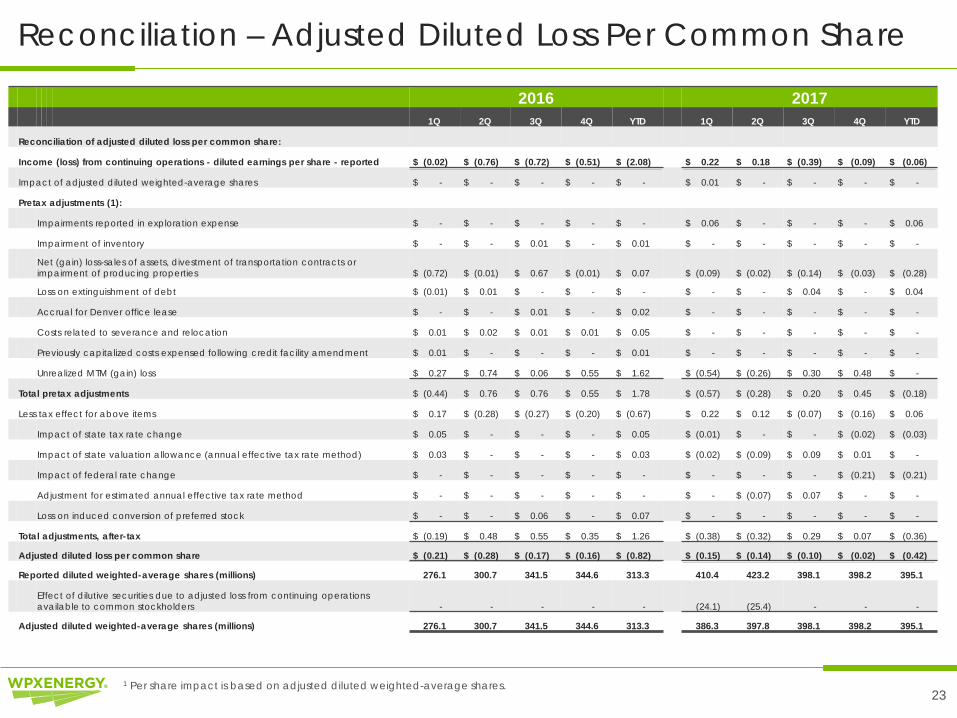
Reconciliation – Adjusted Diluted Loss Per Common Share
23
2016 20171Q 2Q 3Q 4Q YTD 1Q 2Q 3Q 4Q YTD
Reconciliation of adjusted diluted loss per common share:
Income (loss) from continuing operations - diluted earnings per share - reported $ (0.02) $ (0.76) $ (0.72) $ (0.51) $ (2.08) $ 0.22 $ 0.18 $ (0.39) $ (0.09) $ (0.06)
Impact of adjusted diluted weighted-average shares $ - $ - $ - $ - $ - $ 0.01 $ - $ - $ - $ -
Pretax adjustments (1):
Impairments reported in exploration expense $ - $ - $ - $ - $ - $ 0.06 $ - $ - $ - $ 0.06
Impairment of inventory $ - $ - $ 0.01 $ - $ 0.01 $ - $ - $ - $ - $ -
Net (gain) loss-sales of assets, divestment of transportation contracts or impairment of producing properties $ (0.72) $ (0.01) $ 0.67 $ (0.01) $ 0.07 $ (0.09) $ (0.02) $ (0.14) $ (0.03) $ (0.28)
Loss on extinguishment of debt $ (0.01) $ 0.01 $ - $ - $ - $ - $ - $ 0.04 $ - $ 0.04
Accrual for Denver office lease $ - $ - $ 0.01 $ - $ 0.02 $ - $ - $ - $ - $ -
Costs related to severance and relocation $ 0.01 $ 0.02 $ 0.01 $ 0.01 $ 0.05 $ - $ - $ - $ - $ -
Previously capitalized costs expensed following credit facility amendment $ 0.01 $ - $ - $ - $ 0.01 $ - $ - $ - $ - $ -
Unrealized MTM (gain) loss $ 0.27 $ 0.74 $ 0.06 $ 0.55 $ 1.62 $ (0.54) $ (0.26) $ 0.30 $ 0.48 $ -
Total pretax adjustments $ (0.44) $ 0.76 $ 0.76 $ 0.55 $ 1.78 $ (0.57) $ (0.28) $ 0.20 $ 0.45 $ (0.18)
Less tax effect for above items $ 0.17 $ (0.28) $ (0.27) $ (0.20) $ (0.67) $ 0.22 $ 0.12 $ (0.07) $ (0.16) $ 0.06
Impact of state tax rate change $ 0.05 $ - $ - $ - $ 0.05 $ (0.01) $ - $ - $ (0.02) $ (0.03)
Impact of state valuation allowance (annual effective tax rate method) $ 0.03 $ - $ - $ - $ 0.03 $ (0.02) $ (0.09) $ 0.09 $ 0.01 $ -
Impact of federal rate change $ - $ - $ - $ - $ - $ - $ - $ - $ (0.21) $ (0.21)
Adjustment for estimated annual effective tax rate method $ - $ - $ - $ - $ - $ - $ (0.07) $ 0.07 $ - $ -
Loss on induced conversion of preferred stock $ - $ - $ 0.06 $ - $ 0.07 $ - $ - $ - $ - $ -
Total adjustments, after-tax $ (0.19) $ 0.48 $ 0.55 $ 0.35 $ 1.26 $ (0.38) $ (0.32) $ 0.29 $ 0.07 $ (0.36)
Adjusted diluted loss per common share $ (0.21) $ (0.28) $ (0.17) $ (0.16) $ (0.82) $ (0.15) $ (0.14) $ (0.10) $ (0.02) $ (0.42)
Reported diluted weighted-average shares (millions) 276.1 300.7 341.5 344.6 313.3 410.4 423.2 398.1 398.2 395.1
Effect of dilutive securities due to adjusted loss from continuing operations available to common stockholders - - - - - (24.1) (25.4) - - -
Adjusted diluted weighted-average shares (millions) 276.1 300.7 341.5 344.6 313.3 386.3 397.8 398.1 398.2 395.1
1 Per share impact is based on adjusted diluted weighted-average shares.

Reconciliation – Adjusted EBITDAX (Non-GAAP)
24
2016 2017(Dollars in millions) 1Q 2Q 3Q 4Q YTD 1Q 2Q 3Q 4Q YTD
Reconciliation of Adjusted EBITDAX
Net income (loss) - reported $ (12) $ (198) $ (219) $ (172) $ (601) $ 92 $ 76 $ (146) $ (38) $ (16)
Interest expense 57 53 49 48 207 47 46 48 47 188
Provision (benefit) for income taxes 35 (130) (132) (98) (325) 31 (53) 20 (146) (148)
Depreciation, depletion and amortization 152 163 150 158 623 147 171 169 186 673
Exploration expenses 9 12 10 11 42 39 21 20 21 101
EBITDAX 241 (100) (142) (53) (54) 356 261 111 70 798
Accrual for Denver office lease - - 5 - 5 - - - - -Net (gain) loss-sales of assets, divestment of transportation contracts or impairment of producing properties (198) (4) 227 (3) 22 (35) (7) (56) (13) (111)
Loss on extinguishment of debt - - - - - - - 17 - 17
Impairment of inventory - - 4 - 4 - - - - -
Net (gain) loss on derivatives (57) 154 (38) 148 207 (203) (116) 106 210 (3)
Net cash received (paid) related to settlement of derivatives 133 69 58 42 302 (5) 14 14 (19) 4
(Income) loss from discontinued operations 12 (25) 1 1 (11) 2 - (4) 7 5
Adjusted EBITDAX $ 131 $ 94 $ 115 $ 135 $ 475 $ 115 $ 152 $ 188 $ 255 $ 710

DisclaimersThe information contained in this summary has been prepared to assist you in making your own evaluation of the Company and does not purport to contain all of the information you may consider important in deciding whether to invest in shares of the Company’s common stock. In all cases, it is your obligation to conduct your own due diligence. All information contained herein, including any estimates or projections, is based upon information provided by the Company. Any estimates or projections with respect to future performance have been provided to assist you in your evaluation but should not be relied upon as an accurate representation of future results. No persons have been authorized to make any representations other than those contained in this summary, and if given or made, such representations should not be considered as authorized.
Certain statements, estimates and financial information contained in this summary constitute forward-looking statements or information. Such forward-looking statements or information involve known and unknown risks and uncertainties that could cause actual events or results to differ materially from the results implied or expressed in such forward-looking statements or information. While presented with numerical specificity, certain forward-looking statements or information are based (1) upon assumptions that are inherently subject to significant business, economic, regulatory, environmental, seasonal, competitive uncertainties, contingencies and risks including, without limitation, the ability to obtain debt and equity financings, capital costs, construction costs, well production performance, operating costs, commodity pricing, differentials, royalty structures, field upgrading technology, and other known and unknown risks, all of which are difficult to predict and many of which are beyond the Company's control, and (2) upon assumptions with respect to future business decisions that are subject to change.
There can be no assurance that the results implied or expressed in such forward-looking statements or information or the underlying assumptions will be realized and that actual results of operations or future events will not be materially different from the results implied or expressed in such forward-looking statements or information. Under no circumstances should the inclusion of the forward-looking statements or information be regarded as a representation, undertaking, warranty or prediction by the Company or any other person with respect to the accuracy thereof or the accuracy of the underlying assumptions, or that the Company will achieve or is likely to achieve any particular results. The forward-looking statements or information are made as of the date hereof and the Company disclaims any intent or obligation to update publicly or to revise any of the forward-looking statements or information, whether as a result of new information, future events or otherwise. Recipients are cautioned that forward-looking statements or information are not guarantees of future performance and, accordingly, recipients are expressly cautioned not to put undue reliance on forward-looking statements or information due to the inherent uncertainty therein.
25
The SEC requires oil and gas companies, in filings made with the SEC, to disclose proved reserves, which are those quantities of oil and gas, which, by analysis of geoscience and engineering data, can be estimated with reasonable certainty to be economically producible – from a given date forward, from known reservoirs, under existing economic conditions, operating methods, and governmental regulations. The SEC permits the optional disclosure of probable and possible reserves. We have elected to use in this presentation “probable” reserves and “possible” reserves, excluding their valuation. The SEC defines “probable” reserves as “those additional reserves that are less certain to be recovered than proved reserves but which, together with proved reserves, are as likely as not to be recovered.” The SEC defines “possible” reserves as “those additional reserves that are less certain to be recovered than probable reserves.” The Company has applied these definitions in estimating probable and possible reserves. Statements of reserves are only estimates and may not correspond to the ultimate quantities of oil and gas recovered. Any reserve estimates provided in this presentation that are not specifically designated as being estimates of proved reserves may include estimated reserves not necessarily calculated in accordance with, or contemplated by, the SEC’s reserves reporting guidelines. Investors are urged to consider closely the disclosure regarding our business that may be accessed through the SEC’s website at www.sec.gov.
The SEC’s rules prohibit us from filing resource estimates. Our resource estimations include estimates of hydrocarbon quantities for (i) new areas for which we do not have sufficient information to date to classify as proved, probable or even possible reserves, (ii) other areas to take into account the low level of certainty of recovery of the resources and (iii) uneconomic proved, probable or possible reserves. Resource estimates do not take into account the certainty of resource recovery and are therefore not indicative of the expected future recovery and should not be relied upon. Resource estimates might never be recovered and are contingent on exploration success, technical improvements in drilling access, commerciality and other factors.
This presentation may include certain financial measures, including adjusted EBITDAX (earnings before interest, taxes, depreciation, depletion, amortization and exploration expenses), that are non-GAAP financial measures as defined under the rules of the Securities and Exchange Commission.
This presentation is accompanied by a reconciliation of these non-GAAP financial measures to their nearest GAAP financial measures. Management uses these financial measures because they are widely accepted financial indicators used by investors to compare a company’s performance. Management believes that these measures provide investors an enhanced perspective of the operating performance of the company and aid investor understanding. Management also believes that these non-GAAP measures provide useful information regarding our ability to meet future debt service, capital expenditures and working capital requirements. These non-GAAP financial measures should not be considered in isolation or as substitutes for a measure of performance prepared in accordance with United States generally accepted accounting principles.
Reserves Disclaimer
WPX Non-GAAP Disclaimer