1cm validscale: A Stata module to validate subjective ... · validscale: A Stata module to validate...
42
validscale: A Stata module to validate subjective measurement scales using Classical Test Theory Bastien Perrot, Emmanuelle Bataille, Jean-Benoit Hardouin UMR INSERM U1246 - SPHERE "methodS in Patient-centered outcomes and HEalth ResEarch", University of Nantes, University of Tours, France [email protected] French Stata Users Group Meeting, July 6, 2017 1 / 22 validscale N
Transcript of 1cm validscale: A Stata module to validate subjective ... · validscale: A Stata module to validate...

validscale: A Stata module to validate subjectivemeasurement scales using Classical Test Theory
Bastien Perrot, Emmanuelle Bataille, Jean-Benoit Hardouin
UMR INSERM U1246 - SPHERE "methodS in Patient-centered outcomes and HEalthResEarch", University of Nantes, University of Tours, France
French Stata Users Group Meeting, July 6, 2017
1 / 22validscale
N

Context
We use questionnaires to measure non-observable characteristics/traits
personality traitsaptitudes, intelligencequality of life...
The questionnaires are subjective measurement scales providing one orseveral scores based on the sum (or mean) of responses to items (binary orordinal variables)
2 / 22validscale
N
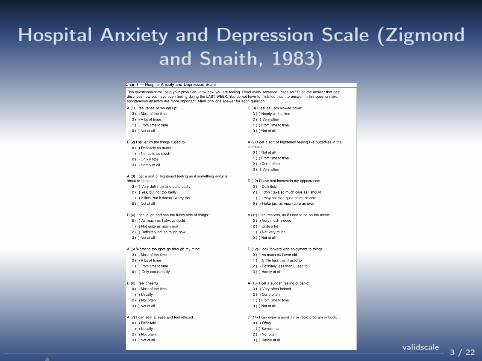
Hospital Anxiety and Depression Scale (Zigmondand Snaith, 1983)
3 / 22validscale
N

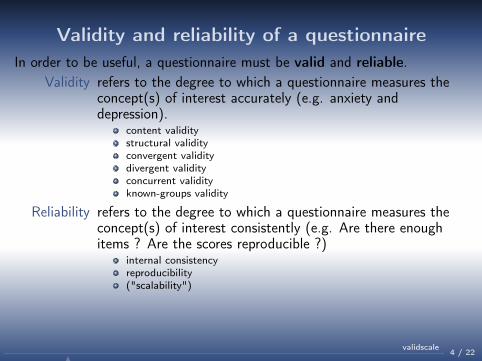
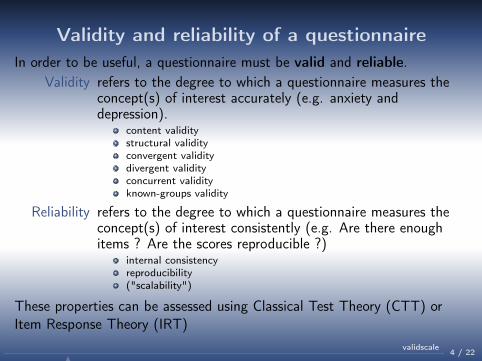
Validity and reliability of a questionnaireIn order to be useful, a questionnaire must be valid and reliable.
Validity refers to the degree to which a questionnaire measures theconcept(s) of interest accurately (e.g. anxiety anddepression).
content validitystructural validityconvergent validitydivergent validityconcurrent validityknown-groups validity
Reliability refers to the degree to which a questionnaire measures theconcept(s) of interest consistently (e.g. Are there enoughitems ? Are the scores reproducible ?)
internal consistencyreproducibility("scalability")
These properties can be assessed using Classical Test Theory (CTT) orItem Response Theory (IRT)
4 / 22validscale
N
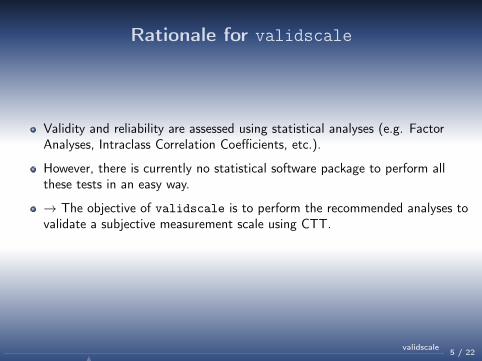
Rationale for validscale
Validity and reliability are assessed using statistical analyses (e.g. FactorAnalyses, Intraclass Correlation Coefficients, etc.).
However, there is currently no statistical software package to perform allthese tests in an easy way.
→ The objective of validscale is to perform the recommended analyses tovalidate a subjective measurement scale using CTT.
5 / 22validscale
N
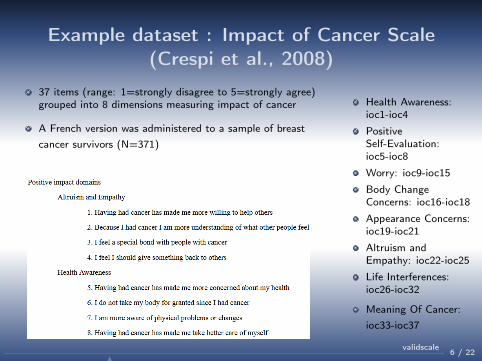
Example dataset : Impact of Cancer Scale(Crespi et al., 2008)
37 items (range: 1=strongly disagree to 5=strongly agree)grouped into 8 dimensions measuring impact of cancer
A French version was administered to a sample of breastcancer survivors (N=371)
Health Awareness:ioc1-ioc4
PositiveSelf-Evaluation:ioc5-ioc8
Worry: ioc9-ioc15
Body ChangeConcerns: ioc16-ioc18
Appearance Concerns:ioc19-ioc21
Altruism andEmpathy: ioc22-ioc25
Life Interferences:ioc26-ioc32
Meaning Of Cancer:ioc33-ioc37
6 / 22validscale
N
Syntax
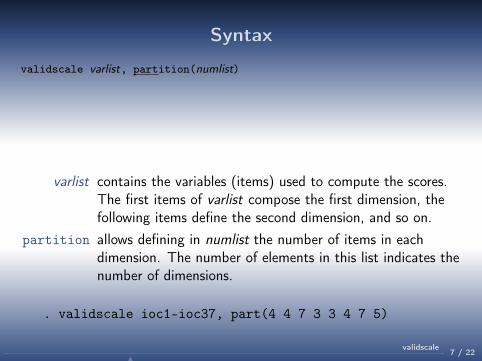
validscale varlist, partition(numlist)
[scorename(string) scores(varlist)
categories(numlist) impute(method) noround compscore(method) descitemsgraphs cfa cfamethod(method) cfasb cfastand cfanocovdim cfacovs(string)cfarmsea(#) cfacfi(#) cfaor convdiv tconvdiv(#) convdivboxplotsalpha(#) delta(#) h(#) hjmin(#) repet(varlist) kappa ickappa(#)scores2(#) kgv(varlist) kgvboxplots kgvgroupboxplots conc(varlist)tconc(#)
]
varlist contains the variables (items) used to compute the scores.The first items of varlist compose the first dimension, thefollowing items define the second dimension, and so on.
partition allows defining in numlist the number of items in eachdimension. The number of elements in this list indicates thenumber of dimensions.
. validscale ioc1-ioc37, part(4 4 7 3 3 4 7 5)
7 / 22validscale
N
Syntax
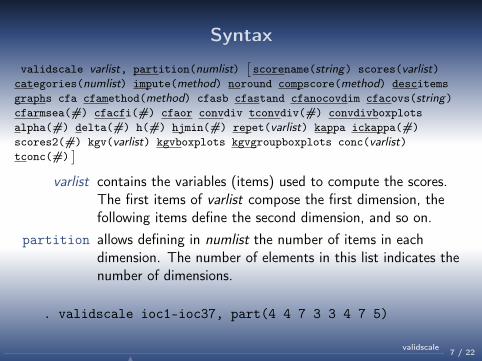
validscale varlist, partition(numlist)[scorename(string) scores(varlist)
categories(numlist) impute(method) noround compscore(method) descitemsgraphs cfa cfamethod(method) cfasb cfastand cfanocovdim cfacovs(string)cfarmsea(#) cfacfi(#) cfaor convdiv tconvdiv(#) convdivboxplotsalpha(#) delta(#) h(#) hjmin(#) repet(varlist) kappa ickappa(#)scores2(#) kgv(varlist) kgvboxplots kgvgroupboxplots conc(varlist)tconc(#)
]varlist contains the variables (items) used to compute the scores.
The first items of varlist compose the first dimension, thefollowing items define the second dimension, and so on.
partition allows defining in numlist the number of items in eachdimension. The number of elements in this list indicates thenumber of dimensions.
. validscale ioc1-ioc37, part(4 4 7 3 3 4 7 5)
7 / 22validscale
N
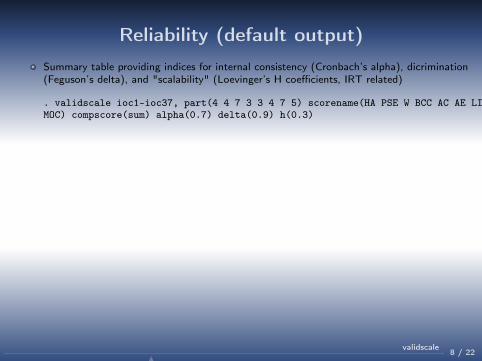
Reliability (default output)Summary table providing indices for internal consistency (Cronbach’s alpha), dicrimination(Feguson’s delta), and "scalability" (Loevinger’s H coefficients, IRT related)
. validscale ioc1-ioc37, part(4 4 7 3 3 4 7 5) scorename(HA PSE W BCC AC AE LIMOC) compscore(sum) alpha(0.7) delta(0.9) h(0.3)
Items used to compute the scoresHA : ioc1 ioc2 ioc3 ioc4PSE : ioc5 ioc6 ioc7 ioc8W : ioc9 ioc10 ioc11 ioc12 ioc13 ioc14 ioc15BCC : ioc16 ioc17 ioc18AC : ioc19 ioc20 ioc21AE : ioc22 ioc23 ioc24 ioc25LI : ioc26 ioc27 ioc28 ioc29 ioc30 ioc31 ioc32MOC : ioc33 ioc34 ioc35 ioc36 ioc37Number of observations: 371
Reliability
n alpha delta H Hj_minHA 369 0.67 0.94 0.35 0.25 (item ioc1)PSE 368 0.69 0.96 0.39 0.30W 369 0.90 0.99 0.62 0.59BCC 369 0.79 0.97 0.61 0.58AC 369 0.81 0.97 0.62 0.60AE 368 0.71 0.94 0.43 0.34LI 367 0.81 0.97 0.42 0.29 (item ioc26)MOC 363 0.83 0.97 0.53 0.38
8 / 22validscale
N
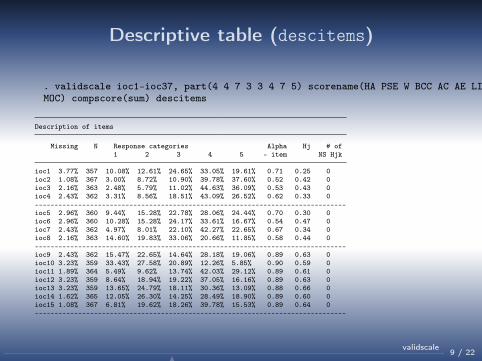
Descriptive table (descitems)
. validscale ioc1-ioc37, part(4 4 7 3 3 4 7 5) scorename(HA PSE W BCC AC AE LIMOC) compscore(sum) descitems
Description of items
Missing N Response categories Alpha Hj # of1 2 3 4 5 - item NS Hjk
ioc1 3.77% 357 10.08% 12.61% 24.65% 33.05% 19.61% 0.71 0.25 0ioc2 1.08% 367 3.00% 8.72% 10.90% 39.78% 37.60% 0.52 0.42 0ioc3 2.16% 363 2.48% 5.79% 11.02% 44.63% 36.09% 0.53 0.43 0ioc4 2.43% 362 3.31% 8.56% 18.51% 43.09% 26.52% 0.62 0.33 0-------------------------------------------------------------------------------ioc5 2.96% 360 9.44% 15.28% 22.78% 28.06% 24.44% 0.70 0.30 0ioc6 2.96% 360 10.28% 15.28% 24.17% 33.61% 16.67% 0.54 0.47 0ioc7 2.43% 362 4.97% 8.01% 22.10% 42.27% 22.65% 0.67 0.34 0ioc8 2.16% 363 14.60% 19.83% 33.06% 20.66% 11.85% 0.58 0.44 0-------------------------------------------------------------------------------ioc9 2.43% 362 15.47% 22.65% 14.64% 28.18% 19.06% 0.89 0.63 0ioc10 3.23% 359 33.43% 27.58% 20.89% 12.26% 5.85% 0.90 0.59 0ioc11 1.89% 364 5.49% 9.62% 13.74% 42.03% 29.12% 0.89 0.61 0ioc12 3.23% 359 8.64% 18.94% 19.22% 37.05% 16.16% 0.89 0.63 0ioc13 3.23% 359 13.65% 24.79% 18.11% 30.36% 13.09% 0.88 0.66 0ioc14 1.62% 365 12.05% 26.30% 14.25% 28.49% 18.90% 0.89 0.60 0ioc15 1.08% 367 6.81% 19.62% 18.26% 39.78% 15.53% 0.89 0.64 0-------------------------------------------------------------------------------
9 / 22validscale
N

Descriptive graphs (graph)
. validscale ioc1-ioc37, part(4 4 7 3 3 4 7 5) scorename(HA PSE W BCC AC AE LIMOC) compscore(sum) graph
010
2030
Per
cent
1 2 3 4 5HA
05
1015
2025
Per
cent
1 2 3 4 5PSE
05
1015
20P
erce
nt
1 2 3 4 5W
05
1015
20P
erce
nt
1 2 3 4 5BCC
05
1015
20P
erce
nt
1 2 3 4 5AC
010
2030
Per
cent
1 2 3 4 5AE
010
2030
Per
cent
1 2 3 4 5LI
05
1015
2025
Per
cent
1 2 3 4 5MOC
Figure: Histograms of scores 10 / 22validscale
N

Descriptive graphs (graph)
. validscale ioc1-ioc37, part(4 4 7 3 3 4 7 5) scorename(HA PSE W BCC AC AE LIMOC) compscore(sum) graph
HA
PSE
W
BCCAC
AE
LI
MOC
-3-2
-10
12
-1 0 1 2 3 4
Figure: Correlations between scores 10 / 22validscale
N
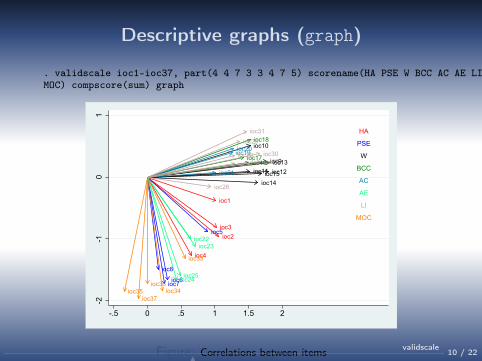
Descriptive graphs (graph)
. validscale ioc1-ioc37, part(4 4 7 3 3 4 7 5) scorename(HA PSE W BCC AC AE LIMOC) compscore(sum) graph
ioc1
ioc2ioc3
ioc4
ioc5
ioc6ioc7
ioc8
ioc9
ioc10
ioc11 ioc12ioc13
ioc14ioc15
ioc16ioc17
ioc18
ioc19ioc20
ioc21
ioc22ioc23
ioc24ioc25
ioc26
ioc27
ioc28
ioc29 ioc30
ioc31
ioc32
ioc33
ioc34ioc35ioc36
ioc37
HA
PSE
W
BCC
AC
AE
LI
MOC
-2-1
01
-.5 0 .5 1 1.5 2
Figure: Correlations between items 10 / 22validscale
N

Confirmatory Factor Analysis (cfa)How well the supposed structure (number of dimensions, clustering of items) fit the data ?
→ Confirmatory Factor Analysis (based on the sem command)
Some criteria based of fit indices: Root Mean Square Error of Approximation (RMSEA) <0.06, Comparative Fit Index (CFI) > 0.95
. validscale ioc1-ioc37, part(4 4 7 3 3 4 7 5) scorename(HA PSE W BCC AC AE LI MOC) cfa cfacov(ioc1*ioc3)
Confirmatory factor analysis
Warning: some items have less than 7 response categories. If multivariatenormality assumption does not hold, maximum likelihood estimation might notbe appropriate. Consider using cfasb in order to apply Satorra-Bentleradjustment or using cfamethod(adf).
Covariances between errors added: e.ioc1*e.ioc3Number of used individuals: 292Item Dimension Factor Standard Intercept Standard Error Variance of
loading error error variance dimension
ioc1 HA 1.00 . 3.36 0.07 1.33 0.16ioc2 HA 2.05 0.46 3.95 0.06 0.45ioc3 HA 1.53 0.31 4.01 0.06 0.55ioc4 HA 1.47 0.34 3.77 0.06 0.68ioc5 PSE 1.00 . 3.42 0.07 1.32 0.32ioc6 PSE 1.56 0.24 3.27 0.07 0.69ioc7 PSE 1.15 0.20 3.70 0.06 0.66ioc8 PSE 1.37 0.22 2.91 0.07 0.80
(output omitted)
Goodness of fit:chi2 df chi2/df RMSEA [90% CI] SRMR NFI
1103.86 600 1.8 0.054 [0.049 ; 0.059] 0.074 0.796(p-value = 0.000)
RNI CFI IFI MCI0.894 0.894 0.895 0.421
11 / 22validscale
N

Confirmatory Factor Analysis (cfa)How well the supposed structure (number of dimensions, clustering of items) fit the data ?
→ Confirmatory Factor Analysis (based on the sem command)
Some criteria based of fit indices: Root Mean Square Error of Approximation (RMSEA) <0.06, Comparative Fit Index (CFI) > 0.95
. validscale ioc1-ioc37, part(4 4 7 3 3 4 7 5) scorename(HA PSE W BCC AC AE LI MOC) cfa cfacov(ioc1*ioc3)
Confirmatory factor analysis
Warning: some items have less than 7 response categories. If multivariatenormality assumption does not hold, maximum likelihood estimation might notbe appropriate. Consider using cfasb in order to apply Satorra-Bentleradjustment or using cfamethod(adf).
Covariances between errors added: e.ioc1*e.ioc3Number of used individuals: 292Item Dimension Factor Standard Intercept Standard Error Variance of
loading error error variance dimension
ioc1 HA 1.00 . 3.36 0.07 1.33 0.16ioc2 HA 2.05 0.46 3.95 0.06 0.45ioc3 HA 1.53 0.31 4.01 0.06 0.55ioc4 HA 1.47 0.34 3.77 0.06 0.68ioc5 PSE 1.00 . 3.42 0.07 1.32 0.32ioc6 PSE 1.56 0.24 3.27 0.07 0.69ioc7 PSE 1.15 0.20 3.70 0.06 0.66ioc8 PSE 1.37 0.22 2.91 0.07 0.80
(output omitted)
Goodness of fit:chi2 df chi2/df RMSEA [90% CI] SRMR NFI
1103.86 600 1.8 0.054 [0.049 ; 0.059] 0.074 0.796(p-value = 0.000)
RNI CFI IFI MCI0.894 0.894 0.895 0.421 11 / 22
validscaleN

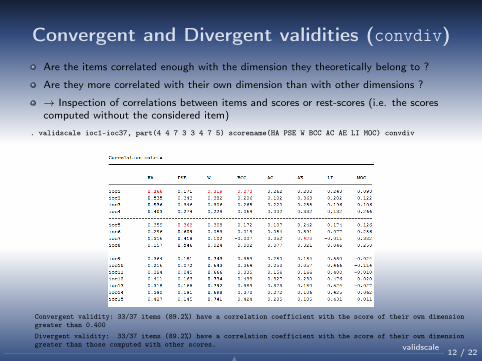
Convergent and Divergent validities (convdiv)Are the items correlated enough with the dimension they theoretically belong to ?
Are they more correlated with their own dimension than with other dimensions ?
→ Inspection of correlations between items and scores or rest-scores (i.e. the scorescomputed without the considered item)
. validscale ioc1-ioc37, part(4 4 7 3 3 4 7 5) scorename(HA PSE W BCC AC AE LI MOC) convdiv
Convergent validity: 33/37 items (89.2%) have a correlation coefficient with the score of their own dimensiongreater than 0.400Divergent validity: 33/37 items (89.2%) have a correlation coefficient with the score of their own dimensiongreater than those computed with other scores.
12 / 22validscale
N

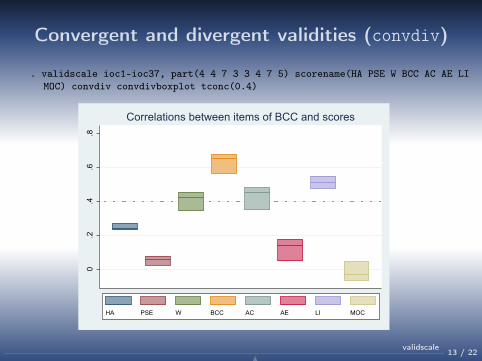
Convergent and divergent validities (convdiv)
. validscale ioc1-ioc37, part(4 4 7 3 3 4 7 5) scorename(HA PSE W BCC AC AE LIMOC) convdiv convdivboxplot tconc(0.4)
0.2
.4.6
Correlations between items of HA and scores
HA PSE W BCC AC AE LI MOC
13 / 22validscale
N
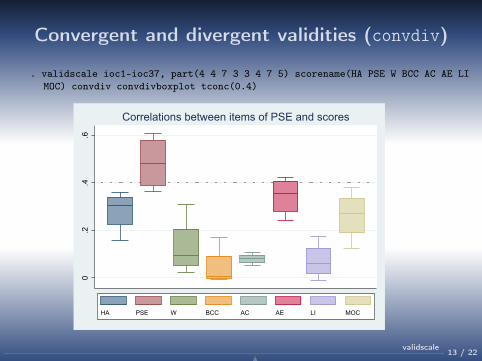
Convergent and divergent validities (convdiv)
. validscale ioc1-ioc37, part(4 4 7 3 3 4 7 5) scorename(HA PSE W BCC AC AE LIMOC) convdiv convdivboxplot tconc(0.4)
0.2
.4.6
Correlations between items of PSE and scores
HA PSE W BCC AC AE LI MOC
13 / 22validscale
N
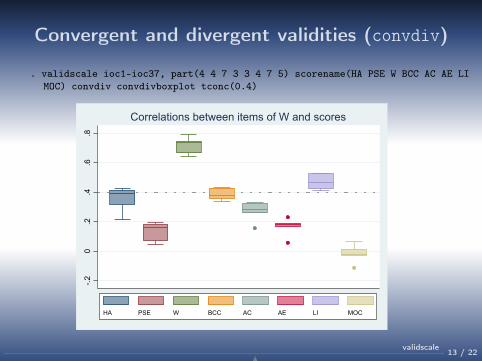
Convergent and divergent validities (convdiv)
. validscale ioc1-ioc37, part(4 4 7 3 3 4 7 5) scorename(HA PSE W BCC AC AE LIMOC) convdiv convdivboxplot tconc(0.4)
-.20
.2.4
.6.8
Correlations between items of W and scores
HA PSE W BCC AC AE LI MOC
13 / 22validscale
N
Convergent and divergent validities (convdiv)
. validscale ioc1-ioc37, part(4 4 7 3 3 4 7 5) scorename(HA PSE W BCC AC AE LIMOC) convdiv convdivboxplot tconc(0.4)
0.2
.4.6
.8
Correlations between items of BCC and scores
HA PSE W BCC AC AE LI MOC
13 / 22validscale
N
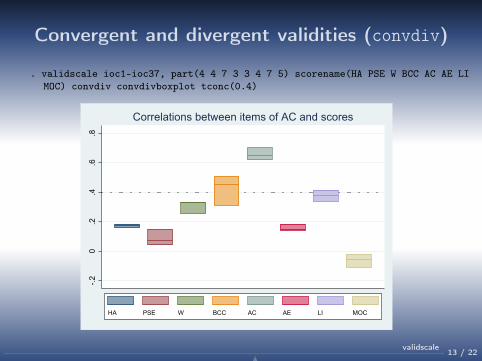
Convergent and divergent validities (convdiv)
. validscale ioc1-ioc37, part(4 4 7 3 3 4 7 5) scorename(HA PSE W BCC AC AE LIMOC) convdiv convdivboxplot tconc(0.4)
-.20
.2.4
.6.8
Correlations between items of AC and scores
HA PSE W BCC AC AE LI MOC
13 / 22validscale
N
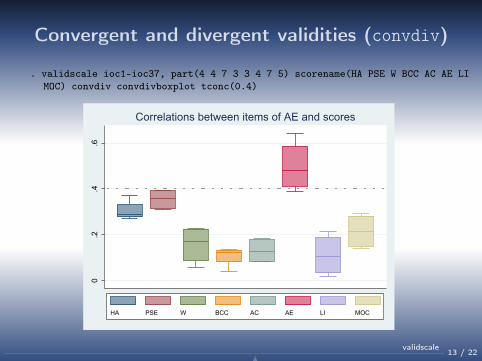
Convergent and divergent validities (convdiv)
. validscale ioc1-ioc37, part(4 4 7 3 3 4 7 5) scorename(HA PSE W BCC AC AE LIMOC) convdiv convdivboxplot tconc(0.4)
0.2
.4.6
Correlations between items of AE and scores
HA PSE W BCC AC AE LI MOC
13 / 22validscale
N
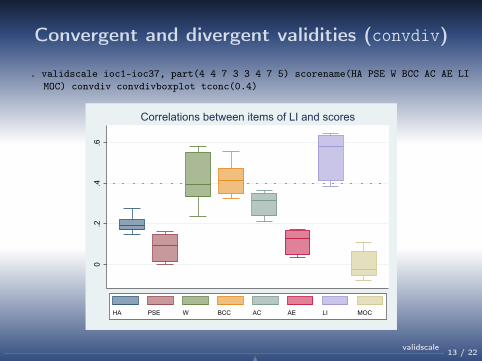
Convergent and divergent validities (convdiv)
. validscale ioc1-ioc37, part(4 4 7 3 3 4 7 5) scorename(HA PSE W BCC AC AE LIMOC) convdiv convdivboxplot tconc(0.4)
0.2
.4.6
Correlations between items of LI and scores
HA PSE W BCC AC AE LI MOC
13 / 22validscale
N
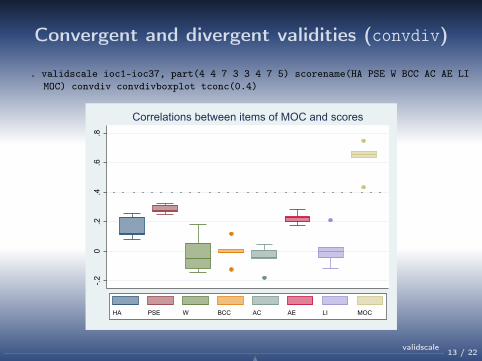
Convergent and divergent validities (convdiv)
. validscale ioc1-ioc37, part(4 4 7 3 3 4 7 5) scorename(HA PSE W BCC AC AE LIMOC) convdiv convdivboxplot tconc(0.4)
-.20
.2.4
.6.8
Correlations between items of MOC and scores
HA PSE W BCC AC AE LI MOC
13 / 22validscale
N
Reproducibility (repet)
Are the scores and items reproducible in time ?
→ Intraclass Correlation Coefficients (ICC) for reproducibility of scores;kappa’s coefficients for reproducibility of items
. validscale ioc1-ioc37, part(4 4 7 3 3 4 7 5) scorename(HA PSE W BCC AC AE LIMOC) repet(ioc1_2-ioc37_2) kappa ickappa(500)
Reproducibility
Dimension n Item Kappa 95% CI for Kappa ICC 95% CI for ICC(bootstrapped)
HA 368 ioc1 0.57 [ 0.50 ; 0.63] 0.93 [ 0.92 ; 0.95]ioc2 0.56 [ 0.50 ; 0.63]ioc3 0.54 [ 0.48 ; 0.61]ioc4 0.62 [ 0.56 ; 0.67]
PSE 367 ioc5 0.59 [ 0.50 ; 0.63] 0.94 [ 0.93 ; 0.95]ioc6 0.58 [ 0.52 ; 0.63]ioc7 0.55 [ 0.49 ; 0.61]ioc8 0.61 [ 0.55 ; 0.67]
W 366 ioc9 0.60 [ 0.48 ; 0.61] 0.98 [ 0.97 ; 0.98]ioc10 0.55 [ 0.48 ; 0.61]ioc11 0.56 [ 0.50 ; 0.63]ioc12 0.62 [ 0.56 ; 0.68]ioc13 0.65 [ 0.58 ; 0.71]ioc14 0.63 [ 0.57 ; 0.69]ioc15 0.56 [ 0.50 ; 0.62]
14 / 22validscale
N
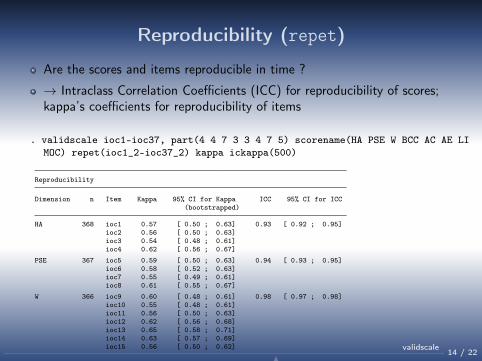
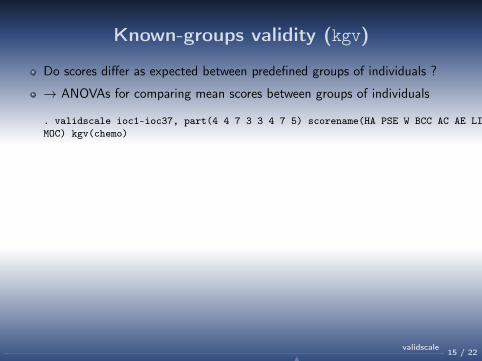
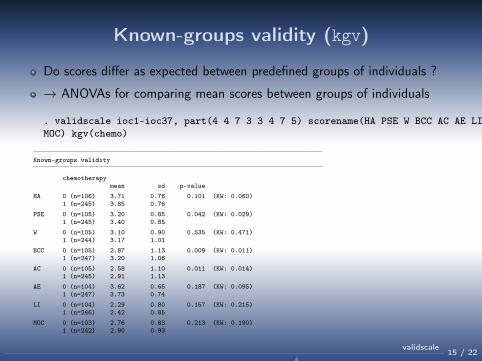
Known-groups validity (kgv)
Do scores differ as expected between predefined groups of individuals ?
→ ANOVAs for comparing mean scores between groups of individuals
. validscale ioc1-ioc37, part(4 4 7 3 3 4 7 5) scorename(HA PSE W BCC AC AE LIMOC) kgv(chemo)
Known-groups validity
chemotherapymean sd p-value
HA 0 (n=106) 3.71 0.76 0.101 (KW: 0.060)1 (n=245) 3.85 0.76
PSE 0 (n=105) 3.20 0.85 0.042 (KW: 0.029)1 (n=245) 3.40 0.85
W 0 (n=105) 3.10 0.90 0.535 (KW: 0.471)1 (n=244) 3.17 1.01
BCC 0 (n=105) 2.87 1.13 0.009 (KW: 0.011)1 (n=247) 3.20 1.06
AC 0 (n=105) 2.58 1.10 0.011 (KW: 0.014)1 (n=245) 2.91 1.13
AE 0 (n=104) 3.62 0.65 0.187 (KW: 0.095)1 (n=247) 3.73 0.74
LI 0 (n=104) 2.29 0.80 0.157 (KW: 0.215)1 (n=246) 2.42 0.85
MOC 0 (n=103) 2.76 0.83 0.213 (KW: 0.190)1 (n=242) 2.90 0.93
15 / 22validscale
N
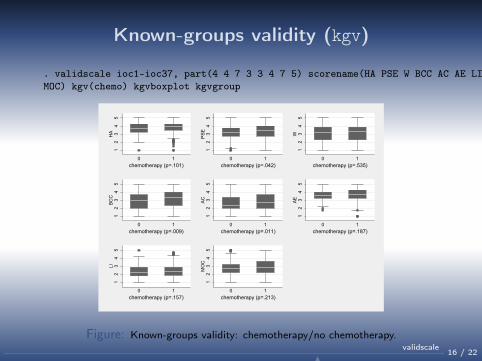
Known-groups validity (kgv)
. validscale ioc1-ioc37, part(4 4 7 3 3 4 7 5) scorename(HA PSE W BCC AC AE LIMOC) kgv(chemo) kgvboxplot kgvgroup
12
34
5H
A
0 1chemotherapy (p=.101)
12
34
5P
SE
0 1chemotherapy (p=.042)
12
34
5W
0 1chemotherapy (p=.535)
12
34
5B
CC
0 1chemotherapy (p=.009)
12
34
5A
C
0 1chemotherapy (p=.011)
12
34
5A
E
0 1chemotherapy (p=.187)
12
34
5LI
0 1chemotherapy (p=.157)
12
34
5M
OC
0 1chemotherapy (p=.213)
Figure: Known-groups validity: chemotherapy/no chemotherapy.
16 / 22validscale
N
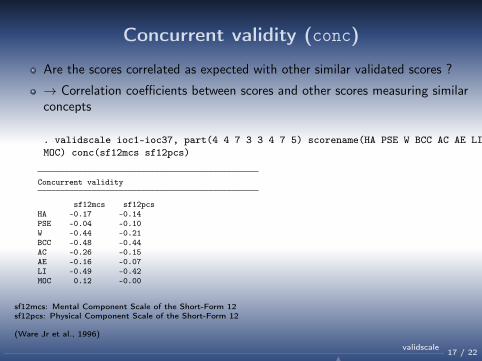
Concurrent validity (conc)
Are the scores correlated as expected with other similar validated scores ?
→ Correlation coefficients between scores and other scores measuring similarconcepts
. validscale ioc1-ioc37, part(4 4 7 3 3 4 7 5) scorename(HA PSE W BCC AC AE LIMOC) conc(sf12mcs sf12pcs)
Concurrent validity
sf12mcs sf12pcsHA -0.17 -0.14PSE -0.04 -0.10W -0.44 -0.21BCC -0.48 -0.44AC -0.26 -0.15AE -0.16 -0.07LI -0.49 -0.42MOC 0.12 -0.00
sf12mcs: Mental Component Scale of the Short-Form 12sf12pcs: Physical Component Scale of the Short-Form 12
(Ware Jr et al., 1996)
17 / 22validscale
N
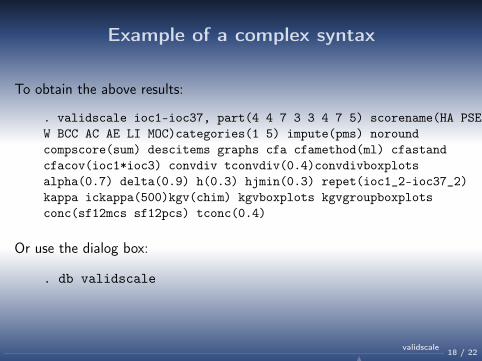
Example of a complex syntax
To obtain the above results:
. validscale ioc1-ioc37, part(4 4 7 3 3 4 7 5) scorename(HA PSEW BCC AC AE LI MOC)categories(1 5) impute(pms) noroundcompscore(sum) descitems graphs cfa cfamethod(ml) cfastandcfacov(ioc1*ioc3) convdiv tconvdiv(0.4)convdivboxplotsalpha(0.7) delta(0.9) h(0.3) hjmin(0.3) repet(ioc1_2-ioc37_2)kappa ickappa(500)kgv(chim) kgvboxplots kgvgroupboxplotsconc(sf12mcs sf12pcs) tconc(0.4)
Or use the dialog box:
. db validscale
18 / 22validscale
N

Dialog box
19 / 22validscale
N

Dialog box
19 / 22validscale
N

Summary
validscale performs the recommended analyses (under CTT) to assess thereliability and validity of a questionnaire
A dialog box allows using the command in a user-friendly way (type . dbvalidscale)
Warning/error messages are displayed to help the user during the analysis
ssc install validscale
20 / 22validscale
N
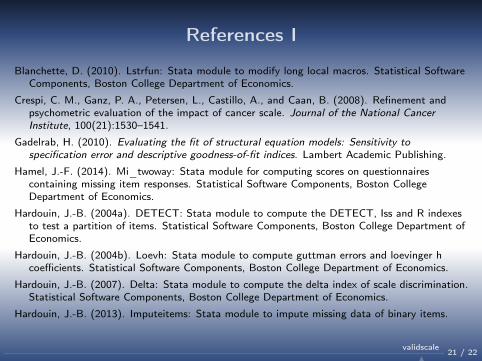
References I
Blanchette, D. (2010). Lstrfun: Stata module to modify long local macros. Statistical SoftwareComponents, Boston College Department of Economics.
Crespi, C. M., Ganz, P. A., Petersen, L., Castillo, A., and Caan, B. (2008). Refinement andpsychometric evaluation of the impact of cancer scale. Journal of the National CancerInstitute, 100(21):1530–1541.
Gadelrab, H. (2010). Evaluating the fit of structural equation models: Sensitivity tospecification error and descriptive goodness-of-fit indices. Lambert Academic Publishing.
Hamel, J.-F. (2014). Mi_twoway: Stata module for computing scores on questionnairescontaining missing item responses. Statistical Software Components, Boston CollegeDepartment of Economics.
Hardouin, J.-B. (2004a). DETECT: Stata module to compute the DETECT, Iss and R indexesto test a partition of items. Statistical Software Components, Boston College Department ofEconomics.
Hardouin, J.-B. (2004b). Loevh: Stata module to compute guttman errors and loevinger hcoefficients. Statistical Software Components, Boston College Department of Economics.
Hardouin, J.-B. (2007). Delta: Stata module to compute the delta index of scale discrimination.Statistical Software Components, Boston College Department of Economics.
Hardouin, J.-B. (2013). Imputeitems: Stata module to impute missing data of binary items.
21 / 22validscale
N
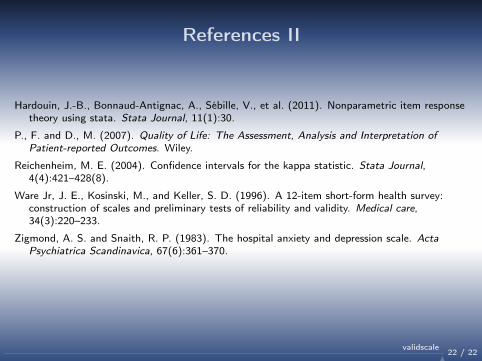
References II
Hardouin, J.-B., Bonnaud-Antignac, A., Sébille, V., et al. (2011). Nonparametric item responsetheory using stata. Stata Journal, 11(1):30.
P., F. and D., M. (2007). Quality of Life: The Assessment, Analysis and Interpretation ofPatient-reported Outcomes. Wiley.
Reichenheim, M. E. (2004). Confidence intervals for the kappa statistic. Stata Journal,4(4):421–428(8).
Ware Jr, J. E., Kosinski, M., and Keller, S. D. (1996). A 12-item short-form health survey:construction of scales and preliminary tests of reliability and validity. Medical care,34(3):220–233.
Zigmond, A. S. and Snaith, R. P. (1983). The hospital anxiety and depression scale. ActaPsychiatrica Scandinavica, 67(6):361–370.
22 / 22validscale
N