1997 Chief Financial Officers Report
36
1997 Chief Financial Officers Report (Audited) Office of Thrift Supervision
Transcript of 1997 Chief Financial Officers Report
1997 Chief FinancialOfficers Report
(Audited)
Office of ThriftSupervision
Table of Contents
Page
• • Message from the Director 1
• • Profile of the OTS 3
• • Thrift Industry Highlights 7 • • Management’s Discussion and Analysis of OTS’ Financial Performance 12
• • Independent Auditor’s Report 17
• • Financial Statements 19 • • Notes to Financial Statements 22
• • Independent Auditor’s Report on Internal Control Structure 31
• • Independent Auditor’s Report on Compliance with Laws and Regulations 33
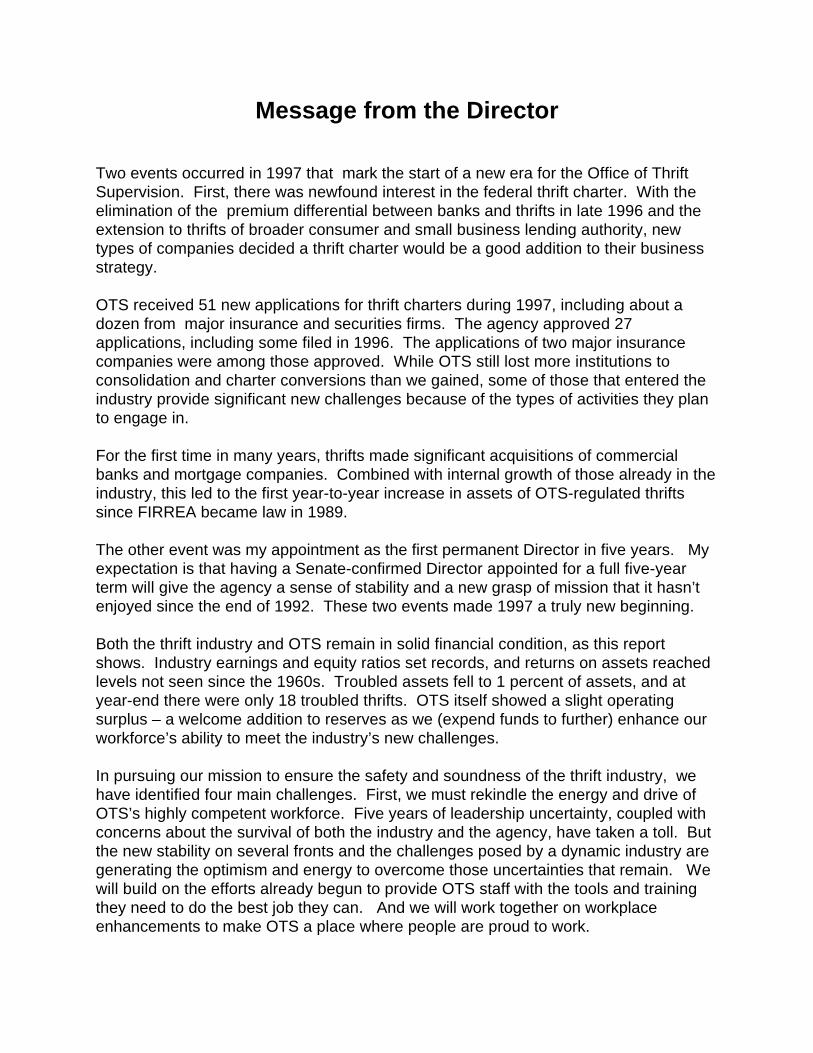
Message from the Director
Two events occurred in 1997 that mark the start of a new era for the Office of ThriftSupervision. First, there was newfound interest in the federal thrift charter. With theelimination of the premium differential between banks and thrifts in late 1996 and theextension to thrifts of broader consumer and small business lending authority, newtypes of companies decided a thrift charter would be a good addition to their businessstrategy.
OTS received 51 new applications for thrift charters during 1997, including about adozen from major insurance and securities firms. The agency approved 27applications, including some filed in 1996. The applications of two major insurancecompanies were among those approved. While OTS still lost more institutions toconsolidation and charter conversions than we gained, some of those that entered theindustry provide significant new challenges because of the types of activities they planto engage in.
For the first time in many years, thrifts made significant acquisitions of commercialbanks and mortgage companies. Combined with internal growth of those already in theindustry, this led to the first year-to-year increase in assets of OTS-regulated thriftssince FIRREA became law in 1989.
The other event was my appointment as the first permanent Director in five years. Myexpectation is that having a Senate-confirmed Director appointed for a full five-yearterm will give the agency a sense of stability and a new grasp of mission that it hasn’tenjoyed since the end of 1992. These two events made 1997 a truly new beginning.
Both the thrift industry and OTS remain in solid financial condition, as this reportshows. Industry earnings and equity ratios set records, and returns on assets reachedlevels not seen since the 1960s. Troubled assets fell to 1 percent of assets, and atyear-end there were only 18 troubled thrifts. OTS itself showed a slight operatingsurplus – a welcome addition to reserves as we (expend funds to further) enhance ourworkforce’s ability to meet the industry’s new challenges.
In pursuing our mission to ensure the safety and soundness of the thrift industry, wehave identified four main challenges. First, we must rekindle the energy and drive ofOTS’s highly competent workforce. Five years of leadership uncertainty, coupled withconcerns about the survival of both the industry and the agency, have taken a toll. Butthe new stability on several fronts and the challenges posed by a dynamic industry aregenerating the optimism and energy to overcome those uncertainties that remain. Wewill build on the efforts already begun to provide OTS staff with the tools and trainingthey need to do the best job they can. And we will work together on workplaceenhancements to make OTS a place where people are proud to work.
7
THRIFT INDUSTRY HIGHLIGHTS
The thrift industry is not the same industry that existed when FIRREA was enacted in1989. It is smaller, but much healthier financially, well capitalized, profitable and highlyfocused in meeting community lending needs — principally mortgage financing. Theindustry’s earnings have been strong since 1992. During 1997 the thrift industry benefitedfrom two factors:
• a favorable economy, and• 1997 was the first year since the passage of the Reform, Recovery, and Enforcement
Act (FIRREA) that thrifts did not have to pay high premiums for federal depositinsurance.
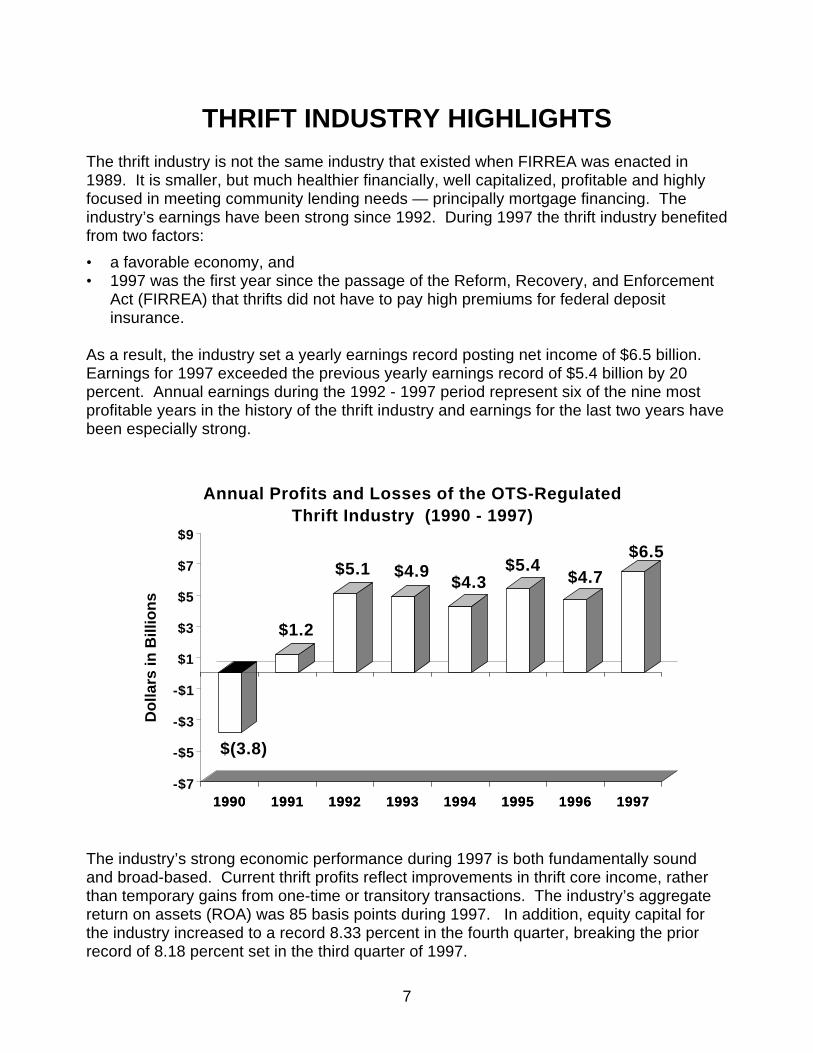
As a result, the industry set a yearly earnings record posting net income of $6.5 billion. Earnings for 1997 exceeded the previous yearly earnings record of $5.4 billion by 20percent. Annual earnings during the 1992 - 1997 period represent six of the nine mostprofitable years in the history of the thrift industry and earnings for the last two years havebeen especially strong.
1990 1991 1992 1993 1994 1995 1996 1997
$(3.8)
$1.2
$5.1 $4.9$4.3
$5.4$4.7
$6.5
-$7
-$5
-$3
-$1
$1
$3
$5
$7
$9
Do
llars
in B
illio
ns
1990 1991 1992 1993 1994 1995 1996 1997
Annual Profits and Losses of the OTS-Regulated Thrift Industry (1990 - 1997)
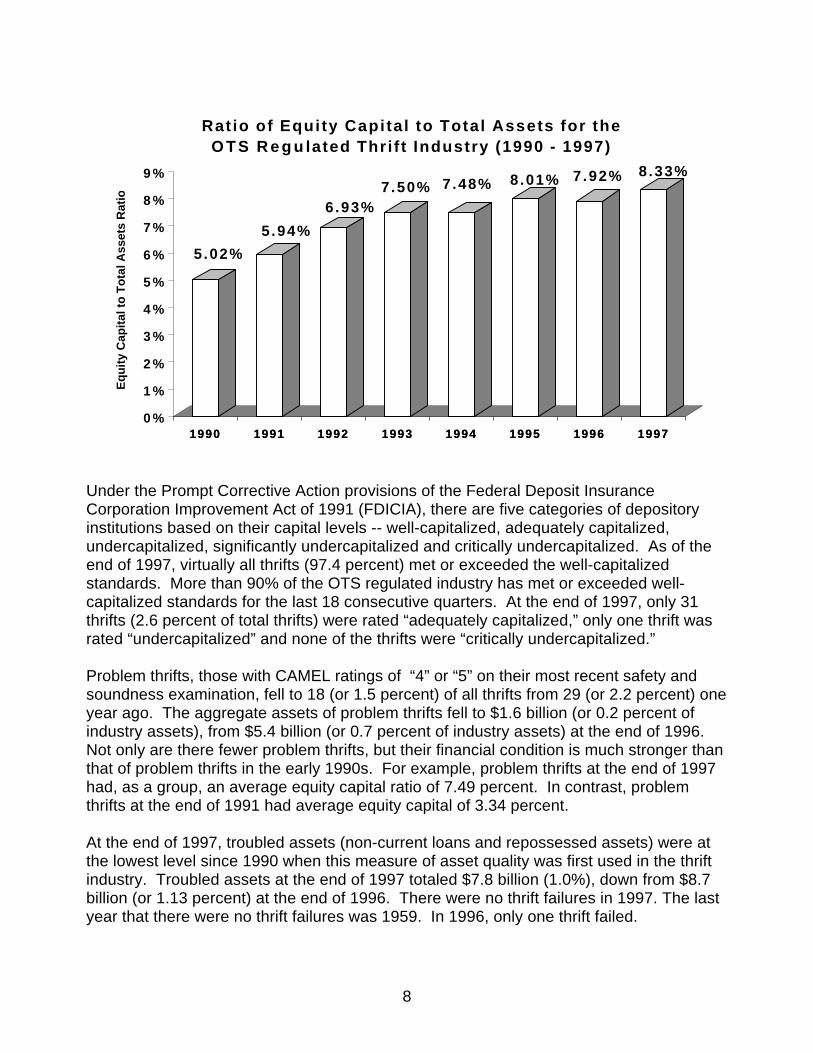
The industry’s strong economic performance during 1997 is both fundamentally soundand broad-based. Current thrift profits reflect improvements in thrift core income, ratherthan temporary gains from one-time or transitory transactions. The industry’s aggregatereturn on assets (ROA) was 85 basis points during 1997. In addition, equity capital forthe industry increased to a record 8.33 percent in the fourth quarter, breaking the priorrecord of 8.18 percent set in the third quarter of 1997.
8
1990 1991 1992 1993 1994 1995 1996 1997
5.02%
5.94%
6.93%7.50% 7.48% 8.01% 7.92% 8.33%
0 %
1 %
2 %
3 %
4 %
5 %
6 %
7 %
8 %
9 %
Eq
uit
y C
apit
al t
o T
ota
l Ass
ets
Rat
io
1990 1991 1992 1993 1994 1995 1996 1997
Ratio of Equity Capital to Total Assets for theO T S R e g u lated Thri f t Industry (1990 - 1997)
Under the Prompt Corrective Action provisions of the Federal Deposit InsuranceCorporation Improvement Act of 1991 (FDICIA), there are five categories of depositoryinstitutions based on their capital levels -- well-capitalized, adequately capitalized,undercapitalized, significantly undercapitalized and critically undercapitalized. As of theend of 1997, virtually all thrifts (97.4 percent) met or exceeded the well-capitalizedstandards. More than 90% of the OTS regulated industry has met or exceeded well-capitalized standards for the last 18 consecutive quarters. At the end of 1997, only 31thrifts (2.6 percent of total thrifts) were rated “adequately capitalized,” only one thrift wasrated “undercapitalized” and none of the thrifts were “critically undercapitalized.”
Problem thrifts, those with CAMEL ratings of “4” or “5” on their most recent safety andsoundness examination, fell to 18 (or 1.5 percent) of all thrifts from 29 (or 2.2 percent) oneyear ago. The aggregate assets of problem thrifts fell to $1.6 billion (or 0.2 percent ofindustry assets), from $5.4 billion (or 0.7 percent of industry assets) at the end of 1996. Not only are there fewer problem thrifts, but their financial condition is much stronger thanthat of problem thrifts in the early 1990s. For example, problem thrifts at the end of 1997had, as a group, an average equity capital ratio of 7.49 percent. In contrast, problemthrifts at the end of 1991 had average equity capital of 3.34 percent.
At the end of 1997, troubled assets (non-current loans and repossessed assets) were atthe lowest level since 1990 when this measure of asset quality was first used in the thriftindustry. Troubled assets at the end of 1997 totaled $7.8 billion (1.0%), down from $8.7billion (or 1.13 percent) at the end of 1996. There were no thrift failures in 1997. The lastyear that there were no thrift failures was 1959. In 1996, only one thrift failed.
9
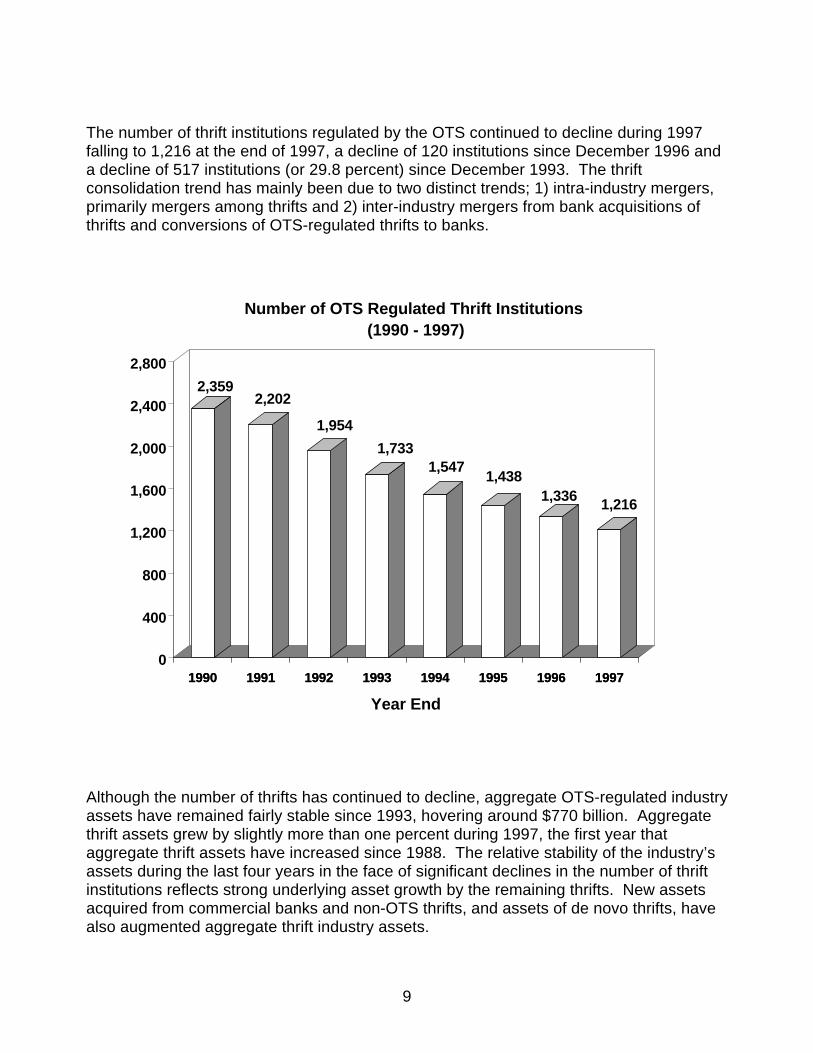
The number of thrift institutions regulated by the OTS continued to decline during 1997falling to 1,216 at the end of 1997, a decline of 120 institutions since December 1996 anda decline of 517 institutions (or 29.8 percent) since December 1993. The thriftconsolidation trend has mainly been due to two distinct trends; 1) intra-industry mergers,primarily mergers among thrifts and 2) inter-industry mergers from bank acquisitions ofthrifts and conversions of OTS-regulated thrifts to banks.
1990 1991 1992 1993 1994 1995 1996 1997
2,3592,202
1,954
1,7331,547
1,4381,336
1,216
0
400
800
1,200
1,600
2,000
2,400
2,800
1990 1991 1992 1993 1994 1995 1996 1997
Year End
Number of OTS Regulated Thrift Institutions (1990 - 1997)
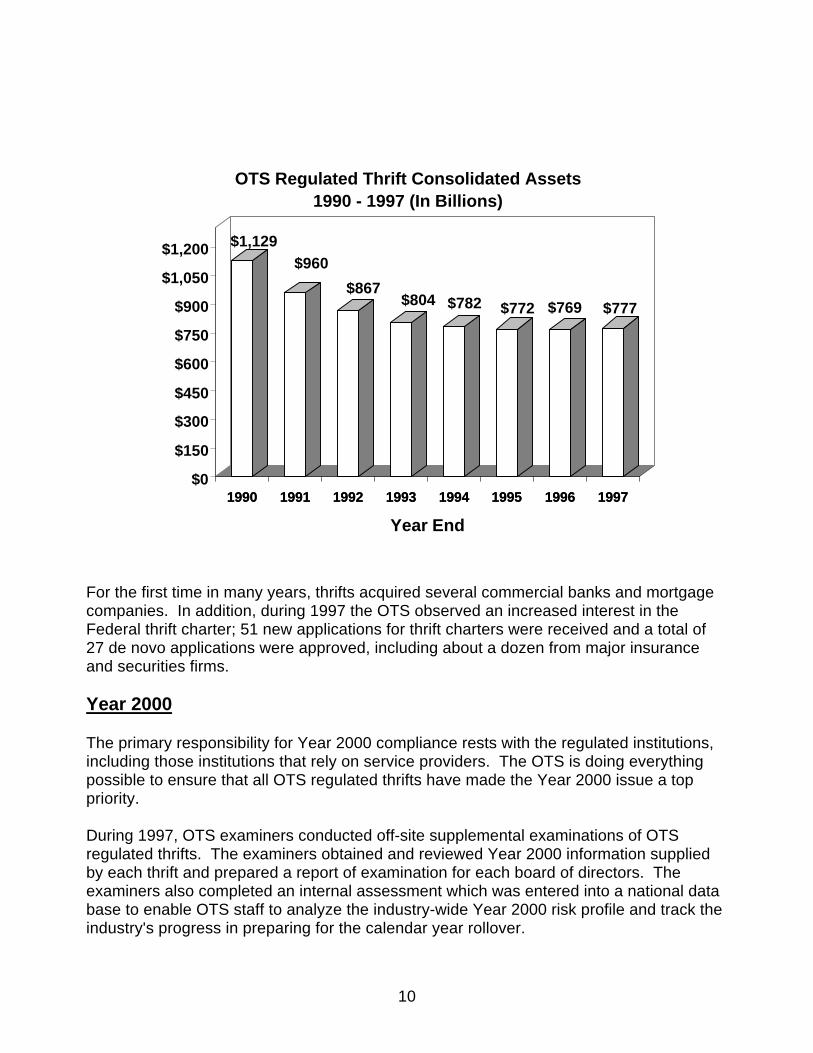
Although the number of thrifts has continued to decline, aggregate OTS-regulated industryassets have remained fairly stable since 1993, hovering around $770 billion. Aggregatethrift assets grew by slightly more than one percent during 1997, the first year thataggregate thrift assets have increased since 1988. The relative stability of the industry’sassets during the last four years in the face of significant declines in the number of thriftinstitutions reflects strong underlying asset growth by the remaining thrifts. New assetsacquired from commercial banks and non-OTS thrifts, and assets of de novo thrifts, havealso augmented aggregate thrift industry assets.
10
1990 1991 1992 1993 1994 1995 1996 1997
$1,129$960
$867$804 $782 $772 $769 $777
$0
$150
$300
$450
$600
$750
$900
$1,050
$1,200
1990 1991 1992 1993 1994 1995 1996 1997
Year End
OTS Regulated Thrift Consolidated Assets 1990 - 1997 (In Billions)
For the first time in many years, thrifts acquired several commercial banks and mortgagecompanies. In addition, during 1997 the OTS observed an increased interest in theFederal thrift charter; 51 new applications for thrift charters were received and a total of 27 de novo applications were approved, including about a dozen from major insuranceand securities firms.
Year 2000
The primary responsibility for Year 2000 compliance rests with the regulated institutions,including those institutions that rely on service providers. The OTS is doing everythingpossible to ensure that all OTS regulated thrifts have made the Year 2000 issue a toppriority.
During 1997, OTS examiners conducted off-site supplemental examinations of OTSregulated thrifts. The examiners obtained and reviewed Year 2000 information suppliedby each thrift and prepared a report of examination for each board of directors. Theexaminers also completed an internal assessment which was entered into a national database to enable OTS staff to analyze the industry-wide Year 2000 risk profile and track theindustry's progress in preparing for the calendar year rollover.
11
The initial Year 2000 examinations, which focused on the thrift managers' awareness ofYear 2000 issues and the need to plan and prioritize for Year 2000, are now beingfollowed-up by on-site examinations which focus on actual renovation efforts and onplanning for testing and contingencies. Although some of these examinations werestarted as early as November 1997, the OTS examiners will conduct most of theseexaminations between February and June 1998. Every OTS-regulated thrift will beexamined for Year 2000 readiness.
OTS Information Systems examiners have included Year 2000 matters in theirexaminations since 1995. As we move closer to January 2000, the examination processhas become more formalized and more intense. In addition to examining OTS regulatedthrifts, the OTS examiners are examining entities that provide data services or sharedapplication software to the thrift industry. When these entities service commercial banksas well as thrifts, the OTS is cooperating with the other banking agencies in schedulingand staffing the examinations.
12
Management’s Discussion and Analysis of OTS’ Financial Performance
Funding Sources
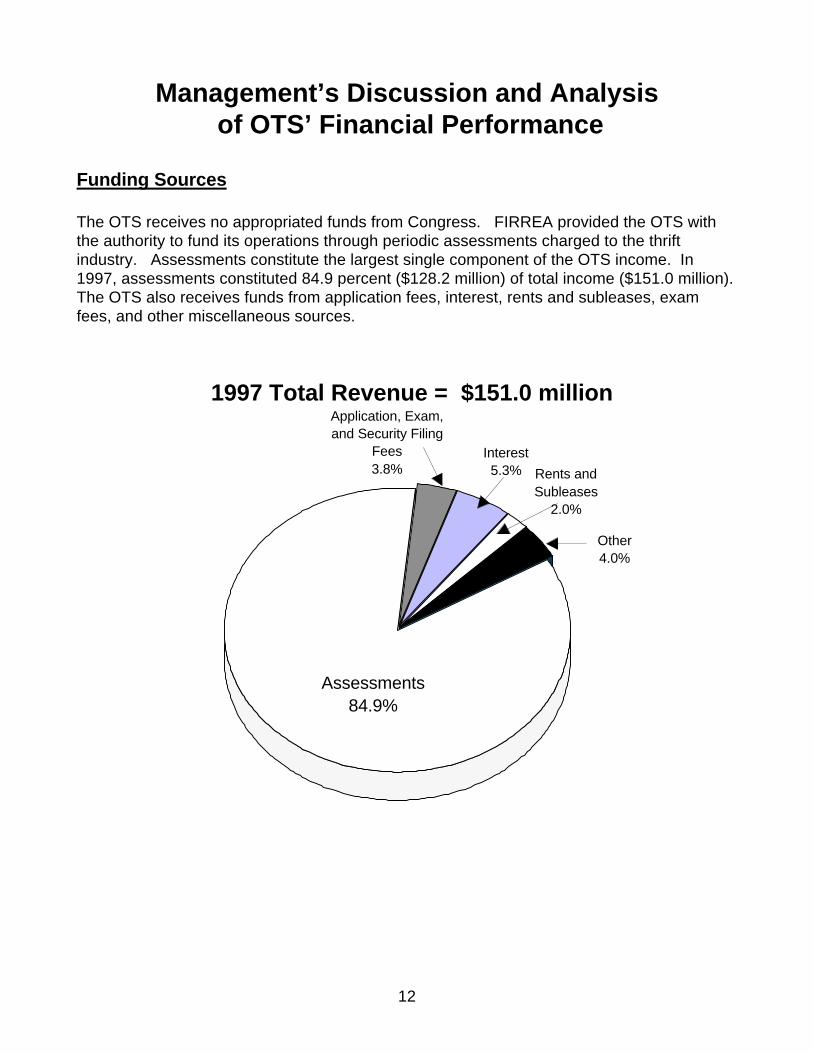
The OTS receives no appropriated funds from Congress. FIRREA provided the OTS withthe authority to fund its operations through periodic assessments charged to the thriftindustry. Assessments constitute the largest single component of the OTS income. In1997, assessments constituted 84.9 percent ($128.2 million) of total income ($151.0 million).The OTS also receives funds from application fees, interest, rents and subleases, examfees, and other miscellaneous sources.
1997 Total Revenue = $151.0 millionApplication, Exam, and Security Filing
Fees3.8%
Interest5.3% Rents and
Subleases2.0%
Other4.0%
Assessments84.9%
13
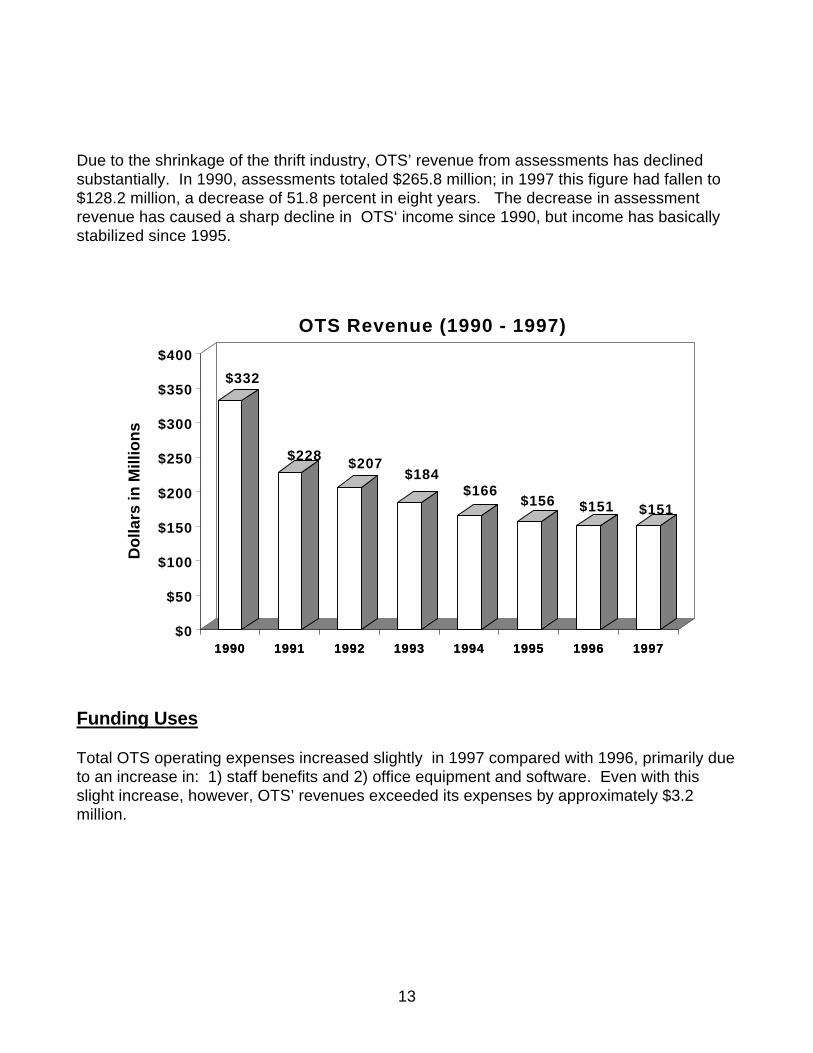
Due to the shrinkage of the thrift industry, OTS’ revenue from assessments has declinedsubstantially. In 1990, assessments totaled $265.8 million; in 1997 this figure had fallen to$128.2 million, a decrease of 51.8 percent in eight years. The decrease in assessmentrevenue has caused a sharp decline in OTS‘ income since 1990, but income has basicallystabilized since 1995.
1990 1991 1992 1993 1994 1995 1996 1997
$332
$228 $207$184
$166$156 $151 $151
$0
$50
$100
$150
$200
$250
$300
$350
$400
Do
llars
in M
illio
ns
1990 1991 1992 1993 1994 1995 1996 1997
OTS Revenue (1990 - 1997)
Funding Uses
Total OTS operating expenses increased slightly in 1997 compared with 1996, primarily dueto an increase in: 1) staff benefits and 2) office equipment and software. Even with thisslight increase, however, OTS’ revenues exceeded its expenses by approximately $3.2million.
14
1990 1991 1992 1993 1994 1995 1996 1997
$267
$230$209
$192$177
$147$133
$148
$0
$50
$100
$150
$200
$250
$300
Do
llars
in M
illio
ns
1990 1991 1992 1993 1994 1995 1996 1997
OTS Operating Expenses (1990 - 1997)
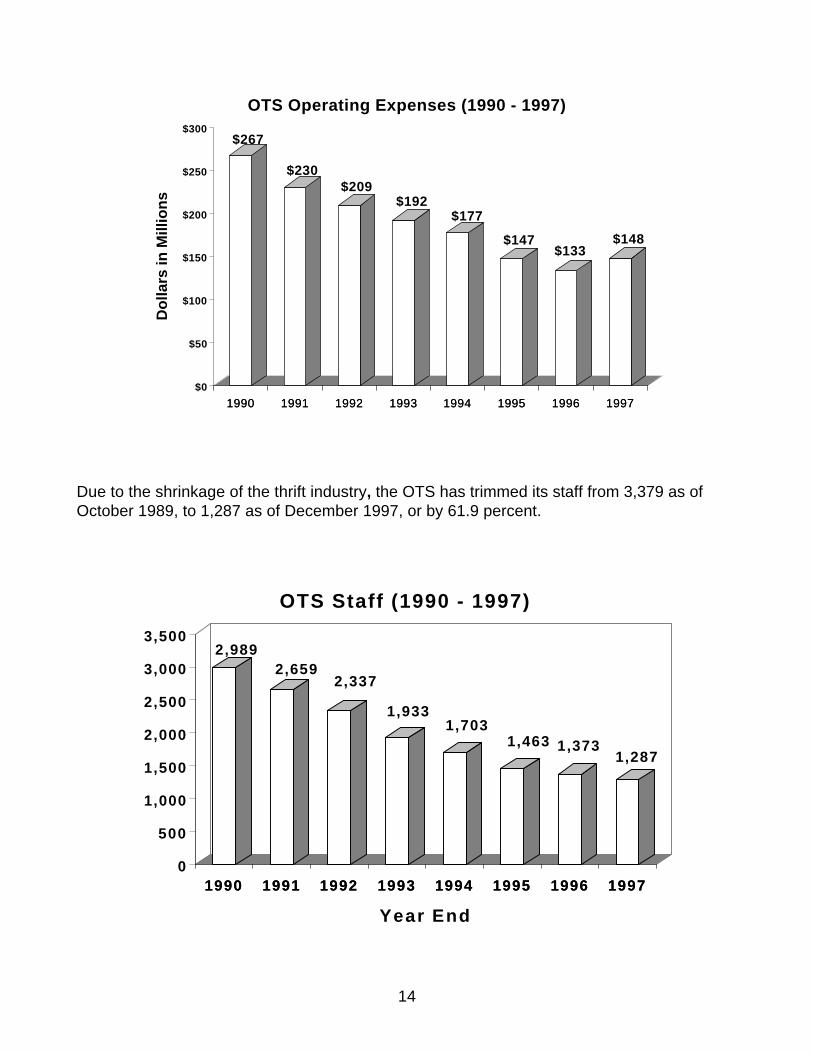
Due to the shrinkage of the thrift industry, the OTS has trimmed its staff from 3,379 as ofOctober 1989, to 1,287 as of December 1997, or by 61.9 percent.
1990 1991 1992 1993 1994 1995 1996 1997
2,9892,659
2,337
1,9331,703
1,463 1,3731,287
0
500
1,000
1,500
2,000
2,500
3,000
3,500
1990 1991 1992 1993 1994 1995 1996 1997
Year End
OTS Staff (1990 - 1997)
15
Compliance
The OTS complies with all applicable Generally Accepted Accounting Principles (GAAP),Federal Financial Accounting Standards and internal control principles. The OTS' financialtransactions are reported on an accrual basis. The Planning, Budget and Finance Divisioncontinually reviews new Statements of Federal Financial Accounting Standards and modifiesaccounting policy, procedures, and reporting, as needed.
FMFIA
The Federal Managers’ Financial Integrity Act (FMFIA) mandated the establishment ofagency internal control programs and regular evaluations of management controls andaccounting systems to protect federal programs from fraud, waste and abuse. The OTSmaintains strong internal controls, comprehensive financial management controls, personnelsecurity controls, computer security, and strong asset accountability programs. The OTSmaintains budgetary integrity through the continual oversight and monitoring of its annualbudget. Generated reports allow the budget staff to regularly analyze the status of allaccounts, review all expenditures, and make recommendations to senior managementregarding potential savings and/or possible overages in the various accounts.
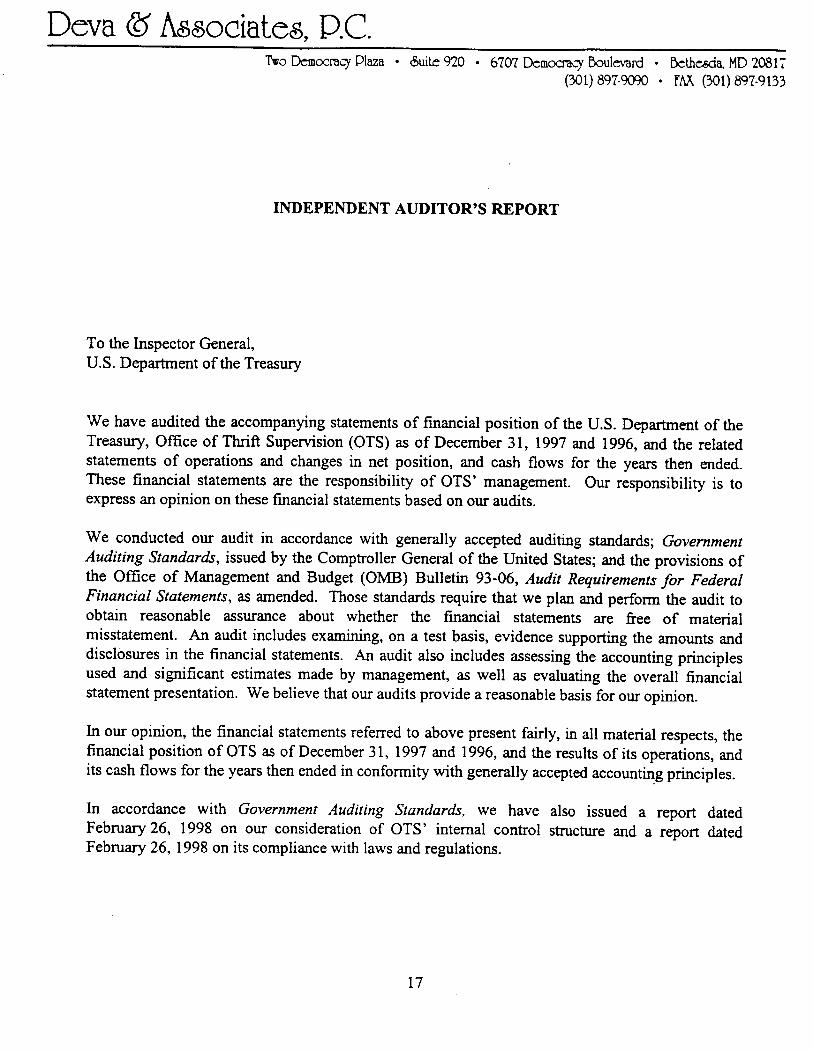
The foundation of the OTS' financial management control program is its annual financialstatement audit. The 1997 audit was conducted by the independent, certified publicaccounting firm of Deva & Associates, P.C. The audit was completed in February 1998. Forthe eighth consecutive year, the OTS was given an unqualified opinion on its financialstatements.
OTS’ Annual Assurance Statement for the fiscal year ending September 30, 1997, asrequired by FMFIA, indicated that OTS’ management control systems are adequate andensure that programs achieve their intended results; resources are used consistent with theOTS mission; programs and resources are protected from waste, fraud, andmismanagement; laws and regulations are followed; and reliable and timely information isobtained and used for decision making.
In addition, none of the quality assurance and other reviews, audits, management studies, orprogram and annual evaluations conducted during FY 1997 identified any Section 2(programs and administrative functions) significant or “material” weaknesses, or Section 4(financial systems) material nonconformances.
Current Status of OTS’ Financial Management Systems
The OTS uses an off-the-shelf accounting system purchased from Computer Data Systems,Inc., as the key component of its financial management system. The accounting systemoperates on a calendar-year basis and integrates the procurement, budget execution,accounts payable, accounts receivable, general ledger, and financial reporting functions andis directly interfaced with the payroll/personnel system. Approved budget data areelectronically uploaded to the accounting system at the outset of each budget year. The
16
OTS provides financial cross-servicing to the Federal Maritime Commission, the FederalHousing Finance Board, and the Office of Financial Institutions Adjudication in the payroll,personnel, and accounting areas. This cross-servicing structure supports the goal ofreducing duplicative functions within the Federal Government as promoted by the NationalPerformance Review.
The OTS' financial management systems currently produce accurate, relevant, timely, anduseful information and meet GAO requirements. A review of these systems as part of theInspector General’s annual audit requirement has produced an unqualified audit for the pasteight years. The system utilizes an automated Standard General Ledger (SGL) crosswalkwhich allows the OTS to meet federal reporting standards while permitting OTS’ internalmanagement to continue receiving a more detailed breakout of accounting information.Financial reports are provided to senior management on a monthly basis to assist them inmonitoring their program area.
Year 2000 Issues
The OTS is actively addressing the conversion of its internal systems and is well on the waytoward accomplishing Year 2000 goals. In 1996, OTS’ Information Resources Managementdivision (IRM) completed an assessment of the national application systems and developeda conversion plan to have all coding efforts completed by the end of 1998. To date,approximately 89 percent of the computer code modifications have been completed, tested,and implemented. Another 2 percent of the code revisions are currently underway andmodification to the remaining computer code will begin shortly.
Fifteen national systems were identified as mission critical. All but two of these systems arenow Year 2000 compliant. The remaining two systems, Home Mortgage Disclosure Act(HMDA) and Interest Rate Risk, are scheduled to be completed by November 1998. Inaddition, OTS is working with the electronic filing software vendor to ensure that its productis Year 2000 compliant for the industry’s 1998 reporting cycles.
Validation testing of converted systems began in September 1997. IRM tested andconverted systems at its disaster recovery site during the annual recovery test. For threedays, the compliant systems operated under dates ranging from December 31, 1999 toJune 1, 2000. This validated the date rollover from December to January and allowed IRMto test leap year and quarterly processes. The tests were successful and identified onlysmall correctable problems. Two similar tests have been scheduled and budgeted for Juneand October of 1998. During 1998 and 1999, all national systems will be tested undersimilar conditions.
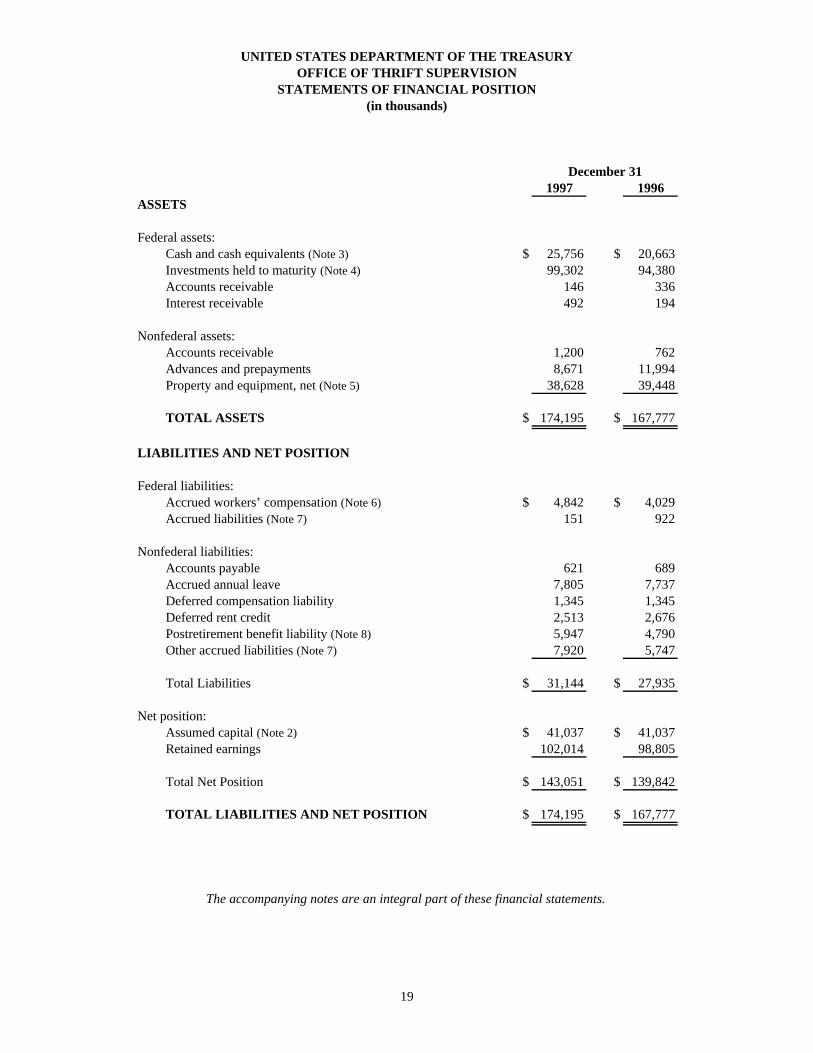
UNITED STATES DEPARTMENT OF THE TREASURYOFFICE OF THRIFT SUPERVISION
STATEMENTS OF FINANCIAL POSITION(in thousands)
December 311997 1996
ASSETS
Federal assets:Cash and cash equivalents (Note 3) $ 25,756 $ 20,663Investments held to maturity (Note 4) 99,302 94,380Accounts receivable 146 336Interest receivable 492 194
Nonfederal assets:Accounts receivable 1,200 762Advances and prepayments 8,671 11,994Property and equipment, net (Note 5) 38,628 39,448
TOTAL ASSETS $ 174,195 $ 167,777
LIABILITIES AND NET POSITION
Federal liabilities:Accrued workers’ compensation (Note 6) $ 4,842 $ 4,029Accrued liabilities (Note 7) 151 922
Nonfederal liabilities:Accounts payable 621 689Accrued annual leave 7,805 7,737Deferred compensation liability 1,345 1,345Deferred rent credit 2,513 2,676Postretirement benefit liability (Note 8) 5,947 4,790Other accrued liabilities (Note 7) 7,920 5,747
Total Liabilities $ 31,144 $ 27,935
Net position:Assumed capital (Note 2) $ 41,037 $ 41,037Retained earnings 102,014 98,805
Total Net Position $ 143,051 $ 139,842
TOTAL LIABILITIES AND NET POSITION $ 174,195 $ 167,777
The accompanying notes are an integral part of these financial statements.
19
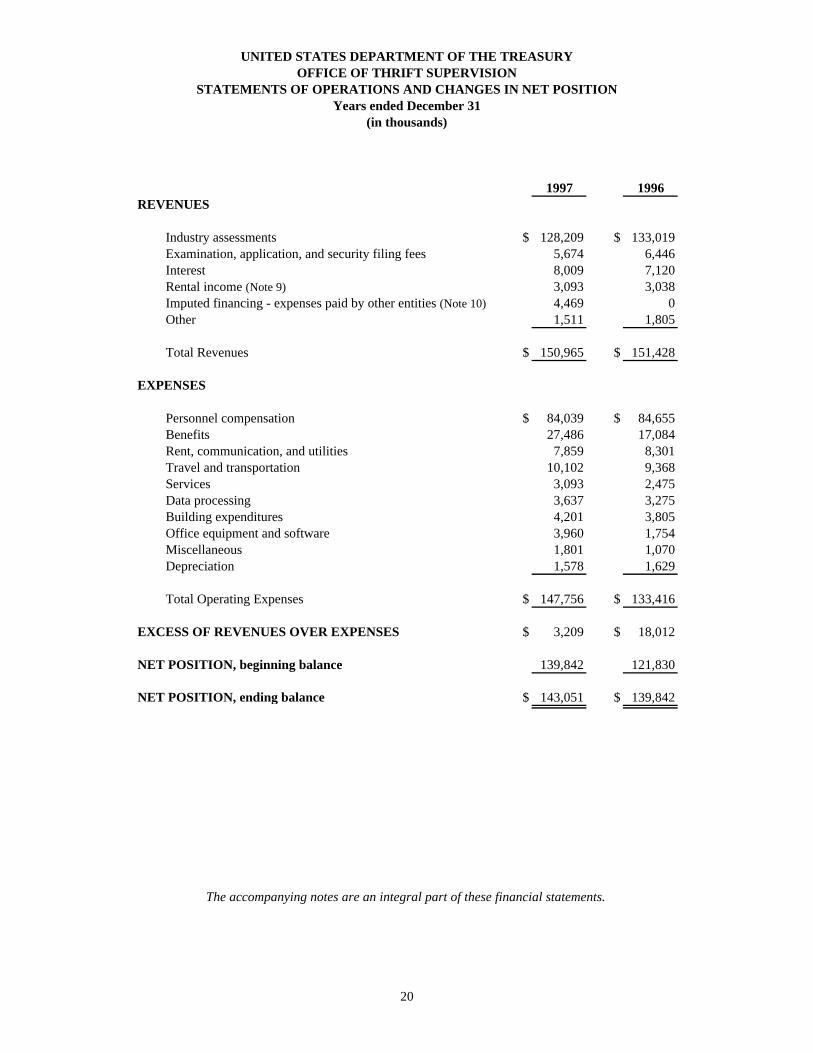
UNITED STATES DEPARTMENT OF THE TREASURYOFFICE OF THRIFT SUPERVISION
STATEMENTS OF OPERATIONS AND CHANGES IN NET POSITIONYears ended December 31
(in thousands)
1997 1996REVENUES
Industry assessments $ 128,209 $ 133,019Examination, application, and security filing fees 5,674 6,446Interest 8,009 7,120Rental income (Note 9) 3,093 3,038Imputed financing - expenses paid by other entities (Note 10) 4,469 0Other 1,511 1,805
Total Revenues $ 150,965 $ 151,428
EXPENSES
Personnel compensation $ 84,039 $ 84,655Benefits 27,486 17,084Rent, communication, and utilities 7,859 8,301Travel and transportation 10,102 9,368Services 3,093 2,475Data processing 3,637 3,275Building expenditures 4,201 3,805Office equipment and software 3,960 1,754Miscellaneous 1,801 1,070Depreciation 1,578 1,629
Total Operating Expenses $ 147,756 $ 133,416
EXCESS OF REVENUES OVER EXPENSES $ 3,209 $ 18,012
NET POSITION, beginning balance 139,842 121,830
NET POSITION, ending balance $ 143,051 $ 139,842
The accompanying notes are an integral part of these financial statements.
20
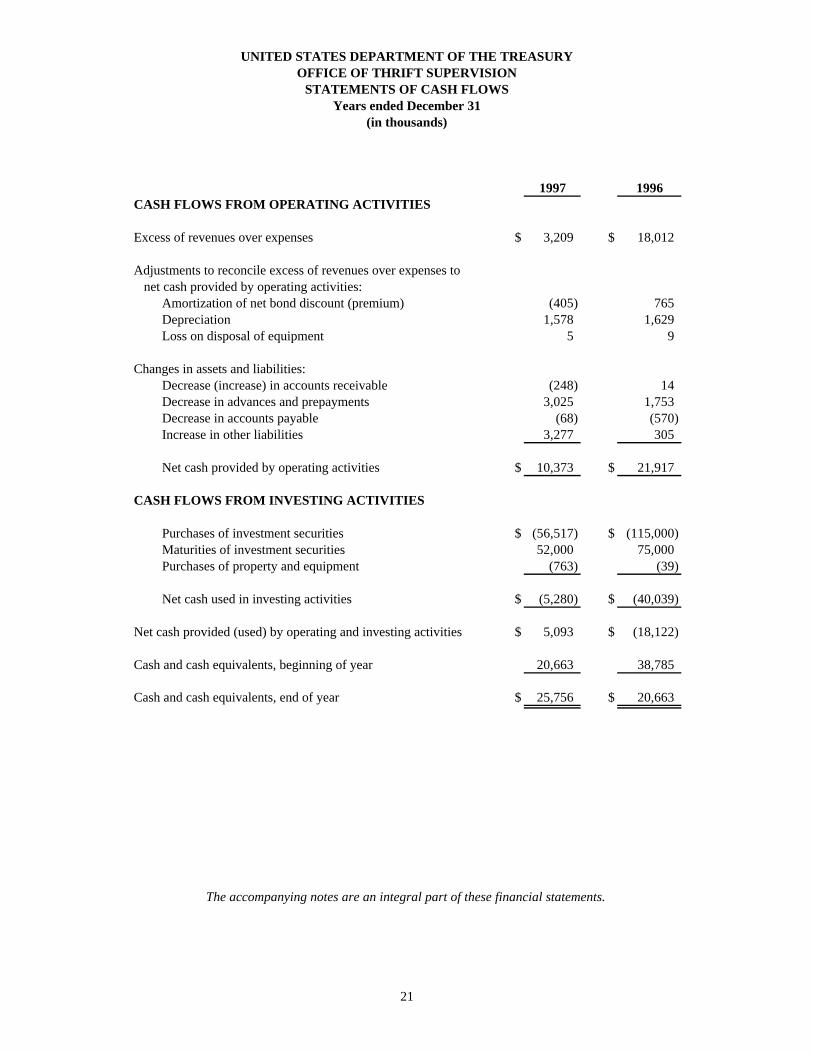
UNITED STATES DEPARTMENT OF THE TREASURYOFFICE OF THRIFT SUPERVISION
STATEMENTS OF CASH FLOWSYears ended December 31
(in thousands)
1997 1996CASH FLOWS FROM OPERATING ACTIVITIES
Excess of revenues over expenses $ 3,209 $ 18,012
Adjustments to reconcile excess of revenues over expenses to net cash provided by operating activities:
Amortization of net bond discount (premium) (405) 765Depreciation 1,578 1,629Loss on disposal of equipment 5 9
Changes in assets and liabilities:Decrease (increase) in accounts receivable (248) 14Decrease in advances and prepayments 3,025 1,753Decrease in accounts payable (68) (570)Increase in other liabilities 3,277 305
Net cash provided by operating activities $ 10,373 $ 21,917
CASH FLOWS FROM INVESTING ACTIVITIES
Purchases of investment securities $ (56,517) $ (115,000)Maturities of investment securities 52,000 75,000Purchases of property and equipment (763) (39) Net cash used in investing activities $ (5,280) $ (40,039)
Net cash provided (used) by operating and investing activities $ 5,093 $ (18,122)
Cash and cash equivalents, beginning of year 20,663 38,785
Cash and cash equivalents, end of year $ 25,756 $ 20,663
The accompanying notes are an integral part of these financial statements.
21
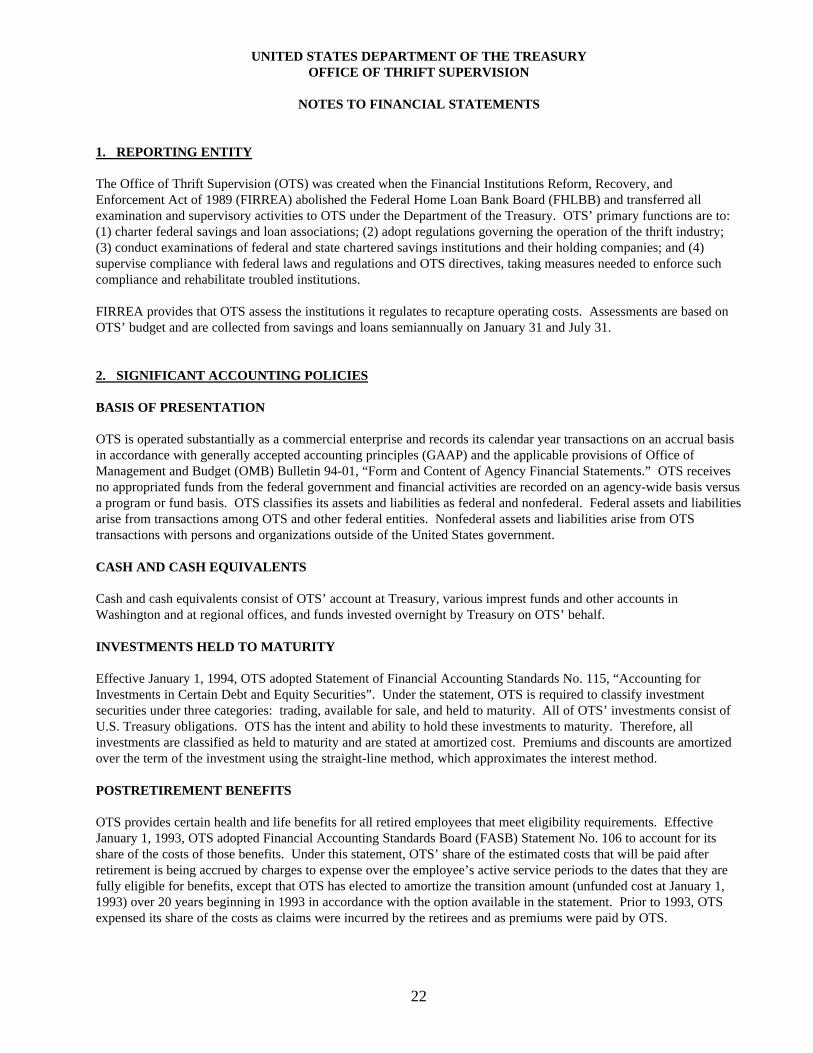
UNITED STATES DEPARTMENT OF THE TREASURYOFFICE OF THRIFT SUPERVISION
NOTES TO FINANCIAL STATEMENTS
22
1. REPORTING ENTITY
The Office of Thrift Supervision (OTS) was created when the Financial Institutions Reform, Recovery, andEnforcement Act of 1989 (FIRREA) abolished the Federal Home Loan Bank Board (FHLBB) and transferred allexamination and supervisory activities to OTS under the Department of the Treasury. OTS’ primary functions are to:(1) charter federal savings and loan associations; (2) adopt regulations governing the operation of the thrift industry;(3) conduct examinations of federal and state chartered savings institutions and their holding companies; and (4)supervise compliance with federal laws and regulations and OTS directives, taking measures needed to enforce suchcompliance and rehabilitate troubled institutions.
FIRREA provides that OTS assess the institutions it regulates to recapture operating costs. Assessments are based onOTS’ budget and are collected from savings and loans semiannually on January 31 and July 31.
2. SIGNIFICANT ACCOUNTING POLICIES
BASIS OF PRESENTATION
OTS is operated substantially as a commercial enterprise and records its calendar year transactions on an accrual basisin accordance with generally accepted accounting principles (GAAP) and the applicable provisions of Office ofManagement and Budget (OMB) Bulletin 94-01, “Form and Content of Agency Financial Statements.” OTS receivesno appropriated funds from the federal government and financial activities are recorded on an agency-wide basis versusa program or fund basis. OTS classifies its assets and liabilities as federal and nonfederal. Federal assets and liabilitiesarise from transactions among OTS and other federal entities. Nonfederal assets and liabilities arise from OTStransactions with persons and organizations outside of the United States government.
CASH AND CASH EQUIVALENTS
Cash and cash equivalents consist of OTS’ account at Treasury, various imprest funds and other accounts inWashington and at regional offices, and funds invested overnight by Treasury on OTS’ behalf.
INVESTMENTS HELD TO MATURITY
Effective January 1, 1994, OTS adopted Statement of Financial Accounting Standards No. 115, “Accounting forInvestments in Certain Debt and Equity Securities”. Under the statement, OTS is required to classify investmentsecurities under three categories: trading, available for sale, and held to maturity. All of OTS’ investments consist ofU.S. Treasury obligations. OTS has the intent and ability to hold these investments to maturity. Therefore, allinvestments are classified as held to maturity and are stated at amortized cost. Premiums and discounts are amortizedover the term of the investment using the straight-line method, which approximates the interest method.
POSTRETIREMENT BENEFITS
OTS provides certain health and life benefits for all retired employees that meet eligibility requirements. EffectiveJanuary 1, 1993, OTS adopted Financial Accounting Standards Board (FASB) Statement No. 106 to account for itsshare of the costs of those benefits. Under this statement, OTS’ share of the estimated costs that will be paid afterretirement is being accrued by charges to expense over the employee’s active service periods to the dates that they arefully eligible for benefits, except that OTS has elected to amortize the transition amount (unfunded cost at January 1,1993) over 20 years beginning in 1993 in accordance with the option available in the statement. Prior to 1993, OTSexpensed its share of the costs as claims were incurred by the retirees and as premiums were paid by OTS.
UNITED STATES DEPARTMENT OF THE TREASURYOFFICE OF THRIFT SUPERVISION
NOTES TO FINANCIAL STATEMENTS
23
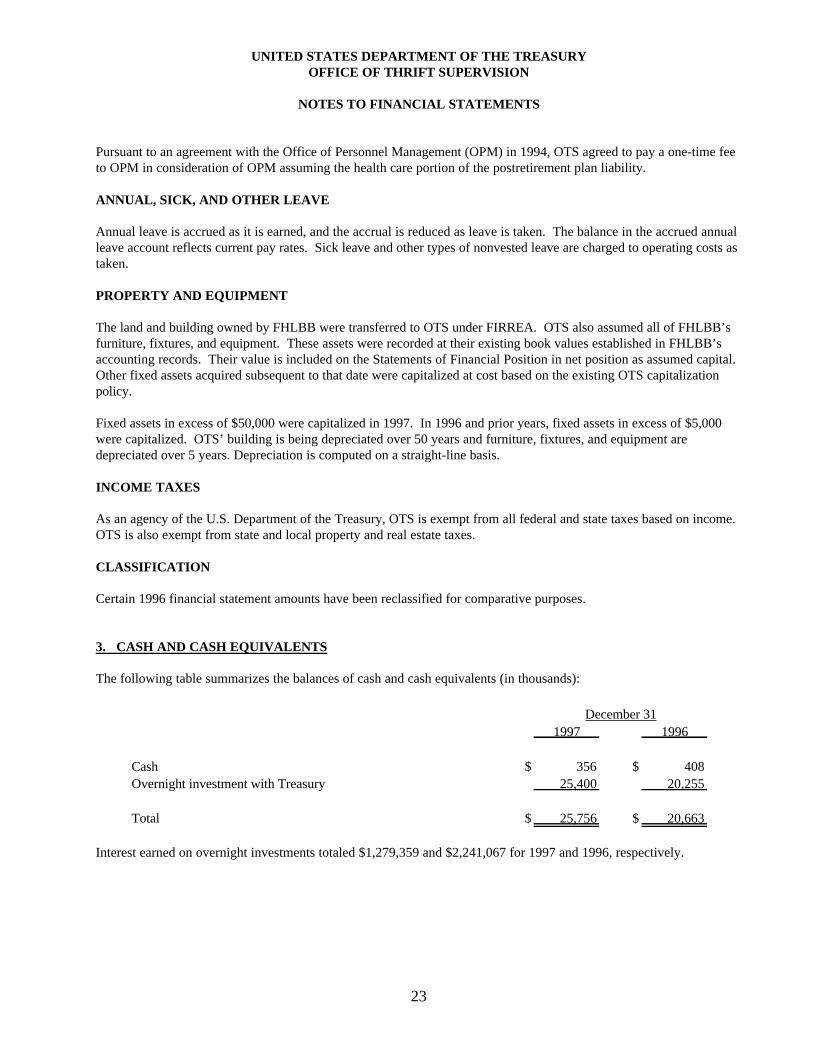
Pursuant to an agreement with the Office of Personnel Management (OPM) in 1994, OTS agreed to pay a one-time feeto OPM in consideration of OPM assuming the health care portion of the postretirement plan liability.
ANNUAL, SICK, AND OTHER LEAVE
Annual leave is accrued as it is earned, and the accrual is reduced as leave is taken. The balance in the accrued annualleave account reflects current pay rates. Sick leave and other types of nonvested leave are charged to operating costs astaken.
PROPERTY AND EQUIPMENT
The land and building owned by FHLBB were transferred to OTS under FIRREA. OTS also assumed all of FHLBB’sfurniture, fixtures, and equipment. These assets were recorded at their existing book values established in FHLBB’saccounting records. Their value is included on the Statements of Financial Position in net position as assumed capital.Other fixed assets acquired subsequent to that date were capitalized at cost based on the existing OTS capitalizationpolicy.
Fixed assets in excess of $50,000 were capitalized in 1997. In 1996 and prior years, fixed assets in excess of $5,000were capitalized. OTS’ building is being depreciated over 50 years and furniture, fixtures, and equipment aredepreciated over 5 years. Depreciation is computed on a straight-line basis.
INCOME TAXES
As an agency of the U.S. Department of the Treasury, OTS is exempt from all federal and state taxes based on income.OTS is also exempt from state and local property and real estate taxes.
CLASSIFICATION
Certain 1996 financial statement amounts have been reclassified for comparative purposes.
3. CASH AND CASH EQUIVALENTS
The following table summarizes the balances of cash and cash equivalents (in thousands):
December 311997 1996
Cash $ 356 $ 408Overnight investment with Treasury 25,400 20,255
Total $ 25,756 $ 20,663
Interest earned on overnight investments totaled $1,279,359 and $2,241,067 for 1997 and 1996, respectively.
UNITED STATES DEPARTMENT OF THE TREASURYOFFICE OF THRIFT SUPERVISION
NOTES TO FINANCIAL STATEMENTS
24
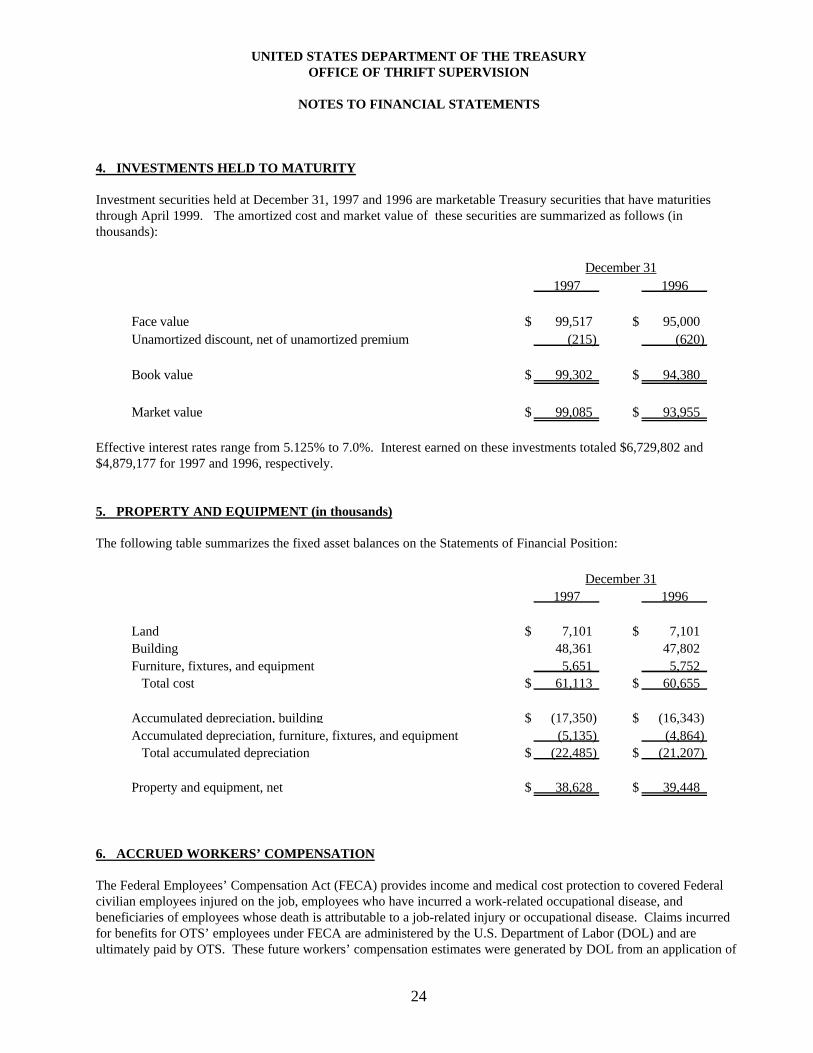
4. INVESTMENTS HELD TO MATURITY
Investment securities held at December 31, 1997 and 1996 are marketable Treasury securities that have maturitiesthrough April 1999. The amortized cost and market value of these securities are summarized as follows (inthousands):
December 311997 1996
Face value $ 99,517 $ 95,000Unamortized discount, net of unamortized premium (215) (620)
Book value $ 99,302 $ 94,380
Market value $ 99,085 $ 93,955
Effective interest rates range from 5.125% to 7.0%. Interest earned on these investments totaled $6,729,802 and$4,879,177 for 1997 and 1996, respectively.
5. PROPERTY AND EQUIPMENT (in thousands)
The following table summarizes the fixed asset balances on the Statements of Financial Position:
December 311997 1996
Land $ 7,101 $ 7,101Building 48,361 47,802Furniture, fixtures, and equipment 5,651 5,752 Total cost $ 61,113 $ 60,655
Accumulated depreciation, building $ (17,350) $ (16,343)Accumulated depreciation, furniture, fixtures, and equipment (5,135) (4,864) Total accumulated depreciation $ (22,485) $ (21,207)
Property and equipment, net $ 38,628 $ 39,448
6. ACCRUED WORKERS’ COMPENSATION
The Federal Employees’ Compensation Act (FECA) provides income and medical cost protection to covered Federalcivilian employees injured on the job, employees who have incurred a work-related occupational disease, andbeneficiaries of employees whose death is attributable to a job-related injury or occupational disease. Claims incurredfor benefits for OTS’ employees under FECA are administered by the U.S. Department of Labor (DOL) and areultimately paid by OTS. These future workers’ compensation estimates were generated by DOL from an application of
UNITED STATES DEPARTMENT OF THE TREASURYOFFICE OF THRIFT SUPERVISION
NOTES TO FINANCIAL STATEMENTS
25
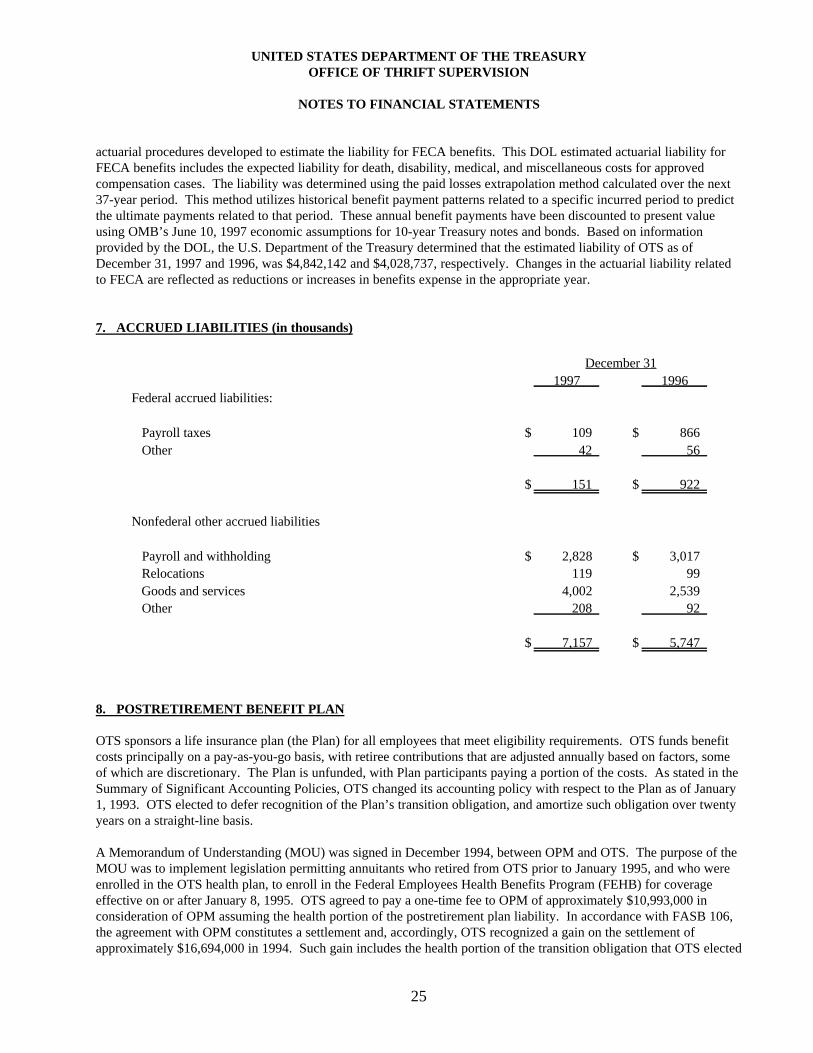
actuarial procedures developed to estimate the liability for FECA benefits. This DOL estimated actuarial liability forFECA benefits includes the expected liability for death, disability, medical, and miscellaneous costs for approvedcompensation cases. The liability was determined using the paid losses extrapolation method calculated over the next37-year period. This method utilizes historical benefit payment patterns related to a specific incurred period to predictthe ultimate payments related to that period. These annual benefit payments have been discounted to present valueusing OMB’s June 10, 1997 economic assumptions for 10-year Treasury notes and bonds. Based on informationprovided by the DOL, the U.S. Department of the Treasury determined that the estimated liability of OTS as ofDecember 31, 1997 and 1996, was $4,842,142 and $4,028,737, respectively. Changes in the actuarial liability relatedto FECA are reflected as reductions or increases in benefits expense in the appropriate year.
7. ACCRUED LIABILITIES (in thousands)
December 311997 1996
Federal accrued liabilities:
Payroll taxes $ 109 $ 866 Other 42 56
$ 151 $ 922
Nonfederal other accrued liabilities
Payroll and withholding $ 2,828 $ 3,017 Relocations 119 99 Goods and services 4,002 2,539 Other 208 92
$ 7,157 $ 5,747
8. POSTRETIREMENT BENEFIT PLAN
OTS sponsors a life insurance plan (the Plan) for all employees that meet eligibility requirements. OTS funds benefitcosts principally on a pay-as-you-go basis, with retiree contributions that are adjusted annually based on factors, someof which are discretionary. The Plan is unfunded, with Plan participants paying a portion of the costs. As stated in theSummary of Significant Accounting Policies, OTS changed its accounting policy with respect to the Plan as of January1, 1993. OTS elected to defer recognition of the Plan’s transition obligation, and amortize such obligation over twentyyears on a straight-line basis.
A Memorandum of Understanding (MOU) was signed in December 1994, between OPM and OTS. The purpose of theMOU was to implement legislation permitting annuitants who retired from OTS prior to January 1995, and who wereenrolled in the OTS health plan, to enroll in the Federal Employees Health Benefits Program (FEHB) for coverageeffective on or after January 8, 1995. OTS agreed to pay a one-time fee to OPM of approximately $10,993,000 inconsideration of OPM assuming the health portion of the postretirement plan liability. In accordance with FASB 106,the agreement with OPM constitutes a settlement and, accordingly, OTS recognized a gain on the settlement ofapproximately $16,694,000 in 1994. Such gain includes the health portion of the transition obligation that OTS elected
UNITED STATES DEPARTMENT OF THE TREASURYOFFICE OF THRIFT SUPERVISION
NOTES TO FINANCIAL STATEMENTS
26
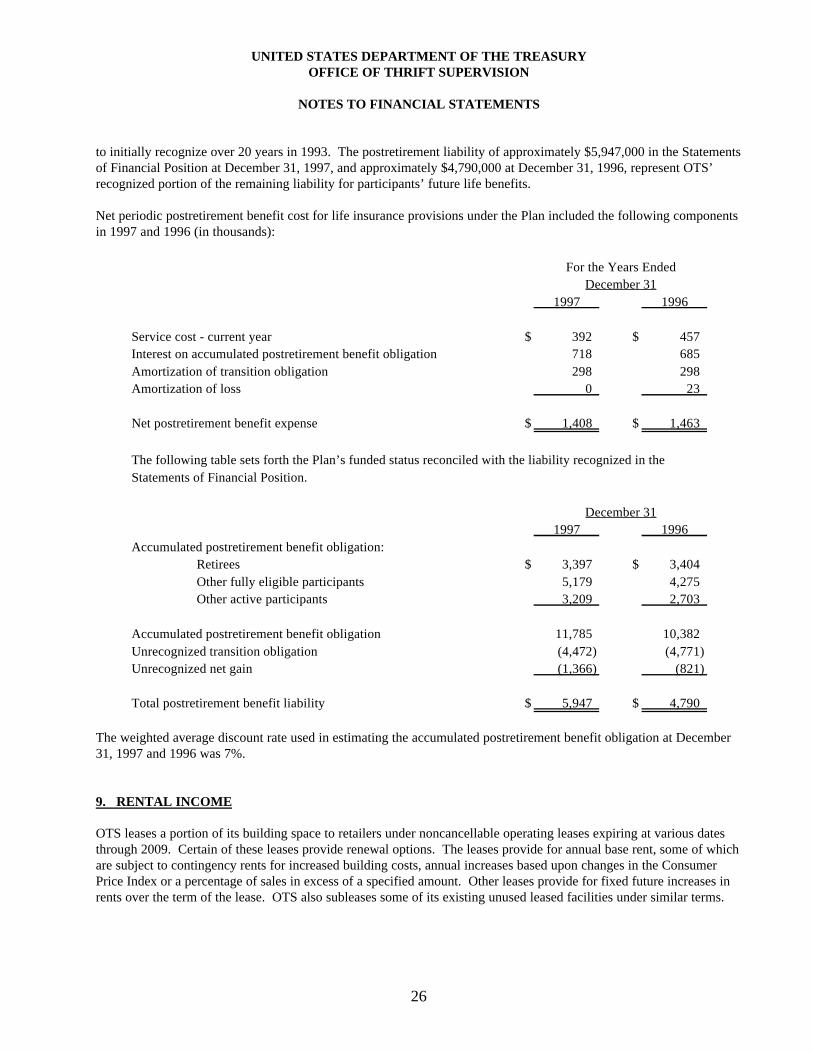
to initially recognize over 20 years in 1993. The postretirement liability of approximately $5,947,000 in the Statementsof Financial Position at December 31, 1997, and approximately $4,790,000 at December 31, 1996, represent OTS’recognized portion of the remaining liability for participants’ future life benefits.
Net periodic postretirement benefit cost for life insurance provisions under the Plan included the following componentsin 1997 and 1996 (in thousands):
For the Years EndedDecember 31
1997 1996
Service cost - current year $ 392 $ 457Interest on accumulated postretirement benefit obligation 718 685Amortization of transition obligation 298 298Amortization of loss 0 23
Net postretirement benefit expense $ 1,408 $ 1,463
The following table sets forth the Plan’s funded status reconciled with the liability recognized in theStatements of Financial Position.
December 311997 1996
Accumulated postretirement benefit obligation:Retirees $ 3,397 $ 3,404Other fully eligible participants 5,179 4,275Other active participants 3,209 2,703
Accumulated postretirement benefit obligation 11,785 10,382Unrecognized transition obligation (4,472) (4,771)Unrecognized net gain (1,366) (821)
Total postretirement benefit liability $ 5,947 $ 4,790
The weighted average discount rate used in estimating the accumulated postretirement benefit obligation at December31, 1997 and 1996 was 7%.
9. RENTAL INCOME
OTS leases a portion of its building space to retailers under noncancellable operating leases expiring at various datesthrough 2009. Certain of these leases provide renewal options. The leases provide for annual base rent, some of whichare subject to contingency rents for increased building costs, annual increases based upon changes in the ConsumerPrice Index or a percentage of sales in excess of a specified amount. Other leases provide for fixed future increases inrents over the term of the lease. OTS also subleases some of its existing unused leased facilities under similar terms.
UNITED STATES DEPARTMENT OF THE TREASURYOFFICE OF THRIFT SUPERVISION
NOTES TO FINANCIAL STATEMENTS
27
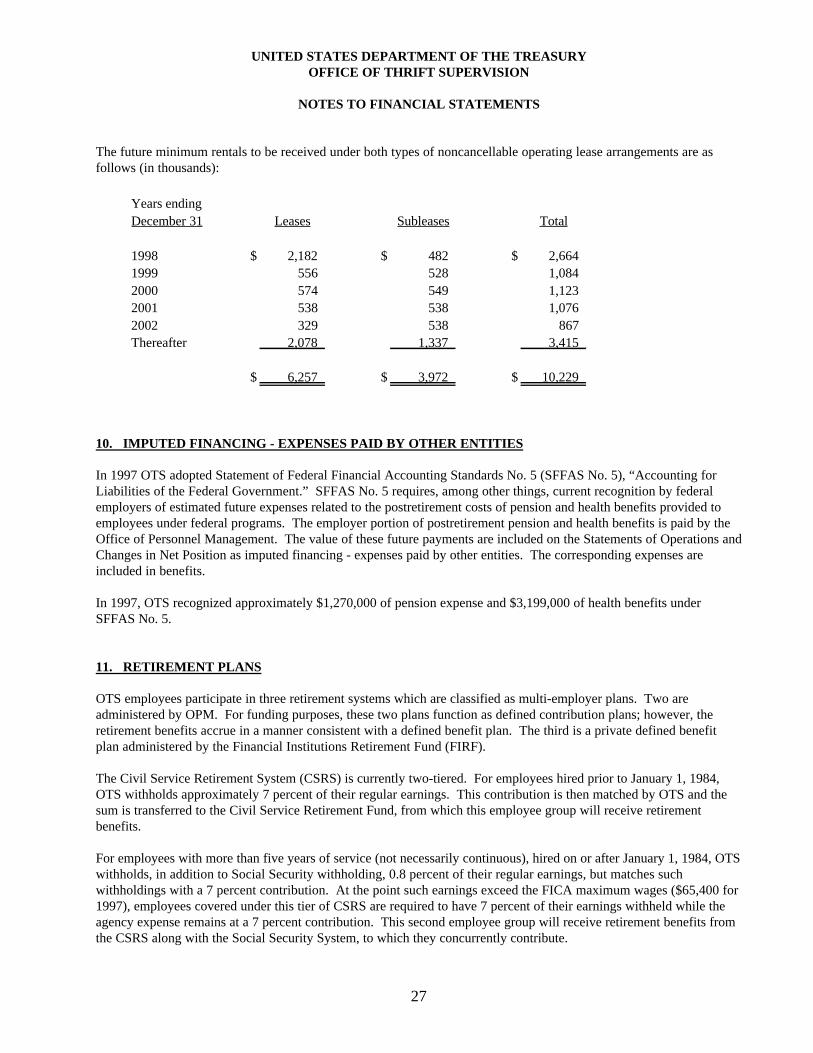
The future minimum rentals to be received under both types of noncancellable operating lease arrangements are asfollows (in thousands):
Years endingDecember 31 Leases Subleases Total
1998 $ 2,182 $ 482 $ 2,6641999 556 528 1,0842000 574 549 1,1232001 538 538 1,0762002 329 538 867Thereafter 2,078 1,337 3,415
$ 6,257 $ 3,972 $ 10,229
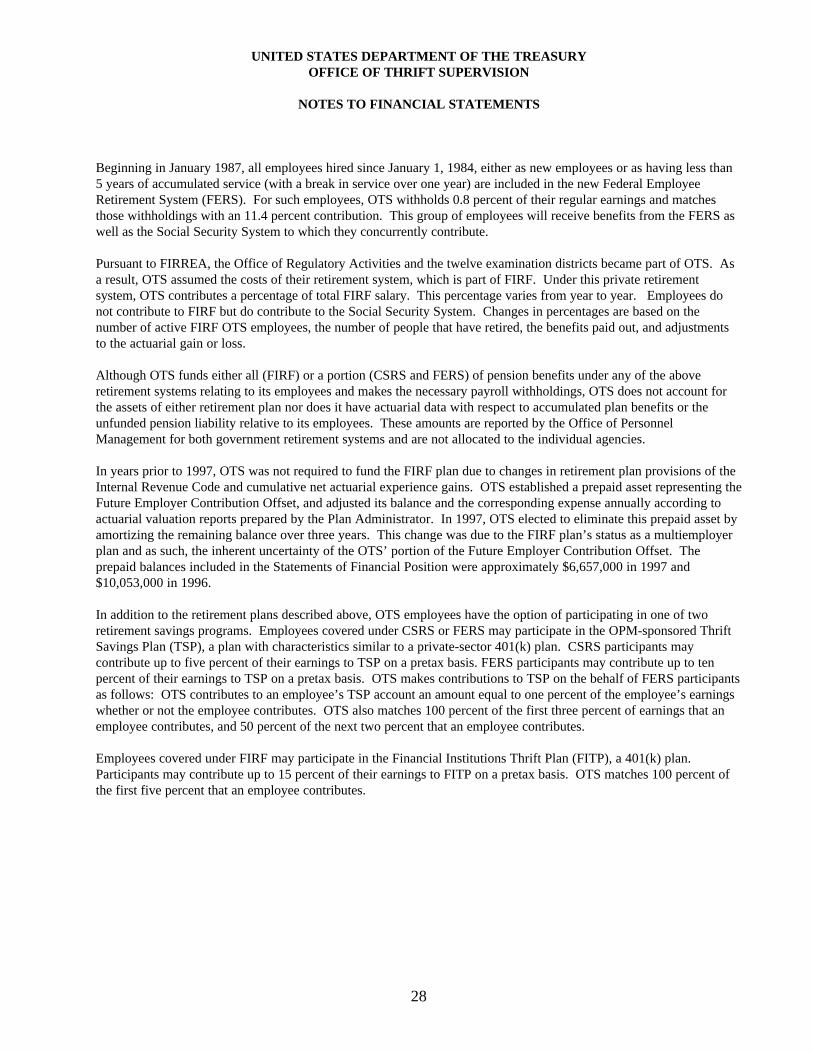
10. IMPUTED FINANCING - EXPENSES PAID BY OTHER ENTITIES
In 1997 OTS adopted Statement of Federal Financial Accounting Standards No. 5 (SFFAS No. 5), “Accounting forLiabilities of the Federal Government.” SFFAS No. 5 requires, among other things, current recognition by federalemployers of estimated future expenses related to the postretirement costs of pension and health benefits provided toemployees under federal programs. The employer portion of postretirement pension and health benefits is paid by theOffice of Personnel Management. The value of these future payments are included on the Statements of Operations andChanges in Net Position as imputed financing - expenses paid by other entities. The corresponding expenses areincluded in benefits.
In 1997, OTS recognized approximately $1,270,000 of pension expense and $3,199,000 of health benefits underSFFAS No. 5.
11. RETIREMENT PLANS
OTS employees participate in three retirement systems which are classified as multi-employer plans. Two areadministered by OPM. For funding purposes, these two plans function as defined contribution plans; however, theretirement benefits accrue in a manner consistent with a defined benefit plan. The third is a private defined benefitplan administered by the Financial Institutions Retirement Fund (FIRF).
The Civil Service Retirement System (CSRS) is currently two-tiered. For employees hired prior to January 1, 1984,OTS withholds approximately 7 percent of their regular earnings. This contribution is then matched by OTS and thesum is transferred to the Civil Service Retirement Fund, from which this employee group will receive retirementbenefits.
For employees with more than five years of service (not necessarily continuous), hired on or after January 1, 1984, OTSwithholds, in addition to Social Security withholding, 0.8 percent of their regular earnings, but matches suchwithholdings with a 7 percent contribution. At the point such earnings exceed the FICA maximum wages ($65,400 for1997), employees covered under this tier of CSRS are required to have 7 percent of their earnings withheld while theagency expense remains at a 7 percent contribution. This second employee group will receive retirement benefits fromthe CSRS along with the Social Security System, to which they concurrently contribute.
UNITED STATES DEPARTMENT OF THE TREASURYOFFICE OF THRIFT SUPERVISION
NOTES TO FINANCIAL STATEMENTS
28
Beginning in January 1987, all employees hired since January 1, 1984, either as new employees or as having less than5 years of accumulated service (with a break in service over one year) are included in the new Federal EmployeeRetirement System (FERS). For such employees, OTS withholds 0.8 percent of their regular earnings and matchesthose withholdings with an 11.4 percent contribution. This group of employees will receive benefits from the FERS aswell as the Social Security System to which they concurrently contribute.
Pursuant to FIRREA, the Office of Regulatory Activities and the twelve examination districts became part of OTS. Asa result, OTS assumed the costs of their retirement system, which is part of FIRF. Under this private retirementsystem, OTS contributes a percentage of total FIRF salary. This percentage varies from year to year. Employees donot contribute to FIRF but do contribute to the Social Security System. Changes in percentages are based on thenumber of active FIRF OTS employees, the number of people that have retired, the benefits paid out, and adjustmentsto the actuarial gain or loss.
Although OTS funds either all (FIRF) or a portion (CSRS and FERS) of pension benefits under any of the aboveretirement systems relating to its employees and makes the necessary payroll withholdings, OTS does not account forthe assets of either retirement plan nor does it have actuarial data with respect to accumulated plan benefits or theunfunded pension liability relative to its employees. These amounts are reported by the Office of PersonnelManagement for both government retirement systems and are not allocated to the individual agencies.
In years prior to 1997, OTS was not required to fund the FIRF plan due to changes in retirement plan provisions of theInternal Revenue Code and cumulative net actuarial experience gains. OTS established a prepaid asset representing theFuture Employer Contribution Offset, and adjusted its balance and the corresponding expense annually according toactuarial valuation reports prepared by the Plan Administrator. In 1997, OTS elected to eliminate this prepaid asset byamortizing the remaining balance over three years. This change was due to the FIRF plan’s status as a multiemployerplan and as such, the inherent uncertainty of the OTS’ portion of the Future Employer Contribution Offset. Theprepaid balances included in the Statements of Financial Position were approximately $6,657,000 in 1997 and$10,053,000 in 1996.
In addition to the retirement plans described above, OTS employees have the option of participating in one of tworetirement savings programs. Employees covered under CSRS or FERS may participate in the OPM-sponsored ThriftSavings Plan (TSP), a plan with characteristics similar to a private-sector 401(k) plan. CSRS participants maycontribute up to five percent of their earnings to TSP on a pretax basis. FERS participants may contribute up to tenpercent of their earnings to TSP on a pretax basis. OTS makes contributions to TSP on the behalf of FERS participantsas follows: OTS contributes to an employee’s TSP account an amount equal to one percent of the employee’s earningswhether or not the employee contributes. OTS also matches 100 percent of the first three percent of earnings that anemployee contributes, and 50 percent of the next two percent that an employee contributes.
Employees covered under FIRF may participate in the Financial Institutions Thrift Plan (FITP), a 401(k) plan.Participants may contribute up to 15 percent of their earnings to FITP on a pretax basis. OTS matches 100 percent ofthe first five percent that an employee contributes.
UNITED STATES DEPARTMENT OF THE TREASURYOFFICE OF THRIFT SUPERVISION
NOTES TO FINANCIAL STATEMENTS
29
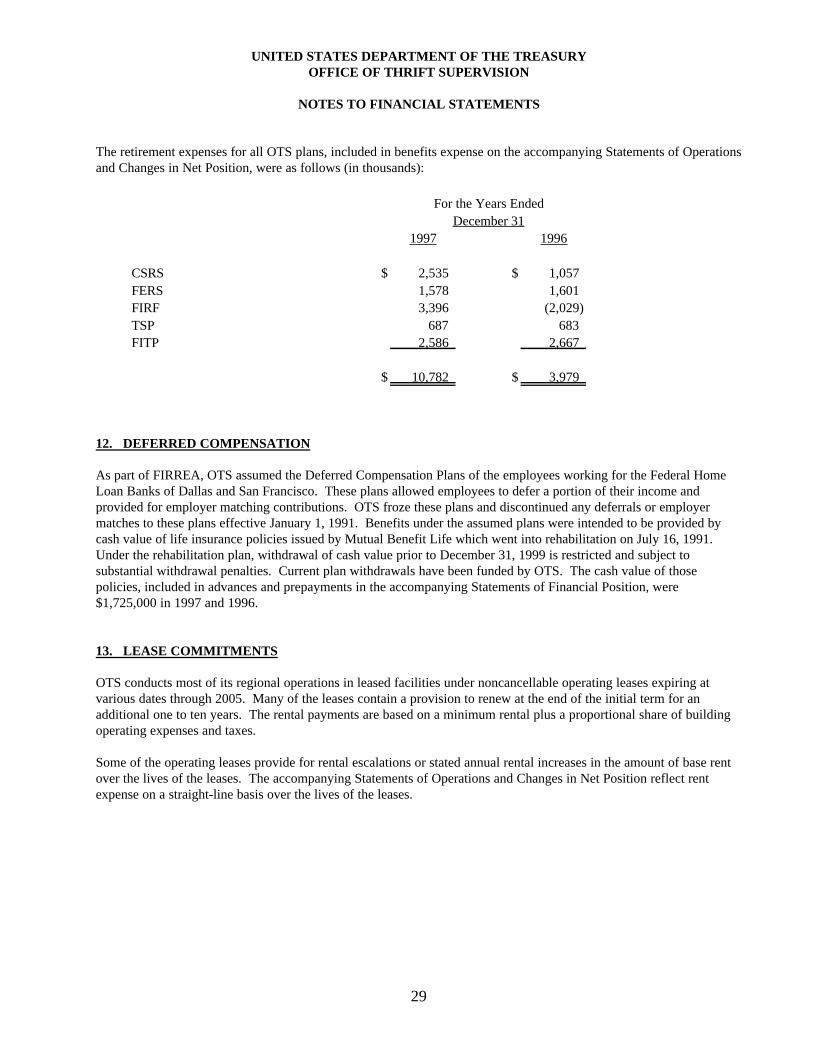
The retirement expenses for all OTS plans, included in benefits expense on the accompanying Statements of Operationsand Changes in Net Position, were as follows (in thousands):
For the Years EndedDecember 31
1997 1996
CSRS $ 2,535 $ 1,057FERS 1,578 1,601FIRF 3,396 (2,029)TSP 687 683FITP 2,586 2,667
$ 10,782 $ 3,979
12. DEFERRED COMPENSATION
As part of FIRREA, OTS assumed the Deferred Compensation Plans of the employees working for the Federal HomeLoan Banks of Dallas and San Francisco. These plans allowed employees to defer a portion of their income andprovided for employer matching contributions. OTS froze these plans and discontinued any deferrals or employermatches to these plans effective January 1, 1991. Benefits under the assumed plans were intended to be provided bycash value of life insurance policies issued by Mutual Benefit Life which went into rehabilitation on July 16, 1991.Under the rehabilitation plan, withdrawal of cash value prior to December 31, 1999 is restricted and subject tosubstantial withdrawal penalties. Current plan withdrawals have been funded by OTS. The cash value of thosepolicies, included in advances and prepayments in the accompanying Statements of Financial Position, were$1,725,000 in 1997 and 1996.
13. LEASE COMMITMENTS
OTS conducts most of its regional operations in leased facilities under noncancellable operating leases expiring atvarious dates through 2005. Many of the leases contain a provision to renew at the end of the initial term for anadditional one to ten years. The rental payments are based on a minimum rental plus a proportional share of buildingoperating expenses and taxes.
Some of the operating leases provide for rental escalations or stated annual rental increases in the amount of base rentover the lives of the leases. The accompanying Statements of Operations and Changes in Net Position reflect rentexpense on a straight-line basis over the lives of the leases.
UNITED STATES DEPARTMENT OF THE TREASURYOFFICE OF THRIFT SUPERVISION
NOTES TO FINANCIAL STATEMENTS
30
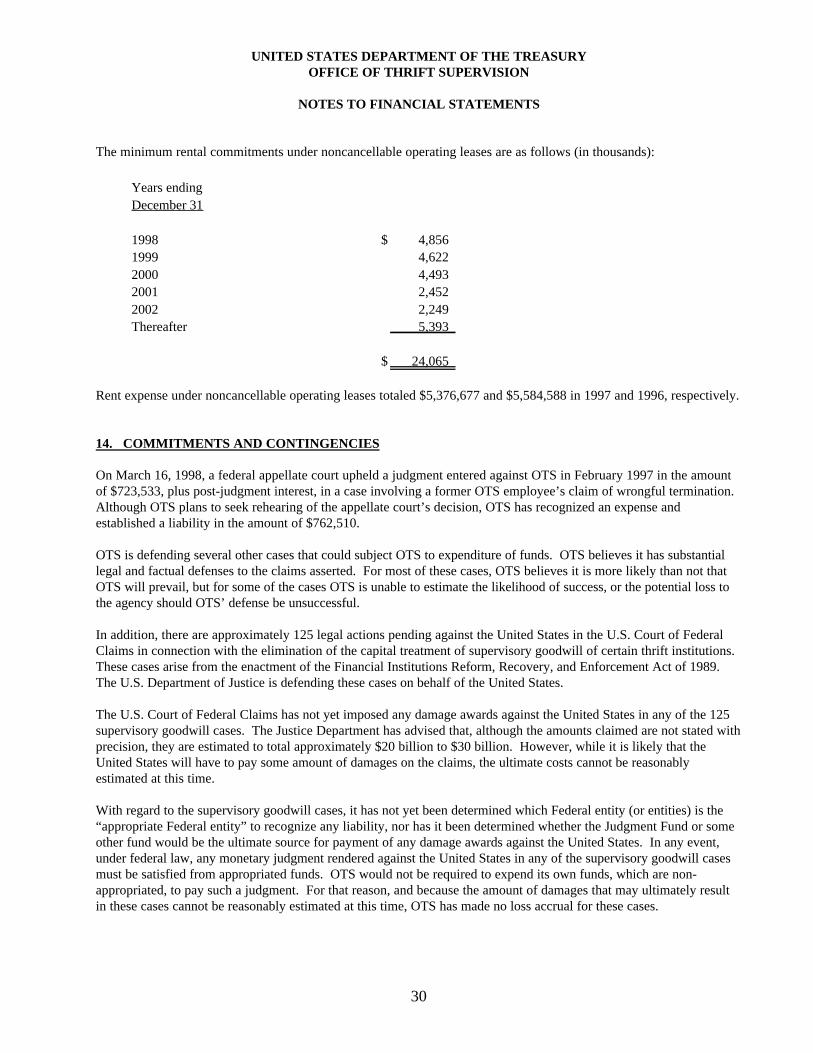
The minimum rental commitments under noncancellable operating leases are as follows (in thousands):
Years endingDecember 31
1998 $ 4,8561999 4,6222000 4,4932001 2,4522002 2,249Thereafter 5,393
$ 24,065
Rent expense under noncancellable operating leases totaled $5,376,677 and $5,584,588 in 1997 and 1996, respectively.
14. COMMITMENTS AND CONTINGENCIES
On March 16, 1998, a federal appellate court upheld a judgment entered against OTS in February 1997 in the amountof $723,533, plus post-judgment interest, in a case involving a former OTS employee’s claim of wrongful termination.Although OTS plans to seek rehearing of the appellate court’s decision, OTS has recognized an expense andestablished a liability in the amount of $762,510.
OTS is defending several other cases that could subject OTS to expenditure of funds. OTS believes it has substantiallegal and factual defenses to the claims asserted. For most of these cases, OTS believes it is more likely than not thatOTS will prevail, but for some of the cases OTS is unable to estimate the likelihood of success, or the potential loss tothe agency should OTS’ defense be unsuccessful.
In addition, there are approximately 125 legal actions pending against the United States in the U.S. Court of FederalClaims in connection with the elimination of the capital treatment of supervisory goodwill of certain thrift institutions.These cases arise from the enactment of the Financial Institutions Reform, Recovery, and Enforcement Act of 1989.The U.S. Department of Justice is defending these cases on behalf of the United States.
The U.S. Court of Federal Claims has not yet imposed any damage awards against the United States in any of the 125supervisory goodwill cases. The Justice Department has advised that, although the amounts claimed are not stated withprecision, they are estimated to total approximately $20 billion to $30 billion. However, while it is likely that theUnited States will have to pay some amount of damages on the claims, the ultimate costs cannot be reasonablyestimated at this time.
With regard to the supervisory goodwill cases, it has not yet been determined which Federal entity (or entities) is the“appropriate Federal entity” to recognize any liability, nor has it been determined whether the Judgment Fund or someother fund would be the ultimate source for payment of any damage awards against the United States. In any event,under federal law, any monetary judgment rendered against the United States in any of the supervisory goodwill casesmust be satisfied from appropriated funds. OTS would not be required to expend its own funds, which are non-appropriated, to pay such a judgment. For that reason, and because the amount of damages that may ultimately resultin these cases cannot be reasonably estimated at this time, OTS has made no loss accrual for these cases.