Frog Dissection Why are we dissecting frogs?? dissecting frogs??

1995-2015The State of Marsh
Birds and FrogsNottawasaga Valley - Lake Simcoe watershed report
Sora and Wood Frog. Photos: Jim Richards

ABOUT THE GREAT LAKES MARSH MONITORING PROGRAM
The Great Lakes Marsh Monitoring Program was launched bi-nationally in 1995 by Bird Studies Canada (then Long Point Bird Observatory) in partnership with Environment Canada and the United States Environmental Protection Agency. Over the years, more than 1500 Citizen Scientists have collected data on birds, frogs, and their habitats at more than 6000 unique survey locations throughout the Great Lakes basin (Fig. 1, 2). This impressive effort allows us to achieve many important outcomes, including:
1. Assess populations of marsh birds and frogs at scales ranging from individual marshes to the entire Great Lakes basin;2. Investigate links between marsh birds and frogs and habitat;3. Contribute to conservation management and planning; and4. Increase awareness of the importance of wetlands.
2
SUMMARY: NOTTAWASAGA VALLEY - LAKE SIMCOE WATERSHED
This report takes a snapshot of the occurrence of marsh birds and frogs within the Nottawasaga Valley - Lake Simcoe watershed compared to other watersheds in southern Ontario using Great Lakes Marsh Monitoring Program data collected between 1995 and 2015. It also compares the historical and current distribution of wetlands within the Nottawasaga Valley - Lake Simcoe watershed. Despite huge losses of wetlands, most marsh bird and frog species occurred at higher frequencies within the watershed compared to a more agriculture-dominated and a more urban-dominated watershed. This was probably because wetlands in the Nottawasaga Valley - Lake Simcoe watershed were bigger and surrounded by higher amounts of forest and wetland—conditions favoured by many species.
We conclude that marshes within the Nottawasaga Valley - Lake Simcoe watershed are healthy compared to most marshes in the rest of southern Ontario. Agricultural and urban land use is expected to increase and intensify in the watershed in years to come. The future health of the watershed’s wetlands depends on balancing further development with effective conservation of wetlands and their surrounding landscapes. Challenging prospects, but well worth the effort due to enormous social, economic, and ecological return on investment.
Fig. 1. Number of Great Lakes Marsh Monitoring Program stations surveyed per year between 1995 and 2015 throughout the Great Lakes basin.
Fig. 2. Locations of Great Lakes Marsh Monitoring Program stations surveyed for birds and/or frogs in at least 1 year between 1995 and 2015. Note that each dot represents 1–8 stations.
Nottawasaga Valley - Lake Simcoe watershed report 3
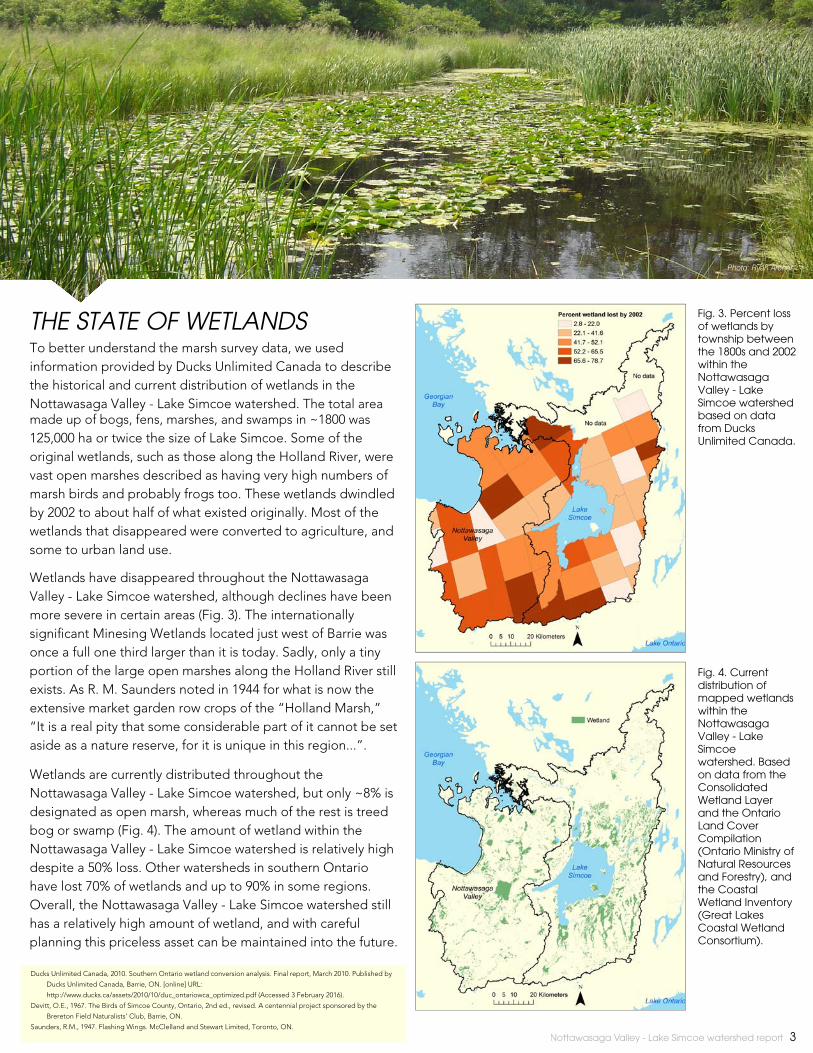
THE STATE OF WETLANDSTo better understand the marsh survey data, we used information provided by Ducks Unlimited Canada to describe the historical and current distribution of wetlands in the Nottawasaga Valley - Lake Simcoe watershed. The total area made up of bogs, fens, marshes, and swamps in ~1800 was 125,000 ha or twice the size of Lake Simcoe. Some of the original wetlands, such as those along the Holland River, were vast open marshes described as having very high numbers of marsh birds and probably frogs too. These wetlands dwindled by 2002 to about half of what existed originally. Most of the wetlands that disappeared were converted to agriculture, and some to urban land use.
Wetlands have disappeared throughout the Nottawasaga Valley - Lake Simcoe watershed, although declines have been more severe in certain areas (Fig. 3). The internationally significant Minesing Wetlands located just west of Barrie was once a full one third larger than it is today. Sadly, only a tiny portion of the large open marshes along the Holland River still exists. As R. M. Saunders noted in 1944 for what is now the extensive market garden row crops of the “Holland Marsh,” “It is a real pity that some considerable part of it cannot be set aside as a nature reserve, for it is unique in this region...”.
Wetlands are currently distributed throughout the Nottawasaga Valley - Lake Simcoe watershed, but only ~8% is designated as open marsh, whereas much of the rest is treed bog or swamp (Fig. 4). The amount of wetland within the Nottawasaga Valley - Lake Simcoe watershed is relatively high despite a 50% loss. Other watersheds in southern Ontario have lost 70% of wetlands and up to 90% in some regions. Overall, the Nottawasaga Valley - Lake Simcoe watershed still has a relatively high amount of wetland, and with careful planning this priceless asset can be maintained into the future.
Ducks Unlimited Canada, 2010. Southern Ontario wetland conversion analysis. Final report, March 2010. Published by
Ducks Unlimited Canada, Barrie, ON. [online] URL:
http://www.ducks.ca/assets/2010/10/duc_ontariowca_optimized.pdf (Accessed 3 February 2016).
Devitt, O.E., 1967. The Birds of Simcoe County, Ontario, 2nd ed., revised. A centennial project sponsored by the
Brereton Field Naturalists’ Club, Barrie, ON.
Saunders, R.M., 1947. Flashing Wings. McClelland and Stewart Limited, Toronto, ON.
Photo: Ryan Archer
Fig. 3. Percent loss of wetlands by township between the 1800s and 2002 within the Nottawasaga Valley - Lake Simcoe watershed based on data from Ducks Unlimited Canada.
Fig. 4. Current distribution of mapped wetlands within the Nottawasaga Valley - Lake Simcoe watershed. Based on data from the Consolidated Wetland Layer and the Ontario Land Cover Compilation (Ontario Ministry of Natural Resources and Forestry), and the Coastal Wetland Inventory (Great Lakes Coastal Wetland Consortium).
Photo: Ryan Archer

4 Nottawasaga Valley - Lake Simcoe watershed report
METHODOLOGYSurveys—Marshes were chosen by volunteers or randomly assigned, were at least 1 ha in size, and were covered mostly by non-woody plants such as cattails or grasses. Participants recorded each bird or frog species seen or heard within semi-circular, 100 m-radius stations. Each station was visited 2–3 times during the breeding season in each year that the station was scheduled for surveying. Visits were timed to maximize the chances of detecting as many species as possible. Stations were visited in mornings or evenings for birds, at night for frogs, and only under favourable weather conditions. Volunteers broadcasted calls during bird surveys to entice secretive species to reveal their presence by approaching or responding vocally. Habitat information was collected annually at each station. Most stations (90%) were located on shore and were placed to avoid double-counting individuals (more than 250 m apart for birds; more than 500 m apart or back-to-back for frogs).
Analyses—We used site-occupancy modeling to calculate the proportion of stations occupied by each of eight marsh-breeding bird and six marsh-breeding frog species.To do so we randomly chose one year of data from each survey station to generate a single measure for each species representing the entire period from 1995 to 2015. This technique was determined to be the most powerful for identifying meaningful differences. We attempted to
calculate the proportion of stations occupied by American Coot, Sora, American Toad, and Northern Leopard Frog, but the results were statistically unreliable. We calculated average values across each watershed to determine the proportion of stations covered by selected habitat variables and, by using a Geographic Information System, the proportion of land within 3000 m of each station covered by selected land use variables. We used 95% confidence intervals to show the level of uncertainty in each value: the wider the interval, the greater the uncertainty. Differences between values were deemed statistically significant when confidence intervals did not overlap.
To assess the status of marsh birds and frogs, we calculated the proportion of stations occupied by each species within the Nottawasaga Valley - Lake Simcoe watershed compared to the agriculture-dominated watershed of mostly the Cedar River in extreme southwestern Ontario (Ag) and the urban-dominated watershed of mostly of the Credit and Humber Rivers in the Greater Toronto Area (Urb). We chose these areas for comparison because agricultural and urban land uses are among the strongest human stressors influencing wetlands in the Nottawasaga Valley - Lake Simcoe watershed. Through these comparisons, we aimed to show what the marsh bird and frog community of the Nottawasaga Valley - Lake Simcoe watershed would look like if these two stressors increase beyond current levels.
Photo: Jody Allair Photo: Jody Allair Photo: Jody Allair
Photo: Beth Goeppinger Photo: Sean Rootham Photo: David Featherstone

Nottawasaga Valley - Lake Simcoe watershed report 5
THE STATE OF MARSH BIRDS AND FROGS
The dataset for this report consisted of 986 bird surveys conducted at 449 stations and 921 frog surveys conducted at 307 stations. The stations were distributed throughout the three watersheds (Fig. 5), although the number of stations with bird, frog, or habitat data varied (Table 1).
Watershed Birds Frogs Habitat Nottawasaga Valley – Lake Simcoe 156 98 214 Agriculture-dominated 103 62 157 Urban-dominated 190 147 259 TOTAL 449 307 630
Fig. 5. Great Lakes Marsh Monitoring Program stations surveyed for birds and/or frogs in at least one year between 1995 and 2015 in three different watersheds of southern Ontario. Data from these stations were used to calculate the information shown in Fig. 6, 7, and 8. Sample sizes are given in Table 1.
Table 1. Number of Great Lakes Marsh Monitoring Program stations surveyed for birds, frogs, or habitat in at least one year between 1995 and 2015 in three different watersheds of southern Ontario.

6 Nottawasaga Valley - Lake Simcoe watershed report
Fig. 6. Percent coverage of selected habitat variables at Great Lakes Marsh Monitoring Program stations in three different watersheds of southern Ontario (1995 to 2015). Data within 100 m were estimated visually within each semicircular station. Data within 500 m and within 3000 m were measured within circular buffers in a GIS using the Ontario Land Cover Compilation (Ontario Ministry of Natural Resources and Forestry). Note that wetland within 500 m is meant to serve as an index of wetland area. Sample sizes for each watershed are listed under “Habitat” in Table 1.
Habitat analysis revealed that all of the stations in the three watersheds had similar characteristics, with these notable exceptions: agriculture-dominated stations had more Common Reed (Phragmites) compared to the other watersheds, and Nottawasaga Valley - Lake Simcoe stations were in larger wetlands with higher amounts of forest and wetland in the surrounding landscape (Fig. 6).
Marsh Wren. Photo: Jim Richards
Common Gallinule. Photo: Jim Richards
American Toad. Photo: Jim Richards

Nottawasaga Valley - Lake Simcoe watershed report 7
Fig. 7. Proportion (%) of Great Lakes Marsh Monitoring Program stations occupied by selected bird species in three different watersheds of southern Ontario (1995 to 2015). Sample sizes for each watershed are listed under “Birds” in Table 1.
The proportion of stations occupied was quite different among bird and frog species, being highest across all of the watersheds for Swamp Sparrow (45%) and Green Frog (68%), and lowest for Common Gallinule (<1%) and Gray Treefrog (21%), respectively (Fig. 7, 8). The proportion of stations occupied by 11 of the 14 bird and frog species (79%) was higher in the Nottawasaga Valley - Lake Simcoe watershed compared to the agriculture and urban-dominated watersheds, with the proportion being significantly higher by 6–48% in 8 of 11 species (57%; Fig. 7, 8). According to these results, the marsh bird and frog community and associated wetland health of the Nottawasaga Valley - Lake Simcoe watershed is currently in good shape compared to most watersheds in the rest of southern Ontario.
Fig. 8. Proportion (%) of Great Lakes Marsh Monitoring Program stations occupied by selected frog species in three different watersheds of southern Ontario (1995 to 2015). Sample sizes for each watershed are listed under “Frogs” in Table 1.

8 Nottawasaga Valley - Lake Simcoe watershed report
IT WON’T BE EASY
Fortunately, half of the original wetlands of the Nottawasaga Valley - Lake Simcoe watershed still exist, and the associated bird and frog community is still relatively healthy. However, even if the entire watershed’s remaining wetlands could be preserved immediately there would still be tremendous challenges in maintaining their health. This is partly because the wetlands are influenced by factors both within and beyond the watershed’s boundaries.
One very important factor is climate change. Increases in carbon dioxide and other gases in the atmosphere, largely due to humans burning fossil fuels, have raised surface temperatures because the gases reflect heat back to earth that would otherwise escape to space. Early-spring temperatures in April within the Lake Simcoe watershed, for example, got warmer by a few degrees between 1995 and 2008. This localized change in climate was mostly caused by carbon dioxide production from within and well beyond the watershed.
The increase in temperature, although it may seem small, is affecting marsh frogs. Analysis of Great Lakes Marsh Monitoring Program data between 1995 and 2008 within the Lake Simcoe watershed revealed that early-breeding species, such as Wood Frog, Northern Leopard Frog, and Spring Peeper, shifted peak timing of breeding earlier by 9-20 days (Fig. 9). By contrast, late-breeding species did not shift timing of breeding (Fig. 9). The shifts were very likely in response to
increasing early-spring temperatures. Whether these changes help or hinder frogs is unknown, but the changes do show that external as well as internal influences need to be carefully considered to ensure that wetlands remain healthy within the Nottawasaga Valley - Lake Simcoe watershed.
Fig. 9. Change in time of breeding (peak calling) of selected frog species at Great Lakes Marsh Monitoring Program stations in the Lake Simcoe watershed (1995 to 2008).
Walpole, A., Bowman, J., Tozer, D., Badzinski, D., 2012. Community level response to climate change: shifts in
anuran calling phenology. Herpetological Conservation and Biology 7, 249-257. [online] URL:
http://herpconbio.org/Volume_7/Issue_2/Walpole_etal_2012.pdf (Accessed 3 February 2016).
Photo: Ryan Archer

Nottawasaga Valley - Lake Simcoe watershed report 9
CONCLUSION
The Nottawasaga Valley - Lake Simcoe watershed once held enough wetlands to cover Lake Simcoe twice over. That is equal to 125,000 major league baseball fields or an area measuring 10 km x 250 km. By 2002, this impressive collection of wetlands had dwindled to half. A huge portion has been lost, but the amount of wetland is still relatively large. Most watersheds in the rest of southern Ontario have lost 70% of wetlands or in some cases up to 90%. These remaining wetlands are a precious asset, and with careful planning can be maintained well into the future.
We used Great Lakes Marsh Monitoring Program data to take a snapshot of the occurrence of marsh birds and frogs within the Nottawasaga Valley - Lake Simcoe watershed compared to a more agriculture-dominated and a more urban-dominated watershed. Despite huge losses of wetlands, most marsh bird and frog species occurred at higher frequencies within the Nottawasaga Valley - Lake Simcoe watershed compared to within the more stressed watersheds. This is probably in large part because wetlands in the Nottawasaga Valley - Lake Simcoe watershed were bigger, with more forest and wetland in the surrounding landscape. These conditions are favoured by many marsh bird and frog species, showing that marshes are healthiest if preserved completely intact and surrounded by large amounts of natural forest and wetland cover.
Marsh Wren. Photo: Jim Richards
American Coot. Photo: Jim Richards.
The Nottawasaga Valley – Lake Simcoe watershed possesses a relatively high proportion of its original wetlands, which harbour good numbers of marsh birds and frogs representing relatively healthy wetlands. However, maintaining this asset will be challenging. Influences from both within and beyond the watershed (such as climate change) will need to be carefully considered to ensure successful conservation of the entire wetland ecosystem. The future health of the watershed’s wetlands depends on balancing further development with effective conservation of wetlands and their surrounding landscapes. Challenging prospects, but well worth the effort due to enormous social, economic, and ecological return on investment.
Photo: Ryan Archer
Northern Leopard Frog. Photo: Scott Gillingwater American Coot. Photo: Jim Richards
Green Frog. Photo: Jim Richards Marsh Wren. Photo: Jim Richards

If you would like to participate in the Great Lakes Marsh Monitoring Program, or for more information, please contact:
Great Lakes Marsh Monitoring Program Volunteer CoordinatorP.O. Box 160Port Rowan, ON, N0E 1M0Courier: 115 Front Street519-586-3531 Ext. 124Toll-free 1-888-448-BIRD(2473)[email protected]/volunteer/glmmp
ACKNOWLEDGMENTSA very special thank you goes to the many dedicated Citizen Scientists who volunteered their time to collect the data used in this report. Without their continuing support, the program would not exist. Our sincere thanks also go to Kathy Jones and a network of regional coordinators, who train and help volunteers on a day-to-day basis. Kathy Jones, David Featherstone, Elaine Secord, and Gregor Beck made valuable comments that improved the report. Bird Studies Canada is grateful to the organizations listed at the bottom of this page for ongoing or recent support in Ontario and specifically in the Nottawasaga Valley - Lake Simcoe watershed, and to the following organizations for past, ongoing, or recent support throughout the Great Lakes basin: Brant Waterways Foundation, Great Lakes Commission, Great Lakes Protection Fund, Great Lakes United, Great Lakes Sustainability Fund, Audubon, Ontario Trillium Foundation, Wetland Habitat Fund, TD Friends of the Environment Foundation, United States Environmental Protection Agency, and U.S. Fish and Wildlife Service.
CitationTozer, D.C. 2016. The state of marsh birds and frogs: Nottawasaga Valley - Lake Simcoe watershed report 1995-2015. Published by Bird Studies Canada.10 pp.
This project was undertaken with the financial support of:
The Great Lakes Marsh Monitoring Program is a program of Bird Studies Canada
Partners
and
supporters:
Assistance for this project was provided by the Government of Ontario
Photo: Ryan Archer