18TH AUGUST 2017 - az750602.vo.msecnd.net AUGUST 2017. Forward Looking Statements This presentation...
35
KINGSPAN 2017 INTERIM RESULTS 18TH AUGUST 2017
Transcript of 18TH AUGUST 2017 - az750602.vo.msecnd.net AUGUST 2017. Forward Looking Statements This presentation...

KINGSPAN 2017 INTERIM RESULTS
18TH AUGUST 2017

Forward Looking Statements
This presentation contains certain forward-lookingstatements including, without limitation, the Group’sfinancial position, business strategy, plans andobjectives of management for future operations. Suchforward-looking information involves risks anduncertainties, assumptions and other factors that couldcause the actual results, performance or achievementsof the Group to differ materially from those in theforward-looking statements. The forward-lookingstatements in this presentation reflect views heldonly as of the date hereof. Neither Kingspan nor anyother person gives any representation, assurance orguarantee that the occurrence of the events expressedor implied in any forward-looking statements in thispresentation will actually occur. Kingspan undertakesno duty to and will not necessarily update any suchstatements in light of new information or futureevents, except to the extent required by anyapplicable law or regulation.
DISCLAIMER
USANeuroscience Center–
Dri-Design

THE BUSINESS
→ A global leader in high
performance insulation and
building envelopes
→ Market leading positions in
UK, Mainland Europe, North
America and Australasia
→ Proprietary technology drives
differentiation in product
performance
3
Pro
du
cts
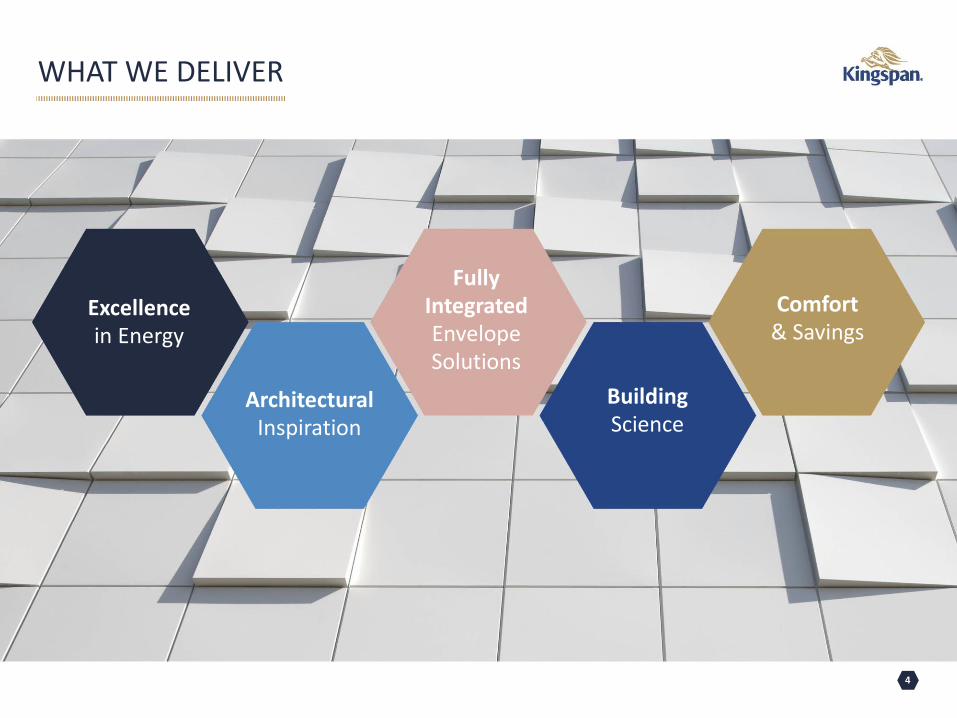
WHAT WE DELIVER
4
Excellencein Energy
Architectural Inspiration
Fully IntegratedEnvelope Solutions
Building Science
Comfort& Savings
5
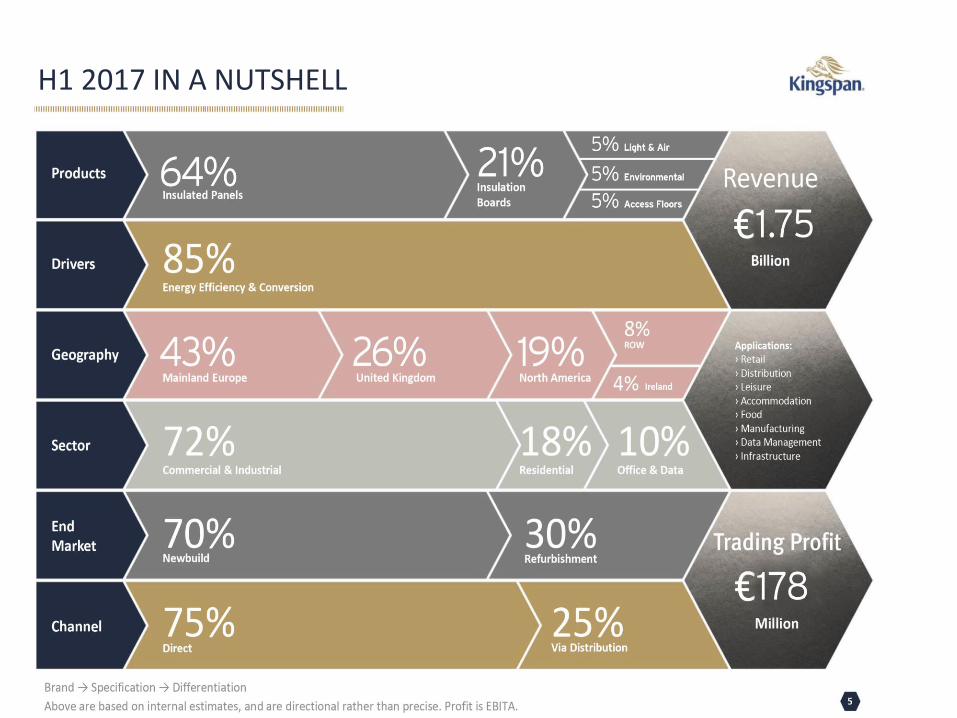
H1 2017 IN A NUTSHELL
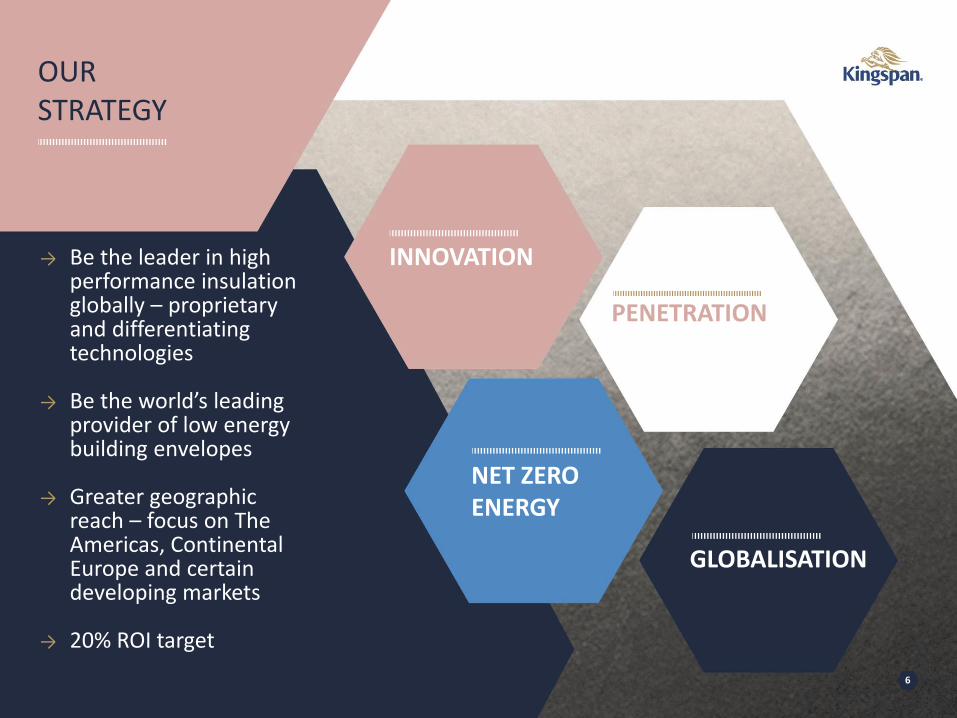
OUR STRATEGY
6
INNOVATION
GLOBALISATION
PENETRATION
NET ZERO ENERGY
→ Be the leader in high performance insulation globally – proprietary and differentiating technologies
→ Be the world’s leading provider of low energy building envelopes
→ Greater geographic reach – focus on The Americas, Continental Europe and certain developing markets
→ 20% ROI target
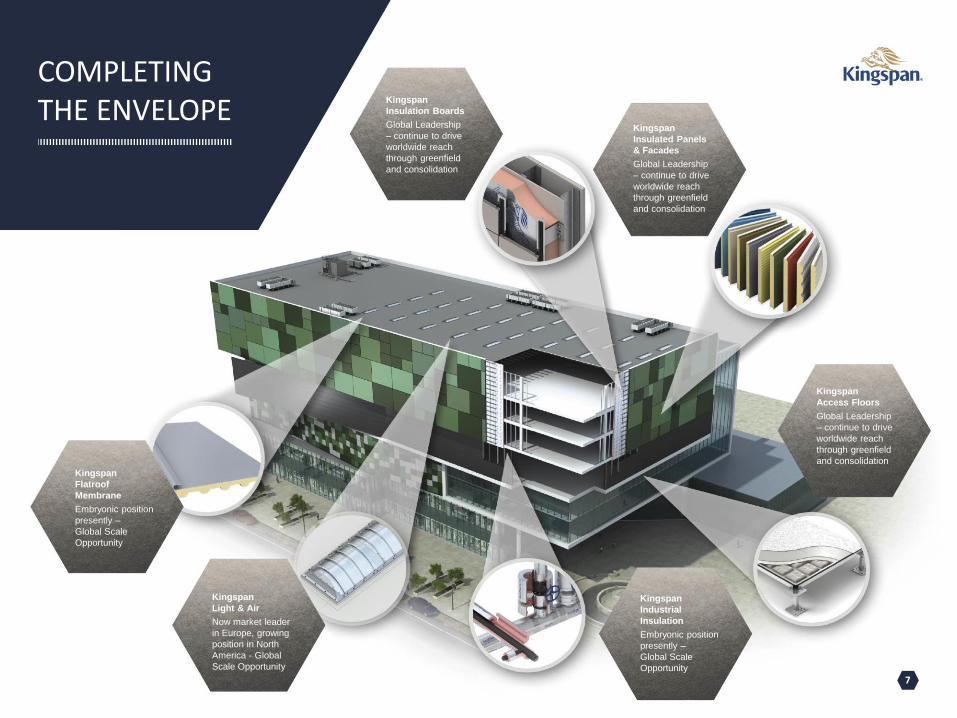
COMPLETING THE ENVELOPE
7
Kingspan
Insulation Boards
Global Leadership
– continue to drive
worldwide reach
through greenfield
and consolidation
Kingspan
Insulated Panels
& Facades
Global Leadership
– continue to drive
worldwide reach
through greenfield
and consolidation
Kingspan
Access Floors
Global Leadership
– continue to drive
worldwide reach
through greenfield
and consolidation
Kingspan
Flatroof
Membrane
Embryonic position
presently –
Global Scale
Opportunity
Kingspan
Light & Air
Now market leader
in Europe, growing
position in North
America - Global
Scale Opportunity
Kingspan
Industrial
Insulation
Embryonic position
presently –
Global Scale
Opportunity

5 YEAR FINANCIAL PERFORMANCE
8
12
2.8 14
8.5
25
5.9
34
0.9
36
5.9
2013 2014 2015 2016 2017*
Trading Profit (€m) (CAGR 31.4%)
1,7
76
.8
1,8
91
.2
2,7
74
.3
3,1
08
.5
3,5
68
.2
2013 2014 2015 2016 2017*
Revenue (€m) (CAGR 19.0%)
* Analyst consensus

H1 2017 IN SUMMARY
→ Insulated Panels sales growth of 17% with a continuing improvement in Western Europe, solid activity in the UK and tougher, although resilient, performances in North America and Eastern Europe.
→ Insulation Boards sales growth of 8% with ongoing advancement of Kooltherm® in all key markets.
→ Light & Air sales of €81.7m making a strong start in its maiden results period.
→ Environmental continues to progress positively overall.
→ Access Floors is ahead in the UK, albeit with a softer pipeline towards year end as well as subdued activity in North America.
9
Basic EPS
UP 5%
to 74.4c
Trading Profit
UP 6%
to €178m
Revenue
UP 19%
to €1.75bn

FINANCIAL HIGHLIGHTS
H1 2017 H1 2016 Change cc*
Revenue (€m) 1,749.3 1,468.1 +19% +21%
Trading Profit (€m) 177.8 167.3 +6% +10%
EBITDA (€m) 209.2 196.8 +6% +10%
Earnings per share (cent) 74.4 70.6 +5% –
Interim Dividend 11.0 10.0 +10% –
Free Cashflow (€m) 39.4 92.6 -57% –
Net Debt (€m) 440.3 348.1 +92.2m –
Trading Margin 10.2% 11.4% -120bps –
Net Debt/EBITDA 1.06x 0.9x – –
ROCE 17.3% 17.8% -50bps –
10
* Constant Currency

TRADING PROFIT & MARGIN PROGRESSION
11
Margin %
H1 16 FY 16 H1 17
Insulated Panels 11.8% 11.0% 10.5%
Insulation Boards 11.5% 11.4% 10.7%
Light & Air - - 3.7%
Environmental 5.3% 7.0% 7.5%
Access Floors 12.2% 12.5% 12.0%
Group 11.4% 11.0% 10.2%
55
.9 69
.2
11
1.7
16
7.3
17
7.8
0.0
25.0
50.0
75.0
100.0
125.0
150.0
175.0
200.0
H1 13 H1 14 H1 15 H1 16 H1 17
Trading Profit(€m)

GROUP SALES & PROFIT BRIDGE
12
1,4
68
.1 1,7
49
.3
(28
.7)
15
3.5 1
56
.4
Rev
enu
e H
1 1
6
Cu
rren
cy
Acq
uis
itio
ns
Un
der
lyin
g
Rev
enu
e H
1 1
7
Sales (€m)
16
7.3
17
7.8
(5.8
)
9.3
7.0
Trad
ing
Pro
fit
H1
16
Cu
rren
cy
Acq
uis
itio
ns
Un
der
lyin
g
Trad
ing
Pro
fit
H1
17
Trading Profit (€m)
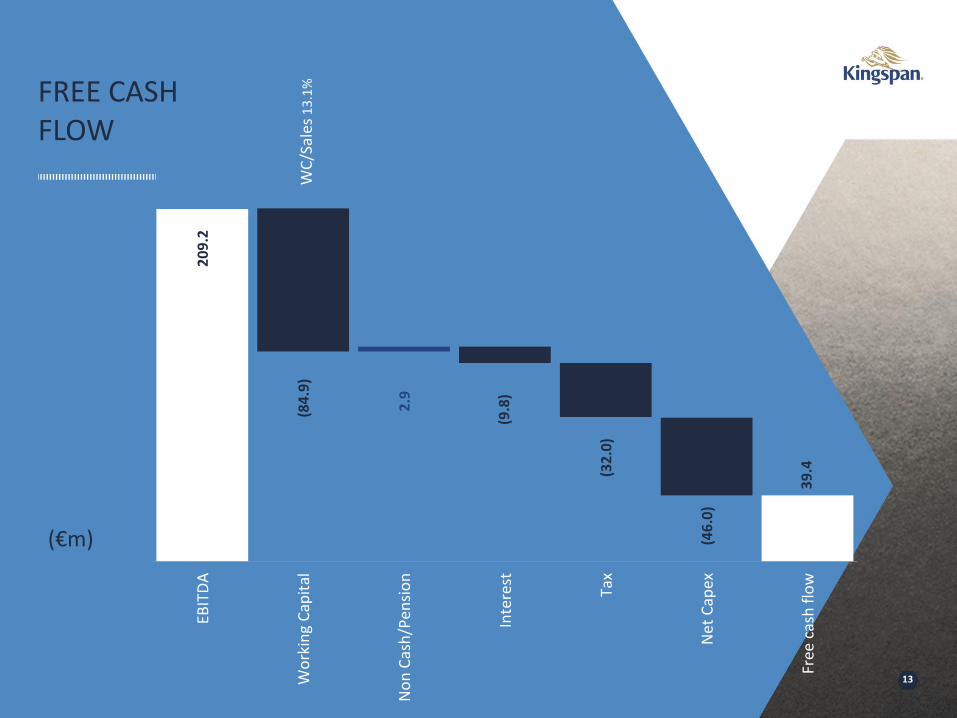
FREE CASH FLOW
13
(€m)
20
9.2
39
.4
2.9
(84
.9)
(9.8
)
(32
.0)
(46
.0)
EBIT
DA
Wo
rkin
g C
apit
al
No
n C
ash
/Pen
sio
n
Inte
rest
Tax
Ne
t C
apex
Free
cas
h f
low
WC
/Sal
es1
3.1
%

WORKING CAPITAL %
14
Average 12.7%
12
.8%
12
.7%
14
.2%
10
.5%
13
.1%
H1
13
H1
14
H1
15
H1
16
H1
17

MOVEMENT IN NET DEBT
15
42
7.9
44
0.3
8.6 42
.0
1.2
(39
.4)
Net
Deb
t D
ec 1
6
Free
Cas
h F
low
Acq
uis
itio
ns
Div
iden
d
Shar
es is
sued
/fx
etc.
Net
Deb
t Ju
ne
17
(€m)

STRONG ROCE
16
12
.3% 13
.4%
15
.2%
17
.3%
17
.3%
2013
2014
2015
2016
H1
17

USAMaryland Community Centre–
Insulated Panels
STRONG BALANCE SHEET
→ Cumulative total long term
financing of €450m raised in last 2
years at an average fixed coupon
of 1.74%.
→ Existing €300m Revolving Credit
Facility refinanced and replaced
with new €500m facility on more
favourable terms expiring in 2022.
→ Total available cash balances and
committed undrawn facilities of
€706m.
→ Weighted average maturity of
debt facilities of 5.9 years.
17

18
SALES BY GEOGRAPHY
€m H1 17 H1 16 Constant Currency Change YoY % Change
Britain & Northern Ireland 455.4 410.1 +22% +11%
Mainland Europe 759.1 592.3 +28% +28%
Americas 336.4 291.4 +12% +15%
Republic of Ireland 66.2 59.5 +11% +11%
Rest of World 132.2 114.8 +11% +15%
Group Sales 1,749.3 1,468.1 +21% +19%
H1 2016
H1 2017

INSULATED PANELS
→ Solid sales performance overall.
→ QuadCore® sales representing 5% of
total, up from virtually zero in H1 2016.
→ Western Europe strong, in particular
Benelux, France and the Nordics.
→ Germany relatively flat. Order intake
challenging with push to recover margin
in an increasingly competitive market.
→ Central Europe mixed.
→ Strong Q1 in UK, easing off in Q2 owing
to soft retail build programme.
→ Revenue comfortably ahead in North
America owing to strength of backlog at
start of 2017. 19
H1 17 H1 16
Sales (€m) 1,111.7 949.5
% of Group Sales 64% 65%
Analysis of YoY % Change
Underlying Currency Acquisitions Total
+11% -1% +7% +17%
USAOrlando City Soccer Stadium –Insulated Panels

USANorth Station Boston–
Insulated Panels INSULATED PANELS (CONT.)
→ Focus on recovery of raw material
inflation key in North America, even at
expense of market share loss.
→ Penetration rates in Australia and New
Zealand rising.
→ Non-residential activity in Turkey and
the Middle East remains subdued.
→ Medium term pipeline in Ireland
positive, albeit activity levels similar to
2016.
→ Latin American strategy progressing
well through PanelMet acquisition in
Colombia and new manufacturing site
in Mexico.
20

INSULATION BOARDS
→ UK grew significantly owing to modest volume growth, Kooltherm® advancement and pronounced selling price increases.
→ Continental Europe strong, particularly Benelux, Germany and the Nordics.
→ North America XPS line operating to capacity – in process of commissioning new line.
→ Growth in Kooltherm® conversion in Australia – supported by new plant in Melbourne.
→ Middle East performed well.
→ Encouraging progress in Ireland with raw material shortage prompting Kooltherm® conversion.
21
H1 17 H1 16
Sales (€m) 373.7 347.4
% of Group Sales 21% 24%
Analysis of YoY % Change
Underlying Currency Acquisitions Total
+11% -3% - +8%
USAD.R. Horton Offices–Insulation

LIGHT & AIR
→ New division formed in H2 2016.
→ Aim to develop global leadership
position in market for efficient
daylighting, smoke management and
ventilation systems.
→ Presently manufacturing in Ireland, UK,
France, Germany and North America.
→ Expected annual revenue of c. €200m
and margin approximately 7%.
→ Plan to develop €500m activity over
next 5 years.
22
H1 17 H1 16
Sales (€m) 81.7 -
% of Group Sales 5% -
USASouthwestern SemenaryTexas–Kingspan L&A
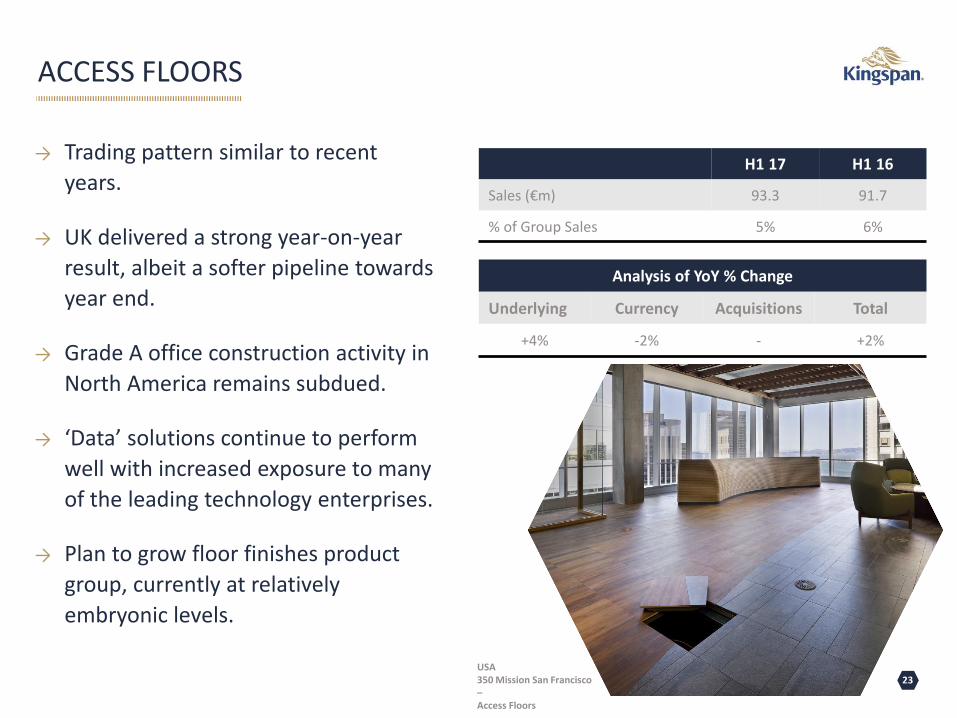
ACCESS FLOORS
→ Trading pattern similar to recent
years.
→ UK delivered a strong year-on-year
result, albeit a softer pipeline towards
year end.
→ Grade A office construction activity in
North America remains subdued.
→ ‘Data’ solutions continue to perform
well with increased exposure to many
of the leading technology enterprises.
→ Plan to grow floor finishes product
group, currently at relatively
embryonic levels.
23
H1 17 H1 16
Sales (€m) 93.3 91.7
% of Group Sales 5% 6%
Analysis of YoY % Change
Underlying Currency Acquisitions Total
+4% -2% - +2%
USA350 Mission San Francisco –Access Floors

ENVIRONMENTAL
→ Solid H1 performance, underlying
revenue +3%.
→ Rainwater harvesting in Australia a
key driver of growth. Rhino® brand
recently acquired.
→ Effluent treatment products and
Ecosafe® fuel storage performed
well.
→ Tougher trading conditions for hot
water and solar thermal products.
→ Overall progressing well.
24
H1 17 H1 16
Sales (€m) 88.9 79.5
% of Group Sales 5% 5%
Analysis of YoY % Change
Underlying Currency Acquisitions Total
+3% -6% +15% +12%
UgandaCotton On Foundation–Kingspan Rainwater

DenmarkExperimentarium Science & Leisure Centre–
Insulated Panels
OUTLOOK
→ End market activity to be broadly positive
during remainder of 2017.
→ Unrelenting chemical supply environment in
nearer term with high pricing levels and
constrained flow of materials.
→ Kingspan well positioned to at least meet the
consensus view of 2017 as a whole at current
exchange rates.
25

ADDITIONAL INFORMATION
26
MexicoLintel Office –
Insulated Panels
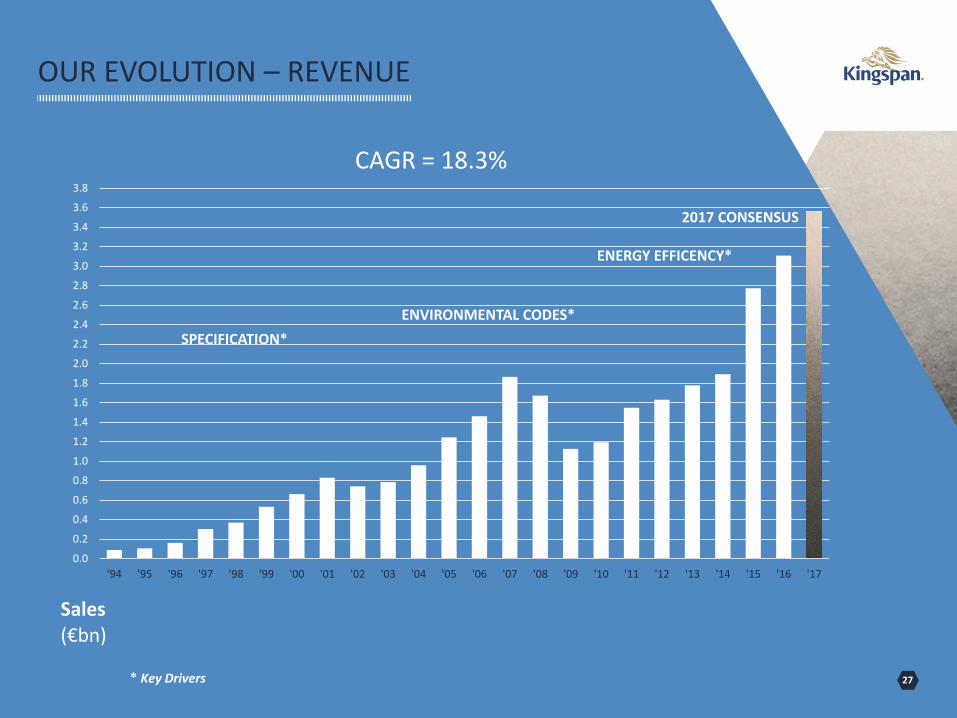
ADDITIONAL INFORMATION
0.0
0.2
0.4
0.6
0.8
1.0
1.2
1.4
1.6
1.8
2.0
2.2
2.4
2.6
2.8
3.0
3.2
3.4
3.6
3.8
'94 '95 '96 '97 '98 '99 '00 '01 '02 '03 '04 '05 '06 '07 '08 '09 '10 '11 '12 '13 '14 '15 '16 '17
Sales(€bn)
OUR EVOLUTION – REVENUE
27
ENVIRONMENTAL CODES*
SPECIFICATION*
CAGR = 18.3%
ENERGY EFFICENCY*
* Key Drivers
2017 CONSENSUS

0.0
10.0
20.0
30.0
40.0
50.0
2010 2011 2012 2013 2014 2015 2016 2017 FC
Mill
ion
s M
2
Panel Board
PANEL & BOARD – SALES VOLUME
28

Monterrey, MexicoQuadCorePanel Line Q1 2017
Winchester, USA XPS Insulation Line 2017Kooltherm Facility 2020
Dubai, UAEQuadCore Panel Line Q1 2017PIR Ducting Insulation Q1 2017Kooltherm Facility 2020
Melbourne, AustraliaKooltherm Line Q1 2017
Novosibirsk, RussiaMixed PanelLine 2020
Kankaanpää, FinlandQuadCore Panel Line Q1 2017
Leuze, BelgiumDoor Panel Line Q2 2017
Perpignan, FrancePIR RoofpanelLine Q4 2017California, USA
QuadCore Facility 2019
UKKooltherm Facility 2020
NordicsKooltherm Facility 2019
GLOBAL ORGANIC EXPANSION
29
29
29

KEY INNOVATIONS
30

31
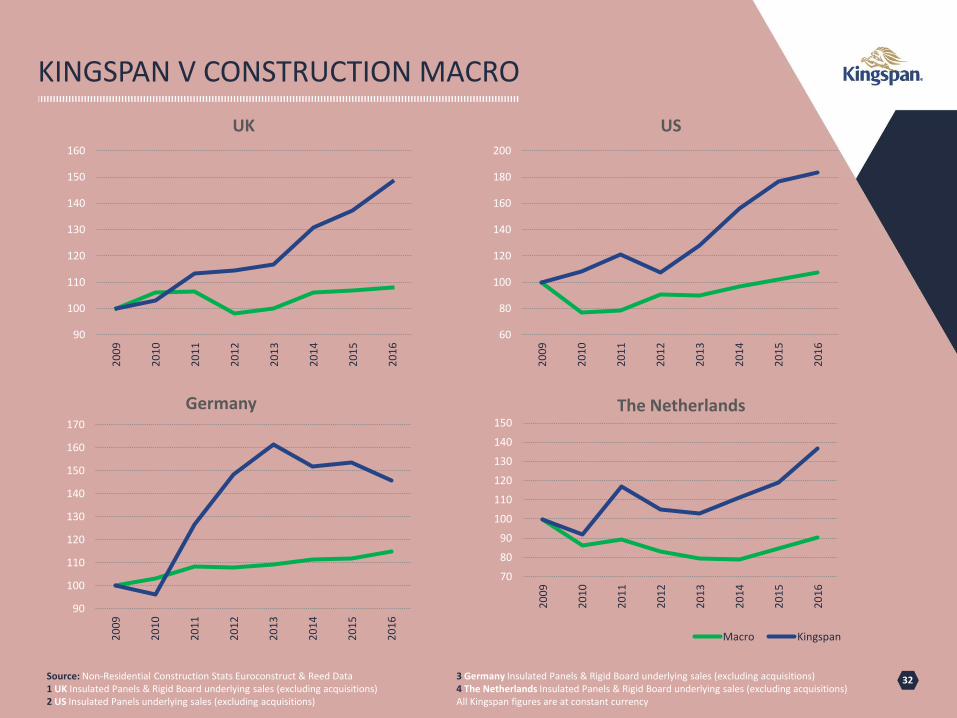
KINGSPAN V CONSTRUCTION MACRO
32Source: Non-Residential Construction Stats Euroconstruct & Reed Data1 UK Insulated Panels & Rigid Board underlying sales (excluding acquisitions)2 US Insulated Panels underlying sales (excluding acquisitions)
3 Germany Insulated Panels & Rigid Board underlying sales (excluding acquisitions)4 The Netherlands Insulated Panels & Rigid Board underlying sales (excluding acquisitions)All Kingspan figures are at constant currency
90
100
110
120
130
140
150
160
170
20
09
20
10
20
11
20
12
20
13
20
14
20
15
20
16
Germany
70
80
90
100
110
120
130
140
150
20
09
20
10
20
11
20
12
20
13
20
14
20
15
20
16
The Netherlands
Macro Kingspan
90
100
110
120
130
140
150
160
20
09
20
10
20
11
20
12
20
13
20
14
20
15
20
16
UK
60
80
100
120
140
160
180
200
20
09
20
10
20
11
20
12
20
13
20
14
20
15
20
16
US

DRIVING PENETRATION GROWTH
33
Aim to change Building Practices / Material Choices
INSULATED PANELS
INSULATION BOARDS
All above either relates to Insulation Panels or Insulation Boards penetration as a % of the respective addressable markets
0%
20%
40%
60%
80%
100%
20
05
20
16
20
20
P
Germany
0%
10%
20%
30%
40%
50%
20
05
20
16
20
20
P
UK
0%
5%
10%
15%
20%
20
05
20
16
20
20
P
North America
0%
2%
4%
6%
8%
10%
12%
14%
20
05
20
16
20
20
P
Western Europe
0%
2%
4%
6%
8%
10%
12%
14%
20
05
20
16
20
20
P
Australia
0%
20%
40%
60%
80%
100%
20
05
20
16
20
20
P
UK
34
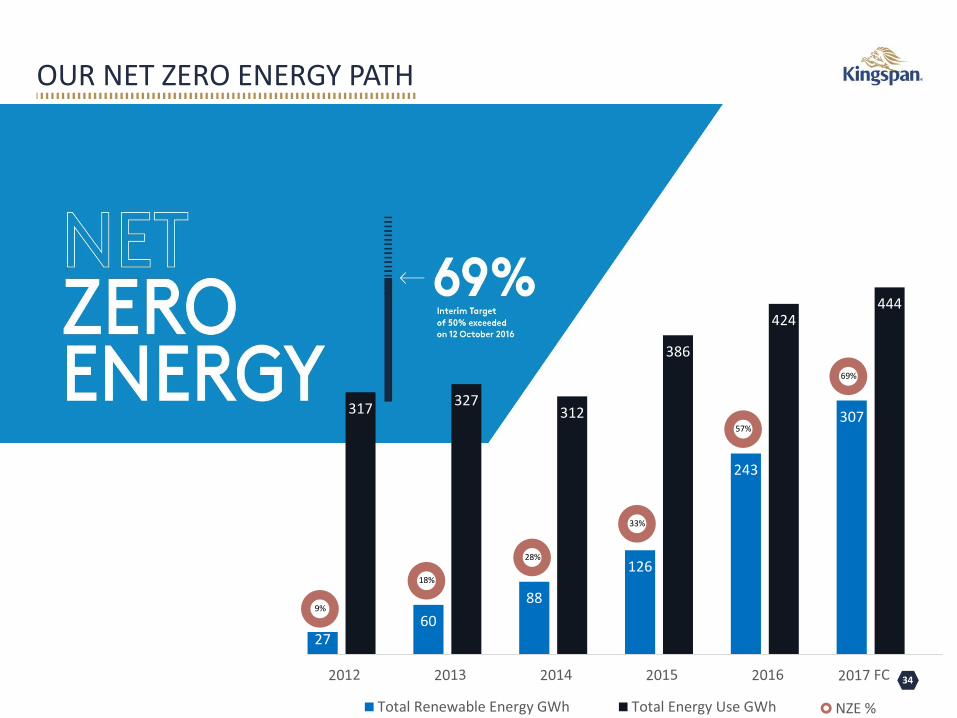
OUR NET ZERO ENERGY PATH
2760
88
126
243
307317
327312
386
424444
Total Renewable Energy GWh Total Energy Use GWh
9%
18%
28%
33%
57%
69%
NZE %