18 DAVID SUTTON PICTURES THE SALIVARY GLANDS PHARYNX AND ESOPHAGUS
90
18 DAVID SUTTON
-
Upload
muhammad-bin-zulfiqar -
Category
Education
-
view
47 -
download
2
Transcript of 18 DAVID SUTTON PICTURES THE SALIVARY GLANDS PHARYNX AND ESOPHAGUS

18DAVID SUTTON

DAVID SUTTON PICTURES
DR. Muhammad Bin Zulfiqar PGR-FCPS III SIMS/SHL

• Fig. 18.1 Digital subtracted images showing (A) a normal submandibular sialogram and (B) a normal parotid sialogram. (Courtesy of Dr P. Chennels.)

• Fig. 18.2 Fatty change in the parotids of an adult-note the low attenuation of the parotid glands (asterisks). (Courtesy of Richard W. Whitehouse.)

• Fig. 18.3 Anatomy of the parotid an parapharyngeal spaces.

• Fig. 18.4 Heterogenous mass (asterisks) filling the parapharyngeal space and displacing all the adjacent spaces. This was a Vth nerve neurofibroma extending down through the skull base into the parapharyngeal space.

• Fig. 18.5 Pleomorphic adenoma in a minor salivary gland resulting in a right-sided parapharyngeal mass.

• Fig. 18.6 Stone in submandibular duct shown on intraoral view. (Courtesy of Miss Ruth Donaldson.)

• Fig. 18.7 Longitudinal oblique sonogram of submandibular gland showing the main (Wharton's) duct.

• Fig. 18.8 Pleomorphic adenoma. (A) Axial contrast-enhanced CT through the parotid glands showing expansion of the left deep lobe and superficial lobe calcifications. (B) Axial T 2 -weighted MR image through the parotid glands showing expansion of the left deep lobe by a high-signal mass and cystic change in the superficial lobe but no evidence of calcifications.

• Fig. 18.9 Unenhanced coronal T1 -weighted MR image through the parotid glands showing a well circumscribed bilobed mass in the right superficial lobe. Diagnosis: pleomorphic adenoma.


• Fig. 18.11 Axial contrast-enhanced CT image of the left parotid gland (p) showing a mixed cystic/solid enhancing mass (arrow). Diagnosis: low-grade carcinoma.

• Fig. 18.12 (A) Obstructive sialectasis. Parotid sialogram demonstrating a non-opaque calculus in the main duct (between the arrowheads). The stone is causing obstruction, and the main duct is dilated. (Courtesy of Dr G. J. S. Parkin.) (B) Parotid duct stone and dilated main duct demonstrated by ultrasound.

• Fig. 18.13 Axial contrast-enhanced CT image of the left parotid gland showing a diffuse enlargement of the deep lobe with loss of the fat planes around the pterygoid muscles and effacement of the left side of nasopharynx (arrow). Diagnosis: deep parotid infection.

• Fig. 18.14 Parotid sialogram. (A) Multiple strictures in the main and in some of the branch ducts. Digital subtraction image. (B) Parotid sialogram shows an inflammatory parotid duct stricture (arrow) secondary to stone disease. Digital subtracted image. (C) Balloon dilatation of the stricture. (D) Postprocedure sialogram. (B-D courtesy of Dr F. Carmichael.)

• Fig. 18.14 Parotid sialogram. (A) Multiple strictures in the main and in some of the branch ducts. Digital subtraction image. (B) Parotid sialogram shows an inflammatory parotid duct stricture (arrow) secondary to stone disease. Digital subtracted image. (C) Balloon dilatation of the stricture. (D) Postprocedure sialogram. (B-D courtesy of Dr F. Carmichael.)

• Fig. 18.15 (A) Parotid sialogram showing punctate sialectasis. There are numerous small collections of contrast medium evenly distributed throughout the gland. Digital subtraction image. (Courtesy of Dr P. Chennels.) (B) Parotid sialogram showing globular sialectasis. Collections of contrast medium 1-2 mm in diameter are evenly distributed throughout the gland (one has been identified with an arrow). The intraglandular ducts are stunted, irregular and sparse. (C) Parotid sialogram showing cavitating and destructive sialectasis. There is a large cavity indicated by the white arrow. There are also numerous small irregular collections of contrast medium (some indicated by black arrows) throughout the gland, almost entirely replacing the normal intraglandular duct system. (Courtesy of Dr G. J. S. Parkin.)

• Fig. 18.15 (A) Parotid sialogram showing punctate sialectasis. There are numerous small collections of contrast medium evenly distributed throughout the gland. Digital subtraction image. (Courtesy of Dr P. Chennels.) (B) Parotid sialogram showing globular sialectasis. Collections of contrast medium 1-2 mm in diameter are evenly distributed throughout the gland (one has been identified with an arrow). The intraglandular ducts are stunted, irregular and sparse. (C) Parotid sialogram showing cavitating and destructive sialectasis. There is a large cavity indicated by the white arrow. There are also numerous small irregular collections of contrast medium (some indicated by black arrows) throughout the gland, almost entirely replacing the normal intraglandular duct system. (Courtesy of Dr G. J. S. Parkin.)

• Fig. 18.16 Axial contrast-enhanced CT image of the parotid glands showing diffuse enlargement of both glands, which are of increased attenuation (arrows). Diagnosis: infiltration with non-Hodgkin's lymphoma.

• Fig. 18.17 (A) Parotid sialogram showing a deficiency of branch ducts deep within the gland. (B) Ultrasound scan showing a hypoechoic mass within the parotid gland. Diagnosis: pleomorphic adenoma. (Courtesy of Dr P. Chennels.)

• Fig. 18.18 Axial contrast-enhanced CT through the parotid glands showing a well-circumscribed dense mass in the left superficial lobe with calcifications. Diagnosis: pleomorphic adenoma.

• Fig. 18.19 Axial contrast-enhanced CT image of the right parotid gland showing a higher attenuation non-enhancing mass containing calcification (arrow). Diagnosis: pleomorphic adenoma.

• Fig. 18.20 Parotid sialogram showing a 2.5 cm benign salivary tumour in the anterior part of the gland, which is displacing the main duct (white arrows) downward and the intraglandular ducts (black arrows) backward. The site of the tumour is devoid of ducts.

• Fig. 18.21 Axial contrast-enhanced CT image of the right parotid gland showing a septated cystic lesion with a thin smooth wall. Diagnosis: haemorrhaqic adenolymphoma (Warthin's tumour).

• Fig. 18.22 Axial T 2- weighted MR image through the parotid glands showing a diffuse high signal mass expanding the left gland and involving the adjacent parapharyngeal and masticator spaces. Diagnosis: lymphangioma.

• Fig. 18.23 Left parotid adenocarcinoma-heterogeneously enhancing mass within the left parotid gland. (Courtesy of Richard W. Whitehouse.)

• Fig. 18.24 Contrast-enhanced coronal T 1 - weighted MRI scan of the parotid glands showing enhancing recurrent tumour (arrow) in the middle cranial fossa. Diagnosis: recurrent adenoid cystic carcinoma demonstrating perineural intracranial invasion.

• Fig. 18.25 (A) Axial contrast-enhanced CT image of the left parotid gland showing a complex enhancing mass involving both deep and superficial lobes. (B) Unenhanced axial CT image revealing a large calcification (arrow). Diagnosis: carcinoma ex pleomorphic adenoma.

• Fig. 18.26 Endoscopic ultrasound of the oesophagus showing the layers of the bowel wall. A = mucosa; B = muscularis mucosa; C = submucosa; D = muscularis propria; E = adventitia. (Courtesy of Dr K. Harris.)

Fig. 18.27 Deep aspiration of barium into the left lower lobe and

• Fig. 18.28 (A) Frontal and (B) lateral views of the normal hypopharynx after a mouthful of barium has been swallowed. The large white arrow indicates a valleculum, and the lower white arrow points to the inferior recess of the pyriform sinus. Arrowheads mark the aryepiglottic folds. Circumvallate papillae (black arrows). There are a number of dental fillings.

• Fig. 18.29 (A) The normal swallow: 1, tongue propels bolus to oropharynx; 2, soft palate moves up and back to close nasopharynx; 3, posterior pharyngeal wall bulges forward to meet the soft palate. (B,C.) 4, peristaltic wave runs down pharynx; 5, hyoid bone elevates; 6, epiglottis inverts.

• Fig. 18.30 Barium swallow showing the hypopharynx. Frontal view. The epiglottis is outlined by barium (arrows). The epiglottis and aryepiglottic folds protect the larynx and in so doing bulge into the pharynx, separating the bolus of barium so that it runs down two lateral food channels (asterisks).

• Fig. 18.31 (A) Pronounced soft palate movement compensates for weakness of the tongue. (B) Pronounced tongue movement or (C) superior pharyngeal constrictor activity compensates for weakness of the soft palate. (D) Pronounced movement of the back of the tongue compensates for weakness of the pharyngeal constrictor muscles. (E) Pronounced pharyngeal constrictor activity compensates for weakness of the tongue.

• Fig.18.32 Barium swallow showing the cervical oesophagus. Lateral view. The posterior impression (arrow) is produced by failure of the cricopharyngeus muscle to relax.

• Fig. 18.33 Posterior pharyngeal diverticulum. (A) Frontal view. (B) Lateral view. Barium fills the diverticulum and then spills over into the anteriorly displaced oesophagus (arrows). (C) Lateral cervical oesophageal diverticulum (Kill ian-lamieson diverticulum).

• Fig. 18.34 A concentric upper oesophageal web seen in both the frontal and lateral projections (arrows). The way in which the web narrows the lumen is well seen in the lateral view.

• Fig. 18.35 Barium swallow showing the cervical oesophagus. Lateral view. The small irregular anterior indentation (arrow) is caused by a venous plexus. Osteophytes at the C5-6 disc space produce an impression on the back of the barium column (arrowhead).

• Fig. 18.36 Postcricoid web. Lateral view showing typical thin anterior web (arrowhead). The lumen is also restricted by cricopharyngeal spasm posteriorly helping to produce a barium jet phenomenon.

• Fig. 18.37 Postcricoid carcinoma. Lateral view showing irregular narrowing.

• Fig. 18.38 Tertiary contractions of the oesophagus seen as (A) a rippling length of the oesophagus and consists of a wave of relaxation fol- of the oesophageal wall or (B) a series of indentations resembling allowed by a slightly slower wave of contraction. Should a patient take corkscrew (hence the description 'corkscrew oesophagus').

• Fig. 18.39 Condensed image of a normal swallow. Timescale (x axis) is 30 s, y axis corresponds to the length of the oesophagus with the mouth at the top and gastric fundus at the bottom. M = mouth; D = distance; S = stomach.

• Fig. 18.40 Condensed image in a patient with pharyngeal incoordination leading to transfer dysphagia, showing fragmentation of the initial swallowed bolus but normal rate of transit through the rest of the oesophagus.

• Fig. 18.41 Condensed image from a patient with oesophagitis showing a 'step-delay' pattern with transient hold up of the bolus in the middle third of the oesophagus.
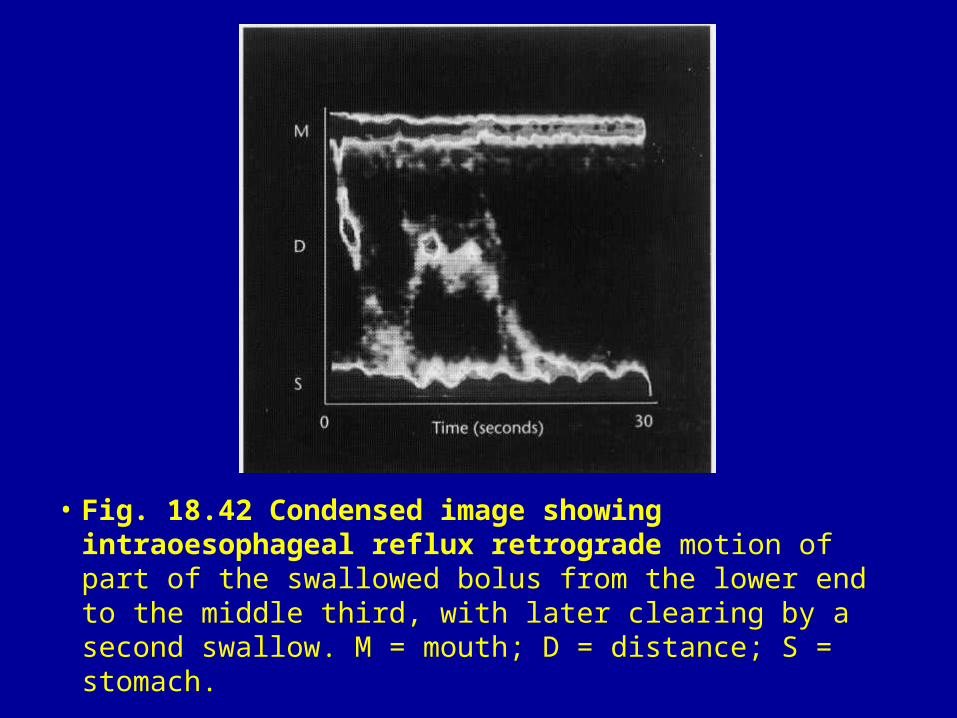
• Fig. 18.42 Condensed image showing intraoesophageal reflux retrograde motion of part of the swallowed bolus from the lower end to the middle third, with later clearing by a second swallow. M = mouth; D = distance; S = stomach.

• Fig. 18.43 Condensed image in a patient with achalasia showing stasis of the swallowed bolus in the middle third of the oesophagus, with to and fro movement caused by respiratory excursion.

Fig. 18.44 Condensed images of sequential swallows in a patient with achalasia, obtained with the patient supine (A) then with the patient semierect (B,C) and sitting (D), showing improving clearance as the patient was brought from the supine to the erect position.

• Fig. 18.45 Achalasia. The oesophagus is distended. (A) Intact oesophageal folds pass through the tapered narrowing, which corresponds to the site of the lower oesophageal sphincter. On fluoroscopy the impaired motility will be evident. (B) Sufficient barium has entered the stomach to coat the fundus and exclude an infiltrating gastric carcinoma as a cause.

• Fig. 18.46 Scleroderma. Incompetence of the gastro-oesophageal sphincter resulting in severe reflux oesophagitis with structuring, oedematous mucosa (mozaic pattern) and deep ulceration.

Fig. 18.47 Midoesophageal diverticulum seen (A) en face and (B) in profile. (C) Epiphrenic diverticulum.
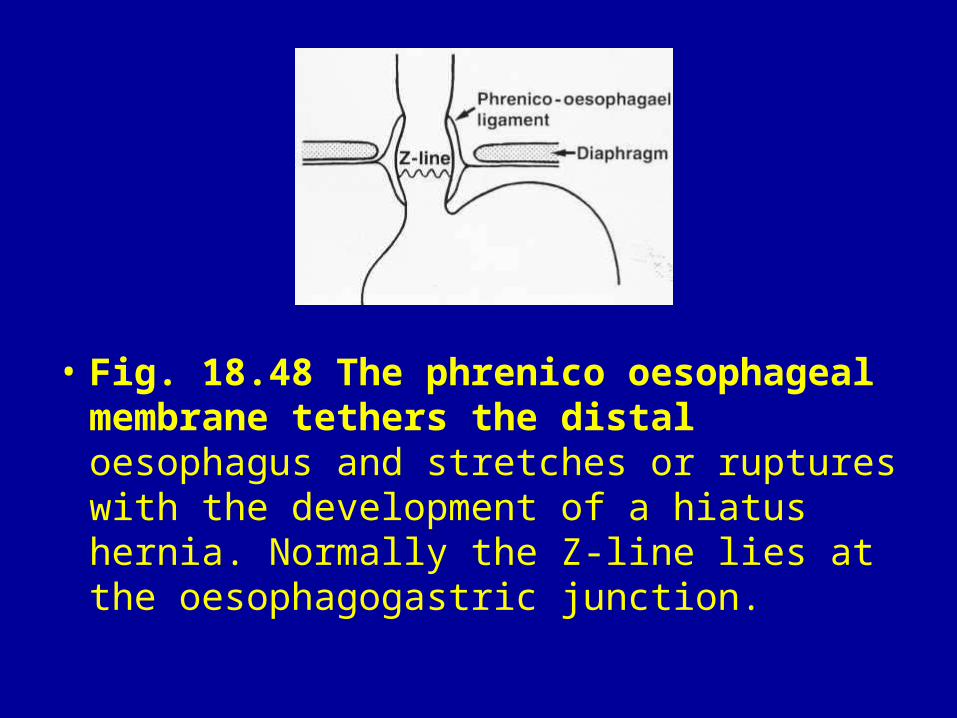
• Fig. 18.48 The phrenico oesophageal membrane tethers the distal oesophagus and stretches or ruptures with the development of a hiatus hernia. Normally the Z-line lies at the oesophagogastric junction.

• Fig. 18.49 Z-line (between the arrows) marks the junction of squamous (oesophageal) and columnar (gastric) epithelium. Gastric rugae are seen extending up to the line.

• Fig. 18.50 The lower end of the oesophagus. (A) The B-ring may normally be within 2 cm above (as shown here) or below the hiatus. Thus the oesophageal vestibule may normally be above, or straddle, the diaphragmatic hiatus. (B) Small sliding hiatus hernia with normal B-ring (between arrows).

• Fig. 18.51 (A) Schatski's ring (between arrows) demonstrated by barium swallow. (B) Bread soaked in barium has been swallowed and is lodged above the ring (between arrows).

• Fig. 18.52 Sliding hiatus hernia with peptic oesophagitis. The hiatus (between arrowheads) is wide (>3 cm) and at least three gastric folds are seen extending across it. The oesophageal mucosa is coarsely granular, indicating oesophagitis.

• Fig. 18.53 (A) Hiatus hernia with an asymmetric stricture found to be benign on biopsy. Above the stricture are a number of ulcers together with transverse folds and pseudodiverticula produced by spasm and scarring. Mucosal erosions (arrows) are present in the oesophagus above this ulcerated segment. (B) Feline oesophagus. These fine mucosal folds are a transient finding produced by contraction of the muscularis mucosa. A similar appearance may be seen in cats. It is usually a normal variant but may be associated with gastro-oesophageal reflux.

• Fig. 18.54 (A) Annular peptic stricture at the oesophagogastric junction. Areae gastricae pattern is present below the stricture. (B) Benign peptic stricture above a hiatus hernia. The stricture has smooth tapered margins. (C) Benign peptic stricture. Asymmetric ulceration and scarring has produced a stricture with irregular and shouldered margins resembling a carcinoma. Erosions on oesophageal folds give them a lobular margin resembling varices (arrows). (D) Peptic oesophagitis with a long tapered stricture resulting from the presence of a nasogastric tube.

• Fig. 18.54 (A) Annular peptic stricture at the oesophagogastric junction. Areae gastricae pattern is present below the stricture. (B) Benign peptic stricture above a hiatus hernia. The stricture has smooth tapered margins. (C) Benign peptic stricture. Asymmetric ulceration and scarring has produced a stricture with irregular and shouldered margins resembling a carcinoma. Erosions on oesophageal folds give them a lobular margin resembling varices (arrows). (D) Peptic oesophagitis with a long tapered stricture resulting from the presence of a nasogastric tube.
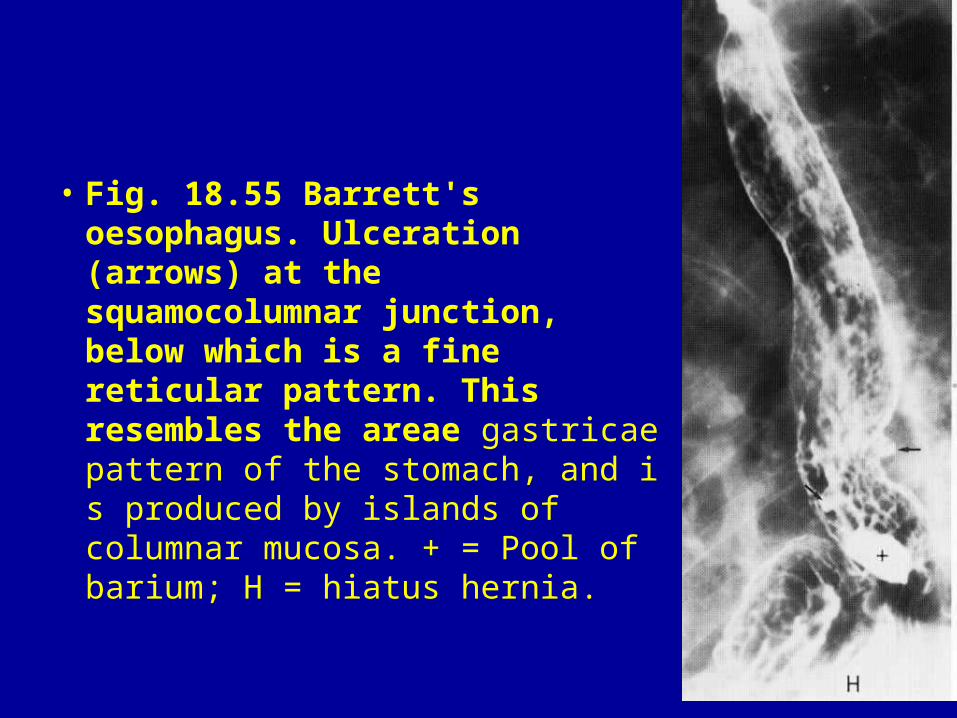
• Fig. 18.55 Barrett's oesophagus. Ulceration (arrows) at the squamocolumnar junction, below which is a fine reticular pattern. This resembles the areae gastricae pattern of the stomach, and i s produced by islands of columnar mucosa. + = Pool of barium; H = hiatus hernia.

• Fig. 18.56 Candida oesophagitis. (A) Mucosal plaques. (B) Extensive mucosal nodularity.
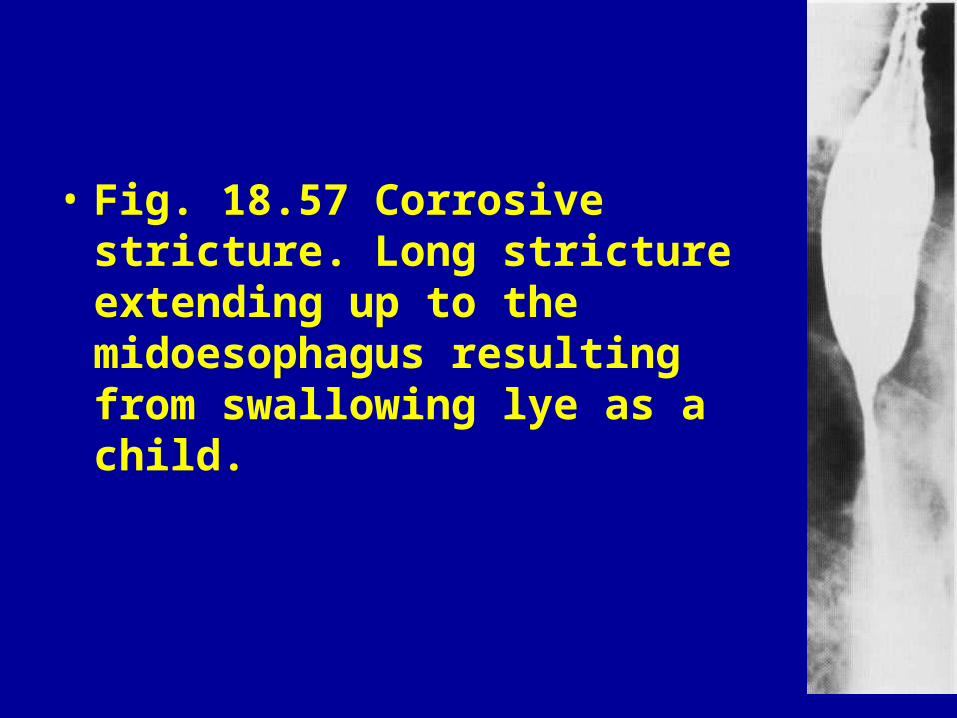
• Fig. 18.57 Corrosive stricture. Long stricture extending up to the midoesophagus resulting from swallowing lye as a child.

• Fig. 18.58 Intramural pseudodiverticulosis. (A) Multiple flask-shaped projections produced by barium entering dilated oesophageal glands. (B) Midoesophageal stricture with small flask-shaped projections. (C) A few pseudodiverticula associated with a benign peptic stricture.

• Fig. 18.59 (A) The radiographic features of a sliding hiatus hernia. H= hiatus, more than 3 cm wide with at least three gastric folds seen extending across the hiatus; S = stomach forming the hernia; B = B-ring, the oesophagogastric junction; V = vestibule. The A-ring is not visible. (B) CT scan showing the Crura of the diaphragm (arrows) separated by 28 mm (normal is 15 mm or less). The fundus of the stomach is seen herniating through the diaphragmatic hiatus. (C) Normal CT of diaphragmatic hiatus for comparison. Crura of the diaphragm are arrowed.

• Fig. 18.59 (A) The radiographic features of a sliding hiatus hernia. H= hiatus, more than 3 cm wide with at least three gastric folds seen extending across the hiatus; S = stomach forming the hernia; B = B-ring, the oesophagogastric junction; V = vestibule. The A-ring is not visible. (B) CT scan showing the Crura of the diaphragm (arrows) separated by 28 mm (normal is 15 mm or less). The fundus of the stomach is seen herniating through the diaphragmatic hiatus. (C) Normal CT of diaphragmatic hiatus for comparison. Crura of the diaphragm are arrowed.

• Fig. 18.60 Rolling (paraoesophageal) hiatus hernia. The gastric fundus (H) lies alongside the lower oesophagus (0).

• Fig. 18.61 (A) Angelchik prosthesis: a silicon ring that is placed around the intra-abdominal segment of the oesophagus to secure its position below the diaphragm. In this patient the ring has slipped down over the stomach and eroded into the stomach. Barium has leaked from the stomach around the prosthesis. (B) Radiological appearance of a failure of a fundoplication. Anatomical drawings top row, barium meal appearances bottom row. 1, Normal postoperative appearance; 2, complete disruption of wrap with recurrence of hiatus hernia; 3, wrap intact but herniates through diaphragmatic hiatus; 4, stomach slips up through wrap and bulges above diaphragm; 5, stomach slips up through wrap but remains below diaphragm. (C) Stomach slips up through wrap and bulges above diaphragm. Wrap is arrowed.

• Fig. 18.61 (A) Angelchik prosthesis: a silicon ring that is placed around the intra-abdominal segment of the oesophagus to secure its position below the diaphragm. In this patient the ring has slipped down over the stomach and eroded into the stomach. Barium has leaked from the stomach around the prosthesis. (B) Radiological appearance of a failure of a fundoplication. Anatomical drawings top row, barium meal appearances bottom row. 1, Normal postoperative appearance; 2, complete disruption of wrap with recurrence of hiatus hernia; 3, wrap intact but herniates through diaphragmatic hiatus; 4, stomach slips up through wrap and bulges above diaphragm; 5, stomach slips up through wrap but remains below diaphragm. (C) Stomach slips up through wrap and bulges above diaphragm. Wrap is arrowed.

• Fig. 18.62 Inflammatory polyp (arrows). The polyp lies at the end of a gastric fold (asterisk).

• Fig. 18.63 Leiomyoma. An echopoor mass (between arrows) is continuous with the layer of the muscularis propria.

• Fig. 18.64 Leiomyoma of the oesophagus. Two views showing features typical of an intramural or extrinsic lesion. There is a broad-based filling defect bulging into, and widening the lumen of the oesophagus.

• Fig. 18.65 Early oesophageal carcinoma. (A) A plaque lesion is seen in profile (arrowheads). (B) En face there is a central ulcer (asterisk) with a nodular margin (arrows).

• Fig. 18.66 Carcinoma of the oesophagus. (A) Advanced stricturing lesion with mucosal destruction and 'shouldering'. (B) Shallow ulcer with a tumour ring. (Courtesy of Dr D. A. Ward.) (C) Two tumour nodules. (Courtesy of Dr R. Edwards.) (D) An irregular polypoidal intraluminal filling defect which is causing obstruction. (E) Oesophageal carcinoma with submucosal extension simulating varices; however, unlike varices the width of the elongated filling defects was uninfluenced by the degree of oesophageal distension. (F) Early oesophageal carcinoma. Plaque-like squamous carcinoma (large arrows) with a small satellite lesion caused by lymphatic spread (small arrow).

• Fig. 18.66 Carcinoma of the oesophagus. (A) Advanced stricturing lesion with mucosal destruction and 'shouldering'. (B) Shallow ulcer with a tumour ring. (Courtesy of Dr D. A. Ward.) (C) Two tumour nodules. (Courtesy of Dr R. Edwards.) (D) An irregular polypoidal intraluminal filling defect which is causing obstruction. (E) Oesophageal carcinoma with submucosal extension simulating varices; however, unlike varices the width of the elongated filling defects was uninfluenced by the degree of oesophageal distension. (F) Early oesophageal carcinoma. Plaque-like squamous carcinoma (large arrows) with a small satellite lesion caused by lymphatic spread (small arrow).

• Fig. 18.66 Carcinoma of the oesophagus. (A) Advanced stricturing lesion with mucosal destruction and 'shouldering'. (B) Shallow ulcer with a tumour ring. (Courtesy of Dr D. A. Ward.) (C) Two tumour nodules. (Courtesy of Dr R. Edwards.) (D) An irregular polypoidal intraluminal filling defect which is causing obstruction. (E) Oesophageal carcinoma with submucosal extension simulating varices; however, unlike varices the width of the elongated filling defects was uninfluenced by the degree of oesophageal distension. (F) Early oesophageal carcinoma. Plaque-like squamous carcinoma (large arrows) with a small satellite lesion caused by lymphatic spread (small arrow).

• Fig. 18.67 Staging of oesophageal carcinoma by endoscopic ultrasound. (A) Diagram illustrating T staging. T1, Tumour limited to mucosa and submucosa. T2, Tumour infiltrates the muscularis propria. T3, Tumour involves adventitia. T4, Tumour invades adjacent structures, i.e. aorta, trachea, pericardium. (B) Stage T2. The muscularis propria has not been breached (black arrows). (C) Stage T2N1. The muscularis propria has not been breached. Adjacent involved malignant lymph nodes (N). Malignant nodes are round, hypoechoic and well defined with loss of internal structure. (D) Stage T4. Tumour has breached the muscularis propria and is invading the aortic wall (arrow). Ao = aorta; T = tumour; N = metastatic lymph node. (Courtesy of Dr K. Harris.)

• Fig. 18.67 Staging of oesophageal carcinoma by endoscopic ultrasound. (A) Diagram illustrating T staging. T1, Tumour limited to mucosa and submucosa. T2, Tumour infiltrates the muscularis propria. T3, Tumour involves adventitia. T4, Tumour invades adjacent structures, i.e. aorta, trachea, pericardium. (B) Stage T2. The muscularis propria has not been breached (black arrows). (C) Stage T2N1. The muscularis propria has not been breached. Adjacent involved malignant lymph nodes (N). Malignant nodes are round, hypoechoic and well defined with loss of internal structure. (D) Stage T4. Tumour has breached the muscularis propria and is invading the aortic wall (arrow). Ao = aorta; T = tumour; N = metastatic lymph node. (Courtesy of Dr K. Harris.)
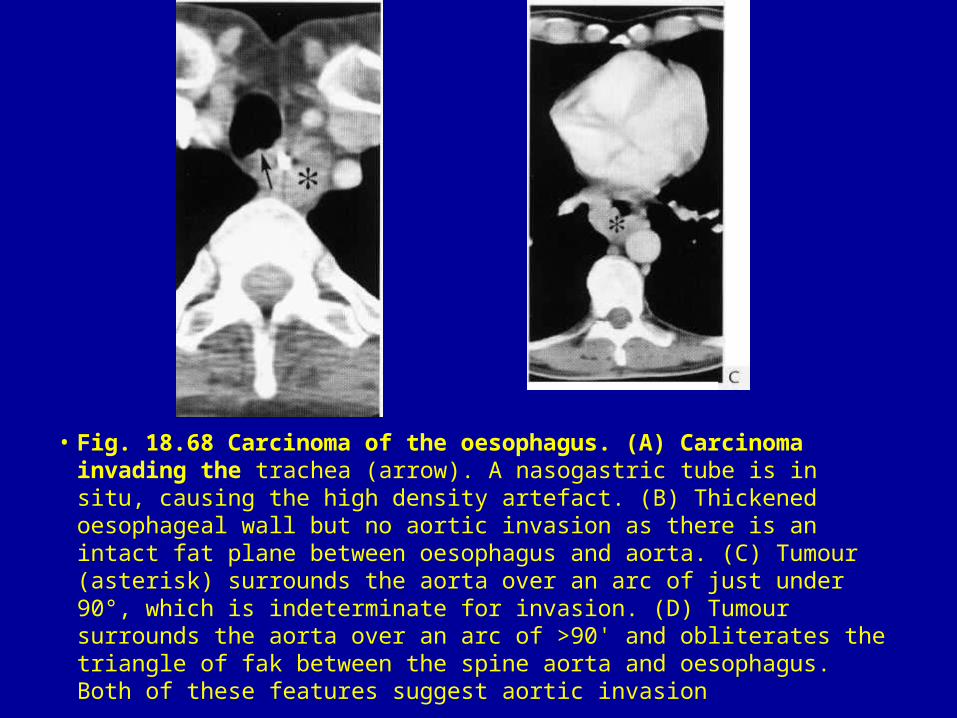
• Fig. 18.68 Carcinoma of the oesophagus. (A) Carcinoma invading the trachea (arrow). A nasogastric tube is in situ, causing the high density artefact. (B) Thickened oesophageal wall but no aortic invasion as there is an intact fat plane between oesophagus and aorta. (C) Tumour (asterisk) surrounds the aorta over an arc of just under 90°, which is indeterminate for invasion. (D) Tumour surrounds the aorta over an arc of >90' and obliterates the triangle of fak between the spine aorta and oesophagus. Both of these features suggest aortic invasion

• Fig. 18.68 Carcinoma of the oesophagus. (A) Carcinoma invading the trachea (arrow). A nasogastric tube is in situ, causing the high density artefact. (B) Thickened oesophageal wall but no aortic invasion as there is an intact fat plane between oesophagus and aorta. (C) Tumour (asterisk) surrounds the aorta over an arc of just under 90°, which is indeterminate for invasion. (D) Tumour surrounds the aorta over an arc of >90' and obliterates the triangle of fak between the spine aorta and oesophagus. Both of these features suggest aortic invasion

• Fig. 18.69 Enlarged subcarinal (white arrow) and paraoesophageal (black arrows) lymph nodes in a patient with advanced oesophageal carcinoma. Note dilated oesophagus with air fluid level proximal to the tumour.

• Fig. 18.70 Endoscopic ultrasound. A small amount of ascites at the margin of the left lobe of the liver.

• Fig. 18.71 Nitinol wallstent being deployed for an obstructing midoesophageal carcinoma. (Courtesy of Dr M. Sheridan.)

• Fig. 18.72 Spindle cell sarcoma. A bulky polypoid tumour arising in the midoesophagus.

• Fig. 18.73 Lower oesophageal obstruction produced by impaction of a large meat bolus.

• Fig. 18.74 (A) Mallory-Weiss syndrome. Tear in the oesophagus at its lower end caused by vomiting. Barium (arrows) has tracked through the defect to lie beneath the mucosa. (B) Mucosal tear and intramural haematoma spreading along the length of one side of the oesophagus. The patient had swallowed a meat bone.

• Fig. 18.75 Oesophageal varices. Typical worm-like filling defects.

• Fig. 18.76 Confluence of pulmonary veins behind the left atrium producing an extrinsic impression on the anterior oesophageal wall (arrows).

• Fig. 18.77 Oesophageal displacement by a dilated aorta. (A) Lateral view shows narrowing at the gastro-oesophageal junction resembling achalasia but caused by displacement, as the oesophagus is of normal width in the frontal view (B).

• Fig. 18.78 Aberrant right subclavian artery producing characteristic extrinsic defect (arrows) of the oesophagus just above the level of the aortic arch. Left anterior oblique view.