161 PD, Long Term (MLTSS) - Society of Actuaries · PDF fileSession 161 PD, Medicaid Managed...
54
Session 161 PD, Medicaid Managed Long Term Services and Supports (MLTSS) Moderator: Don Killian, FSA, MAAA Presenters: Maria Catherine Dominiak, FSA, MAAA Sabrina H. Gibson, FSA, MAAA Don Killian, FSA, MAAA SOA Antitrust Disclaimer SOA Presentation Disclaimer
Transcript of 161 PD, Long Term (MLTSS) - Society of Actuaries · PDF fileSession 161 PD, Medicaid Managed...

Session 161 PD, Medicaid Managed Long Term Services and Supports (MLTSS)
Moderator:
Don Killian, FSA, MAAA
Presenters: Maria Catherine Dominiak, FSA, MAAA
Sabrina H. Gibson, FSA, MAAA Don Killian, FSA, MAAA
SOA Antitrust Disclaimer SOA Presentation Disclaimer

Society of Actuaries Annual MeetingOctober 2016

Moderator: Don Killian, FSA, MAAA Speakers:◦Maria Dominiak, FSA, MAAA◦ Sabrina Gibson, FSA, MAAA

Managing partner and founder of Airam Actuarial Consulting. Specializes in integrated Medicare and Medicaid models for dually eligible
beneficiaries and Medicaid MLTSS. Over 25 years of experience consulting to over 15 states and the federal
government both in Medicaid managed care and fee-for-service delivery systems. Currently part of the team supported by the West Health Policy Center that is
focused on examining new rate-setting approaches for MLTSS in eight states. Part of the Integrated Care Resource Center (ICRC) team supported by CMS
Medicare-Medicaid Coordination Office (MMCO) providing technical assistance to states on various rate setting issues related to the dual eligible financial alignment demonstration and is assisting CMS Center for Medicaid and CHIP Services (CMCS) in improving CMS guidance and oversight of Medicaid managed care rate setting, including MLTSS.

Vice President and Chief Medicaid Actuary for WellCare Health Plans. Health care for almost 20 years. Medicaid actuary for 9 years mostly with a health plan but also as a consulting
actuary. Experience with over 24 Medicaid and CHIP programs in 14 states. Active member of the American Academy of Actuaries (AAA) Medicaid workgroup
and on the committee that developed the Actuarial Standard of Practice on Medicaid Managed Care Rate Setting – ASOP 49
Participated in the AAA workgroup that advised CMS on actuarial oversight of Medicaid rate setting following the 2010 GAO report on CMS’ Oversight of Medicaid Rate Setting.
Active with the Medicaid SOA committee as a presenter of current Medicaid topics at Society of Actuaries meetings and webinars.

Senior Vice President and Chief Actuary for Centene Corporation. Health care for over 20 years. Over 13 years in Government sponsored programs.◦ Experience includes Medicaid, Medicare, and Marketplace◦ Largest Medicaid MLTSS
Experience with International markets in UK and Spain. Active member of the American Academy of Actuaries (AAA) Medicaid workgroup.

MLTSS Background Basics of MLTSS rate setting Recent implementations

MLTSS Background

Long Term Services and Supports (LTSS):◦ Paid and unpaid medical and personal care assistance ◦ Needed for several weeks, months, or years◦ When person experiences difficulty completing self-care
tasks◦ Due to aging, chronic illness, or disability
Managed LTSS is LTSS services provided through a Managed Care Organization (MCO)

LTSS provides assistance with ◦ ADLs - Activities of Daily Living - eating, bathing, dressing, etc. ◦ IADLs - Instrumental Activities of Daily Living - preparing meals, managing medication,
housekeeping, etc.
LTSS includes, but are not limited to:◦ Institutional Nursing facility care
◦ Home and Community Based Services (HCBS) Assisted living facility care Adult daycare programs Home health aide services Personal care services Assistance provided by a family caregiver


Medicaid Spending for Long-Term Services and Supports - Age 65 or Older (in Billions)

29 states currently using or planning to use MLTSS

Utilizing Home and Community Based Settings is More Cost Effective than Utilizing Nursing Facilities
2015 median annual cost
From 2002 to 2013, spending on HCBS increased from 32% of total Medicaid LTSS spending ($29.8B) to 46% ($56.6B).
Nursing Facility Home Health Adult Day Care$91,250 $45,800 $18,000
Source: Genworth, Genworth 2015 Cost of Care Survey (Richmond, VA: Genworth Financial, Inc., April 2015), https://www.genworth.com/dam/Americas/US/PDFs/Consumer/corporate/130568_040115_gnw.pdf.


Source: Truven Health Analytics, Medicaid Expenditures for Long Term Services and Supports (LTSS) in FY2013: Home and Community-Based Services Were a Majority of LTSS Spending, June 30 2015

Rate Setting for Medicaid Managed Long Term Supports and Services

Develop a rate that:◦ Meets CMS requirements per 42 CFR 438.4 (2016 regulation) and CMS
Medicaid managed care rate setting guide◦ Complies with ASOP 49 and provides for all reasonable, appropriate
and attainable costs under the contract◦ Minimizes selection bias◦ Matches payment to the risk of the enrolled population◦ Promotes policy goals of MLTSS program◦ Can be administered and operationalized

Usually reflects variations by:◦ Age (Children/Adults/Elderly)◦ Geography◦ Waiver population/diagnosis◦ Degree of frailty (Nursing Home Level of Care)
Sometimes reflects variations by:◦ Gender◦ Medicare status◦ Setting of care (Institutionalized and Community)
19

Separate Nursing Facility (NF) and HCBS rates◦ Pay separate rate cells based on setting
Transitional rate - Modified blended approach◦ Pay separate rate cells based on setting but limit the availability of the
NF rate cell to encourage the use of HCBS over NF Blended HCBS/NF rate ◦ Pay a single blended rate for those members who meet that state’s
nursing home level of care criteria regardless of setting Risk adjustment◦ Pay using a sophisticated classification algorithm based on a member’s
functional, cognitive and behavioral needs and medical condition

Base data and adjustments
Program and policy changes Trend Managed care
savings
Administration and care
management
Final capitation rates
21

Detailed claims and eligibility data Medicaid-covered services only Includes only those services covered by the capitation rate Reflects only those populations eligible to enroll in the MLTSS
program Modeled to reflect MLTSS payment structure Data sources include fee for service (FFS) or health plan
encounter data
22

FFS data ◦ MLTSS eligible population not easily identified◦ Unmet need/woodwork◦ May not reflect risk of managed care population if MLTSS enrollment is
voluntary◦ Costs outside of MMIS system◦ Reflect FFS delivery system
Encounter data◦ Quality and completeness of data varies by health plan◦ Missing encounter ($0 paid) / Sub-capitation arrangements ◦ May include in lieu of services or services outside of the state plan◦ Costs outside of encounter data system◦ Alternative payment arrangements
23

Completion factors◦ Lags in provider claim submission◦ Missing encounter data
Costs outside of the MMIS system◦ Pharmacy rebates◦ Disproportionate Share Hospital (DSH)/Graduate Medical Education
(GME) payments Retroactive eligibility Third party liability Member cost sharing and patient liability Effects of voluntary selection if enrollment is not mandatory In lieu of services Unmet need
24

Generally reflect one-time changes outside of normal trend◦ State fee schedule adjustments◦ Benefit changes◦ Eligibility changes◦ Federal mandates◦ State legislative actions
Historical changes◦ Differences in benefits, eligibility or fee schedule between the base
data and the contract period Prospective changes◦ Changes in the program that were not captured in the base data but
will be implemented prior to or during the contract period
25

Estimates change in service cost over time due to differences in practice patterns, technology, utilization, inflation and cost shifting
Used to project costs from the base period to the contract period
Applied to Utilization and Unit Cost separately or to total per member per month (PMPM) costs
Generally varies by major category of service◦ Nursing Facility and HCBS are primary trend drivers in MLTSS programs
Excludes changes in program/policy or managed care efficiency adjustments, which are applied separately
26

Reflects expected changes in service delivery for the projected MLTSS program compared to the base data period◦ Change in mix of Home and Community Based Services (HCBS) and
Nursing Facility (NF) users◦ More effective use of personal care/home health services◦ Reductions in unnecessary hospitalizations and readmissions◦ Reductions in unnecessary emergency room visits◦ Increased access to HCBS services
Adjustments vary depending on whether data source is FFS or Encounter data◦ Encounter data reflect managed care effects
Assumed costs/savings should be reasonable, appropriate and attainable
27
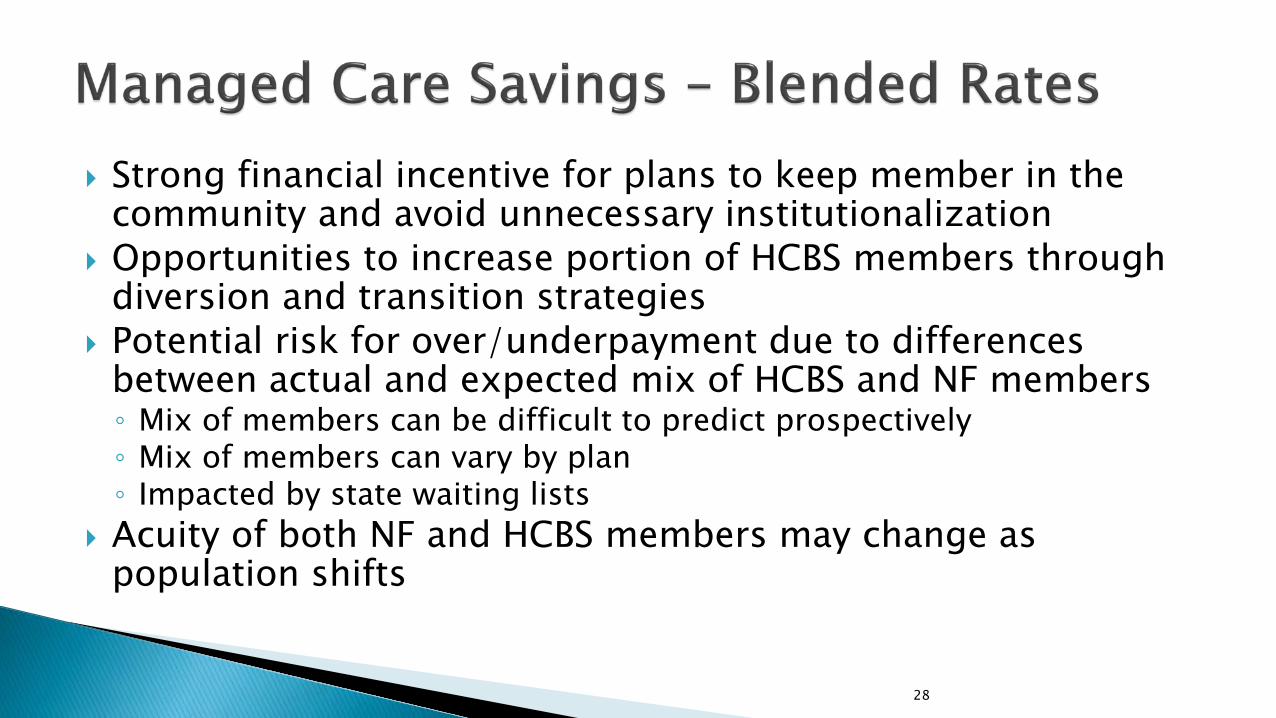
Strong financial incentive for plans to keep member in the community and avoid unnecessary institutionalization
Opportunities to increase portion of HCBS members through diversion and transition strategies
Potential risk for over/underpayment due to differences between actual and expected mix of HCBS and NF members◦ Mix of members can be difficult to predict prospectively ◦ Mix of members can vary by plan ◦ Impacted by state waiting lists
Acuity of both NF and HCBS members may change as population shifts
28

Developed as a pmpm cost, percentage of capitation rates or vary based on fixed and variable costs
Considerations include:◦ Health plan administration◦ Care management costs◦ Contribution to reserves◦ Risk margin◦ Cost of capital◦ Premium tax◦ Other fees or assessments
29

Risk adjustment not common in MLTSS program◦ No national risk adjustment model exists for MLTSS◦ LTSS costs are highly correlated with setting of care, ADLs/IADLs,
certain diagnosis codes and other non-traditional variables MLTSS risk adjustment models range in complexity ◦ Simple model based on original assignment in setting of care or count
of ADLs/IADLs◦ Complex model using a sophisticated algorithm based on a member’s
functional, cognitive and behavioral needs and medical condition Provides more equitable payments between health plans Budget neutral to state
30

Reinsurance ◦ Generally targeted to certain high cost individuals, conditions or
services◦ Arizona provides reinsurance for transplants, members receiving
certain biotech drugs, members with Von Willebrand’s disease, Gaucher’s disease, or hemophilia and certain high cost behavioral health members
Risk sharing/Risk pools◦ Health plans/State share aggregate costs that exceed a predetermined
threshold or risk corridor◦ Often used in initial years of program, or at time of significant program
change when risk is less predictable
31

MLTSS in Hawaii

• Members qualify for Medicaid when they receive LTSS services even if they earn more than the maximum allowed to be Medicaid eligible.
• Members must pay for a portion of their services each month before Medicaid begins paying.
• In a FFS environment:• For members in an institutional setting, the institution usually collects
the monthly cost share or spenddown amount from the member and bills the state for the remainder of the charges.
• For members receiving HCBS services, the member usually pays the HCBS providers up front until they meet their limit, then they send receipts to the state and the state pays other bills for the month.

Institutional (NF) ◦ Resident’s social security or other income is assigned to the provider, except for a small
personal needs allowance◦ Income is applied to per diems until exhausted. Provider then bills the state for the amount
owed for the remainder of the month◦ Example: Mary Smith has monthly SS income of $860. $800 of income is applied toward
NF and $60 is retained as personal needs allowance. NF per diem is $200. NF uses Mary’s income to cover first four days of month’s care. Remaining days are billed to the state.
HCBS ◦ Member’s monthly share-of-cost is determined by the state at the end of the month
preceding the coverage month◦ Member pays waiver provider until monthly share-of-cost is met. Provider then bills
Medicaid.
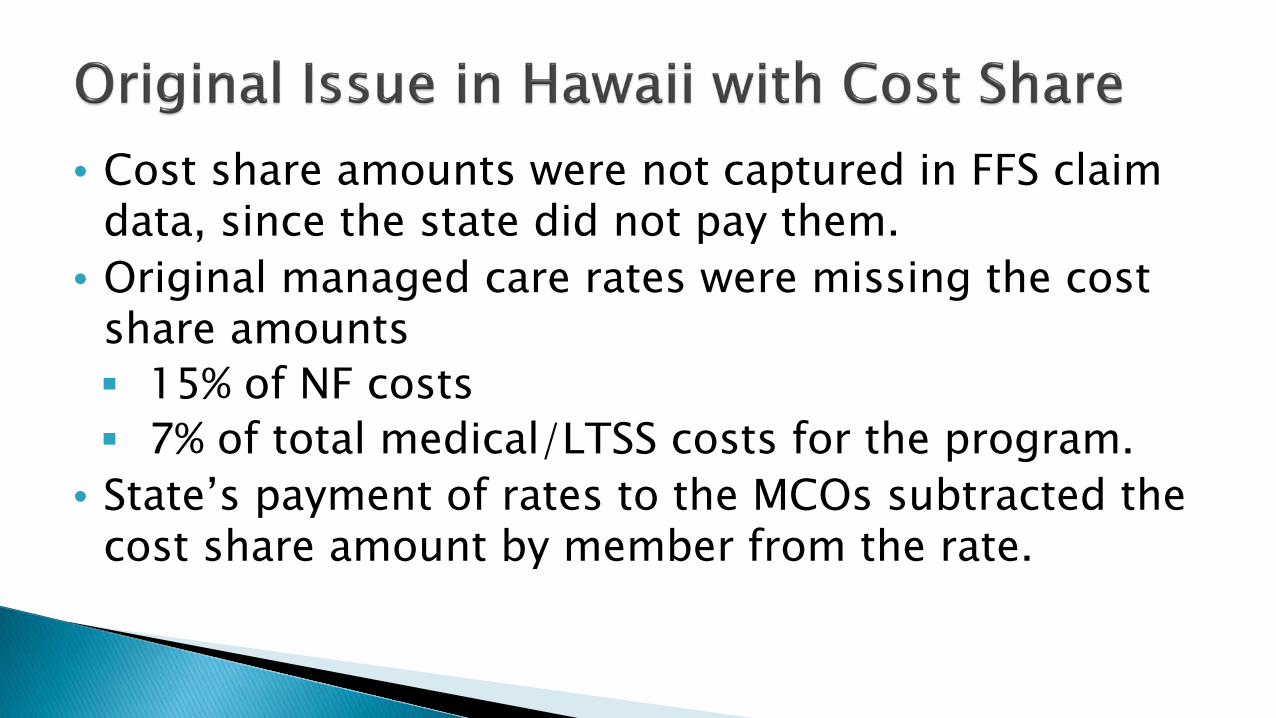
• Cost share amounts were not captured in FFS claim data, since the state did not pay them.
• Original managed care rates were missing the cost share amounts 15% of NF costs 7% of total medical/LTSS costs for the program.
• State’s payment of rates to the MCOs subtracted the cost share amount by member from the rate.

Gross Costs Member Cost Share Net Costs$4,000 $1,000 $3,000
Nursing Home Bills
$4,000
Nursing Home Collects $1,000 From Member
MCO Pays Nursing
Home $3,000

Capitation Rate Member Cost Share Net Paid to MCO$3,000 $1,000 $2,000
• Rates were developed with Net Costs instead of Gross Costs
Nursing Home Bills
$4,000
Nursing Home Collects $1,000 From Member
MCO Pays Nursing Home $3,000- only
received $2,000

• Rate setting actuary must capture the data from another source to get gross costs.
• State stores monthly member cost share requirements in a separate system.
• Actuary pulled from that data source to revise the rates and develop true gross rates.

• Some states develop net rates instead of gross rates and do not subtract member cost share from payments
Gross Costs Member Cost Share Net Costs$4,000 $1,000 $3,000
Capitation Rate Member Cost Share Paid to MCO$3,000 $1,000 $3,000
• Actuary must understand how the payment process will work in order to develop the correct capitation rate

• Months where cost share is greater than claims
• Net versus Gross payment determines development• FFS would not store member paid amounts
Jan Feb Mar Apr May Jun Jul Aug Sep Oct Nov Dec TotalMember Cost Share $200 $200 $200 $200 $200 $200 $200 $200 $200 $200 $200 $200 $2,400Claims $500 $100 $200 $500 $500 $500 $500 $100 $300 $500 $500 $500 $4,700MCO Paid $300 $0 $0 $300 $300 $300 $300 $0 $100 $300 $300 $300 $2,500
Actual Member Paid $200 $100 $200 $200 $200 $200 $200 $100 $200 $200 $200 $200 $2,200
Costs Used to Develop RatesMember Liability $2,400Paid Claims $2,500Total $4,900
Actual Costs $4,700

• Leveraging of cost share due to service trend vs social security changes.• Member income is usually social security• Social security trends at a different rate than LTSS services
Y1 Costs Trend Y2 Costs TrendMember Cost Share $2,400 2% $2,448Claims $4,700 5% $4,935MCO Paid $2,300 $2,487 8%

MLTSS in Florida and Kansas

Statewide Managed Care LTSS effective 8/1/13Covered Populations
• Long Term Care (LTC)• Non-HCBS
• Nursing Facility (NF)• Hospice
• HCBS Waivers• Assisted Living Facility (ALF)• Aged and Disabled• Adult Day Health Care• Nursing Home Diversion (NHD)• Channeling for Frail Elders
Rate Structure• Blended Rate based on Non-HCBS/HCBS mix• Varies by 11 regions• Adjusted for expected transition percentage

Transitions• Main source of managed care savings• Original rates assumed day one full transition• Transitions happen over the course of the year• Difficult to hit pricing targets unless achieve higher than expected transitions
Population Members Revenue Expenses MLR Members Revenue Expenses MLRNon-HCBS 60 5,800 5,500 94.8% 57 5,800 5,500 94.8%HCBS 40 1,400 1,300 92.9% 43 1,400 1,300 92.9%Total 100 4,040 3,820 94.6% 100 3,908 3,694 94.5%
Population Jan Feb Mar Apr May Jun Jul Aug Sep Oct Nov Dec TotalNon-HCBS 60 60 59 59 59 58 58 58 57 57 57 57 699HCBS 40 40 41 41 41 42 42 42 43 43 43 43 501Total 100 100 100 100 100 100 100 100 100 100 100 100 1,200
Medical 3,820 3,820 3,778 3,778 3,778 3,736 3,736 3,736 3,694 3,694 3,694 3,694 3,747
Revenue 3,908 3,908 3,908 3,908 3,908 3,908 3,908 3,908 3,908 3,908 3,908 3,908 3,908
MLR 97.7% 97.7% 96.7% 96.7% 96.7% 95.6% 95.6% 95.6% 94.5% 94.5% 94.5% 94.5% 95.9%
Pre-Transition Post-Transition
Calendar Year
Illustrative Example

• Implement a monthly transition target in the capitation rates
• Allows for a better match of revenue to expenses• Still provides incentive for savings
Population Jan Feb Mar Apr May Jun Jul Aug Sep Oct Nov Dec TotalNon-HCBS 60 60 59 59 59 58 58 58 57 57 57 57 699HCBS 40 40 41 41 41 42 42 42 43 43 43 43 501Total 100 100 100 100 100 100 100 100 100 100 100 100 1,200
Medical 3,820 3,820 3,778 3,778 3,778 3,736 3,736 3,736 3,694 3,694 3,694 3,694 3,747
Revenue 4,029 4,018 4,007 3,996 3,985 3,974 3,963 3,952 3,941 3,930 3,919 3,908 3,969Transition % 0.25% 0.50% 0.75% 1.00% 1.25% 1.50% 1.75% 2.00% 2.25% 2.50% 2.75% 3.00%
MLR 94.8% 95.1% 94.3% 94.5% 94.8% 94.0% 94.3% 94.5% 93.7% 94.0% 94.3% 94.5% 94.4%
Calendar Year
Illustrative Example

Statewide Managed Care LTSS effective 1/1/13Covered Populations
• LTC• Non-HCBS
• Nursing Facility (NF)• HCBS
• Frail Elderly (FE)• Physically Disabled (PD)
• Autism• Intellectual and Developmental Disabilities (IDD)• Technology Assistance (TA)• Traumatic Brain Injury (TBI)• Serious Emotional Disturbance (SED)

Rate Structure• LTC
• Blended Rate based on Non-HCBS/HCBS mix• Separate blended rate for Non-Dual/Dual
• IDD• Blended rates adjusted by region, Non-Dual/Dual, and age band
• All other waivers have a single rate cellIDD
• Approximately 9,000 eligibles• Annual expenses of $500M, of which 90% is LTSS• Additional 3,600 on wait list• Five tiers of acuity, which determine level of services and provider
reimbursement

• Member distribution within Tiers• Significant impact on financial results
OverallTier Relativity Distribution One Two ThreeTier 1 1.44 28.0% 28.0% 24.0% 33.0%Tier 2 1.18 23.0% 22.0% 21.0% 27.0%Tier 3 0.85 24.0% 20.0% 26.0% 26.0%Tier 4 0.55 13.0% 17.0% 14.0% 8.0%Tier 5 0.40 12.0% 13.0% 15.0% 6.0%
Avg Relativity 1.00 0.98 0.95 1.08
Health Plans
Illustrative Example
One Two Three TotalAvg Revenue 4,300 4,300 4,300 4,300Est Expense 3,920 3,813 4,340 4,000MLR 91.2% 88.7% 100.9% 93.0%
Health Plan

• Risk Adjustment• No accepted method
• MLR Corridor• Share in gains/losses• Provides limited protection
MLR State Health Plan92% 50% 50%94% 0% 100%96% 50% 50%
Share
Corridor One Two ThreeBefore 91.2% 88.7% 100.9%After 91.6% 90.3% 98.5%
MLR
Illustrative Example

Setting of Care• Initial assignment of a member• Historical eligibility didn’t distinguish if member was Non-HCBS or HCBS• No longer an issue since rates use health plan encounter data
Patient Responsibility• No one correct source• Led to incorrect payments to providers• Re-adjudication of numerous claims• State created system to pass correct information to health plans

LTC• Blended rate is locked in for full year• No adjustment for new or disenrolled members• Risk corridor around Non-HCBS/HCBS mix provides limited protection

Center for Health Care Strategies MLTSS rate setting resource center. http://www.chcs.org/resource/rate-setting-managed-long-term-services-supports-programs-resource-center
Robert Wood Johnson Foundation Health Policy Brief on Rebalancing Medicaid LTSS. http://www.healthaffairs.org/healthpolicybriefs/brief.php?brief_id=144
Kaiser Family Foundation Primer on MLTSS.http://kff.org/medicaid/report/medicaid-and-long-term-services-and-supports-a-primer/
Mathematica Policy Research Primer on Medicaid rate setting for MLTSS. https://www.mathematica-mpr.com/our-publications-and-findings/publications/medicaid-ratesetting-for-managed-longterm-services-and-supports-basic-practices-for-integrated
Congressional Budget Office: Rising Demand for Long-Term Services and Supports for Elderly People. https://www.openminds.com/wp-content/uploads/indres/062613cboltsstrend.pdf

Thank You Speakers!
Questions