1503 A Remote Sensing and GIS Approach to Assessing ...
16
Melanesian Journal of Geomatics and Property Studies Department of Surveying and Land Studies, ISSN: 2414-2557 40 Sekac, T., Jana, S. K. and Pal, D. K.| MJGPS | Volume 1, 2015 A Remote Sensing and GIS Approach to Assessing Multiple Environmental Factors Leading to Delineation of Flood Hazard Risk Zone in the Busu River Catchment, Morobe Province, Papua New Guinea 1 Tingneyuc Sekac, 2 Sujoy Kumar Jana and 3 Dilip Kumar Pal 1, 2, 3 Department of Surveying and Land Studies, Papua New Guinea University of Technology, Private Mail Bag, Lae 411, Morobe Province, Papua New Guinea 1 [email protected], 2 [email protected], 3 [email protected] Abstract Flooding is one of the major disasters that the Province of Morobe in Papua New Guinea (PNG) is often subjected to. The communities that dwell in the vicinity of major rivers suffer most in the aftermath of a flooding episode. The present study area, Busu River, accounts for a major source of flash flood that affects the low lying areas. The present study aims at assessing the landscape level or geomorphologic pattern of Busu river catchment culminating in delineation of flood hazard risk zone using multi-criteria evaluation and Analytical Hierarchy Process (AHP) appraisal in the GIS and Remote sensing environment. The main data layers that are chosen for carrying out the assessment consist of Landsat 8 satellite image, SRTM DEM data, soil data and rainfall data. Several thematic layers are prepared from the data base as mentioned, followed by assigning weight age to each thematic layer generated. The final flood hazard risk zone was prepared through overlay analysis of several weighted thematic layers. The output flood hazard risk zone map was delineated and reclassified as ‘very high', ‘high', ‘moderate' and ‘low’ risk zones. Keywords: Flood Hazard, Multi Criteria Evaluation, AHP, Remote Sensing, GIS 1. Introduction Flood is one of the main environmental hazards that are experienced across flood plains of the major rivers of the world. Flooding is accompanied by scores of human casualties and immense loss of property including livestock. The contributing factors of flooding may include prolonged periods of heavy rainfall, silting of riverbeds through accelerated soil erosion hence dwindled carrying capacity of the river, geometry of the catchment area, the vegetation cover, unscientific / faulty land use, etc. According to the International Federation of Red Cross and Red Crescent Societies (IFRC, 2008), every year flood disaster results in tremendous losses and social disruption across the world. In the last 30 years, flood has been the most catastrophic natural disaster affecting an average of about 80 million people every year, causing economic damage worth over US$11 million annually around the world (IFRC, 2008). The causes of flooding, how it occurs and how to carry out mitigation measures can be realised through flood hazard investigation and mapping using historical data. Before doing that, the understanding of the multiple environmental factors in the catchment area is of paramount
Transcript of 1503 A Remote Sensing and GIS Approach to Assessing ...

Melanesian Journal of Geomatics and Property Studies Department of Surveying and Land Studies, ISSN: 2414-2557
40 Sekac, T., Jana, S. K. and Pal, D. K.| MJGPS | Volume 1, 2015
A Remote Sensing and GIS Approach to Assessing Multiple Environmental Factors Leading to Delineation of Flood Hazard Risk Zone in the Busu River
Catchment, Morobe Province, Papua New Guinea
1 Tingneyuc Sekac, 2 Sujoy Kumar Jana and 3 Dilip Kumar Pal
1, 2, 3 Department of Surveying and Land Studies, Papua New Guinea University of Technology, Private Mail Bag, Lae 411, Morobe Province, Papua New Guinea
1 [email protected], 2 [email protected], 3 [email protected]
Abstract
Flooding is one of the major disasters that the Province of Morobe in Papua New Guinea (PNG) is often subjected to. The communities that dwell in the vicinity of major rivers suffer most in the aftermath of a flooding episode. The present study area, Busu River, accounts for a major source of flash flood that affects the low lying areas. The present study aims at assessing the landscape level or geomorphologic pattern of Busu river catchment culminating in delineation of flood hazard risk zone using multi-criteria evaluation and Analytical Hierarchy Process (AHP) appraisal in the GIS and Remote sensing environment. The main data layers that are chosen for carrying out the assessment consist of Landsat 8 satellite image, SRTM DEM data, soil data and rainfall data. Several thematic layers are prepared from the data base as mentioned, followed by assigning weight age to each thematic layer generated. The final flood hazard risk zone was prepared through overlay analysis of several weighted thematic layers. The output flood hazard risk zone map was delineated and reclassified as ‘very high', ‘high', ‘moderate' and ‘low’ risk zones. Keywords: Flood Hazard, Multi Criteria Evaluation, AHP, Remote Sensing, GIS
1. Introduction
Flood is one of the main environmental hazards that are experienced across flood plains of the major rivers of the world. Flooding is accompanied by scores of human casualties and immense loss of property including livestock. The contributing factors of flooding may include prolonged periods of heavy rainfall, silting of riverbeds through accelerated soil erosion hence dwindled carrying capacity of the river, geometry of the catchment area, the vegetation cover, unscientific / faulty land use, etc. According to the International Federation of Red Cross and Red Crescent Societies (IFRC, 2008), every year flood disaster results in tremendous losses and social disruption across the world. In the last 30 years, flood has been the most catastrophic natural disaster affecting an average of about 80 million people every year, causing economic damage worth over US$11 million annually around the world (IFRC, 2008).
The causes of flooding, how it occurs and how to carry out mitigation measures can be realised through flood hazard investigation and mapping using historical data. Before doing that, the understanding of the multiple environmental factors in the catchment area is of paramount

Melanesian Journal of Geomatics and Property Studies Department of Surveying and Land Studies, ISSN: 2414-2557
41 Sekac, T., Jana, S. K. and Pal, D. K.| MJGPS | Volume 1, 2015
importance. A catchment is defined as the land area that contributes runoff to a given Hydro Edge. Catchments and watersheds are land areas that drain to a Hydro Network. The determination of their boundaries is necessary for modelling a hydrologic system (Martins and Gadiga, 2015). According to the understanding of the catchment area with its surrounding geographical features, a better flood hazard mapping can be done and it will be a vital component for appropriate land use planning in flood prone areas (Ajin et al., 2013). It creates easily-read, rapidly accessible charts and maps which facilitates the administrators and planners to identify areas of risk and prioritize their mitigation efforts (Ajin et al., 2013). Due to the increasing size of population, modification of the geographical settings becomes a necessity, which in turn aggravates the frequency and ferocity of flash flooding episodes. As a result the wrong land use practices and mismanagement of the water resources and forests are accompanied alongside. Thus, faulty unsustainable practice can but exacerbate flooding.
The country PNG with its highly dissected terrains gives birth to several major rivers such as, Fly River in Western Province and Markham and Busu rivers in Morobe Province. Between the months of June and September, the country PNG experiences a wet season where communities with their properties including civil infrastructures are mostly subjected to the ordeal of flood. One of the major rivers - Busu River where the present study is concentrated, is flowing right encompassing Lae City which is the second largest industrial city in PNG. Communities located near the river face critical issues every year due to flooding of the river. Consequently, people are relocated when their houses and food gardens are washed away. The one major issue is that during every flooding, the bank cutting is common and this reduces the land availability of the city.
The study aims at identifying the possible causes of flooding and delineating flood hazard risk zone through multi-criteria evaluation and Analytical Hierarchy Process. That is each particular factor or thematic layer as mentioned is to be assessed and each class is to be weighted and normalised according to its contribution to the flooding. As discussed by Ajin et al. (2013), and Rachna and Joisy (2009) who prepared the flood hazard map of Vamanapuram River basin, a number of contributing factors including annual rainfall, size of watershed, slope of watershed, gradient of river and stream, drainage density, type of soil, land use, communication line and infrastructures were considered for rating the degree of hazard by means of weighting. Surjit and Kaushik (2012) assessed the risk and vulnerability of flood hazard in Ghaggar basin, India, using GIS. The study attempted to propose a Flood Risk Index (FRI), based on factors such as hydrology, slope, soil type, drainage density, landform and land use. Thilagavathi et al. (2011) and Punithavathi, et al. (2011) also conducted studies on flood risk assessment or flood hazard zones based on various criteria. Thus the current study adopt the same procedure or process for delineating the flood hazard risk zone of Busu River catchment area, but lack of full data will be a hindrance.
1.1 Nature of the problem
Lae City, second largest city in PNG, has experienced serious flooding episodes in the past, which caused much destruction and reduction in land availability. This is so because the city is located right near the Busu River where flooding is active and quite frequent. Thus it is vital to let Governing bodies to exactly know the different categories of flood zones within the catchment area, especially in the low lying areas where the city is located. It is contended that the

Melanesian Journal of Geomatics and Property Studies Department of Surveying and Land Studies, ISSN: 2414-2557
42 Sekac, T., Jana, S. K. and Pal, D. K.| MJGPS | Volume 1, 2015
torrential rainfall in the catchment area contributes to the severity of flooding in low lying areas. Therefore, discussing and analysing the catchment geographical conditions like soil type and drainage density could be important for the flood hazard mitigation measures. Also from the flood hazard risk zone map, the proper decision can be made to assist the city in its urban development drives. People negatively interacting with the upper catchment area are a common problem and that aggravates the flood situation in lower catchment areas. Therefore with the awareness of the hazard map, the upper catchment area community will be convinced not to resort to certain pernicious activities with the river and its surrounding environment.
1.2 Research Questions and Contributions to Knowledge
To guide the study, the following three (3) questions will form the basis of this investigation. 1. What are the main types of environmental factors that contribute to flooding hazard? 2. How can flood hazard investigation and mapping assist the community and Governing body
as a whole? 3. Is there any benefit or ways forward in applying Multi-Criteria Evaluation (MCE) and
Analytical Hierarchy Process (AHP) within GIS and Remote Sensing Environment to solve the issues of Flooding?
It is hoped that the answers to these research questions will contribute immensely to the knowledge of hazard mapping.
1.3 Study Area
The study area is Busu River catchment situated in the eastern part of Lae City, second largest city in PNG. Busu River is one of the fast flowing rivers in the country. The topography of the area consists of the river and its geomorphologic features including urban and built-up areas and agricultural lands. Thus the landscape of the study area is both flat in the low lying area and hilly towards the upper catchment area. Burep, Ninba, Tuembi, Busip, Sanem and Sankwep Rivers are the main tributaries of Busu River. The Busu River flows from north-west to south-east of Lae city. The study area encompasses 1317.72km2 and it is located around 146'60'00''E and 6'25'00"S (Figures 1 and 2).
2. Data used and Methodology
2.1 Preparation of thematic layers
The data type used was mainly digital data. For this study different types of data layers were integrated within GIS environment to delineate flood hazard risk zone for Busu River catchment in Morobe Province. Due to the data availability and also according to the literature and scientific interview with respect to flood cause, the five factors were selected and integrated through multi-criteria evaluation techniques. Multi-criteria analysis (MCA) techniques are well known decision support tools for dealing with complex decision constellations where technological, economical, ecological and social aspects have to be covered (Marinoni, 2004).

Melanesian Journal of Geomatics and Property Studies Department of Surveying and Land Studies, ISSN: 2414-2557
43 Sekac, T., Jana, S. K. and Pal, D. K.| MJGPS | Volume 1, 2015
Fig 1. Study area (Source: Author, 2015)
Fig 2. Study Area Photograph (Source: Author, 2015)
The data layers used are tabulated in Table 1. The summary of Methodology applied to generate each thematic layer and produce flood hazard zone is highlighted in the flow chart in figure 3. The thematic layers, that is, slope layer and drainage density map layer were extracted and generated from SRTM DEM using specific hydrological tools in ArcGIS 10. The thematic layers, that is, rainfall data and soil data are extracted or derived from Geobook, 2009. The land use land cover (LULC) classification thematic layer was generated using Landsat 8 satellite

Melanesian Journal of Geomatics and Property Studies Department of Surveying and Land Studies, ISSN: 2414-2557
44 Sekac, T., Jana, S. K. and Pal, D. K.| MJGPS | Volume 1, 2015
image (LOI) using ERDAS Imagine. The projection and coordinate system was defined to UTM, WGS84, zone 55 southern hemispheres. Each factor was ranked according to its potential contribution to flooding. Also the class of each factor was assigned weight age according to its potentiality in flood intensity. The assigned weight or rank for each factor or class is based on different experts' opinions; therefore, pair-wise comparison, as introduced by Saaty (1980) for weights assigned was carried out basically to normalise the weights and to calculate the consistency ratio in order to be consistent of the weights and ranks assigned (Machiwal et al., 2011).
Table 1. Data layers used
Data layers Description Source Slope factor Extracted from PNG SRTM DEM PNG
University of Technology
Drainage Density Generate from PNG SRTM DEM Land use Land cover factor/layer
Generated from Landsat 8 satellite image(28.5m spatial resolution)
Rainfall data Rain fall data was generated from Geobook, 2009 Soil data Soil data - soil texture: was derived from Geobook during Trukai
project (Samanta, 2014). Source: Author, 2015
Fig 3. Methodological Flow Chart (Source: Author, 2015)
Melanesian Journal of Geomatics and Property Studies Department of Surveying and Land Studies, ISSN: 2414-2557
45 Sekac, T., Jana, S. K. and Pal, D. K.| MJGPS | Volume 1, 2015
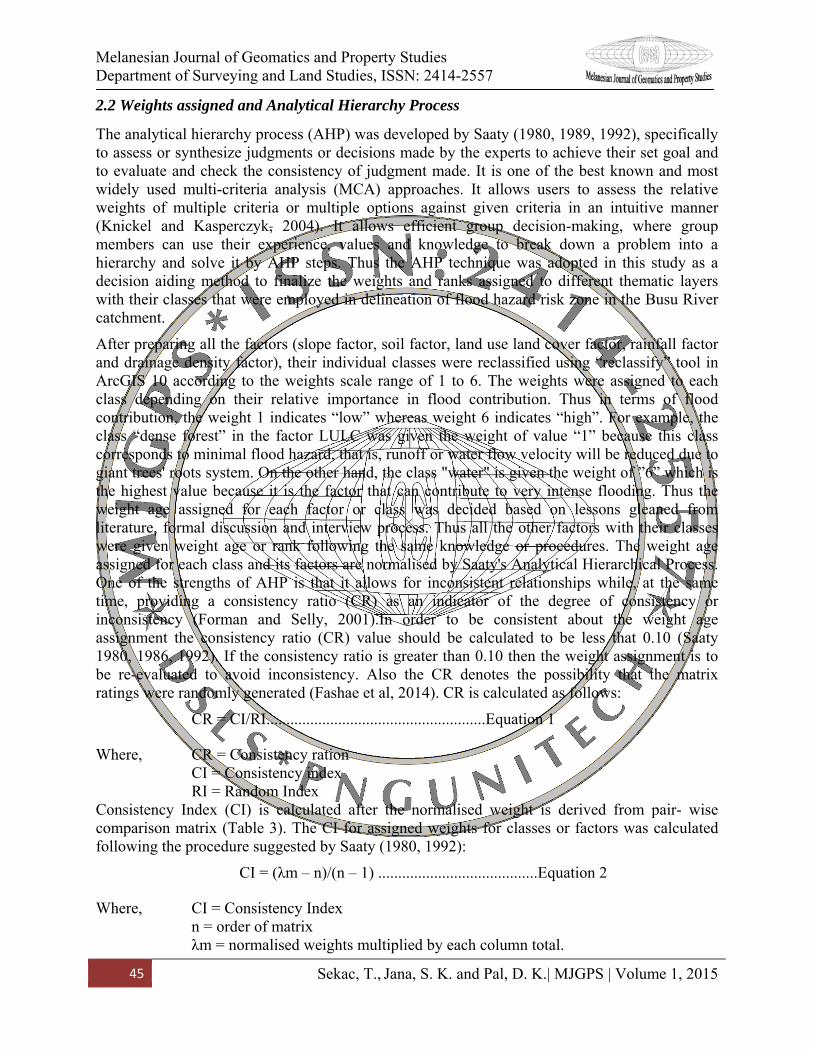
2.2 Weights assigned and Analytical Hierarchy Process
The analytical hierarchy process (AHP) was developed by Saaty (1980, 1989, 1992), specifically to assess or synthesize judgments or decisions made by the experts to achieve their set goal and to evaluate and check the consistency of judgment made. It is one of the best known and most widely used multi-criteria analysis (MCA) approaches. It allows users to assess the relative weights of multiple criteria or multiple options against given criteria in an intuitive manner (Knickel and Kasperczyk, 2004). It allows efficient group decision-making, where group members can use their experience, values and knowledge to break down a problem into a hierarchy and solve it by AHP steps. Thus the AHP technique was adopted in this study as a decision aiding method to finalize the weights and ranks assigned to different thematic layers with their classes that were employed in delineation of flood hazard risk zone in the Busu River catchment.
After preparing all the factors (slope factor, soil factor, land use land cover factor, rainfall factor and drainage density factor), their individual classes were reclassified using “reclassify” tool in ArcGIS 10 according to the weights scale range of 1 to 6. The weights were assigned to each class depending on their relative importance in flood contribution. Thus in terms of flood contribution, the weight 1 indicates “low” whereas weight 6 indicates “high”. For example, the class “dense forest” in the factor LULC was given the weight of value “1” because this class corresponds to minimal flood hazard, that is, runoff or water flow velocity will be reduced due to giant trees' roots system. On the other hand, the class "water" is given the weight of ”6” which is the highest value because it is the factor that can contribute to very intense flooding. Thus the weight age assigned for each factor or class was decided based on lessons gleaned from literature, formal discussion and interview process. Thus all the other factors with their classes were given weight age or rank following the same knowledge or procedures. The weight age assigned for each class and its factors are normalised by Saaty's Analytical Hierarchical Process. One of the strengths of AHP is that it allows for inconsistent relationships while, at the same time, providing a consistency ratio (CR) as an indicator of the degree of consistency or inconsistency (Forman and Selly, 2001).In order to be consistent about the weight age assignment the consistency ratio (CR) value should be calculated to be less that 0.10 (Saaty 1980, 1986, 1992). If the consistency ratio is greater than 0.10 then the weight assignment is to be re-evaluated to avoid inconsistency. Also the CR denotes the possibility that the matrix ratings were randomly generated (Fashae et al, 2014). CR is calculated as follows:
CR = CI/RI.......................................................Equation 1
Where, CR = Consistency ration CI = Consistency index RI = Random Index Consistency Index (CI) is calculated after the normalised weight is derived from pair- wise comparison matrix (Table 3). The CI for assigned weights for classes or factors was calculated following the procedure suggested by Saaty (1980, 1992):
CI = (λm – n)/(n – 1) ........................................Equation 2
Where, CI = Consistency Index n = order of matrix λm = normalised weights multiplied by each column total.
Melanesian Journal of Geomatics and Property Studies Department of Surveying and Land Studies, ISSN: 2414-2557
46 Sekac, T., Jana, S. K. and Pal, D. K.| MJGPS | Volume 1, 2015
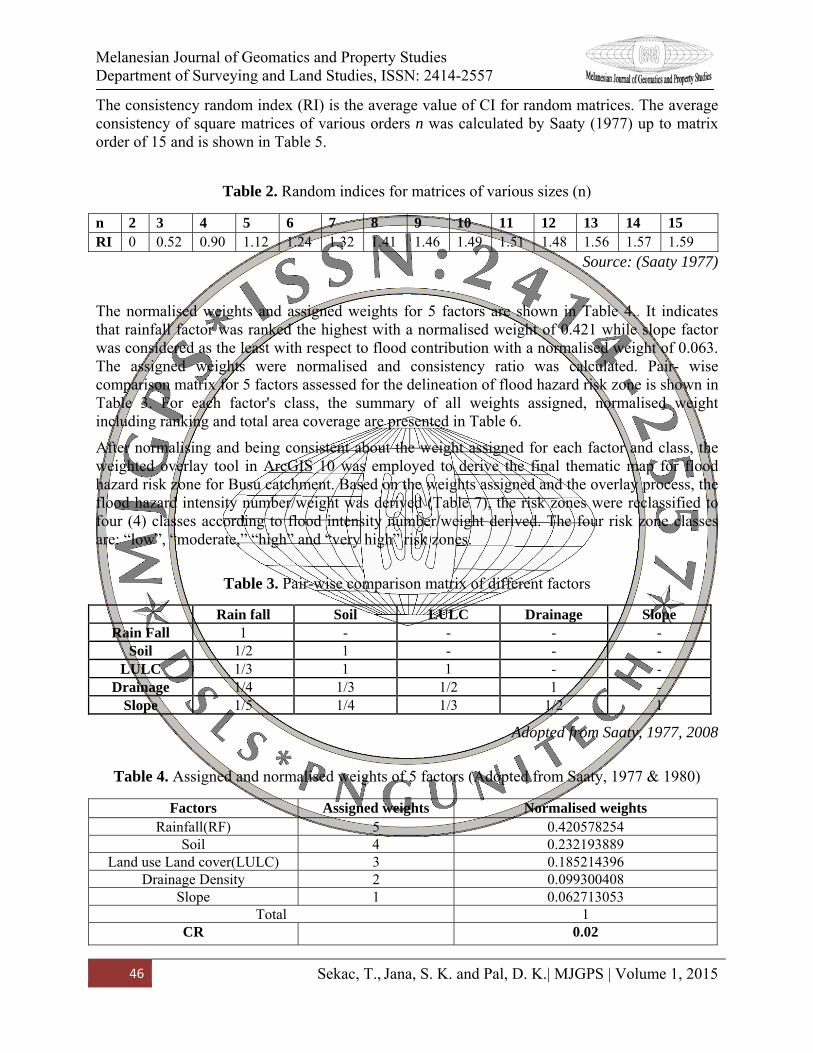
The consistency random index (RI) is the average value of CI for random matrices. The average consistency of square matrices of various orders n was calculated by Saaty (1977) up to matrix order of 15 and is shown in Table 5.
Table 2. Random indices for matrices of various sizes (n)
n 2 3 4 5 6 7 8 9 10 11 12 13 14 15 RI 0 0.52 0.90 1.12 1.24 1.32 1.41 1.46 1.49 1.51 1.48 1.56 1.57 1.59
Source: (Saaty 1977)
The normalised weights and assigned weights for 5 factors are shown in Table 4.. It indicates that rainfall factor was ranked the highest with a normalised weight of 0.421 while slope factor was considered as the least with respect to flood contribution with a normalised weight of 0.063. The assigned weights were normalised and consistency ratio was calculated. Pair- wise comparison matrix for 5 factors assessed for the delineation of flood hazard risk zone is shown in Table 3. For each factor's class, the summary of all weights assigned, normalised weight including ranking and total area coverage are presented in Table 6.
After normalising and being consistent about the weight assigned for each factor and class, the weighted overlay tool in ArcGIS 10 was employed to derive the final thematic map for flood hazard risk zone for Busu catchment. Based on the weights assigned and the overlay process, the flood hazard intensity number/weight was derived (Table 7), the risk zones were reclassified to four (4) classes according to flood intensity number/weight derived. The four risk zone classes are: “low”, “moderate,” “high” and “very high” risk zones.
Table 3. Pair-wise comparison matrix of different factors
Adopted from Saaty, 1977, 2008
Table 4. Assigned and normalised weights of 5 factors (Adopted from Saaty, 1977 & 1980)
Factors Assigned weights Normalised weights Rainfall(RF) 5 0.420578254
Soil 4 0.232193889 Land use Land cover(LULC) 3 0.185214396
Drainage Density 2 0.099300408 Slope 1 0.062713053
Total 1 CR 0.02
Rain fall Soil LULC Drainage Slope Rain Fall 1 - - - -
Soil 1/2 1 - - - LULC 1/3 1 1 - -
Drainage 1/4 1/3 1/2 1 - Slope 1/5 1/4 1/3 1/2 1

Melanesian Journal of Geomatics and Property Studies Department of Surveying and Land Studies, ISSN: 2414-2557
47 Sekac, T., Jana, S. K. and Pal, D. K.| MJGPS | Volume 1, 2015
3. Results and Discussion
Multi-criteria evaluation or analysis technique is applied in different categories of field, like flood hazard assessment, ground water potential investigation, malaria hazard risk investigation, and so forth. The technique consists of processing and overlaying several environmental factors in the GIS environment. Multi-criteria evaluation works well with AHP to synthesise and normalise the decision made. The weighted overlay tool and reclassify tool in ArcGIS 10 are mainly used for these types of analysis. The weights, ranks or percentage influences are assigned to each factor and each class of factors of interest and AHP was carried out. The present study isintended to involve multi-criteria evaluation or analysis technique with AHP in the GIS environment to assess and analyse five (5) major environmental factors of Busu River catchment area as highlighted in Figure 4. Each factor contributes to flooding hazard. Their effectiveness or importance in contributing to flooding is discussed in the next section. The weights assigned are based on user's opinion or from literature or through interview processes.
3.1 Land use - Land cover factor
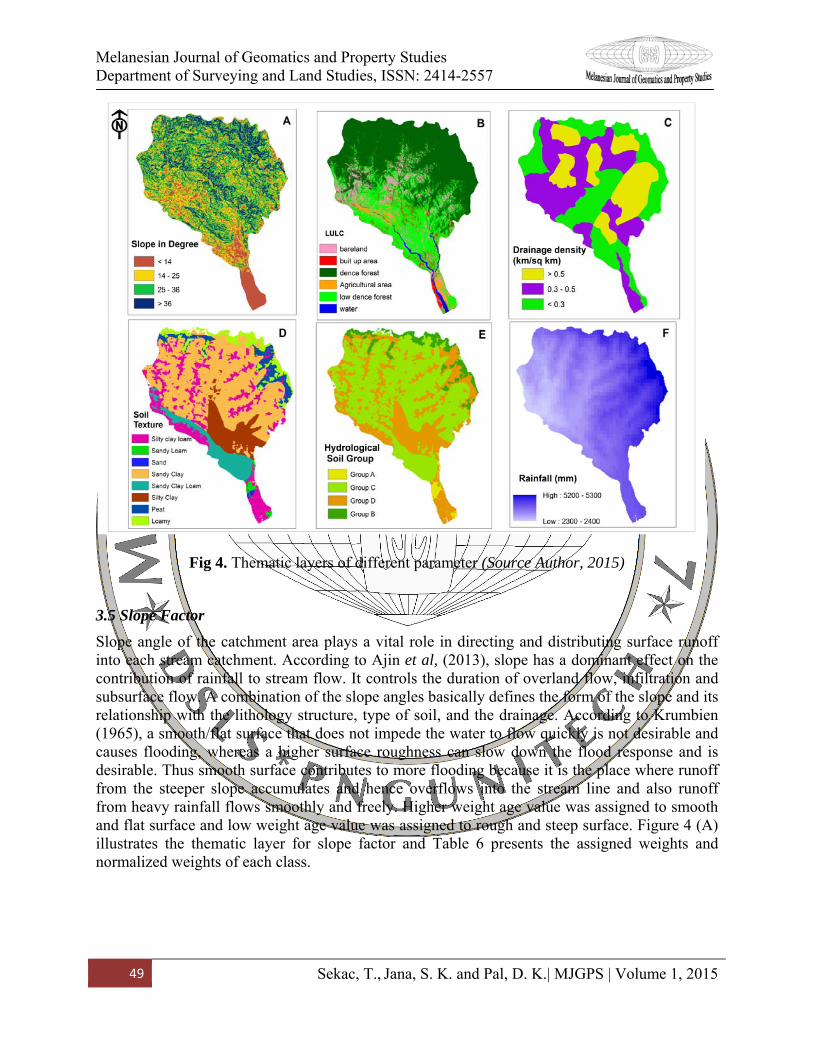
The land use - land cover map was prepared from Landsat 8 satellite image. The weighted map of LULC factor and its class is shown in Figure 4 (B). The LULC plays an important role in controlling the runoff on the surface of the land. The thick dense forest due to its roots system causes huge infiltration (vertical flow enriching ground water table) and thus slows down the runoff (horizontal surface flow) rate into the streams where it won't contribute much to flood hazard. The bare land accelerates the runoff from downpour into the stream at high rate, as the infiltration rate is very low, thereby increasing the water accumulation and hence generating flash flood. According to Ajin et al, (2013) the vegetation cover of soils, whether that is permanent grassland or the cover of other crops, has an important impact on the ability of the soil to act as a water store. Predominant runoff of rainwater is much more likely on bare fields than those with a good crop cover. The presence of thick vegetative cover slows the journey of water on the soil and reduces the amount of runoff, by increasing infiltration time. Impermeable surfaces, such as concrete, absorb almost no water at all where flood may be common in these areas. The weights assigned and the normalised weights for each class are shown in Table 6.The thematic layer for LULC is shown in Figure 4 b).
3.2 Drainage density
Drainage density is one of the factors that contribute to the flooding hazards. Drainage density of a basin is the total line length of the stream network divided by the basin area. The drainage density map was prepared from SRTM DEM data. The total area of the Busu catchment was calculated to be 1317.72 km2, and the total length of the stream network was calculated to be 803.29 km. From this value, drainage density was calculated and its map was generated. Drainage is an important ecosystem factor controlling flood hazards as its densities denote the nature of the soil and its geotechnical properties (Pareta, 2004). A high value of the drainage density indicates a relatively high number of streams, which implies increasing flood peaks. Moreover, a long concentration time implies more opportunities for water to infiltrate. Therefore a decreasing Drainage density generally implies decreasing flood volumes. Higher weights were assigned to higher drainage density areas and lower weights were assigned to low drainage

Melanesian Journal of Geomatics and Property Studies Department of Surveying and Land Studies, ISSN: 2414-2557
48 Sekac, T., Jana, S. K. and Pal, D. K.| MJGPS | Volume 1, 2015
density areas. Figure 4 c) illustrates the thematic layer for Drainage Density & Table 6 explains the weight age assigned to each class and its normalised weights.
3.3 Rainfall factor
Intense rainfall is the major factor that contributes to flooding. The heavy rainfall within a short period leads to high runoff because the flowing water has exceeded the infiltration rate and hence increases the level of water or river or lake. On the other hand, the saturated infiltration rate (vertical) falls short of the runoff rate (horizontal), hence increased flows along the slope. Thus the amount of runoff is related to the amount of rainfall a region experiences, higher the rainfall the more the runoff and hence the higher the flooding intensity. The rainfall data for the study area was generated from Geobook (2009) database. The rainfall data was reclassified into three classes with respect to their values in millimetres, which is high, moderate and low rainfall. Higher weight age was assigned to high rainfall value and low weight age was assigned to low rainfall value. The rainfall thematic layer prepared is shown in Figure 4 (F) and the assigned weights and normalised weights for each class of rainfall are shown in Table 6.
3.4 Soil distribution in the catchment area
In the study area, the types of soil texture were assessed for determining runoff potential that can lead to flooding. The soil texture (soil data) for Morobe province was derived from Geobook (2009) data base (Samanta, 2011). There are about eight types of soil texture found in the study area and these are sandy clay, sandy clay loam, silt clay, peat, loamy, silt clay loam, sandy loam and sand (Figure 4 D). The hydrologic soil group indicates the infiltration and transmission rate of each soil texture. The Soil Conservation Service (SCS) model has grouped or classified each soil texture into four hydrological soil groups as shown in Figure 4(E). The soil Group A, has high infiltration rate when wet and it indicates low runoff potential; group B has moderate infiltration rate and low runoff potential; group C has slow infiltration and hence higher runoff potential; and finally group D has very slow infiltration rate and hence highest runoff potential.
Soil factor is one of the main attributes controlling the infiltration rates or capacity and also surface runoff rate. The runoff is high when the infiltration capacity is low where incidence of flood hazard is imminent during heavy rainfall. The higher weight age was assigned to soil group having slow infiltration rate while the lower weight age was assigned to soil group having high infiltration rate. The assigned and normalised weights of each soil group class are presented in Table 6.
Table 5. Soil textures that are grouped or classified into each HSG (figure 4 (D) & (E).
HSG A B C D Soil Texture
Sand Silt Loam/ Loamy soil
Sandy Clay Loam Silty Clay Loam
Loamy Sand/ Sandy loam Sandy Clay Silty Clay Peat
(Source: Author, 2015)
Melanesian Journal of Geomatics and Property Studies Department of Surveying and Land Studies, ISSN: 2414-2557
49 Sekac, T., Jana, S. K. and Pal, D. K.| MJGPS | Volume 1, 2015
Fig 4. Thematic layers of different parameter (Source Author, 2015)
3.5 Slope Factor
Slope angle of the catchment area plays a vital role in directing and distributing surface runoff into each stream catchment. According to Ajin et al, (2013), slope has a dominant effect on the contribution of rainfall to stream flow. It controls the duration of overland flow, infiltration and subsurface flow. A combination of the slope angles basically defines the form of the slope and its relationship with the lithology structure, type of soil, and the drainage. According to Krumbien (1965), a smooth/flat surface that does not impede the water to flow quickly is not desirable and causes flooding, whereas a higher surface roughness can slow down the flood response and is desirable. Thus smooth surface contributes to more flooding because it is the place where runoff from the steeper slope accumulates and hence overflows into the stream line and also runoff from heavy rainfall flows smoothly and freely. Higher weight age value was assigned to smooth and flat surface and low weight age value was assigned to rough and steep surface. Figure 4 (A) illustrates the thematic layer for slope factor and Table 6 presents the assigned weights and normalized weights of each class.

Melanesian Journal of Geomatics and Property Studies Department of Surveying and Land Studies, ISSN: 2414-2557
50 Sekac, T., Jana, S. K. and Pal, D. K.| MJGPS | Volume 1, 2015
Table 6. Assigned and normalized weights for each factor with their classes for the delineation of Flood hazard risk zone of Busu catchment.
Factors Classes Weights Normalized Weights
Rank Area in (km2)
Area in %
Rainfall(mm) > 4000 6 0.699 0.421 194.96 14.8 3000 - 4000 4 0.194 647.49 49.16 < 3000 2 0.107 474.54 36.03 CR 0.01 Soil Group D 6 0.503 0.232 447.64 34.15 C 4 0.3 761.35 58.07 B 2 0.124 87.53 6.68 A 1 0.073 14.47 1.1 CR 0.02 LULC water 6 0.387 0.185 19.94 1.51 bare land 5 0.212 133.36 10.12 built-up 4 0.182 23.11 1.75 Agricultural area 3 0.11 36.01 2.73 low dense forest 2 0.066 392.51 29.79 dense forest 1 0.044 712.7 54.09 CR 0.02 Drainage Density(km/km2)
> 05 6 0.699 0.099 346.68 26.65
0.3 - 0.5 4 0.194 482.48 37.09 < 0.3 2 0.107 471.81 36.27 CR 0.01 Slope (degree) < 14 6 0.49 0.063 417.79 31.7 14 - 25 4 0.284 782.53 59.38 25- 36 2 0.132 116.29 8.82 > 36 1 0.094 1.24 0.09CR 0.04
(Source: Author, 2015)
The assigned and normalised weights derived for each class are presented in Table 6. The consistency ratio of each matrix for the classes of particular factor was calculated to be less than 0.10. Thus it assumes that the weights assigned and also the random distributions of weights assigned are consistent enough. The consistency ratios calculated are presented in Table 6. The rank or percentage influence for each factor is also presented here. After generating, evaluating and normalising all the factors with their classes, the thematic layers were overlaid using weighted overlay tool in ArcGIS 10. The final result obtained after the reclassification is illustrated in Figure 5.

Melanesian Journal of Geomatics and Property Studies Department of Surveying and Land Studies, ISSN: 2414-2557
51 Sekac, T., Jana, S. K. and Pal, D. K.| MJGPS | Volume 1, 2015
Fig 5. Flood hazard risk zone map (Source: Author, 2015)
The Table 7 presents the areas in square km (km2) and percentage (%) for each flood hazard risk zone. The low risk zone indicates that there is no risk of flooding at all; the moderate risk zone indicates flood risk may or may not occur; however high or very high risk zone indicates actual possibilities of flood hazard in an area. From the calculation, it was found out that low risk zone has 2.97% of area coverage, moderate risk zone has 49.63% of area coverage, high risk zone has 43.42% of area coverage and very low risk zone has 3.99% of area coverage.
Table 7. Flood hazard risk zones re-classification according to flood hazard intensity numbers/weights derived.
Flood hazard intensity number(FHI)/weights
Flood hazard risk zone Area (km2) Area (%)
2 Low risk Zone 38.7 2.97 3 Moderate risk zone 647.69 49.63 4 High Risk zone 566.65 43.42 6 Very High Risk Zone 52.09 3.99
Source: Author, 2015
Melanesian Journal of Geomatics and Property Studies Department of Surveying and Land Studies, ISSN: 2414-2557
52 Sekac, T., Jana, S. K. and Pal, D. K.| MJGPS | Volume 1, 2015
3.6 Quantitative Validation with PGIS and confusion matrix
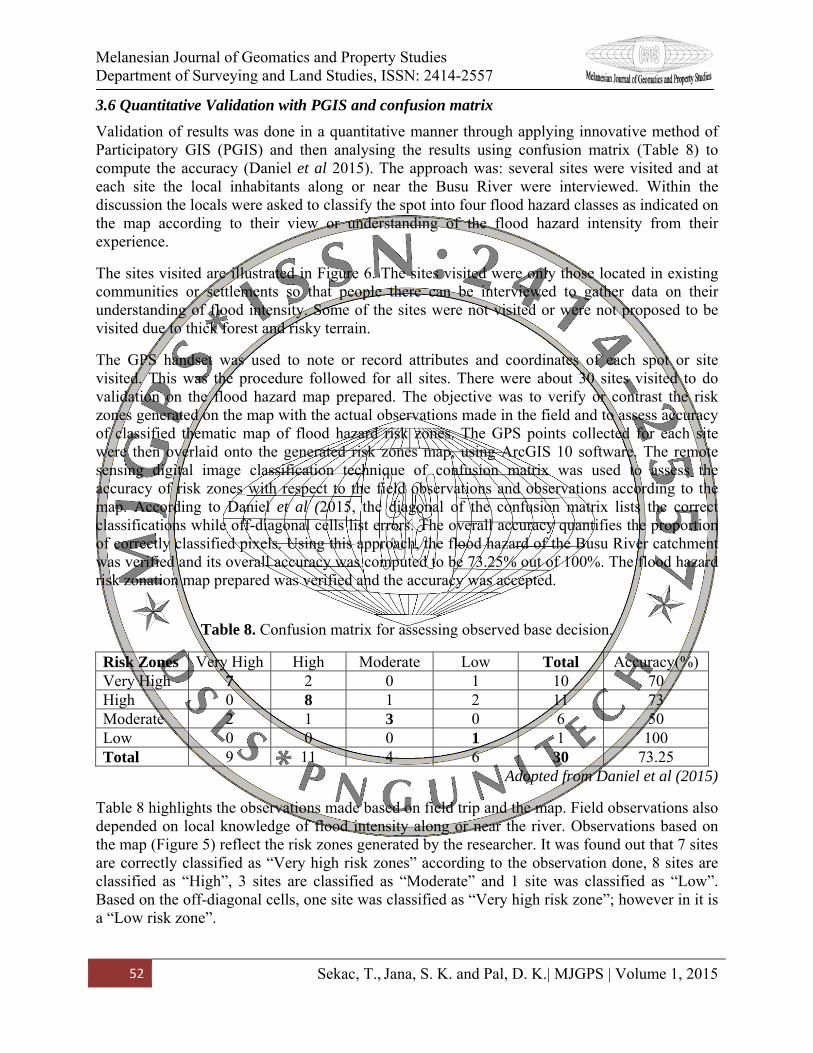
Validation of results was done in a quantitative manner through applying innovative method of Participatory GIS (PGIS) and then analysing the results using confusion matrix (Table 8) to compute the accuracy (Daniel et al 2015). The approach was: several sites were visited and at each site the local inhabitants along or near the Busu River were interviewed. Within the discussion the locals were asked to classify the spot into four flood hazard classes as indicated on the map according to their view or understanding of the flood hazard intensity from their experience.
The sites visited are illustrated in Figure 6. The sites visited were only those located in existing communities or settlements so that people there can be interviewed to gather data on their understanding of flood intensity. Some of the sites were not visited or were not proposed to be visited due to thick forest and risky terrain.
The GPS handset was used to note or record attributes and coordinates of each spot or site visited. This was the procedure followed for all sites. There were about 30 sites visited to do validation on the flood hazard map prepared. The objective was to verify or contrast the risk zones generated on the map with the actual observations made in the field and to assess accuracy of classified thematic map of flood hazard risk zones. The GPS points collected for each site were then overlaid onto the generated risk zones map, using ArcGIS 10 software. The remote sensing digital image classification technique of confusion matrix was used to assess the accuracy of risk zones with respect to the field observations and observations according to the map. According to Daniel et al (2015, the diagonal of the confusion matrix lists the correct classifications while off-diagonal cells list errors. The overall accuracy quantifies the proportion of correctly classified pixels. Using this approach, the flood hazard of the Busu River catchment was verified and its overall accuracy was computed to be 73.25% out of 100%. The flood hazard risk zonation map prepared was verified and the accuracy was accepted.
Table 8. Confusion matrix for assessing observed base decision.
Risk Zones Very High High Moderate Low Total Accuracy(%) Very High 7 2 0 1 10 70 High 0 8 1 2 11 73 Moderate 2 1 3 0 6 50 Low 0 0 0 1 1 100 Total 9 11 4 6 30 73.25
Adopted from Daniel et al (2015)
Table 8 highlights the observations made based on field trip and the map. Field observations also depended on local knowledge of flood intensity along or near the river. Observations based on the map (Figure 5) reflect the risk zones generated by the researcher. It was found out that 7 sites are correctly classified as “Very high risk zones” according to the observation done, 8 sites are classified as “High”, 3 sites are classified as “Moderate” and 1 site was classified as “Low”. Based on the off-diagonal cells, one site was classified as “Very high risk zone”; however in it is a “Low risk zone”.

Melanesian Journal of Geomatics and Property Studies Department of Surveying and Land Studies, ISSN: 2414-2557
53 Sekac, T., Jana, S. K. and Pal, D. K.| MJGPS | Volume 1, 2015
Fig 6. Proposed Sites Visited for the Validation of Flood hazard risk zones (Source: Author, 2015)
Fig. 7. Photographs of the sites visited for the validation purpose

Melanesian Journal of Geomatics and Property Studies Department of Surveying and Land Studies, ISSN: 2414-2557
54 Sekac, T., Jana, S. K. and Pal, D. K.| MJGPS | Volume 1, 2015
4. Conclusion
The process of assessing the morphological or geographical factors of a river basin can enhance our understanding of how flooding actually gets triggered. Table 6 in this paper explains every individual assessment that was carried out to produce flood hazard map. Thus flood hazard mapping is an important component of land use planning in flood plain areas. It creates easily-read, rapidly-accessible charts and maps, which facilitate decision-making by administrators and physical planners to identify areas of risk and prioritise their mitigation or response efforts (Duan et.al 2009). With regards to the present study, the research findings can be very useful when preparing physical development plans for Lae City. Therefore, it is hoped that Lae City officials will appreciate the financial implications of city expansion and city sustainability at the same time as the possible flooding of river plains tend to reduce availability of otherwise developable land, which can force inhabitants to relocate from their homes to higher grounds.
5. References
1. Ajin, R. S., Krishnamurthy, R. R, Jayaprakash, M. and Vinod, P. G., (2013), Flood hazard assessment of Vamanapuram River Basin, Kerala, India: An approach using Remote Sensing & GIS techniques, Advances in Applied Science Research, 2013, 4(3):263-274.
2. Birkmann, J., Krause, D., Stiadi, N., Suarez, D., Welle, T. and Wolfertz, J. (2011), World Risk Report; UNU and IEHS: Bonn, Germany.
3. Chowdhury, A., Jha, M. K., Chowdhury, V. M. and Mal, B. C., (2009), Integrated remote sensing and GIS-based approach for assessing groundwater potential in West Medinipur district, West Bengal, India. Int J Remote Sens 30:231-250
4. Daniel, A. K, Gerald, F and Valentijn, V., (2015), Modelling Flood Hazard Zones at the Sub-District Level with the Rational Model Integrated with GIS and Remote Sensing Approaches, Open Access Water, ISSN 2073-4441.
5. Duan, M, Zahang. J, Liu. Z, Aekakkararungroj, A., (2009), Use of Remote Sensing and GIS for flood hazard mapping in Chiang Mai province, northern Thailand, Bureau of Research Development and Hydrology, Department of Water Resources, BKK 10400, Thailand.
6. Geobook (2009), The UPNG Geobook set - an interactive mapping atlas for each Province of PNG, Remote Sensing Centre, PO Box 320, University, NCD, Papua New Guinea
7. International Federation of the Red Cross and Red Crescent Societies (IFRC), (2008). "World Disasters Report. Oxford University Press", ISBN 978-92-9139-156-1
8. Kaliraj, S., Chandrasekhar, N. and Magesh, N. S., (2015), Evaluation of multiple environmental factor s for site-specific groundwater recharge structures in the Vaigai River upper basin, Tamil Nadu, India, using GIS-based weighted overlay analysis, Centre for GeoTechnology, Manonmaniam Sundaranar University, Tirunelveli, Tamil Nadu 627012, India. Environ Earth Sci DOI 10.1007/s12665-015-4384-9
9. Krumbein, W.C, Graybill, F.A; An Introduction to statistical models in Geology, Mc Graw Hill, New York, 475. 1965.
10. Machiwal, D.., Jha, M.K., Mal, B.C., (2011), Assessment of Groundwater Potential in a Semi-Arid Region of India Using Remote Sensing, GIS and MCDM Techniques, Water Resources Management, 25(5) , 1359-1386.
11. Martins, A. K. and Gadiga B. L., (2015), Hydrological and Morphometric Analysis of Upper Yedzaram Catchment of Mubi in Adamawa State, Nigeria. Using Geographic Information System (GIS). World Environment 2015, 5(2), 63-69 DOI: 10.5923/j.env.20150502.03

Melanesian Journal of Geomatics and Property Studies Department of Surveying and Land Studies, ISSN: 2414-2557
55 Sekac, T., Jana, S. K. and Pal, D. K.| MJGPS | Volume 1, 2015
12. Olutoyin A. Fashae, Moshood N. Tijani, Abel O. Talabi and Oluwatola I. Adedeji, (2014), Delineation of groundwater potential zones in the crystalline basement terrain of SW-Nigeria: an integrated GIS and remote sensing approach, Department of Geography, University of Ibadan, Ibadan, Nigeria.
13. Pareta, K., Hydro-Geomorphology of Sagar District, M.P. (2004): A Study through Remote Sensing Technique, Proceeding in XIX M. P. Young Scientist Congress, Madhya Pradesh Council of Science & Technology (MAPCOST).
14. Punithavathi, J., Tamilenthi, J. and Baskaran., (2011), Flood Zone mappingof Thanjavur district, Tamilnadu using GIS, Advances in Applied Science Research, 2 (2), 437-449.
15. Rachna Chandran and Joisy.M.B., (2009). Flood Hazard Mapping of Vamanapuram River Basin -A Case Study. In Proceedings of 10th National Conference on Technological Trends (NCTT09), Thiruvananthapuram, India, 6-7.
16. Saaty, T. L., (1977), The analytic hierarchy process: planning, priority setting, and resource allocation. McGraw-Hill, New York, Ed. 1.
17. Saaty, T. L., (1980), The analytic hierarchy process: planning, priority setting, and resource allocation, McGraw-Hill, New York, Ed. 2.
18. Saaty, T. L. , (1992), Decision making for leaders, RWS Publications, Pittsburgh 19. Saaty, T. L., (2008), Decision making with the analytic hierarchy process, Int. J. Services
Sciences, 1 ( 1) 83-98. 20. Samanta, S., Pal, B., and Pal, D.K., (2011), Land Suitability Analysis for Rice Cultivation
Based on Multi-Criteria Decision Approach through GIS, Int. J Sci. Emerging Tech., 2 (1),12-20.
21. Samanta, S., Pal, D. K, (2014), Scenario of Large Scale Rice Production in Papua New Guinea, International Journal of Innovative Research in Science & Engineering, 2 (6), 463-475.
22. Surjit Singh Saini, Kaushik. S.P., (2012), Risk and Vulnerability assessment of Flood Hazard in part of Ghaggar Basin: A case study of Guhla block, Kaithal Haryana, India, Intl Jrnl. of geomatics and Geosciences, 3(1), 42-54.
23. Thilagavathi, G., Tamilenthi, S., Ramu, C., and Baskaran, R., (2011), Application of Gis in Flood Hazard Zonation Studies in Papanasam Taluk, Thanjavur District, Tamilnadu, Pelagia Research Library, Advances in Applied Science Research, 2 (3), 574-585.
Biographies
Tingneyuc Sekac, currently pursuing an M. Phil Program in Geomatics in the Department of Surveying & Land Studies, The Papua New Guinea University of Technology, Lae, Morobe Province, Papua New Guinea, [email protected]
Sujoy Kumar Jana, Senior Lecturer & Course Coordinator, M.Sc in Remote Sensing & GIS, Department of Surveying & Land Studies, The Papua New Guinea University of Technology, Lae, Morobe Province, Papua New Guinea, [email protected]
Dilip Kumar Pal, Professor and HOD, Department of Surveying & Land Studies, The Papua New Guinea University of Technology, Lae, Morobe Province, Papua New Guinea, [email protected]