c Docume~1paul~1.Crolocals~1tempprestige Cacheee1cb368b9a643f998b38e985a4cd103
Upload
curtis-crossCategory
view
215download
0
15 Dec 2010
CERN Sept 2010 beam test: Sensor response study
Chris Walmsley and Sam Leveridge
(presented by Paul Dauncey)
1Paul Dauncey

15 Dec 2010
CERN 2010 beam test data• Taken with EUDET telescope
• Two arms, each of three layers of MIMOSA-26 silicon pixel sensors
• Ran with and without tungsten sheets mounted between the arms
•MIMOSA-26 sensors• Digital CMOS pixel sensors, fabricated with 0.35m AMS
• 700m thick (TBC) with 15m epitaxial layer.
• 1152×576 regular (i.e. no gaps) pixel array
• Pixel pitch 18.4m, total active area 21.2×10.6mm2
• Rolling shutter readout; each step is a group of 72 pixels in single row so 16 steps per row and 9216 steps for whole sensor
• Rolling shutter time ~110s total, so ~100ns per step
• Data from two full rolling shutters around trigger are kept
2Paul Dauncey

15 Dec 2010
Sensor study motivation•Overall aim of beam test is to measure EM shower density
• Form tracks in front three sensor layers
• Project through tungsten to back three sensors layers
• Measure particle density w.r.t. track projection position
• Clusters of hits are used for two purposes• In front three layers to form track hits
• In back three layers to count particles and know their position
• For both need to know how a single particle forms a cluster• Determine by studying rates of various patterns of hits in clusters
• Want average particle position within cluster for a given pattern
• Want resolution of particle position for a given pattern3Paul Dauncey
15 Dec 2010
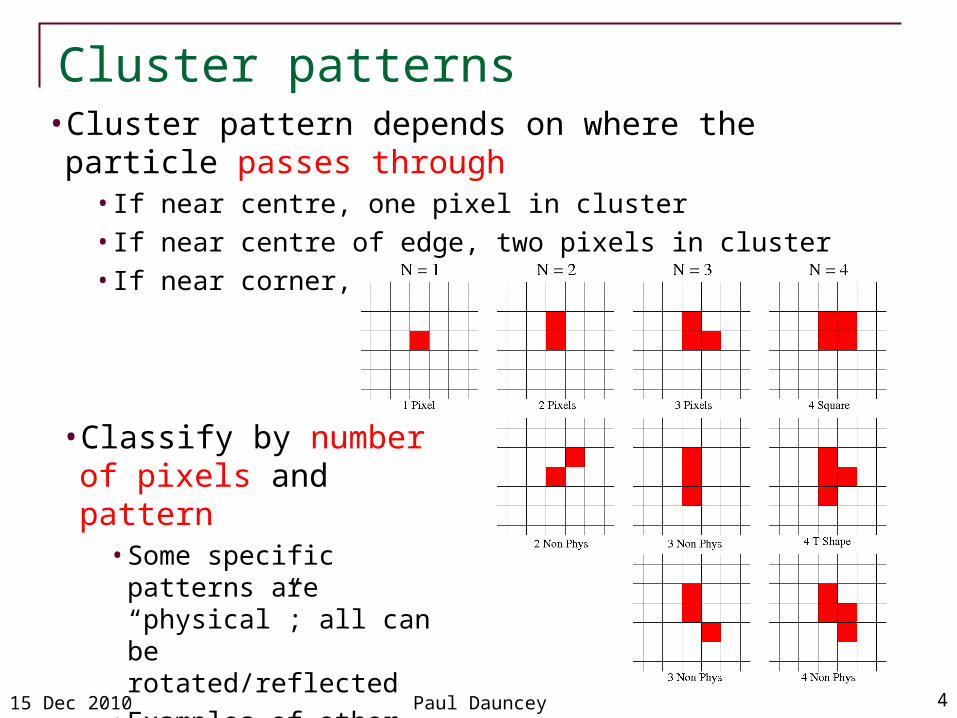
Cluster patterns• Cluster pattern depends on where the particle passes through
• If near centre, one pixel in cluster
• If near centre of edge, two pixels in cluster
• If near corner, four pixels in cluster
4Paul Dauncey
• Classify by number of pixels and pattern• Some specific patterns are
“physical”; all can be rotated/reflected
• Examples of other patterns which are not physical

15 Dec 2010
Cluster patterns in data• Form track in the five “other” layers
• Project into layer being studied and look for nearby clusters
• Look at rates of clusters with various patterns
• See non-negligible rate of a pixel firing twice in one event• Presumably this is due to real particle hit
• Integrate over both time frames
• Only count number of different pixels, not number of times fired, when characterising the clusters
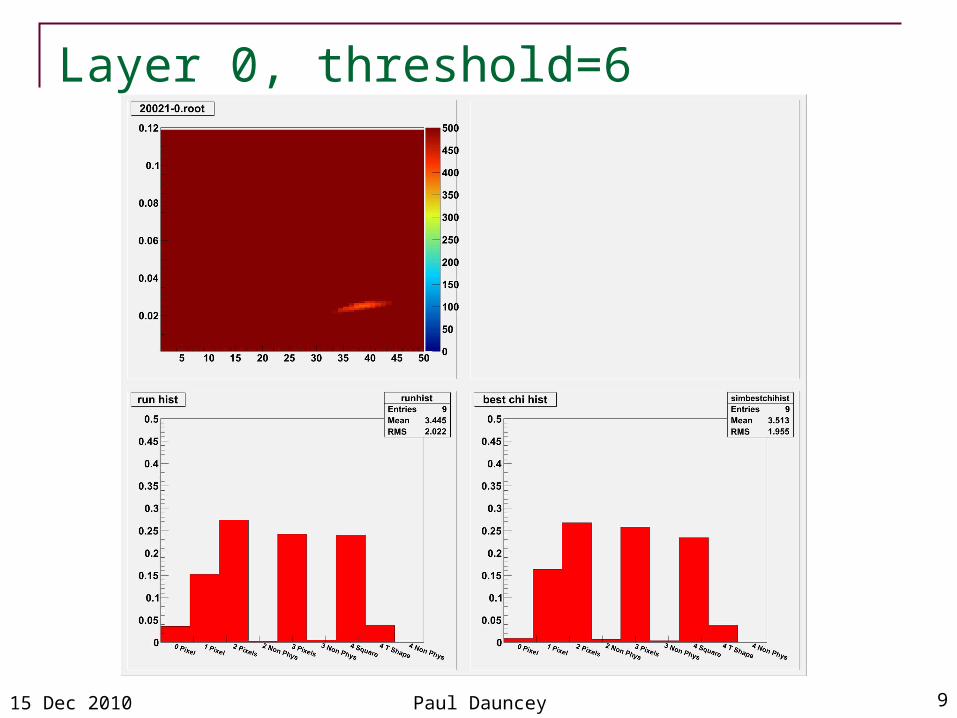
• Look at runs 20021-26• All are 120GeV hadrons with no tungsten
• Different threshold per run; 6.0-10.5 (in some arbitrary threshold units)
5Paul Dauncey

15 Dec 2010
Distance of cluster from track projection
• Clean; almost no background even at threshold=6• 5-hit tracks difficult to fake
•Alignment looks OK; all centred on zero6Paul Dauncey

15 Dec 2010
Cluster simulation
7Paul Dauncey
• 2D simulation of charge spread and threshold• Standalone model of 5×5 pixel array
• Put “charge” with Landau distribution at point; units MPV=1• Initial position varied uniformly over 100×100 array in central pixel
• Parameterise diffusion by spreading with Gaussian
• Charge absorbed per pixel is integral of Gaussian over pixel area
• Add noise per pixel and apply threshold
• Tune parameters• Diffusion spread Gaussian width
• Threshold units-to-MPV conversion factor
• Pixel noise
•Minimise chi-squared comparison with data cluster pattern distribution

15 Dec 2010
Tuning example
8Paul Dauncey
• Chi-sq versus two parameters
• Noise fixed to 2.4 threshold units
• X axis is spread Gaussian width in % of pixel pitch
• Y axis is conversion factor
Layer 0, threshold = 10.0 units
Data Sim
8% inefficiency
15 Dec 2010
Layer 0, threshold=6
9Paul Dauncey

15 Dec 2010
Layer 0, threshold=8
10Paul Dauncey

15 Dec 2010
Layer 0, threshold=9
11Paul Dauncey
15 Dec 2010
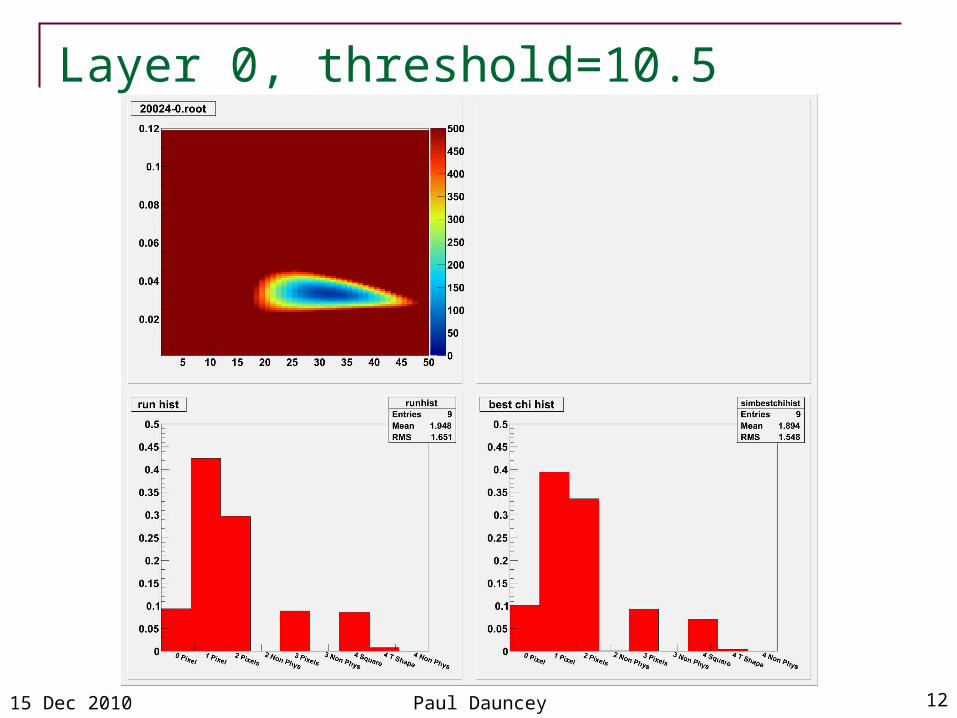
Layer 0, threshold=10.5
12Paul Dauncey
15 Dec 2010
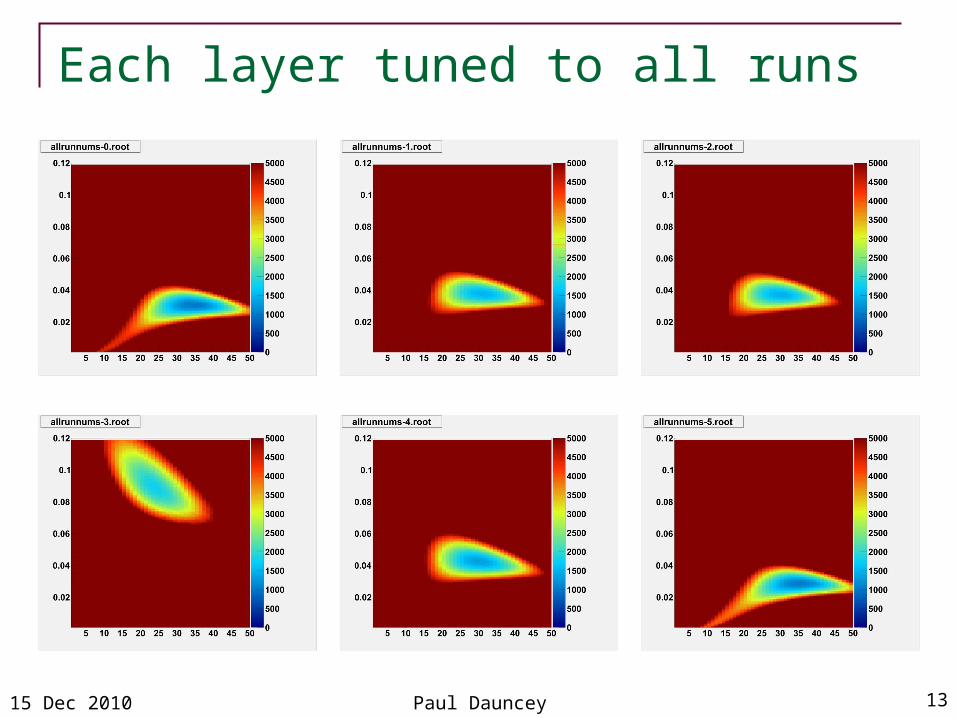
Each layer tuned to all runs
13Paul Dauncey
15 Dec 2010
Tuning results
14Paul Dauncey
• Parameters reasonable consistent for all thresholds and for five of the six layers• Spread Gaussian width ~ 25-30% ~ 5m
• Threshold unit-to-MPV conversion ~ 0.03-0.04
• E.g. threshold = 10 units ~ 0.3-0.4MPV; when charge split between four pixels, efficiency will be low
• Noise ~ 2.4 threshold units ~ 0.08MPV
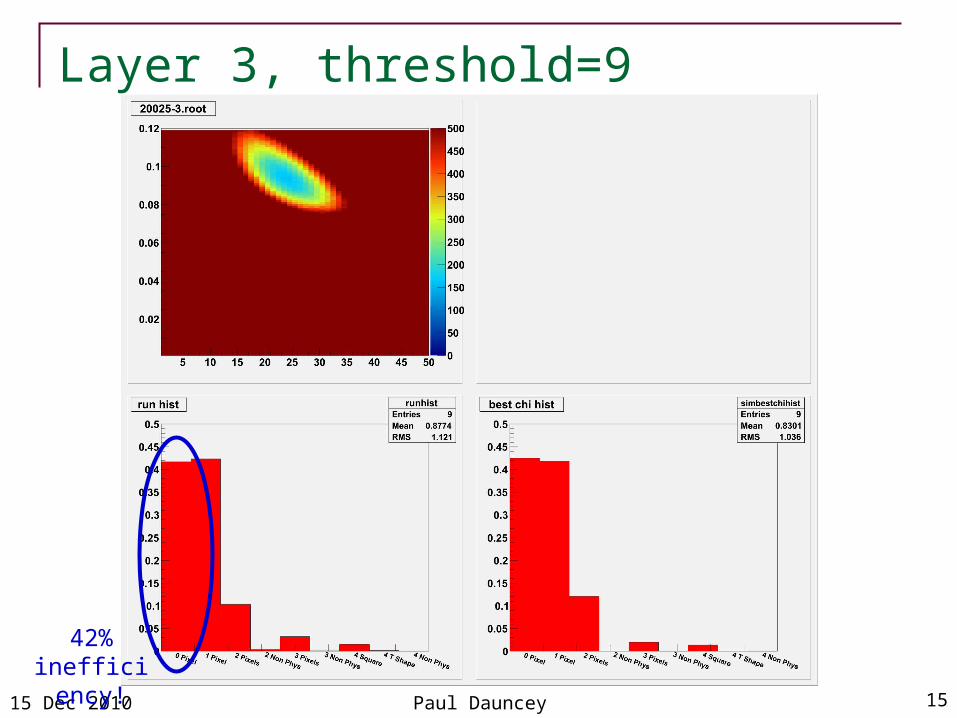
• Layer 3 significantly different in conversion parameter• Spread width and noise similar
• Threshold unit-to-MPV conversion ~ 0.09
• E.g. threshold = 9 units ~ 0.8MPV; generally will have low efficiency)
• Annoying as this is closest layer to tungsten in shower runs
15 Dec 2010
Layer 3, threshold=9
15Paul Dauncey
42% inefficiency!

15 Dec 2010
Simulation positions for patterns
16Paul Dauncey
Not layer 3

15 Dec 2010
Cluster-track positions for N=0
17Paul Dauncey
• Left: Standalone simulation (no track, perfect position)
•Middle: Data (including track resolution) ~ 100k events
• Right: First go at full simulation (including tracking resolution) ~ 100k events

15 Dec 2010
Cluster-track positions for N=1, 2 line
18Paul Dauncey

15 Dec 2010
Cluster-track positions for N=3 L, 4 square
19Paul Dauncey

15 Dec 2010
Cluster resolution
20Paul Dauncey
• Cross-check simulation using resolution• Each cluster pattern results from particle hitting particular position within
pixel
• Look at track projection positions for each cluster pattern
• Look at resolution from simulation and data (subtracting track resolution) for each pattern• Resolve resolution along symmetry axes
a
b
a
b
a
b
15 Dec 2010
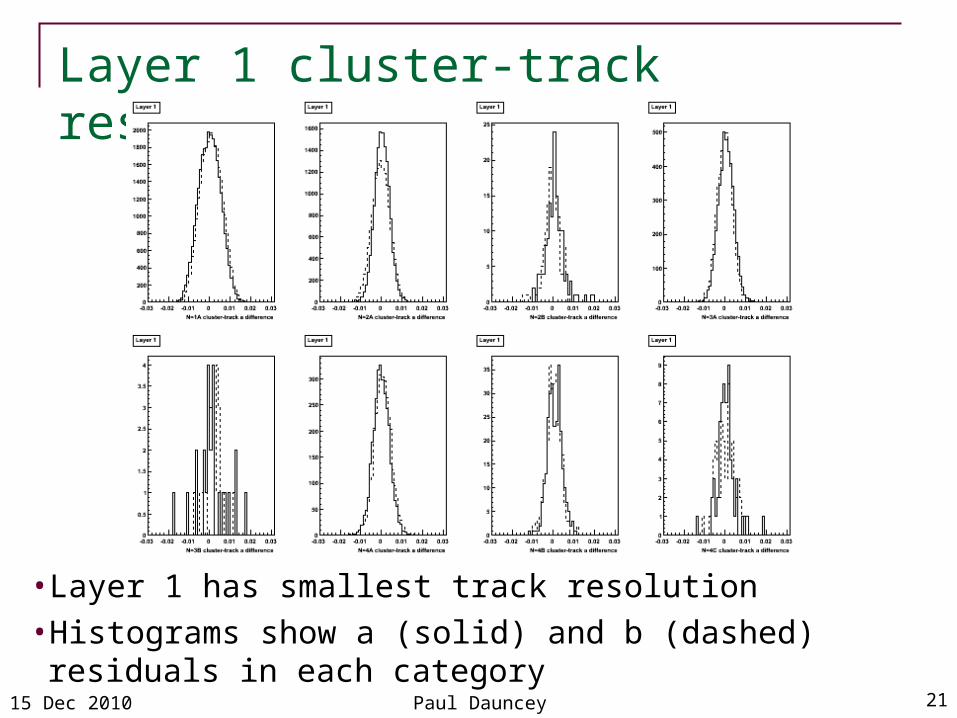
Layer 1 cluster-track residuals
21Paul Dauncey
• Layer 1 has smallest track resolution
•Histograms show a (solid) and b (dashed) residuals in each category
15 Dec 2010
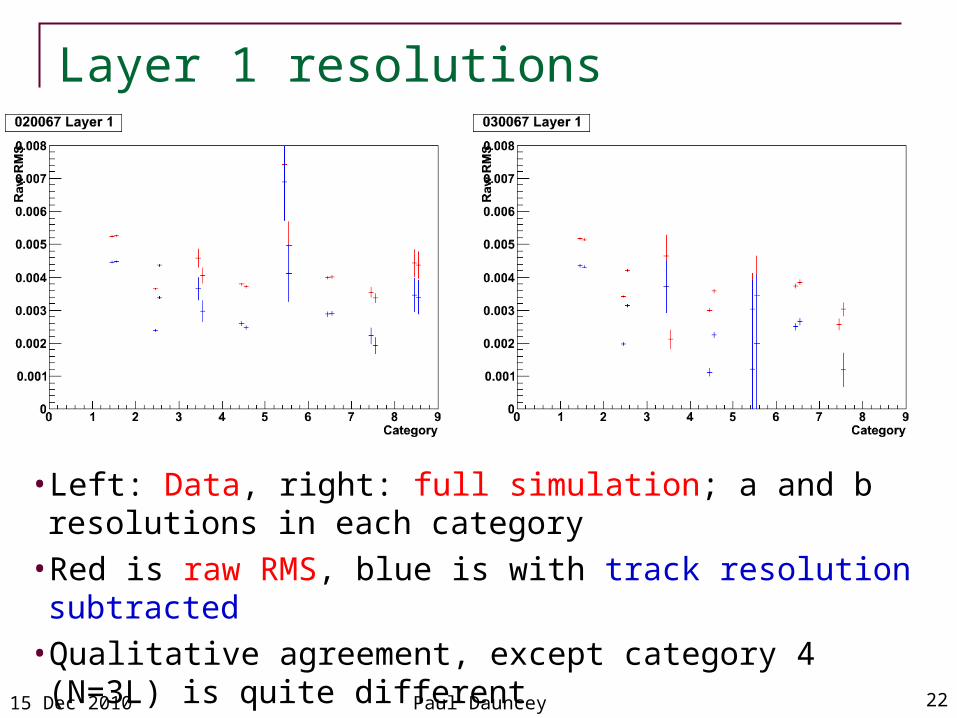
Layer 1 resolutions
22Paul Dauncey
• Left: Data, right: full simulation; a and b resolutions in each category
• Red is raw RMS, blue is with track resolution subtracted
•Qualitative agreement, except category 4 (N=3L) is quite different• Not understood....
•Quantitative agreement to ~20% level for others

15 Dec 2010
One other oddity not understood...
23Paul Dauncey
• Rolling shutter readout with two frames per event• Cluster hits should appear in frame 0 if in high rows and frame 1 if in low
rows; depends on trigger (“pivot”) time
Data, high rate Full simulation Data, e low rate

15 Dec 2010
Conclusions and future work•Sensor simulation seems to give good agreement•Gives right cluster shapes and reasonable resolutions
•Chris and Sam will finish at the end of March• Some tweaking of simulation parameter tuning
•Obtain standalone simulation resolutions
•Next steps (by me...)• Interface fully to GEANT4 simulation
•Model positron showers as taken in real data
•Measure apparent density of shower hits in layers 3,4,5
• Correct using simulation to true density at back of tungsten block
24Paul Dauncey