
13.3 The Base e Graph and Analyze - Classroom Websites 2... · 13.3 13.4 Notes Base e and Compound...
7
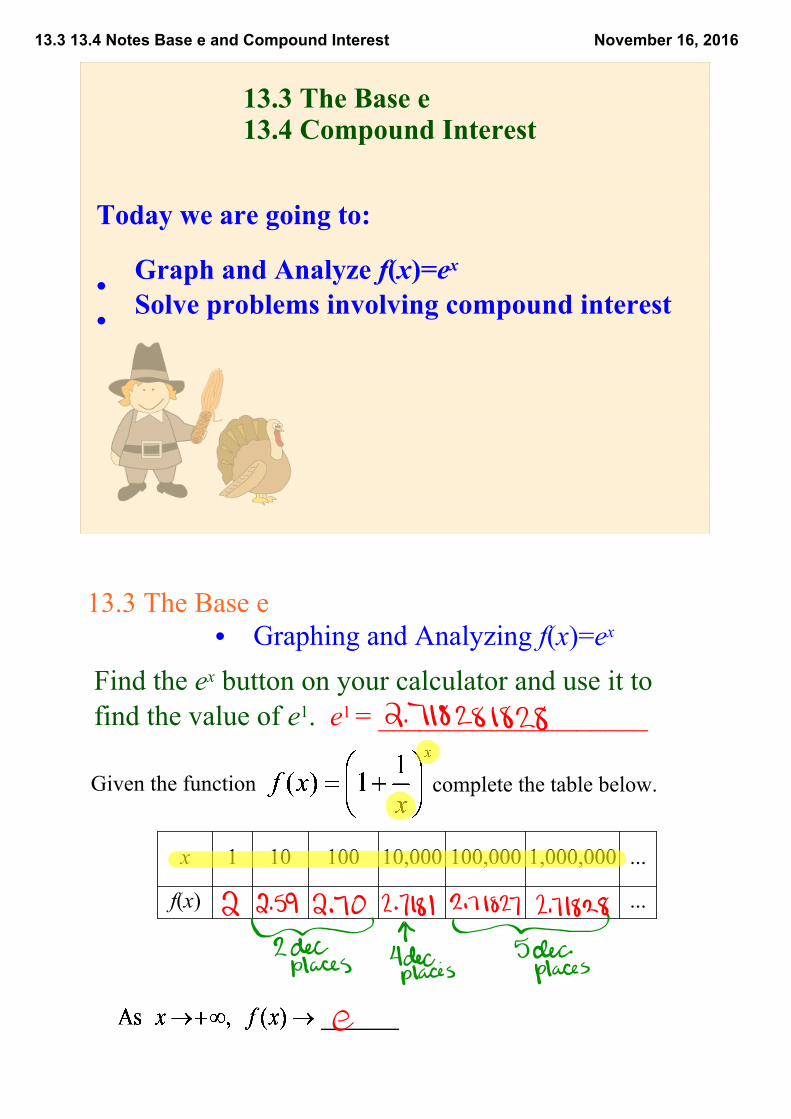
13.3 13.4 Notes Base e and Compound Interest November 16, 2016 13.3 The Base e 13.4 Compound Interest Today we are going to: • Graph and Analyze f(x)=e x • Solve problems involving compound interest • Graphing and Analyzing f(x)=e x Find the e x button on your calculator and use it to find the value of e 1 . e 1 = ___________________ Given the function complete the table below. x 1 10 100 10,000 100,000 1,000,000 ... f(x) ... 13.3 The Base e
-
Upload
vuongkhuong -
Category
Documents
-
view
227 -
download
4
Transcript of 13.3 The Base e Graph and Analyze - Classroom Websites 2... · 13.3 13.4 Notes Base e and Compound...
13.3 13.4 Notes Base e and Compound Interest November 16, 2016
13.3 The Base e13.4 Compound Interest
Today we are going to:
• Graph and Analyze f(x)=ex
• Solve problems involving compound interest
• Graphing and Analyzing f(x)=ex
Find the ex button on your calculator and use it to find the value of e1. e1 = ___________________
Given the function complete the table below.
x 1 10 100 10,000 100,000 1,000,000 ...
f(x) ...
13.3 The Base e

13.3 13.4 Notes Base e and Compound Interest November 16, 2016
If you graph f(x) and the horizontal line y = e, you can see that y = e is the horizontal asymptote of f(x).
Even though e is an irrational number, it can be used as the base of an exponential function. The number e is sometimes called the natural base of an exponential function and is used in scientific and other applications involving exponential growth and decay.
1.Graph the function f(x)=e and answer the questions.x
Domain:
Range:
Asymptote:
Increasing or Decreasing?
End Behavior:
13.3 13.4 Notes Base e and Compound Interest November 16, 2016
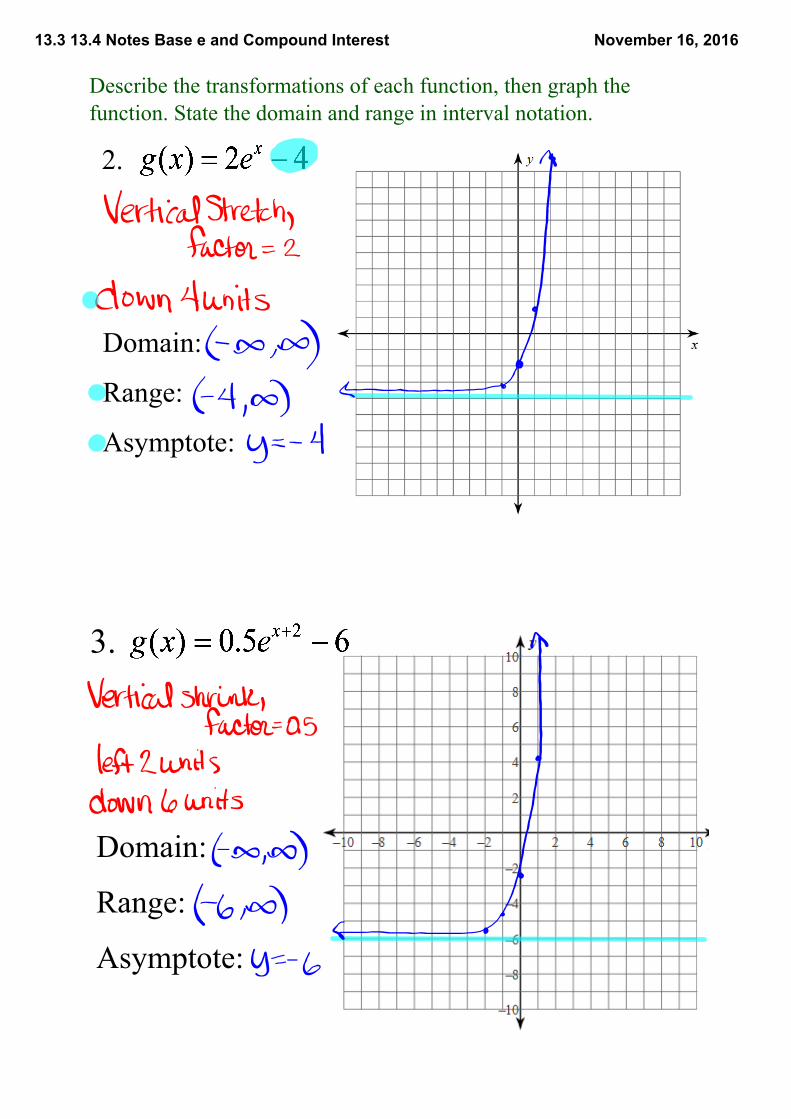
Describe the transformations of each function, then graph the function. State the domain and range in interval notation.
2.
Domain:
Range:
Asymptote:
3.
Domain:
Range:
Asymptote:

13.3 13.4 Notes Base e and Compound Interest November 16, 2016
4. The Dow Jones index is a stock market index for the New York Stock Exchange. The Dow Jones index for the period 19802000 can be modeled by VDJ(t)=878e0.121t, where t is the number of years after 1980. Determine how many years after 1980 the Dow Jones index reached 3000.
Solve each problem using a graphing calculator. Then determine the growth rate or decay rate of the function.
Modeling with Exponential Functions Having Base e
5. The Nikkei 225 index is a stock index for the Tokyo Stock Exchange. The Nikkei 225 index for the period 19902010 can be modeled by VN225(t)=23,500e0.0381t, where t is the number of years after 1990. Determine how many years after 1990 the Nikkei 225 index reached 15,000.

13.3 13.4 Notes Base e and Compound Interest November 16, 2016
13.4 Compound Interest• Solving Problems Involving Compound Interest
Definitions:
Simple Interest:______________________________
Compound Interest:___________________________
Compound Interest Formula:
V(t) = value after t years
P = principal (starting amount)
r = percent rate (as a decimal)
n = number of compoundings in a year
t = time in years
daily: n = 365
weekly: n = 52
monthly: n = 12
annually: n = 1
semiannually: n = 2
quarterly: n = 4
Interest paid only on the original amount of money, not on the interest it has already earned
Interest paid both on the original amount of money and on the interest it has already earned
6. A person invests $200 in an account that earns 6.25% annual interest. Find when the value of the investment reaches $5000.

13.3 13.4 Notes Base e and Compound Interest November 16, 2016
7. (a) A person invests $8000 in an account that earns 6.5% annual interest compounded daily. Find the value in the account after 30 years.
7. (b) Find when the value of the investment reaches $20,000.
Modeling Interest Compounded Continuously
Compound Continuously Formula:
V(t) = value after t years
P = principal (starting amount)
r = percent rate (as a decimal)
t = time in years

13.3 13.4 Notes Base e and Compound Interest November 16, 2016
8. (a) A person invests $5000 in an account that earns 3.5% annual interest compounded continuously. Find the value of the investment 25 years later.
8. (b) Find when the value of the investment reaches $25,000.
Assignment:
13.3 13.4 Worksheet
Don't forget
QUIZ 12.1 13.4 tomorrow!


![[XLS] · Web view6117 4 4.3 6120 4 4.3 6125 13 13.3 6130 13 13.3 6135 13 13.3 6140 13 13.3 6145 13 13.3 6150 13 13.3 6160 13 13.3 6210 4 4.3 6220 13 13.3 6230 4 4.3 6240 4 4.3 6250](https://static.fdocuments.net/doc/165x107/5b2a094f7f8b9a251e8b792d/xls-web-view6117-4-43-6120-4-43-6125-13-133-6130-13-133-6135-13-133-6140.jpg)