13 hartford funds a different perspective
28
HARTFORDFUNDS Sub-Advised by WELLINGTON MANAGEMENT A DIFFERENT PERSPECTIVE The Distinctive Investment Approach of Wellington Management, Sub-Adviser to Hartford Funds
Transcript of 13 hartford funds a different perspective

HARTFORDFUNDSSub-Advised by
WELLINGTON MANAGEMENT
A DIFFERENT PERSPECTIVEThe Distinctive Investment Approach of Wellington Management, Sub-Adviser to Hartford Funds

San Francisco
Chicago
Radnor
Boston
London
Luxembourg
Zurich
Frankfurt
Beijing
Tokyo
HongKong
Singapore
Sydney
● Hartford Funds Headquarters■ Wellington Office Locations
1
NOT FDIC INSURED • MAY LOSE VALUE • NO BANK GUARANTEE

Hartford Funds offers a different investment
perspective through our world-class
sub-adviser, Wellington Management—
a firm that distinguishes itself through
global collaboration, specialized research,
a private partnership structure, and
expertise managing nearly every asset
class and investment approach.
POWERFUL COMBINATION
2Wellington Management Company LLP is a SEC-registered investment adviser and an independent and unaffiliated sub-adviser to Hartford Funds.

Our clients entrustHartford Funds toprovide investmentexpertise in all marketcycles through a world-class moneymanager. —Chris Swift, CEO,
The Hartford
“
”
3
9
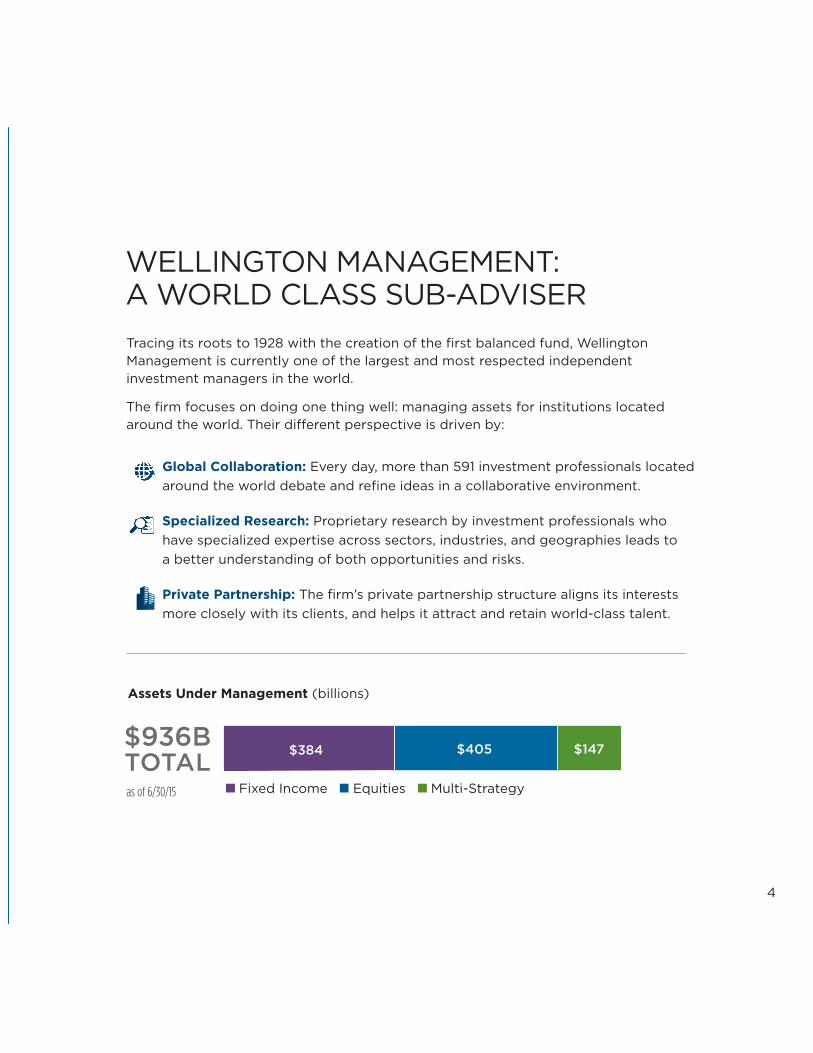
Global Collaboration: Every day, more than 591 investment professionals locatedaround the world debate and refine ideas in a collaborative environment.
Specialized Research: Proprietary research by investment professionals whohave specialized expertise across sectors, industries, and geographies leads to a better understanding of both opportunities and risks.
Private Partnership: The firm’s private partnership structure aligns its interestsmore closely with its clients, and helps it attract and retain world-class talent.
4
Tracing its roots to 1928 with the creation of the first balanced fund, WellingtonManagement is currently one of the largest and most respected independentinvestment managers in the world.
The firm focuses on doing one thing well: managing assets for institutions locatedaround the world. Their different perspective is driven by:
WELLINGTON MANAGEMENT:A WORLD CLASS SUB-ADVISER
Assets Under Management (billions)
$405 $147
Fixed Income Equities Multi-Strategyas of 6/30/15
$384$936BTOTAL

These words are used each day to introduce Wellington Management’s MorningMeeting, which is led from the firm’s Boston headquarters and its offices aroundthe globe. A decades-old tradition, the Morning Meeting allows investmentprofessionals representing multiple areas of expertise to examine, debate, andexchange ideas.
The Morning Meeting embodies the spirit of what sets Wellington Managementapart: a global, collaborative culture built on the free exchange of ideas. It alsoshowcases the firm’s specialized research, which is essential to an in-depthunderstanding of investment opportunities and risks.
GOOD MORNING BOSTON.GOOD AFTERNOON LONDON.GOOD EVENING ASIA.
5
Global Collaboration
Marketplaceof Ideas
Expertise in Many Research Disciplines
Specialization leads to expertise, and
diversity of perspective is the antidote
for growing complexity in the capital
markets. Wellington Management’s
investment professionals have access to
a wide array of specialists who provide
independent thinking that’s different
from Wall Street’s.

We structure our entire organization to facilitate theopen exchange of ideas, because we believe that is howthe best investment thinking is forged.
— Steve KlarDirector of Fixed IncomeWellington Management
6

Wellington Management is known for their specialized research, and how investmentteams leverage central research to complement their own investment ideas.
Core beliefs include:
■ Investment success is the result of in-depth industry, sector, asset class and/orregional knowledge;
■ Experience is essential for consistent performance;
■ Independent thinking leads to undiscovered opportunities;
■ Collaboration drives more informed decision making.
Specialized investors collaborate to share their ideas resulting in original, multi-dimensional research.
DEPTH AND BREADTH OF RESEARCH
Specialized Research
Central Research56 20 11 Global Industry Analysis11 19 9 Quantitative Analysis3 23 10 Global Derivatives6 19 13 Global Macroanalysis4 23 11 Technical Analysis12 18 11 Portfolio Coordinators
54 20 11 Equity and Fixed Income Traders
33 23 12 Management
44 7 5 Research Associates
Fixed Income57 20 11 Portfolio Management10 17 8 Fixed Income Strategists40 19 7 Credit Analysis11 21 9 Quantitative Analysis31 17 7 Product Management26 9 5 Portfolio Analysis
Equities51 25 16 Portfolio Management61 15 8 Research Analysis30 19 7 Product Management
Multi-Strategy
14 21 11 Asset Allocation Portfolio Management
23 14 6 Asset Allocation Analysis14 15 7 Product Management
Wellington Management Investment Professionals (as of 3/31/15)
■ Number of Professionals■ Average Years of Experience■ Years With Wellington Management
7

We strive for early anticipation of change...if you arrive atyour conclusions at the same time as everyone else, youdon’t make any money. This forces us to be independentof Wall Street’s research and its propensity for consensusthinking. — Phil Perelmuter
Director of ResearchWellington Management
8
ResearchAnalyst
Junior ResearchAnalyst
PortfolioManagers
Partner
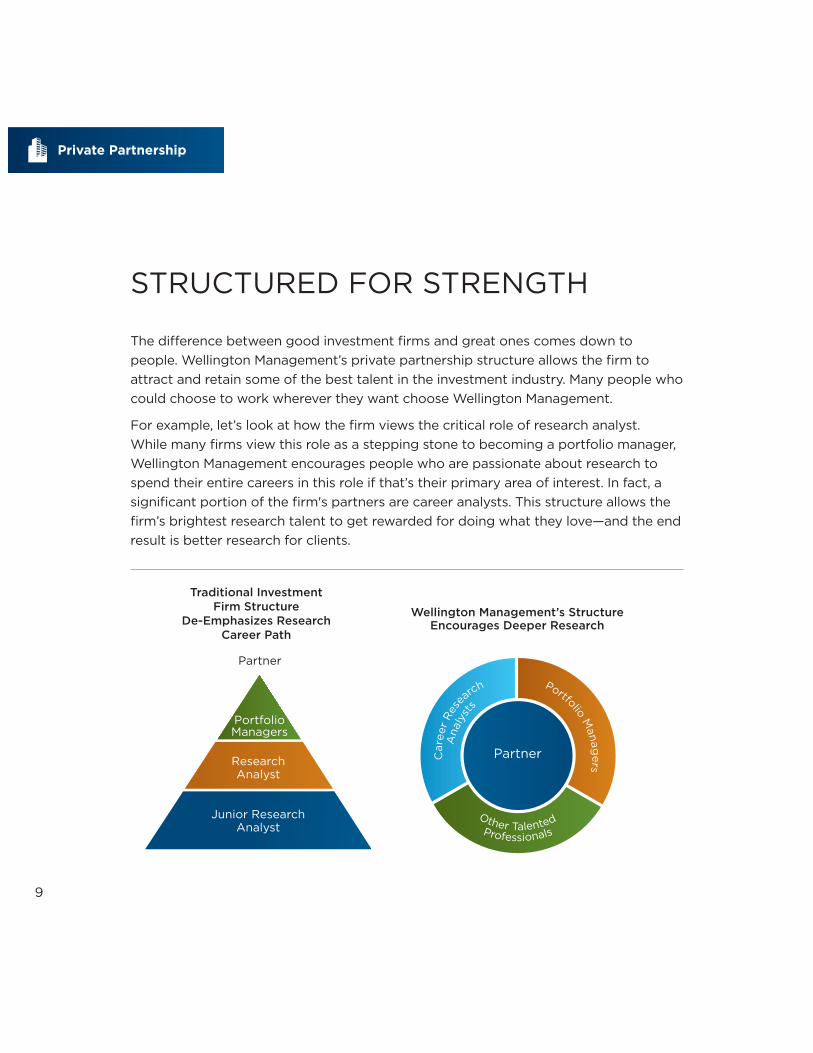
STRUCTURED FOR STRENGTH
Traditional Investment Firm Structure
De-Emphasizes ResearchCareer Path
The difference between good investment firms and great ones comes down topeople. Wellington Management’s private partnership structure allows the firm toattract and retain some of the best talent in the investment industry. Many people whocould choose to work wherever they want choose Wellington Management.
For example, let’s look at how the firm views the critical role of research analyst. While many firms view this role as a stepping stone to becoming a portfolio manager,Wellington Management encourages people who are passionate about research tospend their entire careers in this role if that’s their primary area of interest. In fact, asignificant portion of the firm's partners are career analysts. This structure allows thefirm’s brightest research talent to get rewarded for doing what they love—and the endresult is better research for clients.
Partner
Portfolio Manag
ers
Car
eer
Res
earch
Ana
lyst
s
Other Talented
Professionals
Wellington Management’s Structure Encourages Deeper Research
9
Private Partnership

10
Passionate People Make the Difference
Seventeen years ago, Dr. Bob Deresiewicz worked as a physicianand research scientist at a hospital in Boston; he was also anassistant professor at Harvard Medical School.
While Dr. Deresiewicz loved medicine, he also had a keen interest in investing, which led him to pursue a degree at Harvard BusinessSchool.
Dr. Deresiewicz is now putting his passion for business andmedicine to good use at Wellington Management, where he is a senior managing director of the firm, a global industryanalyst, and a portfolio manager for Hartford Healthcare Fund.

A TRUSTED GLOBAL MANAGERClients around the globe trust the global collaboration, specialized research, andprivate partnership that Wellington Management brings to managing assets.
11
12 Offices Worldwide
2,100+ Clients based in 50+ Countries
200+ Investment Approaches
210,000+ Securities in Global Securities Universe
As of 3/31/15.
222 public fundsclients,
including British ColumbiaInvestment ManagementCompany, OklahomaTeachers RetirementSystem, State of Oregon,and Treasurer of the Stateof North Carolina
350 corporateretirement
plan clients, includingGeneral Mills, Merck &Company, Dow Chemical,and Textron
614 endowment andfoundation
clients, including ChicagoSymphony Orchestra,Massachusetts Institute ofTechnology, University ofMichigan, and US OlympicEndowment
† As of 12/31/14. Clients on this list were selected based on client type, account size, and/or other non-performance based criteria to show a list of Wellington
Management’s representative clients. This list does not represent an endorsement of Wellington Management or its services.
Client list† includes more than:

12
ALL-AROUNDADVANTAGEHartford Funds takes fulladvantage of WellingtonManagement’s differentiatedperspectives in fixed-income,equities, multi-strategy, andalternative investments.

Collaboration in Action
During a meeting with senior management of an airline company, aWellington Management global industry analyst learned that the airlinewould no longer be flying into and out of a particular airport.
The analyst immediately realized this would have implications for fixed-income portfolios. Airports are typically financed by issuing municipal bonds, so if an airline pulls out of an airport, it may lose revenue,making it more difficult for the airport to repay its municipal bondholders.
The analyst immediately shared this insight with Wellington Management’smunicipal bond team—insight that the team may not have discovered on itsown because often times companies provide different types of informationwhen they meet with equity and fixed-income analysts.
13
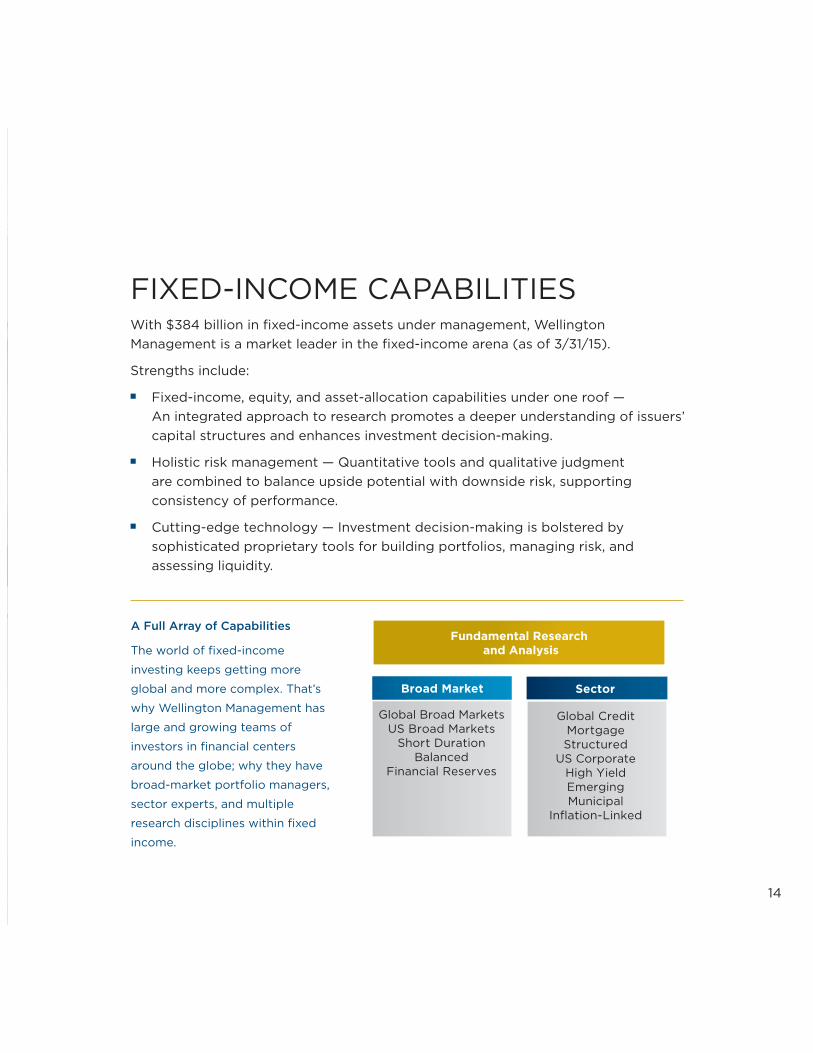
With $384 billion in fixed-income assets under management, WellingtonManagement is a market leader in the fixed-income arena (as of 3/31/15).
Strengths include:
■ Fixed-income, equity, and asset-allocation capabilities under one roof — An integrated approach to research promotes a deeper understanding of issuers’capital structures and enhances investment decision-making.
■ Holistic risk management — Quantitative tools and qualitative judgment are combined to balance upside potential with downside risk, supportingconsistency of performance.
■ Cutting-edge technology — Investment decision-making is bolstered bysophisticated proprietary tools for building portfolios, managing risk, andassessing liquidity.
FIXED-INCOME CAPABILITIES
A Full Array of Capabilities
The world of fixed-income
investing keeps getting more
global and more complex. That’s
why Wellington Management has
large and growing teams of
investors in financial centers
around the globe; why they have
broad-market portfolio managers,
sector experts, and multiple
research disciplines within fixed
income.
14
Global Broad MarketsUS Broad Markets
Short DurationBalanced
Financial Reserves
Fundamental Research and Analysis
Broad Market
Global CreditMortgageStructured
US CorporateHigh YieldEmergingMunicipal
Inflation-Linked
Sector

FIXED-INCOME FUNDS
Fund Symbols A-ShareHartford Funds A C I R3 R4 R5 R6 Y Inception Date
Duration-Hedged Strategic Inc. HABEX HABGX HABHX HABJX HABKX HABLX HABIXEmerging Markets Local Debt HLDAX HLDCX HLDIX HLDRX HLDSX HLDTX HLDYX Floating Rate HFLAX HFLCX HFLIX HFLRX HFLSX HFLTX HFLYX Floating Rate High Income HFHAX HFHCX HFHIX HFHRX HFHSX HFHTX HFHYXHigh Yield HAHAX HAHCX HAHIX HAHRX HAHSX HAHTX HAHYX Inflation Plus HIPAX HIPCX HIPIX HIPRX HIPSX HIPTX HIPYX Municipal Income HMKAX HMKCX HMKIXMunicipal Opportunities HHMAX HHMCX HHMIXMunicipal Real Return HTNAX HTNCX HTNIX HTNYXMunicipal Short Duration HMJAX HMJCX HMJIXQuality Bond HQBAX HQBCX HQBIX HQBRX HQBSX HQBTX HQBYXShort Duration HSDAX HSDCX HSDIX HSDRX HSDSX HSDTX HSDYX Strategic Income HSNAX HSNCX HSNIX HSNRX HSNSX HSNTX HSNVX HSNYX Total Return Bond ITBAX HABCX ITBIX ITBRX ITBUX ITBTX ITBVX HABYX Unconstrained Bond HTIAX HTICX HTIIX HTIRX HTISX HTITX HTIYX World Bond HWDAX HWDCX HWDIX HWDRX HWDSX HWDTX HWDVX HWDYX
PAST PERFORMANCE IS NOT INDICATIVE OF FUTURE RESULTS. The investment return and principal value of aninvestment will fluctuate so that an investor’s shares may be worth more or less than their original cost whenredeemed. Current performance may be lower or higher than the performance data quoted. For more currentperformance information to the most recent month-ended, please visit hartfordfunds.com.A Word About Risk: All investments are subject to risk, including the possible loss of principal. Fixed-incomesecurities are subject to interest-rate risk (the risk that the value of an investment decreases when interest ratesrise), credit risk (the risk that the issuing company of a security is unable to pay interest and principal when due),liquidity risk (the risk that an investment may be difficult to sell at an advantageous time or price), and call risk (therisk that an investment may be redeemed early). High-yield securities (“junk bonds”) involve additional risks. Foreigninvestments can be riskier than U.S. investments. These risks may be greater in emerging markets. Sovereign debtinvestments are subject to credit risk and the risk of default.
*Class A shares of Duration-Hedged Strategic Income, Emerging Markets Local Debt, High Yield, Inflation Plus,Municipal Opportunities, Municipal Real Return, Quality Bond, Strategic Income, Total Return Bond, UnconstrainedBond, and World Bond reflect a maximum 4.5% sales charge; Class A shares of Floating Rate and Floating Rate HighIncome reflect a maximum 3.0% sales charge and Class A shares of Short Duration reflect a maximum 2.0% salescharge. Please see a prospectus for more information about sales charges.
SI = Since inception. Since Inception Performance for Municipal Real Return is as of 6/2/1986; performance prior tothe A-Share inception date reflects Class E (no longer available).
15
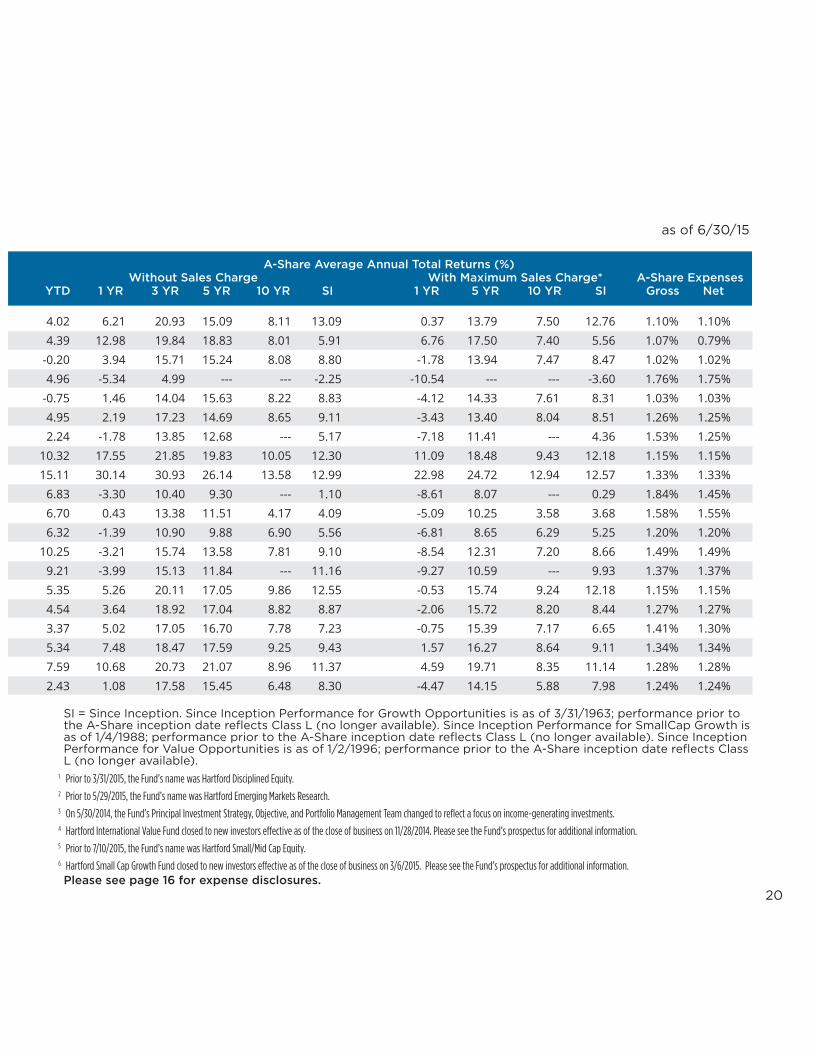
11/29/201305/31/201104/29/200509/30/201109/30/199810/31/200205/29/201505/31/200702/19/200205/29/201511/30/201210/31/200205/31/200707/22/199610/31/200205/31/2011

A-Share Average Annual Total Returns (%)Without Sales Charge With Maximum Sales Charge* A-Share Expenses
YTD 1 YR 3 YR 5 YR 10 YR SI 1 YR 5 YR 10 YR SI Gross Net
ExpensesAll Funds: Expense ratios are as shown in the most recent prospectus. Net expenses reflect contractual expensereimbursements in instances when these reductions reduce the fund's gross expenses. Contractual reimbursementsremain in effect until February 29, 2016 and automatically renew for one-year terms unless terminated.
For Emerging Markets Local Debt: Certain contractual reimbursements remain in effect until February 29, 2016. Othercontractual reimbursements remain in effect until February 29, 2016 and automatically renew for one-year termsunless terminated.
For Global Real Asset (see page 23): A contractual management fee waiver of 0.15% and a contractual expensereimbursement remain in effect until October 31, 2015. Other contractual reimbursements remain in effect untilFebruary 29, 2016 and automatically renew for one-year terms unless terminated.
16
-0.45 -5.42 --- --- --- -0.51 -9.68 --- --- -3.37 2.40% 1.15%-3.79 -14.49 -1.74 --- --- -2.02 -18.34 --- --- -3.12 1.47% 1.25%2.67 0.31 3.90 5.06 3.85 3.89 -2.70 4.42 3.54 3.58 0.96% 0.96%2.76 -0.97 4.70 --- --- 6.06 -3.94 --- --- 5.20 1.12% 1.07%2.27 -0.77 5.73 7.46 6.49 5.74 -5.24 6.48 6.00 5.45 1.14% 1.05%0.38 -2.75 -2.02 2.25 3.57 4.31 -7.12 1.31 3.09 3.93 0.92% 0.85%
--- --- --- --- --- -0.61 --- --- --- -5.08 0.76% 0.69%0.00 2.96 3.03 4.63 --- 2.52 -1.67 3.67 --- 1.94 0.70% 0.69%0.16 -0.88 1.68 3.16 1.91 4.96 -5.34 2.21 1.45 4.79 0.75% 0.69%
--- --- --- --- --- -0.07 --- --- --- -4.56 0.76% 0.69%-0.42 1.51 --- --- --- 1.43 -3.06 --- --- -0.36 1.26% 0.95%1.11 0.74 1.78 2.23 2.80 2.81 -1.28 1.82 2.60 2.64 0.91% 0.85%
-0.30 -3.20 3.09 5.12 --- 4.40 -7.56 4.16 --- 3.80 1.01% 0.95%-0.53 0.16 2.16 3.50 3.67 5.21 -4.35 2.55 3.19 4.95 0.88% 0.87%-0.33 -1.62 1.04 3.64 3.72 4.45 -6.05 2.69 3.25 4.07 1.17% 0.99%-0.32 -0.05 2.33 --- --- 3.55 -4.55 --- --- 2.39 1.02% 1.02%
as of 6/30/15

Equity portfolio managers apply disciplined and research-intensive processes to:
■ Evaluate potential opportunities based a range of inputs including the opinions,recommendations, and models of analysts across the firm
■ Understand global trends and outlooks for specific securities, industries, andmarkets
■ Construct portfolios with a focus on both return and risk to help clients achievetheir goals
EQUITY CAPABILITIES
Global Industry Analysts
BroadEquity
Capabilities
GrowthMulti-Cap
Core Value
Mid Cap
Small Cap
Insights From Specialists
Portfolio managers draw on
the expertise of investment
professionals who specialize
in different investment styles,
market caps, geographies,
industries, and more.
17

Specialized Research in Action
When a natural disaster took a toll on an oil company, many investors sold theirholdings. But a Wellington Management global industry analyst with 25 years ofexperience saw something different: opportunity.
Careful analysis showed that the company’s balance sheet was solid. Theirreturn on equity was strong at nearly 20%, and their new well productionpipeline was robust.
The analyst shared his research at Wellington Management’s Morning Meeting.These insights helped an equity portfolio manager look beyond the short-termfactors driving the share price down, so he could see the compelling longer-term risk/reward profile of this high-quality company.
18

EQUITY FUNDS
Fund Symbols A-ShareHartford Funds A C I R3 R4 R5 R6 Y Inception Date
Capital Appreciation ITHAX HCACX ITHIX ITHRX ITHSX ITHTX ITHVX HCAYXCore Equity1 HAIAX HGICX HGIIX HGIRX HGISX HGITX HAITX HGIYXDividend and Growth IHGIX HDGCX HDGIX HDGRX HDGSX HDGTX HDGVX HDGYXEmerging Markets Equity2 HERAX HERCX HERIX HERRX HERSX HERTX HERYXEquity Income HQIAX HQICX HQIIX HQIRX HQISX HQITX HQIVX HQIYXGlobal Capital Appreciation HCTAX HFCCX HCTIX HCTRX HCTSX HCTTX HCTYXGlobal Equity Income3 HLEAX HLECX HLEJX HLERX HLESX HLETX HLEYXGrowth Opportunities HGOAX HGOCX HGOIX HGORX HGOSX HGOTX HGOVX HGOYXHealthcare HGHAX HGHCX HGHIX HGHRX HGHSX HGHTX HGHYXInternational Capital Appreciation HDVAX HDVCX HDVIX HDVRX HDVSX HDVTX HDVYXInternational Growth HNCAX HNCCX HNCJX HNCRX HNCSX HNCTX HNCYXInternational Opportunities IHOAX HIOCX IHOIX IHORX IHOSX IHOTX IHOVX HAOYXInternational Small Company HNSAX HNSCX HNSJX HNSRX HNSSX HNSTX HNSYXInternational Value4 HILAX HILCX HILIX HILRX HILSX HILTX HILYXMidCap HFMCX HMDCX HFMIX HFMRX HFMSX HFMTX HFMVX HMDYXMidCap Value HMVAX HMVCX HMVJX HMVRX HMVSX HMVTX HMVYXSmall Cap Core5 HSMAX HTSCX HSEIX HSMRX HSMSX HSMTX HSMYXSmall Company IHSAX HSMCX IHSIX IHSRX IHSSX IHSUX IHSVX HSCYXSmallCap Growth6 HSLAX HSLCX HSLIX HSLRX HSLSX HSLTX HSLVX HSLYXValue Opportunities HVOAX HVOCX HVOIX HVORX HVOSX HVOTX HVOYX
PAST PERFORMANCE IS NOT INDICATIVE OF FUTURE RESULTS. The investment return and principal value of aninvestment will fluctuate so that an investor’s shares may be worth more or less than their original cost whenredeemed. Current performance may be lower or higher than the performance data quoted. For more currentperformance information to the most recent month-ended, please visit hartfordfunds.com.A Word About Risk: All investments are subject to risk, including the possible loss of principal. Small- and mid-capstocks are subject to greater risk and volatility. Foreign investments can be riskier than U.S investments. These risksmay be greater in emerging markets.
*Class A shares of the Funds above reflect a maximum 5.5% sales charge.
19
07/22/199604/30/199807/22/199605/31/201108/28/200304/29/200502/29/200802/19/200205/01/200006/30/200804/30/200107/22/199604/30/200105/28/201012/31/199704/30/200101/01/200507/22/199602/19/200202/19/2002
A-Share Average Annual Total Returns (%) Without Sales Charge With Maximum Sales Charge* A-Share Expenses
YTD 1 YR 3 YR 5 YR 10 YR SI 1 YR 5 YR 10 YR SI Gross Net
SI = Since Inception. Since Inception Performance for Growth Opportunities is as of 3/31/1963; performance prior tothe A-Share inception date reflects Class L (no longer available). Since Inception Performance for SmallCap Growth isas of 1/4/1988; performance prior to the A-Share inception date reflects Class L (no longer available). Since InceptionPerformance for Value Opportunities is as of 1/2/1996; performance prior to the A-Share inception date reflects ClassL (no longer available).
1 Prior to 3/31/2015, the Fund’s name was Hartford Disciplined Equity.2 Prior to 5/29/2015, the Fund’s name was Hartford Emerging Markets Research.3 On 5/30/2014, the Fund’s Principal Investment Strategy, Objective, and Portfolio Management Team changed to reflect a focus on income-generating investments.4 Hartford International Value Fund closed to new investors effective as of the close of business on 11/28/2014. Please see the Fund’s prospectus for additional information.5 Prior to 7/10/2015, the Fund’s name was Hartford Small/Mid Cap Equity.6 Hartford Small Cap Growth Fund closed to new investors effective as of the close of business on 3/6/2015. Please see the Fund’s prospectus for additional information.Please see page 16 for expense disclosures.
20
4.02 6.21 20.93 15.09 8.11 13.09 0.37 13.79 7.50 12.76 1.10% 1.10%4.39 12.98 19.84 18.83 8.01 5.91 6.76 17.50 7.40 5.56 1.07% 0.79%
-0.20 3.94 15.71 15.24 8.08 8.80 -1.78 13.94 7.47 8.47 1.02% 1.02%4.96 -5.34 4.99 --- --- -2.25 -10.54 --- --- -3.60 1.76% 1.75%
-0.75 1.46 14.04 15.63 8.22 8.83 -4.12 14.33 7.61 8.31 1.03% 1.03%4.95 2.19 17.23 14.69 8.65 9.11 -3.43 13.40 8.04 8.51 1.26% 1.25%2.24 -1.78 13.85 12.68 --- 5.17 -7.18 11.41 --- 4.36 1.53% 1.25%
10.32 17.55 21.85 19.83 10.05 12.30 11.09 18.48 9.43 12.18 1.15% 1.15%15.11 30.14 30.93 26.14 13.58 12.99 22.98 24.72 12.94 12.57 1.33% 1.33%
6.83 -3.30 10.40 9.30 --- 1.10 -8.61 8.07 --- 0.29 1.84% 1.45%6.70 0.43 13.38 11.51 4.17 4.09 -5.09 10.25 3.58 3.68 1.58% 1.55%6.32 -1.39 10.90 9.88 6.90 5.56 -6.81 8.65 6.29 5.25 1.20% 1.20%
10.25 -3.21 15.74 13.58 7.81 9.10 -8.54 12.31 7.20 8.66 1.49% 1.49%9.21 -3.99 15.13 11.84 --- 11.16 -9.27 10.59 --- 9.93 1.37% 1.37%5.35 5.26 20.11 17.05 9.86 12.55 -0.53 15.74 9.24 12.18 1.15% 1.15%4.54 3.64 18.92 17.04 8.82 8.87 -2.06 15.72 8.20 8.44 1.27% 1.27%3.37 5.02 17.05 16.70 7.78 7.23 -0.75 15.39 7.17 6.65 1.41% 1.30%5.34 7.48 18.47 17.59 9.25 9.43 1.57 16.27 8.64 9.11 1.34% 1.34%7.59 10.68 20.73 21.07 8.96 11.37 4.59 19.71 8.35 11.14 1.28% 1.28%2.43 1.08 17.58 15.45 6.48 8.30 -4.47 14.15 5.88 7.98 1.24% 1.24%
as of 6/30/15
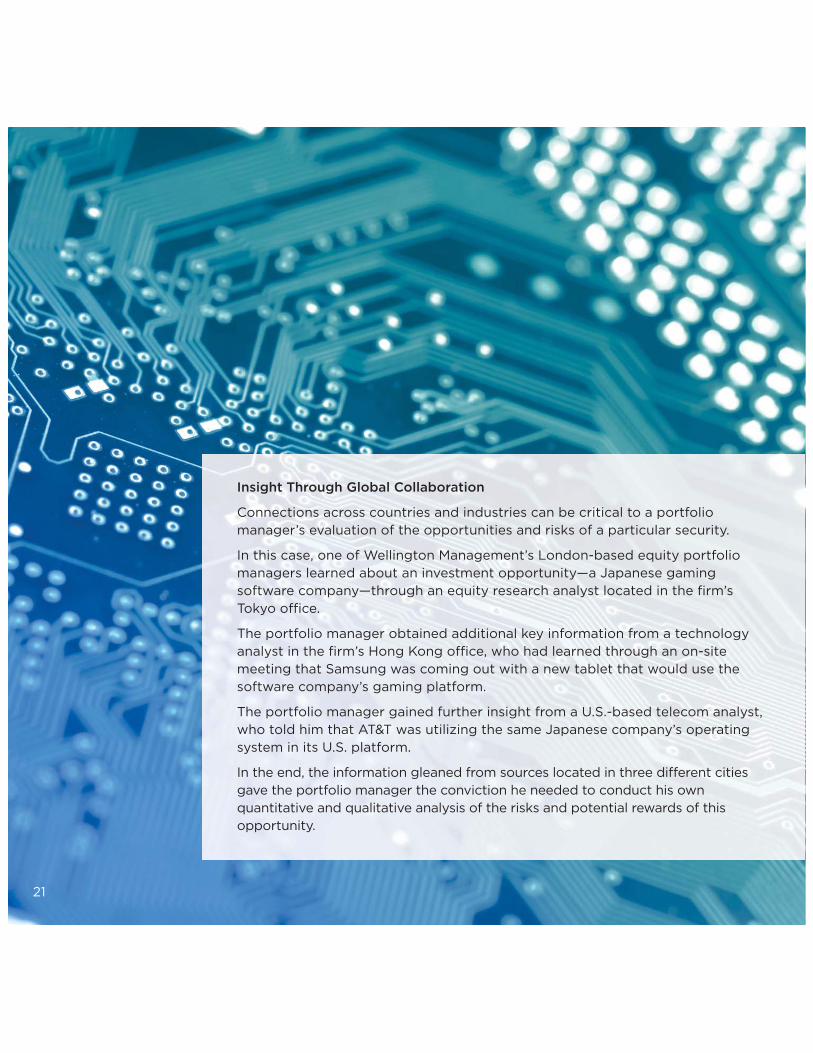
Insight Through Global Collaboration
Connections across countries and industries can be critical to a portfoliomanager’s evaluation of the opportunities and risks of a particular security.
In this case, one of Wellington Management’s London-based equity portfoliomanagers learned about an investment opportunity—a Japanese gamingsoftware company—through an equity research analyst located in the firm’sTokyo office.
The portfolio manager obtained additional key information from a technologyanalyst in the firm’s Hong Kong office, who had learned through an on-sitemeeting that Samsung was coming out with a new tablet that would use thesoftware company’s gaming platform.
The portfolio manager gained further insight from a U.S.-based telecom analyst,who told him that AT&T was utilizing the same Japanese company’s operatingsystem in its U.S. platform.
In the end, the information gleaned from sources located in three different citiesgave the portfolio manager the conviction he needed to conduct his ownquantitative and qualitative analysis of the risks and potential rewards of thisopportunity.
21
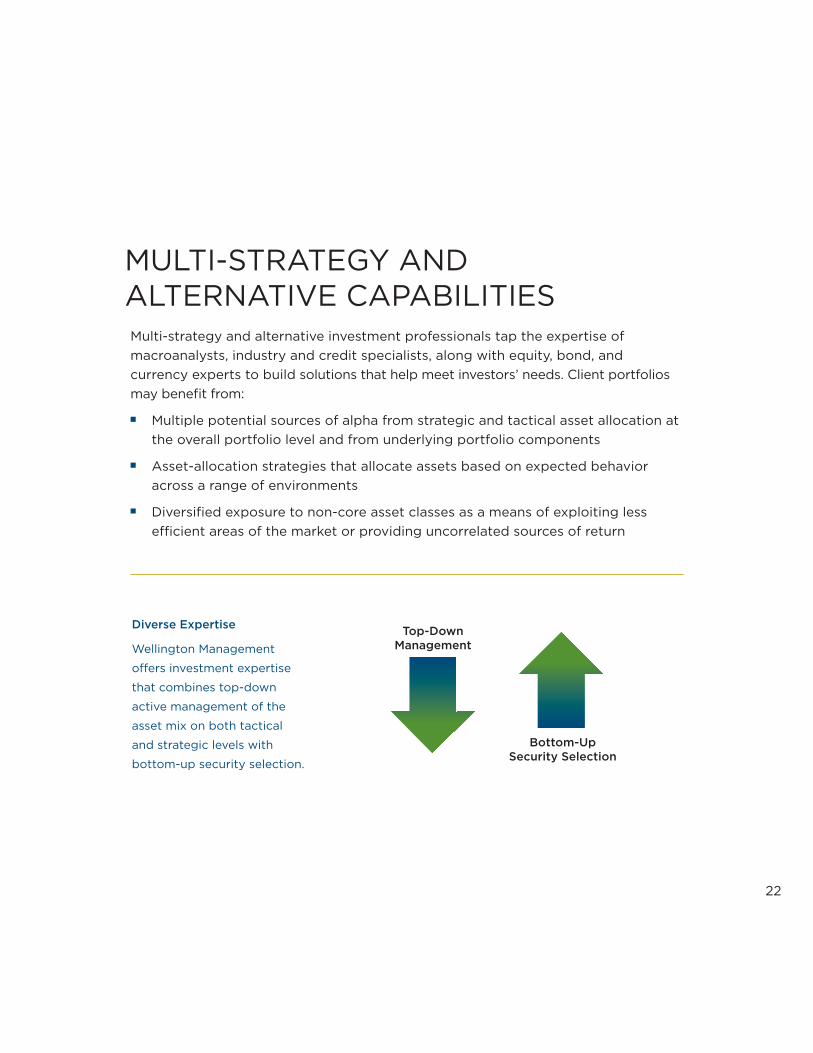
Multi-strategy and alternative investment professionals tap the expertise ofmacroanalysts, industry and credit specialists, along with equity, bond, andcurrency experts to build solutions that help meet investors’ needs. Client portfoliosmay benefit from:
■ Multiple potential sources of alpha from strategic and tactical asset allocation atthe overall portfolio level and from underlying portfolio components
■ Asset-allocation strategies that allocate assets based on expected behavioracross a range of environments
■ Diversified exposure to non-core asset classes as a means of exploiting lessefficient areas of the market or providing uncorrelated sources of return
MULTI-STRATEGY AND ALTERNATIVE CAPABILITIES
Diverse Expertise
Wellington Management
offers investment expertise
that combines top-down
active management of the
asset mix on both tactical
and strategic levels with
bottom-up security selection.
Top-Down Management
Bottom-Up Security Selection
22

PAST PERFORMANCE IS NOT INDICATIVE OF FUTURE RESULTS. The investment return and principal value of aninvestment will fluctuate so that an investor’s shares may be worth more or less than their original cost whenredeemed. Current performance may be lower or higher than the performance data quoted. For more currentperformance information to the most recent month-ended, please visit hartfordfunds.com. A Word About Risk: All investments are subject to risk, including the possible loss of principal. Fixed-incomesecurities are subject to interest-rate risk (the risk that the value of an investment decreases when interest rates rise),credit risk, and call risk. Foreign investments can be riskier than U.S. investments. Alternative investment strategiesare subject to greater risk and are not suitable for all investors.
23
Fund Symbols A-ShareHartford Funds A C I R3 R4 R5 R6 Y Inception Date
Multi-Strategy Balanced ITTAX HAFCX ITTIX ITTRX ITTSX ITTTX IHAYX Balanced Income HBLAX HBLCX HBLIX HBLRX HBLSX HBLTX HBLVX HBLYXChecks and Balances HCKAX HCKCX HCKIX HCKRX HCKSX HCKTXConservative Allocation HCVAX HCVCX HCVIX HCVRX HCVSX HCVTX Global All-Asset HLAAX HLACX HLAIX HLARX HLASX HLATX HLAYX Growth Allocation HRAAX HRACX HRAIX HRARX HRASX HRATX Moderate Allocation HBAAX HBACX HBAIX HBARX HBASX HBATX Multi-Asset Income HAFAX HAICX HAFIX HAFRX HAFSX HAFTX HAFYX
Fund Symbols A-ShareHartford Funds A C I R3 R4 R5 R6 Y Inception Date
Alternative InvestmentsGlobal Alpha HAPAX HAPCX HAPIX HAPRX HAPSX HAPTX HAPYX Global Real Asset HRLAX HRLCX HRLIX HRLRX HRLSX HRLTX HRLYXLong/Short Global Equity7 HLOAX HLOCX HLOIX HLOYXReal Total Return HABMX HABNX HABOX HABFX HABQX HABRX HABPX
MULTI-STRATEGY AND ALTERNATIVE FUNDS
07/22/199607/31/200605/31/200705/28/200405/28/201005/28/200405/28/200404/30/2014
12/14/201205/28/201008/29/201411/29/2013
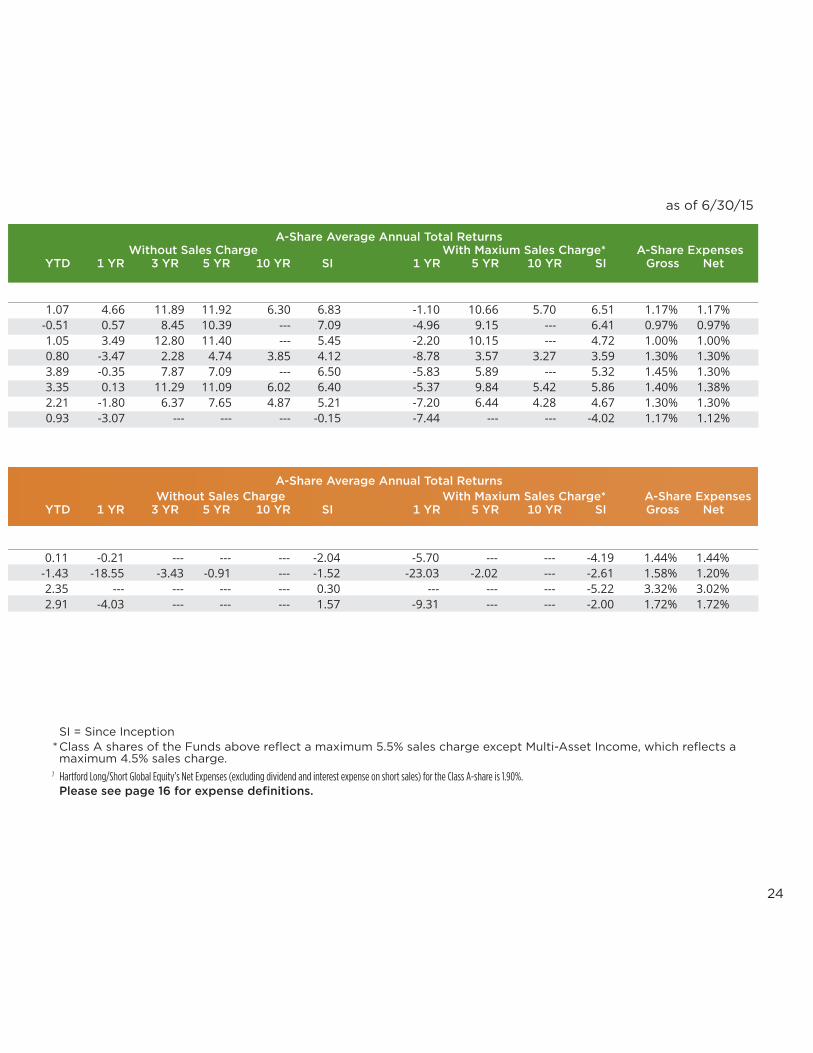
SI = Since Inception*Class A shares of the Funds above reflect a maximum 5.5% sales charge except Multi-Asset Income, which reflects amaximum 4.5% sales charge.
7 Hartford Long/Short Global Equity’s Net Expenses (excluding dividend and interest expense on short sales) for the Class A-share is 1.90%.Please see page 16 for expense definitions.
24
as of 6/30/15
A-Share Average Annual Total ReturnsWithout Sales Charge With Maxium Sales Charge* A-Share Expenses
YTD 1 YR 3 YR 5 YR 10 YR SI 1 YR 5 YR 10 YR SI Gross Net
A-Share Average Annual Total ReturnsWithout Sales Charge With Maxium Sales Charge* A-Share Expenses
YTD 1 YR 3 YR 5 YR 10 YR SI 1 YR 5 YR 10 YR SI Gross Net
1.07 4.66 11.89 11.92 6.30 6.83 -1.10 10.66 5.70 6.51 1.17% 1.17%-0.51 0.57 8.45 10.39 --- 7.09 -4.96 9.15 --- 6.41 0.97% 0.97%1.05 3.49 12.80 11.40 --- 5.45 -2.20 10.15 --- 4.72 1.00% 1.00%0.80 -3.47 2.28 4.74 3.85 4.12 -8.78 3.57 3.27 3.59 1.30% 1.30%3.89 -0.35 7.87 7.09 --- 6.50 -5.83 5.89 --- 5.32 1.45% 1.30%3.35 0.13 11.29 11.09 6.02 6.40 -5.37 9.84 5.42 5.86 1.40% 1.38%2.21 -1.80 6.37 7.65 4.87 5.21 -7.20 6.44 4.28 4.67 1.30% 1.30%0.93 -3.07 --- --- --- -0.15 -7.44 --- --- -4.02 1.17% 1.12%
0.11 -0.21 --- --- --- -2.04 -5.70 --- --- -4.19 1.44% 1.44%-1.43 -18.55 -3.43 -0.91 --- -1.52 -23.03 -2.02 --- -2.61 1.58% 1.20%2.35 --- --- --- --- 0.30 --- --- --- -5.22 3.32% 3.02%2.91 -4.03 --- --- --- 1.57 -9.31 --- --- -2.00 1.72% 1.72%

INCORPORATING A DIFFERENT PERSPECTIVE
Navigating today’s increasingly complex global markets requires a high level of sophistication and expertise. That’s why it’sessential for investors to consider the benefits of consulting withprofessionals who understand this complexity—and embrace it.
Your financial professional can put Wellington Management’sexpertise to work for you by incorporating strategies fromHartford Funds and helping you build a diversified portfolio that’s customized to meet your investment needs.
25

For more information andassistance in selectingHartford Funds that areappropriate to your needs,consult your financialprofessional and visithartfordfunds.com.
26

HARTFORDFUNDSSub-Advised by
WELLINGTON MANAGEMENT
Investors should carefully consider the investment objectives, risks, charges, and expenses of HartfordFunds before investing. This and other information can be found in the prospectus and summaryprospectus, which can be obtained by calling 888-843-7824 (retail) or 800-279-1541 (institutional).Investors should read them carefully before they invest.
Hartford Funds are underwritten and distributed by Hartford Funds Distributors, LLC. Hartford Funds ManagementCompany, LLC is the Funds’ investment manager and the Funds are sub-advised by Wellington ManagementCompany LLP. Wellington Management Company LLP is a SEC-registered investment adviser and is unaffiliated withHartford Funds.
All information and representations herein are as of 6/15, unless otherwise noted. 113489-6 MFWELL_0715
hartfordfunds.com
888-843-7824
@hartfordfunds
hartfordfunds.com/linkedin