
Hartford-West Hartford-East Hartford, Connecticut · COMPREHENSIVE HOUSING MARKET ANALYSIS...
12
COMPREHENSIVE HOUSING MARKET ANALYSIS Hartford-West Hartford-East Hartford, Connecticut U.S. Department of Housing and Urban Development Office of Policy Development and Research As of August 1, 2014 Massachusetts Connecticut New Haven New London Hampden Worcester Windham Litchfield Hartford Tolland Middlesex Long Island Sound Housing Market Area The Hartford-West Hartford-East Hartford Housing Market Area (here- after, the Hartford HMA) is coterminous with the Hartford-West Hartford-East Hartford, CT Metropolitan Statistical Area, which comprises Hartford, Mid- dlesex, and Tolland Counties. The HMA spans central Connecticut from the Massachusetts border to the north to the Long Island Sound to the south. The HMA, the largest metropolitan area in Connecticut and third largest in New England, includes the city of Hartford, which is the state capital. Market Details Economic Conditions ............... 2 Population and Households ..... 5 Housing Market Trends ............ 7 Data Profile ............................. 11 Summary Economy Economic conditions in the Hartford HMA have continued to improve, albeit at a slow-to-moderate rate, since the second quarter of 2011. During the 12 months ending July 2014, nonfarm payrolls increased by 3,800 jobs, or 0.7 percent, to 551,100 jobs, compared with the number of jobs recorded dur- ing the previous 12 months. The largest employment sector in the HMA, the education and health services sector, which accounts for 18 percent of the jobs in the HMA, led job growth, add- ing 2,000 jobs during the 12 months ending July 2014, a 2.0-percent in- crease from a year earlier. During the 3-year forecast period, nonfarm pay- rolls are expected to increase by an average of 4,600 jobs, or 0.8 percent, annually. Sales Market The sales housing market in the HMA is slightly soft, with a current estimated owner vacancy rate of 1.4 percent, up from 1.3 percent in April 2010. During the forecast period, demand is expected for 3,200 new homes (Table 1). The 500 homes currently under construc- tion and a portion of the estimated 17,900 other vacant units in the HMA that may reenter the sales market will satisfy some of the forecast demand. Rental Market The rental housing market in the HMA is slightly soft overall but has moved toward a balanced state since 2010. The estimated renter vacancy rate is 6.8 percent, down from 8.1 percent in April 2010 (Table DP-1 at the end of this report). By contrast, the apartment market is tight, with a vacancy rate of 2.5 percent during the second quarter of 2014, down from 2.8 percent a year earlier (Reis, Inc.). During the forecast period, demand is expected for 2,200 new rental units (Table 1). The 1,325 units currently under construction will satisfy some of the forecast demand. Table 1. Housing Demand in the Hartford HMA* During the Forecast Period Hartford HMA* Sales Units Rental Units Total demand 3,200 2,200 Under construction 500 1,325 *Hartford-West Hartford-East Hartford HMA. Notes: Total demand represents estimated production necessary to achieve a balanced market at the end of the forecast period. Units under construction as of August 1, 2014. A portion of the estimated 17,900 other vacant units in the HMA will likely satisfy some of the forecast demand. The forecast period is August 1, 2014, to August 1, 2017. Source: Estimates by analyst
-
Upload
nguyendieu -
Category
Documents
-
view
229 -
download
3
Transcript of Hartford-West Hartford-East Hartford, Connecticut · COMPREHENSIVE HOUSING MARKET ANALYSIS...

C O M P R E H E N S I V E H O U S I N G M A R K E T A N A L Y S I S
Hartford-West Hartford-East Hartford,ConnecticutU.S. Department of Housing and Urban Development Office of Policy Development and Research As of August 1, 2014
Massachusetts
Connecticut
New Haven
New London
Hampden Worcester
Win
dhamLitc
hfie
ld
Hartford
Tolland
Middlesex
Long Island Sound
Housing Market Area
The Hartford-West Hartford-East Hartford Housing Market Area (here - after, the Hartford HMA) is coterminous with the Hartford-West Hartford-East Hartford, CT Metropolitan Statistical Area, which comprises Hartford, Mid - dlesex, and Tolland Counties. The HMA spans central Connecticut from the Massachusetts border to the north to the Long Island Sound to the south. The HMA, the largest metropolitan area in Connecticut and third largest in New England, includes the city of Hartford, which is the state capital.
Market DetailsEconomic Conditions ............... 2
Population and Households ..... 5
Housing Market Trends ............ 7
Data Profile ............................. 11
SummaryEconomy Economic conditions in the Hartford HMA have continued to improve, albeit at a slow-to-moderate rate, since the second quarter of 2011. During the 12 months ending July 2014, nonfarm payrolls increased by 3,800 jobs, or 0.7 percent, to 551,100 jobs, compared with the number of jobs recorded dur - ing the previous 12 months. The largest employment sector in the HMA, the education and health services sector, which accounts for 18 percent of the jobs in the HMA, led job growth, add - ing 2,000 jobs during the 12 months ending July 2014, a 2.0-percent in - crease from a year earlier. During the 3-year forecast period, nonfarm pay-rolls are expected to increase by an average of 4,600 jobs, or 0.8 percent, annually.
Sales MarketThe sales housing market in the HMA is slightly soft, with a current estimated owner vacancy rate of 1.4 percent, up from 1.3 percent in April 2010. During the forecast period, demand is expected for 3,200 new homes (Table 1). The 500 homes currently under construc-tion and a portion of the estimated 17,900 other vacant units in the HMA that may reenter the sales market will satisfy some of the forecast demand.
Rental MarketThe rental housing market in the HMA is slightly soft overall but has moved toward a balanced state since 2010. The estimated renter vacancy rate is 6.8 percent, down from 8.1 percent in April 2010 (Table DP-1 at the end of this report). By contrast, the apartment market is tight, with a vacancy rate of 2.5 percent during the second quarter of 2014, down from 2.8 percent a year earlier (Reis, Inc.). During the forecast period, demand is expected for 2,200 new rental units (Table 1). The 1,325 units currently under construction will satisfy some of the forecast demand.
Table 1. Housing Demand in the Hartford HMA* During the Forecast Period
Hartford HMA*
SalesUnits
RentalUnits
Total demand 3,200 2,200
Under construction 500 1,325
*Hartford-West Hartford-East Hartford HMA.Notes: Total demand represents estimated production necessary to achieve a balanced market at the end of the forecast period. Units under construction as of August 1, 2014. A portion of the estimated 17,900 other vacant units in the HMA will likely satisfy some of the forecast demand. The forecast period is August 1, 2014, to August 1, 2017.Source: Estimates by analyst
Ha
rtf
ord
-We
st
Ha
rtf
ord
-Ea
st
Ha
rtf
ord
, C
T •
CO
MP
RE
HE
NS
IVE
HO
US
ING
MA
RK
ET
AN
ALY
SIS
2Economic Conditions
In the following discussion, all data relate to the Hartford HMA except
for nonfarm payroll data, which are available from the U.S. Bureau of Labor Statistics for the Hartford-West Hartford-East Hartford, CT Metropol - itan New England City and Town Area (hereafter, the Hartford NECTA). The Hartford NECTA, which is geographi-cally similar to the Hartford HMA, contains all the major employment and population centers in the HMA.
Economic conditions have improved in the Hartford HMA since the second quarter of 2011; however, the rate of growth slowed during the past year, and the current level of nonfarm
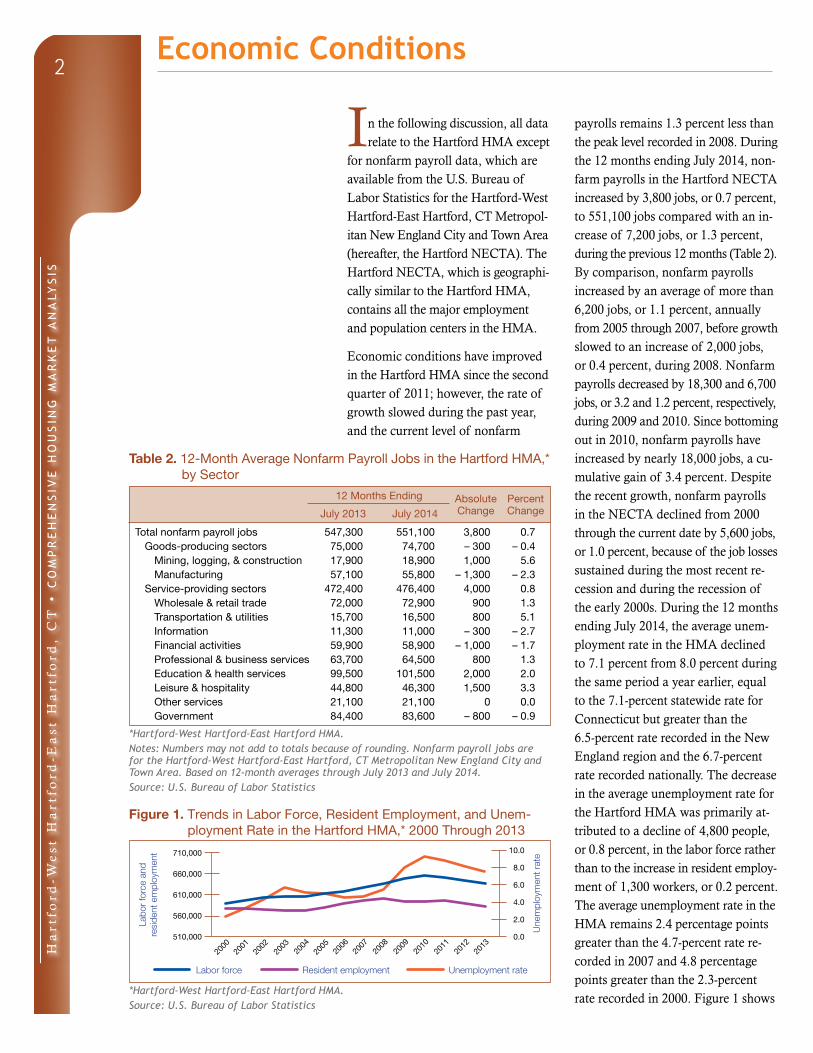
payrolls remains 1.3 percent less than the peak level recorded in 2008. During the 12 months ending July 2014, non-farm payrolls in the Hartford NECTA increased by 3,800 jobs, or 0.7 percent, to 551,100 jobs compared with an in - crease of 7,200 jobs, or 1.3 percent, during the previous 12 months (Table 2). By comparison, nonfarm payrolls increased by an average of more than 6,200 jobs, or 1.1 percent, annually from 2005 through 2007, before growth slowed to an increase of 2,000 jobs, or 0.4 percent, during 2008. Nonfarm payrolls decreased by 18,300 and 6,700 jobs, or 3.2 and 1.2 percent, respectively, during 2009 and 2010. Since bottoming out in 2010, nonfarm payrolls have increased by nearly 18,000 jobs, a cu-mulative gain of 3.4 percent. Despite the recent growth, nonfarm payrolls in the NECTA declined from 2000 through the current date by 5,600 jobs, or 1.0 percent, because of the job losses sustained during the most recent re - cession and during the recession of the early 2000s. During the 12 months ending July 2014, the average unem-ployment rate in the HMA declined to 7.1 percent from 8.0 percent during the same period a year earlier, equal to the 7.1-percent statewide rate for Connecticut but greater than the 6.5-percent rate recorded in the New England region and the 6.7-percent rate recorded nationally. The decrease in the average unemployment rate for the Hartford HMA was primarily at-tributed to a decline of 4,800 people, or 0.8 percent, in the labor force rather than to the increase in resident employ - ment of 1,300 workers, or 0.2 percent. The average unemployment rate in the HMA remains 2.4 percentage points greater than the 4.7-percent rate re - corded in 2007 and 4.8 percentage points greater than the 2.3-percent rate recorded in 2000. Figure 1 shows
Table 2. 12-Month Average Nonfarm Payroll Jobs in the Hartford HMA,* by Sector
12 Months Ending Absolute Change
Percent ChangeJuly 2013 July 2014
Total nonfarm payroll jobs 547,300 551,100 3,800 0.7Goods-producing sectors 75,000 74,700 – 300 – 0.4
Mining, logging, & construction 17,900 18,900 1,000 5.6Manufacturing 57,100 55,800 – 1,300 – 2.3
Service-providing sectors 472,400 476,400 4,000 0.8Wholesale & retail trade 72,000 72,900 900 1.3Transportation & utilities 15,700 16,500 800 5.1Information 11,300 11,000 – 300 – 2.7Financial activities 59,900 58,900 – 1,000 – 1.7Professional & business services 63,700 64,500 800 1.3Education & health services 99,500 101,500 2,000 2.0Leisure & hospitality 44,800 46,300 1,500 3.3Other services 21,100 21,100 0 0.0Government 84,400 83,600 – 800 – 0.9
*Hartford-West Hartford-East Hartford HMA.Notes: Numbers may not add to totals because of rounding. Nonfarm payroll jobs are for the Hartford-West Hartford-East Hartford, CT Metropolitan New England City and Town Area. Based on 12-month averages through July 2013 and July 2014.Source: U.S. Bureau of Labor Statistics
Figure 1. Trends in Labor Force, Resident Employment, and Unem-ployment Rate in the Hartford HMA,* 2000 Through 2013
*Hartford-West Hartford-East Hartford HMA.Source: U.S. Bureau of Labor Statistics
Une
mpl
oym
ent r
ate
Labo
r fo
rce
and
resi
dent
em
ploy
men
t 710,000
660,000
610,000
560,000
510,000
2000
2002
2004
Labor force Resident employment Unemployment rate
10.0
8.0
6.0
4.0
2.0
0.0
2006
2001
2003
2005
2007
2009
2010
2008
2012
2013
2011

Ha
rtf
ord
-We
st
Ha
rtf
ord
-Ea
st
Ha
rtf
ord
, C
T •
CO
MP
RE
HE
NS
IVE
HO
US
ING
MA
RK
ET
AN
ALY
SIS
3
labor force, resident employment, and unemployment rate trends in the HMA from 2000 through 2013.
The education and health services sector, which accounts for 18 percent of all nonfarm payrolls in the Hartford NECTA, is the largest employment sector (Figure 2) and the fastest growing sector since 2000 (Figure 3). The edu-cation and health services sector has added jobs every year since 2000 (the
analysis in this report only considers activity since 2000), helping to stabilize the local economy somewhat during the recessions of the early and late 2000s. From 2001 through 2003, the sector expanded by 4,100 jobs, reflect-ing an average annual increase of 1.7 percent. During this period, the number of nonfarm payroll jobs in all other sectors declined by more than 25,000 jobs, representing a cumulative loss of more than 5 percent. From 2004 through 2008, a period of expansion for the NECTA, the education and health services sector added jobs at four times the rate of all other sectors combined. During 2009, a year when every other sector lost jobs, the educa-tion and health services sector added 2,500 jobs, a 2.7-percent increase. Although sector growth has slowed somewhat since 2010, during the 12 months ending July 2014, the educa-tion and health services sector led growth in the NECTA, adding 2,000 jobs, a 2.0-percent increase.
Figure 2. Current Nonfarm Payroll Jobs in the Hartford HMA,* by Sector
*Hartford-West Hartford-East Hartford HMA.Notes: Nonfarm payroll jobs are for the Hartford-West Hartford-East Hartford, CT Metropolitan New England City and Town Area. Based on 12-month averages through July 2014.Source: U.S. Bureau of Labor Statistics
Figure 3. Sector Growth in the Hartford HMA,* Percentage Change, 2000 to Current
*Hartford-West Hartford-East Hartford HMA.Notes: Nonfarm payroll jobs are for the Hartford-West Hartford-East Hartford, CT Metropolitan New England City and Town Area. Current is based on 12-month averages through July 2014.Source: U.S. Bureau of Labor Statistics
Economic Conditions Continued
Government 15.2%
Leisure & hospitality 8.4%
Other services 3.8%
Education & health services 18.4%
Professional & business services 11.7%
Wholesale & retail trade 13.2%
Manufacturing 10.1%
Mining, logging, & construction 3.4%
Information 2.0%
Transportation & utilities 3.0%
Financial activities 10.7%
Total nonfarm payroll jobs
Goods-producing sectors
Mining, logging, & construction
Manufacturing
Service-providing sectors
Information
Financial activities
Professional & business services
Education & health services
Government
Other services
Leisure & hospitality
Transportation & utilities
Wholesale & retail trade
– 20 – 10 200 10– 30 30

Ha
rtf
ord
-We
st
Ha
rtf
ord
-Ea
st
Ha
rtf
ord
, C
T •
CO
MP
RE
HE
NS
IVE
HO
US
ING
MA
RK
ET
AN
ALY
SIS
4
By contrast to the education and health services sector, the manufacturing and financial activities sectors were drags on the local economy during most years since 2000. During the 12 months end - ing July 2014, the manufacturing and financial activities sectors accounted for 10 and 11 percent of nonfarm payrolls, respectively, in the Hartford NECTA. By comparison, in 2000, the sectors accounted for 14 and 13 per-cent of all nonfarm payroll jobs, re-spectively. The manufacturing sector in the NECTA, despite the overall job losses since 2000, has outperformed the sector in other metropolitan areas in the New England region. From 2000 through 2013, the number of jobs in the manufacturing sector in the Hart-ford NECTA decreased 25 percent. During the same period, the number of manufacturing sector jobs in the Boston-Cambridge-Quincy, MA-NH Metropolitan NECTA (hereafter, the Boston NECTA) decreased 35 percent. In the Providence-Fall River-Warwick, RI-MA Metropolitan NECTA (here - after, the Providence NECTA), the number of manufacturing sector jobs decreased 47 percent. Manufacturing sector payrolls in the Hartford NECTA appeared to stabilize, increasing slightly in 2011 and 2012, until recently, when the sector payrolls declined by 1,300 jobs, or 2.3 percent, during the 12 months ending July 2014. The Lee Company, an aerospace manufacturer in West - brook, announced plans to add 200 employees by 2018 (New Haven Register). This gain will partially counter job losses in the sector resulting from de - clines at Clear Edge Power, a fuel cell manufacturer that filed for bankruptcy protection and cut 270 jobs at its South Windsor facility in April 2014, and at the conglomerate 3M Company, which plans to close its manufacturing plant
in Enfield by the end of 2014, affecting 140 workers (Hartford Business Journal). Unlike in the manufacturing sector, job losses in the financial activities sector since 2000 have been greater (on a percentage basis) in the Hartford NECTA than in either the Boston or Providence NECTAs. In the Hartford NECTA, the financial activities sector has lost nonfarm payroll jobs every year since 2002—although in some years the contractions were minimal— at an average of 11,600 jobs annually, representing a 16-percent decline. Nearly two-thirds of the net job losses occurred in the insurance carriers and related activities industry. During the 12 months ending July 2014, the financial activities sector decreased by 1,000 jobs, a 1.7-percent decline. The insurance carriers and related activities industry, which decreased by 1,200 jobs, a 3.0-percent decline, accounted for more than the entire net loss. Despite the job losses, the number of insurance firms in the HMA has increased by 150 since 2002. “This trend is a result of smaller firms spinning off from larger firms and new and innovative products being developed” (Connecti-cut Economic Resource Center, Inc.).
The larger companies in the financial activities and manufacturing sectors still contribute significantly to the economic landscape in the Hartford HMA. Of the six companies that employ more than 5,000 workers in the HMA, four are part of the manu - facturing or financial activities sectors, including Pratt & Whitney, an aero - space manufacturer, and The Hartford Financial Services Group, an investment and insurance company (Table 3). The largest employer in the HMA, the University of Connecticut (UConn), which includes the UConn Health
Economic Conditions Continued

Ha
rtf
ord
-We
st
Ha
rtf
ord
-Ea
st
Ha
rtf
ord
, C
T •
CO
MP
RE
HE
NS
IVE
HO
US
ING
MA
RK
ET
AN
ALY
SIS
5
Center, employed 10,500 full- and part-time faculty and staff during the academic year beginning the fall of 2012. UConn reported a statewide eco-nomic impact of $3.4 billion, directly or indirectly supporting more than 24,200 jobs during the same period.
During the 12 months ending July 2014, nonfarm payroll levels in other sectors were mixed. As local, state, and national economies continued to improve, the leisure and hospitality sector benefited, gaining 1,500 jobs, or 3.3 percent; the entire net gain was in the accommodation and food services subsector. The mining, logging, and construction sector, in part because of
increased multifamily building activity, was the fastest growing sector (on a percentage basis), adding 1,000 jobs, a 5.6-percent increase. By contrast, the government sector lost 800 jobs, or 0.9 percent. Losses were primarily concentrated in the state government subsector, which lost 700 jobs, repre-senting a 2.0-percent decline.
During the 3-year forecast period, non - farm payrolls are expected to increase at an average annual rate of 4,600 jobs, 0.8 percent. Slow-to-moderate job growth is expected to continue throughout the forecast period, but the nonfarm payroll growth is expected to increase each year of the forecast period, gaining nearly 1 percent during the second year and more than 1 per-cent during the third year. Although the financial activities sector is expected to continue to be a drag on the local economy, the manufacturing sector is expected to be stable and job gains are expected in most other private employment sectors during the next 3 years, with the strongest gains ex - pected in the education and health services, leisure and hospitality, and professional and business services sectors.
Table 3. Major Employers in the Hartford HMA*
Name of Employer Nonfarm Payroll Sector Number of Employees
University of Connecticut (including UConn Health Center)
Government 10,500
The Hartford Financial activities 5,000–9,999The Hartford Financial Services Group Financial activities 5,000–9,999Northeast Utilities System Transportation & utilities 5,000–9,999Pratt & Whitney Manufacturing 5,000–9,999UTC Aerospace Systems Manufacturing 5,000–9,999Aetna, Inc. Financial activities 1,000–4,999Cigna Corporation Financial activities 1,000–4,999ESPN Inc. Information 1,000–4,999Travelers Indemnity Company Financial activities 1,000–4,999
*Hartford-West Hartford-East Hartford HMA.Note: Excludes local school districts.Sources: Connecticut Department of Labor; University of Connecticut
Population and Households
As of August 1, 2014, the estimated population of the
Hartford HMA was 1,216,000, reflect - ing an average annual increase of 840, or 0.1 percent, since April 2010 com - pared with an average annual increase of 6,375, or 0.5 percent, during the previous 10 years (Figure 4). The HMA, which contains nearly 35 percent of
the population of Connecticut, in - cludes the city of Hartford, which is the state capital and the third most populous city in the state (behind Bridgeport and Stamford), with a popu - lation of slightly more than 125,000 (2013 American Community Survey 1-year data). In the HMA, net natural increase (resident births minus resident
Economic Conditions Continued

Ha
rtf
ord
-We
st
Ha
rtf
ord
-Ea
st
Ha
rtf
ord
, C
T •
CO
MP
RE
HE
NS
IVE
HO
US
ING
MA
RK
ET
AN
ALY
SIS
6
deaths) has accounted for all the net population gain since 2010 (Figure 5). Net in-migration has represented 35 percent of the population growth in the HMA since 2000; however, nearly 80 percent of the net in-migration took place before July 2003.
In recent years, population growth and net migration to and from the Hartford HMA were affected not only by the job gains in the HMA but also by the relative strength of the local economy compared with other economies in the northeast and with the national economy. From 2005 through 2007, nonfarm payrolls in the Hartford NECTA increased at an average annual rate of 1.1 percent, 0.4 percentage point less than the national rate but
equal to the rate in the Boston NECTA, the largest metropolitan NECTA. Dur - ing this period of moderate economic growth, net in-migration to the Hart - ford HMA was sustained. From July 2005 to July 2008, the population in - creased at an average annual rate of 5,500, or 0.5 percent, with net in- migration accounting for more than 35 percent of the growth. During 2008 and 2009, nonfarm payrolls decreased an average of 1.5 percent a year, which was less severe than the average annual decline of 2.5 percent nationwide but similar to the average annual decline of 1.3 percent in the Boston NECTA. Although population growth slowed, net in-migration continued. From July 2008 to July 2010, the population increased by 4,800, or 0.4 percent, a year, with net in-migration still rep - resenting more than 35 percent of the growth. From 2010 through 2012, however, nonfarm payrolls in the Hart - ford HMA expanded 0.2 percent a year—lower than both the national rate of 0.7 percent and the 1.2-percent rate in the Boston NECTA. From July 2010 to July 2013, the population remained essentially unchanged, and net out-migration averaged more than 1,500 people a year.
Net out-migration since 2010 has resulted in lower levels of household formation during the period. The HMA currently has an estimated 475,700 households, reflecting an average annual increase of 730 households, or 0.2 percent, since April 2010 compared with the increase of 2,675 households, or 0.6 percent, annually from April 2000 to April 2010. In recent years, the low rate of improvement in the local economy and tightened mortgage lending standards contributed to renters forming more new households than
Figure 4. Population and Household Growth in the Hartford HMA,* 2000 to Forecast
*Hartford-West Hartford-East Hartford HMA.Notes: The current date is August 1, 2014. The forecast date is August 1, 2017.Sources: 2000 and 2010—2000 Census and 2010 Census; current and forecast—estimates by analyst
Figure 5. Components of Population Change in the Hartford HMA,* 2000 to Forecast
*Hartford-West Hartford-East Hartford HMA.Notes: The current date is August 1, 2014. The forecast date is August 1, 2017.Sources: 2000 and 2010—2000 Census and 2010 Census; current and forecast—estimates by analyst
Population and Households Continued
Population Households
7,000
6,000
5,000
4,000
3,000
2,000
1,000
02000 to 2010 2010 to current Current to forecast
Ave
rage
ann
ual c
hang
e
4,000
3,000
2,000
1,000
0
– 1,000
– 2,0002000 to 2010 2010 to current Current to forecast
Ave
rage
ann
ual c
hang
e
Net natural change Net migration

Ha
rtf
ord
-We
st
Ha
rtf
ord
-Ea
st
Ha
rtf
ord
, C
T •
CO
MP
RE
HE
NS
IVE
HO
US
ING
MA
RK
ET
AN
ALY
SIS
7
owners. Since April 2010, nearly 50 percent of new households formed have been renters compared with the 6 percent of new households formed from 2000 to 2010. Owners currently constitute an estimated 67.8 percent
of all households, slightly down from 67.9 percent in the 2010 Census but up from 66.3 percent in the 2000 Census. Figure 6 shows the number of households by tenure in the HMA since 2000.
During the 3-year forecast period, the population and number of households in the HMA are expected to continue to increase slowly. The HMA popu - lation is expected to increase by an average of 2,675, or 0.2 percent, an - nually to reach 1,224,000 by August 1, 2017. The number of households in the HMA is expected to grow by 1,425, or 0.3 percent, annually during the forecast period, to 480,000. Nearly 30 percent of new households formed during the forecast period are expected to be renter households.
Figure 6. Number of Households by Tenure in the Hartford HMA,* 2000 to Current
*Hartford-West Hartford-East Hartford HMA.Note: The current date is August 1, 2014.Sources: 2000 and 2010—2000 Census and 2010 Census; current—estimates by analyst
Housing Market Trends
Sales Market
Despite the low rate of owner house - hold formation since 2010, the sales housing market in the Hartford HMA, which is slightly soft, moved toward a balanced state during the past 2 years, in part because the economy continued to slowly improve and additions to sales housing inventory were limited. The current owner vacancy rate is estimated at 1.4 percent, up from the 1.3-percent rate in April 2010 and the 0.9-percent rate recorded during the tight market in April 2000.
The number of home sales (including single-family homes, townhomes, and condominiums) and average home sales prices stabilized and began to increase during the past year, but both remain
well below the peak levels recorded during the 2000s. During the 12 months ending July 2014, new and existing home sales totaled 13,750, slightly up from the 13,700 home sales recorded during the previous 12 months (Core - Logic, Inc.). By comparison, an average of 22,350 homes sold annually from 2000 through 2007. From 2008 through 2010, a period that included a national recession and an economic downturn in the HMA, which led to substantially tightened mortgage lending standards, average annual home sales declined to 14,150 before bottoming out at 10,950 homes sold in 2011. During the 12 months ending July 2014, the aver - age home sales price was $237,400,
2000 2010 Current
Renter Owner
350,000
300,000
250,000
200,000
150,000
100,000
50,000
0
Population and Households Continued
Ha
rtf
ord
-We
st
Ha
rtf
ord
-Ea
st
Ha
rtf
ord
, C
T •
CO
MP
RE
HE
NS
IVE
HO
US
ING
MA
RK
ET
AN
ALY
SIS
8
a 2-percent increase from $231,700 during the previous 12 months. Aver-age sales prices peaked at $264,200 from 2006 through 2008 and declined to $238,200 from 2009 through 2011.
The market for new home sales was slower to recover than the overall sales market in the Hartford HMA. During the 12 months ending July 2014, new home sales totaled 310, down from 340 new homes sold during the same period a year earlier. By comparison, from 2004 through 2007, the peak period for new home sales in the HMA, an average of 1,825 new homes sold annually. During the 12 months end-ing July 2014, new home sales prices increased 2 percent, to $367,600, com - pared with prices during the same period a year earlier.
The slight improvement in sales market conditions in the Hartford HMA can be partially attributed to the decrease in the rates of seriously delinquent mortgage loans, underwater mortgag-es, and distressed sales—that is, REO (Real Estate Owned) and short sales. As of July 2014, 5.8 percent of home loans in the HMA were 90 or more days delinquent, were in foreclosure, or transitioned into REO status, down from 6.8 percent a year earlier (Black Knight Financial Services, Inc.). By
comparison, as of July 2014, the percentage of seriously delinquent loans and REO properties was 6.5 percent for Connecticut, 5.6 percent for the New England region, and 4.8 percent for the United States. During June 2014, the percentage of under-water mortgages in the HMA was estimated at 9 percent, slightly down from 10 percent a year earlier and compared with a 10-percent statewide rate and an 11-percent national rate (CoreLogic, Inc.). Distressed sales comprised an estimated 17 percent of existing home sales in the HMA during the 12 months ending July 2014, down from 18 percent a year earlier and compared with a 19-percent state - wide rate and a 16-percent national rate.
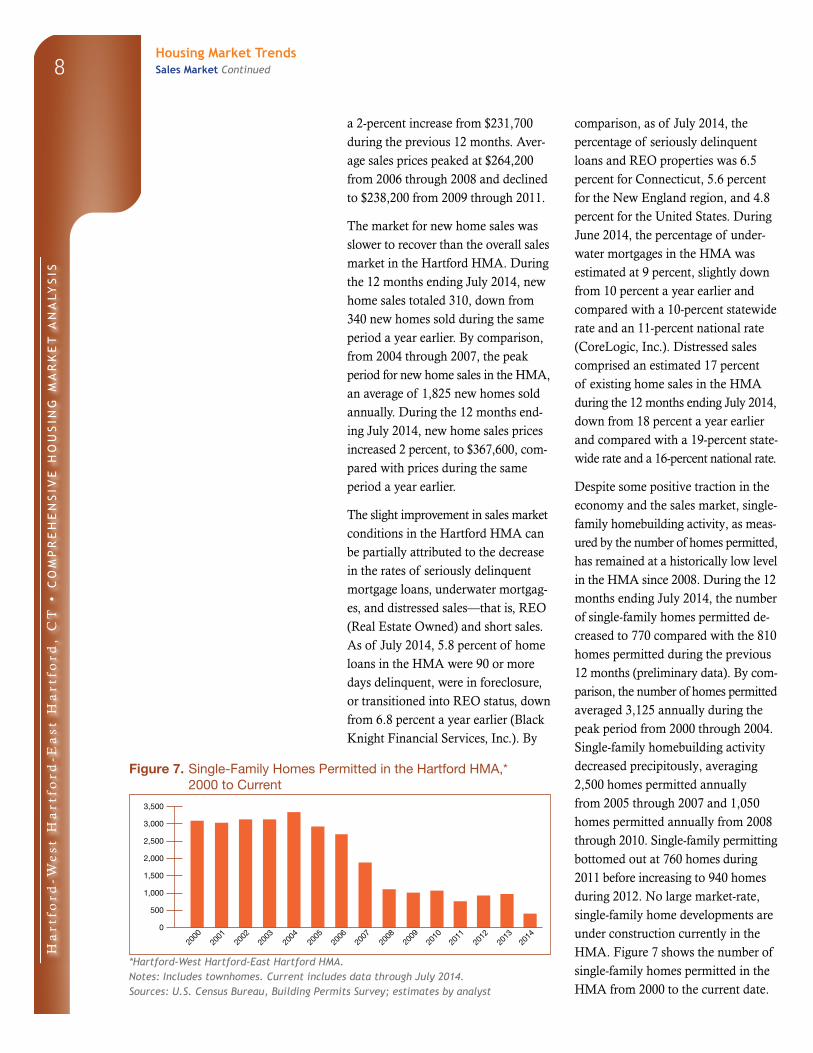
Despite some positive traction in the economy and the sales market, single- family homebuilding activity, as meas - ured by the number of homes permitted, has remained at a historically low level in the HMA since 2008. During the 12 months ending July 2014, the number of single-family homes permitted de - creased to 770 compared with the 810 homes permitted during the previous 12 months (preliminary data). By com - parison, the number of homes permitted averaged 3,125 annually during the peak period from 2000 through 2004. Single-family homebuilding activity decreased precipitously, averaging 2,500 homes permitted annually from 2005 through 2007 and 1,050 homes permitted annually from 2008 through 2010. Single-family permitting bottomed out at 760 homes during 2011 before increasing to 940 homes during 2012. No large market-rate, single-family home developments are under construction currently in the HMA. Figure 7 shows the number of single-family homes permitted in the HMA from 2000 to the current date.
Figure 7. Single-Family Homes Permitted in the Hartford HMA,* 2000 to Current
*Hartford-West Hartford-East Hartford HMA.Notes: Includes townhomes. Current includes data through July 2014.Sources: U.S. Census Bureau, Building Permits Survey; estimates by analyst
Housing Market TrendsSales Market Continued
2000
2001
2002
2003
2004
2005
2006
3,500
3,000
2,500
2,000
1,500
1,000
500
0
2008
2009
2010
2011
2013
2014
2012
2007

Ha
rtf
ord
-We
st
Ha
rtf
ord
-Ea
st
Ha
rtf
ord
, C
T •
CO
MP
RE
HE
NS
IVE
HO
US
ING
MA
RK
ET
AN
ALY
SIS
9
During the 3-year forecast period, de - mand is expected for 3,200 new homes (Table 1). The 500 homes currently under construction will meet part of the demand. Demand is estimated to be strongest during the third year of the forecast period and for single-family homes priced from $300,000 to $499,999 (Table 4). An estimated 17,900 other vacant units are currently in the inventory, a portion of which may reenter the sales market and satisfy some of the forecast demand.
Table 4. Estimated Demand for New Market-Rate Sales Hous-ing in the Hartford HMA* During the Forecast Period
Price Range ($) Units of Percent
From To Demand of Total
175,000 249,999 160 5.0250,000 299,999 320 10.0300,000 399,999 800 25.0400,000 499,999 800 25.0500,000 599,999 480 15.0600,000 799,999 320 10.0800,000 and higher 320 10.0
*Hartford-West Hartford-East Hartford HMA.Notes: The 500 homes currently under construction and a portion of the es-timated 17,900 other vacant units in the HMA will likely satisfy some of the forecast demand. The forecast period is August 1, 2014, to August 1, 2017.Source: Estimates by analyst
Rental MarketOverall rental housing market condi - tions in the Hartford HMA are slightly soft. As of August 1, 2014, the rental vacancy rate was 6.8 percent, down from 8.1 percent in April 2010 but up from 5.9 percent in April 2000, when rental markets were tight throughout most of New England (Figure 8). By contrast to the overall rental market conditions, the market for more tradi - tional apartments, or market-rate rental complexes consisting of 40 or more units, is tight. During the second quar - ter of 2014, the apartment vacancy rate in the HMA decreased to 2.5 percent from 2.8 percent during the same period a year earlier, and the rate is down from 4.7 percent in 2010 (Reis, Inc.). The significant difference between
vacancy rates for the overall rental market and for the apartment market stems from the above average propor-tion of rental units that are more than 50 years old. Nearly one-half of all renter-occupied units in the HMA were built before 1960 compared with a nationwide rate of 30 percent (2013 American Community Survey 1-year data). The older renter units are usually smaller multifamily units that tend to be lower quality housing options, and, in general, have higher vacancy rates than do more traditional apartment complexes.
The low apartment vacancy rate in the Hartford HMA during the second quarter of 2014, which can be attrib-uted partially to the limited number of completions since 2008, represents the lowest rate for the HMA in nearly 12 years and the fourth lowest rate in the nation among metropolitan areas covered by Reis, Inc. The apartment vacancy rate in the HMA was less than the 3.3-percent rate in the Northeast-ern United States and the nationwide rate of 4.1 percent. During the second quarter of 2014, the average monthly
Figure 8. Rental Vacancy Rates in the Hartford HMA,* 2000 to Current
*Hartford-West Hartford-East Hartford HMA.Note: The current date is August 1, 2014.Sources: 2000 and 2010—2000 Census and 2010 Census; current—estimates by analyst
Housing Market TrendsSales Market Continued
2000 Current2010
5.96.8
8.110.0
8.0
6.0
4.0
2.0
0.0

Ha
rtf
ord
-We
st
Ha
rtf
ord
-Ea
st
Ha
rtf
ord
, C
T •
CO
MP
RE
HE
NS
IVE
HO
US
ING
MA
RK
ET
AN
ALY
SIS
10
asking rent in the HMA increased 2 percent, to $1,056, compared with the average rent during the same period a year earlier (Reis, Inc.). For apart-ments built since 2009, the average rent was $1,649. The average monthly asking rents in the HMA for studio, one-bedroom, two-bedroom, and three-bedroom units were $733, $918, $1,170, and $1,496, respectively.
Apartment market conditions were tight in most areas in the Hartford HMA. During the second quarter of 2014, apartment vacancy rates in the seven Reis-defined market areas within the HMA ranged from 1.4 percent in the South Hartford and Northwest Hartford areas to 4.1 percent in the Tolland/Windham area. The North - west Hartford area recorded the most significant decline in the apartment vacancy rate, from 2.3 percent during the same period a year earlier. The Northwest Hartford and South Hart - ford areas also recorded the highest average asking rents, at $1,197 and $1,131, respectively. The City of Hart - ford area recorded the lowest average asking rent, at $884. Average asking rents increased in all seven areas, rang - ing from a 3-percent gain in the Tolland/ Windham area to a 1-percent increase
the East Hartford area, compared with the average asking rents during the second quarter of 2013.
Multifamily building activity, as meas - ured by the number of multifamily units permitted, increased significantly in the Hartford HMA during the past 2 years but remains well below the levels recorded during the peak period from 2005 through 2007 (Figure 9). During the 12 months ending July 2014, the number of multifamily units permitted increased to 960 compared with the 830 units permitted during the previous 12 months (preliminary data). By comparison, from 2005 through 2007, multifamily permitting activity averaged 1,650 units a year. Beginning in 2008, multifamily build - ing activity decreased precipitously each year until 2010, when 210 units were permitted. As economic condi - tions began to improve, permitting levels increased in each of the next 3 years, reaching 1,050 units permitted in 2013. The largest apartment devel-opment currently under construction in the HMA is the adaptive reuse of the former Bank of America building in the city of Hartford; the $80 mil-lion mixed-use development with 286 units, targeted for LEED (Leadership in Energy & Environmental Design) Platinum certification, is scheduled to open in phases from March 2015 through the end of the summer. Rents for the 225 market-rate units are ex-pected to range from $1,300 to $1,600 for studio units, from $1,700 to $2,000 for one-bedroom units, and from $2,000 to $2,300 for two-bedroom units (Hart - ford Courant).
During the 3-year forecast period, steady demand is expected for 2,200 new rental units in the Hartford HMA (Table 1). Demand is expected
Figure 9. Multifamily Units Permitted in the Hartford HMA,* 2000 to Current
*Hartford-West Hartford-East Hartford HMA.Notes: Excludes townhomes. Current includes data through July 2014.Sources: U.S. Census Bureau, Building Permits Survey; estimates by analyst
Housing Market TrendsRental Market Continued
2000
2001
2002
2003
2004
2005
2006
1,800
1,600
1,400
1,200
1,000
800
600
400
200
0
2008
2009
2010
2011
2013
2014
2012
2007

Ha
rtf
ord
-We
st
Ha
rtf
ord
-Ea
st
Ha
rtf
ord
, C
T •
CO
MP
RE
HE
NS
IVE
HO
US
ING
MA
RK
ET
AN
ALY
SIS
11
to be strongest for one-bedroom units with monthly rents ranging from $1,300 to $1,699 (Table 5). The 1,325
new rental units currently under construction will satisfy part of the demand.
Table 5. Estimated Demand for New Market-Rate Rental Housing in the Hartford HMA* During the Forecast Period
Zero Bedrooms One Bedroom Two Bedrooms Three or More Bedrooms
Monthly GrossRent ($)
Units of Demand
Monthly GrossRent ($)
Units of Demand
Monthly Gross Rent ($)
Units of Demand
Monthly Gross Rent ($)
Units of Demand
1,000 to 1,199 120 1,100 to 1,299 150 1,500 to 1,699 100 1,800 to 1,999 101,200 to 1,399 90 1,300 to 1,499 350 1,700 to 1,899 150 2,000 to 2,199 201,400 to 1,599 60 1,500 to 1,699 350 1,900 to 2,099 200 2,200 to 2,399 201,600 or more 30 1,700 to 1,899 150 2,100 to 2,299 150 2,400 to 2,599 25
1,900 to 2,099 50 2,300 to 2,499 50 2,600 or more 252,100 or more 50 2,500 or more 50
Total 300 Total 1,100 Total 700 Total 100
*Hartford-West Hartford-East Hartford HMA.Notes: Numbers may not add to totals because of rounding. The 1,325 units currently under construction will likely satisfy some of the estimated demand. The forecast period is August 1, 2014, to August 1, 2017.Source: Estimates by analyst
Data Profile
Table DP-1. Hartford HMA* Data Profile, 2000 to Current
Average Annual Change (%)
2000 2010 Current 2000 to 2010 2010 to Current
Total resident employment 575,630 593,163 589,100 0.3 – 0.2
Unemployment rate 2.3% 9.3% 7.1%
Nonfarm payroll jobs 556,700 533,200 551,100 – 0.4 0.9
Total population 1,148,618 1,212,381 1,216,000 0.5 0.1
Total households 445,870 472,533 475,700 0.6 0.2
Owner households 295,809 320,902 322,500 0.8 0.1
Percent owner 66.3% 67.9% 67.8%
Renter households 150,061 151,631 153,200 0.1 0.2
Percent renter 33.7% 32.1% 32.2%
Total housing units 471,877 507,049 509,600 0.7 0.1
Owner vacancy rate 0.9% 1.3% 1.4%
Rental vacancy rate 5.9% 8.1% 6.8%
Median Family Income $59,600 $81,550 $83,805 3.2 0.7
*Hartford-West Hartford-East Hartford HMA.Notes: Numbers may not add to totals because of rounding. Employment data represent annual averages for 2000, 2010, and the 12 months through July 2014. Median Family Incomes are for 1999, 2009, and 2013. The current date is August 1, 2014.Sources: U.S. Census Bureau; U.S. Department of Housing and Urban Development; estimates by analyst
Housing Market TrendsRental Market Continued

Ha
rtf
ord
-We
st
Ha
rtf
ord
-Ea
st
Ha
rtf
ord
, C
T •
CO
MP
RE
HE
NS
IVE
HO
US
ING
MA
RK
ET
AN
ALY
SIS
12
Data Definitions and Sources
2000: 4/1/2000—U.S. Decennial Census
2010: 4/1/2010—U.S. Decennial Census
Current date: 8/1/2014—Analyst’s estimates
Forecast period: 8/1/2014–8/1/2017—Analyst’s
estimates
The metropolitan statistical area and New
England city and town area definitions in this
report are based on the delineations established
by the Office of Management and Budget (OMB)
in the OMB Bulletin dated December 1, 2009,
and do not reflect changes defined by the OMB
Bulletin dated February 28, 2013.
Demand: The demand estimates in the analysis
are not a forecast of building activity. They are
the estimates of the total housing production
needed to achieve a balanced market at the end
of the 3-year forecast period given conditions on
the as-of date of the analysis, growth, losses, and
excess vacancies. The estimates do not account
for units currently under construction or units in
the development pipeline.
Other Vacant Units: In the U.S. Department of
Housing and Urban Development’s (HUD’s)
analysis, other vacant units include all vacant
units that are not available for sale or for rent.
The term therefore includes units rented or sold
but not occupied; held for seasonal, recreational,
or occasional use; used by migrant workers; and
the category specified as “other” vacant by the
Census Bureau.
Building Permits: Building permits do not neces-
sarily reflect all residential building activity that
occurs in an HMA. Some units are constructed
or created without a building permit or are issued
a different type of building permit. For example,
some units classified as commercial structures are
not reflected in the residential building permits. As a
result, the analyst, through diligent fieldwork, makes an
estimate of this additional construction activity. Some of
these estimates are included in the discussions of single-
family and multifamily building permits.
For additional data pertaining to the housing market
for this HMA, go to http://www.huduser.org/
publications/pdf/CMARtables_Hartford-WestHartford-
EastHartfordCT_15.pdf.
Contact Information
Michael J. Murphy, Economist
Boston HUD Regional Office
617–994–8279
This analysis has been prepared for the assistance and
guidance of HUD in its operations. The factual informa-
tion, findings, and conclusions may also be useful to
builders, mortgagees, and others concerned with local
housing market conditions and trends. The analysis
does not purport to make determinations regarding the
acceptability of any mortgage insurance proposals that
may be under consideration by the Department.
The factual framework for this analysis follows the
guidelines and methods developed by HUD’s Economic
and Market Analysis Division. The analysis and findings
are as thorough and current as possible based on informa -
tion available on the as-of date from local and national
sources. As such, findings or conclusions may be modi-
fied by subsequent developments. HUD expresses its
appreciation to those industry sources and state and local
government officials who provided data and information
on local economic and housing market conditions.
For additional reports on other market areas, please go to www.huduser.org/portal/ushmc/chma_archive.html.