
120108145113_p3_1
16
16 th AFA Int’l Fertilizers Forum & Exhibition February 2 - 4, 2010 Cairo Semiramis Intercontinental Hotel, Egypt Outlook for World Fertilizer Demand, Supply and Supply/Demand Balances Mr. Patrick Heffer Director IFA Agriculture Service France
-
Upload
afa-association -
Category
Documents
-
view
212 -
download
0
description
http://www.afa.com.eg/uploads/papers/2010/files/120108145113_p3_1.pdf
Transcript of 120108145113_p3_1
16th AFA Int’l Fertilizers Forum & Exhibition
February 2 - 4, 2010
Cairo Semiramis Intercontinental Hotel, Egypt
Outlook for World Fertilizer Demand, Supply and Supply/Demand Balances
Mr. Patrick Heffer Director
IFA Agriculture Service
France

1/24/2010
1
OUTLOOK FOR WORLD OUTLOOK FOR WORLD FERTILIZER DEMAND, SUPPLY FERTILIZER DEMAND, SUPPLY AND SUPPLY/DEMAND AND SUPPLY/DEMAND BALANCESBALANCES
Patrick Patrick Heffer and Michel Prud’hommeHeffer and Michel Prud’hommeIFAIFA
16th AFA Int’l Annual Fertilizers Forum & Exhibition2-4 February 2010, Cairo, Egypt
ECONOMIC CONTEXTECONOMIC CONTEXT
1/24/2010
2
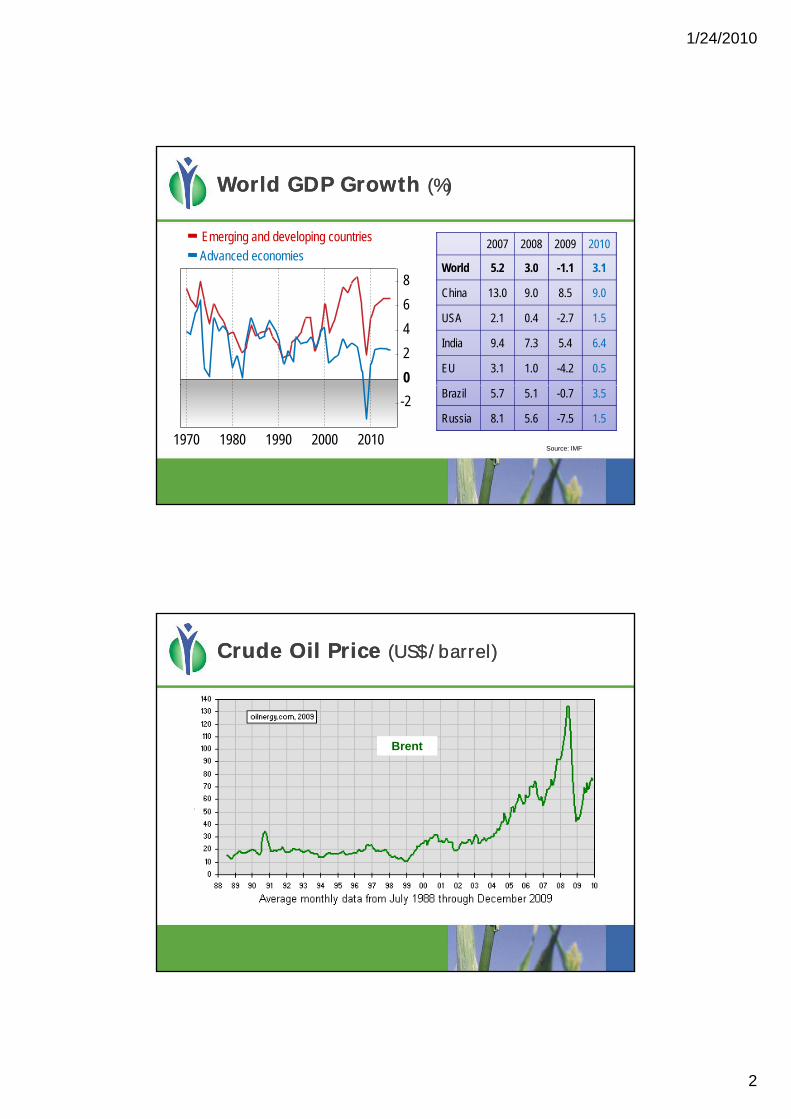
World GDP Growth World GDP Growth (%)(%)
2007 2008 2009 2010
World 5 2 3 0 1 1 3 1
Emerging and developing countries
Advanced economiesWorld 5.2 3.0 -1.1 3.1
China 13.0 9.0 8.5 9.0
USA 2.1 0.4 -2.7 1.5
India 9.4 7.3 5.4 6.4
EU 3.1 1.0 -4.2 0.5
8
6
4
2
0
Source: IMF
Brazil 5.7 5.1 -0.7 3.5
Russia 8.1 5.6 -7.5 1.5
1970 1980 1990 2000 2010
-2
Crude Oil Price Crude Oil Price (US$/barrel)(US$/barrel)
Brent
1/24/2010
3
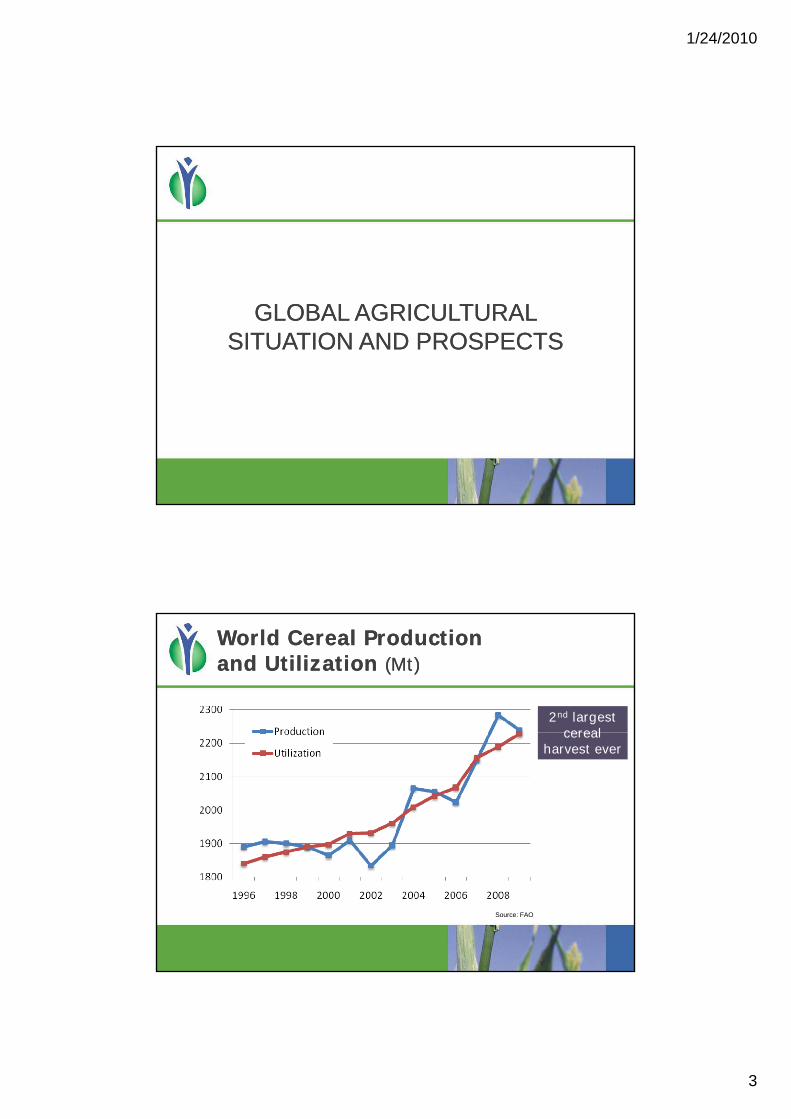
GLOBAL AGRICULTURAL GLOBAL AGRICULTURAL SITUATION AND PROSPECTSSITUATION AND PROSPECTS
World Cereal ProductionWorld Cereal Productionand Utilization and Utilization (Mt)(Mt)
2nd largest cerealcereal
harvest ever
Source: FAO
1/24/2010
4
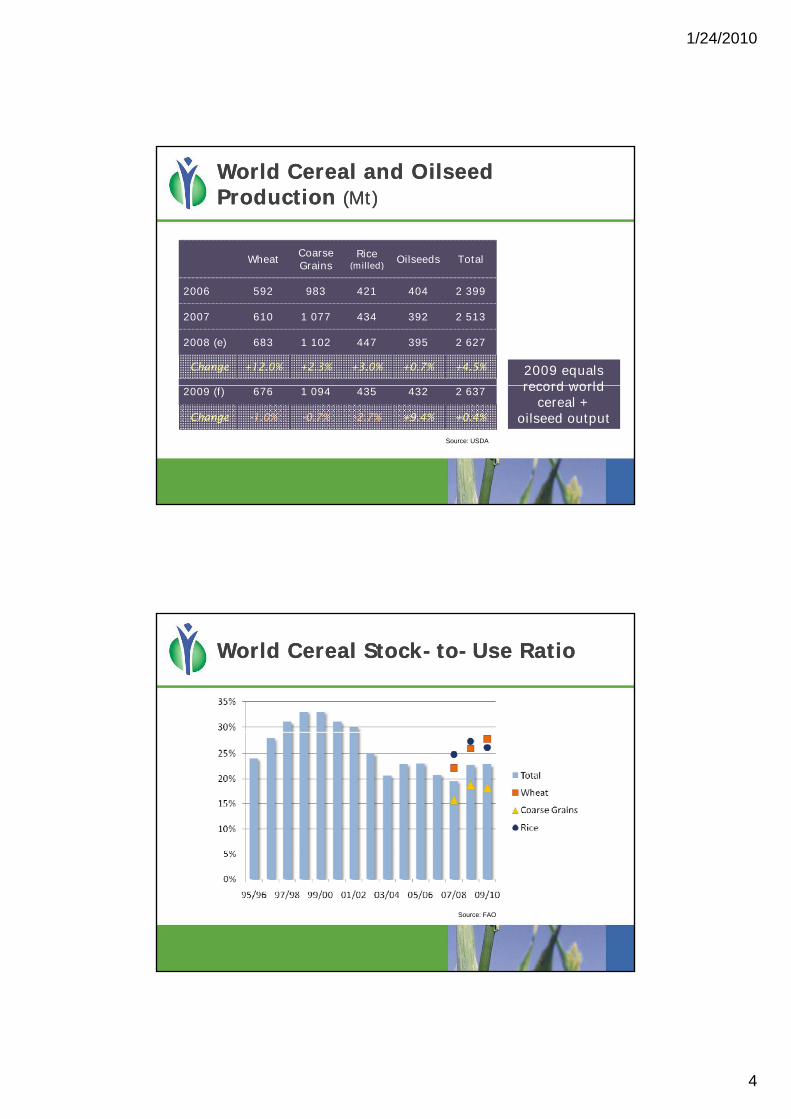
World Cereal and Oilseed World Cereal and Oilseed Production Production (Mt)(Mt)
WheatCoarseGrains
Rice(milled)
Oilseeds TotalGrains (milled)
2006 592 983 421 404 2 399
2007 610 1 077 434 392 2 513
2008 (e) 683 1 102 447 395 2 627
Change +12.0% +2.3% +3.0% +0.7% +4.5% 2009 equals record world2009 (f) 676 1 094 435 432 2 637
Change -1.0% -0.7% -2.7% +9.4% +0.4%
Source: USDA
record world cereal +
oilseed output of 2008
World Cereal StockWorld Cereal Stock--toto--Use RatioUse Ratio
Source: FAO
1/24/2010
5
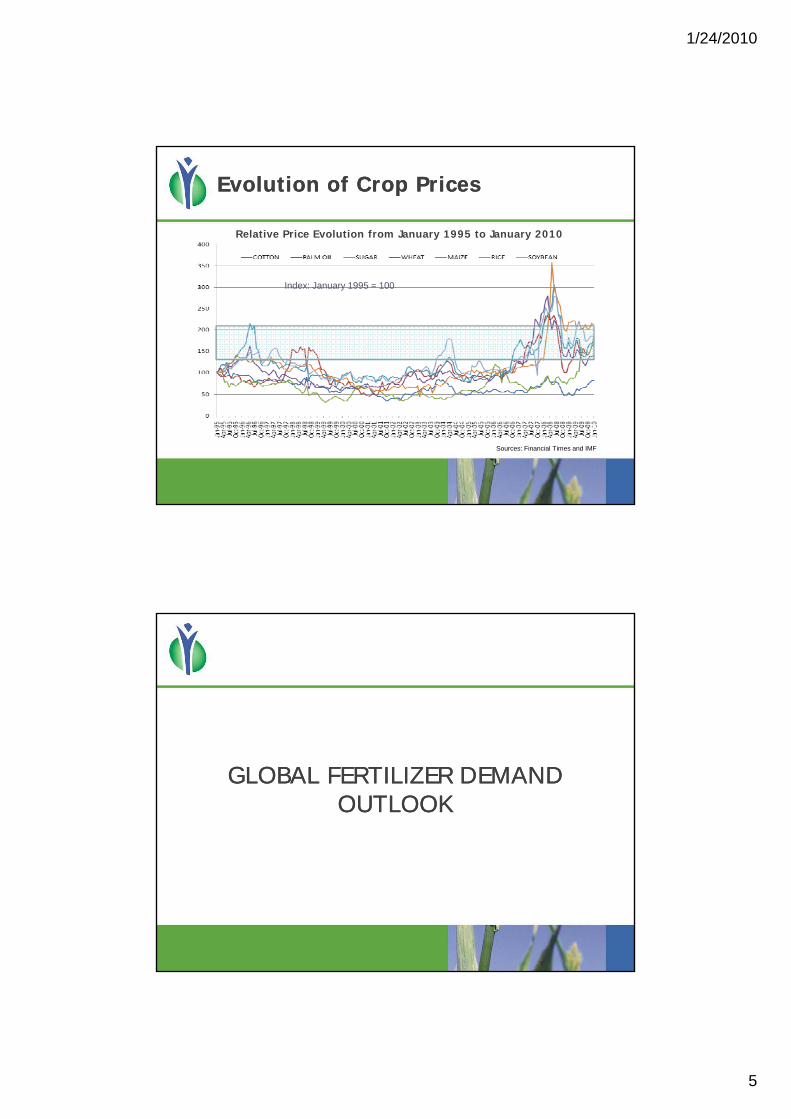
Evolution of Crop PricesEvolution of Crop Prices
Relative Price Evolution from January 1995 to January 2010
Index: January 1995 = 100
Sources: Financial Times and IMF
GLOBAL FERTILIZER DEMAND GLOBAL FERTILIZER DEMAND OUTLOOKOUTLOOK
1/24/2010
6
160
180K2O
P2O5
2007/08
2008/09 (e)
Change2009/10 (f)
Change2010/11 (f)
Change
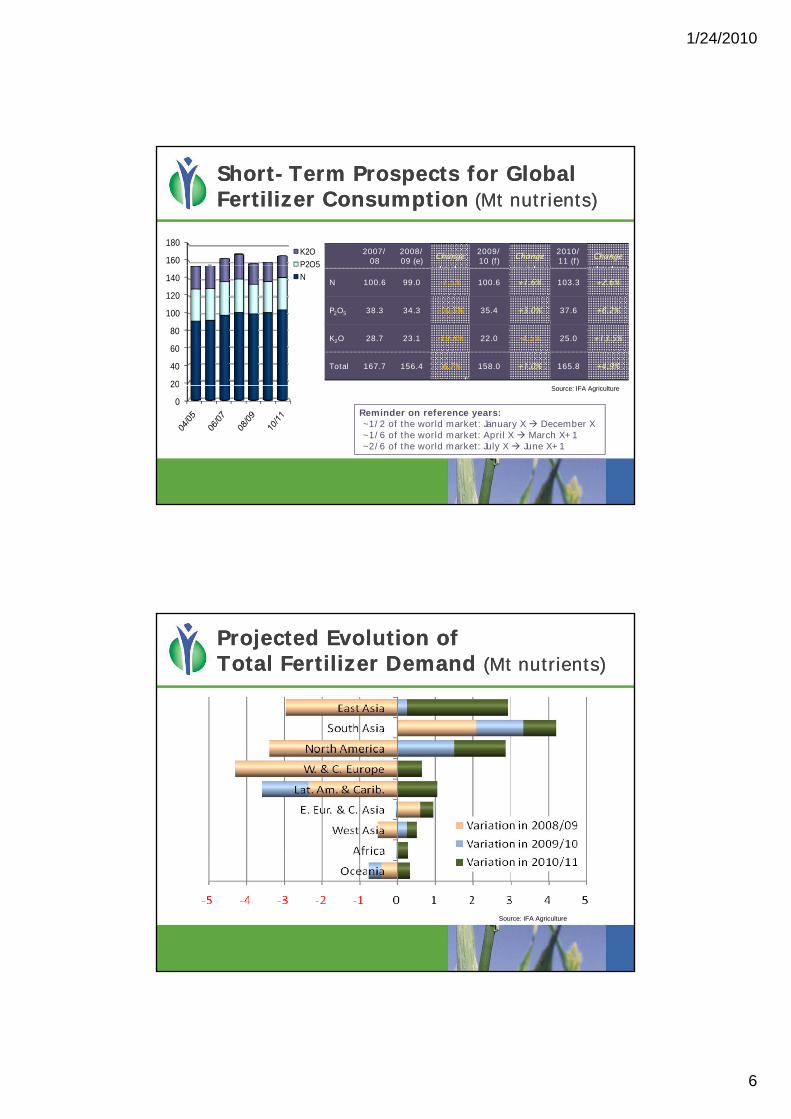
ShortShort--Term Prospects for Global Term Prospects for Global Fertilizer Fertilizer ConsumptionConsumption ((Mt nutrients)Mt nutrients)
20
40
60
80
100
120
140
P2O5
NN 100.6 99.0 -1.5% 100.6 +1.6% 103.3 +2.6%
P2O5 38.3 34.3 -10.5% 35.4 +3.0% 37.6 +6.2%
K2O 28.7 23.1 -19.8% 22.0 -4.5% 25.0 +13.5%
Total 167.7 156.4 -6.7% 158.0 +1.0% 165.8 +4.9%
0
20 Source: IFA Agriculture
Reminder on reference years:~1/2 of the world market: January X December X~1/6 of the world market: April X March X+1~2/6 of the world market: July X June X+1
Projected Evolution of Projected Evolution of Total Fertilizer Demand Total Fertilizer Demand (Mt nutrients)(Mt nutrients)
Source: IFA Agriculture
1/24/2010
7
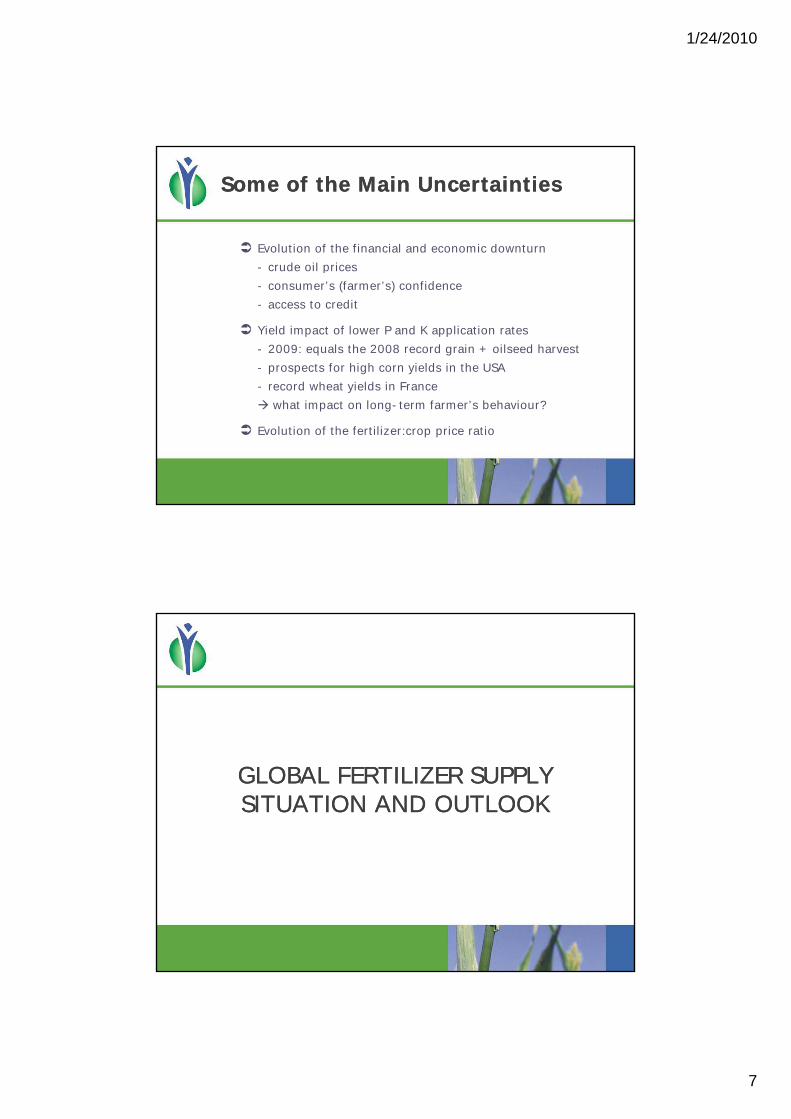
Some of the Main UncertaintiesSome of the Main Uncertainties
Evolution of the financial and economic downturn
crude oil prices- crude oil prices
- consumer’s (farmer’s) confidence
- access to credit
Yield impact of lower P and K application rates
- 2009: equals the 2008 record grain + oilseed harvest
- prospects for high corn yields in the USA
record wheat yields in France- record wheat yields in France
what impact on long-term farmer’s behaviour?
Evolution of the fertilizer:crop price ratio
GLOBAL FERTILIZER SUPPLY GLOBAL FERTILIZER SUPPLY SITUATION AND OUTLOOKSITUATION AND OUTLOOK
1/24/2010
8
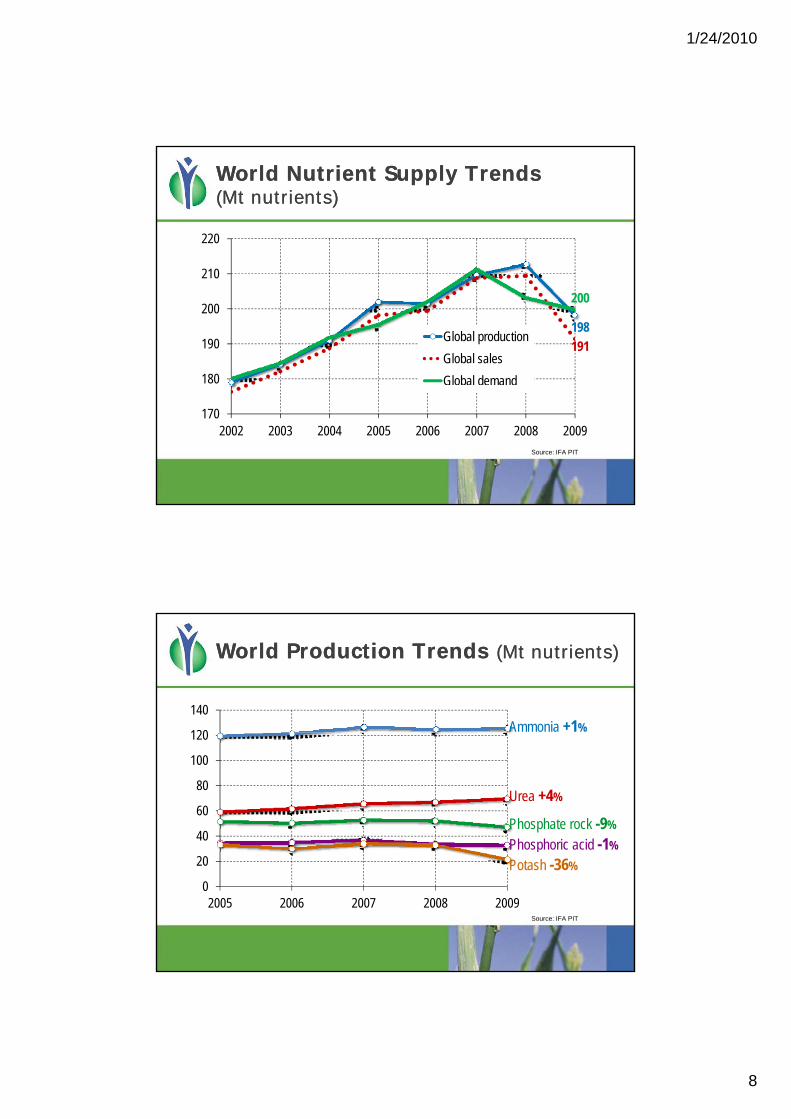
World Nutrient Supply Trends World Nutrient Supply Trends (Mt nutrients)(Mt nutrients)
220
198
191
200
180
190
200
210
Global production
Global sales
Global demand
Global Supply and Demand Outlook for Fertilizers and Raw Materials / Intermediates
1702002 2003 2004 2005 2006 2007 2008 2009
| Source:IFA PIT Committee
Source: IFA PIT
World Production Trends World Production Trends (Mt nutrients)(Mt nutrients)
120
140Ammonia +1%
40
60
80
100
120
Urea +4%
Phosphate rock -9%
Phosphoric acid -1%
Global Supply and Demand Outlook for Fertilizers and Raw Materials / Intermediates
0
20
2005 2006 2007 2008 2009
pPotash -36%
| Source:IFA PIT Committee
Source: IFA PIT

1/24/2010
9
World Operating RatesWorld Operating Rates
Rates in %: production over operating capacity
100%
AmmoniaUrea
PotashPhosphoric Acid
50
60%
70%
80%
90%
Global Supply and Demand Outlook for Fertilizers and Raw Materials / Intermediates
1995 97 99 01 03 05 07 2009 1995 97 99 01 03 05 07 2009
40%
50%
| Source:IFA PIT Committee
Source: IFA PIT
35
40
Exports of Main CommoditiesExports of Main Commodities(Mt nutrients)(Mt nutrients)
Urea
10
15
20
25
30
Urea
Phosphate rockAmmonia
Potash
Sulphur
Global Supply and Demand Outlook for Fertilizers and Raw Materials / Intermediates
0
5
2005 2006 2007 2008 2009
DAPPhosphoric acid
| Source:IFA PIT Committee
Source: IFA PIT
1/24/2010
10
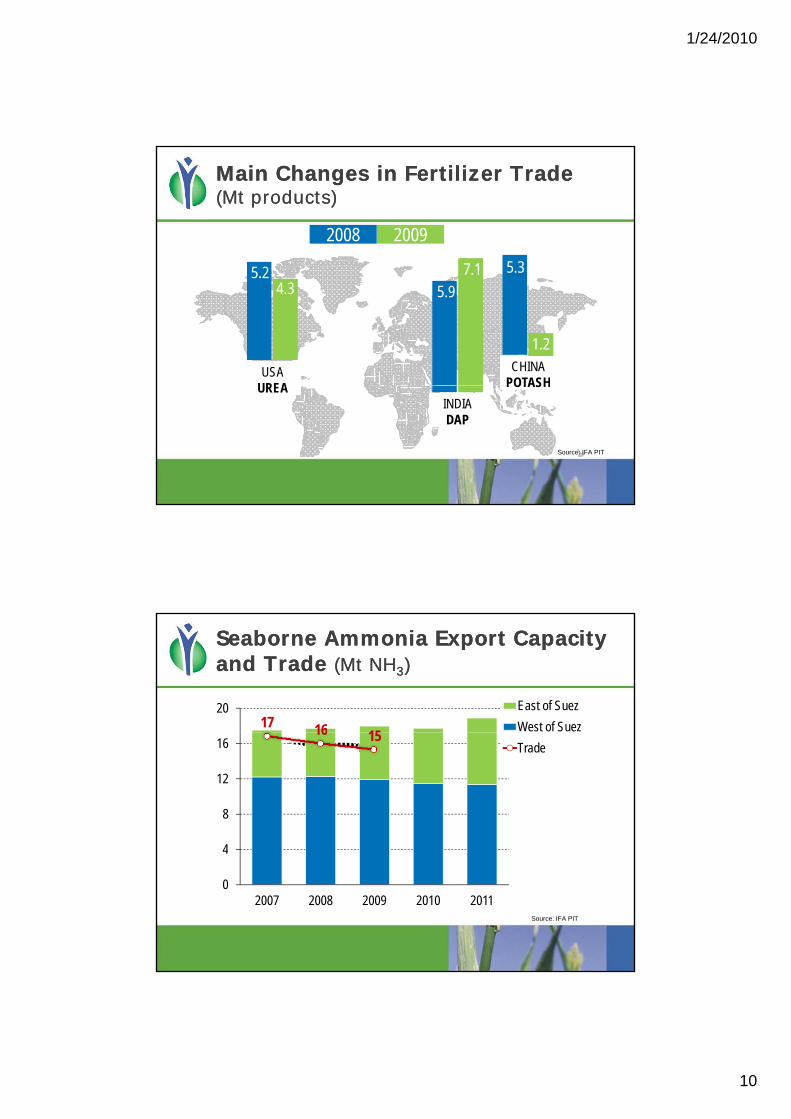
Main Changes in Fertilizer TradeMain Changes in Fertilizer Trade(Mt products)(Mt products)
7 1
2008 2009
5 3
5.97.15.2
4.3
CHINAPOTASH
USAUREA
5.3
1.2
Global Supply and Demand Outlook for Fertilizers and Raw Materials / Intermediates
POTASH
INDIADAP
UREA
| Source:IFA PIT Committee
Source: IFA PIT
Seaborne Ammonia Export Capacity Seaborne Ammonia Export Capacity and Trade and Trade (Mt NH(Mt NH33))
17 16 15
20 East of Suez
West of Suez16 15
4
8
12
16 Trade
Global Supply and Demand Outlook for Fertilizers and Raw Materials / Intermediates
0
4
2007 2008 2009 2010 2011
| Source:IFA PIT Committee
Source: IFA PIT
1/24/2010
11
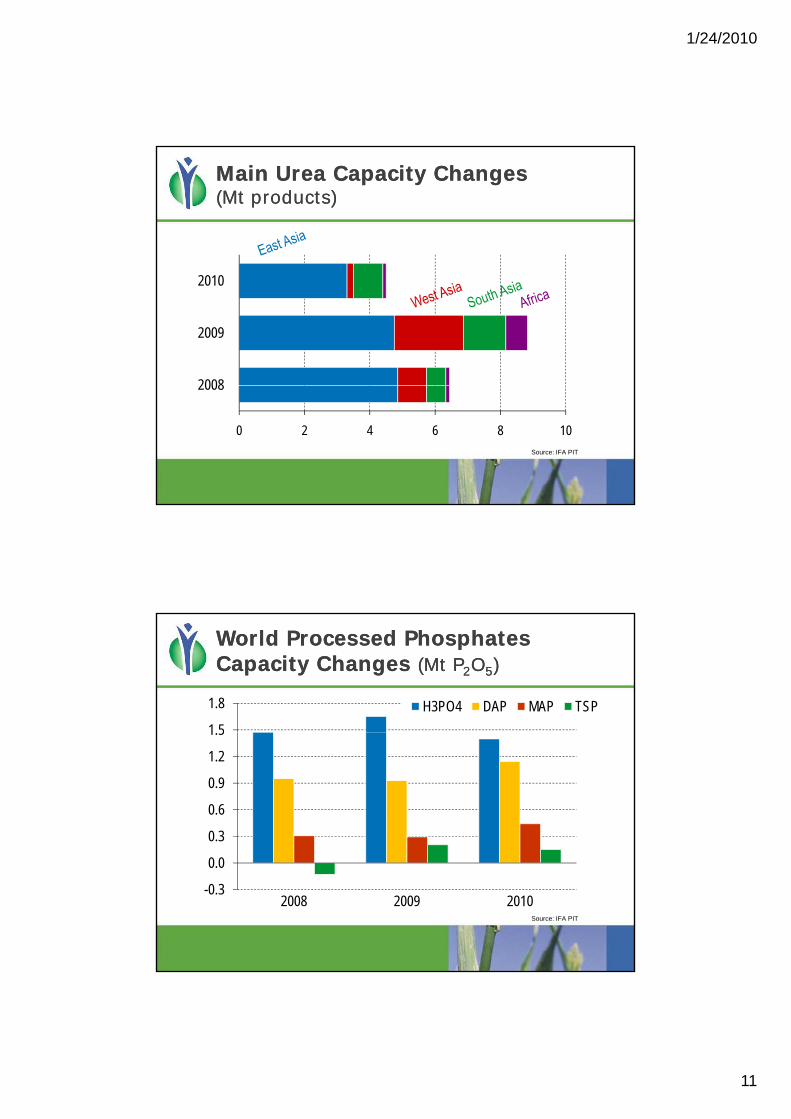
Main Urea Capacity Changes Main Urea Capacity Changes (Mt products)(Mt products)
2008
2009
2010
Global Supply and Demand Outlook for Fertilizers and Raw Materials / Intermediates
0 2 4 6 8 10
2008
| Source:IFA PIT Committee
Source: IFA PIT
World Processed Phosphates World Processed Phosphates Capacity Changes Capacity Changes (Mt P(Mt P22OO55))
1 5
1.8 H3PO4 DAP MAP TSP
0.3
0.6
0.9
1.2
1.5
Global Supply and Demand Outlook for Fertilizers and Raw Materials / Intermediates
-0.3
0.0
2008 2009 2010
| Source:IFA PIT Committee
Source: IFA PIT

1/24/2010
12
Main Potash Capacity Changes Main Potash Capacity Changes (Mt K(Mt K22O)O)
2008
2009
2010
Global Supply and Demand Outlook for Fertilizers and Raw Materials / Intermediates
0.0 0.2 0.4 0.6 0.8 1.0 1.2 1.4 1.6
2008
| Source:IFA PIT Committee
Source: IFA PIT
World Sulphur Supply/Demand World Sulphur Supply/Demand Balance Balance (Mt S)(Mt S)
48 49 4955
Supply Demand
48 49 49
50 45 45 48
2007 2008 2009 2010
Global Supply and Demand Outlook for Fertilizers and Raw Materials / Intermediates
-1.6
3.3 4.8 6.7
Balance
| Source:IFA PIT Committee
Source: IFA PIT

1/24/2010
13
World Nutrient Supply/Demand World Nutrient Supply/Demand BalancesBalances
128133 137
129152
159165
157
Mt ureaMt N
Supply Demand
125 123129
2008 2009 2010
146 149157
2008 2009 2010
36 38 39 38 39 41 Mt K2OMt P2O5
Global Supply and Demand Outlook for Fertilizers and Raw Materials / Intermediates
28 25 28
2008 2009 2010
33 33 35
2008 2009 2010
| Source:IFA Ag Committee
Source: IFA PIT
220
World Nutrient Supply Trends World Nutrient Supply Trends (Mt nutrients)(Mt nutrients)
205
190
200
210
Global productionGlobal sales
Global Supply and Demand Outlook for Fertilizers and Raw Materials / Intermediates
1802004 2005 2006 2007 2008 2009 2010
Global demand
| Source:IFA PIT Committee
Source: IFA PIT
1/24/2010
14
Prospects for Prospects for 20102010
A recovery in demand and stronger sales prospects
Current S/D balances: potentially, high surpluses prevailing in 2009 and through 2010
Limited new capacity outside China and on-going structural changes
Rising volatility of agricultural commodity and energy prices
Improving market conditions in 2010
Increases in production and operating rates
Higher domestic sales and exports
Global Supply and Demand Outlook for Fertilizers and Raw Materials / Intermediates
- A rebound in import demand in Latin America, North America and South-East Asia
- Sustained imports in South Asia - Potential improvement in Europe and Oceania- Uncertainties as regards China
ConclusionConclusion
Projections for 2010/11 are very speculative
Provided the world economic activity recovers, and the agricultural market fundamentals remain positive, global fertilizer demand in 2010/11 could regain positive growth rates
Global Supply and Demand Outlook for Fertilizers and Raw Materials / Intermediates
positive growth rates

1/24/2010
15
For questions/comments:For questions/comments:on the demand side: on the demand side: [email protected]@fertilizer.org
th l id th l id on the supply side: on the supply side: [email protected]@fertilizer.org


