116th Comprehensive Annual Financial Report
113
Transcript of 116th Comprehensive Annual Financial Report


Introduction 1
Public School Teachers’ Pension and Retirement Fund of Chicago
116th Comprehensive Annual Financial ReportFor the year ended June 30, 2011
Chicago, Illinois
Report prepared by the staff of the Public School Teachers’ Pension and Retirement Fund of Chicago

Introduction 2
Ta b l e o f C o n t e n t s

Introduction 3
INTRODUCTORY SECTION (UNAUDITED) PAGE 46 Board of Trustees
7 Consultants
9 Organizational Chart
10 Letter of Transmittal
FINANCIAL SECTION PAGE 1820 Independent Auditors’ Report
21 Management’s Discussion and Analysis (Unaudited)
Basic Financial Statements
28 Statement of Plan Net Assets
29 Statement of Changes in Plan Net Assets
30 Notes to Financial Statements
Required Supplementary Information
45 Schedule of Funding Progress (Unaudited)
46 Schedule of Contributions (Unaudited)
Other Supplementary Information
47 Administrative and Miscellaneous Expenses
48 Schedule of Cash Receipts and Disbursements
49 Schedule of Manager Fees
51 Schedule of Consultant Payments
INVESTMENT SECTION (UNAUDITED) PAGE 5254 Master Custodian Report
55 Investment Consultant Report
56 Total Annual Fund Rate of Return
57 Schedule of Investment Results
58 Investment Portfolio Summary
59 Asset Allocation Summary
60 Historical Asset Allocation
61 Domestic Equity Summary
62 International Equity Summary
64 Fixed Income Summary
65 Public REITs Summary
66 Private Equity Summary
67 Infrastructure Summary
67 Hedge Fund Summary
68 Real Estate Summary
69 Manager Analysis
71 Broker Commission Reports
75 Investment Authority
ACTUARIAL SECTION (UNAUDITED) PAGE 7678 Actuarial Certification
79 Actuarial Report — Pension Fund
86 Actuarial Report — Health Insurance
91 Summary of Actuarial Liability and Unfunded
Actuarial Liability
92 Solvency Test
93 Schedule of Actual Employer Contributions and
Actuarially Determined Contribution Requirements
for Pension and Health Insurance
94 Schedule of Active Member
Valuation Data Pension Fund
94 Schedule of Retirees and Beneficiaries Added
to and Removed from Rolls Pension Fund
95 Summary of Actuarial Assumptions and
Actuarial Cost Method
98 Summary of Principal Provisions
101 Glossary of Terms Used in Report
STATISTICAL SECTION (UNAUDITED) PAGE 102104 Statement of Changes in Plan Net Assets
Pension Fund
106 Statement of Changes in Plan Net Assets
Health Insurance Fund
108 Distribution of Current Annuitants by Benefit Type
109 Distribution of Pensioners with Health Insurance
Reimbursements by Size of Annuity
110 Schedule of Average Benefit Payments
111 Number of Active Members

Introduction 4

Introduction 55 Introduction
I n t r o d u c t i o nThis section provides information regarding the Chicago Teachers’
Pension Fund Board of Trustees and its consultants, an organizational
chart, a Letter of Transmittal, and additional administrative information.

Introduction 6 Introduction 6
OFFICERS
President, John F. O’Brill
Vice President, Maria J. Rodriguez
Financial Secretary, Walter E. Pilditch
Recording Secretary, Mary Sharon Reilly
MEMBERSRepresenting the ContributorsLois W. Ashford
Jeffery Blackwell
Jeanne Marie Freed
John F. O’Brill
Jay C. Rehak
Maria J. Rodriguez
Representing the AnnuitantsWalter E. Pilditch
Mary Sharon Reilly
James F. Ward
Representing the Administrators/Principals
Chris N. Kotis
Representing the Board of EducationAlberto A. Carrero, Jr.
Peggy A. Davis
Executive Director,
Kevin B. Huber
Chief Financial and Legal Officer,
Patricia A. Hambrick
Board of TrusteesAs of June 30, 2011
Executive Staff
John F. O’Brill
Jay C. Rehak
Alberto A. Carrero, Jr.
Maria J. Rodriguez Mary Sharon Reilly
James F. Ward
Peggy A. Davis
Walter E. Pilditch
Chris N. Kotis
Lois W. Ashford Jeffery Blackwell
Jeanne Marie Freed

7 Introduction
LEGAL COUNSELJoseph BurnsJacobs, Burns, Orlove, and Hernandez122 South Michigan Avenue, suite 1720Chicago, Illinois 60603-6145
INVESTMENT CONSULTANTSGwelda Swilley-Burke and Matthew ShirillaCallan Associates Inc.120 North LaSalle Street, suite 2100Chicago, Illinois 60602
Robert KochisThe Townsend GroupSkylight Office Tower1660 West Second Street, suite 450Cleveland, Ohio 44113
HEALTH INSURANCE CONSULTANTPaul HillingAon Hewitt200 East Randolph, suite 900Chicago, IL 60601
BANK CUSTODIANKathryn M. StevensonThe Northern Trust Company50 South LaSalle StreetChicago, Illinois 60675
AUDITORSKurt A. GabouerPartnerKPMG LLP303 East Wacker DriveChicago, Illinois 60601
CUSTODIANStephanie D. NeelyCity Treasurer121 North LaSalle StreetChicago, Illinois 60602
CONSULTING ACTUARYSandor GoldsteinGoldstein & Associates29 South LaSalle Street, suite 735Chicago, Illinois 60603
ConsultantsAs of June 30, 2011

8 Introduction
INVESTMENT ADVISORSAdams Street Partners, LLC Adelante Capital Management, LLCAriel Capital Management, LLCAttucks Asset ManagementBlackstone GroupCapri Capital Partners, LLCCB Richard Ellis Investors, LLCChanning Capital Management, LLCCredo Capital Management, LLCDimensional Fund AdvisorsDV Realty Advisors, LLCEarnest Partners, LLCEuropa Capital Partners, LLPFortress Investment GroupFranklin Templeton Real Estate Advisors, LLCFremont Realty Capital, LPGarcia, Hamilton & Associates, LPHarbourVest Partners, LLCHarris Investment Management, Inc.Hispania Capital PartnersHolland Capital Management, LPHudson Realty Capital, LLCICV Capital Partners, LLCIntercontinental Real Estate Corp.J.P. Morgan Fleming Asset ManagementK2 Advisors, LLCLazard Asset Management, LLCLaSalle Investment Management, Inc.Leading Edge Investment AdvisorsLM Capital Group, LLC
Lombardia Capital Partners, LLCMacquarie Infrastructure Partners, Inc.Merrill Lynch Asian Real Estate Fund, LPMesirow Financial, Inc.MFS Institutional Advisors, Inc.Morgan Stanley Investment ManagementMuller and Monroe Asset Management, LLCNew Amsterdam Partners, LLCNorthern Trust Global InvestmentsOlympus Real Estate Partners, LLCPalladium Equity Partners, LLCPantheon Ventures, Inc.Pharos Capital Group, LLCPiedmont Investment Advisors, LLCPluscios Management, LLCProgress Investment Management, LLCPrudential Investment Management, Inc.Pugh Capital Management, Inc.RhumbLine AdvisersRREEF America, LLCSyncom Partners, LLCTaplin, Canida and Habacht, Inc.UBS Global Asset ManagementUrban America, LPUrdang Investment Management, Inc.Waddell & Reed Asset Management GroupWalton Street Capital, LLCWestern Asset Management Co.William Blair & Company, LLCZevenbergen Capital Investments, LLC
ConsultantsAs of June 30, 2011

Introduction 99
Board of Trustees
Frances Radencic Director, Member
and Office Services
Sheron Banks-Fallis
Member Services Manager
Sandra Shelby Controller
Eric Morel Information Technology
Manager
Patricia A. Hambrick Chief Financial and
Legal Officer
Kevin B. Huber Executive Director
Organizational ChartAs of June 30, 2011
Edgar Samayoa Benefits
Supervisor – Pensions
Denise Valentovich
Benefits Supervisor – Claims and
Billing
Mary Cavallaro Health
Benefits Manager
Robert Jurinek
Internal Auditor
Carmen Heredia-Lopez
Director of Investments

10 Introduction
Letter of transmittaL
December 28, 2011
The Pension Board of Trustees and Fund Members
Public School Teachers’ Pension and Retirement Fund of Chicago
203 North LaSalle Street, suite 2600
Chicago, Illinois 60601
Dear Pension Board of Trustees, Contributors, Pensioners, and Members of the Public:
This is the 116th Comprehensive Annual Report of the Public School Teachers’ Pension and
Retirement Fund of Chicago (Fund) that covers the fiscal year ended June 30, 2011. Illinois
statutes provide for a Board of Trustees to be responsible for the administration of the Fund. An
important aspect of the administration is the presentation of a detailed annual report of system
finances and operations. This publication is intended for all parties-at-interest as well as for the
public at large.
The financial statements and their content are the responsibility of the Fund’s management. This
report provides a review of the financial, actuarial, and operational conditions of the Fund. It
contains financial statements with some comparative data, which were subject to an independent
audit conducted by Illinois licensed certified public accountants, an actuarial valuation prepared
by the Fund’s consulting actuary, a description of benefits as specified in Illinois law, and other
relevant information.
The Fund is a public employee retirement system established by the State of Illinois to provide
annuity, disability, survivor, death, and health benefits for certain certified teachers and other
employees of the Chicago Public Schools and approved City of Chicago charter schools. It is
administered in accordance with Chapter 40, Act 5, Articles 1, 17, and 20 of the Illinois
Compiled Statutes.
overview
The Fund’s membership decreased to just under 60,000 members as of June 30, 2011.
The 116th year of continuous operations ended with the Fund’s operational condition reflecting
an improvement over the prior year. The Fund’s financial condition was positively impacted by the
rebound in the financial markets during the year. The June 30, 2011, value of net assets held in
trust for pension and health benefits amounted to $10.3 billion, a 15.2% increase from the $9.0
billion of the previous year.
203 North LaSalle Street, suite 2600Chicago, IL 60601-1231

Introduction 11
The actuarial value of assets of the Pension Fund, calculated on a 4-year smoothed market value
basis and used in the determination of the funding ratio, amounted to $10.1 billion. A comparison
of the actuarial value of assets to the actuarial accrued liabilities of $16.9 billion, yields a 59.7%
actuarial funding ratio, a 10.8% decrease from the prior year funding ratio of 66.9%.
The actuarial value of assets of the Health Insurance Fund amounted to $31.3 million. A
comparison of the actuarial value of assets to the actuarial accrued liabilities of $3.1 billion
yields a 1.0% actuarial funding ratio, a 17.0% decrease from the prior year funding ratio of 1.2%.
The Financial Statements in this report were prepared in accordance with generally accepted
accounting principles as promulgated by the Governmental Accounting Standards Board. The
specific accounting treatment of transactions is described in the Summary of Accounting Policies
in the Notes to the Financial Statements. We encourage readers to consider additional financial
information in this introductory section, and in the overview and analysis sections of
management’s discussion and analysis of the financial report.
investment authority and Performance
The Trustees’ investment authority is found in the Illinois Compiled Statutes, Chapter 40,
Act 5, Articles 1 and 17. A discussion of the specific investment authority, policy provisions,
diversification posture, performance objective and asset allocation is provided in the Investments
Section of this report.
As of June 30, 2011, investments at fair value plus cash totaled $10,456,912,118. This reflects a
16.8% increase from the $8,949,590,783 value of June 30, 2010. The Fund’s investment
performance rate of return for the year ended June 30, 2011, was 24.8%, exceeding the projected
return of 8% and reflecting a 82.3% increase from the 13.6% performance rate of return as of
June 30, 2010. The ten-year rate of return posted by the Fund for the period ended June 30,
2011, was 5.7%, and fell short of the actuarial assumption of 8%. Refer to the Investments
Section of this report for more detailed performance information.
The Board of Trustees, along with their professional staff, consultants, and multiple investment
managers, maintain an asset allocation program designed to obtain the highest expected return
on investments consistent with a level of risk appropriate for a large public employee retirement
system. The Trustees continue to monitor and adjust their strategic asset allocation among
investment types and manager styles. Opportunities to improve the financial strength of the Fund
will continue to be explored in accordance with high standards long in effect. Refer to the
Manager Analysis and Broker Commission Report in the Investments Section of this report for
information regarding investment professionals who provide services to the Fund.

Introduction 12
accounting system and internaL controLs
This report was prepared to conform to the principles of governmental accounting and reporting
as pronounced by the Governmental Accounting Standards Board and the American Institute of
Certified Public Accountants. The accrual basis of accounting was used to record the assets,
liabilities, revenues and expenses of the Fund. Revenues are recognized in the accounting period
in which they are earned, without regard to the date of collection, and expenses are recorded
when the corresponding liabilities are incurred, regardless of when payment is made.
In developing the Fund’s accounting system, consideration is given to the adequacy of internal
accounting controls. These controls are designed to provide reasonable assurance regarding the
safekeeping of assets and the reliability of financial records. Constant effort is directed by the
Fund administration at improving the level of internal accounting control to ensure the members
of the Fund of a financially sound retirement system.
economic review
The year began with persistent uncertainty about the general direction of the US economy, due in
large part to concerns related to sovereign debt. During the first quarter, Japan’s Nikkei Index
fell over fears of a slowing economy in the U.S. and abroad; China reported that its fast-growing
economy was slowing down; the Bank of England reduced its already diminished forecast for the
British economy; Ireland announced that its economy shrank by 1.2%; and trade figures from
Washington showed that American exports were faltering.
The economy continued to be weak amid low consumer confidence, and fear of the slowing
recovery. During the first quarter, the employment picture worsened marginally with an increase
in the rate of unemployment from 9.5% in June 2010 to 9.6% in September 2010. The Consumer
Price Index increased at an annualized rate of 0.7% over the first quarter of the year to reach an
annual rate of 1.1%, and the Consumer Confidence Index fell to 48.5, its lowest level since March
2010 and well below the benchmark of 100.
Oil prices increased marginally from $78 per barrel to $80 per barrel. Home prices increased by
3.2% over the trailing one year period. The yield on 3-month Treasuries decreased slightly from
0.18% at the end of the prior fiscal year to 0.16% at the end of the first quarter of fiscal 2011 and
the yield on ten-year Treasuries continued to decline from 2.97% at the end of the previous fiscal
year to 2.53% at the end of the first quarter of fiscal year 2011.
In stark contrast to the weak economic data that was produced during the quarter, the first
quarter of fiscal 2011 yielded double-digit gains in the domestic equity markets, as measured by
the S & P 500 Index.
The economic climate took a turn for the better in the second quarter, capped by reports of robust
holiday spending and a decline in initial jobless claims. Despite budgetary pressures generated by
the government’s commitment to reviving the budget by taking steps to keep interest rates low,
and the extension of tax cuts, the business community viewed the government actions as positive

Introduction 13
with the potential for increased investments and hiring. Key areas of the economy remained
stressed however, as housing prices began to fall again, and an increase in mortgage rates further
slowed housing activity. Improvements in jobless claims failed to translate into a meaningful
decline in the nations' unemployment rate which increased to 9.8% at quarter end. There was no
significant change in the annualized Consumer Price Index, while the Consumer Confidence Index
increased to 54.
From an economic perspective, a recovery was well underway in the third quarter of the year.
Unemployment dipped to 8.9% nationally with nearly two million jobs having been created since
the downturn. The annualized Consumer Price Index increased to 2.1%, and the Consumer
Confidence Index climbed to 72. Corporate profits grew for the eighth straight quarter and
approached levels reached in the spring of 2007. The growth passed through to equity markets in
the form of declining volatility. However, housing concerns due to another leg of decline in the
housing market caused expectations of a robust housing recovery to remain elusive and many
forecasts predicted another full year of falling prices, high mortgage delinquencies and continued
foreclosure activity. In addition, by quarter end consumer confidence began to weaken,
attributable in large part, to sharply rising energy prices. Political unrest in the Middle East and
North Africa resulted in the price of oil rising to $100 per barrel and gasoline prices reaching $4
a gallon, inflicting pain on consumers.
The U.S. economy sputtered at year-end causing investors to shun equities in favor of fixed
income securities. Headlines on the two major topics of unemployment and housing were largely
negative during the last quarter. Job growth remained anemic and the jobs report at year end
showed a reversal of the recent declines in the unemployment rate. Joblessness crept higher to
9.1%; and while jobs were being created, the very slow pace of growth was below that which was
necessary to absorb new entrants to the labor force. The annualized Consumer Price Index
climbed to 3.6% and the Consumer Confidence Index dropped to 62. In addition, the residential
housing market, debate over the federal debt limit and future inflation continued to concern
market participants.
Contrary to the seemingly ominous economic news in the headlines and in political capitals
around the world, corporate America appeared reasonably stable. Corporate profits were at the
all-time high levels of 2007 and margins remained elevated as the severe cost cutting of 2008-
2009 had not been wholly reversed through new hiring and capital expenditures. Contrary to the
debt crisis at the sovereign level, many corporations took advantage of historically low rates to
access debt markets at very favorable terms.
economic outLook
At the end of fiscal 2011, the U.S. Congress was embroiled in a bitter debate over the debt ceiling.
While an 11th hour resolution in early August averted a default on government obligations,
credibility and confidence suffered on both sides of the aisle. Following the resolution, Standard
& Poor’s downgraded the credit rating of U.S. Treasuries from AAA to AA+ based on concerns

Introduction 14
surrounding the effectiveness, stability, and predictability of American policymaking and political
institutions. The market impact of the downgrade was unexpected, as confidence in the status of
U.S. Treasuries caused a flight-to-quality which overrode the credit rating decline and pushed
bond prices higher.
In the first quarter of fiscal 2012, the Federal Reserve’s bond buying program came to an end, yet
rumors about another round of stimulus were confirmed by the end of the quarter, when Chairman
Ben Bernanke announced the next attempt to spur economic growth. The plan included selling
$400 billion in short-term fixed income assets while buying longer-dated paper. Additionally, the
Federal Reserve announced that it would reinvest principal and interest payments received on its
$1 trillion holdings in mortgage-backed and agency securities in order to maintain the size of its
position in the sector.
Despite the political and economic turmoil that currently dominate the news, corporations
continued to perform well. Corporate balance sheets continued to amass cash as firms remain
reluctant to return capital to shareholders. The strong earnings statements and balance sheets
coupled with weak stock prices strongly supported bullish equity valuations. Bearish investors
counter the low valuations with observations about the risks that macroeconomic and
geopolitical uncertainty place on the sustainability of currently high profit margins. The
unemployment rate inched to 9.2%, the annualized Consumer Price Index held at 3.6%, and the
Consumer Confidence Index dropped to 57 in the first month of the new fiscal year.
funding goaLs
The funding policy of the Fund provides for employer contributions which, when added to
contributions received from employee members and earnings on investments, will be sufficient to
meet the actuarially determined obligations of the Fund.
On an annual basis, an actuarial valuation is performed in order to determine the amount of
required contributions on behalf of the Fund. The Illinois Compiled Statutes (Public Act 89-15)
provide for an actuarially determined funding plan intended to maintain the assets of the Fund
at a level equal to 90% of the liabilities of the Fund.
The Chicago Board of Education (employer) is required by law to make contributions to the Fund
only to the extent that the Fund’s actuarially determined funding level drops below 90% by the
end of the fiscal year. The employer is then required to make contributions to the Fund in order to
ensure the actuarial value of assets is 90% of the actuarial value of liabilities by the end of a
predetermined funding period. In years where the funding ratio exceeds 90%, no employer
contribution is required.
Amendments to the Illinois Pension Code during fiscal year 2010 changed the funding
requirements for future years. Illinois Compiled Statutes (Public Act 83-1440) limited the
contributions required to be made to the Fund by the Chicago Board of Education to $187 million

15 Introduction
for fiscal 2011, $192 million for fiscal 2012, and $196 million for fiscal 2013. Under the amended
statute, the Chicago Board of Education was provided a 14-year extension, or until the end of year
2059, to make contributions that ensure that the Fund’s actuarial value of assets is 90% of the
Fund’s actuarial liabilities. The anticipated impact of the legislation is a decrease in the funding
level to 55.2% in fiscal year 2012.
In addition, the Illinois Compiled Statutes (Public Act 90-582) provide that the Chicago Board of
Education (employer) and the State of Illinois (State) are required to make additional
contributions as a percentage of payroll to offset a portion of the cost of benefit increases
enacted under Public Act 90-582. In years where the funding ratio exceeds 90%, no employer or
State contributions are required.
Based upon the actuarial projects at June 30, 2008, the employer and State were required to
make contributions in the amount of $393,266,000 in fiscal year 2010. During fiscal year 2010,
the employer and State paid $355,759,400 in required contributions. The unpaid portion of
$37,506,600 for fiscal year 2010 is currently under litigation with the employer.
Based upon actuarial projects at June 30, 2009, the State was required to make contributions of
$10,449,000 in fiscal 2011. Due to amendments in the Pension Code, the employer was required
to make contributions of $198,140,000 in fiscal 2011. During fiscal year 2011, the employer and
State paid $176,066,600 in required contributions. The unpaid portion of $32,522,400 for fiscal
2011 is currently under litigation with the employer.
major initiatives
The Fund and its Trustees continued to work to enhance the Fund’s investment program,
strengthen the Fund’s benefits, improve office operations, and safeguard the assets of the Fund.
investments
The Fund’s rate of return for the year ended June 30, 2011, was 24.8% as performance of the
portfolio mirrored the improved market and economic conditions relative to the previous fiscal
year end. The Fund maintained a diversified portfolio consisting of equities (domestic and
international), fixed income, real estate, and private equity. The Fund continued to attempt to
maximize investment performance while maintaining acceptable levels of risk.
The Board maintained its target allocation policy during the year. The Board kept its target
allocations in domestic equity at 40.5%, in international equity at 22%, in fixed income at 19.5%,
in real estate at 6.5%, in private equity at 3%, in public REITs at 2.5%, in cash and cash
equivalents at 2%, in infrastructure at 2%, and in hedge funds at 2%.
During the year, the Board performed due diligence over its investment managers in order to
monitor performance and compliance. The Fund continued its formal manager performance review
process in order to monitor managers in all asset classes whose performance was suspect. During
the year ended June 30, 2011, the Fund hired two minority owned fixed income managers;

16 Introduction
terminated an international equity manager and re-distributed the assets to three existing
international managers, including one minority owned manager. In alternative investments, the
Fund increased its commitment to two existing private equity fund of funds managers and hired
one female owned hedge fund of funds manager. In the real estate asset class, the Fund hired a
minority owned real estate manager as well as a real estate fund of funds manager with a focus on
funds owned by minorities, females, and persons with a disability.
The Fund continues to be committed to diversity and as of June 30, 2011, approximately 31%
($3.1 billion) of the Fund’s assets were managed by qualified minority or female owned
investment managers. Additionally, the Fund directed $2,016,666 of commissions to qualified
minority and women brokers.
LEGISLATIVE
Public Act 096-0889 and Public Act 096-1490 were enacted during fiscal year 2010 and became
effective on January 1, 2011. The legislation amended the Illinois Pension Code with dramatic
effect on the Fund and public employees throughout the State of Illinois. In conjunction, both
statutes established a second tier of benefits for those who, after January 1, 2011, first become a
member or participant in any reciprocal retirement system or pension fund established under the
Illinois Pension Code. The second tier benefits include a cap on the salary used in the calculation
of pensions, establish a minimum retirement age of 62, establish age 67 as the minimum age for
unreduced pension benefits, and limit automatic annual post-retirement pension increases based
on the Consumer Price Index.
In addition, Public Act 096-0889 amended the Pension Code, Article 17, Section 129 to limit the
Board of Education’s required contribution to the Fund for fiscal 2011, 2012, and 2013, to $187
million, $192 million, and $196 million, respectively. The period over which contributions must
be made and the funding level of the Fund must be brought to 90% was extended from 2045
to 2059.
The Fund successfully sought passage of legislative changes to eliminate the five day threshold for
pension service credit. Public Act 97-0030 became effective on July 1, 2011, and amended the
Pension Code, Article 17, to allow for pension service credit for each day paid, and to establish
the number of days that constitute a month and year of pension service credit.
Major legislative proposals that the Trustees continue to pursue include:
n Increasing State funding to the Fund on a level relative and comparable to that
provided to the downstate teachers’ pension fund
n Increasing State funding for retiree health insurance, and
n Regaining the property tax levy reallocated to the Board of Education in 1995

Introduction 17
During the year, the Trustees and Fund Administrators have diligently exercised their fiduciary
responsibilities and vigorously opposed legislative changes that negatively impact the financial
stability and future of the Fund, and benefits provided to its active and retired membership. The
Trustees and Fund Administrators, in conjunction with the Fund’s consultants, continue to work in
Springfield to represent the interests of the members, improve benefits for members, and
maintain the financial stability of the Fund.
oPerations
Fund management continued to focus on strengthening operations, improving internal controls,
modernizing key infrastructure components of the Fund, and emphasizing customer service for
our members.
The Fund continued to work with its primary employer, Chicago Public Schools, to resolve payroll
system issues that impacted pension fund data.
The Board has supported the administrative staff and is committed to moving into an automated
work environment and organizational structure that will continue the Fund’s long history of
superior customer service. Detailed discussion regarding all of the Fund’s financial operations is
found in the Management’s Discussion and Analysis section of the Financial report.
concLuding comments
In the 2010 teacher trustee election, Jeffrey Blackwell and Jeanne Marie Freed were elected to
three-year terms.
In the election for officers, John F. O’Brill was elected president, Maria J. Rodriguez, vice
president, Mary Sharon Reilly, recording secretary, and Dr. Walter E. Pilditch, financial secretary.
Chairs of standing committees included John F. O’Brill, Investments; Mary Sharon Reilly, Pension
Law and Rules; Dr. Walter E. Pilditch, Finance and Audit; and Dr. Walter E. Pilditch, Claims and
Service Credits.
This annual report of the Public School Teachers’ Pension and Retirement Fund of Chicago was
prepared through the combined efforts of the Pension Board of Trustees, the Fund’s actuary,
certified public accountants, and administrative staff. We want to express our gratitude and
appreciation for the diligence of all contributors in the preparation of this publication.
Patricia A. Hambrick
Chief Financial Officer

Financials 18

Introduction 1919 Financials
F i na n c i a lThis section contains the report of the independent public
accountants, the financial statements of the Fund and their
analysis, and supplemental financial information.

Financials 20 Financials 20

Financials 21
management’s discussion and anaLysis (unaudited)
June 30, 2011
Management is pleased to provide this overview and analysis of the financial activities of the Public School Teachers’ Pension and Retirement Fund of Chicago (the Fund) for the year ended June 30, 2011. This information is intended to supplement the financial statements, which begin on page 28 of this report. We encourage readers to consider additional information and data in the Fund’s 2011 Comprehensive Annual Financial Report.
annuaL financiaL review
The Fund maintains a highly diversified portfolio of investments for the purpose of accumulating sufficient assets to provide benefits to members and survivors. Diversification of investments among U.S. stocks, real estate, fixed income, private equity, and international investments provides risk-adjusted returns while allowing the Fund to “ride out” short-term fluctuations in individual asset classes. Due to a strong rebound of the financial market in 2011, the Fund returned 24.8% for the year ended June 2011. Although The Fund is a long-term investor and results are more significant over longer periods, the sharp decline in value across investment classes in previous years brought the Fund’s compound rate of return over the past 10 years down to 5.7%, which is 2.3% less than the actuarial assumption of 8.0%.
The Fund’s consulting actuary has certified the total actuarial accrued liability of the Pension Fund to be $16.9 billion as of June 30, 2011. This represents an increase in the total actuarial accrued liability of $620.9 million compared to the actuarial accrued liability of $16.3 billion as of June 30, 2010. The unfunded actuarial accrued liability increased from $5.4 billion to $6.8 billion during the year. The Fund’s consulting actuary has also certified the total actuarial accrued liability of the Health Insurance Fund to be $3.1 billion as of June 30, 2011. This represents an increase in the total actuarial accrued liability of $206.6 million compared to the actuarial accrued liability of $2.9 billion as of June 30, 2010. The unfunded actuarial accrued liability increased from $2.8 billion to $3.0 billion during the year.
financiaL highLights
n Investment returns were favorable in comparison to previous years. The investment rate of return for fiscal year 2011 was 24.8% following fiscal year 2010’s return of 13.6% and fiscal year 2009’s return of negative 22.0%. Five and ten-year averaged returns were 4.2% and 5.7%, respectively.
n Total plan net assets increased during the fiscal year to $10.3 billion at June 30, 2011, from $9.0 billion at June 30, 2010.
n The Fund paid members $1.0 billion in service retirement, disability and survivor benefits, and an additional $78.9 million for healthcare benefits.
n Total additions to plan net assets were $2.5 billion for fiscal year 2011. The net investment gain of $2.1 billion was more than 5.4 times member and employer contributions, which totaled $394.5 million.
n Total deductions from plan net assets were $1.2 billion for fiscal year 2011. Benefit payments, member refunds, and administrative expenses increased 5.9% over fiscal year 2010.
n The funded ratio for pension benefits decreased to 59.7% as of June 30, 2011, from 66.9% at the end of the previous year.

Financials 22
overview of the financiaL statements of the fund
The two basic financial statements of the Fund are the statement of plan net assets and the statement of changes in plan net assets. Statements are shown for the most recent and previous fiscal years for comparison and analysis of changes in individual line items. The statements are prepared in conformity with U.S. generally accepted accounting principles.
The statement of plan net assets is a measure of the Fund’s assets and liabilities at the close of the fiscal year. Total assets less liabilities equal net assets held in trust for future benefits.
The statement of changes in plan net assets shows revenues (additions) and expenses (deductions) for the fiscal year. The net increase (or decrease) is the change in net assets available for benefits since the end of the previous fiscal year.
For financial reporting purposes, the Fund’s assets are divided into two primary funds: the Pension Fund (a defined benefit plan) and the Health Insurance Fund (a postemployment healthcare plan). The Pension Fund includes member contributions and investment earnings used to pay service retirement benefits for participants. The Fund pays service retirement benefits using a fixed formula based on years of service and salary, subject to certain age requirements. In addition to service retirement, participants are eligible for disability and survivor benefits. The Health Insurance Fund consists of assets set aside to subsidize healthcare premiums for members receiving pension benefits.
The notes to financial statements are a fundamental part of the financial statements and provide important information to augment the understanding of the figures in the financial statements. The notes describe accounting policies along with plan membership and benefits. Supplementary disclosures of selected financial data are included in the notes.
In addition to the basic financial statements and notes, a schedule of funding progress and a schedule of employer contributions are included as required supplementary information for both the pension plan and the health insurance plan. These schedules emphasize the long-term nature of the plans and show progress of the Fund in accumulating sufficient assets to pay benefits when due.
The schedule of funding progress shows actuarial trend information for the Pension Fund and the Health Insurance Fund for the past six years. The schedule includes the ratio of valuation assets to the actuarial accrued liability (funded ratio). The funded ratio increases or decreases over time based upon the relationships between contributions, investment performance, benefit changes, and actuarial assumption changes based upon participant information and characteristics. This schedule shows the unfunded actuarial accrued liability as a percentage of member payroll. This schedule also shows the relationship between the funding status of the plan and the growth of payroll.
The schedule of employer contributions shows the amount of required employer contributions and the percentage actually contributed.

Financials 23
investment Performance
For fiscal year 2011, the Fund’s total investment performance resulted in a 24.8% gain. The U.S., International, Real Estate Investment Trusts (REITs), and Private Equity markets generated positive returns. The Fund’s portfolio of U.S. stocks reported a 34.9% return; International stocks reported a 31.2% return, public REITs reported a 32.7% return, and Private Equity reported a 21.5% return. Private real estate generated a positive return of 17.4%, while fixed income realized a positive return of 5.1%.
1-Year Returns (2011)
A s s e t C At e g o r y F u n d r e t u r n I n d e x n A m e I n d e x r e t u r n
Total Fund 24.8% Fund Benchmark Index 23.6%
Domestic equity 34.9 Russell 3000 Index 32.8
International equity 31.2 MSCI ACWI Ex US 30.3
Public REITS 32.7 NAREIT 33.1
Private equity 21.5 N/A —
Real estate (private) 17.4 NEREIF Total Index 16.1
Fixed income 5.1 Barclays Aggregated Index 3.9
5-Year Returns (2011)
A s s e t C At e g o r y F u n d r e t u r n I n d e x n A m e I n d e x r e t u r n
Total Fund 4.2% Fund Benchmark Index 4.7%
Domestic equity 3.7 Russell 3000 Index 3.6
International equity 4.4 MSCI ACWI Ex US 4.1
Public REITS 2.2 NAREIT 1.7
Private equity 9.1 N/A —
Real estate (private) (1.6) NEREIF Total Index 3.3
Fixed income 6.7 Barclays Aggregated Index 6.5
Investment performance returns are calculated using a time-weighted rate of return, annualized on a fiscal year basis from July 1-June 30.

Financials 24
* Note: Percentage indicates actual category weight as a percentage of the entire portfolio.
Asset Allocation Summary as of June 30, 2011in millions of dollars
Cash Equivalent: $5054.8% (target 2.0%)
Private Equity: $3193.1% (target 3.0%)
Infrastructure: $2762.6% (target 2.0%)
Hedge Funds: $1781.7% (target 2.0%)
Real Estate: $6876.6% (target 6.5%)
Public REITs: $2992.9% (target 2.5%)
Fixed Income: $1,81717.3% (target 19.5%)
International Equity: $2,31822.2% (target 22.0%)
Domestic Equity: $4,057 38.8% (target 40.5%)

Financials 25
financiaL statement anaLysis
Plan Net AssetsThe plan net assets increased $1.4 billion (15.2%) during the fiscal year. This increase was due primarily to the strong investment returns during the year.
As of June 30, 2011, total receivables, excluding amounts due from brokers, decreased by $4.6 million from 2010. The decrease in receivables is due to collection and adjustment of the Early Retirement Option receivable, along with a decrease in both contribution receivable from the employer at year-end and accrued investment income at year-end. Due from brokers (the proceeds due from investment sales) decreased $150.1 million due to timing of investment sales at year-end.
Refunds payable increased $2.4 million in 2011. This increase was due to a larger number of refund claims pending at year end. The increase in accounts and administrative expense payable of $2.0 million is the result of an increase in the year-end accrual of investment manager fee expense. Securities lending collateral payable includes $49.4 million, which represents the amount due to the Fund’s custodian for losses on securities lending transactions. Due to brokers (the cash due to brokers for investment purchases) decreased by $5.1 million due to the timing of investment purchases at year-end.
The following is a summary of the plan net assets for the years ended June 30, 2011 and 2010:
FIsCAl yeAr
(In mIllIons) 2011 2010
Cash and cash equivalents $ 19.2 $ 10.8
Receivables 91.1 95.7
Due from brokers 188.4 338.6
Investments, at fair value 10,437.8 8,938.7
Securities lending collateral 578.0 590.7
Capital assets, net 2.8 3.2
Total assets 11,317.3 9,977.7
Benefits and refunds payable 16.4 13.2
Accounts and administrative expenses payable 14.0 12.0
Securities lending collateral payable 608.2 630.5
Due to brokers 334.6 339.7
Total liabilities 973.2 995.4
Net assets held in trust for benefits $ 10,344.1 $ 8,982.3
Additions to Plan AssetsAdditions to plan assets which are needed to finance statutory benefit obligations come from public sources such as state and federal appropriations, employer and employee contributions, net earnings on investments, and miscellaneous sources. For the year ended June 30, 2011, additions totaled $2.5 billion, compared to $1.7 billion for the year ended June 30, 2010. Intergovernmental contributions decreased by $5.3 million in fiscal year 2011. The change in intergovernmental contributions is the net result of a $5.0 million increase from the state and a $10.0 million decrease from the employer, in additional funds required under Section 17-127 of the pension code. Federal insurance reimbursement represents funds from Federal programs which provide reimbursement to health plan sponsors for a portion of the costs of providing a

Financials 26
qualified retiree prescription drug plan, and costs of providing health coverage to early retirees. The reduction in employee contributions is largely the result of additional contributions from the primary employer recorded during fiscal year 2010 totaling approximately $7.9 million, which has not yet been collected and is shown as an employer receivable. Minimum funding requirement represents additional employer contributions required by state law when the funding level drops below 90%. Amendments to the statute during fiscal year 2010 changed the funding requirements for additional employer contributions for fiscal years 2011, 2012, and 2013. Based upon the amendments to the statute, the employer made additional contributions in fiscal year 2011 in the amount of $165.6 million. Net investment income increased due to the unrealized appreciation of the Fund’s investment portfolio. The Fund’s portfolio experienced a 24.8% gain for the year ended June 30, 2011 compared to a 13.6% gain for the year ended June 30, 2010.
The following is a summary of additions to plan net assets for the years ended June 30, 2011 and 2010:
FIsCAl yeAr
(In mIllIons) 2011 2010
Intergovernmental, net $ 43.0 $ 48.3
Federal health insurance reimbursement 10.3 –
Employee contributions 185.9 194.6
Minimum funding requirement (employer) 165.6 307.5
Net investment income 2,123.3 1,107.6
Total additions $ 2,528.1 $ 1,658.0
Deductions from Plan AssetsDeductions from plan assets are representative of an actuarially mature employee group, with modest increases in most benefit categories. Pension benefits increased as new pensioners were added to the pension payroll, with benefits based on higher salaries. Refunds increased slightly due to a larger number of former teachers requesting resignation refunds. The health insurance rebate was disbursed at 70% of covered premiums for the first six months of fiscal year 2011 and 60% of covered premiums for the last six months of fiscal year 2011. The health insurance rebate was 70% for fiscal year 2010. Total deductions from plan assets amounted to $1.2 billion for the year ended June 30, 2011, compared to $1.1 billion for the previous year.
The following is a summary of deductions from plan net assets for the years ended June 30, 2011 and 2010:
FIsCAl yeAr
(In mIllIons) 2011 2010
Pension benefits $ 1,047.5 $ 988.5
Refunds 27.2 21.1
Death benefits 3.3 2.9
Refund of insurance premiums 78.9 80.0
Administration and miscellaneous expenses 9.5 8.8
Total deductions $ 1,166.4 $ 1,101.3

Financials 27
Funding AnalysisUnder the funding plan established by the statutes of the State of Illinois, the employer is not required to make a minimum contribution to the Fund unless the Fund’s funding level falls below 90% for a fiscal year. The employer is then required to make a minimum contribution to the fund in order to bring the total assets of the Fund up to 90% of the total actuarial liabilities of the Fund, by the end of a predetermined funding period.
Amendments to the statute during fiscal year 2010 changed the funding requirements for future years. Minimum contributions for fiscal year 2011 were limited to $187 million; minimum contributions for fiscal year 2012 were limited to $192 million; and minimum contributions for fiscal year 2013 were limited to $196 million. Under the amended statute, the funding period was extended from 2045 to 2059.
Based upon the amended statute, the employer must make contributions of $192 million and $196 million in fiscal years 2012 and 2013, respectively. State law also requires state contributions and other employer contributions to provide for benefit increases when the funding level drops below 90%. Accordingly, the State of Illinois is required to remit $11.0 million and $10.9 million for the periods ending June 30, 2012 and June 2013, respectively. The primary employer of the Fund is required to remit $11.7 million and $11.6 million during the fiscal years ending June 30, 2012 and June 30, 2013, respectively.
Amendments to the statute which were effective during fiscal year 2011 will have a longer term impact on funding. Public Act 96-0889, effective January 1, 2011, created a second tier of benefits for those who first participate in the system after that date. The amendment caps the salary amount that can be used in the calculation of pensions in the future, increases the minimum retirement age, and limits post retirement increases to pensions.
The funded ratio for the plan decreased from 67.1% in 2010 to 59.9% in 2011. The decrease in the funded ratio is due to the employer contribution being less than the employer contribution requirement of normal cost plus interest on the unfunded liability along with the smoothing of 2008 and 2009 investment losses over a four-year period. Employer contributions in 2012 are expected to be substantially less than contributions in fiscal year 2011 and a slight increase is expected in operational and benefits costs. The rate of return for the period ended June 30, 2012, is projected at 8%. As a result, the funded ratio is expected to decrease to 55.2% in fiscal year 2012. The funded ratio of the plan has ranged from 59.9% to 99.9% over the last 10 years.
As previously mentioned, the schedule of employer contributions shows the amount of required contributions in accordance with Governmental Accounting Standards Board (GASB) Statement No. 25, Financial Reporting for Defined Benefit Pension Plans and Note Disclosures for Defined Contribution Plans, and GASB Statement No. 43, Accounting and Financial Reporting by Employers for Postemployment Benefits Other Than Pensions. As exhibited in the schedules, the employer is not making required contributions sufficient to meet the increasing liability of the Pension Fund or Health Insurance Fund.
requests for information
Questions about any information provided in this report should be addressed to: Public School Teachers’ Pension and Retirement Fund of Chicago ATTN: Executive Director 203 North LaSalle Street, suite 2600 Chicago, IL 60601-1231

Financials 28
Statement of Plan Net AssetsJune 30, 2011, with comparative totals for 2010
PensIon
Fund
HeAltH InsurAnCe
Fund
totAl 2011
totAl 2010
ASSETS:
Cash $ 19,159,631 — 19,159,631 10,838,653
Receivables:
Intergovernmental 5,317,843 — 5,317,843 6,455,385
Employee 49,567,455 — 49,567,455 49,986,365
Accrued investment income 30,800,471 — 30,800,471 33,018,734
Due from brokers 188,426,993 — 188,426,993 338,599,541
Participating teachers’ accounts for contributions 4,681,364 — 4,681,364 4,707,780
Other receivables 747,610 — 747,610 1,493,711
Total receivables 279,541,736 — 279,541,736 434,261,516
Investments, at fair value:
U.S. government and agency fixed income 1,029,908,642 — 1,029,908,642 1,069,179,658
U.S. corporate fixed income 577,812,506 — 577,812,506 603,347,049
Foreign fixed income securities 145,648,486 — 145,648,486 141,258,567
Commingled fixed income funds 61,543,285 — 61,543,285 39,484,665
U.S. equities 4,057,376,902 — 4,057,376,902 3,307,748,840
Foreign equities 2,318,222,672 — 2,318,222,672 1,796,843,210
Public REITs 298,907,749 — 298,907,749 220,141,501
Pooled short-term investment funds 451,975,535 34,224,572 486,200,107 568,099,224
Hedge fund 177,744,777 — 177,744,777 141,957,992
Real estate 686,732,202 — 686,732,202 549,194,297
Infrastructure 275,818,888 — 275,818,888 231,022,323
Private equity 319,315,230 — 319,315,230 265,604,804
Margin cash 2,521,041 — 2,521,041 4,870,000
Total investments 10,403,527,915 34,224,572 10,437,752,487 8,938,752,130
Securities lending collateral 578,003,044 — 578,003,044 590,740,626 Capital assets, net of accumulated depreciation 2,794,812 — 2,794,812 3,167,576
Total assets 11,283,027,138 34,224,572 11,317,251,710 9,977,760,501
LIABILITIES:
Benefits payable 2,332,209 — 2,332,209 1,627,688
Refunds payable 14,046,884 — 14,046,884 11,597,077
Accounts and administrative expenses payable 11,097,618 2,900,000 13,997,618 11,992,638 Securities lending collateral payable 608,158,566 — 608,158,566 630,483,033
Due to brokers 334,629,697 — 334,629,697 339,732,001
Total liabilities 970,264,974 2,900,000 973,164,974 995,432,437
Net assets held in trust for benefits $ 10,312,762,164 31,324,572 10,344,086,736 8,982,328,064
See accompanying notes to financial statements.

Financials 29
Statement of Changes in Plan Net AssetsFor fiscal year ended June 30, 2011,
with comparative totals for 2010
PensIon
Fund
HeAltH InsurAnCe
Fund
totAl 2011
totAl 2010
ADDITIONS:
Contributions
Intergovernmental, net $ 10,449,994 32,522,400 42,972,394 48,274,950
Employee 185,882,636 — 185,882,636 194,621,551
Minimum funding requirement (employer) 133,140,000 32,477,600 165,617,600 307,485,000
Total contributions 329,472,630 65,000,000 394,472,630 550,381,501
Investment income:
Net appreciation in fair value 1,928,712,617 — 1,928,712,617 875,027,563
Interest 104,059,688 20,471 104,080,159 114,675,717
Dividends 127,470,956 — 127,470,956 110,049,532
Miscellaneous 620,222 — 620,222 5,548
Securities lending gain 4,601,984 — 4,601,984 47,554,173
Less investment expense:
Investment advisory and
custodial fees (42,193,297) — (42,193,297) (39,738,780)
Total investment income, net 2,123,272,170 20,471 2,123,292,641 1,107,573,753
Federal insurance reimbursement — 10,338,661 10,338,661 —
Miscellaneous 55,307 — 55,307 —
Total additions 2,452,800,107 75,359,132 2,528,159,239 1,657,955,254
DEDUCTIONS:
Pension benefits 1,047,538,959 — 1,047,538,959 988,503,470
Refunds 26,041,554 — 26,041,554 19,871,308
2.2 Legislative refunds 1,138,964 — 1,138,964 1,212,986
Refund of insurance premiums — 78,892,292 78,892,292 79,953,873
Death benefits 3,260,860 — 3,260,860 2,946,147
1,077,980,337 78,892,292 1,156,872,629 1,092,487,784
Administrative and miscellaneous expenses 9,527,938 — 9,527,938 8,800,848
Total deductions 1,087,508,275 78,892,292 1,166,400,567 1,101,288,632
Net increase (decrease) 1,365,291,832 (3,533,160) 1,361,758,672 556,666,622
Net assets held in trust for benefits:
Beginning of year 8,947,470,332 34,857,732 8,982,328,064 8,425,661,442
End of Year $ 10,312,762,164 31,324,572 10,344,086,736 8,982,328,064
See accompanying notes to financial statements.

Financials 30
Notes to Financial StatementsJune 30, 2011
(1) Description of Pension and Health Insurance Plan
(a) Pension PlanThe Public School Teachers’ Pension and Retirement Fund of Chicago (the Fund) is the administrator of a cost-sharing multiple-employer defined benefit public employee retirement system. The state legislature established the Fund in 1895 to provide retirement, survivor, and disability benefits for certain certified teachers and employees of the Chicago Public and Charter Schools as well as Fund employees. The Fund is administered in accordance with Illinois Compiled Statutes (ILCS) Chapter 40, Act 5, Article 17. The Fund is governed by a 12-member Board of Trustees (six elected by the teacher contributors, three elected by the annuitants, one elected by the principal and administrator contributors, and two appointed by the primary employer, the Chicago Board of Education). The Board of Trustees is authorized by state law to make investments, pay benefits, hire staff and consultants, and carry out all necessary functions in compliance with the Illinois Pension Code. As of June 30, 2011, the Fund had 57 participating employers consisting of the primary employer, Chicago Public Schools, 55 charter schools, and the Fund itself.
As of June 30, 2011 and 2010, the Fund membership consisted of the following:
2 0 1 1 2 0 1 0
Retirees and beneficiaries currently receiving benefits 25,199 24,600Terminated members entitled to benefits but not yet receiving them 4,253 2,752
Current members:
Vested 21,027 21,983
Nonvested 9,106 12,000
59,585 61,335
The State of Illinois Public Act (P.A.) 96-0889, created a second tier of benefits for teachers who first become participants in the Fund, or other public pension funds in the State of Illinois, after January 1, 2011. Plan provisions for the two tiers are described below:
(I) Tier IA member with at least 20 years of service and who has attained 55 years of age is entitled to a pension. A member with at least 5 but less than 20 years of service is entitled to a pension on attainment of age 62. In the case of retirement prior to age 60 with less than 34 years of service, the retirement pension is reduced one-half of 1% for each month that the member is under age 60.
A retirement pension is determined by either (1) applying specified percentages which vary with years of service to the average of the four highest years of salary earned or (2) applying a flat 2.2% to the average of the four highest years of salary earned for each year of service. P.A. 90-852 increased the retirement annuity formula to 2.2% of final average salary for each year of service earned after June 30, 1998. Employees may upgrade service to the 2.2 formula for years prior to July 1, 1998, by making certain additional contributions to the Fund. Beginning July 1, 1998, employee contributions increased from 8% to 9% of salary to account for the increased benefit. Annuitants who retired after 1959 receive an annual 3% increase in the retirement pension beginning January 1 following the member’s 61st birthday or the first anniversary of retirement, whichever is later.
A survivor pension is payable upon the death of a contributor or retired member of the Fund. The benefit is the greater of 50% of earned pension or an amount based on the average of the four highest years of salary in the last 10 years of service or on the average salary for the total service, if less than 4 years, with certain qualifications. A 3% automatic annual increase is paid on survivor pension benefits. A single-sum death benefit is also payable on the death of a contributor or retired member of the Fund, with certain qualifications.

Financials 31
A disability pension is payable in the event of total or permanent disability with certain qualifications and service requirements. A duty disability benefit, equal to 75% of final salary, is provided upon the total incapacity for further teaching as a result of an injury sustained while in teaching service. A nonduty disability is payable after 10 or more years of service and is determined by either (1) applying specified percentages which vary with years of service to the average salary earned or (2) applying a flat 2.2% to the average salary earned for each year of service. A 3% automatic annual increase is paid on disability pensions after the first anniversary of the pension or the pensioner’s 61st birthday, whichever is later.
(II) Tier IIA member with at least 10 years of service and who has attained 67 years of age is entitled to an unreduced pension. A member with at least 10 years of service and who has attained 62 years of age is entitled to a reduced pension. In the case of retirement prior to age 67, the retirement pension is reduced one half of 1% for each month that the member is under age 67.
A retirement pension is determined by applying a flat 2.2% to the average of the eight highest years of salary earned for each year of service. P.A. 96-0889 established an annual cap totaling $106,800 on the amount of salary that can be used in any year in calculating pension amounts, with annual increases to the cap limited to the lesser of 3% or the Urban Consumer Price Index.
Tier II members who retire receive an automatic annual increase, equal to the lesser of 3% of the annual pension or one-half the increase in the Consumer Price Index for all Urban Consumers. The automatic annual increase is paid beginning January 1 following the member’s 61st birthday or the first anniversary of retirement, whichever is later.
A survivor pension is payable upon the death of a contributor or retired member of the Fund. The benefit is the greater of 66-2/3% of earned pension or an amount based on the average of the eight highest years of salary in the last 10 years of service or on the average salary for the total service, if less than eight years, with certain qualifications. An automatic annual increase, equal to the lesser of 3% of the annual pension or one-half the increase in the Consumer Price Index for all Urban Consumers, is paid on survivor pensions after the first anniversary of the pension. A single sum death benefit is also payable on the death of a contributor or retired member of the Fund, with certain qualifications.
A disability pension is payable in the event of total or permanent disability with certain qualifications and service requirements. A duty disability benefit, equal to 75% of final salary, is provided upon the total incapacity for further teaching as a result of an injury sustained while in teaching service. A nonduty disability is payable after 10 or more years of service and is determined by applying a flat 2.2% to the average of the eight highest years of salary earned. An automatic annual increase, equal to the lesser of 3% of the annual pension or one-half the increase in the Consumer Price Index for all Urban Consumers, is paid on disability pensions after the first anniversary of the pension or the pensioner’s 61st birthday, whichever is later.
(b) Health Insurance PlanThe Fund administers a health insurance program that includes three external health insurance providers. A recipient of a retirement pension, survivor pension, or disability pension may be eligible to participate in a health insurance program and premium rebate sponsored by the Fund, provided the Fund is the member’s final pension system prior to retirement. The purpose of the program is to help defray the retired member’s premium cost for health insurance. The member is responsible for paying the cost of the insurance and may purchase insurance from the Fund’s providers or other outside providers. Each year, the Board of Trustees establishes a rebate percentage that is used to defray a portion of the cost of the insurance. The rebate percentage was 70% of the individual member’s cost for the first six months of fiscal year 2011 and 60% of the individual member’s cost for the last six months of fiscal year 2011. The rebate percentage was 70% for fiscal year 2010. In accordance with Chapter 40, Act 5, Article 17, Section 17 142.1 of the ILCS, the total health insurance benefits provided in any one year may not exceed $65,000,000 plus any previous years’ amounts authorized but not expended. Of the net assets available for benefits in the health insurance fund, previous years’ amounts authorized but not expended at June 30, 2011 and 2010 are $31,324,572 and $34,857,732, respectively. The Fund has total discretion over the program, and no employee or employer contributions are made for the subsidy.

As of June 30, 2011 and 2010, health insurance membership consisted of the following:
2 0 1 1 2 0 1 0
Retirees and beneficiaries currently receiving health insurance benefits 17,279 16,796 Terminated employees entitled to benefits but not yet receiving them 4,253 2,752
Active Members 30,133 33,983
51,665 53,531
(2) Summary of Significant Accounting Policies
(a) Reporting EntityAs defined by generally accepted accounting principles established by the Governmental Accounting Standards Board (GASB), a financial reporting entity consists of a primary government, as well as its component units, which are legally separate organizations for which the elected officials of the primary government are financially accountable. Financial accountability is defined as:
(1) Appointment of a voting majority of the component unit’s board and either (a) the ability to impose will by the primary government, or (b) the possibility that the component unit will provide a financial benefit to or impose a financial burden on the primary government; or
(2) Fiscal dependency on the primary government.
Based upon the required criteria, the Fund has no component units and is not a component unit of any other entity.
(b) Basis of AccountingThe Fund’s financial statements are prepared using the accrual basis of accounting, following standards promulgated by the GASB. Employee and employer contributions are recognized as additions when due, pursuant to formal commitments, as well as statutory or contractual requirements. Benefits and refunds are recognized as deductions when due and payable, in accordance with the terms of the plan.
(c) Cash and InvestmentsCash includes amounts in demand deposits and uninvested funds held by the Fund’s investment managers.
Investments are governed by Chapter 40, Act 5, Article 17 of the ILCS. These statutes authorize the Fund to invest in accordance with the prudent person rule, which states that fiduciaries will exercise the care, skill, prudence, and diligence under the circumstances then prevailing that a prudent man acting in a like capacity with such matters would use in the conduct of an enterprise of a like character with like aims.
Investments are reported at fair value. Where appropriate, the fair value includes estimated disposition costs. Fair value for stock is determined by using the closing price listed on the national securities exchanges as of June 30. Fair value for fixed income securities are determined principally by using quoted market prices provided by independent pricing services. For commingled funds, the net asset value is determined and certified by the commingled fund manager as of June 30. Alternative investments, which include private equity, real estate, and hedge funds are valued based on amounts established by the fund managers or general partners which are subject to annual audit. The fair value of the derivative instruments that are not exchanged traded is determined by external pricing services using various pricing methods which are based upon the type of the derivative instrument.
Financials 32

Financials 33
(d) Capital AssetsCapital assets are reported at cost. Depreciation is computed by the straight-line method based upon estimated useful lives of 50 years for building and improvements, 10 years for the benefit payment system, and 3 to 5 years for furniture and equipment.
(e) Administrative ExpensesAdministrative expenses are budgeted and approved by the Fund’s Board of Trustees. Funding for these expenses is included in the employer contributions as determined by the annual actuarial valuation.
(f) Risks and UncertaintiesThe Fund invests in various investment securities. Investment securities are exposed to various risks such as interest rate, market, and credit risks. Due to the level of risk associated with certain investment securities, it is at least reasonably possible that changes in the values of investment securities will occur in the near term and that such changes could materially affect the amounts reported in the statement of plan net assets.
(g) Use of EstimatesIn preparing financial statements in conformity with U.S. generally accepted accounting principles, the Fund makes estimates and assumptions that affect the reported amounts of assets and liabilities and disclosures of contingent assets and liabilities at the date of the financial statements, as well as the reported amounts of additions and deductions during the reporting period. Actual results could differ from those estimates and assumptions.
(H) Comparative Financial InformationThe financial statements include certain prior year summarized comparative information in total. Such information does not include sufficient detail to constitute a presentation in conformity with U.S. generally accepted accounting principles. Accordingly, such information should be read in conjunction with the Fund’s financial statements for the year ended June 30, 2010, from which the summarized information was derived.
(3) Receivables
As of June 30, 2011 and 2010, intergovernmental receivables include contributions due from the Board of Education and appropriations due from the State of Illinois as follows:
2 0 1 1 2 0 1 0
Board of Education
Early retirement program $ 909,663 3,326,102
State of Illinois appropriations 4,408,180 3,129,283
$ 5,317,843 6,455,385
The Early Retirement Program receivable represents the Board of Education’s portion of the early retirement costs for fiscal year 2008. The Board of Education did not offer the early retirement program for fiscal year 2011 or 2010.
Employee receivables include the employees’ portion of the early retirement costs, retirement contributions deducted from employees’ compensation by the Employer during the year to be remitted to the Fund, and contributions to be made by employees to upgrade to the 2.2 pension formula. The Employer owed $46,592,612 and $47,226,712, on behalf of the employees, at June 30, 2011 and 2010, respectively. Employees owed the Fund $2,974,843 and $2,759,653 for the 2.2 pension formula upgrade at June 30, 2011 and 2010, respectively.

Financials 34
(4) Deposits and Investments
DepositsCustodial credit risk for deposits is the risk that, in the event of a financial institution failure, the Fund’s deposits may not be returned. All noninvestment related bank balances at year-end are insured or collateralized by securities recorded in the Fund’s name and held by the Fund’s agent, its master custodian (Northern Trust Bank). Cash held in the investment related bank account is neither insured nor collateralized for amounts in excess of $250,000. There is no deposit policy for custodial credit risk.
Cash balances at June 30, 2011:
Carrying amount $ 19,159,631
Bank balance 19,710,682
Amount exposed to custodial credit risk 19,437,233
InvestmentsThe following table presents a summary of the Fund’s investments at fair values at June 30, 2011:
Investments FAIr vAlue
U.S. government and agency fixed income $ 1,029,908,642
U.S. corporate fixed income 577,812,506
Foreign fixed income securities 145,648,486
Commingled fixed income funds 61,543,285
U.S. equities 4,057,376,902
Foreign equities 2,318,222,672
Public REITs 207,117,272
Foreign public REITs 91,790,477
Pooled short-term investment funds 486,200,107
Hedge fund 177,744,777
Real estate 686,732,202
Infrastructure 275,818,888
Private equity 319,315,230
Margin cash 2,521,041
Total investments $ 10,437,752,487

Financials 35
(a) Custodial Credit RiskThe custodial credit risk for investments is the risk that, in the event of the failure of the counterparty to a transaction, the Fund will not be able to recover the value of investments or collateral securities that are in the possession of an outside party. The Fund does not have a formal investment policy which limits its exposure to custodial credit risk. As of June 30, 2011, the following investments were uninsured and unregistered, with securities held by the counterparty or by its trust department or agent but not in the Fund’s name:
CustodIAl CredIt rIsk June 30, 2011
Margin cash $ 2,521,041
(b) Concentration of Credit RiskThere are no significant investments in any organization that represent 5% or more of net assets available for benefits as of June 30, 2011.
(c) Credit RiskCredit risk is the risk that the Fund will not recover its investments due to the inability of the counterparty to fulfill its obligation. The Fund does not have a formal investment policy which limits its exposure to credit risk. The following table presents the quality ratings of debt securities held by the Fund as of June 30, 2011:
s&P CredIt
rAtIngsAsset - BACked
CommerCIAl mortgAge -
BACkedCorPorAte
Bondsgovernment
AgenCIesgovernment
Bonds
government mortgAge-
BACked
munICIPAl Prov. Bonds
AAA $ 14,205,395 26,569,315 4,299,749 138,294,356 15,568,145 470,274 2,408,123
AA 1,870,000 1,305,519 70,939,524 8,478,940 1,105,000 — 11,103,643
A 365,272 7,001,104 297,241,487 8,890,105 2,326,706 — 12,512,973
BBB 526,487 1,010,387 182,719,697 1,448,946 12,385,086 — —
BB 1,297,426 — 8,120,104 — — — —
B 2,023,552 4,696,268 1,015,521 — — — —
CCC 1,040,215 7,877,611 — — — — —
C — — 155,500 — — — —
D 1,594,130 97,454 — — — — —
Not Rated 2,953,453 3,401,007 4,469,560 308,731 18,002,983 — —
US Gov’t. Agency — — — 9,675,187 591,211,587 271,642,428 740,684
$ 25,875,930 51,958,665 568,961,142 167,096,265 640,599,507 272,112,702 26,765,423

Financials 36
(d) Interest Rate RiskInterest rate risk is the risk that the fair value of the Fund’s investments will decrease as a result of an increase in interest rates. The following table presents the weighted average maturity of debt securities held by the Fund as of June 30, 2011:
Investment tyPe FAIr vAlueeFFeCtIve durAtIon
(yeArs)
Asset-backed securities $ 25,875,930 0.01
Commercial mortgage-backed 51,958,665 0.30
Corporate bonds 568,961,142 1.92
Government agencies 167,096,265 0.35
Government bonds 640,599,505 3.72
Government mortgage-backed securities 272,112,703 0.36
Municipal/provincial bonds 26,765,424 0.14
Total $ 1,753,369,634
The Fund does not have a formal investment policy that limits investment maturities as a means of managing its exposure to potential fair value losses arising from future changes in interest rates.
(e) Foreign Currency RiskForeign currency risk is the risk that changes in exchange rates will adversely affect the fair value of an investment or a deposit. The Fund does not have a formal investment policy which limits its exposure to foreign currency risk. The following table presents the foreign currency risk by type of investment as of June 30, 2011:
CurrenCy FAIr vAlue PerCentAge
Foreign equities:
Australian dollar $ 50,295,296 2.17%
Brazilian real 25,987,925 1.12%
British pound sterling 517,109,934 22.31%
Canadian dollar 47,637,380 2.05%
Chilean peso 2,387,665 0.10%
Czech koruna 4,694,931 0.20%
Danish krone 4,495,159 0.19%
Egyptian pound 967,402 0.04%
Euro 529,102,027 22.82%
Hong Kong dollar 99,852,541 4.31%
Indian rupee 21,021,280 0.91%
Indonesian rupiah 14,806,040 0.64%
Japanese yen 384,244,576 16.57%

Financials 37
CurrenCy FAIr vAlue PerCentAge
Malaysian ringgit 1,190,040 0.05%
Mexican peso 6,483,005 0.28%
New Israeli shekel 1,819,003 0.08%
New Zealand dollar 6,111,140 0.26%
Norwegian krone 18,494,759 0.80%
Philippine peso 929,073 0.04%
Polish zloty 1,574,137 0.07%
Singapore dollar 21,473,726 0.93%
South African rand 14,923,863 0.64%
South Korean won 13,011,310 0.56%
Swedish krona 37,782,894 1.63%
Swiss franc 164,509,577 7.10%
Taiwan dollar 14,316,126 0.62%
Thai baht 3,088,451 0.13%
Turkish lira 8,029,434 0.35%
U.S. dollar 301,883,978 13.03%
Total $ 2,318,222,672 100.00%
Foreign fixed income – U.S. dollar $ 145,648,486 100.00%
Foreign Public REITs
Australian dollars 12,013,664 13.09%
Brazilian real 593,852 0.65%
British pound sterling 11,389,139 12.41%
Canadian dollar 2,947,945 3.21%
Chinese yuan renminbi 237,614 0.26%
Euro 11,405,022 12.42%
Hong Kong dollar 25,670,407 27.97%
Japanese yen 14,016,979 15.27%
Singapore dollar 3,681,878 4.01%
Swedish krona 1,026,589 1.12%
Swiss franc 1,428,531 1.55%
U.S. dollar 7,378,857 8.04%
Total $ 91,790,477 100.00%

Financials 38
(5) DerivativesDuring the year ended June 30, 2010, the Fund implemented GASB Statement No. 53, Accounting and Financial Reporting for Derivative Instruments. A derivative instrument is an instrument or contract whose value is derived from that of other financial instruments such as stocks, bonds, and commodities, interest rates or a market index. The Fund’s derivatives are considered investment derivative instruments. The following table summarizes the derivatives held within the Fund’s investment portfolio as of June 30, 2011:
derIvAtIve tyPe notIonAl Amounts FAIr vAlue
Foreign currency contracts purchased $ — 112,036,436
Foreign currency contracts sold — (111,470,041)
Futures:
Long fixed income 23,608,750 (40,906)
Long equity 16,520,970 133,176
Short fixed income 44,636,313 97,400
Rights — 27,135
Warrants — 39,958
Swaps:
Interest rate
Pay fixed, receive variable 14,178,000 (1,032,481)
Total return
Pay variable, receive variable 8,812,196 30,891
Credit default
Pay coupon/buy protection 9,282,551 1,005,913
Receive coupon/sale protection 12,115,811 (615,631)
Total $ 129,154,591 211,850
Forward Currency Forward ContractsForward currency contracts are two-sided contracts in the form of either forward purchases or forward sales. The Fund’s use of these securities is limited to small positions in the Fund’s portfolio to hedge fluctuations in foreign currency. The fair value of forward currency contracts outstanding at June 30, 2011, is as follows:
CurrenCy FAIr vAlue
Foreign currency exchange purchases:
British pound sterling $ 9,132,632
Euro 167,085
Swiss franc 434,689
United States dollar 102,302,030
Total Purchases $ 112,036,436

Financials 39
CurrenCy FAIr vAlue
Foreign currency exchange sales:
British pound sterling $ (30,088,839)
Canadian dollar (4,369,019)
Euro (25,987,008)
Japanese yen (34,426,040)
Mexican peso (79,852)
Norwegian krone (84,340)
Singapore dollar (6,345)
Swedish krona (254,900)
Swiss franc (6,473,872)
United States dollar (9,699,826)
Total Sales $ (111,470,041)
Futures ContractsFinancial futures are agreements to purchase or sell a specific amount of an asset at a specified delivery or maturity date for an agreed-upon price. The Fund uses financial futures to improve yield, to adjust the duration of the fixed income portfolio, and to replicate an index.
Stock Rights and WarrantsA stock right is the right to the holder as a current shareholder in a company to buy additional shares at a discount over the current market price. Warrants are instruments which when purchased are priced above the current market, and allow the holder to purchase shares in a company at a specified future point in time. As a holder of warrants, the Fund bears the risk that the share price will drop below the cost of the warrant.
SwapsSwaps are agreements to exchange currency or assets. The Fund invests in swaps to manage exposure to credit, currency, inflation, and interest rate risks. Interest rate swap agreements involve the exchange of a set of variable and fixed rate interest payments linked to a referenced interest rate without an exchange of the underlying principal amount. The agreements are used to limit or manage exposure to fluctuations in the interest rates or to obtain a marginally lower interest rate than would be available with the swaps. Credit default swap and synthetic default swap agreements involve one party making a stream of payments (the buyer of protection) to another party (the seller of protection) in exchange for the right to receive a specified return in the event of a default or other credit event for the referenced entity, obligation, or index.

Financials 40
Changes in Fair ValueThe following table summarizes the changes in fair value, which were recognized as investment income in the Fund’s statement of changes in plan net assets for the year ended June 30, 2011:
derIvAtIve tyPe CHAnges In FAIr vAlue
Foreign currency contracts $ (2,905,209)
Futures 2,217,838
Options 182,933
Swaptions 15,378
Rights and warrants 346,816
Swaps 1,672,603
Total $ 1,530,359
Credit RiskCredit risk is the risk that the Fund will not recover its investments due to the inability of the counterparty to fulfill its obligation. It is the Fund’s policy to enter into netting arrangements whenever it has more than one derivative instrument transaction with a counterparty. Under the terms of these arrangements, should one party become insolvent or otherwise default on its obligations, close-out netting provisions permit the nondefaulting party to accelerate and terminate all outstanding transactions and net the transactions’ fair values so that a single sum will be owed by, or owed to, the nondefaulting party. The aggregate fair value of derivatives in asset positions at June 30, 2011, was approximately $113,161,817, which is offset by liabilities included in the netting arrangements with counterparties, resulting in approximately $1,426,277 net exposure to credit risk. The counterparties with the remaining credit risk are banks which are rated A or above by the rating agencies.
Interest Rate RiskThe Fund manages its exposure to fair value losses from interest rate risk for the derivatives portfolio using the effective duration contribution method on the portfolio as a whole. Duration is a weighted average of the maturity of all the income streams from the portfolio of the fixed income instruments. Following is the effective duration of the Fund’s fixed income derivatives at June 30, 2011:
derIvAtIve tyPe FAIr vAlue eFFeCtIve durAtIon (yeArs)
Futures fixed income (long and short, net) $ 189,670 0.39
Interest rate swaps (1,032,481) (0.28)
Total return swaps 30,891 (0.06)
Total $ (811,920)
(6) Securities Lending
The Fund’s policies permit the Fund to lend its securities to broker-dealers and other entities with a simultaneous agreement to return the collateral for the same securities in the future. The Northern Trust Company, the Fund’s master custodian, lends securities of the type on loan at year-end for collateral in the form of cash, irrevocable letters of credit or other securities worth at least 102% of the lent securities’ fair value, and international securities for collateral worth at least 105%. At year-end, the Fund has no credit risk exposure to borrowers because the amount the Fund owes to the borrowers exceeds the amounts the borrowers owe to the Fund. The contract

Financials 41
with the Fund’s master custodian requires it to indemnify the Fund if the borrowers fail to return the securities, if the collateral is inadequate to replace the securities lent, or the borrowers fail to pay the Fund for income distributions by the securities issuers while the securities are out on loan. All securities loans can be terminated on demand by either the Fund or the borrower, although the average term of the loans is one week. Cash collateral is invested in the lending agent’s short-term investment pool, which at June 30, 2011, has a weighted average maturity of 45 days.
The relationship between the maturities of the investment pool and the Fund’s loans is affected by the maturities of the securities loans made by other entities that use the agent’s pool, which the Fund cannot determine. The Fund cannot pledge or sell collateral securities without borrower default.
loAns outstAndIng As oF 2011 2010
Fair value of securities loaned for cash collateral $ 565,855,927 570,843,419
Fair value of securities loaned for noncash collateral 49,291,052 64,898,353
Total fair value of securities loaned $ 615,146,979 635,741,772
Fair value of cash collateral from borrowers $ 578,003,044 590,740,626
Fair value of noncash collateral from borrowers 52,391,490 69,563,857
Total fair value of collateral from borrowers $ 630,394,534 660,304,483
(7) Contributions and Reserves
The funding policy of the Fund provides for employer contributions, which, when added to contributions received from employee members and earnings on investments, will be sufficient to meet the actuarially determined obligations of the Fund. On an annual basis, an actuarial valuation is performed in order to determine the amount of required contributions on behalf of the Fund. The ILCS (Public Act 89-15) provides for an actuarially determined funding plan intended to maintain the assets of the Fund at a level equal to 90% of the liabilities of the Fund. The Chicago Board of Education (employer) is required by law to make contributions to the Fund only to the extent that the Fund’s actuarially determined funding level drops below 90% by the end of the fiscal year. The employer is then required to make contributions to the Fund in order to ensure the actuarial value of assets is 90% of the actuarial value of liabilities by 2059. In years where the funding rate exceeds 90%, no employer contribution is required. Based upon amendments to the statute during fiscal year 2010, the employer and the state were required to make contributions in the amount of $208.6 million in fiscal year 2011. Based upon the actuarial projections at June 30, 2008, the employer and state were required to make contributions in the amount of $393.3 million in fiscal year 2010. During fiscal year 2011 and 2010 the employer and state paid $176.1 million and $355.7 million respectively. The unpaid portion for fiscal year 2011 and 2010 is currently under litigation with the employer.
During the year ending June 30, 2011, the state funding for the health insurance plan remained at $32.5 million. As a result, the Fund allocated $32.5 million of the employer contribution to the Health Insurance Fund to pay health benefits to Fund retirees.
(a) Member ContributionsMember contributions, established by the ILCS, are 9% of the full salary rate, of which 1% applies to survivor’s and children’s pension benefits. Fund employees also participate as members in the Fund and are included in the total current members. Contributions made by the Fund for Fund employees totaled $257,873 and $237,330 for the years ended June 30, 2011 and June 30, 2010, respectively, which is 100% of the employee contributions required to be made by the Fund.

Financials 42
(b) Other ContributionsThe State of Illinois makes an annual contribution to the Fund to supplement any employer contribution. This contribution is considered an intergovernmental contribution. Federal funds which are included in the employer minimum funding requirement, are actuarially-based amounts contributed to the Fund for the accruing pension cost of teachers whose salaries are paid from special trusts or federal funds. Federal insurance reimbursement represents funds from Federal programs providing reimbursement to health plan sponsors for a portion of the costs of providing a qualified retiree prescription drug plan, and costs of providing health coverage to early retirees.
(c) Early Retirement ProgramOptional Program — Eligible Chicago teachers age 55 to 60 may retire without discount if the Board of Education passes a resolution for the early retirement without discount program in accordance with the ILCS. A contributor is eligible if he/she:
n has at least 20 but less than 34 years of service
n retires within 6 months of the last day of teaching service (or payroll period) for which pension contributions were made.
The contributor and the Board of Education must each make a one-time contribution to the Fund. The employee contribution equals 7% of the member’s last full-time salary rate multiplied by (1) the number of years the member is under 60 or (2) the number of years the member’s creditable service is less than 34, whichever is less. The employer contribution equals 20% of such salary multiplied by the number of years used in the employee contribution calculation. The number of teachers who may retire under this election may be limited by the Board of Education.
The Board of Education did not pass an Early Retirement Option for the years ended June 30, 2011 and 2010. During fiscal year 2010, the Board of Education paid the amount due for fiscal year 2007. The unpaid portion of the required contributions for fiscal year 2008 is reflected as a receivable of $909,663 in the accompanying financial statements.
(8) Funded Status and Funding ProgressAs of June 30, 2011, the funded status, annual covered payroll, and unfunded actuarial accrued liability for the Pension and Health Insurance Plans were as follows:
PensIon PlAn
HeAltH InsurAnCe PlAn
Actuarial accrued liability $ 16,940,626,445 3,071,516,739
Less actuarial value of assets 10,109,314,922 31,324,572
Unfunded actuarial accrued liability $ 6,831,311,523 3,040,192,167
Funded ratio 59.67% 1.02%
Annual covered payroll $ 2,090,131,858 2,090,131,858
Unfunded actuarial accrued liability as a percentage of annual covered payroll 326.84% 145.45%
The actuarial valuations involve estimates of the value of reported amounts and assumptions about the probability of events far into the future. Because actuarial calculations reflect a long- term perspective, actuarially determined amounts are subject to continual revision, as results are compared to past expectations and new estimates made about the future. Examples include assumptions about future employment, mortality, investment returns, and healthcare cost trends. The schedules of funding progress, presented as required supplementary information (RSI) following the notes to the financial statements, present multiyear trend information about whether the actuarial value of each plan’s net assets is increasing or decreasing over time relative to the actuarial accrued liability for benefits.

Financials 43
Actuarial Methods and Assumptions
The following represents the actuarial methods and assumptions for the Pension and Health Insurance Plans as of June 30, 2011:
PensIon PlAnHeAltH InsurAnCe
PlAn
Valuation date June 30, 2011 June 30, 2011
Actuarial cost method Projected unit credit Projected unit credit
Amortization method Level percent of payroll Level percent of payroll
Amortization approach Open Open
Amortization period 30 years 30 years
Asset valuation method 4-year smoothed market value 4-year smoothed market value
Actuarial assumptions:
Investment rate of return 8% per year 4.5% per year
Projected salary increases*
Rate of increase varying by age.In terms of the impact on liabilities and costs, the assumed rates of increase are equivalent to an aver-age salary increase of 4% per year
N/A
Inflation rate* 3% per year 3% per year
Postretirement benefit increase: Medical trend rate:
2012 3% per year 9.0% per year
2013 3% per year 8.5% per year
2014 3% per year 8.0% per year
2015 3% per year 7.5% per year
2016 3% per year 7.0% per year
2017 3% per year 6.5% per year
2018 3% per year 6.0% per year
2019 3% per year 5.5% per year
2020 and later 3% per year 5.0% per year
* includes inflation at cost-of-living adjustments

Financials 44
(9) Insurance CoverageThe Fund is exposed to various risks of loss related to torts; theft of, damage to, and destruction of assets; errors and omissions; injuries to employees; and natural disasters. The Fund has minimized the risk of loss through private insurance carriers with deductibles for coverage ranging up to $1,000 per occurrence. The amount of settlements has not exceeded insurance coverage in any of the previous three fiscal years.
(10) LitigationThere are several pending lawsuits in which the Fund is involved. Management believes that the potential claims against the Fund would not materially affect the financial position of the Fund.
(11) Operating LeasesThe Fund’s office lease provides that the lessee pay its proportionate share of the operating costs plus a base rental amount. Included in this lease are provisions for 32 monthly periods of “free rent.” In conformity with accounting requirements, the Fund will recognize office rent expense on a straight-line basis over the 16-year lease term. As an inducement, the lessor agreed to provide the Fund an allowance of $1,971,610 to be used for leasehold improvements, fixed asset purchases, or monthly rental payments. If the allowance is used for leasehold improvements or fixed asset purchases, the Fund must submit the paid invoices to the lessor for reimbursement. If the Fund chooses to use the allowance for a monthly rental payment, the Fund must inform the lessor of this intent. The minimum future rental lease payments through April 30, 2021, are as follows:
yeAr ended June 30: Amount
2012 499,991
2013 512,649
2014 525,307
2015 537,965
2016 550,623
2017-2020 2,329,072
2021 510,539
Total minimum future rental payments $ 5,466,146
Rent expense was $487,333 and $474,675 in 2011 and 2010, respectively.

Financials 45
required suPPLementary information Schedule of Funding Progress (Unaudited)
Pension PlanLast six fiscaL years (in thousands except for percentages)
scheduLe 1
vAluAtIon dAte
ACtuArIAl vAlue oF Assets
(A)
ACtuArIAl ACCrued
lIABIlIty – ProJeCted unIt CredIt
(AAl)(B)
unFunded AAl
(uAAl)(B-A)
Funded rAtIo(A/B)
AnnuAl Covered PAyroll
(C)
uAAl As A PerCent
oF AnnuAl Covered PAyroll
(B-A)/C
June 30, 2006 $ 10,947,998 14,035,627 3,087,629 78.00% $ 1,944,358 158.80
June 30, 2007 11,759,699 14,677,184 2,917,485 80.12 1,863,182 156.59
June 30, 2008 12,069,417 15,203,741 3,134,324 79.38 1,914,559 163.71
June 30, 2009 11,493,256 15,683,241 4,189,985 73.28 1,996,194 209.90
June 30, 2010 10,917,417 16,319,744 5,402,327 66.90 2,107,934 256.29
June 30, 2011 10,109,314 16,940,626 6,831,312 59.67 2,090,132 326.84
(A) The actuarial value of assets available for benefits was determined by adjusting the value of assets at cost by
the average excess of the market value of assets over assets at cost as of the last four fiscal periods.
See accompanying independent auditors’ report.
Schedule of Funding Progress (Unaudited)Health Insurance Plan
Last six fiscaL years (in thousands except for percentages)
scheduLe 2
vAluAtIon dAte
ACtuArIAl vAlue oF Assets
(A)
ACtuArIAl ACCrued
lIABIlIty – ProJeCted unIt CredIt
(AAl)(B)
unFunded AAl
(uAAl)(B-A)
Funded rAtIo(A/B)
AnnuAl Covered PAyroll
(C)
uAAl As A PerCent
oF AnnuAl Covered PAyroll
(B-A)/C
June 30, 2006 $ 41,058 2,373,774 2,332,716 1.73% $ 1,944,358 119.97%
June 30, 2007 47,402 2,022,008 1,974,606 2.34 1,863,182 105.98
June 30, 2008 44,989 2,407,122 2,362,133 1.87 1,914,559 123.38
June 30, 2009 49,692 2,670,283 2,620,591 1.86 1,996,194 131.28
June 30, 2010 34,858 2,864,877 2,830,019 1.22 2,107,934 134.26
June 30, 2011 31,325 3,071,517 3,040,192 1.02 2,090,132 145.45
See accompanying independent auditors’ report

Financials 46
required suPPLementary information Schedule of Employer Contributions
(Unaudited)Pension PlanLast six fiscaL years
scheduLe 3
PerIod ended
AnnuAl requIred ContrIButIons ACtuAl
PerCentAge ContrIButed
AnnuAl requIred ContrIButIons ACtuAl
PerCentAge ContrIButed
totAl ContrIButIons
As A % oF AnnuAl requIred
ContrIButIonsEMPLOYER CONTRIBUTIONS EMPLOYEE CONTRIBUTIONS
June 30, 2006 $ 328,365,821 117,789,706 35.87% $ 163,544,149 163,419,386 99.92% 57.17%
June 30, 2007 311,139,800 103,761,750 33.35 156,716,250 179,017,663 114.23 60.44
June 30, 2008 290,072,885 164,466,511 56.70 161,037,666 172,504,804 107.12 74.70
June 30, 2009 292,145,359 198,069,327 67.80 167,904,187 176,176,975 104.93 81.35
June 30, 2010 355,846,125 290,759,950 81.71 177,302,867 194,621,551 109.77 91.04
June 30, 2011 430,091,545 143,589,994 33.39 175,805,483 185,882,636 105.73 54.38
See accompanying independent auditors’ report.
Schedule of Employer Contributions (Unaudited) Health Insurance Plan
Last six fiscaL years
scheduLe 4
PerIod ended
AnnuAl requIred ContrIButIons ACtuAl
PerCentAge ContrIButed
EMPLOYER CONTRIBUTIONS
June 30, 2006 $ 213,315,753 65,000,000 30.47%
June 30, 2007 209,446,107 65,000,000 31.03
June 30, 2008 150,033,070 65,000,000 37.82
June 30, 2009 171,880,428 65,000,000 37.82
June 30, 2010 186,231,574 65,000,000 34.90
June 30, 2011 215,797,617 65,000,000 30.12
See accompanying independent auditors’ report.

Financials 47
Schedules of Administrative and Miscellaneous Expenses
years ended June 30, 2011 and 2010
scheduLe 5
2011 2010
Salaries $ 4,608,637 3,802,012
Accrued leave 140,244 365,869
Actuary fees 70,750 68,000
Auditing 175,000 165,275
Banking fees 58,518 55,425
Consulting 3,631 10,376
Data processing 47,145 77,809
Depreciation 516,054 536,610
Election expense 214,331 250,358
Employees’ health insurance 664,504 610,313
Field services/pension rep 59,634 56,558
Health insurance consulting 44,333 35,093
Insurance premium 35,359 31,965
Legal fees 431,892 210,496
Legislative expense 136,037 127,138
Maintenance of equipment, systems, software, and support
189,493 187,095
Medical fees 57,097 55,443
Membership, dues, and subscriptions 11,414 13,335
Office forms and supplies 75,360 59,908
Office rent and utilities 888,722 912,895
Postage 182,321 142,305
Publications/communication 165,915 235,322
Records management 8,043 8,901
Studies and evaluation 6,896 43,715
System consulting 540,988 542,950
Trustee conferences, seminars, and meetings
100,295 128,149
Tuition and training/educational conference 70,193 46,896
Miscellaneous 25,132 20,637
totAl $ 9,527,938 8,800,848
See accompanying independent auditors’ report.

48 Financials
Schedules of Cash Receipts and Disbursementsyears ended June 30, 2011 and 2010
scheduLe 6
2011 2010
Cash and cash equivalents at beginning of period $ 578,937,877 491,711,557
Add receipts:
Member contributions 186,327,962 181,608,813
Public revenues 220,066,197 364,916,322
Interest and dividends 238,991,584 275,786,079
Miscellaneous 55,307 —
Net investment sales 507,599,155 404,733,180
Total cash receipts 1,153,040,205 1,227,044,394
Less disbursements:
Pension benefits 1,050,095,298 991,377,579
Refunds 51,685,515 18,631,998
2.2 legislative refunds 1,138,964 1,212,986
Refund of insurance premiums 75,992,292 76,339,873
Investment and administrative expenses 46,960,174 51,643,400
Miscellaneous 746,101 612,238
Total cash disbursements 1,226,618,344 1,139,818,074
Net increase (decrease) in cash
and cash equivalents (73,578,139) 87,226,320
Cash and cash equivalents at end of period $ 505,359,738 578,937,877
See accompanying independent auditors’ report.

Financials 49
Schedules of Manager Feesyears ended June 30, 2011 and 2010
scheduLe 7
2011 2010
Acadian Asset Management $ — 213,293
Adams Street Partners 1,235,539 1,116,753
Adelante Capital Management 330,060 259,049
Ariel Capital Management 398,483 446,462
Attucks Asset Management 1,115,289 967,225
Brandywine Global Investment Management — 336,883
Capri Capital Partners 121,797 244,017
CB Richard Ellis Investors 103,813 108,156
Channing Capital Management 425,091 363,874
Credo Capital Management 417,051 338,776
Dimensional Fund Advisors 609,287 522,849
DV Realty Advisors 265,159 256,365
Earnest Partners, LLC 895,815 708,872
Europa 649,879 647,268
Fortress Japan Opportunity Domestic Fund 101,115 —
Franklin Templeton Institutional Advisors 136,957 —
Fremont Realty Capital 345,091 341,468
Garcia Hamilton 115,436 —
HarbourVest Partners, LLC 729,000 810,000
Harris Investment Management, Inc. 616,811 512,096
Hispania Capital Partners 239,782 339,475
Holland Capital Management 634,206 472,404
Hudson Partners 208,191 —
ICV Capital Partners 117,786 225,000
Intercontinental Real Estate Corp. 402,496 436,319
J. & W. Seligman & Co. — 533,344
J.P. Morgan Fleming Asset Management 3,843,178 3,930,647
K2 Advisors 820,630 550,237
LaSalle Property Fund 85,656 —
Lazard Asset Management 808,390 764,178
Leading Edge — Manager of Managers 832,081 181,697
Lehman Brothers Asset Management — 43,191
LM Capital 218,646 181,170
Lombardia Capital Partners 660,965 582,909
Lynmar Capital Group, Inc. — 215,330 Continued on page 50

50 Financials
2011 2010
Macquarie Infrastructure Partners $ 1,383,840 2,142,193
Merrill Lynch 1,116,827 1,173,802
Mesirow Financial, Inc. 2,614,737 2,085,577
MFS Institutional Advisors 1,461,536 1,335,115
Morgan Stanley Investment Management 2,834,695 2,624,127
Muller and Monroe Asset Management 203,159 257,258
New Amsterdam Partners 489,755 543,168
Northern Trust Global Investments 356,000 479,242
Palladium Equity Partners 128,503 150,000
Pantheon Ventures, Inc. 698,175 718,837
Pharos Capital Group 54,768 16,449
Piedmont Investment Advisors 464,261 417,338
Progress Investment Management 1,084,277 961,577
Prudential Investment Management 1,385,586 1,293,187
Pugh Capital Management 121,173 —
RhumbLine Advisers 125,177 91,736
RREEF Global 286,346 309,178
Syncom Partners 161,280 159,284
Taplin, Canida and Habacht 202,003 193,210
UBS Global Asset Management 1,295,115 756,269
United Investment Management — 375,224
Urban America, LP 290,284 290,284
Urdang Investment Management 519,783 274,642
Waddell & Reed Asset Management Group 316,235 289,228
Walton Street Capital 1,090,253 1,166,844
Western Asset Management 808,629 876,693
William Blair & Company 3,323,490 1,989,123
Zevenbergen Capital Investments 330,675 260,876
Total manager fees 40,630,242 37,879,768
Callan – General Consultant 182,500 —
Mercer – General Consultant 130,000 405,000
Northern Trust – Master Custodian 400,000 400,000
The Townsend Group – Real Estate Consultant 161,838 160,000
Total consultant fees 874,338 965,000
Fees for foreign exchange and real estate 688,717 894,012
Total $ 42,193,297 39,738,780
See accompanying independent auditors’ report.
scheduLe 7 (continued from page 49)

Financials 51
Schedule of Consultant Paymentsyears ended June 30, 2011 and 2010
scheduLe 8
2011 2010
Anselmo and Associates $ 77,733 72,468
Aon Consulting 41,000 —
Aspen Marketing 52,001 49,059
Bogfire, Inc. 25,190 23,685
Bradley Consulting Group, Inc. 452,000 432,000
Cahill Printing Co. 11,729 12,454
Chicago Press Corporation 82,089 51,663
Comgraphic 155,180 42,394
Data Consultants 41,508 54,790
E. M. Barnes & Associates 58,304 54,490
Election Service Corporation 174,138 218,036
Goldstein & Associates 70,750 68,000
Michelle Holleman 73,933 72,285
Imaging Office Systems 26,537 27,984
Jacobs, Burns, Orlove, and Hernandez 355,987 196,752
Kirkland & Ellis, LLP 79,052 13,541
KPMG LLP 175,000 165,275
Levi, Ray & Shoup, Inc. — 48,673
Robin Lynch 88,988 110,950
National Data Service of Chicago 6,966 6,966
North Shore Printers 86,624 44,907
The Segal Company 3,333 35,903
Total $ 2,138,041 1,802,275
See accompanying independent auditors’ report.

Introduction 52 Investments 52

Introduction 53 Investments 53
I n v e s t me n t sThis section includes a synopsis of the Fund’s investment authority,
summary tables of investment data, and a digest of the current year’s
investment activity and performance.

Investments 5454 Investments

Investments 55 Investments

Investments 56
-3.3%
4.0%
15.0%
10.8% 10.7%
17.7%
totaL annuaL fund rate of return*as of June 30, 2002-2011
*Time-weighted rate of return.
25
20
15
10
5
0
-5
-10
-15
-20
-25
percent
-5.3%
-22.4%
13.6%
24.8%
2002 2003 2004 2005 2006 2007 2008 2009 2010 2011

Investments 57
scheduLe of investment resuLts
AnnuAlIzed returns gross oF Fees
2007 2008 2009 2010 2011 3 yeAr 5 yeAr 10 yeAr
Total Fund 17.7% (5.3%) (22.0%) 13.6% 24.8% 3.3% 4.2% 5.7%
Large Cap 19.9% (10.1%) (26.6%) 13.6% 32.6% 3.4% 3.6% 3.4%
Russell 1000 Index 20.4% (12.4%) (26.7%) 15.2% 31.9% 3.7% 3.3% 3.2%
S&P 500 20.6% (13.1%) (26.2%) 14.4% 30.7% 3.3% 2.9% 2.7%
Mid Cap Equity 18.3% (10.5%) (29.7%) 21.7% 39.8% 6.2% 4.8% 7.0%
S&P Mid Cap 18.5% (7.3%) (28.0%) 24.9% 39.4% 7.8% 6.6% 7.9%
Small Cap Equity 19.7% (18.2%) (24.1%) 24.4% 39.9% 9.7% 5.3% 8.0%
Russell 2000 Index 16.4% (16.2%) (25.0%) 21.5% 37.4% 7.8% 4.1% 6.3%
International Equity 25.2% (7.2%) (28.9%) 14.4% 31.2% 2.2% 4.4% 8.2%
MSCI ACWI ex US 30.1% (6.2%) (30.5%) 10.9% 30.3% 0.1% 4.1% 7.9%
Fixed Income 6.2% 5.8% 4.1% 12.3% 5.1% 7.1% 6.7% 5.9%
Barclays Aggregated Index 6.1% 7.1% 6.1% 9.5% 3.9% 6.5% 6.5% 5.7%
REITs 18.0% (16.7%) (37.8%) 38.7% 33.0% 4.7% 2.4% 11.4%
Custom REITs Index** 13.8% (16.8%) (39.6%) 38.7% 33.2% 3.7% 1.1% 9.9%
Real Estate (Private) 18.4% 6.5% (34.7%) (4.7%) 20.0% (9.3%) (1.2%) 5.3%
NCREIF Property Index 17.3% 9.2% (19.6%) (1.5%) 16.7% (2.6%) 3.4% 7.6%
Private Equity* 22.0% 19.7% (24.7%) 15.4% 21.5% 1.8% 9.1% –
N/A – – – – –
Infrastructure – – 12.1% (3.2%) 16.9% 8.3% – –
Hedge Funds – – – – 6.9% – – –
* Returns for Private Equity are based on the custodial statements.
** Custom REIT Index is calculated based on a weighted average of the NAREIT domestic and NAREIT global
indices to accurately reflect the changes in CTPF strategy.
Note: Returns are calculated based upon a time weighted rate of return.

Investments 58
Investment Portfolio Summaryin millions of dollars
June 30, 2010FAIr
vAlue PurCHAses
sAles (FAIr
vAlue)FAIr vAlue
AdJustments
June 30, 2011FAIr
vAlue
PerCent oF totAl
Fixed Income $ 1,858.2 3,783.3 3,736.5 (87.6) 1,817.4 17.38%
Equity 5,324.7 2,574.1 2,880.4 1,656.1 6,674.5 63.83%
Real Estate 549.3 62.8 18.2 92.8 686.7 6.57%
Hedge Funds 141.9 25.0 0.0 10.8 177.7 1.70%
Infrastructure 231.0 15.5 3.6 32.9 275.8 2.64%
Private Equity 265.6 56.4 33.5 30.8 319.3 3.05%
Cash & Equivalents 578.9 (73.5) 0.0 0.1 505.5 4.83%
Total Portfolio $ 8,949.6 6,443.6 6,672.2 1,735.9 10,456.9 100.00%

Investments 59
Asset Allocation Summary as of June 30, 2011in millions of dollars
* Note: Percentage indicates actual category weight as a percentage of the entire portfolio.
Cash Equivalent: $5054.8% (target 2.0%)
Private Equity: $3193.1% (target 3.0%)
Infrastructure: $2762.6% (target 2.0%)
Hedge Funds: $1781.7% (target 2.0%)
Real Estate: $6876.6% (target 6.5%)
Public REITs: $2992.9% (target 2.5%)
Fixed Income: $1,81717.3% (target 19.5%)
International Equity: $2,31822.2% (target 22.0%)
Domestic Equity: $4,057 38.8% (target 40.5%)

Investments 60
Historical Asset Allocation
2006 2007 2008 2009 2010 2011
ACtuAl PolICy ACtuAl PolICy ACtuAl PolICy ACtuAl PolICy ACtuAl PolICy ACtuAl PolICy
Equity:
Domestic 47.7 48.5 43.9 41.5 39.5 41.5 36.1 40.5 37.0 40.5 40.1 40.5
International 14.6 12.5 21.3 22.0 21.3 22.0 19.6 22.0 20.1 22.0 22.9 22.0
Public REITs 2.3 2.0 1.7 2.5 2.2 2.5 1.7 2.5 2.5 2.5 3.0 2.5
Private Equity 2.3 2.0 2.4 3.0 2.6 3.0 2.8 3.0 3.0 3.0 2.9 3.0
Total Equity 66.9 65.0 69.3 69.0 65.6 69.0 60.2 68.0 62.5 68.0 68.9 68.0
Fixed Income 23.4 28.0 20.8 20.5 22.2 20.5 23.4 19.5 20.8 19.5 17.7 19.5
Real Estate 6.1 5.0 6.5 6.5 7.9 6.5 7.0 6.5 20.8 19.5 6.7 8.5
Infrastructure 0.0 0.0 0.0 2.0 0.0 2.0 3.0 2.0 6.1 6.5 2.7 0.0
Hedge Funds 0.0 0.0 0.0 0.0 0.0 0.0 0.0 2.0 2.6 2.0 1.7 2.0
Cash & Equiv. 3.6 2.0 3.4 2.0 4.3 2.0 6.4 2.0 6.4 2.0 2.3 2.0
Total Portfolio
100.0 100.0 100.0 100.0 100.0 100.0 100.0 100.0 100.0 100.0 100.0 100.0
Historical Asset Allocation by Dollar Amount
2006 2007 2008 2009 2010 2011F i s c a l Y e a r
cashreal estate inFrastructureFixed incomeequitY hedge Funds
ma
rk
et
Va
lue
(m
illi
on
s o
F d
oll
ar
s)
1 2 ,000
10 ,000
8 ,000
6 ,000
4 ,000
2 ,000
0

Investments 61
Domestic Equity Summaryas of June 30, 2011
economic sector hoLdings
s&P eConomIC seCtor
numBer oF sHAres
mArket vAlue
PerCent oF totAl
s&P 500 Index
AlloCAtIon
Information Technology 22,204,783 $ 688,750,978 17.0% 17.7%
Financials 21,725,490 538,551,739 13.3% 15.1%
Health Care 15,457,480 476,166,955 11.7% 11.7%
Consumer Staples 6,687,266 290,183,240 7.2% 10.6%
Industrials 14,882,283 517,575,503 12.8% 11.3%
Energy 9,206,785 415,205,684 10.2% 12.7%
Consumer Discretionary 15,539,515 502,287,679 12.4% 10.7%
Utilities 2,492,712 81,523,283 2.0% 3.4%
Materials 4,290,479 160,324,715 4.0% 3.7%
Telecommunication Services 3,654,813 91,888,684 2.3% 3.1%
Miscellaneous 64,634,438 294,918,442 7.1% 0.0%
Grand Total 180,776,044 $ 4,057,376,902 100.0% 100.0%
toP 10 domestic equity hoLdings
desCrIPtIon
numBer oF sHAres
mArket vAlue
PerCent oF totAl
Apple Computer Corp. 221,025 $ 74,191,462 1.8%
Exxon Mobil 847,132 68,939,602 1.7%
Microsoft Corp. 1,862,213 48,417,538 1.2%
JP Morgan Chase 990,670 40,558,030 1.0%
IBM Corp. 225,627 38,706,312 1.0%
General Electric Co. 1,792,406 33,804,777 0.8%
Chevron 314,443 32,337,318 0.8%
ConocoPhillips 429,319 32,280,496 0.8%
Halliburton 619,381 31,588,431 0.8%
Verizon Communications 817,634 30,440,513 0.7%
Total Top 10 Domestic Equity 8,119,850 $ 431,264,479 10.6%
Grand Total 180,776,044 $ 4,057,376,902 100.0%
A complete list of the portfolio holdings is available at the pension fund office.
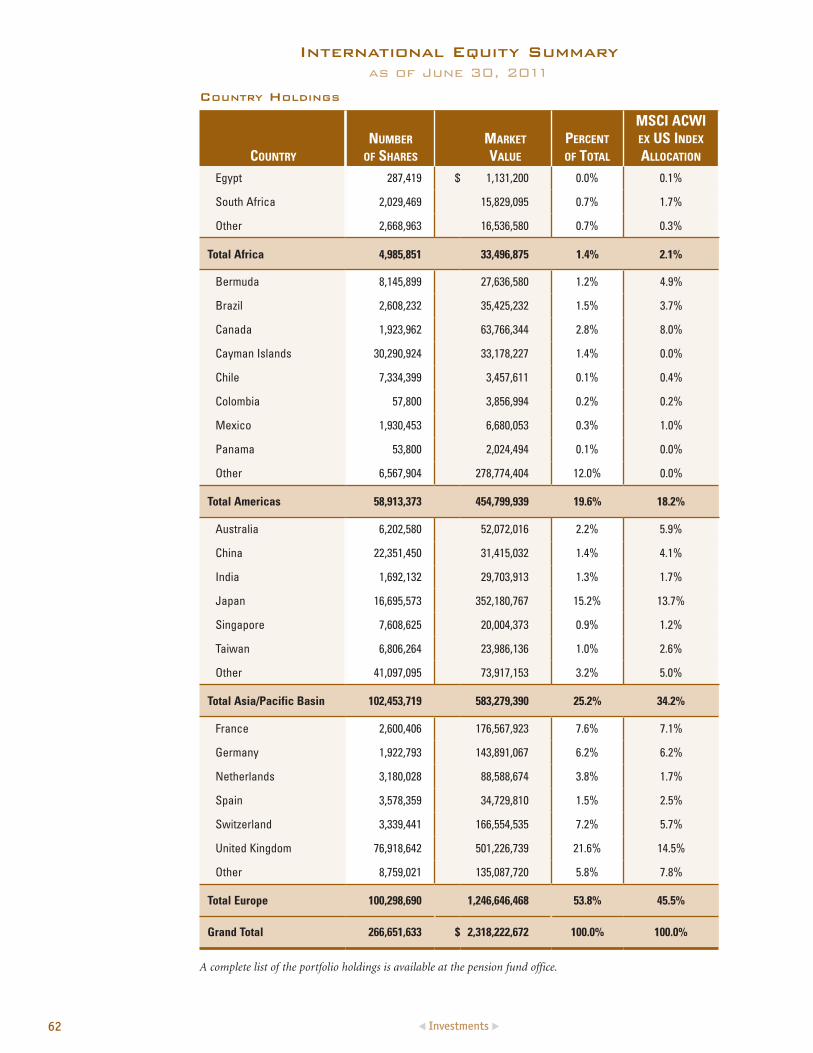
62 Investments
International Equity Summary as of June 30, 2011
country hoLdings
Country
numBer oF sHAres
mArket vAlue
PerCent oF totAl
msCI ACWI ex us Index AlloCAtIon
Egypt 287,419 $ 1,131,200 0.0% 0.1%
South Africa 2,029,469 15,829,095 0.7% 1.7%
Other 2,668,963 16,536,580 0.7% 0.3%
Total Africa 4,985,851 33,496,875 1.4% 2.1%
Bermuda 8,145,899 27,636,580 1.2% 4.9%
Brazil 2,608,232 35,425,232 1.5% 3.7%
Canada 1,923,962 63,766,344 2.8% 8.0%
Cayman Islands 30,290,924 33,178,227 1.4% 0.0%
Chile 7,334,399 3,457,611 0.1% 0.4%
Colombia 57,800 3,856,994 0.2% 0.2%
Mexico 1,930,453 6,680,053 0.3% 1.0%
Panama 53,800 2,024,494 0.1% 0.0%
Other 6,567,904 278,774,404 12.0% 0.0%
Total Americas 58,913,373 454,799,939 19.6% 18.2%
Australia 6,202,580 52,072,016 2.2% 5.9%
China 22,351,450 31,415,032 1.4% 4.1%
India 1,692,132 29,703,913 1.3% 1.7%
Japan 16,695,573 352,180,767 15.2% 13.7%
Singapore 7,608,625 20,004,373 0.9% 1.2%
Taiwan 6,806,264 23,986,136 1.0% 2.6%
Other 41,097,095 73,917,153 3.2% 5.0%
Total Asia/Pacific Basin 102,453,719 583,279,390 25.2% 34.2%
France 2,600,406 176,567,923 7.6% 7.1%
Germany 1,922,793 143,891,067 6.2% 6.2%
Netherlands 3,180,028 88,588,674 3.8% 1.7%
Spain 3,578,359 34,729,810 1.5% 2.5%
Switzerland 3,339,441 166,554,535 7.2% 5.7%
United Kingdom 76,918,642 501,226,739 21.6% 14.5%
Other 8,759,021 135,087,720 5.8% 7.8%
Total Europe 100,298,690 1,246,646,468 53.8% 45.5%
Grand Total 266,651,633 $ 2,318,222,672 100.0% 100.0%
A complete list of the portfolio holdings is available at the pension fund office.

Investments 63
toP 10 internationaL equity hoLdings
HoldIng
numBer oF sHAres mArket vAlue
PerCent oF totAl
Nestle (Switzerland) 524,710 $ 32,560,686 1.4%
Reckitt Benckiser Group (United Kingdom) 525,925 29,045,513 1.3%
British American Tobacco (United Kingdom) 2,650,707 26,389,508 1.1%
HSBC Holdings (United Kingdom) 601,884 26,316,492 1.1%
Novartis (Switzerland) 415,188 25,394,515 1.1%
Prudential (United Kingdom) 2,120,851 24,515,427 1.1%
BHP Billiton LTD ( United Kingdom) 585,357 23,042,950 1.0%
Sanofi S.A. (France) 281,732 22,645,530 1.0%
Diageo PLC (United Kingdom) 1,107,195 22,628,164 1.0%
U.S. Bancorp (Switzerland) 1,166,894 21,245,233 11.0%
Total Top 10 International Equity 9,980,443 $ 253,784,018 10.9%
Grand Total 266,651,633 $ $2,318,222,672 100.0%
A complete list of the portfolio holdings is available at the pension fund office.

Investments 64
Fixed Income Summaryas of June 30, 2011
fixed income hoLdings
Asset CAtegory PAr vAlue
mArket vAlue
PerCent oF totAl
BArClAys’ AggregAte Bond Index AlloCAtIon
Government/Government Agency $ 776,491,990 $ 825,408,033 45.5% 47.0%
Corporates 533,253,240 495,598,259 27.3% 27.3%
Mortgage Backed Securities 300,515,246 306,075,630 16.9% 16.9%
Non-Corporate 36,728,764 10,711,851 0.6% 0.6%
Cash & Short Term Investments 106,216,758 106,211,993 5.9% 5.8%
Asset Backed Securities 30,700,494 25,534,607 1.4% 1.4%
Commercial Mortgage-Backed 17,700,797 18,613,204 1.0% 1.0%
Other 61,380,027 29,280,383 1.5% 0.0%
Grand Total $ 1,862,987,316 $ 1,817,433,960 100.0% 100.0%

Investments 65
Public REITs Summaryas of June 30, 2011
PubLic reits hoLdings
ProPerty tyPe
numBer oF sHAres
mArket vAlue
PerCent oF totAl
nAreIt ProPerty
Index AlloCAtIon
Diversified 6,969,423 $ 51,096,881 17.1% 6.2%
Retail REITs 2,995,121 45,924,240 15.4% 11.4%
Specialized REITs 1,093,787 26,842,238 9.0% 13.1%
Residential REITs 470,314 25,699,644 8.6% 16.6%
Office REITs 1,131,687 19,445,880 6.5% 14.2%
Real Estate Operating Companies 3,219,263 17,564,179 5.9% 5.0%
Real Estate Development 4,769,763 8,747,643 2.9% 2.6%
Industrial REITs 641,392 5,235,896 1.8% 5.4%
Hotels, Resorts, and Cruise Lines 129,836 6,411,635 2.1% 6.8%
Mortgage REITs 33,470 632,053 0.2% 0.9%
Health Care Facilities 33,189 462,200 0.2% 13.3%
Commingled REITs/Other 8,619,051 90,845,260 30.3% 4.5%
Grand Total 30,106,296 $ 298,907,749 100.0% 100.0%
toP 10 PubLic reits hoLdings
HoldIngs
numBer oF sHAres
mArket vAlue
PerCent oF totAl
Sun Hung KAI Properties 554,708 $ 8,076,905 2.7%
Mitsubishi Estate Co. 291,000 5,066,196 1.7%
Starwood Hotels & Resorts Worldwide Inc. 85,546 4,793,998 1.6%
Hong Kong Land HLD 651,000 4,635,120 1.6%
Mitsui Fudosan Co. Ltd. 243,000 4,146,285 1.4%
Wharf (HLDGS) 454,426 3,156,527 1.1%
China Overseas Land & Investment 1,442,880 3,092,978 1.0%
Sumitomo Realty & Development 129,000 2,857,615 1.0%
Brookfield Office Properties Inc. 143,298 2,762,809 0.9%
China Resources Land Ltd. 1,274,000 2,339,316 0.8%
Total Top 10 Public REITs 5,268,858 $ 40,927,749 13.8%
Grand Total 30,106,296 $ 298,907,749 100.0%
A complete list of the portfolio holdings is available at the pension fund office.

66 Investments
Private Equity Summaryas of June 30, 2011
Private equity hoLdings
desCrIPtIon
numBer oF sHAres
mArket vAlue
PerCent oF totAl
Adams Street 71,655,484 $ 75,273,728 23.6%
Harbourvest 42,391,001 49,329,917 15.4%
Hispania Partners 5,784,578 3,661,323 1.1%
Hudson Realty 17,000,000 16,742,994 5.2%
ICV Capital Partners 5,730,958 6,232,784 2.0%
M2 Private Equity 5,649,581 5,978,195 1.9%
Mesirow Capital 62,438,189 89,281,993 28.0%
Muller and Monroe 15,664,023 13,928,945 4.4%
Palladium Partners 4,365,133 5,672,642 1.8%
Pantheon 44,362,703 40,984,115 12.8%
Pharos Capital 5,316,511 8,075,181 2.5%
Syncom 5,747,756 4,153,413 1.3%
Grand Total 286,105,917 $ 319,315,230 100.0%

Investments 67
Infrastructure Summaryas of June 30, 2011
infrastructure hoLdings
desCrIPtIon
numBer oF sHAres
mArket vAlue
PerCent oF totAl
JP Morgan 170,342,297 $ 150,956,188 54.7%
Macquarie 88,490,325 124,862,700 45.3%
Grand Total 258,832,622 $ 275,818,888 100.0%
A complete list of the portfolio holdings is available at the pension fund office.
Hedge Fund Summaryas of June 30, 2011
hedge fund hoLdings
desCrIPtIon
numBer oF sHAres
mArket vAlue
PerCent oF totAl
K2 Advisors 70,000 $ 75,428,284 42.4%
Mesirow-Absolute Return 70,000 76,067,745 42.8%
Pluscios 25,000 26,248,748 14.8%
Grand Total 165,000 $ 177,744,777 100.0%

Investments 68
Real Estate Summaryas of June 30, 2011
reaL estate hoLdings
desCrIPtIon
numBer oF sHAres
mArket vAlue
PerCent oF totAl
Capri Capital 23,600,000 $ 5,567,969 0.8%
CB Richard Ellis 8,139,444 7,608,813 1.1%
DV Urban 23,747,672 11,457,639 1.7%
Europa 10,413,360 13,748,009 2.0%
Fortress Japan 1,278,995,845 18,323,170 2.7%
Fremont Realty 25,744,681 18,493,816 2.7%
Intercontinental 35,879,397 26,128,125 3.8%
JP Morgan 91,290 143,702,766 20.9%
LaSalle Investment 23,519 24,655,230 3.6%
Merrill Lynch 31,762,675 18,050,248 2.6%
Morgan Stanley 7,580,841 1,586,410 0.2%
Olympus 10,793,740 728,381 0.2%
Prudential Investment Management 6,162 144,152,889 21.0%
RREEF Global 30,000,000 22,971,642 3.3%
UBS Realty Investors 18,777 146,059,467 21.3%
Urban America 23,222,737 14,064,562 2.0%
Walton Street 89,921,644 69,433,066 10.1%
Grand Total 1,599,941,784 $ 686,732,202 100.0%
A complete list of the portfolio holdings is available at the pension fund office.

Investments 69
Asset CAtegory
mArket vAlue 6/30/2011
PerCentAge oF PortFolIo
Fy 2011 mAnAger Fees
equItyDomestic Equity
Ariel Capital Management $ 123,934,256 1.2% $ 398,483
Attucks Asset Management 184,810,061 1.8% 1,115,289
Channing Capital Management 77,724,947 0.7% 425,091
Credo Capital Management 80,078,350 0.8% 417,051
Dimensional Fund Advisors 122,618,498 1.2% 609,287
Harris Investment 279,791,621 2.7% 616,811
Holland Capital Management 201,342,863 1.9% 634,206
Lombardia Capital Partners 241,057,046 2.3% 660,965
New Amsterdam Partners 192,723,296 1.8% 489,755
Northern Trust Global Investments 861,466,732 8.2% 253,202
Piedmont Investment 144,116,127 1.4% 464,260
Progress Investment Managers 187,145,579 1.8% 1,084,276
Rhumbline Advisors 1,094,029,185 10.5% 125,177
Waddell and Reed 177,704,715 1.7% 316,235
Zevenbergen Capital Management 88,833,626 0.8% 330,674
Total 4,057,376,902 38.8% 7,940,762
International Equity
EARNEST Partners 210,224,764 2.0% 895,815
Lazard Asset Management 538,671,451 5.2% 808,390
Leading Edge Investment Advisors 101,895,565 1.0% 832,081
MFS Institutional Advisors 418,628,056 4.0% 1,461,536
Morgan Stanley Investment Management 468,445,205 4.5% 1,957,287
Northern Trust Global Investments 6,605,480 0.1% 679William Blair 573,752,151 5.5% 3,323,490
Total 2,318,222,672 22.3% 9,279,278
Public REITs
Adelante Capital Management 62,807,143 0.6% 330,060
Morgan Stanley Investment Management 145,281,362 1.4% 841,392Urdang Investment Management 90,819,244 0.9% 519,784
Total 298,907,749 2.9% 1,691,236
FIxed InCome
Garcia, Hamilton 74,970,214 0.7% 115,436
LM Capital Management 124,417,785 1.2% 218,646
Northern Trust Global Investments 982,079,284 9.4% 102,119
Pugh Capital Management 75,754,818 0.7% 121,173
Taplin, Canida & Habatch 121,536,310 1.2% 202,003Western Asset Management Company 438,675,549 4.2% 808,630
Total 1,817,433,960 17.4% 1,568,007
Hedge Funds
K2 Advisors 75,428,284 0.7% 798,638
Mesirow-Absolute Return 76,067,745 0.7% 820,630Pluscious Management 26,248,748 0.3% 0
Total 177,744,777 1.7% 1,619,268Continued on page 70
Manager Analysis

Investments 70
Asset CAtegory
mArket vAlue 6/30/2011
PerCentAge oF PortFolIo
Fy 2011 mAnAger Fees
PrIvAte equIty
Adams Street 75,289,912 0.7% 1,235,539
Harbourvest 49,329,917 0.5% 729,000
Hispania Partners 3,661,323 0.0% 239,782
Hudson 16,531,698 0.2% 208,191
ICV Capital Partners 6,394,595 0.1% 117,786
M2 Private Equity 5,978,195 0.1% 100,000
Mesirow Capital 89,281,993 0.9% 1,816,099
Muller and Monroe 13,928,945 0.1% 103,159
Palladium Partners 5,705,937 0.1% 128,503
Pantheon 40,984,120 0.4% 698,175
Pharos Capital 8,075,181 0.1% 54,768
Syncom 4,153,414 0.0% 161,281
Total 319,315,230 3.2% 5,592,283
InFrAstruCture
JP Morgan 150,956,188 1.4% 2,643,061
Macquarie 124,862,700 1.2% 1,383,840
Total 275,818,888 2.6% 4,026,901
reAl estAte
Capri Capital 5,567,972 0.1% 121,797
CB Richard Ellis 7,608,813 0.1% 103,813
DV Urban 11,457,639 0.1% 265,159
Europa 13,750,471 0.1% 649,879
Fortress Japan 18,279,424 0.2% 101,115
Franklin Templeton – 0.0% 136,957
Fremont Realty 18,493,816 0.2% 345,091
Intercontinental 26,128,125 0.2% 402,496
JP Morgan Strategic 143,702,746 1.4% 1,200,117
LaSalle Investment Management 24,655,270 0.2% 85,656
Merrill Lynch 18,050,248 0.2% 1,116,827
Morgan Stanley 1,586,410 0.0% 36,016
Olympus 728,381 0.0% –
Prudential Investment Management 144,152,889 1.4% 1,385,586
RREEF Global 23,125,724 0.2% 286,346
UBS Realty Investors 145,946,646 1.4% 1,295,115
Urban America 14,064,562 0.1% 290,284
Walton Street 69,433,066 0.7% 1,090,253
Total 686,732,202 6.6% 8,912,507
CAsH And equIvAlents
Northern Trust 505,359,738 4.8% –
grAnd totAl $ 10,456,912,118 100.0% $ 40,630,242
Manager Analysis continued from page 69

Investments 71
Broker Commission ReportDomestic Agency Trades
for the Year Ended June 30, 2011
Broker nAme
numBer oF sHAres trAded
CommIssIon Amount
CommIssIon Per sHAre
Loop Capital Markets, LLC 10,551,708 $ 295,387 $ 0.03 Cabrera Capital Markets 6,668,232 232,429 0.03 M. R. Beal & Company 5,236,428 180,789 0.03 BNY Brokerage 3,228,117 129,243 0.04 M. Ramsey King Securities 2,567,777 89,063 0.03 Cheevers & Co 2,771,100 84,371 0.03 Guzman & Company 685,738 82,704 0.12 International Strategy & Investment Group 1,386,899 67,308 0.05 Williams Capital Group 1,751,963 59,244 0.03 Gardner Rich & Company 1,715,100 56,025 0.03 J.P. Morgan Securities 3,075,416 55,752 0.02 Blaylock, Robert Van Securities 1,611,221 55,303 0.03 Pacific American Securities 1,507,359 49,090 0.03 Jefferies & Co 840,111 37,238 0.04 Goldman, Sachs and Co. 1,408,693 35,670 0.03 Citigroup Global Markets 78,691 35,177 0.45 HSBC Securties Ltd. 1,567,616 31,352 0.02 BAC Merrill Lynch 860,277 28,044 0.03 Barclays Corp. 2,744,698 27,874 0.01 Liquidnet Ltd. 1,083,358 27,221 0.03 UBS Securities LLC. 1,129,313 27,078 0.02 Credit Lyonnais Securities 1,617,227 26,712 0.02 Castleoak Securities 880,018 26,365 0.03 Capital Institutional Services, Inc. 540,088 25,601 0.05 Instinet 996,832 25,531 0.03 Island Trading 1,228,582 23,605 0.02 Deutsche Securities Inc 686,386 22,730 0.03 Pulse Trading 639,647 22,333 0.03 William Blair & Company 470,988 18,671 0.04 Pershing LLC. 925,380 18,669 0.02 Robert W Baird & Co 433,462 17,340 0.04 Stifel, Nicolaus & Co. Inc. 428,787 17,079 0.04 Sanford Bernstein & Co 538,407 15,958 0.03 Piper Jaffray 460,841 14,297 0.03 Bank of America 426,486 12,848 0.03 Morgan Stanley & Co Inc. 684,504 12,617 0.02 Divine Capital Markets 296,210 11,049 0.04 Citation Group 258,395 10,161 0.04 Jones & Associates 230,258 9,542 0.04 Melvin Securities 316,217 9,446 0.03 Mischler Financial 327,312 9,282 0.03 Investment Technology Group, Inc. 1,502,732 9,160 0.01 Cantor Fitzgerald 316,156 9,018 0.03 BOE Securities 240,479 8,640 0.04 North South Capital 194,062 7,441 0.04 OTHER (87 Brokers) 6,561,002 158,083 0.02
Grand Total 73,670,273 $ 2,228,540 $ 0.03

Investments 72
Broker Commission ReportMWDBE Domestic Equity Trades
for the Year Ending June 30, 2011
Broker nAme
numBer oF sHAres trAded
CommIssIon Amount
CommIssIon Per sHAre
Loop Capital Markets, LLC 10,551,708 $ $295,387 $ 0.03
Cabrera Capital 6,668,232 232,429 0.03
M. R. Beal & Company 5,236,428 180,789 0.03
M. Ramsey King Securities 2,567,777 89,063 0.03
Cheevers & Co 2,771,100 84,371 0.03
Guzman & Company 685,738 82,704 0.12
Williams Capital Group 1,751,963 59,244 0.03
Gardner Rich & Company 1,715,100 56,025 0.03
Blaylock, Robert Van Securities 1,611,221 55,303 0.03
Castleoak Securities 880,018 26,365 0.03
Melvin Securities 316,217 9,446 0.03
Mischler Financial 327,312 9,282 0.03
North South Capital 194,062 7,441 0.04
Podesta & Co. 74,280 2,280 0.03
Greentree Brokerage 68,812 1,088 0.02
Total Directed Domestic Commission 35,419,968 $ 1,191,217 $ 0.03
Grand Total 73,670,273 $ 2,228,540 $ 0.03

Investments 73
Broker Commission ReportInternational Agency Trades
for the Year Ended June 30, 2011
Broker nAme
numBer oF sHAres trAded
CommIssIon Amount
CommIssIon Per sHAre
Loop Capital Markets, LLC 30,582,556 $ 332,469 $ 0.01 Cabrera Capital 29,149,159 261,111 0.01 Credit Suisse 15,812,639 175,219 0.01 Gardner Rich & Company 2,783,596 96,085 0.03 J.P. Morgan Securities 28,989,690 87,361 0.00 Morgan Stanley & Co Inc. 13,263,207 84,464 0.01 Nomura Securities 4,516,377 75,768 0.02 Liquidnet Ltd. 14,118,967 72,343 0.01 UBS Securities LLC 8,100,263 71,131 0.01 Deutsche Securities Inc 5,190,899 65,844 0.01 MaCquarie Equities Limited 6,092,625 64,097 0.01 Barclays Corp. 2,444,884 61,702 0.03 ABG Securities 2,608,435 54,945 0.02 Merrill Lynch 2,702,738 52,408 0.02 BAC Merrill Lynch 6,899,269 44,892 0.01 Citigroup Global Markets 2,664,776 40,841 0.02 Goldman, Sachs and Co. 6,344,790 40,628 0.01 CLSA Securities 4,799,146 34,370 0.01 Melvin & Company 1,603,409 32,725 0.02 M. Ramsey King Securities 3,285,246 29,139 0.01 M.R. Beal & Company 2,240,644 26,605 0.01 Collins Stewart 451,466 25,018 0.06 Daiwa Securities 1,900,247 19,068 0.01 RBS Securities 1,004,185 18,677 0.02 BNP Paribas 3,480,743 15,783 0.00 Redburn Partners LLC 1,344,689 15,309 0.01 Carnegie Inc. 412,567 14,785 0.04 Numis Securities 2,034,737 14,499 0.01 Deutsche Bank 1,123,955 14,492 0.01 Exane Inc. 281,780 14,354 0.05 Credit Lyonnais Securities 591,346 12,877 0.02 HSBC Securties Ltd. 4,071,895 12,356 0.00 Helvea 235,677 11,828 0.05 Sanford Bernstein 584,101 10,833 0.02 China International Capital Corp. 3,088,111 10,596 0.00 Royal Bank of Canada 1,310,445 10,049 0.01 Royal Bank of Scotland 176,411 7,710 0.04 Divine Capital 418,830 7,697 0.02 Investec 201,984 7,525 0.04 Cheuvreux 187,757 7,291 0.04 Oriel Securities Ltd. 569,700 7,048 0.01 Jefferies & Co. 319,166 6,687 0.02 BMO Capital Markets 135,999 5,576 0.04 Berenberg Bank 54,690 5,510 0.10 Canaccord Capital Corp. 952,536 5,366 0.01 OTHER (57 Brokers) 12,272,444 85,610 0.01
Grand Total 231,398,776 $ 2,170,691 $ 0.01

Investments 74 Investments
Broker Commission ReportMWDBE International Equity Trades for the Year Ending June 30, 2011
Broker nAme
numBer oF sHAres trAded
CommIssIon Amount
CommIssIon Per sHAre
Loop Capital Markets, LLC 31,430,337 $ 326,738 $ 0.01
Cabrera Capital 29,952,785 275,915 0.01
Gardner Rich & Company 3,264,410 113,312 0.03
M.R. Beal & Company 3,476,381 46,906 0.01
Melvin Securities 1,603,409 32,725 0.02
M. Ramsey King Securities 3,285,246 29,139 0.01
Greentree Brokerage 29,450 454 0.02
Cheevers & Co 1,500 260 0.17
Total Directed International Commission 73,043,518 $ 825,449 $ 0.01
Grand Total 231,398,776 $ 2,170,691 $ 0.01

Investments 75 Investments
investment authority iLLinois Pension code
SECTION 5/17-146. To Make InvestmentsTo make investments. To invest the monies of the Fund, subject to the requirements and restrictions set forth in this Article and in Sections 1-109, 1-109.1, 1-109.2, 1-110, 1-111, 1-114 and 1-115. No bank or savings and loan association shall receive investment funds as permitted by this Section, unless it has com-plied with the requirements established pursuant to Section 6 of the Public Funds Investment Act. Those requirements shall be applicable only at the time of investment and shall not require the liquidation of any investment at any time.
The Board of Trustees shall have the authority to enter into any agreements and to execute any documents that it determines to be necessary to complete any investment transaction.
All investments shall be clearly held and accounted for to indicate ownership by the Fund. The Board of Trustees may direct the registration of securities or the holding of interests in real property in the name of the Fund or in the name of a nominee created for the express purpose of registering securities or holding interests in real property by a national or state bank or trust company authorized to conduct a trust business in the State of Illinois. The Board of Trustees may hold title to interests in real property in the name of the Fund or in the name of a title holding corporation created for the express purpose of holding title to interests in real property.
Investments shall be carried at cost or at a value determined in accordance with generally accepted accounting principles and accounting procedures approved by the Board of Trustees.
The value of investments held by the Fund in one or more commingled investment accounts shall be determined in accordance with generally accepted accounting principles.
The Board of Trustees of any Fund established under this Article may not transfer its investment authority, nor transfer the assets of the Fund to any other person or entity for the purpose of consolidating or merging its assets and management with any other pension fund or public investment authority, unless the Board of Trustees resolution authorizing such transfer is submitted for approval to the contributors and pensioners of the Fund at elections held not less than 30 days after the adoption of such resolution by the Board of Trustees, and such resolution is approved by a majority of the votes cast on the question in both the contributors election and the pensioners election. The election procedures and qualifications governing the election of trustees shall govern the submission of resolutions for approval under this paragraph, insofar as they may be made applicable.
SECTION 5/17-146.2. To Lend SecuritiesTo lend securities. The Board of Trustees may lend securities owned by the Fund to a borrower upon such written terms and conditions as may be mutually agreed. The agreement shall provide that during the period of the loan the Fund (or the custodian of the Fund, or agent thereof, as applicable) shall retain the right to receive or collect from the borrower all dividends, interest and distributions to which the Fund would have otherwise been entitled.
The borrower shall deposit with the Fund collateral for the loan equal to the market value of the securities at the time the loan is made, and shall increase the amount of collateral if the Board of Trustees requests an additional amount because of subsequent increased market value of the securities. The Board of Trustees may accept from the borrower cash collateral or collateral consisting of assets described in Section 1-113 of this Act. To the extent that the Fund participates in a securities lending program established and maintained by (1) a national or State bank which is authorized to do business in the State of Illinois, or (2) an investment manager, the Board of Trustees may accept collateral consisting of an undivided interest in a pool of commingled collateral that has been established by the bank or investment manager for the purpose of pooling collateral received for the loans of securities owned by substantially all of the participants in such bank’s or investment manager’s securities lending program. Nothing in Sections 1-109, 1-110 or 1-113 of this Act shall be construed to prohibit the Fund’s lending of securities in accordance with this Section.
SECTION 5/17-147. Custody of Fund-Bonds-Legal ProceedingsCustody of Fund-Bonds-Legal proceedings. The city treasurer, ex-officio, shall be the custodian of the Fund, and shall secure and safely keep it, subject to the control and direction of the Board of Trustees. He shall keep his books and accounts concerning the Fund in the manner prescribed by the Board of Trustees. The books and accounts shall always be subject to the inspection of the Board of Trustees or any member thereof. The city treasurer shall be liable on his official bond for the proper performance of his duties and the conservation of the Fund.
Payments from the Fund shall be made upon warrants signed by the president and the secretary of the Board of Education, the president of the Board of Trustees, and countersigned by the executive director or by such person as the Board of Trustees may designate from time to time by appropriate resolution.
Neither the treasurer nor any other officer having the custody of the Fund is entitled to retain any interest accruing thereon, but such interest shall accrue and inure to the benefit of such Fund, become a part thereof, subject to the purposes of this Article.
Any legal proceedings necessary for the enforcement of the provisions of this Article shall be brought by and in the name of the Board of Trustees of the Fund.

Actuarial 7676 Actuarial

Actuarial 7777 Actuarial
A c t ua r i a lThis section includes the actuarial reports and summarizes actuarial
liability and unfunded actuarial liability. Schedules of data
summarizing information about members and beneficiaries, actuarial
assumptions, and a glossary of terms are also included.

Actuarial 78

Actuarial 79
actuariaL rePort
a. PurPose and summary — Pension fund
We have carried out an actuarial valuation of the Public School Teachers’ Pension and Retirement Fund of Chicago as of June 30, 2011. The purpose of the valuation was to determine the financial position and annual required contribution of the Fund for reporting purposes pursuant to GASB Statement No. 25. According to GASB Statement No. 25, postemployment healthcare benefits provided by the fund are not included in this valuation. Pursuant to GASB Statement No. 43, postemployment health care benefits were valued separately and the results of that valuation are included in a separate report.
This report is intended to present the results of the valuation of the pension benefits provided under the fund. The results of the valuation are summarized below:
1. Total Actuarial Liability $ 16,940,626,445
2. Actuarial Value of Assets 10,109,314,922
3. Unfunded Actuarial Liability 6,831,311,523
4. Funded Ratio 59.7%
5. Employer's Normal Cost for FY 12 as a percent of payroll 5.91%
6. Annual Required Contribution for FY 12 Based on GASB Statement No. 25 510,101,466
b. data used for the Pension fund vaLuation
ParticiPant data. The participant data required to carry out the valuation was supplied by the Fund. The membership of the Fund as of June 30, 2011, on which the valuation was based, is summarized in Exhibit 1. It can be seen that there were 30,133 active contributors, 24,034 pensioners, and 4,253 vested terminated members included in the valuation. The total active payroll as of June 30, 2011, was $2,090,131,858.
Actuarial

Actuarial 80 Actuarial
exhibit 1 summAry oF memBersHIP dAtA
1. Number of Members
(a) Active Members
(i) Vested Employees 21,027
(ii) Non-vested Employees 9,106
Total Active Members 30,133
(b) Members Receiving
(i) Retirement Pensions 21,977
(ii) Disability Pensions 465
(iii) Survivor Pensions 2,757
Total Pensioners 25,199
(c) Vested Terminated Members 4,253
Total 59,585
2. Total Annual Salaries $ 2,090,131,858
Average Salary 69,364
3. Total Accumulated Contributions of Active Members $ 1,503,911,310
4. Annual Benefit Payments Currently Being Made
(a) Retirement Pensions $ 986,884,026
(b) Disability Pensions 14,101,691
(c) Survivor Pensions 46,887,342
Total Pensions $1,047,873,059
An age and service distribution for active members is provided in Exhibit 2.

Actuarial 81 Actuarial
exhibit 2 2011 Age And servICe dIstrIButIon oF ACtIve memBers
numBer oF memBers And AverAge sAlArIes By Age And servICe grouPIng (mAle And FemAle ComBIned)
y e A r s o F s e r v I C e
A g e <1 1-4 5- 9 10-14 15-19 20-24 25-29 30-34 35+ totAl
Under 25 260 546 0 0 0 0 0 0 0 806
Avg. Salary $18,464 45,249 0 0 0 0 0 0 0 $36,608
25-29 480 3,011 794 1 0 0 0 0 0 4,286
Avg. Salary $20,634 50,395 62,397 77,287 0 0 0 0 0 $49,291
30-34 234 1,747 2,463 451 0 0 0 0 0 4,895
Avg. Salary $22,910 52,724 66,818 79,118 0 0 0 0 0 $60,822
35-39 133 833 1,433 1,416 289 0 0 0 0 4,104
Avg. Salary $23,133 52,834 67,950 82,018 90,635 0 0 0 0 $69,881
40-44 99 533 795 1,015 1,003 163 0 0 0 3,608
Avg. Salary $20,256 53,017 67,673 81,604 89,491 95,607 0 0 0 $75,453
45-49 70 312 532 568 707 485 92 0 0 2,766
Avg. Salary $16,924 48,577 69,457 79,300 86,286 90,269 95,520 0 0 $76,611
50-54 46 279 445 529 642 470 467 127 1 3,006
Avg. Salary $14,738 46,007 65,065 78,324 85,058 89,235 91,529 95,422 85,750 $78,309
55-59 54 221 355 416 580 550 462 531 203 3,372
Avg. Salary $14,384 41,943 60,636 78,096 84,169 87,881 92,645 98,424 102,772 $82,189
60-64 37 140 215 284 433 434 302 276 398 2,519
Avg. Salary $10,043 34,248 53,259 72,993 84,739 89,334 91,173 96,049 100,082 $82,051
65-69 9 36 57 60 116 95 80 60 99 612
Avg. Salary $5,236 25,172 62,421 74,592 85,145 93,806 91,427 91,219 101,605 $82,715
70+ 6 22 17 15 19 26 10 11 33 159
Avg. Salary $7,440 11,023 29,109 54,525 75,387 94,033 88,520 95,391 104,550 $68,313
Members 1,428 7,680 7,106 4,755 3,789 2,223 1,413 1,005 734 30,133
Avg. Salary $19,783 $50,003 $65,891 $79,855 $86,668 $89,864 $92,051 $96,929 $101,213 $69,364

Actuarial 82 Actuarial
assets. In November of 1994, the Governmental Accounting Standards Board (GASB) issued GASB Statement No. 25, which establishes standards of financial reporting for governmental pension plans. The statement is effective for periods beginning after June 15, 1996. Under GASB Statement No. 25, the actuarial value of assets to be used for determining a plan’s funded status and annual required contribution needs to be market related. In determining the actuarial value of assets, smoothing changes in the market value of assets over a period of three to five years is considered to be appropriate.
The asset values used for the valuation were based on the asset information contained in the audited financial statements for the year ending June 30, 2011, prepared by the Fund. The actuarial value of assets was determined by smoothing unexpected gains or losses over a period of 4 years. The resulting actuarial value of assets is $10,109,314,922. The development of this actuarial value of assets is outlined in Exhibit 3. As of June 30, 2011, the market value of the assets of the fund for pension benefits amounted to $10,312,762,164.
exhibit 3 ACtuArIAl vAlue oF Assets
A. Development of Investment Gain/(Loss) for Year Ending June 30, 2011
1. Actuarial Value of Assets as of 6/30/10 $ 10,952,274,725
2. Employer Contributions and Miscellaneous Income 218,983,962
3. Employee Contributions 185,882,636
4. Expenses 1,166,400,567
5. Expected Investment Income 846,306,631
6. Actual Investment Income 2,123,292,641
7. Investment Gain/(Loss) (6 – 5) $ 1,276,986,010
B. Development of Actuarial Value of Assets
8. Expected Value of Assets as of June 30, 2011 (1 + 2 + 3 – 4 + 5) $ 11,037,047,387
9. One-fourth of Investment Gain/(Loss) for Year Ending June 30, 2008 (414,651,992)
10. One-fourth of Investment Gain/(Loss) for Year Ending June 30, 2009 (852,439,981)
11. One-fourth of Investment Gain/(Loss) for Year Ending June 30, 2010 51,437,577
12. One-fourth of Investment Gain/(Loss) for Year Ending June 30, 2011 319,246,503
13. Total Actuarial Value of Assets as of 6-30-11 (8 + 9 + 10 + 11 + 12) $ 10,140,639,494
14. Assets For Retiree Health Insurance Benefits 31,324,572
15. Actuarial Value of Assets for Pension Benefits (13 – 14) $ 10,109,314,922
c. fund Provisions
Our valuation was based on the provisions of the Fund in effect as of June 30, 2011, as provided in Article 17 of the Illinois Pension Code. A summary of the principal provisions of the Fund on which the valuation was based is provided in Appendix 2.

Actuarial 83 Actuarial
d. actuariaL assumPtions and cost method
The actuarial assumptions used for the June 30, 2011, valuation are the same as the assumptions that were used for the June 30, 2010, valuation. The actuarial assumptions used for the June 30, 2011, valuation are outlined in Appendix 1. In our opinion, the actuarial assumptions used for the valuation are reasonable, in the aggregate, taking into account Fund experience and future expectations and represent our best estimate of anticipated experience.
The projected unit credit actuarial cost method was used for the June 30, 2011, actuarial valuation. This is the same actuarial cost method that was used for the June 30, 2010, valuation.
e. actuariaL LiabiLity
The actuarial liability as determined under the valuation for the various classes of members is summarized in Exhibit 4. The total actuarial liability is then compared with the actuarial value of assets in order to arrive at the unfunded actuarial liability.
As of June 30, 2011, the total actuarial liability for pension benefits provided under the fund is $16,940,626,445, the actuarial value of assets is $10,109,314,922, and the unfunded liability is $6,831,311,523. The ratio of the actuarial value of assets to the actuarial liability, or funded ratio, is 59.7%.
exhibit 4 ACtuArIAl lIABIlIty As oF June 30, 2011
1. Actuarial Liability for Active Members
(a) Basic Retirement Annuity $ 3,306,698,997
(b) Post Retirement Increase 899,008,877
(c) Lump Sum Death Benefit 9,809,079
(d) Survivor’s Pension 322,620,559
(e) Disability Pension 94,232,942
(f) Withdrawal Benefit 269,394,051
Total $ 4,901,764,505
2. Actuarial Liability for Members Receiving Benefits
(a) Retirement Pensions $ 11,232,632,560
(b) Survivor Pensions 420,495,560
(c) Disability Pensions 138,410,357
Total $ 11,791,538,477
3. Actuarial Liability for Inactive Members 247,323,463
4. Total Actuarial Liability $ 16,940,626,445
5. Actuarial Value of Assets 10,109,314,922
6. Unfunded Actuarial Liability $ 6,831,311,523
7. Funded Ratio 59.7%

Actuarial 84 Actuarial
f. emPLoyer’s normaL cost
The employer's share of the normal cost for pension benefits for the year beginning July 1, 2011, is developed in Exhibit 5. The total normal cost is $299,247,550, employee contributions are estimated to be $175,805,483, resulting in the employer's share of the normal cost of $123,442,067.
Based on a payroll of $2,090,131,858 as of June 30, 2011, the employer's share of the normal cost can be expressed as 5.91% of payroll.
exhibit 5 emPloyer’s normAl Cost For yeAr BegInnIng July 1, 2011
Dollar Amount Percent of Payroll
1. Basic Retirement Pension $ 183,648,711 8.79%
2. Post Retirement Increases 49,583,942 2.37
3. Lump Sum Death Benefits 674,199 .03
4. Survivor’s Pension 19,490,522 .93
5. Disability Benefits 7,517,046 .36
6. Withdrawal Benefits 28,899,724 1.39
7. Administrative Expenses 9,433,406 .45
8. Total Normal Cost $ 299,247,550 14.32%
9. Employee Contributions 175,805,483 8.41
10. Employer’s Share of Normal Cost $ 123,442,067 5.91%
Note. The above figures are based on a total active payroll of $2,090,131,858 as of June 30, 2011.
g. emPLoyer contribution requirements for fiscaL year 2013
additionaL state contributions. According to Section 17-127 of the Pension Code, the State shall make additional contributions of .544% of payroll to the Fund to offset a portion of the cost of benefit increases enacted under Public Act 90-582, except that no additional contributions are required if for the previous fiscal year the ratio of the fund’s assets to total actuarial liabilities was at least 90%.
Based on the June 30, 2011, actuarial valuation, the ratio of the actuarial value of assets to total actuarial liabilities, or funded ratio, amounts to 59.9%. Therefore, additional State contributions will be required for Fiscal Year 2013. The total payroll for FY 2013 is projected to be $2,149,987,987. This total payroll includes employee contributions of 7% of salary paid by the Board of Education. Excluding these employee contributions from payroll results in an adjusted projected payroll of $2,009,334,567. Based on this adjusted projected payroll for Fiscal Year 2013, we have determined the additional State contributions under Section 17-127 of the Pension Code to be $10,931,000.

Actuarial 85 Actuarial
additionaL board of education contributions. According to Section 17-127.2 of the Pension Code, the Board of Education shall make additional contributions of .58% of each teacher’s salary to the Fund to offset a portion of the cost of benefit increases enacted under Public Act 90-582, except that no additional contributions are required if for the previous fiscal year the ratio of the fund’s assets to total actuarial liabilities was at least 90%.
As the funded ratio as of June 30, 2011, is 59.9%, additional Board of Education contributions will be required for Fiscal Year 2010. Based on adjusted projected payroll of $2,009,334,567 for Fiscal Year 2013, we have determined the additional Board of Education contribution under Section 17-127.2 of the Pension Code to be $11,654,000.
board of education required contribution. Senate Bill 1946, which was signed into law on April 14, 2010, as Public Act 96-0889, revised the funding provisions that had previously been in effect. Public Act 96-0889 specifies the Board of Education’s required contribution for Fiscal Years 2011, 2012, and 2013 as a fixed dollar amount. The amount specified for Fiscal Year 2013 is $196,000,000. Therefore, pursuant to Public Act 96-0889, the Board of Education’s required contribution for Fiscal Year 2013 is $196,000,000.
For Fiscal Years 2014 through 2059, the Board of Education is to make annual contributions calculated as a level percent of payroll sufficient to bring the total assets of the fund up to 90% of the total actuarial liabilities of the fund by the end of Fiscal year 2059.
h. Annual Required Contribution for GASB Statement No. 25
GASB Statement No. 25 requires the disclosure of the annual required employer contribution (ARC), calculated in accordance with certain parameters. Based on the results of the June 30, 2011, actuarial valuation, we have therefore calculated the annual required contribution for Fiscal Year 2012. In accordance with the parameters prescribed in GASB Statement No. 25, in calculating the annual required contribution, we have used a 30-year level-percent-of-payroll amortization of the unfunded liability. On this basis, the annual required contribution for Fiscal Year 2012 has been determined to be as follows:
Fiscal Year 2012
1. Employer’s normal cost $ 123,442,067
2. Annual amount to amortize the unfunded liability over 30 years as a level percent of payroll 386,659,399
3. Annual required contribution (1 + 2) $ 510,101,466
The funding plan currently in effect does not meet the requirements for amortizing the unfunded liability provided under GASB Statement No. 25. In all other respects, the assumptions and methods used for funding purposes meet the parameters set forth for financial statement disclosure in GASB Statement No. 25.
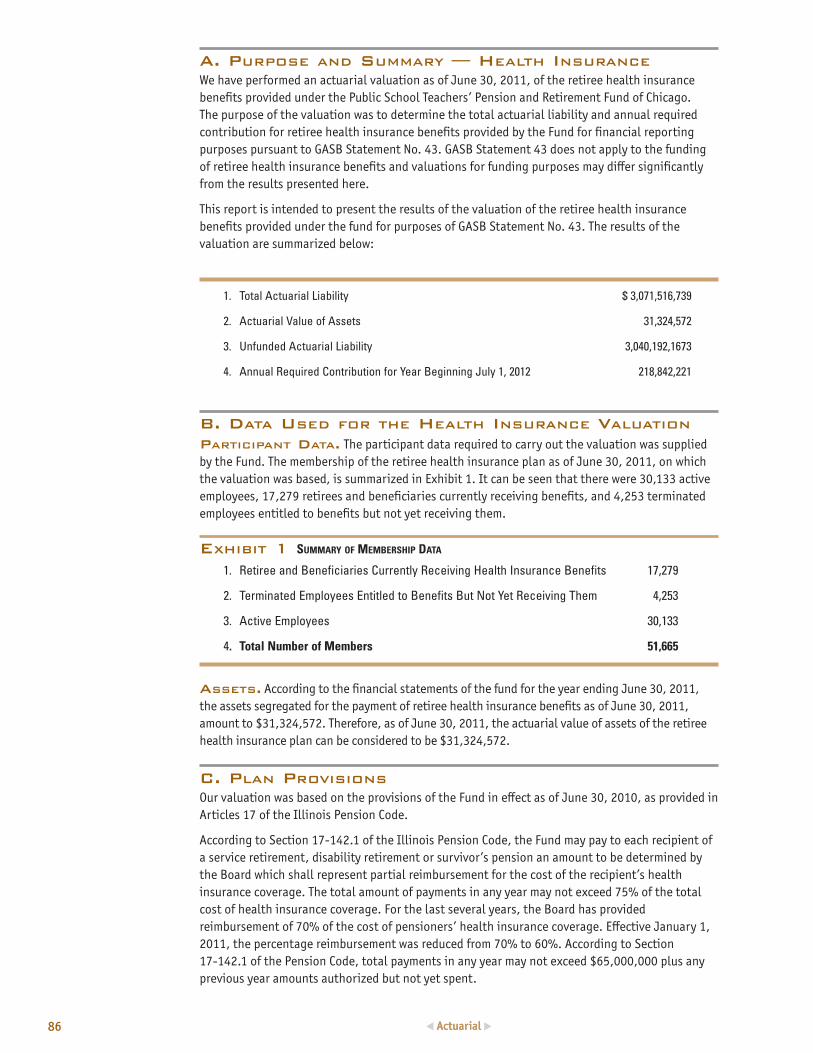
Actuarial 86 Actuarial
a. PurPose and summary — heaLth insurance
We have performed an actuarial valuation as of June 30, 2011, of the retiree health insurance benefits provided under the Public School Teachers’ Pension and Retirement Fund of Chicago. The purpose of the valuation was to determine the total actuarial liability and annual required contribution for retiree health insurance benefits provided by the Fund for financial reporting purposes pursuant to GASB Statement No. 43. GASB Statement 43 does not apply to the funding of retiree health insurance benefits and valuations for funding purposes may differ significantly from the results presented here.
This report is intended to present the results of the valuation of the retiree health insurance benefits provided under the fund for purposes of GASB Statement No. 43. The results of the valuation are summarized below:
1. Total Actuarial Liability $ 3,071,516,739
2. Actuarial Value of Assets 31,324,572
3. Unfunded Actuarial Liability 3,040,192,1673
4. Annual Required Contribution for Year Beginning July 1, 2012 218,842,221
b. data used for the heaLth insurance vaLuation
ParticiPant data. The participant data required to carry out the valuation was supplied by the Fund. The membership of the retiree health insurance plan as of June 30, 2011, on which the valuation was based, is summarized in Exhibit 1. It can be seen that there were 30,133 active employees, 17,279 retirees and beneficiaries currently receiving benefits, and 4,253 terminated employees entitled to benefits but not yet receiving them.
exhibit 1 summAry oF memBersHIP dAtA
1. Retiree and Beneficiaries Currently Receiving Health Insurance Benefits 17,279
2. Terminated Employees Entitled to Benefits But Not Yet Receiving Them 4,253
3. Active Employees 30,133
4. Total Number of Members 51,665
assets. According to the financial statements of the fund for the year ending June 30, 2011, the assets segregated for the payment of retiree health insurance benefits as of June 30, 2011, amount to $31,324,572. Therefore, as of June 30, 2011, the actuarial value of assets of the retiree health insurance plan can be considered to be $31,324,572.
c. PLan Provisions
Our valuation was based on the provisions of the Fund in effect as of June 30, 2010, as provided in Articles 17 of the Illinois Pension Code.
According to Section 17-142.1 of the Illinois Pension Code, the Fund may pay to each recipient of a service retirement, disability retirement or survivor’s pension an amount to be determined by the Board which shall represent partial reimbursement for the cost of the recipient’s health insurance coverage. The total amount of payments in any year may not exceed 75% of the total cost of health insurance coverage. For the last several years, the Board has provided reimbursement of 70% of the cost of pensioners’ health insurance coverage. Effective January 1, 2011, the percentage reimbursement was reduced from 70% to 60%. According to Section 17-142.1 of the Pension Code, total payments in any year may not exceed $65,000,000 plus any previous year amounts authorized but not yet spent.

Actuarial 87 Actuarial
GASB Statement No. 43 provides that the actuarial valuation of a retiree health insurance plan should include all benefits to be provided by the plan to plan members or beneficiaries in accordance with the current substantive plan. GASB has indicated that in addition to the written plan document, other information should also be taken into consideration in determining the benefits to be provided, including an established pattern or practice with regard to the sharing of benefit costs between the employer and plan members.
According to recent discussions with GASB staff, the actuarial valuation of the Chicago Teachers’ Pension Fund Retiree Health Insurance Program for purposes of GASB Statement No. 43 should not take into account the current $65 million maximum on the annual benefits that may be paid from the fund as there has been a history of increases in the dollar maximum.
We have therefore not taken into account the current $65 million maximum on the annual benefits that may be paid from the Fund in performing the June 30, 2011, actuarial valuation.
d. actuariaL assumPtions and cost method
In performing the actuarial valuation of the retiree health insurance program for purposes of GASB Statement No. 43, we used such parameters and assumptions as are prescribed in GASB Statement No. 43 for actuarial valuations of retiree health insurance benefits. These parameters and assumptions are described below:
interest rate assumPtion. Under GASB Statement No. 43, if a retiree health insurance plan is not funded on an actuarial basis, the interest rate assumption is to be based on the investments of the employer. Although some assets are being accumulated for the payment of retiree health insurance benefits, these assets currently represent only 1.0% of the total actuarial liabilities. As governmental employers are able to invest only in short term, fixed income securities, we have used an interest rate assumption of 4.5% in performing the actuarial valuation of the retiree health insurance plan.
medicaL trend rate assumPtion. One of the most important assumptions is the medical trend rate assumption used to increase per member medical costs in future years. The medical trend rate assumption that we have used is 9.0% in 2011, gradually declines to 5.0% by the year 2020 as follows:
y e A r m e d I C A l t r e n d
2012 9.0%
2013 8.5%
2014 8.0%
2015 7.5%
2016 7.0%
2017 6.5%
2018 6.0%
2019 5.5%
2020 5.0%

Actuarial 88 Actuarial
Per member costs
current Pensioners. We have been provided with information regarding premium rates as of June 30, 2011, for each pensioner currently participating in the retiree health insurance program. We applied the pension fund’s reimbursement rate to these premiums to determine the per member cost to the pension fund for pensioners currently participating in the retiree health insurance program.
currentLy active emPLoyees. We have been provided with information regarding premium rates as of June 30, 2011, for each of the health insurance plans available to retirees and the number of retirees participating in each plan. Based on this information, we developed average per member pension fund costs to be used for currently active employees. We developed average per member pension fund costs separately for the following categories:
m e m B e r C A t e g o r y A v e r A g e C o s t P e r r e t I r e e
Members under age 65 $ 858.48
Members over age 65 $ 524.00
GASB Statement No. 43 provides projection of future retiree health care benefits should be based on actuarial standards issued by the Actuarial Standards Board. Actuarial Standards of Practice No. 6 provides that actuaries should consider the variation of health care costs by age and should use appropriate age bands if the costs vary significantly.
We have therefore developed age-adjusted costs per retiree that are equivalent to the above average costs per retiree by using the Aging Curve for Health Care Costs that is included in Table 4 of the study Aging Curves for Health Care Costs in Retirement, by Jeffrey P. Petertil, published in the July 2005 issue of the North American Actuarial Journal.
The percent increases in health care costs by age that are shown in Table 4 of the above paper are as follows:
A g e B A n d
r e P r e s e n t A t I v e o n e y e A r A g I n g F A C t o r
50-54 3.3%
55-59 3.6%
60-64 4.2%
65-69 3.0%
70-74 2.5%
75-79 2.0%
80-84 1.0%
85-89 0.5%
90 and over 0.0%

Actuarial 89 Actuarial
Applying the above rates of increases in health care costs by age, we developed costs per retiree by five-year age groups that were equivalent to the above average costs per retiree. This was done separately for the under age 65 costs per retiree and the over age 65 costs per retiree, for both employee retirees and spouse retirees. The cost per retiree by five-year age groups were developed so the total of the age-adjusted costs was equal to the total of the level average costs.
The age adjusted retiree costs to the pension fund that we developed using the above approach are as follows:
A g e B A n d
A g e A d J u s t e d C o s t P e r e m P l o y e e r e t I r e e
50-54 $617.59
55-59 $731.73
60-64 $885.97
65-69 $437.38
70-74 $500.92
75-79 $559.85
80-84 $603.09
85 and above $626.03
ParticiPation rates. Based on the percent of retirees participating in the retiree health insurance plan in the most recent year, we assumed the percent of future retirees that will participate in the plan to be as follows:
m e m B e r C A t e g o r y P A r t I C I P A t I o n r A t e
Under age 65 79%
Over age 65 87%
other actuariaL assumPtions. The other actuarial assumptions that we used in performing the actuarial valuation of the retiree health insurance benefits provided under the fund are similar to the actuarial assumptions that we use in the actuarial valuation of pension benefits. These assumptions are outlined in Appendix 1.
The projected unit credit actuarial cost method was used for the June 30, 2011, valuation. This is the same actuarial cost method that we use for the actuarial valuation of pension benefits provided under the fund.

Actuarial 90 Actuarial
e. actuariaL LiabiLity
The actuarial liability as determined under the valuation for the various classes of members is summarized in Exhibit 2. The total actuarial liability is then compared with the actuarial value of assets in order to arrive at the unfunded actuarial liability.
As of June 30, 2011, the total actuarial liability for retiree health insurance benefits provided under the fund is $3,071,516,739 the actuarial value of assets is $31,324,572 and the unfunded actuarial liability is $3,040,192,167.
exhibit 2 ACtuArIAl lIABIlIty As oF June 30, 20111. Actuarial Liability for Active Members $ 1,517,197,552
2. Actuarial Liability for Members Receiving Benefits 1,554,319,187
3. Total Actuarial Liability $ 3,071,516,739
4. Actuarial Value of Assets 31,324,572
5. Unfunded Actuarial Liability $ 3,040,192,167
6. Funded Ratio 1.0%
f. normaL cost
The normal cost for the year beginning July 1, 2011, is shown below. The total normal cost is $108,094,388. Based on a payroll of $2,090,131,858 as of July 1, 2011, the total normal cost can be expressed as 5.17% of payroll.
Employer’s Normal Cost for Year Beginning July 1, 2011
Dollar Amount Percent of Payroll
Total Normal Cost $ 108,094,388 5.17%
g. annuaL required contribution for gasb statement no. 43
Pursuant to GASB Statement No. 43, we have calculated the annual required contribution for the year beginning July 1, 2011, as the normal cost plus a 30-year level-percent-of-payroll amortization of the unfunded actuarial liability. Therefore, the annual required contribution (ARC) for the year beginning July 1, 2011, for purposes of GASB Statement No. 43 is as follows:
1. Total normal cost $ 108,094,388
2. Annual amount to amortize the unfunded liability over 30 years as a level percent of payroll 110,747,833
3. Annual required contribution (1 + 2) $ 218,842,221

Actuarial 91 Actuarial
Summary of Actuarial Liability and Unfunded Actuarial Liability Pension Fund
additionaL actuariaL tabLes
Summary of Actuarial Liability and Unfunded Actuarial Liability Health Insurance
FIsCAl yeAr
totAl ACtuArIAl lIABIlIty
ACtuArIAl vAlue oF Assets
Assets As A % oF ACtuArIAl lIABIlIty
unFunded ACtuArIAl lIABIlIty (uAl)
ACtIve memBer PAyroll
uAl As A % oF ACtIve memBer PAyroll
2002 11,025,482,210 10,640,947,039 96.5% 384,535,171 1,759,045,853 21.9%
2003 11,411,528,364 10,494,754,698 92.0% 916,773,666 1,706,205,814 53.7%
2004 12,105,680,577 10,392,193,115 85.8% 1,713,487,462 1,767,631,306 96.9%
2005 13,295,876,206 10,506,471,213 79.0% 2,789,404,993 1,968,612,235 141.7%
2006 14,035,627,452 10,947,998,433 78.0% 3,087,629,019 1,944,358,215 158.8%
2007* 14,677,184,345 11,759,699,063 80.1% 2,917,485,282 1,863,182,086 156.6%
2008* 15,203,740,567 12,069,417,038 79.4% 3,134,323,529 1,914,558,916 163.7%
2009* 15,683,241,527 11,493,255,754 73.3% 4,189,985,773 1,996,194,224 209.9%
2010* 16,319,743,665 10,917,416,993 66.9% 5,402,326,672 2,107,934,080 256.3%
2011* 16,940,626,445 10,109,314,922 59.7% 6,831,311,523 2,090,131,858 326.8%
* Pension benefits only
FIsCAl yeAr
totAl ACtuArIAl lIABIlIty
ACtuArIAl vAlue oF Assets
Assets As A % oF ACtuArIAl lIABIlIty
unFunded ACtuArIAl lIABIlIty (uAl)
ACtIve memBer PAyroll
uAl As A % oF ACtIve memBer PAyroll
2006 2,373,773,770 41,057,585 1.7% 2,332,716,185 1,944,358,215 120.0%
2007 2,022,007,643 47,401,758 2.3% 1,974,605,885 1,863,182,086 106.0%
2008 2,407,122,492 44,989,385 1.9% 2,362,133,107 1,914,558,916 123.4%
2009 2,670,282,662 49,691,750 1.9% 2,620,590,912 1,996,194,224 131.3%
2010 2,864,877,305 34,857,732 1.2% 2,830,019,573 2,107,934,080 134.3%
2011 3,071,516,739 31,324,572 1.0% 3,040,192,167 2,090,131,858 145.5%

Actuarial 92 Actuarial
Solvency Test — Pension Fund
additionaL actuariaL tabLes
FIsCAl yeAr
(1) ACtIve memBers ACCumulAted ContrIButIons
(2) memBers Currently reCeIvIng BeneFIts
(3) ACtIve memBer emPloyer PortIon
ACtuArIAl vAlue oF Assets (1) (2) (3)
2002 1,227,035,375 5,829,728,535 3,968,718,300 10,640,947,039 100% 100% 90%
2003 1,158,355,645 6,241,474,235 4,011,698,484 10,494,754,698 100% 100% 77%
2004 1,193,225,162 6,802,897,439 4,109,557,976 10,392,193,115 100% 100% 58%
2005 1,350,467,025 7,999,438,133 3,945,971,048 10,506,471,213 100% 100% 29%
2006 1,568,239,525 8,914,312,590 3,553,075,337 10,947,998,433 100% 100% 13%
2007 1,289,062,329 9,987,716,674 3,400,405,342 11,759,699,063 100% 100% 14%
2008 1,271,835,518 10,491,444,573 3,440,460,416 12,069,417,038 100% 100% 9%
2009 1,405,263,483 10,795,476,796 3,482,501,248 11,493,255,754 100% 94% 0%
2010 1,514,213,112 11,200,095,789 3,605,434,764 10,917,416,993 100% 84% 0%
2011 1,503,911,310 11,791,538,477 3,645,176,758 10,140,639,494 100% 73% 0%
PerCent oF ACCrued lIABIlItIes Covered By Assets
A C C R U E D L I A B I L I T I E S F O R

Actuarial 93 Actuarial
Schedule of Actual Employer Contributions and Actuarially Determined Contribution
Requirements for Pension Fund
ACTUAL EMPLOYER CONTRIBUTIONACtuArIAlly determIned ContrIButIon requIrement As A PerCent oF PAyroll
FIsCAl
yeAr
ACtIve memBer PAyroll
dollAr Amount
PerCent oF PAyroll
2002 1,759,045,853 77,679,068 4.42% 10.17%
2003 1,706,205,814 78,747,983 4.62% 9.39%
2004 1,767,631,306 78,127,273 4.42% 11.48%
2005 1,968,612,235 73,917,464 3.75% 13.15%
2006 1,944,358,215 117,789,706 6.06% 16.89%
2007* 1,863,182,086 103,761,750 5.57% 16.70%
2008* 1,914,558,916 164,466,511 8.59% 15.15%
2009* 1,996,194,224 198,069,327 9.92% 14.64%
2010* 2,107,934,080 290,759,950 13.79% 16.88%
2011* 2,090,131,858 143,589,994 6.87% 20.40%
* Pension benefits only
Schedule of Actual Employer Contributions and Actuarially Determined Contribution
Requirements for Retiree Health Insurance Benefits
ACTUAL EMPLOYER CONTRIBUTIONACtuArIAlly determIned ContrIButIon requIrement As A PerCent oF PAyroll
FIsCAl
yeAr
ACtIve memBer PAyroll
dollAr Amount
PerCent oF PAyroll
2006 1,944,358,215 65,000,000 3.34% 10.97%
2007 1,863,182,086 65,000,000 3.49% 11.24%
2008 1,914,558,916 65,000,000 3.39% 7.84%
2009 1,996,194,224 65,000,000 3.26% 8.61%
2010 2,107,934,080 65,000,000 3.08% 8.83%
2011 2,090,131,858 65,000,000 3.08% 10.32%
additionaL actuariaL tabLes

Actuarial 94 Actuarial
Schedule of Active Member Valuation Data Pension Fund
additionaL actuariaL tabLes
vAluAtIon dAte numBer AnnuAl PAyroll
AnnuAl AverAge PAy
% InCreAse (deCreAse) In AverAge PAy
6-30-02 37,374 1,759,045,853 47,066 4.8%
6-30-03 36,548 1,706,205,814 46,684 (0.8%)
6-30-04 37,362 1,767,631,306 47,311 1.3%
6-30-05 37,521 1,968,612,235 52,467 10.9%
6-30-06 34,682 1,944,358,215 56,062 6.9%
6-30-07 32,968 1,863,182,086 56,515 .8%
6-30-08 32,086 1,914,558,916 59,670 5.6%
6-30-09 31,905 1,996,194,224 62,567 4.9%
6-30-10 33,983 2,107,934,080 62,029 (0.9%)
6-30-11 30,133 2,090,131,858 69,364 11.8%
Schedule of Retirees and Beneficiaries Added to and Removed from Rolls Pension Fund
yeAr ended no.
AnnuAl BeneFIts no.
AnnuAl BeneFIts no. AnnuAl BeneFIts
AverAge AnnuAl BeneFIt
% InCreAse In AverAge
AnnuAl BeneFIt
2002 1,279 $79,552,055 710 $13,059,415 17,867 $501,519,500 $28,070 11.6%
2003 1,363 $63,184,471 665 $20,222,042 18,565 $544,481,929 $29,328 4.5%
2004 1,336 $63,484,844 635 $13,595,626 19,266 $594,371,147 $30,851 5.2%
2005 2,631 $117,025,483 943 $23,137,112 20,954 $688,259,518 $32,846 6.5%
2006 1,788 $91,991,917 637 $15,910,849 22,105 $764,340,586 $34,578 5.3%
2007 2,055 $104,043,221 537 $14,063,967 23,623 $854,319,840 $36,165 4.6%
2008 881 $67,060,461 584 $16,543,468 23,920 $904,836,833 $37,828 4.6%
2009 957 $57,109,256 659 $19,557,718 24,218 $942,388,371 $38,913 2.9%
2010 1,080 $67,630,266 698 $21,855,794 24,600 $988,162,843 $40,169 3.2%
2011 1,394 $86,404,558 795 $26,694,342 25,199 $1,047,873,059 $41,584 3.5%
Added-to-rolls removed-From rolls rolls-end-oF-yeAr

Actuarial 95 Actuarial
aPPendix 1
Summary of Actuarial Assumptions and Actuarial Cost Method
actuariaL assumPtions. The actuarial assumptions used for the June 30, 2011, valuation are summarized below. The assumptions were adopted as of June 30, 2008.
mortaLity rates. For males, the UP-94 Table for Males, rated down three years; for females, the UP-94 Table for Females, rated down two years. For disabled males, the UP-94 Table for Males, rated up 5 years; for disabled females, the UP-94 Table for Males without adjustment.
termination rates. Termination rates based on the recent experience of the Fund. The following is a sample of the termination rates that were used:
1. Employees With 5 or Less Years of Service
y e A r s o F s e r v I C e r A t e o F t e r m I n A t I o n
P e r 1 , 0 0 0 m e m B e r s
Less than 1 year 295
1 – 2 years 71
2 – 3 years 70
3 – 4 years 56
4 – 5 years 52
2. Employees With 5 to 10 Years of Service
A g e r A t e o F t e r m I n A t I o n
P e r 1 , 0 0 0 m e m B e r s
25 46
30 48
35 44
40 37
45 32
50 30
55 30
60 30
62 and later 0

Actuarial 96 Actuarial
3. Employees With 10 or More Years of Service
A g e r A t e o F t e r m I n A t I o n
P e r 1 , 0 0 0 m e m B e r s
30 24
35 25
40 19
45 12
50 10
55 10
60 10
62 and later 0
disabiLity rates. Disability rates are based on the recent experience of the Fund. The following is a sample of the disability rates that were used:
A g e d I s A B I l I t I e s P e r 1 , 0 0 0 m e m B e r s
30 .7
40 1.0
50 2.0
60 2.5
62 and over .0
retirement rates. Rates of retirement for each age from 55 to 75 based on the recent experience of the Fund were used. The following are samples of the rates of retirement that were used:
1. Employees With Less Than 33 Years of Service
A g e r A t e o F r e t I r e m e n t P e r
1 , 0 0 0 m e m B e r s
55 55
60 77
65 100
70 137
75 1,000
2. Employees with 33 or More Years of Service
A g e r A t e o F r e t I r e m e n t P e r
1 , 0 0 0 m e m B e r s
55 120
60 200
65 190
70 200
75 1,000

Actuarial 97
For persons who became or will become participants on or after January 1, 2011, rates of retirement for each age from 62 to 75 were used. The following are samples of the rates of retirement that were used:
A g e r A t e o F r e t I r e m e n t P e r
1 , 0 0 0 m e m B e r s
62 400
64 250
67 300
70 200
75 1,000
saLary Progression. Rates of salary increase, which vary by age. The following is a sample of the assumed rates of salary increase:
A g e A s s u m e d r A t e
o F I n C r e A s e
25 11.2%
30 8.9%
35 7.3%
40 6.2%
45 5.4%
50 4.7%
55 and later 4.0%
Based on the above salary increase assumption, the assumption regarding general increases in salaries can be considered to be 4% per year.
interest rate – Pension PLan. 8.0% per year, compounded annually. Of this 8% per year assumption, 3.0% can be attributed to inflation.
interest rate – heaLth insurance PLan. 4.5% per year, compounded annually.
maritaL status. 80% of participants were assumed to be married.
sPouse’s age. Male spouses are assumed to be 2 years older than female spouses.
assumPtion regarding totaL service credit at retirement. It was assumed that a teacher’s total service credit at retirement would be 103.3% of the teacher’s regular period of service at retirement.
actuariaL cost method. The projected unit credit actuarial cost method was used. Actuarial gains and losses are reflected in the unfunded actuarial liability. This actuarial cost method was adopted as of August 31, 1991.

Actuarial 98 Actuarial
aPPendix 2Summary of Principal Provisions
1. eLigibiLity for Pension. The right to a retirement pension vests (1) after 20 years of validated service, with the pension payable at age 55 or over; or (2) after 5 years validated service, with the pension payable at age 62 or over.
2. amount of retirement Pension. For service earned before July 1, 1998, the retirement pension is 1.67% of “final average salary” for each of the first 10 years of validated service, 1.90% for each of the next 10 years, 2.10% for each of the next 10 years, and 2.30% for each year above 30. For service earned after June 30, 1998, the pension is 2.2% of “final average salary” for each year of service.
Service earned before July 1, 1998, can be upgraded to the 2.2% formula through the payment of additional employee contributions of 1% of the teacher’s highest salary within the last four years for each year of prior service. Maximum payment is 20% of salary, but all years are upgraded. The number of years for which contributions are required is reduced by one for each three full years of service after June 30, 1998. No contribution is required if the employee has at least 30 years of service.
The maximum pension is 75% of final average salary.
3. finaL average saLary defined. “Final average salary” for pension computation is the average of the highest rates of salary for any 4 consecutive years of validated service within the last 10 years of service.
4. reduction in Pension for earLy retirement. Except for retirement after 34 years of service, the retirement pension in the case of retirement prior to age 60 is reduced ½ of 1% for each month that the teacher is under age 60.
5. earLy retirement without discount. Subject to authorization by the employer, an employee who retires on or before June 30, 2010, may elect to make a one-time contribution and thereby avoid the early retirement reduction. The exercise of this election by the employee also obligates the employer to make a one-time nonrefundable contribution.
6. non-duty disabiLity retirement. A disability retirement pension is payable in the event of total or permanent disability for teaching service after 10 or more years of service, irrespective of age. The rate of pension is 2.2% of average salary for each year of service after June 30, 1998, and for each year of service that has been upgraded, and 1-2/3% of average salary for each other year of service. Upon disability retirement after 20 years or more of contributing service, but under age 55, the accrued retirement pension is payable, discounted ½ of 1% for each month the disabled teacher is under age 55, down to a minimum of 50 years.
If total service is 20 years or more and the member has attained age 55, the accrued retirement pension is payable without reduction. After 25 years of service, regardless of age, the accrued retirement pension is payable without reduction.
7. duty disabiLity benefit. A duty-connected disability benefit is provided equal to 75% of final average salary upon total incapacity for teaching service as a result of an injury sustained while in the performance of teaching service. The benefit is reduced by “Workers’ Compensation“ payments.
8. Post-retirement increases. Automatic annual increases in pension equal to 3% of the current amount of pension are provided. The increases accrued from the anniversary date of retirement or the 61st birthday, whichever is later.

Actuarial 99 Actuarial
9. survivor’s Pensions. Pensions are payable to survivors of teachers and pensioners under the following conditions:
Upon the death of a teacher or pensioner occurring on or after July 1, 1981, the maximum benefit is $400 per month to a spouse alone and $600 per month if there are other dependents. Payment of a survivor’s pension is conditioned upon marriage having been in effect at least 1 year prior to death. On death after retirement, the total survivor’s pension may not exceed retirement or disability pension paid to the deceased pensioner.
Upon the death of a teacher or pensioner occurring after December 31, 1986, the minimum total survivor’s pension payable shall be 50% of the earned retirement pension of such teacher or pensioner.
If the surviving spouse is under age 50, and no unmarried minor children under age 18 survive, payment of the survivor’s pension is deferred until age 50.
Survivor’s pensions are subject to annual automatic increases of 3% of the current amount of pension.
10. reversionary Pension. By accepting a reduced retirement pension, a member can provide a reversionary pension for a surviving beneficiary. If the reversionary pension was elected on or after January 1, 1984, and the beneficiary survives the date of the teacher’s retirement, but does not survive the retired teacher, the teacher’s pension shall be restored to the full amount of pension.
11. refund of contributions. Upon separation of service, a teacher is entitled to receive a refund of his total contributions and those contributions made on his behalf, without interest.
12. death benefits. Upon death while in service, a refund equal to the total contributions less contributions for survivor’s pensions is payable without interest to a designed beneficiary or the estate of the teacher. Upon death after retirement, the death benefit consists of the excess, if any, of the total contributions over the total pension payments paid to the member or his beneficiary. In addition, the following death benefit is payable:
Death in service. The amount of the benefit is equal to the last month’s salary for each year of validated service up to 6 month’s salary but not exceeding $10,000.
Death while on pension. The death benefit is equal to 6 month’s salary but not to exceed $10,000 less 1/5 of the death benefit for each year or part of a year that the member has been on pension, down to a minimum of $5,000.
13. heaLth insurance reimbursement. The Board may pay each recipient of a retirement, disability, or survivor’s pension an amount to be determined by the Board, which shall represent partial reimbursement for the cost of the recipient’s health insurance coverage, with the total amount of payment not to exceed $65,000,000, or 75% of the total cost of health insurance coverage in any year.
14. financing. Teachers are required to contribute a total of 9% of salary consisting of 7½% towards the retirement pensions, 1% towards the survivor pension, and ½% towards the post-retirement increment. As of September 1981, the Board of Education has been paying 7% of the required teacher contributions for Chicago public school teachers. Charter school contributions may be contributed at various rates by the employers and teachers.
The remainder of the cost of benefits is financed by (1) contributions by the Chicago Board of Education; (2) allocations by the State of Illinois from the State Distributive Fund; and (3) investment income.
15. retirement systems reciProcaL act. The Fund complies with the Retirement Systems Reciprocal Act (Chapter 40 Act 5 Article 20 of the Illinois Compiled Statutes) to provide reciprocal benefits if a member has service credit for other public employment in Illinois.

Actuarial 100 Actuarial
Persons Who First Become Participants On or After January 1, 2011
The following changes to the above provisions apply to persons who first become participants on or after January 1, 2011:
1. The highest salary for annuity purposes is equal to the average monthly salary obtained by dividing the participant’s total salary during the 96 consecutive months of service within the last 120 months of service in which the total compensation was the highest by the number of months in that period.
2. For 2010, the final average salary is limited to the Social Security wage base of $106,800. Limitations for future years shall automatically be increased by the lesser of 3% or one-half of percentage change in the Consumer Price Index-U during the preceding month calendar year.
3. A participant is eligible to retire with unreduced benefits after attainment of age 67 with at least 10 years of service credit. However, a participant may elect to retire at age 62 with at least 10 years of service credit and receive a retirement annuity reduced by one-half of 1% for each month that his or her age is under 67.
4. The initial survivor’s annuity is equal to 66 2/3% of the participant’s earned retirement annuity at the date of death, subject to automatic annual increases of the lesser of 3% or one-half of the increase in the Consumer Price Index-U during the preceding calendar year, based on the originally granted survivor’s annuity.
5. Automatic annual increases in the retirement annuity then being paid are equal to the lesser of 3% or one-half the annual change in the Consumer Price Index for all Urban Consumers, whichever is less, based on the originally granted retirement annuity.

Actuarial 101 Actuarial
aPPendix 3 Glossary of Terms Used in Report
1. actuariaL Present vaLue. The value of an amount or series of amounts payable at various times, determined as of a given date by the application of a particular set of actuarial assumptions.
2. actuariaL cost method or funding method. A procedure for determining the actuarial present value of pension plan benefits and for determining an actuarially equivalent allocation of such value to time periods, usually in the form of a normal cost and an actuarial accrued liability.
3. normaL cost. That portion of the present value of pension plan benefits, which is allocated to a valuation year by the actuarial cost method.
4. actuariaL accrued LiabiLity or accrued LiabiLity. That portion, as determined by a particular actuarial cost method, of the actuarial present value of pension benefits which is not provided for by future normal costs.
5. actuariaL vaLue of assets. The value assigned by the actuary to the assets of the pension plan for purposes of an actuarial valuation.
6. unfunded actuariaL LiabiLity. The excess of the actuarial liability over the actuarial value of assets.
7. Projected unit credit actuariaL cost method. A cost method under which the projected benefits of each individual included in an actuarial valuation are allocated by a consistent formula to valuation years. The actuarial present value of benefits allocated to a valuation year is called the normal cost. The actuarial present value of benefits allocated to all periods prior to a valuation year is called the actuarial liability. Under this method, the actuarial gains (losses), as they occur, generally reduce (increase) the unfunded actuarial liability.
8. actuariaL assumPtions. Assumptions as to future events affecting pension costs.
9. actuariaL vaLuation. The determination, as of the valuation date, of the normal cost, actuarial liability, actuarial value of assets, and related actuarial present values for a pension plan.
10. vested benefits. Benefits that are not contingent on an employee’s future service.

Introduction 102102 Statistical

Introduction 103103 Statistical
Stat i s t i c a lThis section includes information about the Chicago Teachers’ Pension
Fund revenue sources and applications. It also includes summaries of
statistical information about the participating members and
annuitants and the benefits paid to them.

Statistical 104
Statement of Changes in Plan Net Assets Pension Fund
For year ended June 30, 2011, with comparative totals for 9 years
2011 2010 2009 2008 2007
AddItIons:
Contributions:
Intergovernmental, net (employer) $ 143,589,994 $ 290,759,950 $ 198,069,327 $ 164,270,412 $ 103,761,750
Employee contributions 185,882,636 194,621,551 176,176,975 172,504,804 179,017,663
329,472,630 485,381,501 374,246,302 336,775,216 282,779,413 Investment income:
Net investment income 2,123,272,170 1,107,453,898 (2,464,420,944) (738,817,587) 1,947,810,351
Miscellaneous 55,307 – – – 1,923
Total additions 2,452,800,107 1,592,835,399 (2,090,174,642) (402,042,371) 2,230,591,687
deduCtIons:Pension Benefits
Retirement 999,323,111 943,252,537 897,873,287 863,963,625 759,346,660
Survivors 36,196,804 33,738,810 31,028,747 29,037,664 27,532,256
Disability 12,019,044 11,512,123 11,673,453 11,673,773 10,898,039
Refunds
Separation 13,135,132 9,334,950 10,615,031 5,626,786 12,829,988
Death 3,373,836 4,253,510 3,765,163 3,218,956 3,942,853
Other 10,671,550 7,495,834 5,658,269 7,884,526 19,581,668
Death Benefits
Heirs of Active Teachers 419,861 496,832 514,743 486,740 554,765
Heirs of Annuitants 2,840,999 2,449,315 2,462,789 2,359,473 2,322,418
Uncollectible Receivables – – – – –
1,077,980,337 1,012,533,911 963,591,482 924,251,543 837,008,647 Administrative and miscellaneous expenses 9,527,938 8,800,848 8,751,945 7,827,576 8,434,688
Total deductions 1,087,508,275 1,021,334,759 972,343,427 932,079,119 845,443,335
Net increase (decrease) 1,365,291,832 571,500,640 (3,062,518,069) (1,334,121,490) 1,385,148,352
Transfers Health Insurance – – – – –Net assets held in trust for benefits:
Beginning of period, 8,947,470,332 8,375,969,692 11,438,487,761 12,772,609,251 11,387,460,899
End of period $ 10,312,762,164 $ 8,947,470,332 $ 8,375,969,692 $ 11,438,487,761 $ 12,772,609,251

Statistical 105
Continued from page 104
2006 2005 2004 2003 2002
AddItIons:
Contributions:
Intergovernmental, net (employer) $ 52,789,706 $ 8,872,764 $ 13,032,273 $ 13,703,283 $ 11,805,305
Employee contributions 163,419,386 175,706,081 169,598,212 159,931,110 145,498,027
216,209,092 184,578,845 182,630,485 173,634,393 157,303,332 Investment income:
Net investment income 1,093,872,285 1,034,998,497 1,477,931,294 312,557,682 (371,820,584)
Miscellaneous 139,509 561,154 86,285 35,775 829,063
Total additions 1,310,220,886 1,220,138,496 1,660,648,064 486,227,850 (213,688,189)
deduCtIons:Pension Benefits
Retirement 682,245,353 617,684,571 554,975,291 509,945,240 495,238,632
Survivors 25,854,248 24,520,785 22,885,524 25,730,482 23,517,998
Disability 10,388,393 9,561,956 8,649,568 8,126,443 7,571,076
Refunds
Separation 10,633,789 16,877,637 9,565,261 7,648,527 9,036,757
Death 4,028,201 3,572,619 3,588,032 2,747,859 4,043,552
Other 16,023,309 4,408,439 10,173,428 6,954,762 29,219,867
Death Benefits
Heirs of Active Teachers 535,142 470,537 505,842 482,493 746,322
Heirs of Annuitants 2,082,915 2,035,334 2,095,323 2,339,000 2,070,000
Uncollectible Receivables – – – – –
751,791,350 679,131,878 612,438,269 563,974,806 571,444,204 Administrative and miscellaneous expenses 8,320,340 7,477,671 7,214,467 6,576,953 6,459,734
Total deductions 760,111,690 686,609,549 619,652,736 570,551,759 577,903,938
Net increase (decrease) 550,109,196 533,528,947 1,040,995,328 (84,323,909) (791,592,127)
Transfers Health Insurance 59,496,735 – – – (32,302,217)Net assets held in trust for benefits:
Beginning of period 10,777,854,968 10,244,326,021 9,203,330,693 9,287,654,602 10,111,548,946
End of period $ 11,387,460,899 $ 10,777,854,968 $ 10,244,326,021 $ 9,203,330,693 $ 9,287,654,602
See accompanying notes to financial statements.

Statistical 106
Statement of Changes in Plan Net Assets Health Insurance Fund
For Year Ended June 30, 2011, with comparative totals for 9 years
2011 2010 2009 2008 2007
AddItIons:
Contributions:
Intergovernmental, net (employer) $ 65,000,000 $ 65,000,000 $ 65,000,000 $ 65,000,000 $ 65,000,000
Investment income:
Net investment income 20,471 119,855 514,200 1,278,818 2,373,014
Health Insurance Premium Refund
10,338,661 15,000,000 — —
Total additions 75,359,132 65,119,855 80,514,200 66,278,818 67,373,014
deduCtIons:
Health Insurance Premium Rebate 78,892,292 79,953,873 75,811,835 68,691,191 61,028,841
Total deductions 78,892,292 79,953,873 75,811,835 68,691,191 61,028,841
Net increase (decrease) (3,533,160) (14,834,018) 4,702,365 (2,412,373) 6,344,173
Transfers Health Insurance
— — — — —
Net assets held in trust for benefits:
Beginning of period, as restated 34,857,732 49,691,750 44,989,385 47,401,758 41,057,585
End of period $ 31,324,572 $ 34,857,732 $ 49,691,750 $ 44,989,385 $ 47,401,758

Statistical 107
2006 2005 2004 2003** 2002*
AddItIons:
Contributions:
Intergovernmental, net (employer) $ 65,000,000 $ 65,044,700 $ 65,095,000 $ 65,044,700 $ 65,044,700
Investment income:
Net investment income 4,071,093 1,899,844 928,497 944,488 1,167,878
Health Insurance Premium Refund
— — — — —
Total additions 69,071,093 66,944,544 66,023,497 65,989,188 66,212,578
deduCtIons:
Health Insurance Premium Rebate 58,279,900 54,410,887 53,106,379 51,395,920 44,068,275
Total deductions 58,279,900 54,410,887 53,106,379 51,395,920 44,068,275
Net increase (decrease) 10,791,193 12,533,657 12,917,118 14,593,268 22,144,303
Transfers Health Insurance (59,496,735) — — — 32,302,217
Net assets held in trust for benefits:
Beginning of period, as restated 89,763,127 77,229,470 64,312,352 49,719,084 —
End of period $ 41,057,585 $ 89,763,127 $ 77,229,470 $ 64,312,352 $ 54,446,520
See accompanying notes to financial statements.
* First year of Health Insurance Fund
** Beginning period restated.
Continued from page 106

Statistical 108
annuitants
Distribution of Current Annuitants by Benefit Type
As of June 30, 2011
montHly PensIon Amount
retIrement dIsABIlIty survIvor totAl
mAles FemAles mAles FemAles mAles FemAles mAles FemAles
$ 0 – 499 446 1,003 3 4 158 263 607 1,270
$ 500 – 999 367 803 12 25 271 436 650 1,264
$ 1,000 – 1,499 303 667 22 47 199 261 524 975
$ 1,500 – 1,999 250 786 13 46 171 247 434 1,079
$ 2,000 – 2,499 266 924 14 52 178 277 458 1,253
$ 2,500 – 2,999 314 1,025 16 47 35 116 365 1,188
$ 3,000 – 3,499 323 1,241 14 43 10 48 347 1,332
$ 3,500 – 3,999 400 1,211 13 46 8 42 421 1,299
$ 4,000 – 4,499 786 2,124 6 21 3 18 795 2,163
$ 4,500 – 4,999 1,118 2,987 6 6 0 10 1,124 3,003
$ 5,000 – 5,499 596 1,517 0 3 1 1 597 1,521
$ 5,500 – 5,999 256 337 2 1 0 1 258 339
$ 6,000 – 6,499 250 308 1 1 0 1 251 310
$ 6,500 – 6,999 135 240 0 0 0 0 135 240
$ 7,000 – 7,499 108 180 1 0 1 0 110 180
$ 7,500 – 7,999 99 137 0 0 0 0 99 137
$ 8,000 – 8,499 65 102 0 0 0 1 65 103
$ 8,500 – 8,999 50 90 0 0 0 0 50 90
$ 9,000 + 70 93 0 0 0 0 70 93
Total 6,202 15,775 123 342 1,035 1,722 7,360 17,839

Statistical 109
annuitants
Distribution of Pensioners with Health Insurance Reimbursements by Size of Annuity
June 30, 2011
H e A l t H I n s u r A n C e
montHly PensIon Amount mAles FemAles
$ 0 – 499 74 201
$ 500 – 999 162 420
$ 1,000 – 1,499 173 469
$ 1,500 – 1,999 175 624
$ 2,000 – 2,499 216 859
$ 2,500 – 2,999 240 898
$ 3,000 – 3,499 251 1,072
$ 3,500 – 3,999 336 1,057
$ 4,000 – 4,499 642 1,839
$ 4,500 – 4,999 944 2,606
$ 5,000 – 5,499 524 1,343
$ 5,500 – 5,999 208 299
$ 6,000 – 6,499 209 273
$ 6,500 – 6,999 112 200
$ 7,000 – 7,499 94 162
$ 7,500 – 7,999 89 115
$ 8,000 – 8,499 55 86
$ 8,500 – 8,999 42 75
$ 9,000 + 57 78
Total 4,603 12,676
Represents members who have purchased insurance from the Fund’s providers and reimbursed members who
have purchased insurance from other outside providers.

Statistical 110
Schedule of Average Benefit Payments
yeArs oF CredIted servICe
0-5 5-10 10-15 15-20 20-25 25-30 30+Fiscal Year 2002
Average Monthly Pension 323 664 1,208 1,862 2,423 3,008 4,089
Average Final Average Salary 6,230 4,459 4,618 4,753 5,037 5,255 5,983
Number of Retired Members 49 70 53 46 69 89 758
Fiscal Year 2003
Average Monthly Pension 303 622 1,171 1,729 2,296 3,080 4,185
Average Final Average Salary 5,620 4,029 4,625 4,779 4,873 5,438 6,174
Number of Retired Members 67 67 60 52 91 108 678
Fiscal Year 2004
Average Monthly Pension 322 654 1,331 2,059 2,314 3,238 4,475
Average Final Average Salary 5,792 5,053 4,989 5,385 4,840 5,603 6,601
Number of Retired Members 72 68 78 75 86 109 1,041
Fiscal Year 2005
Average Monthly Pension 332 750 1,310 2,074 2,550 3,170 4,392
Average Final Average Salary 6,081 4,777 4,805 5,497 5,314 5,446 6,133
Number of Retired Members 64 63 90 90 130 97 842
Fiscal Year 2006
Average Monthly Pension 383 807 1,395 2,067 2,659 3,425 4,609
Average Final Average Salary 6,204 5,135 5,164 5,527 5,563 5,676 6,257
Number of Retired Members 42 54 78 92 153 149 1,012
Fiscal Year 2007
Average Monthly Pension 370 774 1,513 2,240 2,894 3,746 4,878
Average Final Average Salary 6,792 5,131 5,667 5,855 6,043 6,325 6,562
Number of Retired Members 80 64 81 111 222 139 1,218
Fiscal Year 2008
Average Monthly Pension 258 781 1,397 2,071 2,699 4,025 6,297
Average Final Average Salary 5,487 5,450 5,411 5,539 5,969 7,185 8,555
Number of Retired Members 45 49 35 38 58 44 358
Fiscal Year 2009
Average Monthly Pension 339 813 1,519 2,249 2,621 3,523 4,748
Average Final Average Salary 6,323 5,224 5,635 6,074 5,616 5,970 6,459
Number of Retired Members 38 63 52 50 82 53 314
Fiscal Year 2010
Average Monthly Pension 307 803 1,435 2,331 2,922 3,672 5,862
Average Final Average Salary 5,954 4,909 5,408 6,139 6,275 6,413 7,978
Number of Retired Members 33 64 52 46 63 42 160
Fiscal Year 2011
Average Monthly Pension 313 802 1,361 2,363 2,910 3,944 6,458
Average Final Salary 6,480 4,994 5,276 6,252 6,405 6,936 8,824
Number of Retired Members 39 59 56 60 91 49 232
The higher final average salaries in the 0-5 years of credited service are the result of a higher concentration of members with larger salaries who have service with other reciprocal pension plans.
Table does not include disabled members or surviving spouses.

Statistical 111
ParticiPating members Number of Active Members*
FIsCAl yeAr mAle PArtICIPAnts FemAle PArtICIPAnts totAl
2002 9,084 28,290 37,374
2003 9,284 27,264 36,548
2004 9,478 27,884 37,362
2005 9,061 28,460 37,521
2006 8,209 26,473 34,682
2007 7,799 25,169 32,968
2008 7,473 24,613 32,086
2009 7,617 24,288 31,905
2010 7,145 23,867 30,012
2011 6,949 23,184 30,133
*Active members consist of vested and non-vested employees.
Note: fiscal year 2010 participant information corrected in April 2017.

To provide, protect, and enhance the present and future economic well being of members, pensioners and
beneficiaries through efficient and effective management of benefit programs, investment practices and
customer service, and to commit to earning and keeping the respect and trust of the participants through
quality service and by protecting retirement benefits, in compliance with applicable laws and standards.
CTPF BOARD OF TRUSTEES’ MISSION STATEMENT
Chicago Teachers’ Pension Fund203 North LaSalle Street, suite 2600Chicago, Illinois 60601-1231312.641.4464 phone312.641.7185 faxwww.ctpf.org