100 Top National Hospitals - Feb. 2013
89
100 Top Hospitals: Study Overview 20th Edition February 25, 2013 100 TOP HOSPITALS
-
Upload
luckiestmermaid -
Category
Documents
-
view
74 -
download
1
description
Top hospitals in the US - Rated
Transcript of 100 Top National Hospitals - Feb. 2013
100 Top Hospitals: Study Overview
20th EditionFebruary 25, 2013
100 TOP HOSPITALS

Truven Health Analytics777 E. Eisenhower ParkwayAnn Arbor, MI 48108 USA+1.800.366.7526
Truven Health 100 Top Hospitals®, Study Overview, 20th Edition100 Top Hospitals is a registered trademark of Truven Health Analytics.
©2013 Truven Health Analytics Inc.All rights reserved.Printed and bound in the United States of America
The information contained in this publication is intended to serve as a guide for general comparisons and evaluations, but not as the sole basis upon which any specific conduct is to be recommended or undertaken. The reader bears sole risk and responsibility for any analysis, interpretation, or conclusion based on the information contained in this publication, and Truven Health Analytics shall not be responsible for any errors, misstatements, inaccuracies, or omissions contained herein. No part of this publication may be reproduced or transmitted in any form or by any means, electronic or mechanical, including photocopying, recording, or by any information storage and retrieval system, without permission in writing from Truven Health Analytics.
ISBN 978-1-57372-460-9
Table ofContents
Introduction ..............................................................................1–3This Year’s 100 Top Hospitals and Everest Award Winners ........ 1–2
The Multi-Faceted 100 Top Hospitals Program ................................ 2
About Truven Health Analytics ........................................................ 3
Award Winners .........................................................................5–8Major Teaching Hospitals .................................................................. 5
Teaching Hospitals ............................................................................. 6
Large Community Hospitals .............................................................. 7
Medium Community Hospitals ......................................................... 8
Small Community Hospitals ............................................................. 8
The Everest Award .................................................................9–13The 2013 Everest Award Winners ..................................................... 9
Value to the Healthcare Industry..................................................... 10
How We Select the Everest Award Winners ............................. 10–13
Findings ................................................................................15–29How Are the Winners Outperforming Their Peers? ................. 15–20
Midwest Leads in Hospital Performance .................................. 20–22
Performance Improvement Over Time: All Hospitals .................... 23
Performance Improvement Over Time ...................................... 24–28
Methodology .........................................................................29–43Building the Database of Hospitals ........................................... 30–32
Classifying Hospitals into Comparison Groups ........................ 32–33
Scoring Hospitals on Weighted Performance Measures ........... 33–35
Performance Measures ............................................................... 36–41
Determining the 100 Top Hospitals .......................................... 41–43
Truven Health Policy on Revocation of a 100 Top
Hospitals Award ............................................................................... 43
Winners Through The Years ................................................45–69
Appendix A: Distribution of Winners by State and Region .....71
Appendix B: States Included in Each Census Region ..............73
Appendix C: Methodology Details ......................................75–87Methods for Identifying Complications of Care ....................... 75–80
Core Measures ............................................................................ 80–81
30-Day Risk-Adjusted Mortality Rates and 30-Day
Risk-Adjusted Readmission Rates ................................................... 82

HCAHPS Overall Hospital Rating ............................................. 82–83
Length-of-Stay Methodologies .................................................. 83–84
Performance Measure Normalization ............................................. 84
Interquartile Range Methodology .................................................... 85
Why We Have Not Calculated Percent Change
in Specific Instances ........................................................................ 85
Protecting Patient Privacy ............................................................... 85
Medicare Cost Report Line Items Used in the Performance
Measures Calculations ............................................................... 86–87
References .............................................................................89–91

1100 Top HospiTals
Truven Health AnalyticsSM is proud to celebrate the 20th anniversary of the
Truven Health 100 Top Hospitals® program. What began 20 years ago as a quest to
use publicly available data to objectively identify the country’s top hospitals has
grown to become a teaching tool for the entire industry.
Through the years, the body of published research proving the validity and stability
of the 100 Top Hospitals has grown wide.1–23 We’ve used the data the 100 Top
Hospitals studies yield to learn what makes the winning hospitals the best and
how their results differ from those of their peers. We’ve also undertaken a number
of research efforts to dig deeper into the practices of the top organizations’ leaders.
Through these efforts, we’ve learned that the best hospitals and health systems:
§ Demonstrate excellence across the organization, delivering top-notch patient
outcomes, keeping costs down and finances stable so they can invest more back
into patient care, following recommended processes, and providing value to the
community as a high-quality employer and trusted care partner1–5
§ Aren’t satisfied with one-time accolades. They build on their results and raise
their standards year after year6
§ Follow care standards more closely than their peers7–12
§ Exhibit a culture of excellence and performance improvement that pervades
every aspect of their organizations — from housekeeping to patient care
to administration13,18
§ Follow Baldrige practices closely13,14
§ Have leaders with common approaches to management and organizational
goal development13,15–18
§ Use advanced information technology processes19
§ Have strong board leadership15–18, 20–23
We’ve worked hard to use our tools and techniques to benefit the industry. Read on
to learn how the latest winners continue to set benchmarks for other organizations
to emulate.
This Year’s 100 Top Hospitals and Everest Award WinnersThe 100 Top Hospitals study is annual, quantitative research that identifies the
hospitals with the best facility-wide performance. To evaluate hospital performance,
our team of researchers — including epidemiologists, statisticians, physicians, and
former hospital executives — uses public data sources to develop an independent
and objective assessment. Hospitals do not apply and winners do not pay to market
this honor.
Celebrating 20 Years of Identifying
Top PerformanceIntroduction
2 100 Top HospiTals
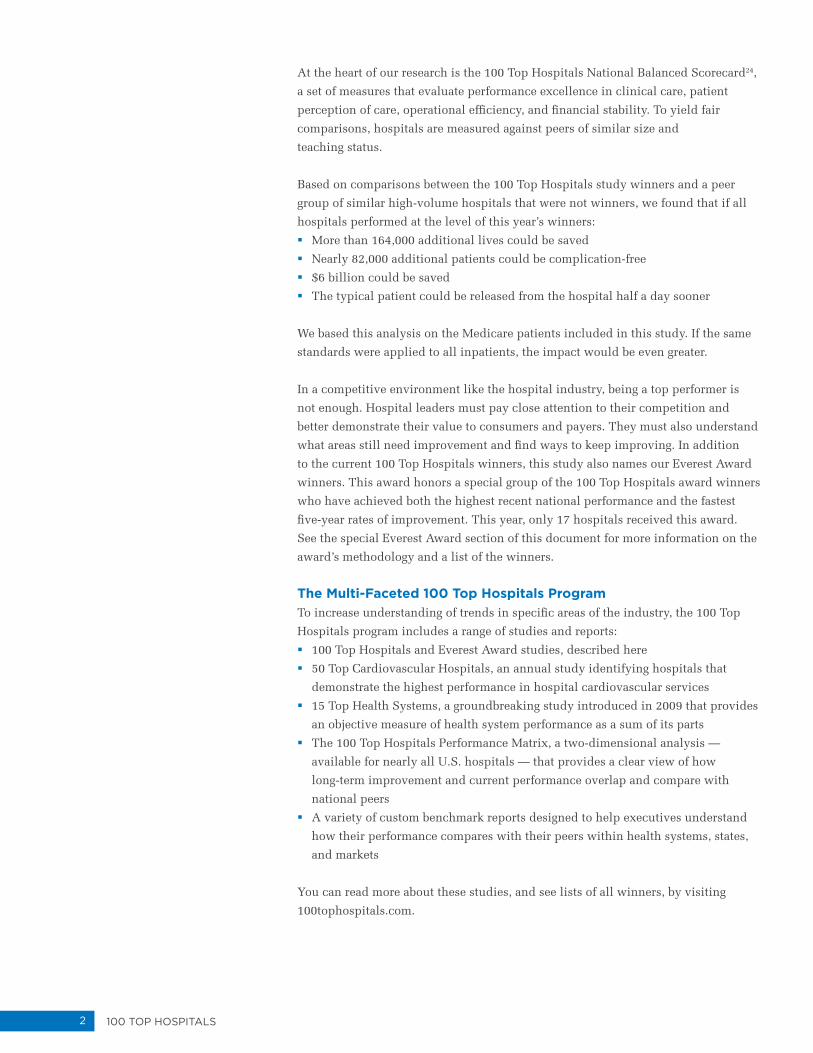
At the heart of our research is the 100 Top Hospitals National Balanced Scorecard24,
a set of measures that evaluate performance excellence in clinical care, patient
perception of care, operational efficiency, and financial stability. To yield fair
comparisons, hospitals are measured against peers of similar size and
teaching status.
Based on comparisons between the 100 Top Hospitals study winners and a peer
group of similar high-volume hospitals that were not winners, we found that if all
hospitals performed at the level of this year’s winners:
§ More than 164,000 additional lives could be saved
§ Nearly 82,000 additional patients could be complication-free
§ $6 billion could be saved
§ The typical patient could be released from the hospital half a day sooner
We based this analysis on the Medicare patients included in this study. If the same
standards were applied to all inpatients, the impact would be even greater.
In a competitive environment like the hospital industry, being a top performer is
not enough. Hospital leaders must pay close attention to their competition and
better demonstrate their value to consumers and payers. They must also understand
what areas still need improvement and find ways to keep improving. In addition
to the current 100 Top Hospitals winners, this study also names our Everest Award
winners. This award honors a special group of the 100 Top Hospitals award winners
who have achieved both the highest recent national performance and the fastest
five-year rates of improvement. This year, only 17 hospitals received this award.
See the special Everest Award section of this document for more information on the
award’s methodology and a list of the winners.
The Multi-Faceted 100 Top Hospitals ProgramTo increase understanding of trends in specific areas of the industry, the 100 Top
Hospitals program includes a range of studies and reports:
§ 100 Top Hospitals and Everest Award studies, described here
§ 50 Top Cardiovascular Hospitals, an annual study identifying hospitals that
demonstrate the highest performance in hospital cardiovascular services
§ 15 Top Health Systems, a groundbreaking study introduced in 2009 that provides
an objective measure of health system performance as a sum of its parts
§ The 100 Top Hospitals Performance Matrix, a two-dimensional analysis —
available for nearly all U.S. hospitals — that provides a clear view of how
long-term improvement and current performance overlap and compare with
national peers
§ A variety of custom benchmark reports designed to help executives understand
how their performance compares with their peers within health systems, states,
and markets
You can read more about these studies, and see lists of all winners, by visiting
100tophospitals.com.
3100 Top HospiTals
About Truven Health AnalyticsTruven Health Analytics delivers unbiased information, analytic tools, benchmarks,
and services to the healthcare industry. Hospitals, government agencies, employers,
health plans, clinicians, pharmaceutical, and medical device companies have relied
on us for more than 30 years. We combine our deep clinical, financial, and healthcare
management expertise with innovative technology platforms and information assets
to make healthcare better by collaborating with our customers to uncover and realize
opportunities for improving quality, efficiency, and outcomes. With more than 2,000
employees globally, we have major offices in Ann Arbor, Mich.; Chicago; and Denver.
Advantage Suite, Micromedex, ActionOI, MarketScan, and 100 Top Hospitals are
registered trademarks or trademarks of Truven Health Analytics.
5100 Top HospiTals
Award Winners
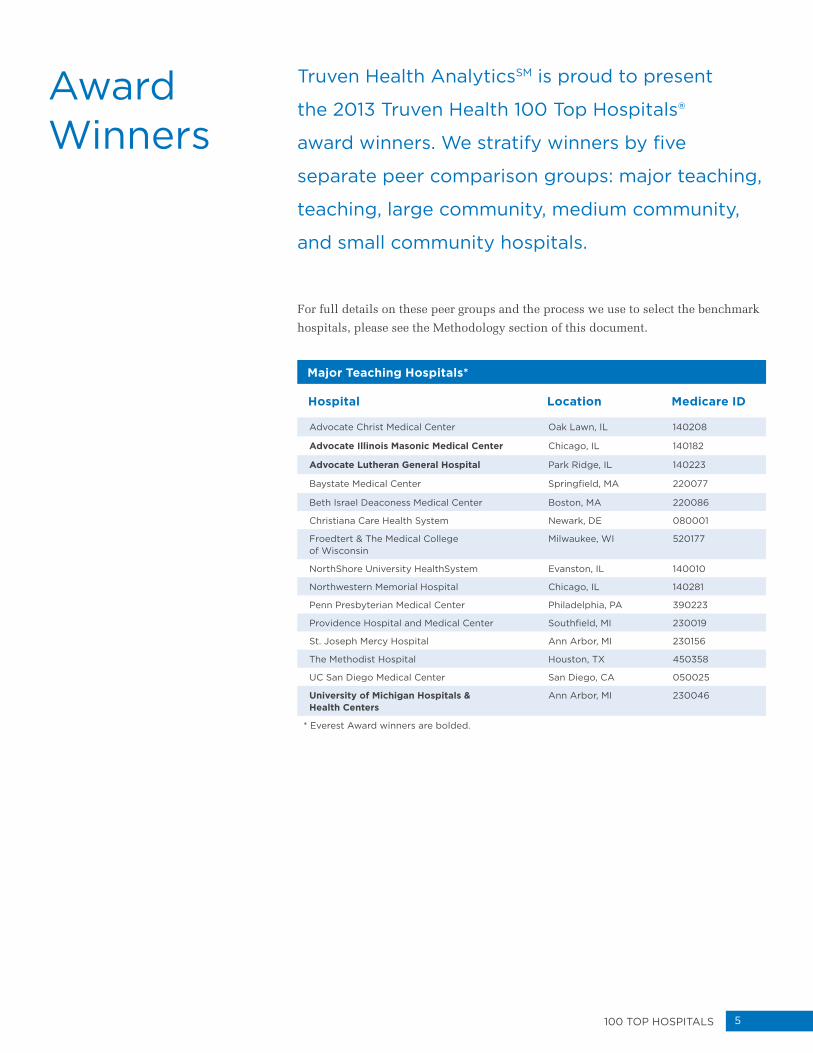
For full details on these peer groups and the process we use to select the benchmark
hospitals, please see the Methodology section of this document.
Major Teaching Hospitals*
Hospital Location Medicare ID
Advocate Christ Medical Center Oak Lawn, IL 140208
Advocate Illinois Masonic Medical Center Chicago, IL 140182
Advocate Lutheran General Hospital Park Ridge, IL 140223
Baystate Medical Center Springfield, MA 220077
Beth Israel Deaconess Medical Center Boston, MA 220086
Christiana Care Health System Newark, DE 080001
Froedtert & The Medical College of Wisconsin
Milwaukee, WI 520177
NorthShore University HealthSystem Evanston, IL 140010
Northwestern Memorial Hospital Chicago, IL 140281
Penn Presbyterian Medical Center Philadelphia, PA 390223
Providence Hospital and Medical Center Southfield, MI 230019
St. Joseph Mercy Hospital Ann Arbor, MI 230156
The Methodist Hospital Houston, TX 450358
UC San Diego Medical Center San Diego, CA 050025
University of Michigan Hospitals & Health Centers
Ann Arbor, MI 230046
* Everest Award winners are bolded.
Truven Health AnalyticsSM is proud to present
the 2013 Truven Health 100 Top Hospitals®
award winners. We stratify winners by five
separate peer comparison groups: major teaching,
teaching, large community, medium community,
and small community hospitals.
6 100 Top HospiTals
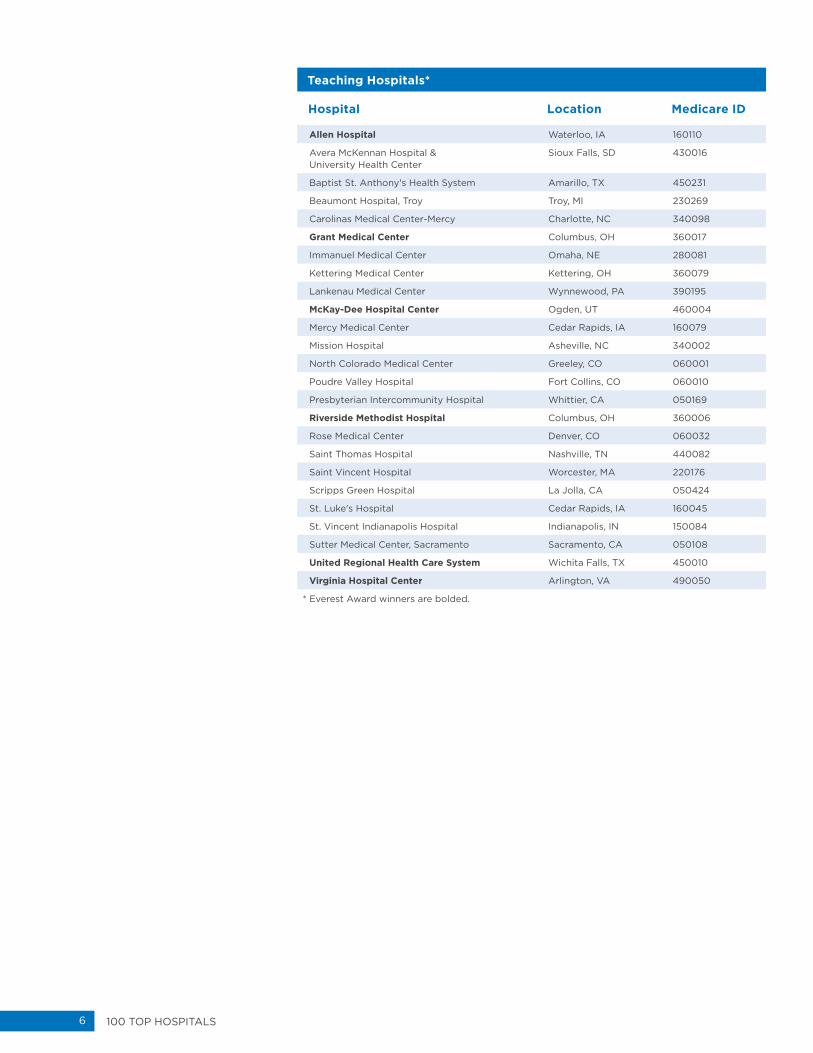
Teaching Hospitals*
Hospital Location Medicare ID
Allen Hospital Waterloo, IA 160110
Avera McKennan Hospital & University Health Center
Sioux Falls, SD 430016
Baptist St. Anthony's Health System Amarillo, TX 450231
Beaumont Hospital, Troy Troy, MI 230269
Carolinas Medical Center-Mercy Charlotte, NC 340098
Grant Medical Center Columbus, OH 360017
Immanuel Medical Center Omaha, NE 280081
Kettering Medical Center Kettering, OH 360079
Lankenau Medical Center Wynnewood, PA 390195
McKay-Dee Hospital Center Ogden, UT 460004
Mercy Medical Center Cedar Rapids, IA 160079
Mission Hospital Asheville, NC 340002
North Colorado Medical Center Greeley, CO 060001
Poudre Valley Hospital Fort Collins, CO 060010
Presbyterian Intercommunity Hospital Whittier, CA 050169
Riverside Methodist Hospital Columbus, OH 360006
Rose Medical Center Denver, CO 060032
Saint Thomas Hospital Nashville, TN 440082
Saint Vincent Hospital Worcester, MA 220176
Scripps Green Hospital La Jolla, CA 050424
St. Luke's Hospital Cedar Rapids, IA 160045
St. Vincent Indianapolis Hospital Indianapolis, IN 150084
Sutter Medical Center, Sacramento Sacramento, CA 050108
United Regional Health Care System Wichita Falls, TX 450010
Virginia Hospital Center Arlington, VA 490050
* Everest Award winners are bolded.
7100 Top HospiTals
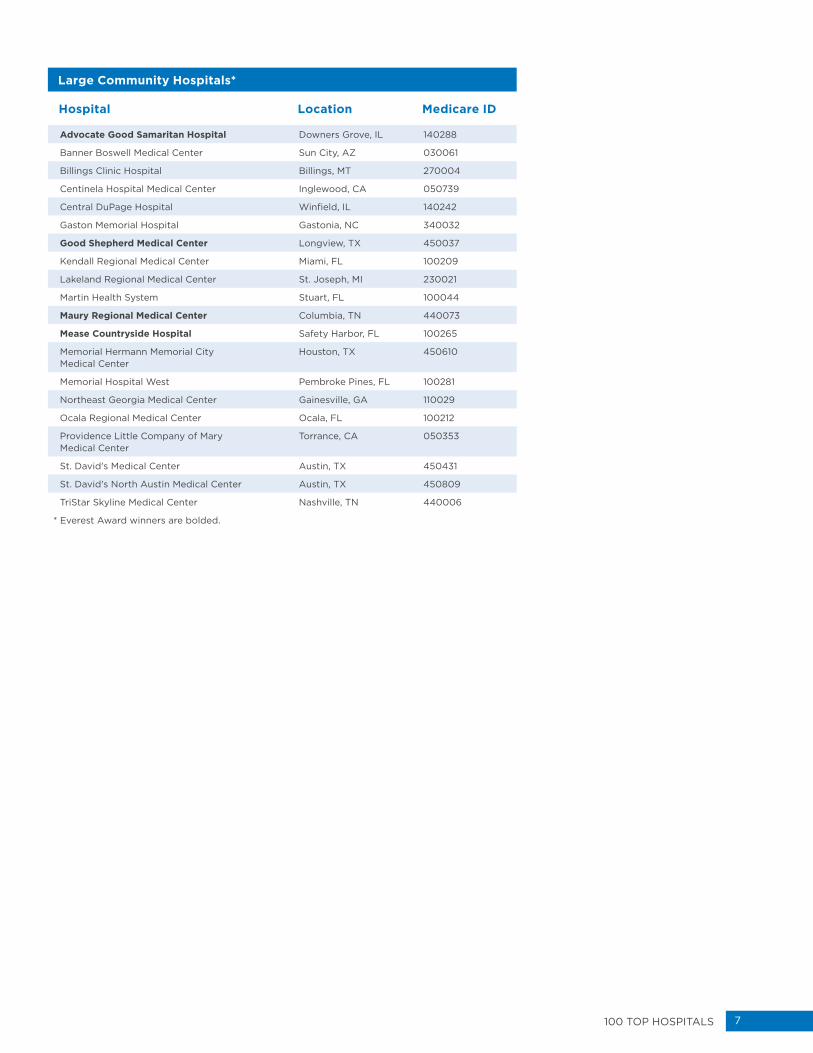
Large Community Hospitals*
Hospital Location Medicare ID
Advocate Good Samaritan Hospital Downers Grove, IL 140288
Banner Boswell Medical Center Sun City, AZ 030061
Billings Clinic Hospital Billings, MT 270004
Centinela Hospital Medical Center Inglewood, CA 050739
Central DuPage Hospital Winfield, IL 140242
Gaston Memorial Hospital Gastonia, NC 340032
Good Shepherd Medical Center Longview, TX 450037
Kendall Regional Medical Center Miami, FL 100209
Lakeland Regional Medical Center St. Joseph, MI 230021
Martin Health System Stuart, FL 100044
Maury Regional Medical Center Columbia, TN 440073
Mease Countryside Hospital Safety Harbor, FL 100265
Memorial Hermann Memorial City Medical Center
Houston, TX 450610
Memorial Hospital West Pembroke Pines, FL 100281
Northeast Georgia Medical Center Gainesville, GA 110029
Ocala Regional Medical Center Ocala, FL 100212
Providence Little Company of Mary Medical Center
Torrance, CA 050353
St. David's Medical Center Austin, TX 450431
St. David's North Austin Medical Center Austin, TX 450809
TriStar Skyline Medical Center Nashville, TN 440006
* Everest Award winners are bolded.
8 100 Top HospiTals
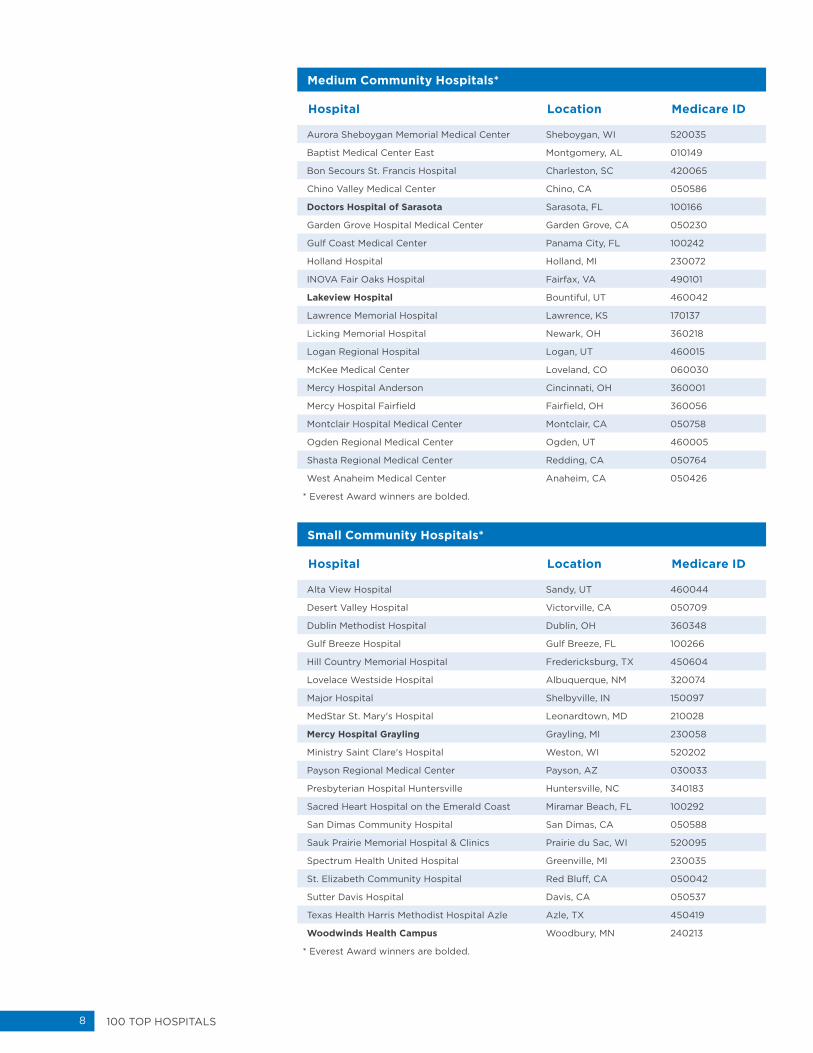
Small Community Hospitals*
Hospital Location Medicare ID
Alta View Hospital Sandy, UT 460044
Desert Valley Hospital Victorville, CA 050709
Dublin Methodist Hospital Dublin, OH 360348
Gulf Breeze Hospital Gulf Breeze, FL 100266
Hill Country Memorial Hospital Fredericksburg, TX 450604
Lovelace Westside Hospital Albuquerque, NM 320074
Major Hospital Shelbyville, IN 150097
MedStar St. Mary's Hospital Leonardtown, MD 210028
Mercy Hospital Grayling Grayling, MI 230058
Ministry Saint Clare's Hospital Weston, WI 520202
Payson Regional Medical Center Payson, AZ 030033
Presbyterian Hospital Huntersville Huntersville, NC 340183
Sacred Heart Hospital on the Emerald Coast Miramar Beach, FL 100292
San Dimas Community Hospital San Dimas, CA 050588
Sauk Prairie Memorial Hospital & Clinics Prairie du Sac, WI 520095
Spectrum Health United Hospital Greenville, MI 230035
St. Elizabeth Community Hospital Red Bluff, CA 050042
Sutter Davis Hospital Davis, CA 050537
Texas Health Harris Methodist Hospital Azle Azle, TX 450419
Woodwinds Health Campus Woodbury, MN 240213
* Everest Award winners are bolded.
Medium Community Hospitals*
Hospital Location Medicare ID
Aurora Sheboygan Memorial Medical Center Sheboygan, WI 520035
Baptist Medical Center East Montgomery, AL 010149
Bon Secours St. Francis Hospital Charleston, SC 420065
Chino Valley Medical Center Chino, CA 050586
Doctors Hospital of Sarasota Sarasota, FL 100166
Garden Grove Hospital Medical Center Garden Grove, CA 050230
Gulf Coast Medical Center Panama City, FL 100242
Holland Hospital Holland, MI 230072
INOVA Fair Oaks Hospital Fairfax, VA 490101
Lakeview Hospital Bountiful, UT 460042
Lawrence Memorial Hospital Lawrence, KS 170137
Licking Memorial Hospital Newark, OH 360218
Logan Regional Hospital Logan, UT 460015
McKee Medical Center Loveland, CO 060030
Mercy Hospital Anderson Cincinnati, OH 360001
Mercy Hospital Fairfield Fairfield, OH 360056
Montclair Hospital Medical Center Montclair, CA 050758
Ogden Regional Medical Center Ogden, UT 460005
Shasta Regional Medical Center Redding, CA 050764
West Anaheim Medical Center Anaheim, CA 050426
* Everest Award winners are bolded.
9100 Top HospiTals
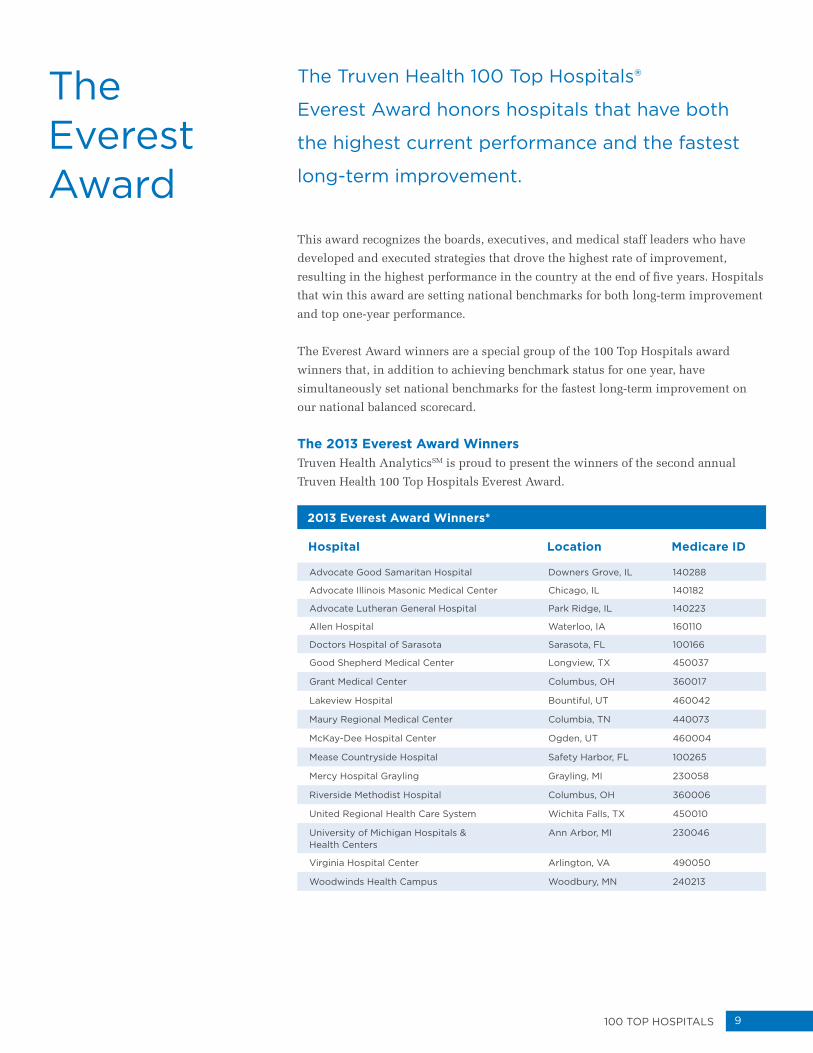
The Everest Award
This award recognizes the boards, executives, and medical staff leaders who have
developed and executed strategies that drove the highest rate of improvement,
resulting in the highest performance in the country at the end of five years. Hospitals
that win this award are setting national benchmarks for both long-term improvement
and top one-year performance.
The Everest Award winners are a special group of the 100 Top Hospitals award
winners that, in addition to achieving benchmark status for one year, have
simultaneously set national benchmarks for the fastest long-term improvement on
our national balanced scorecard.
The 2013 Everest Award Winners Truven Health AnalyticsSM is proud to present the winners of the second annual
Truven Health 100 Top Hospitals Everest Award.
2013 Everest Award Winners*
Hospital Location Medicare ID
Advocate Good Samaritan Hospital Downers Grove, IL 140288
Advocate Illinois Masonic Medical Center Chicago, IL 140182
Advocate Lutheran General Hospital Park Ridge, IL 140223
Allen Hospital Waterloo, IA 160110
Doctors Hospital of Sarasota Sarasota, FL 100166
Good Shepherd Medical Center Longview, TX 450037
Grant Medical Center Columbus, OH 360017
Lakeview Hospital Bountiful, UT 460042
Maury Regional Medical Center Columbia, TN 440073
McKay-Dee Hospital Center Ogden, UT 460004
Mease Countryside Hospital Safety Harbor, FL 100265
Mercy Hospital Grayling Grayling, MI 230058
Riverside Methodist Hospital Columbus, OH 360006
United Regional Health Care System Wichita Falls, TX 450010
University of Michigan Hospitals & Health Centers
Ann Arbor, MI 230046
Virginia Hospital Center Arlington, VA 490050
Woodwinds Health Campus Woodbury, MN 240213
The Truven Health 100 Top Hospitals®
Everest Award honors hospitals that have both
the highest current performance and the fastest
long-term improvement.
10 100 Top HospiTals
Value to the Healthcare Industry Leaders making critical decisions in an increasingly transparent environment
must have more sophisticated intelligence that provides clearer insight into the
complexity of changing organizational performance. They must also balance
short- and long-term goals to drive continuous gains in performance and value.
By comparing individual hospital and health system performance with integrated
national benchmarks for highest achievement and improvement, we provide unique
new insights for making smarter decisions that will achieve their mission and
consistently increase value to the community.
Transparency presents hospital boards and CEOs with a very public challenge to
increase the value of core services to their communities. Providing real value is not
a one-time event — it is a continuous process of increasing worth over time. Leaders
of hospitals and health systems must develop strategies to continuously strengthen
both their organizations and the value of their services to the community.
Integrating national benchmarks for highest achievement with national benchmarks
for fastest long-term improvement radically increases the value of objective business
information available for strategy development and decision making. Comparing
hospital or health system performance to these integrated benchmarks allows leaders
to review the effectiveness of long-term strategies that led to current performance.
This integrated information enables boards and CEOs to better answer multi-
dimensional questions, such as:
§ Did our long-term strategies result in a stronger hospital across all
performance areas?
§ Did our strategies drive improvement in some areas but inadvertently cause
deteriorating performance in others?
§ What strategies will help us increase the rate of improvement in the right areas to
come closer to national performance levels?
§ What incentives do we set for management to achieve the desired improvement
more quickly?
§ Will the investments we’re considering help us achieve improvement goals for the
hospital or health system?
§ Can we quantify the long- and short-term increases in value our hospital has
provided to our community?
How We Select the Everest Award WinnersWinners of the 100 Top Hospitals Everest Award are setting national benchmarks for
both long-term (three- to five-year) improvement and highest one-year performance
on the study’s balanced scorecard. Everest Award winners are selected from among
the new 100 Top Hospitals award winners. The national award and the Everest
Award are based on a set of measures that reflect highly effective performance across
the whole organization.

11100 Top HospiTals
Top Performance —
Current Year
Everest Award Winners
Most Improved
Performance —Five Years
* For full details on how the 100 Top Hospitals winners are selected, please see the Methodology section of this document.
† Due to availability of Present on Admission (POA) data, the clinical measures are based on only three years of data. See the Performance Measures section below for details.
Our methodology for selecting the Everest Award winners can be summarized in
three main steps:
1. Selecting the annual 100 Top Hospitals award winners using our objective
methodology* based on publicly available data and a balanced scorecard of
performance measures
2. Using our multi-year trending methodology to select the 100 hospitals that have
shown the fastest, most consistent five-year improvement rates on the same
balanced scorecard of performance measures†
3. Aligning these two lists of hospitals and looking for overlap; those that ranked in
the top 100 of both lists are the Everest Award winners
Combining these two methodologies yields a very select group of Everest Award
winners; the number of winners will vary every year, based solely on performance.
This year, only 17 hospitals achieved this status.
Data SourcesAs with all of the 100 Top Hospitals awards, our methodology is objective and all
data come from trusted public sources. We build a database of short-term, acute-care,
nonfederal U.S. hospitals that treat a broad spectrum of patients. The primary data
sources are the Medicare Provider Analysis and Review (MedPAR) dataset and the
Medicare Cost Report. We use the most recent five years of Cost Report and three
years of MedPAR data available.
Several other datasets are also used. Core measures and patient satisfaction (Hospital
Consumer Assessment of Healthcare Providers and Systems (HCAHPS) survey) data
are from the Centers for Medicare and Medicaid Services (CMS) Hospital Compare
dataset. Residency program information, used in classifying teaching hospitals,
is from the American Medical Association (Accreditation Council for Graduate
Medical Education (ACGME)-accredited programs) and the American Osteopathic
Association (AOA).
After excluding hospitals with data that would skew study results (e.g., specialty
hospitals), we have a database study group of nearly 3,000 hospitals.

12 100 Top HospiTals
Comparison GroupsBecause bed size and teaching status have a profound effect on the types of patients a
hospital treats and the scope of services it provides, we assigned each hospital in our
study database to one of five comparison groups, or classes, according to its size and
teaching status (for definitions of each group, see the Methodology section):
§ Major Teaching Hospitals
§ Teaching Hospitals
§ Large Community Hospitals
§ Medium Community Hospitals
§ Small Community Hospitals
To judge hospitals fairly and compare them to like hospitals, we use these classes for
all scoring and ranking of hospitals to determine winners. For more information on
how we build the database, please see the Methodology section of this document.
Performance MeasuresBoth the 100 Top Hospitals award and the Everest Award are based on a set of
measures that reflect highly effective performance across the whole organization,
including board members, medical staff, management, and nursing. These measures
include patient outcomes and safety, national treatment standards (core measures),
patient satisfaction, operational efficiency, and financial stability.
The 10 measures used to select the 2013 winners are:
1. Risk-adjusted mortality index (in-hospital)‡
2. Risk-adjusted complications index‡
3. Risk-adjusted patient safety index‡
4. Core measures mean percent
5. 30-day risk-adjusted mortality rate for acute myocardial infarction (AMI),
heart failure, and pneumonia
6. 30-day risk-adjusted readmission rate for AMI, heart failure, and pneumonia
7. Severity-adjusted average length-of-stay‡
8. Case mix- and wage-adjusted inpatient expense per discharge
9. Adjusted operating profit margin
10. HCAHPS score (patient rating of overall hospital performance)
For full details, including calculation and scoring methods, please see the
Methodology section.
For the in-hospital mortality, complications, and patient safety — clinical measures
with low frequency of occurrence — we combine two years of data for each study
year to stabilize results. Starting with the 2013 100 Top Hospitals studies, the Truven
Health risk models have been re-calibrated using MedPAR 2009, 2010, and 2011 data
sets to take advantage of Present on Admission (POA) coding. POA coding first became
available in the 2009 MedPAR data set, so data are only available for three years.
‡ Due to availability of Present on Admission (POA) data, these measures contain only three years of data (2009, 2010, and 2011).

13100 Top HospiTals
In this study, we trended only three years, rather than the five used in previous
studies, combining data as follows:
§ Study year 2011 = 2011 and 2010 MedPAR datasets
§ Study year 2010 = 2010 and 2009 MedPAR datasets
§ Study year 2009 = 2009 and 2009 MedPAR datasets
The average length-of-stay measure is trended using only three years of data with
POA as well, but the data years are not combined for this metric. One year of data for
each study year is used. All other measures use five years of data.
For specific data years used for each measure, please see page 41 of the
Methodology section.
Final Selection: Ranking and Five-Year TrendingTo select the 100 Top Hospitals award winners, we rank hospitals on the basis
of their current-year performance on each of the study measures relative to other
hospitals in their comparison group. We then sum each hospital’s performance-
measure rankings and re-rank them, overall, to arrive at a final rank for the hospital.
(The 30-day rates by patient condition each receive a weight of one-sixth. All other
measures receive a weight of one.) The hospitals with the best final ranks in each
comparison group are selected as the 100 Top Hospitals award winners.
Separately, for every hospital in the study, we calculate a t-statistic that measures
five-year‡ performance improvement on each of the 10 performance measures. This
statistic measures both the direction and magnitude of change in performance, and
the statistical significance of that change. Within the five comparison groups, we
rank hospitals on the basis of their performance improvement t-statistic on each
of the study measures relative to other hospitals in their group. We then sum each
hospital’s performance-measure rankings and re-rank them, overall, to arrive at a
final rank for the hospital. The hospitals with the best final rank in each comparison
group are selected as the performance improvement benchmark hospitals.
As our final step, we align the two groups of benchmark hospitals and look for
overlap. Those that are identified as benchmarks on both lists are the Everest
Award winners.
‡ Due to availability of Present on Admission (POA) data, certain measures contain only three years of data (2009, 2010, and 2011). See previous page for details.
15100 Top HospiTals
Based on comparisons between the study winners and a peer group of similar
high-volume hospitals that were not winners, we found that if all hospitals
performed at the level of this year’s winners:
§ More than 164,000 additional lives could be saved
§ Nearly 82,000 additional patients could be complication-free
§ $6 billion could be saved
§ The typical patient could be released from the hospital half a day sooner
We based this analysis on the Medicare patients included in this study. If the same
standards were applied to all inpatients, the impact would be even greater.
How Are the Winners Outperforming Their Peers?In this section, we show how the 100 Top Hospitals performed within their
comparison groups, or classes (major teaching and teaching hospitals; and large,
medium, and small community hospitals), compared with nonwinning peers.
For performance measure details and definitions of each comparison group, please
see the Methodology section.
In Tables 1-6, data for the 100 Top Hospitals award winners are labeled Benchmark,
and data for all hospitals, excluding award winners, are labeled Peer Group. In
columns labeled Benchmark Compared with Peer Group, we calculate the actual and
percentage difference between the benchmark hospital scores and the peer group
scores. We found:
100 Top Hospitals Have Better Survival Rates § The winners had 7 percent fewer deaths than expected, considering patient
severity, while their nonwinning peers had as many deaths as would be
expected (Table 1).
§ Small community hospitals had the best survival rates and the most dramatic
difference between winners and nonwinners. Winning hospitals had 14 percent
fewer deaths that expected, while their peers had only 1 percent fewer (Table 6).
§ Major teaching hospitals are large organizations impacting many patient lives.
In this group, winning hospitals had 4 percent fewer deaths than nonwinning
hospitals. Large and medium-sized community hospitals also had a big impact,
with 5 and 6 percent fewer deaths, respectively, than their nonwinning
peers (Table 2).
Findings The Truven Health 100 Top Hospitals® outperform
their peers by demonstrating balanced excellence —
operating effectively across all functional areas of
their organizations. There’s no better way to see
how the nation’s health and the industry’s bottom
lines could be improved than by aggregating the
winner-versus-nonwinner data from this study.
16 100 Top HospiTals
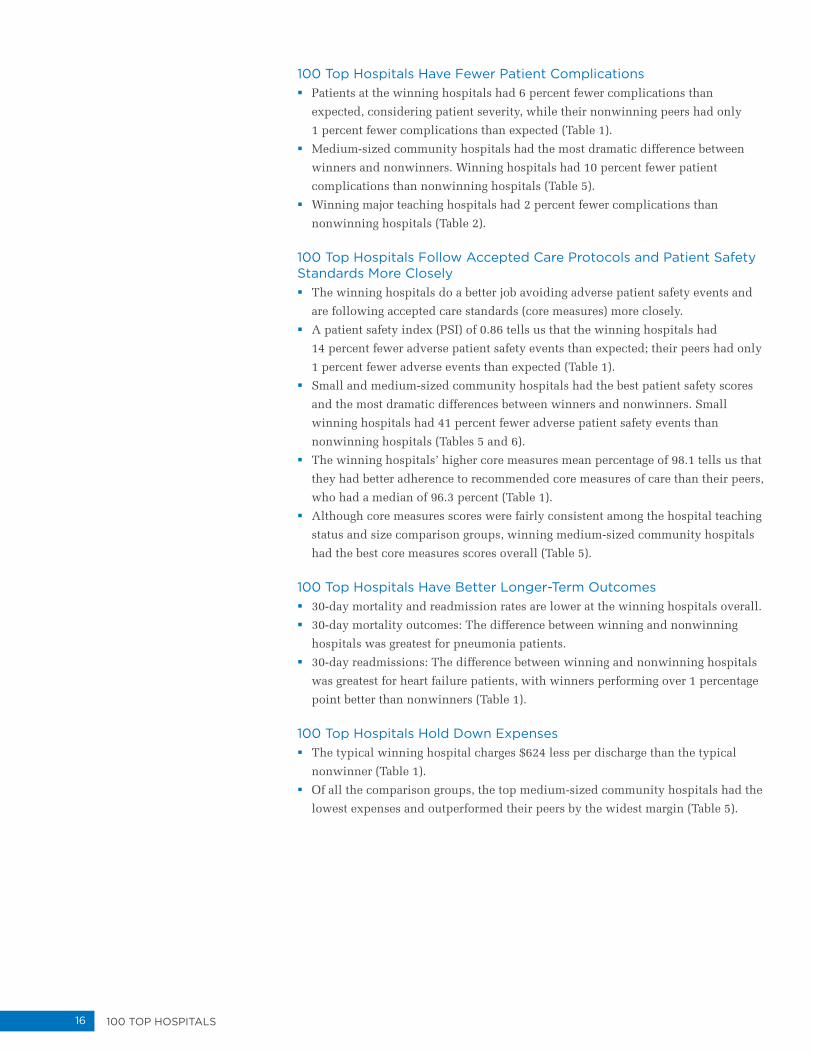
100 Top Hospitals Have Fewer Patient Complications § Patients at the winning hospitals had 6 percent fewer complications than
expected, considering patient severity, while their nonwinning peers had only
1 percent fewer complications than expected (Table 1).
§ Medium-sized community hospitals had the most dramatic difference between
winners and nonwinners. Winning hospitals had 10 percent fewer patient
complications than nonwinning hospitals (Table 5).
§ Winning major teaching hospitals had 2 percent fewer complications than
nonwinning hospitals (Table 2).
100 Top Hospitals Follow Accepted Care Protocols and Patient Safety Standards More Closely § The winning hospitals do a better job avoiding adverse patient safety events and
are following accepted care standards (core measures) more closely.
§ A patient safety index (PSI) of 0.86 tells us that the winning hospitals had
14 percent fewer adverse patient safety events than expected; their peers had only
1 percent fewer adverse events than expected (Table 1).
§ Small and medium-sized community hospitals had the best patient safety scores
and the most dramatic differences between winners and nonwinners. Small
winning hospitals had 41 percent fewer adverse patient safety events than
nonwinning hospitals (Tables 5 and 6).
§ The winning hospitals’ higher core measures mean percentage of 98.1 tells us that
they had better adherence to recommended core measures of care than their peers,
who had a median of 96.3 percent (Table 1).
§ Although core measures scores were fairly consistent among the hospital teaching
status and size comparison groups, winning medium-sized community hospitals
had the best core measures scores overall (Table 5).
100 Top Hospitals Have Better Longer-Term Outcomes § 30-day mortality and readmission rates are lower at the winning hospitals overall.
§ 30-day mortality outcomes: The difference between winning and nonwinning
hospitals was greatest for pneumonia patients.
§ 30-day readmissions: The difference between winning and nonwinning hospitals
was greatest for heart failure patients, with winners performing over 1 percentage
point better than nonwinners (Table 1).
100 Top Hospitals Hold Down Expenses § The typical winning hospital charges $624 less per discharge than the typical
nonwinner (Table 1).
§ Of all the comparison groups, the top medium-sized community hospitals had the
lowest expenses and outperformed their peers by the widest margin (Table 5).
17100 Top HospiTals
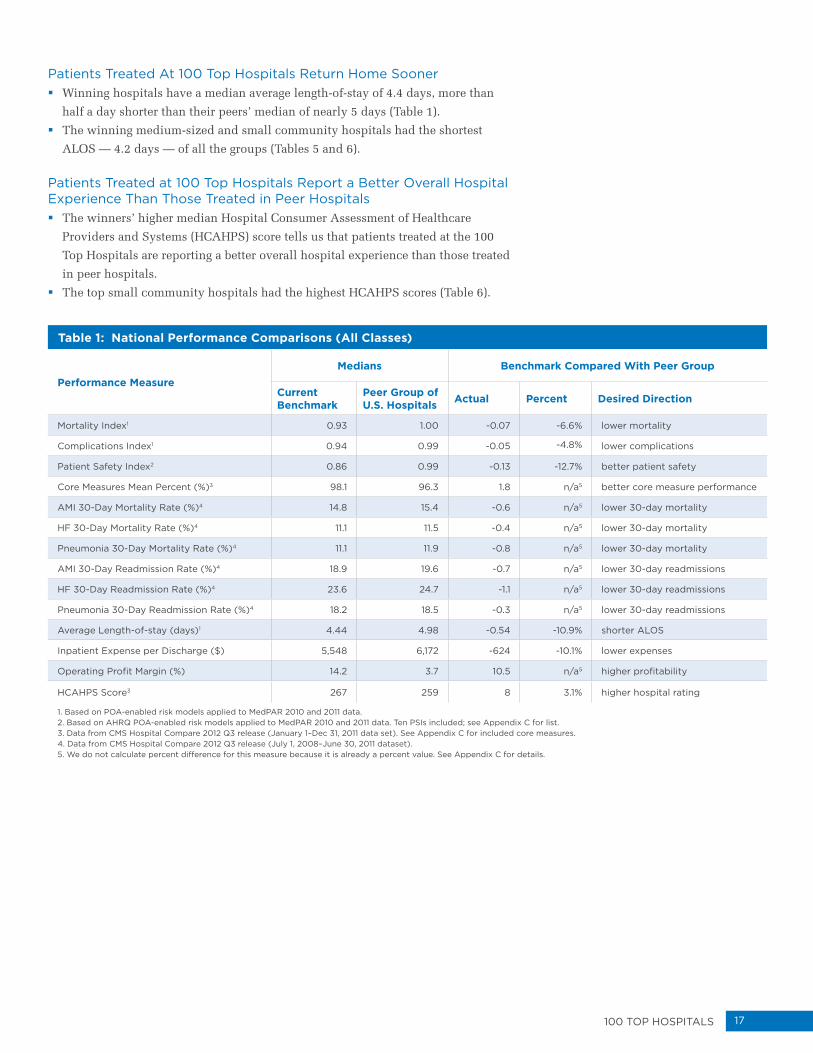
Patients Treated At 100 Top Hospitals Return Home Sooner § Winning hospitals have a median average length-of-stay of 4.4 days, more than
half a day shorter than their peers’ median of nearly 5 days (Table 1).
§ The winning medium-sized and small community hospitals had the shortest
ALOS — 4.2 days — of all the groups (Tables 5 and 6).
Patients Treated at 100 Top Hospitals Report a Better Overall Hospital Experience Than Those Treated in Peer Hospitals § The winners’ higher median Hospital Consumer Assessment of Healthcare
Providers and Systems (HCAHPS) score tells us that patients treated at the 100
Top Hospitals are reporting a better overall hospital experience than those treated
in peer hospitals.
§ The top small community hospitals had the highest HCAHPS scores (Table 6).
Table 1: National Performance Comparisons (All Classes)
Performance MeasureMedians Benchmark Compared With Peer Group
Current Benchmark
Peer Group of U.S. Hospitals Actual Percent Desired Direction
Mortality Index1 0.93 1.00 -0.07 -6.6% lower mortality
Complications Index1 0.94 0.99 -0.05 -4.8% lower complications
Patient Safety Index2 0.86 0.99 -0.13 -12.7% better patient safety
Core Measures Mean Percent (%)3 98.1 96.3 1.8 n/a5 better core measure performance
AMI 30-Day Mortality Rate (%)4 14.8 15.4 -0.6 n/a5 lower 30-day mortality
HF 30-Day Mortality Rate (%)4 11.1 11.5 -0.4 n/a5 lower 30-day mortality
Pneumonia 30-Day Mortality Rate (%)4 11.1 11.9 -0.8 n/a5 lower 30-day mortality
AMI 30-Day Readmission Rate (%)4 18.9 19.6 -0.7 n/a5 lower 30-day readmissions
HF 30-Day Readmission Rate (%)4 23.6 24.7 -1.1 n/a5 lower 30-day readmissions
Pneumonia 30-Day Readmission Rate (%)4 18.2 18.5 -0.3 n/a5 lower 30-day readmissions
Average Length-of-stay (days)1 4.44 4.98 -0.54 -10.9% shorter ALOS
Inpatient Expense per Discharge ($) 5,548 6,172 -624 -10.1% lower expenses
Operating Profit Margin (%) 14.2 3.7 10.5 n/a5 higher profitability
HCAHPS Score3 267 259 8 3.1% higher hospital rating
1. Based on POA-enabled risk models applied to MedPAR 2010 and 2011 data.2. Based on AHRQ POA-enabled risk models applied to MedPAR 2010 and 2011 data. Ten PSIs included; see Appendix C for list.3. Data from CMS Hospital Compare 2012 Q3 release (January 1–Dec 31, 2011 data set). See Appendix C for included core measures.4. Data from CMS Hospital Compare 2012 Q3 release (July 1, 2008–June 30, 2011 dataset).5. We do not calculate percent difference for this measure because it is already a percent value. See Appendix C for details.
18 100 Top HospiTals
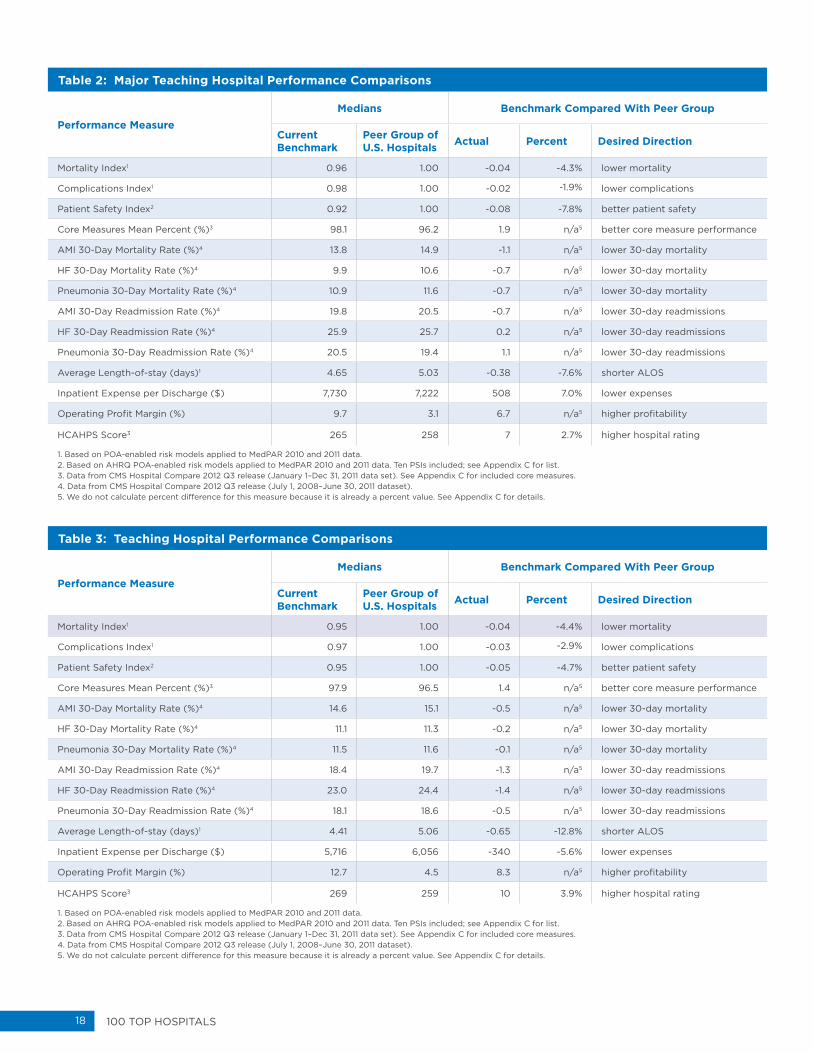
Table 2: Major Teaching Hospital Performance Comparisons
Performance MeasureMedians Benchmark Compared With Peer Group
Current Benchmark
Peer Group of U.S. Hospitals Actual Percent Desired Direction
Mortality Index1 0.96 1.00 -0.04 -4.3% lower mortality
Complications Index1 0.98 1.00 -0.02 -1.9% lower complications
Patient Safety Index2 0.92 1.00 -0.08 -7.8% better patient safety
Core Measures Mean Percent (%)3 98.1 96.2 1.9 n/a5 better core measure performance
AMI 30-Day Mortality Rate (%)4 13.8 14.9 -1.1 n/a5 lower 30-day mortality
HF 30-Day Mortality Rate (%)4 9.9 10.6 -0.7 n/a5 lower 30-day mortality
Pneumonia 30-Day Mortality Rate (%)4 10.9 11.6 -0.7 n/a5 lower 30-day mortality
AMI 30-Day Readmission Rate (%)4 19.8 20.5 -0.7 n/a5 lower 30-day readmissions
HF 30-Day Readmission Rate (%)4 25.9 25.7 0.2 n/a5 lower 30-day readmissions
Pneumonia 30-Day Readmission Rate (%)4 20.5 19.4 1.1 n/a5 lower 30-day readmissions
Average Length-of-stay (days)1 4.65 5.03 -0.38 -7.6% shorter ALOS
Inpatient Expense per Discharge ($) 7,730 7,222 508 7.0% lower expenses
Operating Profit Margin (%) 9.7 3.1 6.7 n/a5 higher profitability
HCAHPS Score3 265 258 7 2.7% higher hospital rating
1. Based on POA-enabled risk models applied to MedPAR 2010 and 2011 data.2. Based on AHRQ POA-enabled risk models applied to MedPAR 2010 and 2011 data. Ten PSIs included; see Appendix C for list.3. Data from CMS Hospital Compare 2012 Q3 release (January 1–Dec 31, 2011 data set). See Appendix C for included core measures.4. Data from CMS Hospital Compare 2012 Q3 release (July 1, 2008–June 30, 2011 dataset).5. We do not calculate percent difference for this measure because it is already a percent value. See Appendix C for details.
Table 3: Teaching Hospital Performance Comparisons
Performance MeasureMedians Benchmark Compared With Peer Group
Current Benchmark
Peer Group of U.S. Hospitals Actual Percent Desired Direction
Mortality Index1 0.95 1.00 -0.04 -4.4% lower mortality
Complications Index1 0.97 1.00 -0.03 -2.9% lower complications
Patient Safety Index2 0.95 1.00 -0.05 -4.7% better patient safety
Core Measures Mean Percent (%)3 97.9 96.5 1.4 n/a5 better core measure performance
AMI 30-Day Mortality Rate (%)4 14.6 15.1 -0.5 n/a5 lower 30-day mortality
HF 30-Day Mortality Rate (%)4 11.1 11.3 -0.2 n/a5 lower 30-day mortality
Pneumonia 30-Day Mortality Rate (%)4 11.5 11.6 -0.1 n/a5 lower 30-day mortality
AMI 30-Day Readmission Rate (%)4 18.4 19.7 -1.3 n/a5 lower 30-day readmissions
HF 30-Day Readmission Rate (%)4 23.0 24.4 -1.4 n/a5 lower 30-day readmissions
Pneumonia 30-Day Readmission Rate (%)4 18.1 18.6 -0.5 n/a5 lower 30-day readmissions
Average Length-of-stay (days)1 4.41 5.06 -0.65 -12.8% shorter ALOS
Inpatient Expense per Discharge ($) 5,716 6,056 -340 -5.6% lower expenses
Operating Profit Margin (%) 12.7 4.5 8.3 n/a5 higher profitability
HCAHPS Score3 269 259 10 3.9% higher hospital rating
1. Based on POA-enabled risk models applied to MedPAR 2010 and 2011 data.2. Based on AHRQ POA-enabled risk models applied to MedPAR 2010 and 2011 data. Ten PSIs included; see Appendix C for list.3. Data from CMS Hospital Compare 2012 Q3 release (January 1–Dec 31, 2011 data set). See Appendix C for included core measures.4. Data from CMS Hospital Compare 2012 Q3 release (July 1, 2008–June 30, 2011 dataset).5. We do not calculate percent difference for this measure because it is already a percent value. See Appendix C for details.

19100 Top HospiTals
Table 4: Large Community Hospital Performance Comparisons
Performance MeasureMedians Benchmark Compared With Peer Group
Current Benchmark
Peer Group of U.S. Hospitals Actual Percent Desired Direction
Mortality Index1 0.95 1.00 -0.05 -5.0% lower mortality
Complications Index1 0.95 1.00 -0.05 -4.9% lower complications
Patient Safety Index2 0.89 0.99 -0.10 -9.9% better patient safety
Core Measures Mean Percent (%)3 98.3 96.8 1.5 n/a5 better core measure performance
AMI 30-Day Mortality Rate (%)4 14.8 15.2 -0.4 n/a5 lower 30-day mortality
HF 30-Day Mortality Rate (%)4 11.5 11.3 0.2 n/a5 lower 30-day mortality
Pneumonia 30-Day Mortality Rate (%)4 11.2 11.6 -0.4 n/a5 lower 30-day mortality
AMI 30-Day Readmission Rate (%)4 19.1 19.7 -0.6 n/a5 lower 30-day readmissions
HF 30-Day Readmission Rate (%)4 23.1 24.7 -1.6 n/a5 lower 30-day readmissions
Pneumonia 30-Day Readmission Rate (%)4 18.6 18.5 0.1 n/a5 lower 30-day readmissions
Average Length-of-stay (days)1 4.58 5.12 -0.54 -10.6% shorter ALOS
Inpatient Expense per Discharge ($) 5,246 6,027 -780 -12.9% lower expenses
Operating Profit Margin (%) 10.9 5.5 5.4 n/a5 higher profitability
HCAHPS Score3 265 259 6 2.3% higher hospital rating
1. Based on POA-enabled risk models applied to MedPAR 2010 and 2011 data.2. Based on AHRQ POA-enabled risk models applied to MedPAR 2010 and 2011 data. Ten PSIs included; see Appendix C for list.3. Data from CMS Hospital Compare 2012 Q3 release (January 1–Dec 31, 2011 data set). See Appendix C for included core measures.4. Data from CMS Hospital Compare 2012 Q3 release (July 1, 2008–June 30, 2011 dataset).5. We do not calculate percent difference for this measure because it is already a percent value. See Appendix C for details.
Table 5: Medium-Sized Community Hospital Performance Comparisons
Performance MeasureMedians Benchmark Compared With Peer Group
Current Benchmark
Peer Group of U.S. Hospitals Actual Percent Desired Direction
Mortality Index1 0.94 1.00 -0.06 -6.2% lower mortality
Complications Index1 0.90 1.00 -0.10 -10.0% lower complications
Patient Safety Index2 0.74 0.99 -0.25 -25.4% better patient safety
Core Measures Mean Percent (%)3 98.4 96.5 2.0 n/a5 better core measure performance
AMI 30-Day Mortality Rate (%)4 14.8 15.5 -0.7 n/a5 lower 30-day mortality
HF 30-Day Mortality Rate (%)4 11.0 11.5 -0.5 n/a5 lower 30-day mortality
Pneumonia 30-Day Mortality Rate (%)4 11.4 11.9 -0.5 n/a5 lower 30-day mortality
AMI 30-Day Readmission Rate (%)4 18.8 19.5 -0.7 n/a5 lower 30-day readmissions
HF 30-Day Readmission Rate (%)4 23.6 24.7 -1.1 n/a5 lower 30-day readmissions
Pneumonia 30-Day Readmission Rate (%)4 17.4 18.5 -1.2 n/a5 lower 30-day readmissions
Average Length-of-stay (days)1 4.20 5.06 -0.86 -16.9% shorter ALOS
Inpatient Expense per Discharge ($) 4,833 6,055 -1,222 -20.2% lower expenses
Operating Profit Margin (%) 17.1 4.5 12.6 n/a5 higher profitability
HCAHPS Score3 263 257 6 2.1% higher hospital rating
1. Based on POA-enabled risk models applied to MedPAR 2010 and 2011 data.2. Based on AHRQ POA-enabled risk models applied to MedPAR 2010 and 2011 data. Ten PSIs included; see Appendix C for list.3. Data from CMS Hospital Compare 2012 Q3 release (January 1–Dec 31, 2011 data set). See Appendix C for included core measures.4. Data from CMS Hospital Compare 2012 Q3 release (July 1, 2008–June 30, 2011 dataset).5. We do not calculate percent difference for this measure because it is already a percent value. See Appendix C for details.

20 100 Top HospiTals
Table 6: Small Community Hospital Performance Comparisons
Performance MeasureMedians Benchmark Compared With Peer Group
Current Benchmark
Peer Group of U.S. Hospitals Actual Percent Desired Direction
Mortality Index1 0.86 0.99 -0.13 -12.9% lower mortality
Complications Index1 0.90 0.96 -0.06 -6.7% lower complications
Patient Safety Index2 0.59 0.99 -0.40 -40.5% better patient safety
Core Measures Mean Percent (%)3 98.0 95.8 2.1 n/a5 better core measure performance
AMI 30-Day Mortality Rate (%)4 15.9 15.7 0.2 n/a5 lower 30-day mortality
HF 30-Day Mortality Rate (%)4 11.5 11.8 -0.3 n/a5 lower 30-day mortality
Pneumonia 30-Day Mortality Rate (%)4 11.1 12.1 -1.0 n/a5 lower 30-day mortality
AMI 30-Day Readmission Rate (%)4 18.8 19.4 -0.6 n/a5 lower 30-day readmissions
HF 30-Day Readmission Rate (%)4 23.6 24.6 -1.1 n/a5 lower 30-day readmissions
Pneumonia 30-Day Readmission Rate (%)4 17.4 18.2 -0.8 n/a5 lower 30-day readmissions
Average Length-of-stay (days)1 4.20 5.04 -0.84 -16.7% shorter ALOS
Inpatient Expense per Discharge ($) 5,434 6,321 -887 -14.0% lower expenses
Operating Profit Margin (%) 14.9 2.1 12.8 n/a5 higher profitability
HCAHPS Score3 271 260 11 4.0% higher hospital rating
1. Based on POA-enabled risk models applied to MedPAR 2010 and 2011 data.2. Based on AHRQ POA-enabled risk models applied to MedPAR 2010 and 2011 data. Ten PSIs included; see Appendix C for list.3. Data from CMS Hospital Compare 2012 Q3 release (January 1–Dec 31, 2011 data set). See Appendix C for included core measures.4. Data from CMS Hospital Compare 2012 Q3 release (July 1, 2008–June 30, 2011 dataset).5. We do not calculate percent difference for this measure because it is already a percent value. See Appendix C for details.
Midwest Leads in Hospital Performance Hospital performance varies widely throughout the country. Regional differences
in the population's age and health, as well as differences in payment protocols,
greatly affect hospitals' abilities to improve patient outcomes and build healthy
business structures. The methodology of the 100 Top Hospitals studies helps to level
the playing field for some of the factors beyond a hospital's control by adjusting
for patient severity, wage differences, and hospital size and teaching status. Still,
regional variations in hospital performance are clear.
In this year’s study, about a third (35 and 32 out of 100, respectively) of the award
winners were located in the Midwest and South census regions. The West was close
behind, with 28 of the 100 winners. The Northeast had far fewer winning hospitals —
just 5 of the 2013 were located in this region. (See Appendix A for a breakdown
of all winners by state and census region, and Appendix B for a list of all states in
each region.)
Because the regions do not have equal numbers of hospitals, evaluating hospital
performance by looking at the number of winners by region can be deceiving.
To further assess regional performance, we prepared analysis that demonstrates
state-level performance over the last two years of the 100 Top Hospitals study.
To show performance by state, we ranked states and aggregated them into five equal
groups (quintiles) based on their performance in this year’s study versus other states.
21100 Top HospiTals
Colo.
Wash.
Qunitile 1-Best
Qunitile 2
Qunitile 3
Qunitile 4
Qunitile 5-Worst
Wyo.
Mont.
Idaho
Ore.
Calif.
Nev.Utah
Ariz.N.M.
Texas
Okla.
Kan.
S. D.
N. D.
Wis.
Mich.
Iowa
Mo.
Ark.
La.
Miss. Ala. Ga.
S.C.
N.C.
Tenn.
Ky.
Ill. Ind.Ohio
W. Va.Va.
Pa.
N.Y.R.I.
Maine
Vt.
Del.
Md.
N.H.Mass.
Conn.
Minn.
Neb.
Fla.
N.J.
Hawaii
100 Top Hospital Performance2013 Study State-Level Rankings
Alaska
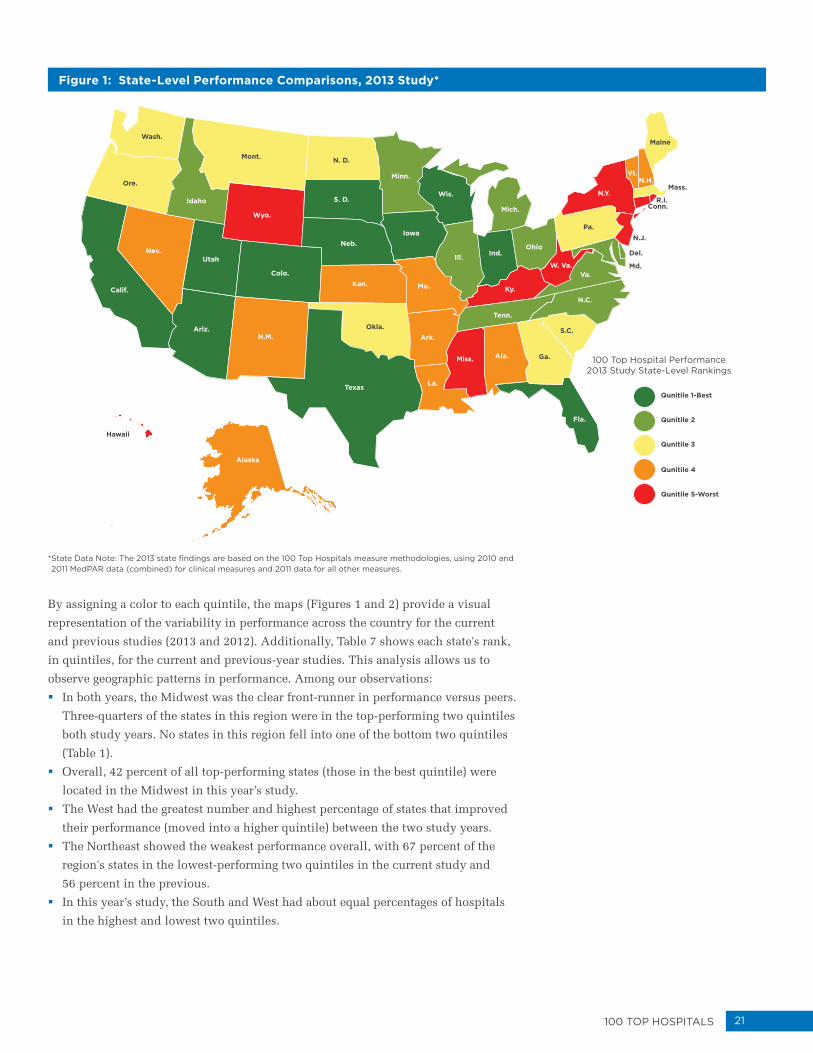
Figure 1: State-Level Performance Comparisons, 2013 Study*
* State Data Note: The 2013 state findings are based on the 100 Top Hospitals measure methodologies, using 2010 and 2011 MedPAR data (combined) for clinical measures and 2011 data for all other measures.
By assigning a color to each quintile, the maps (Figures 1 and 2) provide a visual
representation of the variability in performance across the country for the current
and previous studies (2013 and 2012). Additionally, Table 7 shows each state's rank,
in quintiles, for the current and previous-year studies. This analysis allows us to
observe geographic patterns in performance. Among our observations:
§ In both years, the Midwest was the clear front-runner in performance versus peers.
Three-quarters of the states in this region were in the top-performing two quintiles
both study years. No states in this region fell into one of the bottom two quintiles
(Table 1).
§ Overall, 42 percent of all top-performing states (those in the best quintile) were
located in the Midwest in this year’s study.
§ The West had the greatest number and highest percentage of states that improved
their performance (moved into a higher quintile) between the two study years.
§ The Northeast showed the weakest performance overall, with 67 percent of the
region's states in the lowest-performing two quintiles in the current study and
56 percent in the previous.
§ In this year’s study, the South and West had about equal percentages of hospitals
in the highest and lowest two quintiles.

22 100 Top HospiTals
Colo.
Wash.
Qunitile 1-Best
Qunitile 2
Qunitile 3
Qunitile 4
Qunitile 5-Worst
Wyo.
Mont.
Idaho
Ore.
Calif.
Nev.Utah
Ariz.N.M.
Texas
Okla.
Kan.
S. D.
N. D.
Wis.
Mich.
Iowa
Mo.
Ark.
La.
Miss. Ala. Ga.
S.C.
N.C.
Tenn.
Ky.
Ill. Ind.Ohio
W. Va.Va.
Pa.
N.Y.R.I.
Maine
Vt.
Del.
Md.
N.H.Mass.
Conn.
Minn.
Neb.
Fla.
N.J.
Hawaii
100 Top Hospital Performance2012 Study State-Level Rankings
Alaska
Figure 2: State-Level Performance Comparisons, 2012 Study
Table 7: 100 Top Hospitals Two-Year State-Level Performance Comparisons
Northeast Midwest South West
2013 Study* 2012 Study 2013 Study 2012 Study 2013 Study 2012 Study 2013 Study 2012 Study
Connecticut Connecticut Illinois Illinois Alabama Alabama Alaska Alaska
Maine Maine Indiana Indiana Arkansas Arkansas Arizona Arizona
Massachusetts Massachusetts Iowa Iowa Delaware Delaware California California
New Hampshire New Hampshire Kansas Kansas District of Columbia
District of Columbia
Colorado Colorado
New Jersey New Jersey Michigan Michigan Florida Florida Hawaii Hawaii
New York New York Minnesota Minnesota Georgia Georgia Idaho Idaho
Pennsylvania Pennsylvania Missouri Missouri Kentucky Kentucky Montana Montana
Rhode Island Rhode Island Nebraska Nebraska Louisiana Louisiana Nevada Nevada
Vermont Vermont North Dakota North Dakota Maryland Maryland New Mexico New Mexico
Ohio Ohio Mississippi Mississippi Oregon Oregon
South Dakota South Dakota North Carolina North Carolina Utah Utah
Wisconsin Wisconsin Oklahoma Oklahoma Washington Washington
South Carolina South Carolina Wyoming Wyoming
Tennessee Tennessee
Texas Texas
Virginia Virginia
West Virginia West Virginia
Colo.
Wash.
Qunitile 1-Best
Qunitile 2
Qunitile 3
Qunitile 4
Qunitile 5-Worst
Wyo.
Mont.
Idaho
Ore.
Calif.
Nev.Utah
Ariz.N.M.
Texas
Okla.
Kan.
S. D.
N. D.
Wis.
Mich.
Iowa
Mo.
Ark.
La.
Miss. Ala. Ga.
S.C.
N.C.
Tenn.
Ky.
Ill. Ind.Ohio
W. Va.Va.
Pa.
N.Y.R.I.
Maine
Vt.
Del.
Md.
N.H.Mass.
Conn.
Minn.
Neb.
Fla.
N.J.
Hawaii
100 Top Hospital Performance2013 Study State-Level Rankings
Alaska
* State Data Note: The 2013 state findings are based on the 100 Top Hospitals measure methodologies, using 2010 and 2011 MedPAR data (combined) for clinical measures and 2011 data for all other measures.
23100 Top HospiTals
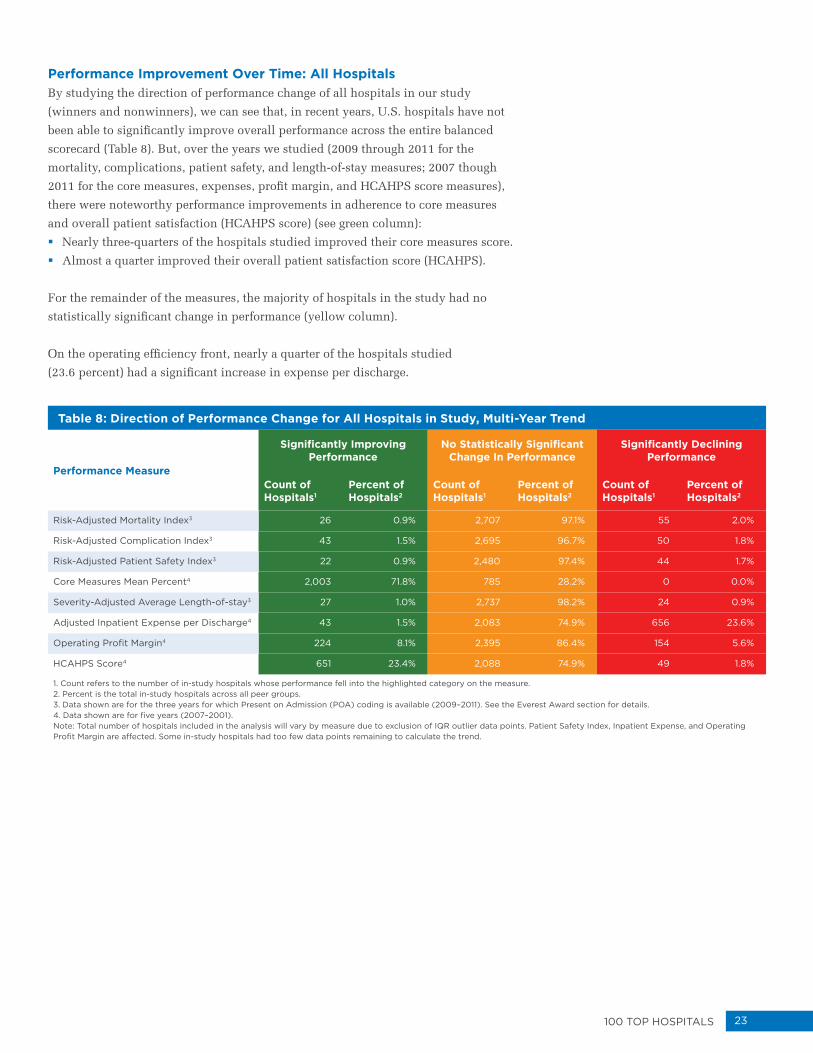
Performance Improvement Over Time: All Hospitals By studying the direction of performance change of all hospitals in our study
(winners and nonwinners), we can see that, in recent years, U.S. hospitals have not
been able to significantly improve overall performance across the entire balanced
scorecard (Table 8). But, over the years we studied (2009 through 2011 for the
mortality, complications, patient safety, and length-of-stay measures; 2007 though
2011 for the core measures, expenses, profit margin, and HCAHPS score measures),
there were noteworthy performance improvements in adherence to core measures
and overall patient satisfaction (HCAHPS score) (see green column):
§ Nearly three-quarters of the hospitals studied improved their core measures score.
§ Almost a quarter improved their overall patient satisfaction score (HCAHPS).
For the remainder of the measures, the majority of hospitals in the study had no
statistically significant change in performance (yellow column).
On the operating efficiency front, nearly a quarter of the hospitals studied
(23.6 percent) had a significant increase in expense per discharge.
Table 8: Direction of Performance Change for All Hospitals in Study, Multi-Year Trend
Performance Measure
Significantly Improving Performance
No Statistically Significant Change In Performance
Significantly Declining Performance
Count of Hospitals1
Percent of Hospitals2
Count of Hospitals1
Percent of Hospitals2
Count of Hospitals1
Percent of Hospitals2
Risk-Adjusted Mortality Index3 26 0.9% 2,707 97.1% 55 2.0%
Risk-Adjusted Complication Index3 43 1.5% 2,695 96.7% 50 1.8%
Risk-Adjusted Patient Safety Index3 22 0.9% 2,480 97.4% 44 1.7%
Core Measures Mean Percent4 2,003 71.8% 785 28.2% 0 0.0%
Severity-Adjusted Average Length-of-stay3 27 1.0% 2,737 98.2% 24 0.9%
Adjusted Inpatient Expense per Discharge4 43 1.5% 2,083 74.9% 656 23.6%
Operating Profit Margin4 224 8.1% 2,395 86.4% 154 5.6%
HCAHPS Score4 651 23.4% 2,088 74.9% 49 1.8%
1. Count refers to the number of in-study hospitals whose performance fell into the highlighted category on the measure.2. Percent is the total in-study hospitals across all peer groups.3. Data shown are for the three years for which Present on Admission (POA) coding is available (2009–2011). See the Everest Award section for details.4. Data shown are for five years (2007–2001).Note: Total number of hospitals included in the analysis will vary by measure due to exclusion of IQR outlier data points. Patient Safety Index, Inpatient Expense, and Operating Profit Margin are affected. Some in-study hospitals had too few data points remaining to calculate the trend.
24 100 Top HospiTals
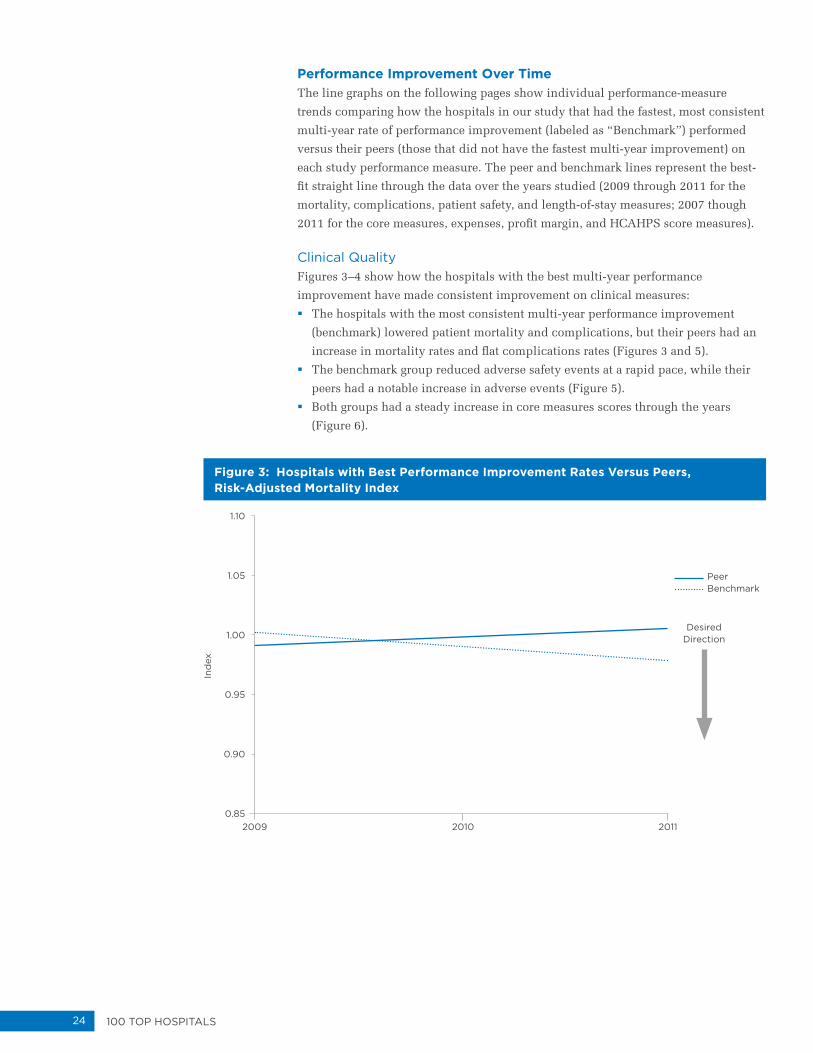
Performance Improvement Over TimeThe line graphs on the following pages show individual performance-measure
trends comparing how the hospitals in our study that had the fastest, most consistent
multi-year rate of performance improvement (labeled as “Benchmark”) performed
versus their peers (those that did not have the fastest multi-year improvement) on
each study performance measure. The peer and benchmark lines represent the best-
fit straight line through the data over the years studied (2009 through 2011 for the
mortality, complications, patient safety, and length-of-stay measures; 2007 though
2011 for the core measures, expenses, profit margin, and HCAHPS score measures).
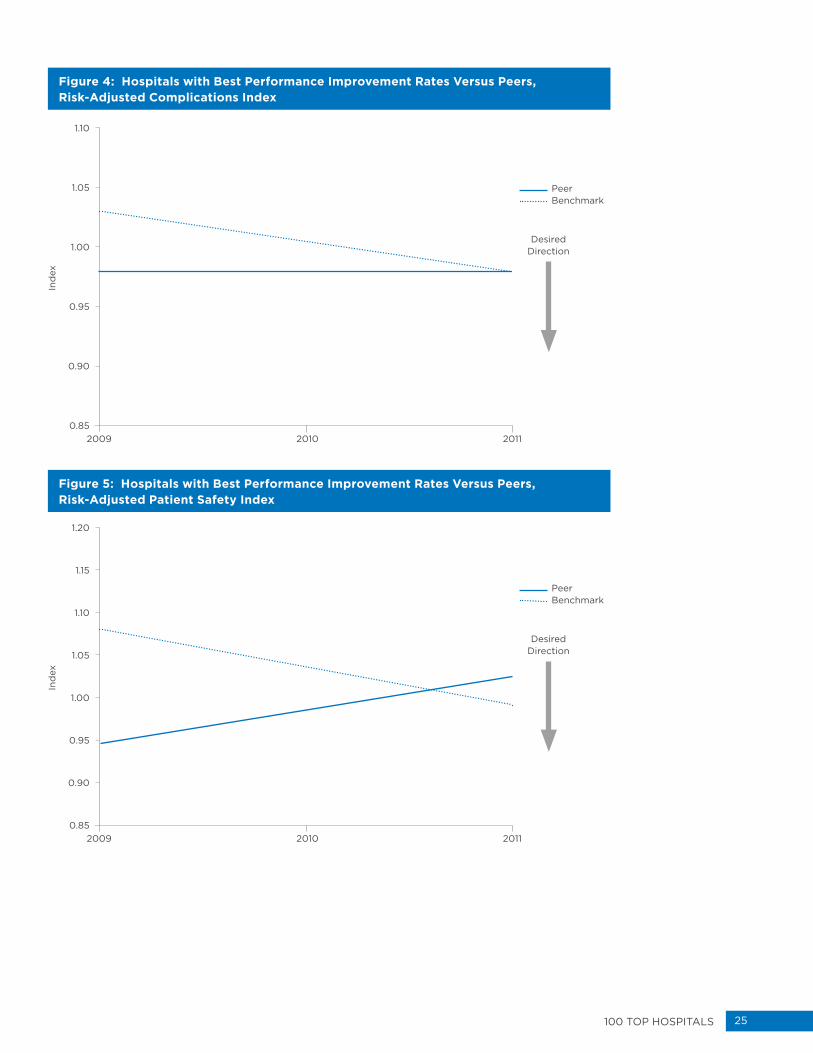
Clinical QualityFigures 3–4 show how the hospitals with the best multi-year performance
improvement have made consistent improvement on clinical measures:
§ The hospitals with the most consistent multi-year performance improvement
(benchmark) lowered patient mortality and complications, but their peers had an
increase in mortality rates and flat complications rates (Figures 3 and 5).
§ The benchmark group reduced adverse safety events at a rapid pace, while their
peers had a notable increase in adverse events (Figure 5).
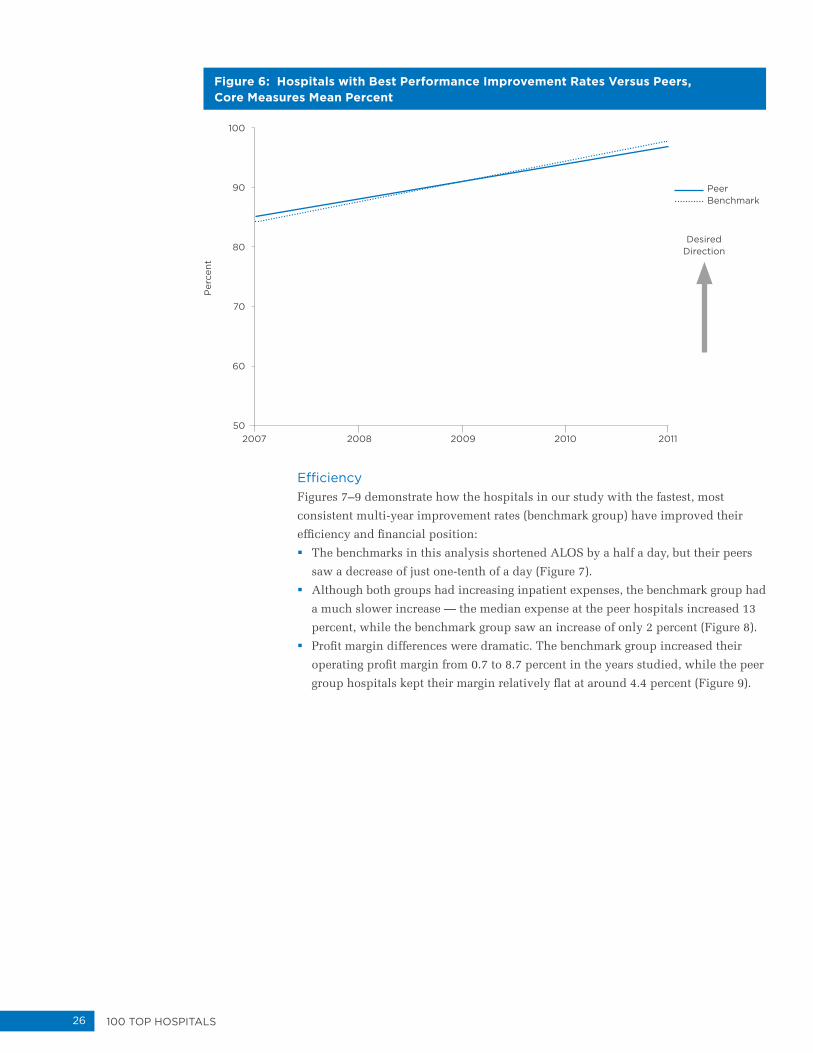
§ Both groups had a steady increase in core measures scores through the years
(Figure 6).
Figure 3: Hospitals with Best Performance Improvement Rates Versus Peers,Risk-Adjusted Mortality Index
Peer Benchmark
Desired Direction
Ind
ex
2009 2010 2011
1.10
1.05
1.00
0.95
0.90
0.85
25100 Top HospiTals
Figure 4: Hospitals with Best Performance Improvement Rates Versus Peers, Risk-Adjusted Complications Index
Peer Benchmark
Desired Direction
Ind
ex
2009 2010 2011
1.10
1.05
1.00
0.95
0.90
0.85
Figure 5: Hospitals with Best Performance Improvement Rates Versus Peers, Risk-Adjusted Patient Safety Index
Peer Benchmark
Desired Direction
Ind
ex
2009 2010 2011
1.20
1.15
1.10
1.05
1.00
0.95
0.90
0.85
26 100 Top HospiTals
Figure 6: Hospitals with Best Performance Improvement Rates Versus Peers, Core Measures Mean Percent
Peer Benchmark
Desired Direction
Per
cent
2007 2008 2009 2010 2011
100
90
80
70
60
50
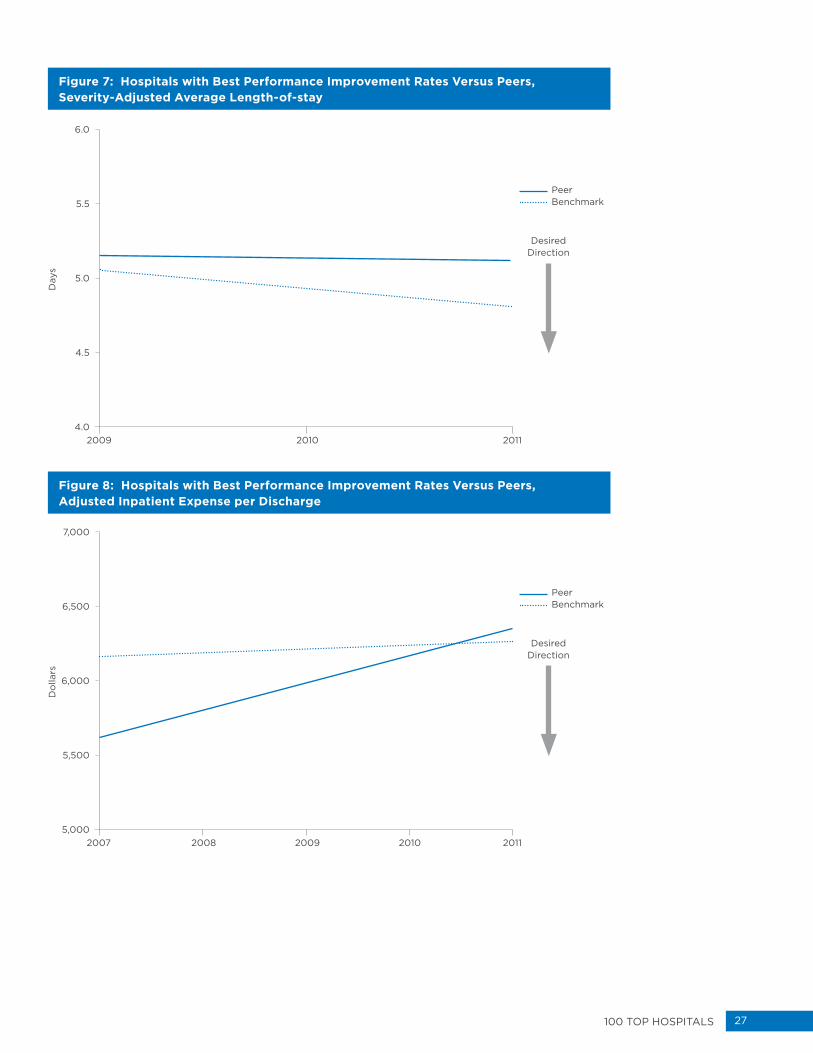
EfficiencyFigures 7–9 demonstrate how the hospitals in our study with the fastest, most
consistent multi-year improvement rates (benchmark group) have improved their
efficiency and financial position:
§ The benchmarks in this analysis shortened ALOS by a half a day, but their peers
saw a decrease of just one-tenth of a day (Figure 7).
§ Although both groups had increasing inpatient expenses, the benchmark group had
a much slower increase — the median expense at the peer hospitals increased 13
percent, while the benchmark group saw an increase of only 2 percent (Figure 8).
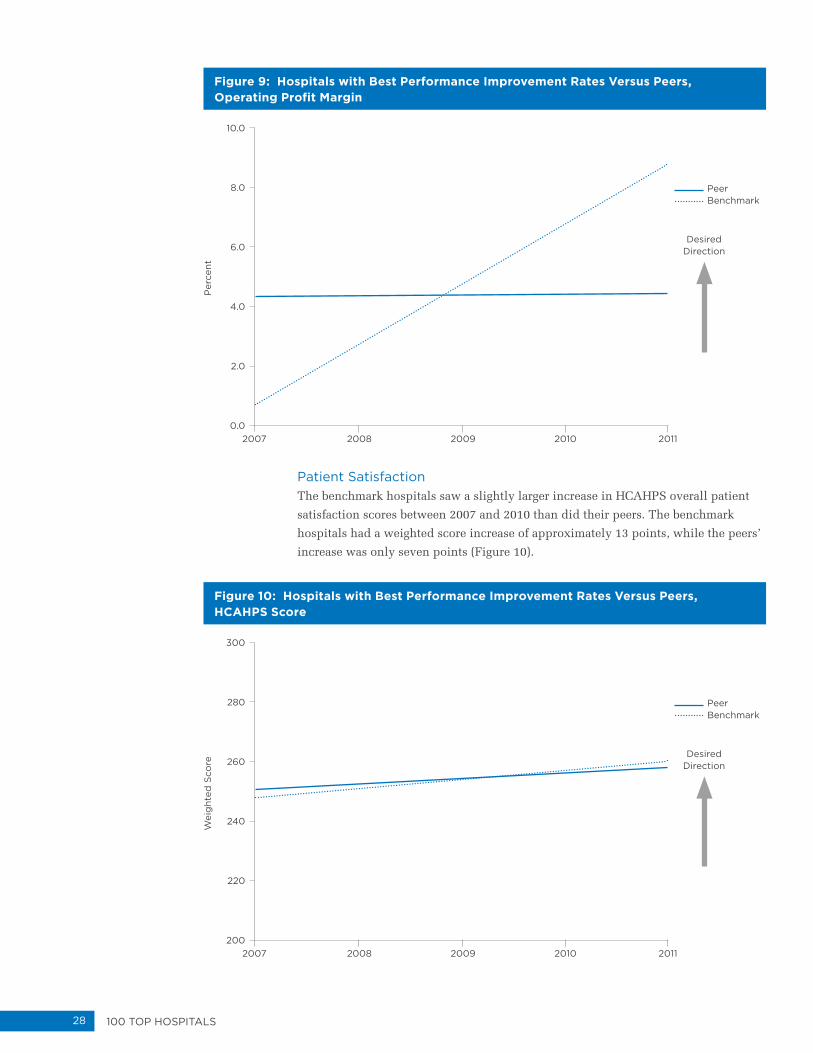
§ Profit margin differences were dramatic. The benchmark group increased their
operating profit margin from 0.7 to 8.7 percent in the years studied, while the peer
group hospitals kept their margin relatively flat at around 4.4 percent (Figure 9).
27100 Top HospiTals
Figure 7: Hospitals with Best Performance Improvement Rates Versus Peers, Severity-Adjusted Average Length-of-stay
Peer Benchmark
Desired Direction
Day
s
2009 2010 2011
6.0
5.5
5.0
4.5
4.0
Figure 8: Hospitals with Best Performance Improvement Rates Versus Peers, Adjusted Inpatient Expense per Discharge
Peer Benchmark
Desired Direction
Do
llars
2007 2008 2009 2010 2011
7,000
6,500
6,000
5,500
5,000
28 100 Top HospiTals
Patient SatisfactionThe benchmark hospitals saw a slightly larger increase in HCAHPS overall patient
satisfaction scores between 2007 and 2010 than did their peers. The benchmark
hospitals had a weighted score increase of approximately 13 points, while the peers’
increase was only seven points (Figure 10).
Figure 9: Hospitals with Best Performance Improvement Rates Versus Peers, Operating Profit Margin
Peer Benchmark
Desired Direction
Per
cent
2007 2008 2009 2010 2011
10.0
8.0
6.0
4.0
2.0
0.0
Figure 10: Hospitals with Best Performance Improvement Rates Versus Peers, HCAHPS Score
Peer Benchmark
Desired Direction
Wei
ght
ed S
core
2007 2008 2009 2010 2011
300
280
260
240
220
200
29100 Top HospiTals
The main steps we take in selecting the 100 Top Hospitals are:
§ Building the database of hospitals, including special selection and
exclusion criteria
§ Classifying hospitals into comparison groups by size and teaching status
§ Scoring hospitals on a balanced scorecard of 10 performance measures
§ Determining 100 Top Hospitals by ranking hospitals relative to their
comparison group
The following section is intended to be an overview of these steps. To request
more detailed information on any of the study methodologies outlined here, please
e-mail us at [email protected] or call +1.800.366.7526. Note: This
section details the methods used to produce the 100 Top Hospitals award winners.
For details on the methods used to find the Everest Award winners, please see the
Everest Awards section of this document.
Methodology The Truven Health 100 Top Hospitals® study
is quantitative research that identifies 100
hospitals with the highest achievement on the
100 Top Hospitals Balanced Scorecard.
The scorecard, based on Norton and Kaplan’s24
concept, consists of 10 measures, distributed
across four domains — quality, efficiency, finance,
and consumer assessment of care — and uses
only publicly available data. The hospitals with the
highest achievement are those with the highest
ranking on a composite score of the 10 measures.
This study includes only short-term, acute-care,
nonfederal U.S. hospitals that treat a broad
spectrum of patients.
30 100 Top HospiTals
Building the Database of Hospitals All of the 100 Top Hospitals studies use only publicly available data. The data for
this study primarily come from:
§ The Medicare Provider Analysis and Review (MedPAR) dataset
§ The Medicare Cost Report
§ The Centers for Medicare and Medicaid Services (CMS) Hospital Compare dataset
We use MedPAR patient-level medical record information to calculate mortality,
complications, patient safety, and length-of-stay. The MedPAR dataset contains
information on the approximately 14 million Medicare patients discharged annually
from U.S. acute-care hospitals. In this study, we used the most recent two federal
fiscal years of MedPAR data available — 2010 and 2011 — which include Medicare
HMO encounters.25
Note: To choose the Everest Award winners, we also reviewed the most recent
five years of data, 2007 through 2011, to study the rate of change in performance
through the years. To read more about the Everest Award methodology, please see the
special Everest Award section of this document. For specific data sources for each
performance measure, please see the table on page 41.
We use Medicare Cost Reports to create our proprietary database, which contains
hospital-specific demographic information and hospital-specific, all-payer revenue,
and expense data. The Medicare Cost Report is filed annually by every U.S. hospital
that participates in the Medicare program. Hospitals are required to submit cost
reports to receive reimbursement from Medicare. It should be noted, however, that
cost report data include services for all patients, not just Medicare beneficiaries.
The Medicare Cost Report promotes comparability and consistency among hospitals
in reporting. We used hospital 2011 cost reports, published in the federal Hospital
Cost Report Information System (HCRIS) third quarter 2012 dataset for this study.
Due to the change in Medicare cost report format requirements from version
2552-96 to version 2552-10, which caused a significant number of hospitals to be
delayed in filing 2011 cost reports, we also processed the 2010 cost reports for any
hospitals with missing or incomplete 2011 cost reports. These hospitals are included
in the study for purposes of analysis and comparison, but they are not included for
consideration as 100 Top winners.
If we did not have a 2011 or 2010 cost report that was complete, we excluded the
hospital from the study. Hospitals that file cost reports jointly with other hospitals
under one provider number are analyzed as one organization.
We, and many others in the healthcare industry, have used the MedPAR and
Medicare Cost Report databases for many years. We believe them to be accurate and
reliable sources for the types of analyses performed in this study. Performance based
on Medicare data has been found to be highly representative of that of all-payer data.
We used the CMS Hospital Compare dataset published in the third quarter of 2012
for core measures, 30-day mortality rates, 30-day readmission rates, and Hospital
Consumer Assessment of Healthcare Providers and Systems (HCAHPS) patient
perception of care data in this study.
31100 Top HospiTals
We used residency program information to classify hospitals. This comes from the
American Medical Association (for Accreditation Council for Graduate Medical
Education (ACGME)-accredited programs)26 and the American Osteopathic
Association (AOA).27
Severity-Adjustment Models and Present-on-Admission DataTruven Health proprietary severity adjustment models for mortality, complications
and length-of-stay (LOS) have been recalibrated using three years of MedPAR data
to take advantage of available present-on-admission (POA) data that was reported in
the 2009, 2010, and 2011 MedPAR data sets. In addition, the hospital characteristics
factors were dropped, as analysis indicated they did not contribute to improved
model performance.
The improved severity-adjustment models were used in producing the risk-adjusted
mortality and complications indexes, based on two years of MedPAR data (2010 and
2011); and the severity-adjusted LOS, based on MedPAR 2011.
In addition, the Agency for Healthcare Research and Quality (AHRQ) Patient Safety
Indicator risk models also take into account POA. Under the Deficit Reduction Act of
2005, as of federal fiscal year 2008, hospitals receive reduced payment for cases with
certain conditions — like falls, surgical site infections, and pressure ulcers — that
were not present on the patient’s admission but occur during their hospitalization.
As a result, CMS now requires all inpatient prospective payment system hospitals to
document whether a patient has these conditions when admitted.
Hospital ExclusionsAfter building the database, we excluded a number of hospitals that would have
skewed the study results. Excluded from the study were:
§ Specialty hospitals (e.g., critical access; children’s; women’s; psychiatric;
substance abuse; rehabilitation; cardiac; orthopedic; heart; cancer; and long-term,
acute-care hospitals)
§ Federally owned hospitals
§ Non-U.S. hospitals (such as those in Puerto Rico, Guam, and the
U.S. Virgin Islands)
§ Hospitals with fewer than 25 acute-care beds
§ Hospitals with fewer than 100 Medicare patient discharges in federal FFY 2011
§ Hospitals with Medicare average lengths of stay longer than 25 days in FFY 2011
§ Hospitals with no reported Medicare patient deaths in FFY 2011
§ Hospitals for which either a 2011 or 2010 Medicare Cost Report was not available
§ Hospitals with either a 2011 or 2010 Medicare Cost Report that was not for a
12-month reporting period
§ Hospitals that did not report POA information, because their data are not
comparable to other hospitals’ (affects most Maryland hospitals in the
Medicare waiver program*)
§ Hospitals missing data required to calculate performance measures
* Maryland’s hospitals are not paid under Medicare’s inpatient prospective payment system. Instead, they have a Medicare waiver agreement that allows Medicare reimbursement according to rates set by the state’s Health Services Cost Review Commission. For more information, see mhcc.maryland.gov/consumerinfo/hospitalguide/patients/other_information/overview_of_maryland_regulatory_system_for_hospital_oversight.html.
32 100 Top HospiTals
In addition, specific patient records were also excluded:
§ Patients who were discharged to another short-term facility
(this is done to avoid double counting)
§ Patients who were not at least 65 years old
§ Rehabilitation, psychiatric, and substance-abuse patients
§ Patients with stays shorter than one day
After all exclusions were applied, 2,922 hospitals were included in the study.
Classifying Hospitals into Comparison GroupsBed size, teaching status, and residency/fellowship program involvement have a
profound effect on the types of patients a hospital treats and the scope of services it
provides. When analyzing the performance of an individual hospital, it is important
to evaluate it against other similar hospitals. To address this, we assigned each
hospital to one of five comparison groups, or classes, according to its size and
teaching status.
Our classification methodology draws a significant distinction between major
teaching hospitals and teaching hospitals by measuring the magnitude and type of
teaching programs, and by accounting for their level of involvement in physician
education and research. This methodology de-emphasizes the role of bed size and
focuses more on teaching program involvement. Through it, we seek to measure both
the depth and breadth of teaching involvement and recognize teaching hospitals’
tendencies to reduce beds and concentrate on true tertiary care.
Our formula for defining the teaching comparison groups includes each hospital’s
bed size, residents†-to-acute-care beds ratio, and involvement in graduate medical
education programs accredited by either the ACGME26 or the AOA.27 The definition
includes both the magnitude (number of programs) and type (sponsorship or
participation) of graduate medical education (GME) program involvement. In this
study, AOA residency program involvement was treated as being equivalent to
ACGME program sponsorship.
The five comparison groups, and their parameters, are as follows:
Major Teaching Hospitals There are three ways to qualify:
1. 400 or more acute-care beds in service plus an intern and resident-per-bed ratio
of at least 0.25, plus
– Sponsorship of at least 10 GME programs or
– Involvement in at least 20 programs overall
2. Involvement in at least 30 GME programs overall
(regardless of bed size or intern and resident-per-bed ratio)
3. An intern and resident-per-bed ratio of at least 0.60
(regardless of bed size or GME program involvement)
† We include interns, residents, and fellows reported in full time equivalents (FTEs) on the hospital cost report.
33100 Top HospiTals
Teaching Hospitals § 200 or more acute-care beds in service and
§ Either an intern and resident-per-bed ratio of at least 0.03 or involvement in at
least three GME programs overall
Large Community Hospitals § 250 or more acute-care beds in service and
§ Not classified as a teaching hospital per definitions above
Medium Community Hospitals § 100–249 acute-care beds in service and
§ Not classified as a teaching hospital per definitions above
Small Community Hospitals § 25–99 acute-care beds in service and
§ Not classified as a teaching hospital per definitions above
Scoring Hospitals on Weighted Performance Measures
Evolution of Performance MeasuresWe use a balanced scorecard approach, based on public data, to select the measures
most useful for boards and CEOs in the current hospital operating environment.
Throughout the life of the study, we have worked hard to meet this vision. We gather
feedback from industry leaders, hospital executives, academic leaders, and internal
experts; review trends in the healthcare market; and survey hospitals in demanding
marketplaces to learn what measures are valid and reflective of top performance.
As the market has changed, our methods have evolved. Our current measures
are centered on four main components of hospital performance: clinical quality,
efficiency, financial health, and patient perception of care.
The measures for the 2013 study are:
1. Risk-adjusted mortality index (in-hospital)
2. Risk-adjusted complications index
3. Risk-adjusted patient safety index
4. Core measures mean percent
5. 30-day risk-adjusted mortality rates for acute myocardial infarction (AMI),
heart failure, and pneumonia
6. 30-day risk-adjusted readmission rates for AMI, heart failure, and pneumonia
7. Severity-adjusted average length-of-stay
8. Case mix- and wage-adjusted inpatient expense per discharge
9. Adjusted operating profit margin
10. HCAHPS score (patient rating of overall hospital performance)
Following is the rationale for the selection of our balanced scorecard categories and
the measures used for each.
34 100 Top HospiTals
Clinical QualityOur measures of clinical quality are the risk-adjusted mortality index, risk-adjusted
complications index, 30-day mortality rate, 30-day readmission rate, risk-adjusted
patient safety index, and the core measures mean percent.
The mortality and complications measures show us how the hospital is performing
on the most basic and essential care standards — survival and error-free care —
while treating patients in the hospital. The extended outcomes measures — 30-day
mortality and readmission rates for AMI, heart failure, and pneumonia patients —
help us understand how the hospital’s patients are faring over a longer period. These
measures are part of CMS’ value-based purchasing program and are watched closely
in the industry. Hospitals with lower values appear to be providing care with better
medium-term results for these conditions.
Patient safety is another important measure of hospital quality tracked closely in
the industry. The risk-adjusted patient safety index is based on the AHRQ PSIs.28
Patient safety measures reflect both clinical quality and the effectiveness of systems
within the hospital. Because they use hospital administrative data and focus on
surgical complications and other iatrogenic events, we feel that AHRQ’s PSIs provide
an unbiased look at many aspects of patient safety inside hospitals. Such objective
analysis is central to the 100 Top Hospitals mission. The risk-adjusted patient safety
index facilitates comparison of national and individual hospital performance using
a group of 10 PSIs, which allows us to gauge the results of hospital-wide patient
safety performance.
To be truly balanced, a scorecard must include various measures of quality.
To this end, we also include an aggregate core measures score. Core measures were
developed by the Joint Commission and CMS, and endorsed by the National Quality
Forum as minimum basic process-of-care standards. They are a widely accepted
method for measuring patient care quality that includes specific guidelines for heart
attack, heart failure, pneumonia, pregnancy and related conditions, and surgical
care. Our core measures score is based on the heart attack, heart failure, pneumonia,
and surgical care areas of this program, using Hospital Compare data reported on
the CMS Web site.29 In this study, we included only those core measures that CMS
has sanctioned for use in 2012. See Appendix C for a list.
Efficiency and Financial HealthThese categories include severity-adjusted average length-of-stay, adjusted inpatient
expense per discharge, and adjusted operating profit margin. Severity-adjusted
average length-of-stay serves as a proxy for clinical efficiency, while adjusted
inpatient expense per discharge serves as a measure of operating efficiency.
We previously used operating expense per adjusted discharge, which is the most
commonly used measure of hospital operating efficiency. This measure relies on
35100 Top HospiTals
adjusting discharges for outpatient volume based on the ratio of total inpatient
revenue to acute inpatient revenue. This overstates the number of discharges
allocated to outpatient volume because the mark-up on outpatient services is
generally much higher than for inpatient services. By switching to a metric based
on inpatient expense per inpatient discharge, we have a much stronger predictor
of operating efficiency. The operating profit margin is a measure of management’s
ability to operate within its current financial constraints and provides an indicator of
the hospital’s financial health.
All three measures require adjustment to increase the validity of comparisons
across the hospital industry. We use a Truven Health severity-adjustment model
to determine expected length-of-stay at the patient level. This is used to calculate
the hospital-level, severity-adjusted, average length-of-stay. We adjust inpatient
expenses, as reported on the hospital cost report, for patient severity (Medicare case
mix index) and area wage levels (area wage index). These adjustments allow us to
more accurately compare hospitals with different levels of patient severity operating
in varying cost-of-living environments. We adjust operating profit margin to reflect
related organization expense, as reported on the Medicare cost report, to provide a
more accurate measure of a hospital’s profitability.
Previous studies used the cash-to-total-debt ratio to look at a hospital’s liquidity.
Such measures of liquidity are one way to measure the financial viability and health
of an organization. However, measuring liquidity has become problematic as more
and more hospitals join health systems. Health system accounting practices often
recognize hospitals as units of the system, with no cash or investment assets of their
own; a typical practice is to sweep cash up to the system accounts daily. Moreover,
hospitals in health systems are now often reported as having no debt in their own
name. Using public data, there is no effective way to accurately determine liquidity,
so we have removed the cash-to-debt measure from the 100 Top Hospitals study.
Patient Perception of CareWe believe that a measure of patient perception of care is crucial to the balanced
scorecard concept. Understanding how patients perceive the care a hospital
provides, and how that perception compares and contrasts with perceptions
of its peers, is an important step a hospital must take in pursuing performance
improvement. As such, this study includes the HCAHPS score, based on patient
perception of care data from the HCAHPS patient survey. In this study, the HCAHPS
score is based on the HCAHPS overall hospital rating question only.
Through the combined measures described above, we hope to provide a balanced
picture of overall quality of care and financial health, and reflect the probability of
sustained high performance. Full details about each of these performance measures
are included on the following pages.

36 100 Top HospiTals
Performance Measures
Risk-Adjusted Mortality Index (In-Hospital)
Why We Include This Element Calculation Comment Favorable Values Are
Patient survival is a universally accepted measure of hospital quality. The lower the mortality index, the greater the survival of the patients in the hospital, considering what would be expected based on patient characteristics. While all hospitals have patient deaths, this measure can show where deaths did not occur but were expected, or the reverse, given the patient’s condition.
We calculate an index value based on the number of actual in-hospital deaths in 2010 and 2011, divided by the number expected, given the risk of death for each patient. We normalize the index based on the observed and expected deaths for each comparison group. This measure is based on our proprietary, risk-adjusted mortality index model, which is designed to predict the likelihood of a patient’s death based on patient-level characteristics (age, sex, presence of complicating diagnoses).
Palliative care patients are included in the risk model. POA data are considered as part of the risk model. Post-discharge deaths are not included. For more details, see Appendix C. The reference value for this index is 1.00; a value of 1.15 indicates 15 percent more deaths occurred than were predicted, and a value of 0.85 indicates 15 percent fewer deaths than predicted.
We rank hospitals on the difference between observed and expected deaths, expressed in normalized standard deviation units (z-score).30, 31 Hospitals with the fewest deaths, relative to the number expected, after accounting for standard binomial variability, received the most favorable scores. We use two years of MedPAR data (2010 and 2011) to reduce the influence of chance fluctuation. Normalization was done by comparison group.
Hospitals with observed values that were statistically worse than expected (95 percent confidence) were not eligible to be named as benchmarks.
Lower
Risk-Adjusted Complications Index
Why We Include This Element Calculation Comment Favorable Values Are
Keeping patients free from potentially avoidable complications is an important goal for all healthcare providers. A lower complications index indicates fewer patients with complications, considering what would be expected based on patient characteristics. Like the mortality index, this measure can show where complications did not occur but were expected, or the reverse, given the patient’s condition.
We calculate an index value based on the number of cases with complications in 2010 and 2011, divided by the number expected, given the risk of complications for each patient. We normalize the index based on the observed and expected complications for each comparison group. This measure uses our proprietary, expected complications rate index models. These models account for patient-level characteristics (age, sex, principal diagnosis, comorbid conditions, and other characteristics). Complications rates are calculated from normative data for two patient risk groups: medical and surgical. POA data are considered as part of the risk model. For more details, see Appendix C.
The reference value for this index is 1.00; a value of 1.15 indicates 15 percent more complications occurred than were predicted, and a value of 0.85 indicates 15 percent fewer complications than predicted.
We rank hospitals on the difference between the observed and expected number of patients with complications, expressed in normalized standard deviation units (z-score).30, 31 We use two years of MedPAR data (2010 and 2011) to reduce the influence of chance fluctuation. Normalization was done by comparison group. Hospitals with the fewest observed complications, relative to the number expected, after accounting for standard binomial variability, received the most favorable scores.
Hospitals with observed values that were statistically worse than expected(95 percent confidence) were not eligible to be named as benchmarks.
Lower

37100 Top HospiTals
Risk-Adjusted Patient Safety Index
Why We Include This Element Calculation Comment Favorable Values Are
Patient safety has become an increasingly important measure of hospital quality. Patient safety measures are reflective of both clinical quality and the effectiveness of systems within the hospital. The AHRQ, a public health service agency within the federal government’s Department of Health and Human Services, has developed a set of PSIs. These indicators are widely used as a means of measuring hospital safety. Because they use hospital administrative data and include surgical complications and other iatrogenic events, we feel that AHRQ’s PSIs provide an unbiased look at the quality of care inside hospitals. Such objective analysis is central to the 100 Top Hospitals mission.
For each of the 10 included PSIs (see Appendix C for a list), we calculated an index value based on the number of actual PSI occurrences for 2010 and 2011, combined, divided by the number of normalized expected occurrences, given the risk of the PSI event for each patient. Values were normalized by comparison group. We applied the hospital-level PSI methodology from AHRQ to the 2010 and 2011 MedPAR acute-care data, using AHRQ program code to adjust for risk.28 POA data are considered as part of the PSI model. For more information, see Appendix C.
The reference value for this index is 1.00; a value of 1.15 indicates 15 percent more events than predicted, and a value of 0.85 indicates 15 percent fewer.
We rank hospitals on the difference between the observed and expected number of patients with PSI events, for each of the 10 selected PSIs, expressed in standard deviation units (z-score).30, 31
We used two years of MedPAR data (2010 and 2011) to reduce the influence of chance fluctuation. The AHRQ PSI risk models used POA coding in the MedPAR data. We normalized z-scores by hospital comparison group and developed a mean normalized z-score as an aggregate PSI score. Hospitals with the fewest observed PSIs, relative to the number expected, accounting for binomial variability, received the most favorable scores.
Hospitals with extreme outlier values in this measure were not eligible to be named benchmarks (see “Eliminating Outliers” on page 41).
Lower
Core Measures Mean Percent
Why We Include This Element Calculation Comment Favorable Values Are
To be truly balanced, a scorecard must include various measures of quality. Core measures were developed by the National Quality Forum as minimum basic standards. They are a widely accepted method for measuring patient care quality that includes specific guidelines for heart attack, heart failure, pneumonia, and surgical care.
For each hospital, we calculate the arithmetic mean of the included core measure percent values. The reported core measure percent values reflect the percentage of eligible patients who received the expected standard of patient care. We consider reported core measure percents with patient counts less than or equal to 25 or with relative standard error values greater than or equal to 0.30 statistically unreliable. In these cases, we substitute the comparison group-specific median percent value for the affected core measure.
Core measure values are from the CMS Hospital Compare database for the third quarter of 2012. This contains data from January 1 through December 31, 2011. Because of low reporting, we excluded a number of core measures for small community hospitals.
We ranked hospitals by comparison group, based on their mean core measure percent value for included core measures.
For a list of the measures used and those excluded, please see Appendix C.
Higher
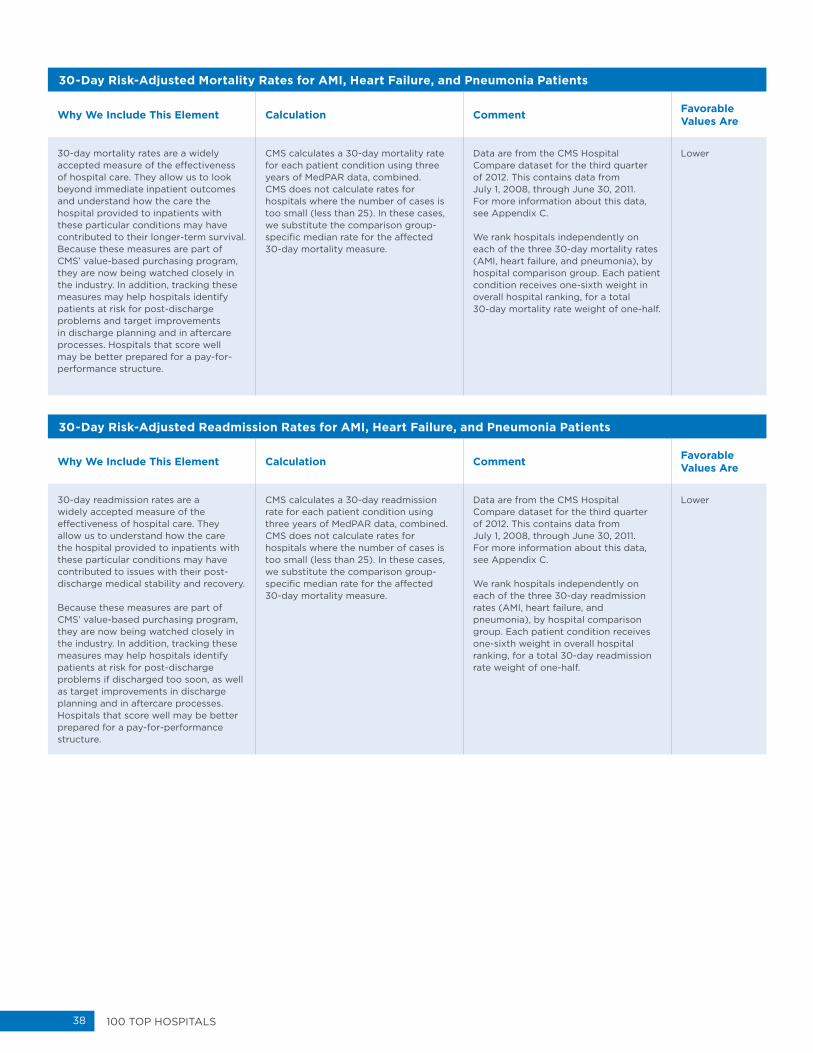
38 100 Top HospiTals
30-Day Risk-Adjusted Mortality Rates for AMI, Heart Failure, and Pneumonia Patients
Why We Include This Element Calculation Comment Favorable Values Are
30-day mortality rates are a widely accepted measure of the effectiveness of hospital care. They allow us to look beyond immediate inpatient outcomes and understand how the care the hospital provided to inpatients with these particular conditions may have contributed to their longer-term survival. Because these measures are part of CMS’ value-based purchasing program, they are now being watched closely in the industry. In addition, tracking these measures may help hospitals identify patients at risk for post-discharge problems and target improvements in discharge planning and in aftercare processes. Hospitals that score well may be better prepared for a pay-for-performance structure.
CMS calculates a 30-day mortality rate for each patient condition using three years of MedPAR data, combined. CMS does not calculate rates for hospitals where the number of cases is too small (less than 25). In these cases, we substitute the comparison group-specific median rate for the affected 30-day mortality measure.
Data are from the CMS Hospital Compare dataset for the third quarter of 2012. This contains data from July 1, 2008, through June 30, 2011. For more information about this data, see Appendix C.
We rank hospitals independently on each of the three 30-day mortality rates (AMI, heart failure, and pneumonia), by hospital comparison group. Each patient condition receives one-sixth weight in overall hospital ranking, for a total 30-day mortality rate weight of one-half.
Lower
30-Day Risk-Adjusted Readmission Rates for AMI, Heart Failure, and Pneumonia Patients
Why We Include This Element Calculation Comment Favorable Values Are
30-day readmission rates are a widely accepted measure of the effectiveness of hospital care. They allow us to understand how the care the hospital provided to inpatients with these particular conditions may have contributed to issues with their post-discharge medical stability and recovery.
Because these measures are part of CMS’ value-based purchasing program, they are now being watched closely in the industry. In addition, tracking these measures may help hospitals identify patients at risk for post-discharge problems if discharged too soon, as well as target improvements in discharge planning and in aftercare processes. Hospitals that score well may be better prepared for a pay-for-performance structure.
CMS calculates a 30-day readmission rate for each patient condition using three years of MedPAR data, combined. CMS does not calculate rates for hospitals where the number of cases is too small (less than 25). In these cases, we substitute the comparison group-specific median rate for the affected 30-day mortality measure.
Data are from the CMS Hospital Compare dataset for the third quarter of 2012. This contains data from July 1, 2008, through June 30, 2011. For more information about this data, see Appendix C.
We rank hospitals independently on each of the three 30-day readmission rates (AMI, heart failure, and pneumonia), by hospital comparison group. Each patient condition receives one-sixth weight in overall hospital ranking, for a total 30-day readmission rate weight of one-half.
Lower
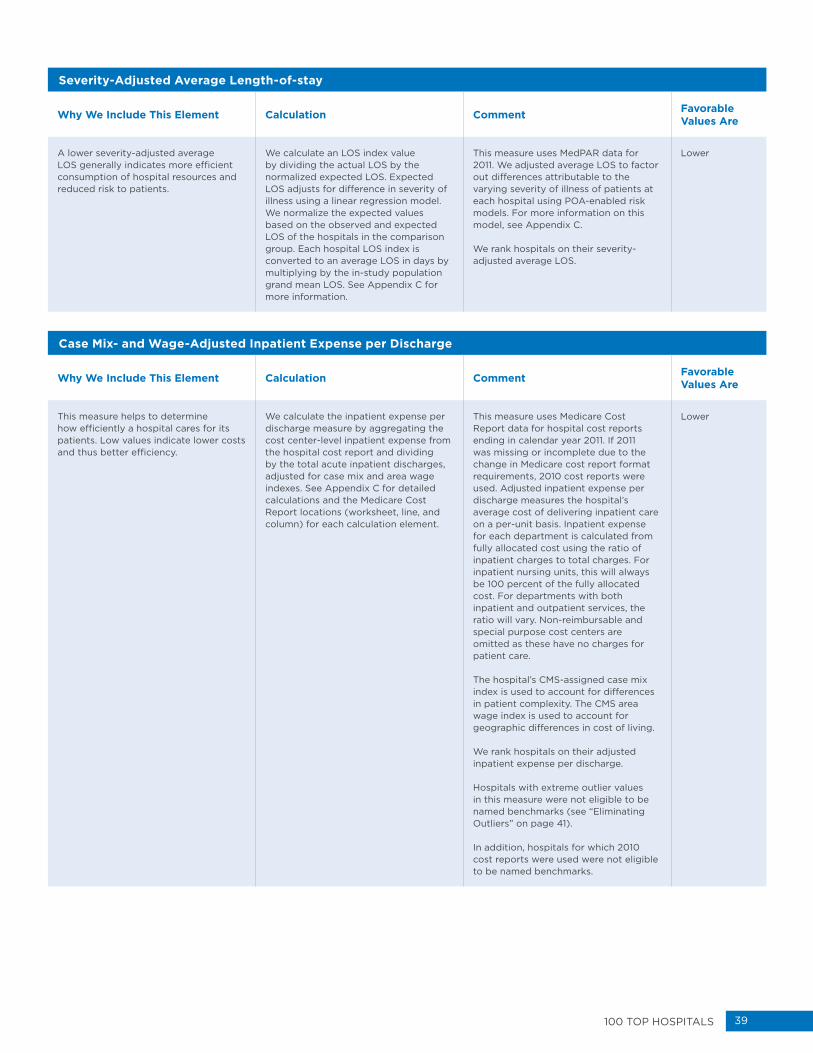
39100 Top HospiTals
Severity-Adjusted Average Length-of-stay
Why We Include This Element Calculation Comment Favorable Values Are
A lower severity-adjusted average LOS generally indicates more efficient consumption of hospital resources and reduced risk to patients.
We calculate an LOS index value by dividing the actual LOS by the normalized expected LOS. Expected LOS adjusts for difference in severity of illness using a linear regression model. We normalize the expected values based on the observed and expected LOS of the hospitals in the comparison group. Each hospital LOS index is converted to an average LOS in days by multiplying by the in-study population grand mean LOS. See Appendix C for more information.
This measure uses MedPAR data for 2011. We adjusted average LOS to factor out differences attributable to the varying severity of illness of patients at each hospital using POA-enabled risk models. For more information on this model, see Appendix C.
We rank hospitals on their severity-adjusted average LOS.
Lower
Case Mix- and Wage-Adjusted Inpatient Expense per Discharge
Why We Include This Element Calculation Comment Favorable Values Are
This measure helps to determine how efficiently a hospital cares for its patients. Low values indicate lower costs and thus better efficiency.
We calculate the inpatient expense per discharge measure by aggregating the cost center-level inpatient expense from the hospital cost report and dividing by the total acute inpatient discharges, adjusted for case mix and area wage indexes. See Appendix C for detailed calculations and the Medicare Cost Report locations (worksheet, line, and column) for each calculation element.
This measure uses Medicare Cost Report data for hospital cost reports ending in calendar year 2011. If 2011 was missing or incomplete due to the change in Medicare cost report format requirements, 2010 cost reports were used. Adjusted inpatient expense per discharge measures the hospital’s average cost of delivering inpatient care on a per-unit basis. Inpatient expense for each department is calculated from fully allocated cost using the ratio of inpatient charges to total charges. For inpatient nursing units, this will always be 100 percent of the fully allocated cost. For departments with both inpatient and outpatient services, the ratio will vary. Non-reimbursable and special purpose cost centers are omitted as these have no charges for patient care.
The hospital’s CMS-assigned case mix index is used to account for differences in patient complexity. The CMS area wage index is used to account for geographic differences in cost of living.
We rank hospitals on their adjusted inpatient expense per discharge.
Hospitals with extreme outlier values in this measure were not eligible to be named benchmarks (see “Eliminating Outliers” on page 41).
In addition, hospitals for which 2010 cost reports were used were not eligible to be named benchmarks.
Lower
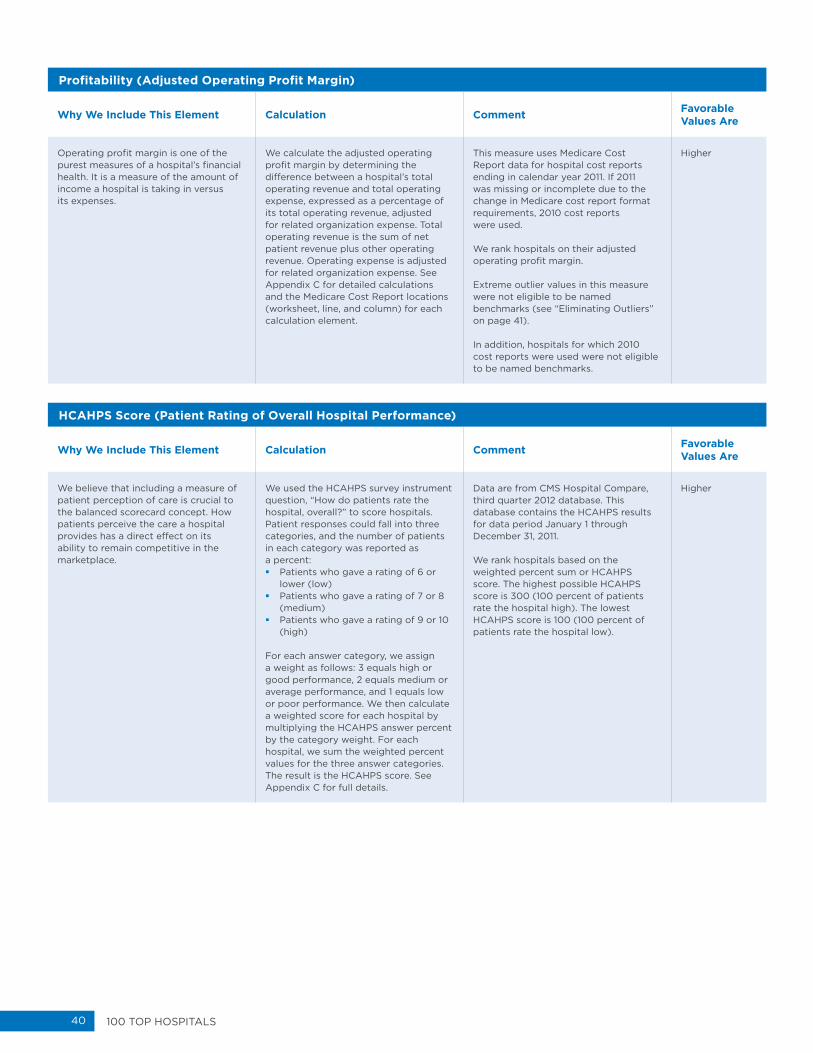
40 100 Top HospiTals
Profitability (Adjusted Operating Profit Margin)
Why We Include This Element Calculation Comment Favorable Values Are
Operating profit margin is one of the purest measures of a hospital’s financial health. It is a measure of the amount of income a hospital is taking in versus its expenses.
We calculate the adjusted operating profit margin by determining the difference between a hospital’s total operating revenue and total operating expense, expressed as a percentage of its total operating revenue, adjusted for related organization expense. Total operating revenue is the sum of net patient revenue plus other operating revenue. Operating expense is adjusted for related organization expense. See Appendix C for detailed calculations and the Medicare Cost Report locations (worksheet, line, and column) for each calculation element.
This measure uses Medicare Cost Report data for hospital cost reports ending in calendar year 2011. If 2011 was missing or incomplete due to the change in Medicare cost report format requirements, 2010 cost reports were used.
We rank hospitals on their adjusted operating profit margin.
Extreme outlier values in this measure were not eligible to be named benchmarks (see “Eliminating Outliers” on page 41).
In addition, hospitals for which 2010 cost reports were used were not eligible to be named benchmarks.
Higher
HCAHPS Score (Patient Rating of Overall Hospital Performance)
Why We Include This Element Calculation Comment Favorable Values Are
We believe that including a measure of patient perception of care is crucial to the balanced scorecard concept. How patients perceive the care a hospital provides has a direct effect on its ability to remain competitive in the marketplace.
We used the HCAHPS survey instrument question, “How do patients rate the hospital, overall?” to score hospitals. Patient responses could fall into three categories, and the number of patients in each category was reported as a percent: § Patients who gave a rating of 6 or
lower (low) § Patients who gave a rating of 7 or 8
(medium) § Patients who gave a rating of 9 or 10
(high)
For each answer category, we assign a weight as follows: 3 equals high or good performance, 2 equals medium or average performance, and 1 equals low or poor performance. We then calculate a weighted score for each hospital by multiplying the HCAHPS answer percent by the category weight. For each hospital, we sum the weighted percent values for the three answer categories. The result is the HCAHPS score. See Appendix C for full details.
Data are from CMS Hospital Compare, third quarter 2012 database. This database contains the HCAHPS results for data period January 1 through December 31, 2011.
We rank hospitals based on the weighted percent sum or HCAHPS score. The highest possible HCAHPS score is 300 (100 percent of patients rate the hospital high). The lowest HCAHPS score is 100 (100 percent of patients rate the hospital low).
Higher
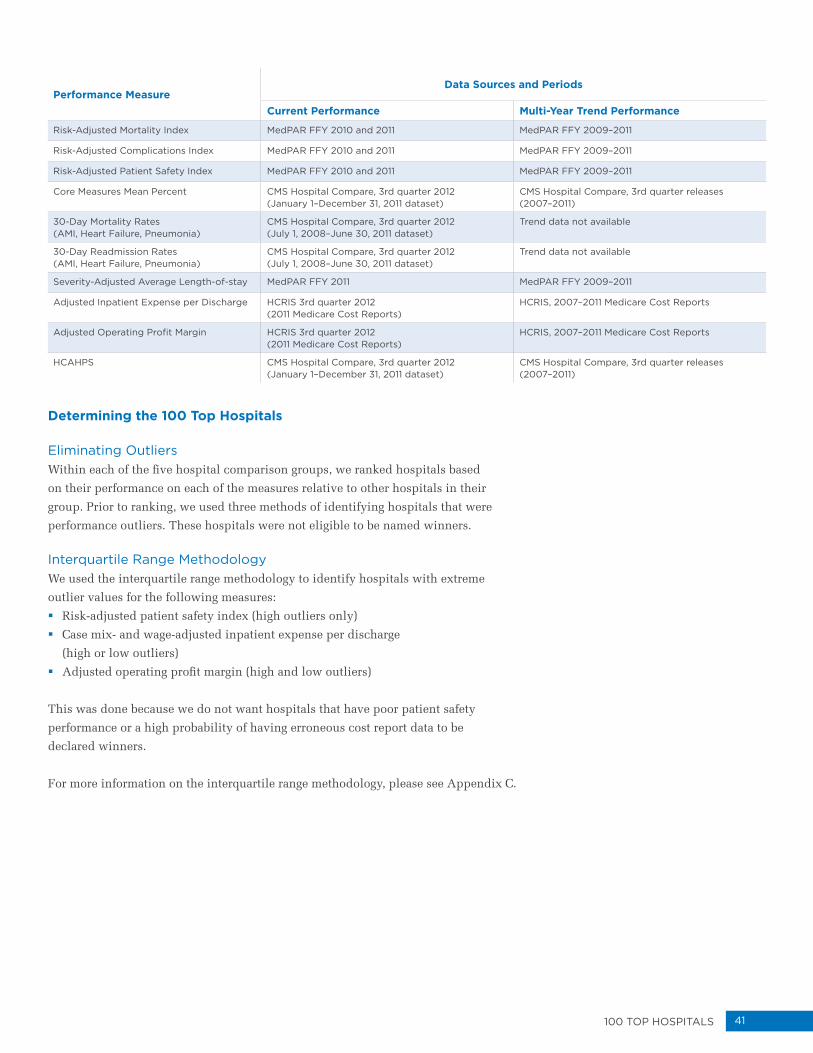
41100 Top HospiTals
Performance MeasureData Sources and Periods
Current Performance Multi-Year Trend Performance
Risk-Adjusted Mortality Index MedPAR FFY 2010 and 2011 MedPAR FFY 2009–2011
Risk-Adjusted Complications Index MedPAR FFY 2010 and 2011 MedPAR FFY 2009–2011
Risk-Adjusted Patient Safety Index MedPAR FFY 2010 and 2011 MedPAR FFY 2009–2011
Core Measures Mean Percent CMS Hospital Compare, 3rd quarter 2012 (January 1–December 31, 2011 dataset)
CMS Hospital Compare, 3rd quarter releases (2007–2011)
30-Day Mortality Rates(AMI, Heart Failure, Pneumonia)
CMS Hospital Compare, 3rd quarter 2012 (July 1, 2008–June 30, 2011 dataset)
Trend data not available
30-Day Readmission Rates(AMI, Heart Failure, Pneumonia)
CMS Hospital Compare, 3rd quarter 2012 (July 1, 2008–June 30, 2011 dataset)
Trend data not available
Severity-Adjusted Average Length-of-stay MedPAR FFY 2011 MedPAR FFY 2009–2011
Adjusted Inpatient Expense per Discharge HCRIS 3rd quarter 2012 (2011 Medicare Cost Reports)
HCRIS, 2007–2011 Medicare Cost Reports
Adjusted Operating Profit Margin HCRIS 3rd quarter 2012 (2011 Medicare Cost Reports)
HCRIS, 2007–2011 Medicare Cost Reports
HCAHPS CMS Hospital Compare, 3rd quarter 2012 (January 1–December 31, 2011 dataset)
CMS Hospital Compare, 3rd quarter releases (2007–2011)
Determining the 100 Top Hospitals
Eliminating OutliersWithin each of the five hospital comparison groups, we ranked hospitals based
on their performance on each of the measures relative to other hospitals in their
group. Prior to ranking, we used three methods of identifying hospitals that were
performance outliers. These hospitals were not eligible to be named winners.
Interquartile Range MethodologyWe used the interquartile range methodology to identify hospitals with extreme
outlier values for the following measures:
§ Risk-adjusted patient safety index (high outliers only)
§ Case mix- and wage-adjusted inpatient expense per discharge
(high or low outliers)
§ Adjusted operating profit margin (high and low outliers)
This was done because we do not want hospitals that have poor patient safety
performance or a high probability of having erroneous cost report data to be
declared winners.
For more information on the interquartile range methodology, please see Appendix C.

42 100 Top HospiTals
Mortality and Complications OutliersFor mortality and complications, which have observed and expected values, we
identified hospitals with performance that was statistically worse than expected.
This was done because we do not want hospitals that have poor clinical outcomes to
be declared winners.
Hospital mortality is considered worse than expected if the observed value
is higher than expected and the difference is statistically significant with 95
percent confidence. Confidence interval high and low index values (95 percent
confidence) are calculated. When a hospital’s observed value is 30 or greater, we
use the approximate binomial confidence interval methodology. When a hospital’s
observed value is less than 30, we use the exact mid-p binomial confidence interval
methodology. If the hospital’s low confidence interval index value is greater than or
equal to 1.0, the hospital is statistically worse than expected and is excluded from
the list of possible winners.
Operating Profit Margin OutliersWe identified hospitals with a negative adjusted operating profit margin as outliers.
This was done because we do not want hospitals that fail to meet this very basic
financial responsibility to be declared winners.
Winner Exclusion for No Current Cost ReportWe used hospital 2011 cost reports, published in the federal Hospital Cost Report
Information System (HCRIS) third quarter 2012 dataset, for this study. Due to the
change in Medicare cost report format requirements from version 2552-96 to version
2552-10, which caused a significant number of hospitals to be delayed in filing 2011
cost reports, we also processed the 2010 cost reports for any hospitals with missing
or incomplete 2011 cost reports. These hospitals are included in the study for
purposes of analysis and comparison, but they are not included for consideration as
100 Top winners, due to the age of their data.
RankingWithin the five hospital comparison groups, we ranked hospitals on the basis of their
performance on each of the performance measures independently, relative to other
hospitals in their group. Each performance measure is assigned a weight for use in
overall ranking. Each hospital’s performance measure ranks were summed to arrive
at a total score for the hospitals. The hospitals were then ranked based on their total
scores, and the hospitals with the best overall rankings in each comparison group
were selected as the winners.
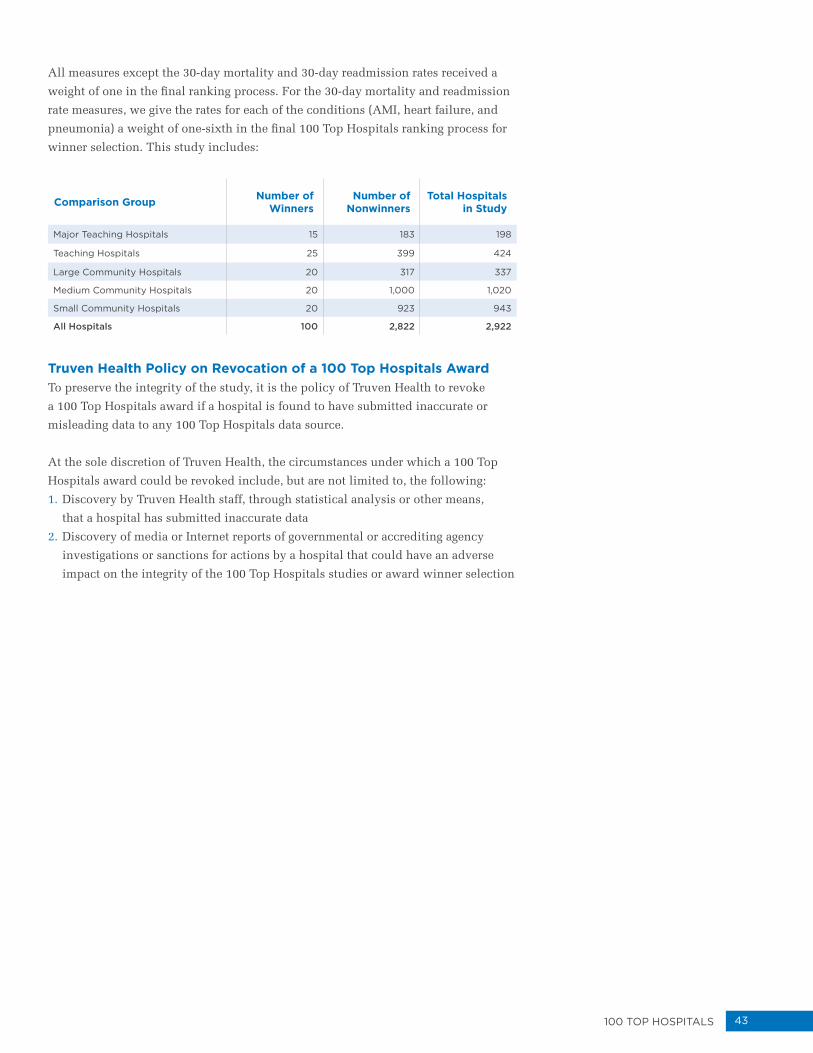
43100 Top HospiTals
All measures except the 30-day mortality and 30-day readmission rates received a
weight of one in the final ranking process. For the 30-day mortality and readmission
rate measures, we give the rates for each of the conditions (AMI, heart failure, and
pneumonia) a weight of one-sixth in the final 100 Top Hospitals ranking process for
winner selection. This study includes:
Comparison Group Number of Winners
Number of Nonwinners
Total Hospitals in Study
Major Teaching Hospitals 15 183 198
Teaching Hospitals 25 399 424
Large Community Hospitals 20 317 337
Medium Community Hospitals 20 1,000 1,020
Small Community Hospitals 20 923 943
All Hospitals 100 2,822 2,922
Truven Health Policy on Revocation of a 100 Top Hospitals AwardTo preserve the integrity of the study, it is the policy of Truven Health to revoke
a 100 Top Hospitals award if a hospital is found to have submitted inaccurate or
misleading data to any 100 Top Hospitals data source.
At the sole discretion of Truven Health, the circumstances under which a 100 Top
Hospitals award could be revoked include, but are not limited to, the following:
1. Discovery by Truven Health staff, through statistical analysis or other means,
that a hospital has submitted inaccurate data
2. Discovery of media or Internet reports of governmental or accrediting agency
investigations or sanctions for actions by a hospital that could have an adverse
impact on the integrity of the 100 Top Hospitals studies or award winner selection

45100 Top HospiTals
Winners Through The Years
* List is ordered by years won, then state, then hospital name.† Due to renaming of the studies to better align with the year in which they were produced, there was no "2010" study.
Hospital* Location
Total Year(s) Won Study Years†
199
3
199
4
199
5
199
6
199
7
199
8
199
9
200
0
200
1
200
2
200
3
200
4
200
5
200
6
200
7
200
8
200
9
20
11
2012
2013
NorthShore University HealthSystem
Evanston, IL 16● ● ● ● ● ● ● ● ● ● ● ● ● ● ● ●
Advocate Lutheran General Hospital
Park Ridge, IL 14● ● ● ● ● ● ● ● ● ● ● ● ● ●
Munson Medical Center Traverse City, MI 14 ● ● ● ● ● ● ● ● ● ● ● ● ● ●
Vanderbilt University Medical Center
Nashville, TN 13● ● ● ● ● ● ● ● ● ● ● ● ●
Brigham and Women's Hospital Boston, MA 12 ● ● ● ● ● ● ● ● ● ● ● ●
Saint Thomas Hospital Nashville, TN 12 ● ● ● ● ● ● ● ● ● ● ● ●
Beth Israel Deaconess Medical Center
Boston, MA 11● ● ● ● ● ● ● ● ● ● ●
EMH Regional Medical Center Elyria, OH 11 ● ● ● ● ● ● ● ● ● ● ●
Hillcrest Hospital Mayfield Heights, OH 11 ● ● ● ● ● ● ● ● ● ● ●
Licking Memorial Hospital Newark, OH 11 ● ● ● ● ● ● ● ● ● ● ●
Beaumont Hospital, Troy Troy, MI 10 ● ● ● ● ● ● ● ● ● ●
Mayo Clinic — Rochester Methodist Hospital
Rochester, MN 10● ● ● ● ● ● ● ● ● ●
Riverside Methodist Hospital Columbus, OH 10 ● ● ● ● ● ● ● ● ● ●
Providence St. Vincent Medical Center
Portland, OR 10● ● ● ● ● ● ● ● ● ●
Lancaster General Hospital Lancaster, PA 10 ● ● ● ● ● ● ● ● ● ●
Blake Medical Center Bradenton, FL 9 ● ● ● ● ● ● ● ● ●
Mease Countryside Hospital Safety Harbor, FL 9 ● ● ● ● ● ● ● ● ●
Mercy Medical Center North Iowa
Mason City, IA 9● ● ● ● ● ● ● ● ●
Kettering Medical Center Kettering, OH 9 ● ● ● ● ● ● ● ● ●
Mercy Hospital Anderson Cincinnati, OH 9 ● ● ● ● ● ● ● ● ●
Memorial Health Care System Chattanooga, TN 9 ● ● ● ● ● ● ● ● ●
Poudre Valley Hospital Fort Collins, CO 8 ● ● ● ● ● ● ● ●
Kendall Regional Medical Center Miami, FL 8 ● ● ● ● ● ● ● ●
Martin Health System Stuart, FL 8 ● ● ● ● ● ● ● ●
North Florida Regional Medical Center
Gainesville, FL 8● ● ● ● ● ● ● ●
Holland Hospital Holland, MI 8 ● ● ● ● ● ● ● ●

46 100 Top HospiTals
Hospital* Location
Total Year(s) Won Study Years†
199
3
199
4
199
5
199
6
199
7
199
8
199
9
200
0
200
1
200
2
200
3
200
4
200
5
200
6
200
7
200
8
200
9
20
11
2012
2013
Spectrum Health Hospital Group Grand Rapids, MI 8 ● ● ● ● ● ● ● ●
University of Michigan Hospitals & Health Centers
Ann Arbor, MI 8● ● ● ● ● ● ● ●
St. Cloud Hospital St. Cloud, MN 8 ● ● ● ● ● ● ● ●
Geisinger Medical Center Danville, PA 8 ● ● ● ● ● ● ● ●
Sanford USD Medical Center Sioux Falls, SD 8 ● ● ● ● ● ● ● ●
Scott and White Hospital Temple, TX 8 ● ● ● ● ● ● ● ●
Inova Fairfax Hospital Falls Church, VA 8 ● ● ● ● ● ● ● ●
University of Virginia Medical Center
Charlottesville, VA 8● ● ● ● ● ● ● ●
Desert Valley Hospital Victorville, CA 7 ● ● ● ● ● ● ●
St. Elizabeth Community Hospital
Red Bluff, CA 7● ● ● ● ● ● ●
Exempla Lutheran Medical Center
Wheat Ridge, CO 7● ● ● ● ● ● ●
Saint Francis Hospital and Medical Center
Hartford, CT 7● ● ● ● ● ● ●
Regional Medical Center Bayonet Point
Hudson, FL 7● ● ● ● ● ● ●
St. Luke's Boise Medical Center Boise, ID 7 ● ● ● ● ● ● ●
Northwestern Memorial Hospital Chicago, IL 7 ● ● ● ● ● ● ●
Silver Cross Hospital New Lenox, IL 7 ● ● ● ● ● ● ●
St. Vincent Indianapolis Hospital Indianapolis, IN 7 ● ● ● ● ● ● ●
Cleveland Clinic Foundation Cleveland, OH 7 ● ● ● ● ● ● ●
Southwest General Health Center
Middleburg Heights, OH 7● ● ● ● ● ● ●
York Hospital York, PA 7 ● ● ● ● ● ● ●
Castleview Hospital Price, UT 7 ● ● ● ● ● ● ●
St. Joseph Medical Center Tacoma, WA 7 ● ● ● ● ● ● ●
Chambers Memorial Hospital Danville, AR 6 ● ● ● ● ● ●
Scripps Green Hospital La Jolla, CA 6 ● ● ● ● ● ●
Rose Medical Center Denver, CO 6 ● ● ● ● ● ●
Leesburg Regional Medical Center
Leesburg, FL 6● ● ● ● ● ●
Medical Center of Trinity Trinity, FL 6 ● ● ● ● ● ●
Morton Plant Hospital Clearwater, FL 6 ● ● ● ● ● ●
Palmetto General Hospital Hialeah, FL 6 ● ● ● ● ● ●
Central DuPage Hospital Winfield, IL 6 ● ● ● ● ● ●
St. Elizabeth Healthcare Edgewood, KY 6 ● ● ● ● ● ●
Baystate Medical Center Springfield, MA 6 ● ● ● ● ● ●
Beverly Hospital Beverly, MA 6 ● ● ● ● ● ●
Newton-Wellesley Hospital Newton, MA 6 ● ● ● ● ● ●
Spectrum Health United Hospital
Greenville, MI 6● ● ● ● ● ●
William Beaumont Hospital-Royal Oak
Royal Oak, MI 6● ● ● ● ● ●
* List is ordered by years won, then state, then hospital name.† Due to renaming of the studies to better align with the year in which they were produced, there was no "2010" study.
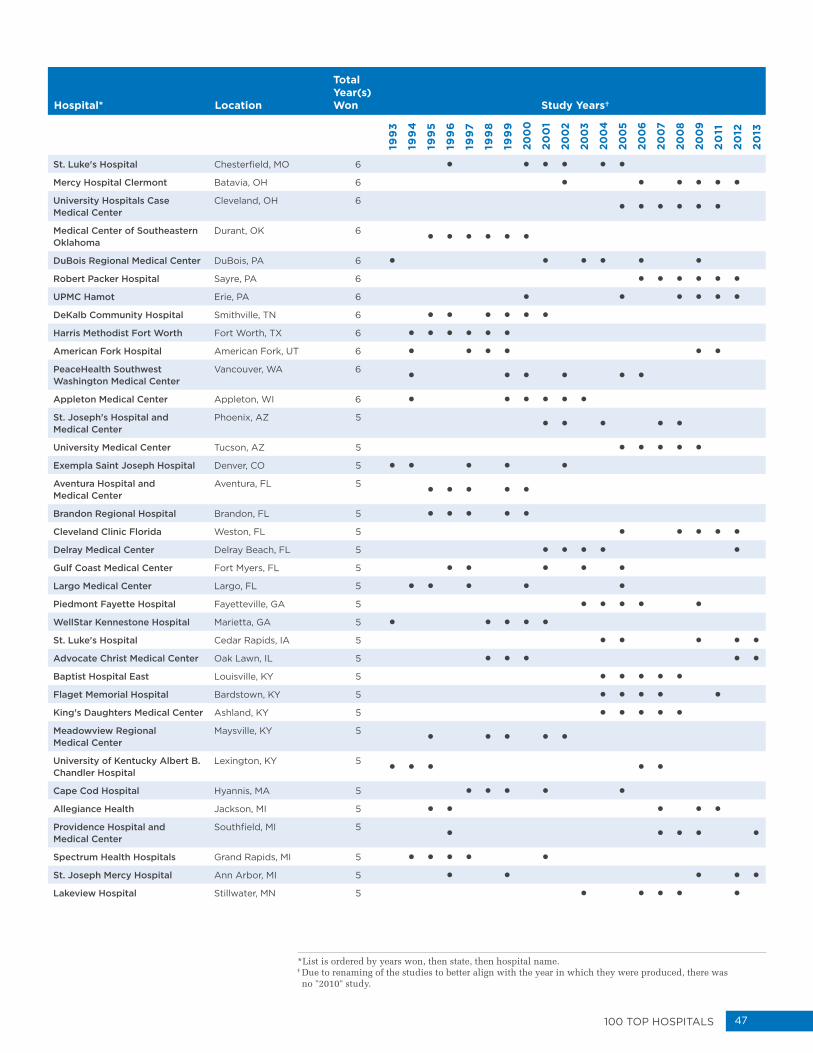
47100 Top HospiTals
Hospital* Location
Total Year(s) Won Study Years†
199
3
199
4
199
5
199
6
199
7
199
8
199
9
200
0
200
1
200
2
200
3
200
4
200
5
200
6
200
7
200
8
200
9
20
11
2012
2013
St. Luke's Hospital Chesterfield, MO 6 ● ● ● ● ● ●
Mercy Hospital Clermont Batavia, OH 6 ● ● ● ● ● ●
University Hospitals Case Medical Center
Cleveland, OH 6● ● ● ● ● ●
Medical Center of Southeastern Oklahoma
Durant, OK 6● ● ● ● ● ●
DuBois Regional Medical Center DuBois, PA 6 ● ● ● ● ● ●
Robert Packer Hospital Sayre, PA 6 ● ● ● ● ● ●
UPMC Hamot Erie, PA 6 ● ● ● ● ● ●
DeKalb Community Hospital Smithville, TN 6 ● ● ● ● ● ●
Harris Methodist Fort Worth Fort Worth, TX 6 ● ● ● ● ● ●
American Fork Hospital American Fork, UT 6 ● ● ● ● ● ●
PeaceHealth Southwest Washington Medical Center
Vancouver, WA 6● ● ● ● ● ●
Appleton Medical Center Appleton, WI 6 ● ● ● ● ● ●
St. Joseph's Hospital and Medical Center
Phoenix, AZ 5● ● ● ● ●
University Medical Center Tucson, AZ 5 ● ● ● ● ●
Exempla Saint Joseph Hospital Denver, CO 5 ● ● ● ● ●
Aventura Hospital and Medical Center
Aventura, FL 5● ● ● ● ●
Brandon Regional Hospital Brandon, FL 5 ● ● ● ● ●
Cleveland Clinic Florida Weston, FL 5 ● ● ● ● ●
Delray Medical Center Delray Beach, FL 5 ● ● ● ● ●
Gulf Coast Medical Center Fort Myers, FL 5 ● ● ● ● ●
Largo Medical Center Largo, FL 5 ● ● ● ● ●
Piedmont Fayette Hospital Fayetteville, GA 5 ● ● ● ● ●
WellStar Kennestone Hospital Marietta, GA 5 ● ● ● ● ●
St. Luke's Hospital Cedar Rapids, IA 5 ● ● ● ● ●
Advocate Christ Medical Center Oak Lawn, IL 5 ● ● ● ● ●
Baptist Hospital East Louisville, KY 5 ● ● ● ● ●
Flaget Memorial Hospital Bardstown, KY 5 ● ● ● ● ●
King's Daughters Medical Center Ashland, KY 5 ● ● ● ● ●
Meadowview Regional Medical Center
Maysville, KY 5● ● ● ● ●
University of Kentucky Albert B. Chandler Hospital
Lexington, KY 5● ● ● ● ●
Cape Cod Hospital Hyannis, MA 5 ● ● ● ● ●
Allegiance Health Jackson, MI 5 ● ● ● ● ●
Providence Hospital and Medical Center
Southfield, MI 5● ● ● ● ●
Spectrum Health Hospitals Grand Rapids, MI 5 ● ● ● ● ●
St. Joseph Mercy Hospital Ann Arbor, MI 5 ● ● ● ● ●
Lakeview Hospital Stillwater, MN 5 ● ● ● ● ●
* List is ordered by years won, then state, then hospital name.† Due to renaming of the studies to better align with the year in which they were produced, there was no "2010" study.

48 100 Top HospiTals
Hospital* Location
Total Year(s) Won Study Years†
199
3
199
4
199
5
199
6
199
7
199
8
199
9
200
0
200
1
200
2
200
3
200
4
200
5
200
6
200
7
200
8
200
9
20
11
2012
2013
Mayo Clinic — Saint Marys Hospital
Rochester, MN 5● ● ● ● ●
St. John's Mercy Hospital Washington, MO 5 ● ● ● ● ●
Mission Hospital Asheville, NC 5 ● ● ● ● ●
Saint Elizabeth Regional Medical Center
Lincoln, NE 5● ● ● ● ●
Aultman Hospital Canton, OH 5 ● ● ● ● ●
Sycamore Medical Center Miamisburg, OH 5 ● ● ● ● ●
The Christ Hospital Cincinnati, OH 5 ● ● ● ● ●
The Ohio State University Medical Center
Columbus, OH 5● ● ● ● ●
Avera McKennan Hospital & University Health Center
Sioux Falls, SD 5● ● ● ● ●
Jamestown Regional Medical Center
Jamestown, TN 5● ● ● ● ●
St. Mark's Hospital Salt Lake City, UT 5 ● ● ● ● ●
Valley View Medical Center Cedar City, UT 5 ● ● ● ● ●
Providence Regional Medical Center
Everett, WA 5● ● ● ● ●
St. Francis Hospital Federal Way, WA 5 ● ● ● ● ●
Aurora Sheboygan Memorial Medical Center
Sheboygan, WI 5● ● ● ● ●
Gundersen Lutheran La Crosse, WI 5 ● ● ● ● ●
Theda Clark Medical Center Neenah, WI 5 ● ● ● ● ●
Northwest Medical Center Tucson, AZ 4 ● ● ● ●
Payson Regional Medical Center
Payson, AZ 4● ● ● ●
Pomona Valley Hospital Medical Center
Pomona, CA 4● ● ● ●
Sutter Davis Hospital Davis, CA 4 ● ● ● ●
Torrance Memorial Medical Center
Torrance, CA 4● ● ● ●
UCSF Medical Center San Francisco, CA 4 ● ● ● ●
West Anaheim Medical Center Anaheim, CA 4 ● ● ● ●
Hartford Hospital Hartford, CT 4 ● ● ● ●
Middlesex Hospital Middletown, CT 4 ● ● ● ●
Gulf Coast Medical Center Panama City, FL 4 ● ● ● ●
JFK Medical Center Atlantis, FL 4 ● ● ● ●
Lee Memorial Health System Fort Myers, FL 4 ● ● ● ●
Memorial Hospital of Jacksonville
Jacksonville, FL 4● ● ● ●
Palms West Hospital Loxahatchee, FL 4 ● ● ● ●
Wellington Regional Medical Center
Wellington, FL 4● ● ● ●
Advocate Good Samaritan Hospital
Downers Grove, IL 4● ● ● ●
Advocate Illinois Masonic Medical Center
Chicago, IL 4● ● ● ●
* List is ordered by years won, then state, then hospital name.† Due to renaming of the studies to better align with the year in which they were produced, there was no "2010" study.

49100 Top HospiTals
Hospital* Location
Total Year(s) Won Study Years†
199
3
199
4
199
5
199
6
199
7
199
8
199
9
200
0
200
1
200
2
200
3
200
4
200
5
200
6
200
7
200
8
200
9
20
11
2012
2013
Riverside Medical Center Kankakee, IL 4 ● ● ● ●
Shelby Memorial Hospital Shelbyville, IL 4 ● ● ● ●
Major Hospital Shelbyville, IN 4 ● ● ● ●
Harlan ARH Hospital Harlan, KY 4 ● ● ● ●
Saint Joseph East Lexington, KY 4 ● ● ● ●
Milford Regional Medical Center Milford, MA 4 ● ● ● ●
Saint Vincent Hospital Worcester, MA 4 ● ● ● ●
Washington County Health System
Hagerstown, MD 4● ● ● ●
Gerber Memorial Health Services
Fremont, MI 4● ● ● ●
St. Joseph Mercy Saline Hospital Saline, MI 4 ● ● ● ●
St. Mary's Medical Center Duluth, MN 4 ● ● ● ●
Carolinas Medical Center-NorthEast
Concord, NC 4● ● ● ●
Gaston Memorial Hospital Gastonia, NC 4 ● ● ● ●
Albany Medical Center Albany, NY 4 ● ● ● ●
Bethesda North Hospital Cincinnati, OH 4 ● ● ● ●
Fairview Hospital Cleveland, OH 4 ● ● ● ●
Grant Medical Center Columbus, OH 4 ● ● ● ●
Summa Health System Akron, OH 4 ● ● ● ●
University Hospital Cincinnati, OH 4 ● ● ● ●
Providence Portland Medical Center
Portland, OR 4● ● ● ●
St. Charles Medical Center-Bend Bend, OR 4 ● ● ● ●
Paoli Hospital Paoli, PA 4 ● ● ● ●
The Western Pennsylvania Hospital
Pittsburgh, PA 4● ● ● ●
UPMC Northwest Seneca, PA 4 ● ● ● ●
Baptist Hospital Nashville, TN 4 ● ● ● ●
Baptist Hospital of East Tennessee
Knoxville, TN 4● ● ● ●
Centennial Medical Center Nashville, TN 4 ● ● ● ●
Hendersonville Medical Center Hendersonville, TN 4 ● ● ● ●
Maury Regional Medical Center Columbia, TN 4 ● ● ● ●
Clear Lake Regional Medical Center
Webster, TX 4● ● ● ●
East Texas Medical Center Tyler Tyler, TX 4 ● ● ● ●
Memorial Hermann Hospital System
Houston, TX 4● ● ● ●
Mother Frances Hospital-Tyler Tyler, TX 4 ● ● ● ●
St. David's Medical Center Austin, TX 4 ● ● ● ●
University Medical Center Brackenridge
Austin, TX 4● ● ● ●
Alta View Hospital Sandy, UT 4 ● ● ● ●
* List is ordered by years won, then state, then hospital name.† Due to renaming of the studies to better align with the year in which they were produced, there was no "2010" study.

50 100 Top HospiTals
Hospital* Location
Total Year(s) Won Study Years†
199
3
199
4
199
5
199
6
199
7
199
8
199
9
200
0
200
1
200
2
200
3
200
4
200
5
200
6
200
7
200
8
200
9
20
11
2012
2013
Augusta Health Fishersville, VA 4 ● ● ● ●
St. Clare Hospital Lakewood, WA 4 ● ● ● ●
Bellin Hospital Green Bay, WI 4 ● ● ● ●
Sauk Prairie Memorial Hospital & Clinics
Prairie du Sac, WI 4● ● ● ●
University of Wisconsin Hospital and Clinics
Madison, WI 4● ● ● ●
Andalusia Regional Hospital Andalusia, AL 3 ● ● ●
Baptist Medical Center East Montgomery, AL 3 ● ● ●
Banner Boswell Medical Center Sun City, AZ 3 ● ● ●
Mt. Graham Regional Medical Center
Safford, AZ 3● ● ●
Paradise Valley Hospital Phoenix, AZ 3 ● ● ●
Wickenburg Community Hospital
Wickenburg, AZ 3● ● ●
Providence Little Company of Mary Medical Center
Torrance, CA 3● ● ●
Sutter Medical Center, Sacramento
Sacramento, CA 3● ● ●
Tri-City Medical Center Oceanside, CA 3 ● ● ●
UC San Diego Medical Center San Diego, CA 3 ● ● ●
St. Anthony North Hospital Westminster, CO 3 ● ● ●
Danbury Hospital Danbury, CT 3 ● ● ●
Yale-New Haven Hospital New Haven, CT 3 ● ● ●
Baptist Hospital Miami, FL 3 ● ● ●
Memorial Hospital West Pembroke Pines, FL 3 ● ● ●
Ocala Regional Medical Center Ocala, FL 3 ● ● ●
Orange Park Medical Center Orange Park, FL 3 ● ● ●
Orlando Regional Medical Center
Orlando, FL 3● ● ●
Sacred Heart Hospital on the Emerald Coast
Miramar Beach, FL 3● ● ●
St. Vincent's Medical Center Jacksonville, FL 3 ● ● ●
Fairview Park Hospital Dublin, GA 3 ● ● ●
Meadows Regional Medical Center
Vidalia, GA 3● ● ●
WellStar Douglas Hospital Douglasville, GA 3 ● ● ●
Centegra Northern Illinois Medical Center
McHenry, IL 3● ● ●
Crossroads Community Hospital Mount Vernon, IL 3 ● ● ●
Memorial Hospital of Carbondale
Carbondale, IL 3● ● ●
Marion General Hospital Marion, IN 3 ● ● ●
St. Mary's Medical Center Evansville, IN 3 ● ● ●
Wishard Health Services Indianapolis, IN 3 ● ● ●
* List is ordered by years won, then state, then hospital name.† Due to renaming of the studies to better align with the year in which they were produced, there was no "2010" study.
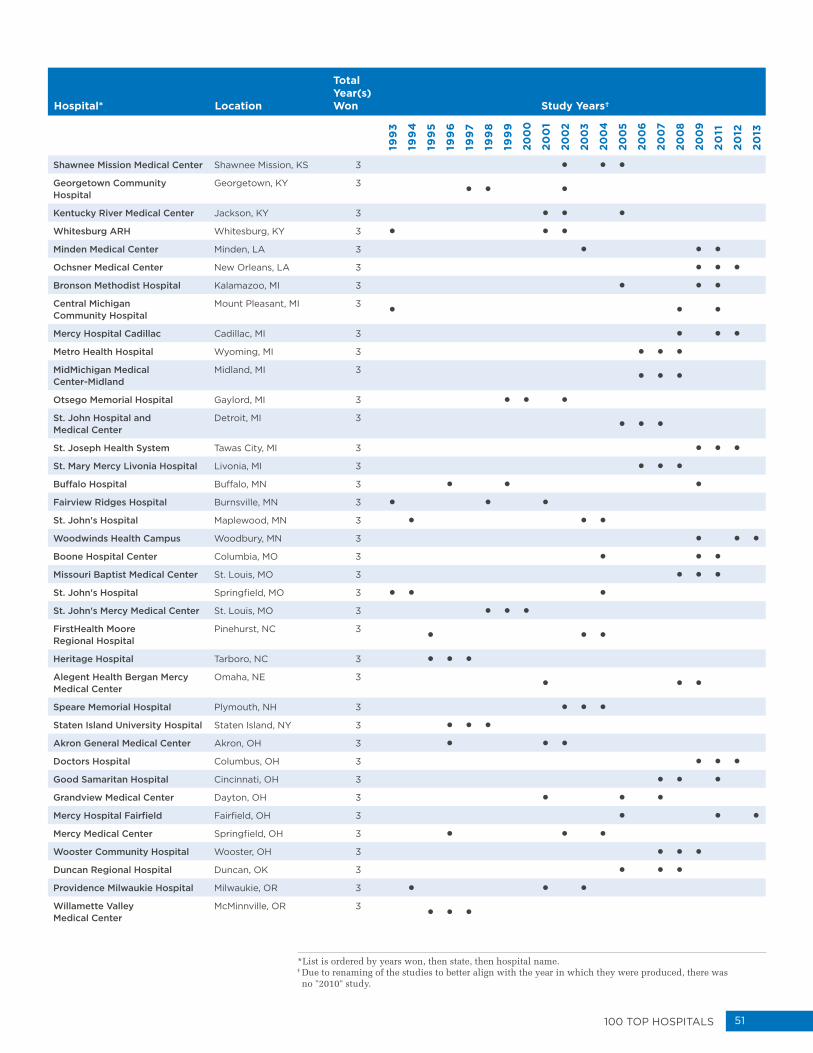
51100 Top HospiTals
Hospital* Location
Total Year(s) Won Study Years†
199
3
199
4
199
5
199
6
199
7
199
8
199
9
200
0
200
1
200
2
200
3
200
4
200
5
200
6
200
7
200
8
200
9
20
11
2012
2013
Shawnee Mission Medical Center Shawnee Mission, KS 3 ● ● ●
Georgetown Community Hospital
Georgetown, KY 3● ● ●
Kentucky River Medical Center Jackson, KY 3 ● ● ●
Whitesburg ARH Whitesburg, KY 3 ● ● ●
Minden Medical Center Minden, LA 3 ● ● ●
Ochsner Medical Center New Orleans, LA 3 ● ● ●
Bronson Methodist Hospital Kalamazoo, MI 3 ● ● ●
Central Michigan Community Hospital
Mount Pleasant, MI 3● ● ●
Mercy Hospital Cadillac Cadillac, MI 3 ● ● ●
Metro Health Hospital Wyoming, MI 3 ● ● ●
MidMichigan Medical Center-Midland
Midland, MI 3● ● ●
Otsego Memorial Hospital Gaylord, MI 3 ● ● ●
St. John Hospital and Medical Center
Detroit, MI 3● ● ●
St. Joseph Health System Tawas City, MI 3 ● ● ●
St. Mary Mercy Livonia Hospital Livonia, MI 3 ● ● ●
Buffalo Hospital Buffalo, MN 3 ● ● ●
Fairview Ridges Hospital Burnsville, MN 3 ● ● ●
St. John's Hospital Maplewood, MN 3 ● ● ●
Woodwinds Health Campus Woodbury, MN 3 ● ● ●
Boone Hospital Center Columbia, MO 3 ● ● ●
Missouri Baptist Medical Center St. Louis, MO 3 ● ● ●
St. John's Hospital Springfield, MO 3 ● ● ●
St. John's Mercy Medical Center St. Louis, MO 3 ● ● ●
FirstHealth Moore Regional Hospital
Pinehurst, NC 3● ● ●
Heritage Hospital Tarboro, NC 3 ● ● ●
Alegent Health Bergan Mercy Medical Center
Omaha, NE 3● ● ●
Speare Memorial Hospital Plymouth, NH 3 ● ● ●
Staten Island University Hospital Staten Island, NY 3 ● ● ●
Akron General Medical Center Akron, OH 3 ● ● ●
Doctors Hospital Columbus, OH 3 ● ● ●
Good Samaritan Hospital Cincinnati, OH 3 ● ● ●
Grandview Medical Center Dayton, OH 3 ● ● ●
Mercy Hospital Fairfield Fairfield, OH 3 ● ● ●
Mercy Medical Center Springfield, OH 3 ● ● ●
Wooster Community Hospital Wooster, OH 3 ● ● ●
Duncan Regional Hospital Duncan, OK 3 ● ● ●
Providence Milwaukie Hospital Milwaukie, OR 3 ● ● ●
Willamette Valley Medical Center
McMinnville, OR 3● ● ●
* List is ordered by years won, then state, then hospital name.† Due to renaming of the studies to better align with the year in which they were produced, there was no "2010" study.
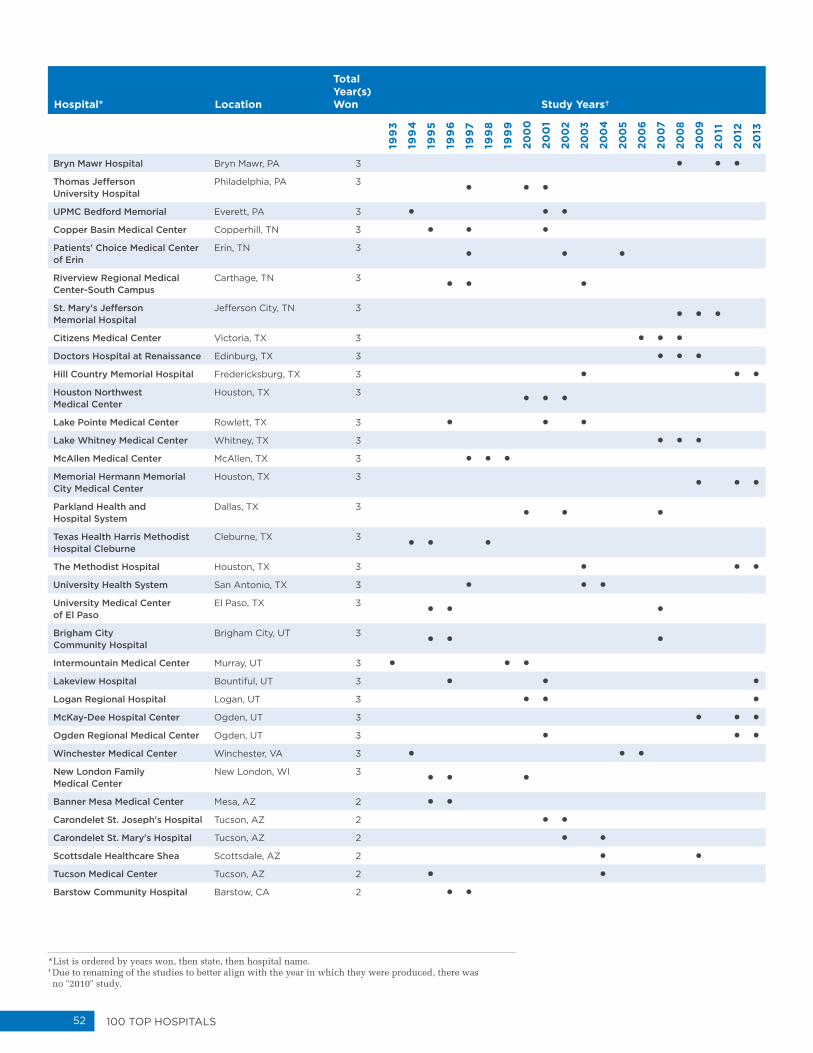
52 100 Top HospiTals
Hospital* Location
Total Year(s) Won Study Years†
199
3
199
4
199
5
199
6
199
7
199
8
199
9
200
0
200
1
200
2
200
3
200
4
200
5
200
6
200
7
200
8
200
9
20
11
2012
2013
Bryn Mawr Hospital Bryn Mawr, PA 3 ● ● ●
Thomas Jefferson University Hospital
Philadelphia, PA 3● ● ●
UPMC Bedford Memorial Everett, PA 3 ● ● ●
Copper Basin Medical Center Copperhill, TN 3 ● ● ●
Patients' Choice Medical Center of Erin
Erin, TN 3● ● ●
Riverview Regional Medical Center-South Campus
Carthage, TN 3● ● ●
St. Mary's Jefferson Memorial Hospital
Jefferson City, TN 3● ● ●
Citizens Medical Center Victoria, TX 3 ● ● ●
Doctors Hospital at Renaissance Edinburg, TX 3 ● ● ●
Hill Country Memorial Hospital Fredericksburg, TX 3 ● ● ●
Houston Northwest Medical Center
Houston, TX 3● ● ●
Lake Pointe Medical Center Rowlett, TX 3 ● ● ●
Lake Whitney Medical Center Whitney, TX 3 ● ● ●
McAllen Medical Center McAllen, TX 3 ● ● ●
Memorial Hermann Memorial City Medical Center
Houston, TX 3● ● ●
Parkland Health and Hospital System
Dallas, TX 3● ● ●
Texas Health Harris Methodist Hospital Cleburne
Cleburne, TX 3● ● ●
The Methodist Hospital Houston, TX 3 ● ● ●
University Health System San Antonio, TX 3 ● ● ●
University Medical Center of El Paso
El Paso, TX 3● ● ●
Brigham City Community Hospital
Brigham City, UT 3● ● ●
Intermountain Medical Center Murray, UT 3 ● ● ●
Lakeview Hospital Bountiful, UT 3 ● ● ●
Logan Regional Hospital Logan, UT 3 ● ● ●
McKay-Dee Hospital Center Ogden, UT 3 ● ● ●
Ogden Regional Medical Center Ogden, UT 3 ● ● ●
Winchester Medical Center Winchester, VA 3 ● ● ●
New London Family Medical Center
New London, WI 3● ● ●
Banner Mesa Medical Center Mesa, AZ 2 ● ●
Carondelet St. Joseph's Hospital Tucson, AZ 2 ● ●
Carondelet St. Mary's Hospital Tucson, AZ 2 ● ●
Scottsdale Healthcare Shea Scottsdale, AZ 2 ● ●
Tucson Medical Center Tucson, AZ 2 ● ●
Barstow Community Hospital Barstow, CA 2 ● ●
* List is ordered by years won, then state, then hospital name.† Due to renaming of the studies to better align with the year in which they were produced, there was no "2010" study.
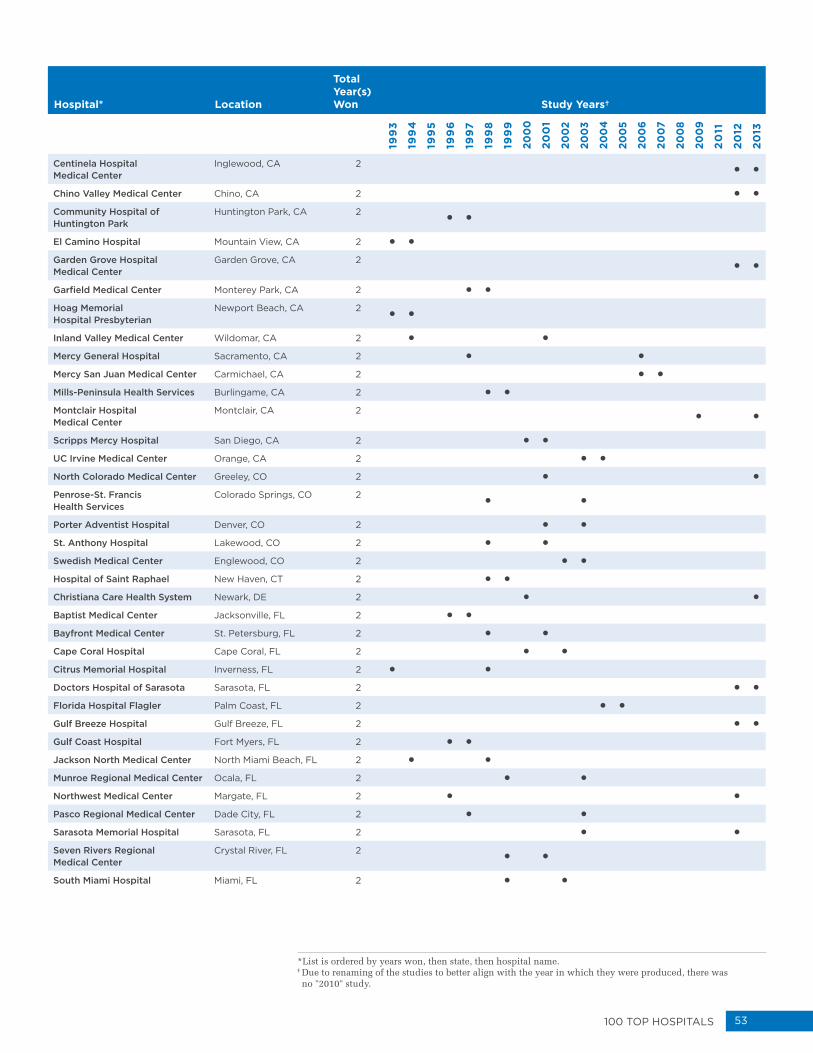
53100 Top HospiTals
Hospital* Location
Total Year(s) Won Study Years†
199
3
199
4
199
5
199
6
199
7
199
8
199
9
200
0
200
1
200
2
200
3
200
4
200
5
200
6
200
7
200
8
200
9
20
11
2012
2013
Centinela Hospital Medical Center
Inglewood, CA 2● ●
Chino Valley Medical Center Chino, CA 2 ● ●
Community Hospital of Huntington Park
Huntington Park, CA 2● ●
El Camino Hospital Mountain View, CA 2 ● ●
Garden Grove Hospital Medical Center
Garden Grove, CA 2● ●
Garfield Medical Center Monterey Park, CA 2 ● ●
Hoag Memorial Hospital Presbyterian
Newport Beach, CA 2● ●
Inland Valley Medical Center Wildomar, CA 2 ● ●
Mercy General Hospital Sacramento, CA 2 ● ●
Mercy San Juan Medical Center Carmichael, CA 2 ● ●
Mills-Peninsula Health Services Burlingame, CA 2 ● ●
Montclair Hospital Medical Center
Montclair, CA 2● ●
Scripps Mercy Hospital San Diego, CA 2 ● ●
UC Irvine Medical Center Orange, CA 2 ● ●
North Colorado Medical Center Greeley, CO 2 ● ●
Penrose-St. Francis Health Services
Colorado Springs, CO 2● ●
Porter Adventist Hospital Denver, CO 2 ● ●
St. Anthony Hospital Lakewood, CO 2 ● ●
Swedish Medical Center Englewood, CO 2 ● ●
Hospital of Saint Raphael New Haven, CT 2 ● ●
Christiana Care Health System Newark, DE 2 ● ●
Baptist Medical Center Jacksonville, FL 2 ● ●
Bayfront Medical Center St. Petersburg, FL 2 ● ●
Cape Coral Hospital Cape Coral, FL 2 ● ●
Citrus Memorial Hospital Inverness, FL 2 ● ●
Doctors Hospital of Sarasota Sarasota, FL 2 ● ●
Florida Hospital Flagler Palm Coast, FL 2 ● ●
Gulf Breeze Hospital Gulf Breeze, FL 2 ● ●
Gulf Coast Hospital Fort Myers, FL 2 ● ●
Jackson North Medical Center North Miami Beach, FL 2 ● ●
Munroe Regional Medical Center Ocala, FL 2 ● ●
Northwest Medical Center Margate, FL 2 ● ●
Pasco Regional Medical Center Dade City, FL 2 ● ●
Sarasota Memorial Hospital Sarasota, FL 2 ● ●
Seven Rivers Regional Medical Center
Crystal River, FL 2● ●
South Miami Hospital Miami, FL 2 ● ●
* List is ordered by years won, then state, then hospital name.† Due to renaming of the studies to better align with the year in which they were produced, there was no "2010" study.
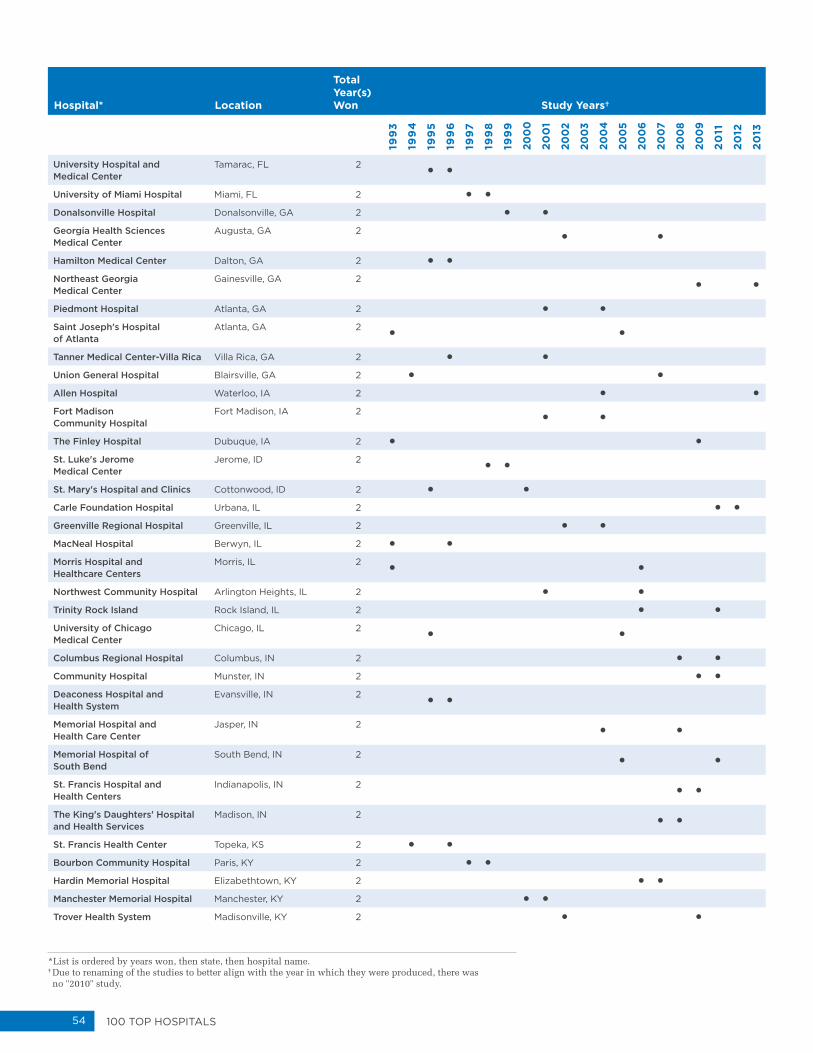
54 100 Top HospiTals
Hospital* Location
Total Year(s) Won Study Years†
199
3
199
4
199
5
199
6
199
7
199
8
199
9
200
0
200
1
200
2
200
3
200
4
200
5
200
6
200
7
200
8
200
9
20
11
2012
2013
University Hospital and Medical Center
Tamarac, FL 2● ●
University of Miami Hospital Miami, FL 2 ● ●
Donalsonville Hospital Donalsonville, GA 2 ● ●
Georgia Health Sciences Medical Center
Augusta, GA 2● ●
Hamilton Medical Center Dalton, GA 2 ● ●
Northeast Georgia Medical Center
Gainesville, GA 2● ●
Piedmont Hospital Atlanta, GA 2 ● ●
Saint Joseph's Hospital of Atlanta
Atlanta, GA 2● ●
Tanner Medical Center-Villa Rica Villa Rica, GA 2 ● ●
Union General Hospital Blairsville, GA 2 ● ●
Allen Hospital Waterloo, IA 2 ● ●
Fort Madison Community Hospital
Fort Madison, IA 2● ●
The Finley Hospital Dubuque, IA 2 ● ●
St. Luke's Jerome Medical Center
Jerome, ID 2● ●
St. Mary's Hospital and Clinics Cottonwood, ID 2 ● ●
Carle Foundation Hospital Urbana, IL 2 ● ●
Greenville Regional Hospital Greenville, IL 2 ● ●
MacNeal Hospital Berwyn, IL 2 ● ●
Morris Hospital and Healthcare Centers
Morris, IL 2● ●
Northwest Community Hospital Arlington Heights, IL 2 ● ●
Trinity Rock Island Rock Island, IL 2 ● ●
University of Chicago Medical Center
Chicago, IL 2● ●
Columbus Regional Hospital Columbus, IN 2 ● ●
Community Hospital Munster, IN 2 ● ●
Deaconess Hospital and Health System
Evansville, IN 2● ●
Memorial Hospital and Health Care Center
Jasper, IN 2● ●
Memorial Hospital of South Bend
South Bend, IN 2● ●
St. Francis Hospital and Health Centers
Indianapolis, IN 2● ●
The King's Daughters' Hospital and Health Services
Madison, IN 2● ●
St. Francis Health Center Topeka, KS 2 ● ●
Bourbon Community Hospital Paris, KY 2 ● ●
Hardin Memorial Hospital Elizabethtown, KY 2 ● ●
Manchester Memorial Hospital Manchester, KY 2 ● ●
Trover Health System Madisonville, KY 2 ● ●
* List is ordered by years won, then state, then hospital name.† Due to renaming of the studies to better align with the year in which they were produced, there was no "2010" study.
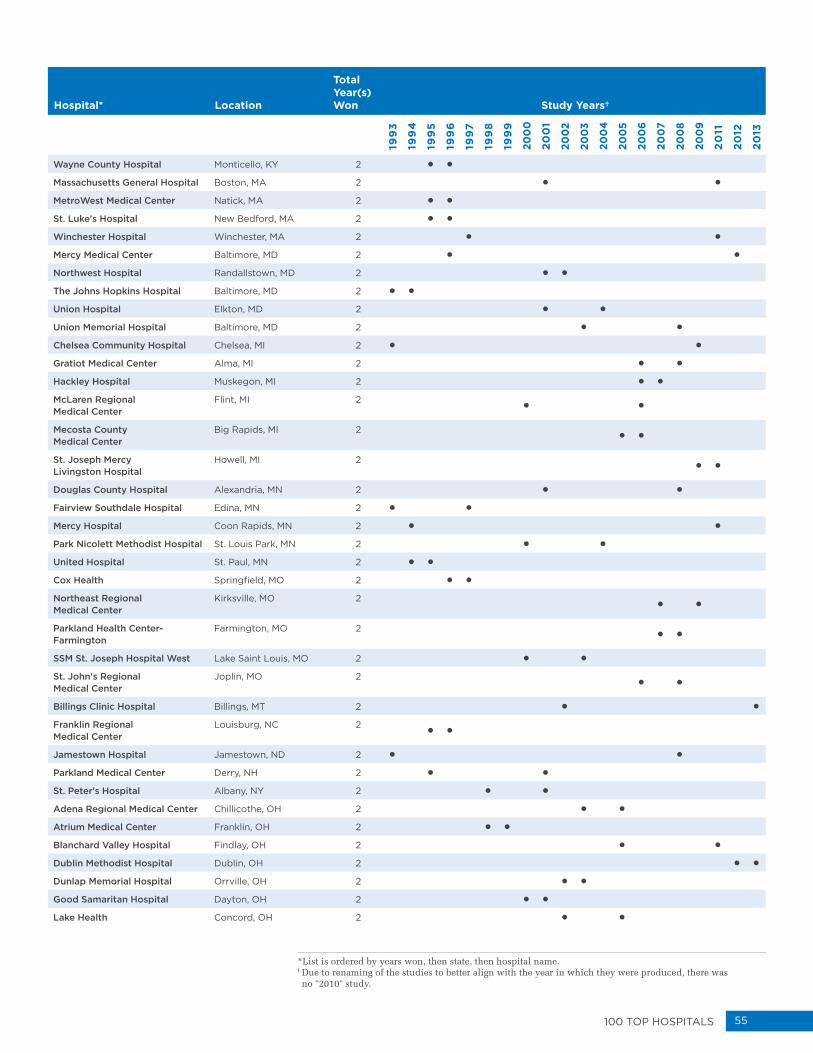
55100 Top HospiTals
Hospital* Location
Total Year(s) Won Study Years†
199
3
199
4
199
5
199
6
199
7
199
8
199
9
200
0
200
1
200
2
200
3
200
4
200
5
200
6
200
7
200
8
200
9
20
11
2012
2013
Wayne County Hospital Monticello, KY 2 ● ●
Massachusetts General Hospital Boston, MA 2 ● ●
MetroWest Medical Center Natick, MA 2 ● ●
St. Luke's Hospital New Bedford, MA 2 ● ●
Winchester Hospital Winchester, MA 2 ● ●
Mercy Medical Center Baltimore, MD 2 ● ●
Northwest Hospital Randallstown, MD 2 ● ●
The Johns Hopkins Hospital Baltimore, MD 2 ● ●
Union Hospital Elkton, MD 2 ● ●
Union Memorial Hospital Baltimore, MD 2 ● ●
Chelsea Community Hospital Chelsea, MI 2 ● ●
Gratiot Medical Center Alma, MI 2 ● ●
Hackley Hospital Muskegon, MI 2 ● ●
McLaren Regional Medical Center
Flint, MI 2● ●
Mecosta County Medical Center
Big Rapids, MI 2● ●
St. Joseph Mercy Livingston Hospital
Howell, MI 2● ●
Douglas County Hospital Alexandria, MN 2 ● ●
Fairview Southdale Hospital Edina, MN 2 ● ●
Mercy Hospital Coon Rapids, MN 2 ● ●
Park Nicolett Methodist Hospital St. Louis Park, MN 2 ● ●
United Hospital St. Paul, MN 2 ● ●
Cox Health Springfield, MO 2 ● ●
Northeast Regional Medical Center
Kirksville, MO 2● ●
Parkland Health Center-Farmington
Farmington, MO 2● ●
SSM St. Joseph Hospital West Lake Saint Louis, MO 2 ● ●
St. John's Regional Medical Center
Joplin, MO 2● ●
Billings Clinic Hospital Billings, MT 2 ● ●
Franklin Regional Medical Center
Louisburg, NC 2● ●
Jamestown Hospital Jamestown, ND 2 ● ●
Parkland Medical Center Derry, NH 2 ● ●
St. Peter's Hospital Albany, NY 2 ● ●
Adena Regional Medical Center Chillicothe, OH 2 ● ●
Atrium Medical Center Franklin, OH 2 ● ●
Blanchard Valley Hospital Findlay, OH 2 ● ●
Dublin Methodist Hospital Dublin, OH 2 ● ●
Dunlap Memorial Hospital Orrville, OH 2 ● ●
Good Samaritan Hospital Dayton, OH 2 ● ●
Lake Health Concord, OH 2 ● ●
* List is ordered by years won, then state, then hospital name.† Due to renaming of the studies to better align with the year in which they were produced, there was no "2010" study.
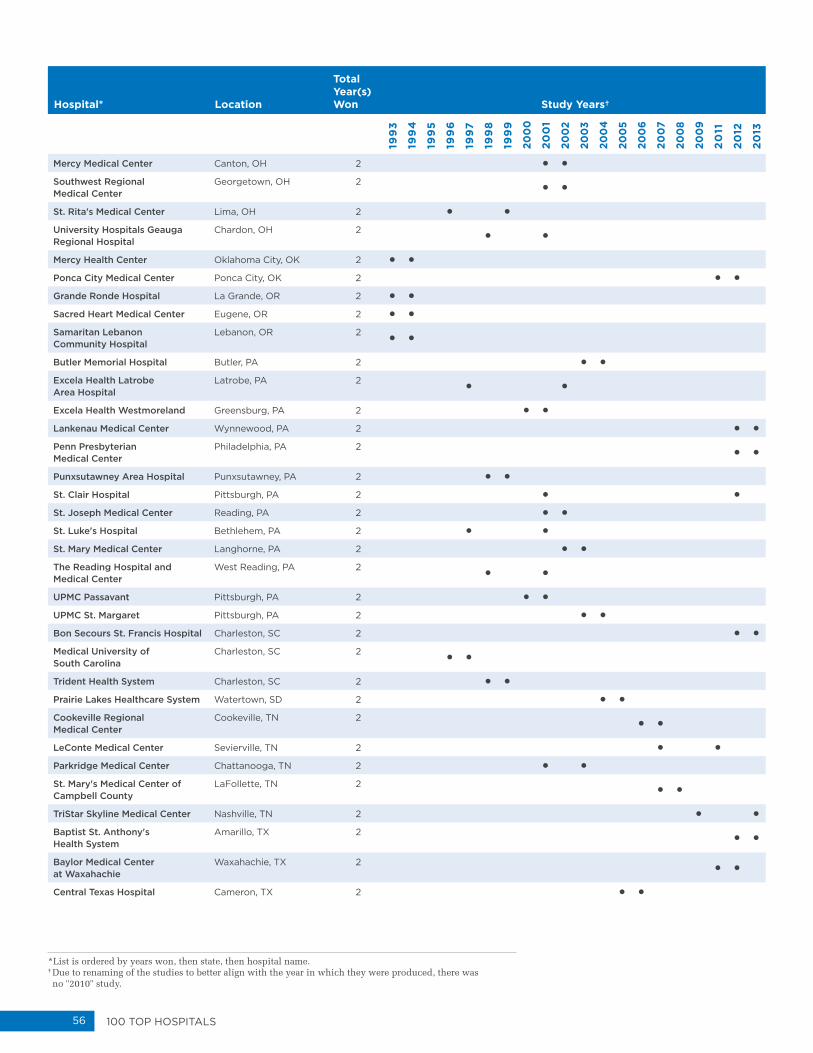
56 100 Top HospiTals
Hospital* Location
Total Year(s) Won Study Years†
199
3
199
4
199
5
199
6
199
7
199
8
199
9
200
0
200
1
200
2
200
3
200
4
200
5
200
6
200
7
200
8
200
9
20
11
2012
2013
Mercy Medical Center Canton, OH 2 ● ●
Southwest Regional Medical Center
Georgetown, OH 2● ●
St. Rita's Medical Center Lima, OH 2 ● ●
University Hospitals Geauga Regional Hospital
Chardon, OH 2● ●
Mercy Health Center Oklahoma City, OK 2 ● ●
Ponca City Medical Center Ponca City, OK 2 ● ●
Grande Ronde Hospital La Grande, OR 2 ● ●
Sacred Heart Medical Center Eugene, OR 2 ● ●
Samaritan Lebanon Community Hospital
Lebanon, OR 2● ●
Butler Memorial Hospital Butler, PA 2 ● ●
Excela Health Latrobe Area Hospital
Latrobe, PA 2● ●
Excela Health Westmoreland Greensburg, PA 2 ● ●
Lankenau Medical Center Wynnewood, PA 2 ● ●
Penn Presbyterian Medical Center
Philadelphia, PA 2● ●
Punxsutawney Area Hospital Punxsutawney, PA 2 ● ●
St. Clair Hospital Pittsburgh, PA 2 ● ●
St. Joseph Medical Center Reading, PA 2 ● ●
St. Luke's Hospital Bethlehem, PA 2 ● ●
St. Mary Medical Center Langhorne, PA 2 ● ●
The Reading Hospital and Medical Center
West Reading, PA 2● ●
UPMC Passavant Pittsburgh, PA 2 ● ●
UPMC St. Margaret Pittsburgh, PA 2 ● ●
Bon Secours St. Francis Hospital Charleston, SC 2 ● ●
Medical University of South Carolina
Charleston, SC 2● ●
Trident Health System Charleston, SC 2 ● ●
Prairie Lakes Healthcare System Watertown, SD 2 ● ●
Cookeville Regional Medical Center
Cookeville, TN 2● ●
LeConte Medical Center Sevierville, TN 2 ● ●
Parkridge Medical Center Chattanooga, TN 2 ● ●
St. Mary's Medical Center of Campbell County
LaFollette, TN 2● ●
TriStar Skyline Medical Center Nashville, TN 2 ● ●
Baptist St. Anthony's Health System
Amarillo, TX 2● ●
Baylor Medical Center at Waxahachie
Waxahachie, TX 2● ●
Central Texas Hospital Cameron, TX 2 ● ●
* List is ordered by years won, then state, then hospital name.† Due to renaming of the studies to better align with the year in which they were produced, there was no "2010" study.

57100 Top HospiTals
Hospital* Location
Total Year(s) Won Study Years†
199
3
199
4
199
5
199
6
199
7
199
8
199
9
200
0
200
1
200
2
200
3
200
4
200
5
200
6
200
7
200
8
200
9
20
11
2012
2013
CHRISTUS St. Michael Health System
Texarkana, TX 2● ●
Corpus Christi Medical Center Corpus Christi, TX 2 ● ●
East Houston Regional Medical Center
Houston, TX 2● ●
Good Shepherd Medical Center Longview, TX 2 ● ●
Harris County Hospital District Houston, TX 2 ● ●
Llano Memorial Healthcare System
Llano, TX 2● ●
Memorial Hermann Katy Hospital
Katy, TX 2● ●
Memorial Hermann Sugar Land Hospital
Sugar Land, TX 2● ●
Memorial Hermann-Texas Medical Center
Houston, TX 2● ●
Seton Medical Center Austin Austin, TX 2 ● ●
St. David's North Austin Medical Center
Austin, TX 2● ●
Mountain View Hospital Payson, UT 2 ● ●
San Juan Hospital Monticello, UT 2 ● ●
INOVA Fair Oaks Hospital Fairfax, VA 2 ● ●
Memorial Regional Medical Center
Mechanicsville, VA 2● ●
Sentara Leigh Hospital Norfolk, VA 2 ● ●
Sentara Virginia Beach General Hospital
Virginia Beach, VA 2● ●
VCU Medical Center Richmond, VA 2 ● ●
Providence St. Mary Medical Center
Walla Walla, WA 2● ●
Sunnyside Community Hospital Sunnyside, WA 2 ● ●
Valley Medical Center Renton, WA 2 ● ●
Whitman Hospital and Medical Center
Colfax, WA 2● ●
Aurora West Allis Medical Center
West Allis, WI 2● ●
Baldwin Area Medical Center Baldwin, WI 2 ● ●
Bay Area Medical Center Marinette, WI 2 ● ●
Meriter Hospital Madison, WI 2 ● ●
Monroe Clinic Monroe, WI 2 ● ●
St. Elizabeth Hospital Appleton, WI 2 ● ●
St. Mary's Hospital Madison, WI 2 ● ●
Waukesha Memorial Hospital Waukesha, WI 2 ● ●
Powell Valley Healthcare Powell, WY 2 ● ●
Evergreen Medical Center Evergreen, AL 1 ●
Hill Hospital of Sumter County York, AL 1 ●
J. Paul Jones Hospital Camden, AL 1 ●
* List is ordered by years won, then state, then hospital name.† Due to renaming of the studies to better align with the year in which they were produced, there was no "2010" study.
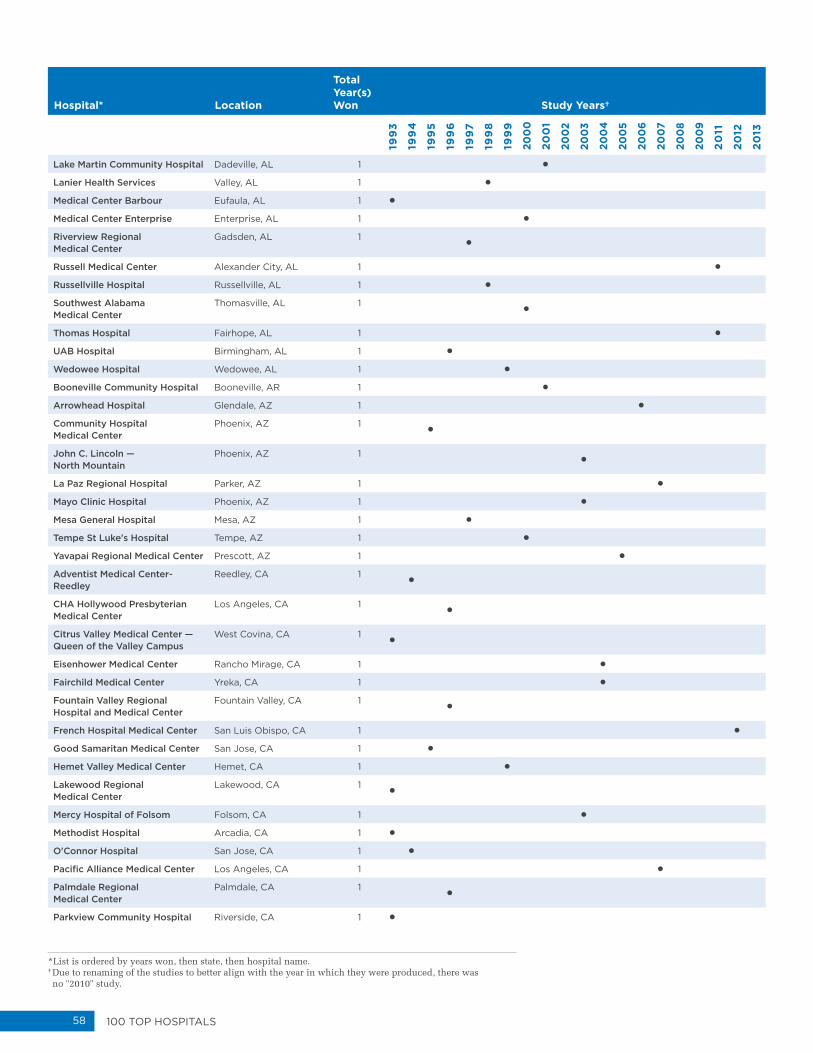
58 100 Top HospiTals
Hospital* Location
Total Year(s) Won Study Years†
199
3
199
4
199
5
199
6
199
7
199
8
199
9
200
0
200
1
200
2
200
3
200
4
200
5
200
6
200
7
200
8
200
9
20
11
2012
2013
Lake Martin Community Hospital Dadeville, AL 1 ●
Lanier Health Services Valley, AL 1 ●
Medical Center Barbour Eufaula, AL 1 ●
Medical Center Enterprise Enterprise, AL 1 ●
Riverview Regional Medical Center
Gadsden, AL 1●
Russell Medical Center Alexander City, AL 1 ●
Russellville Hospital Russellville, AL 1 ●
Southwest Alabama Medical Center
Thomasville, AL 1●
Thomas Hospital Fairhope, AL 1 ●
UAB Hospital Birmingham, AL 1 ●
Wedowee Hospital Wedowee, AL 1 ●
Booneville Community Hospital Booneville, AR 1 ●
Arrowhead Hospital Glendale, AZ 1 ●
Community Hospital Medical Center
Phoenix, AZ 1●
John C. Lincoln — North Mountain
Phoenix, AZ 1●
La Paz Regional Hospital Parker, AZ 1 ●
Mayo Clinic Hospital Phoenix, AZ 1 ●
Mesa General Hospital Mesa, AZ 1 ●
Tempe St Luke's Hospital Tempe, AZ 1 ●
Yavapai Regional Medical Center Prescott, AZ 1 ●
Adventist Medical Center-Reedley
Reedley, CA 1●
CHA Hollywood Presbyterian Medical Center
Los Angeles, CA 1●
Citrus Valley Medical Center — Queen of the Valley Campus
West Covina, CA 1●
Eisenhower Medical Center Rancho Mirage, CA 1 ●
Fairchild Medical Center Yreka, CA 1 ●
Fountain Valley Regional Hospital and Medical Center
Fountain Valley, CA 1●
French Hospital Medical Center San Luis Obispo, CA 1 ●
Good Samaritan Medical Center San Jose, CA 1 ●
Hemet Valley Medical Center Hemet, CA 1 ●
Lakewood Regional Medical Center
Lakewood, CA 1●
Mercy Hospital of Folsom Folsom, CA 1 ●
Methodist Hospital Arcadia, CA 1 ●
O'Connor Hospital San Jose, CA 1 ●
Pacific Alliance Medical Center Los Angeles, CA 1 ●
Palmdale Regional Medical Center
Palmdale, CA 1●
Parkview Community Hospital Riverside, CA 1 ●
* List is ordered by years won, then state, then hospital name.† Due to renaming of the studies to better align with the year in which they were produced, there was no "2010" study.
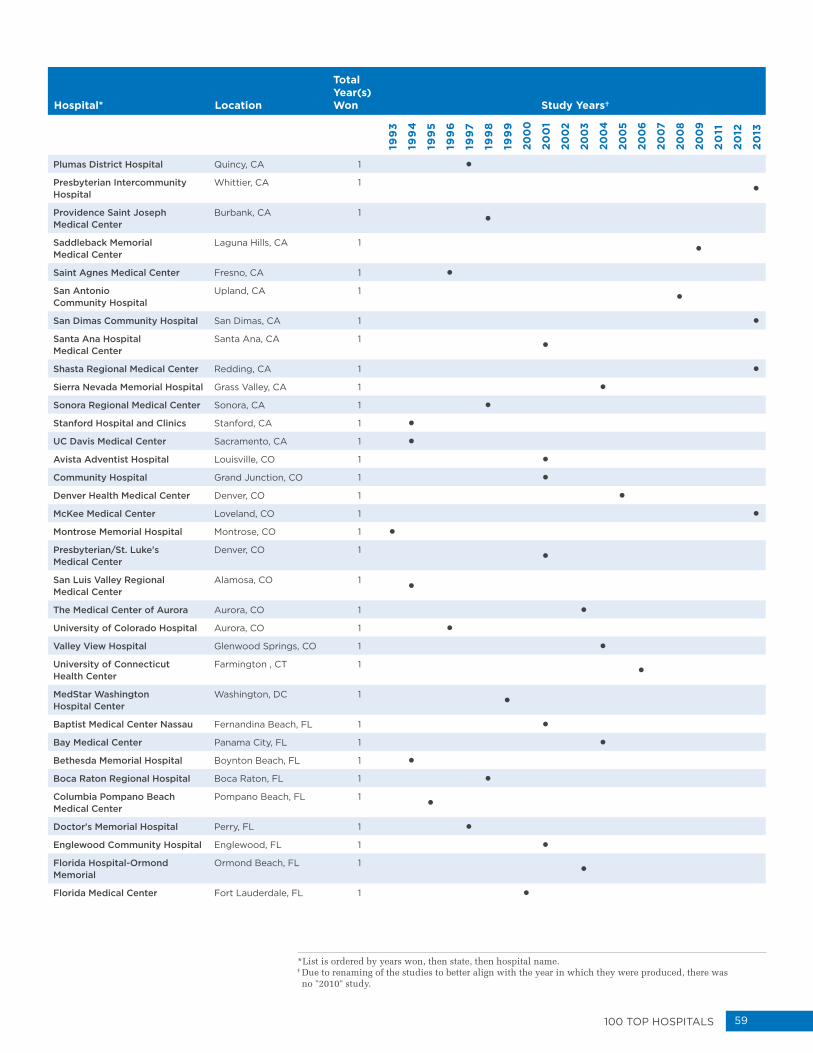
59100 Top HospiTals
Hospital* Location
Total Year(s) Won Study Years†
199
3
199
4
199
5
199
6
199
7
199
8
199
9
200
0
200
1
200
2
200
3
200
4
200
5
200
6
200
7
200
8
200
9
20
11
2012
2013
Plumas District Hospital Quincy, CA 1 ●
Presbyterian Intercommunity Hospital
Whittier, CA 1●
Providence Saint Joseph Medical Center
Burbank, CA 1●
Saddleback Memorial Medical Center
Laguna Hills, CA 1●
Saint Agnes Medical Center Fresno, CA 1 ●
San Antonio Community Hospital
Upland, CA 1●
San Dimas Community Hospital San Dimas, CA 1 ●
Santa Ana Hospital Medical Center
Santa Ana, CA 1●
Shasta Regional Medical Center Redding, CA 1 ●
Sierra Nevada Memorial Hospital Grass Valley, CA 1 ●
Sonora Regional Medical Center Sonora, CA 1 ●
Stanford Hospital and Clinics Stanford, CA 1 ●
UC Davis Medical Center Sacramento, CA 1 ●
Avista Adventist Hospital Louisville, CO 1 ●
Community Hospital Grand Junction, CO 1 ●
Denver Health Medical Center Denver, CO 1 ●
McKee Medical Center Loveland, CO 1 ●
Montrose Memorial Hospital Montrose, CO 1 ●
Presbyterian/St. Luke's Medical Center
Denver, CO 1●
San Luis Valley Regional Medical Center
Alamosa, CO 1●
The Medical Center of Aurora Aurora, CO 1 ●
University of Colorado Hospital Aurora, CO 1 ●
Valley View Hospital Glenwood Springs, CO 1 ●
University of Connecticut Health Center
Farmington , CT 1●
MedStar Washington Hospital Center
Washington, DC 1●
Baptist Medical Center Nassau Fernandina Beach, FL 1 ●
Bay Medical Center Panama City, FL 1 ●
Bethesda Memorial Hospital Boynton Beach, FL 1 ●
Boca Raton Regional Hospital Boca Raton, FL 1 ●
Columbia Pompano Beach Medical Center
Pompano Beach, FL 1●
Doctor's Memorial Hospital Perry, FL 1 ●
Englewood Community Hospital Englewood, FL 1 ●
Florida Hospital-Ormond Memorial
Ormond Beach, FL 1●
Florida Medical Center Fort Lauderdale, FL 1 ●
* List is ordered by years won, then state, then hospital name.† Due to renaming of the studies to better align with the year in which they were produced, there was no "2010" study.
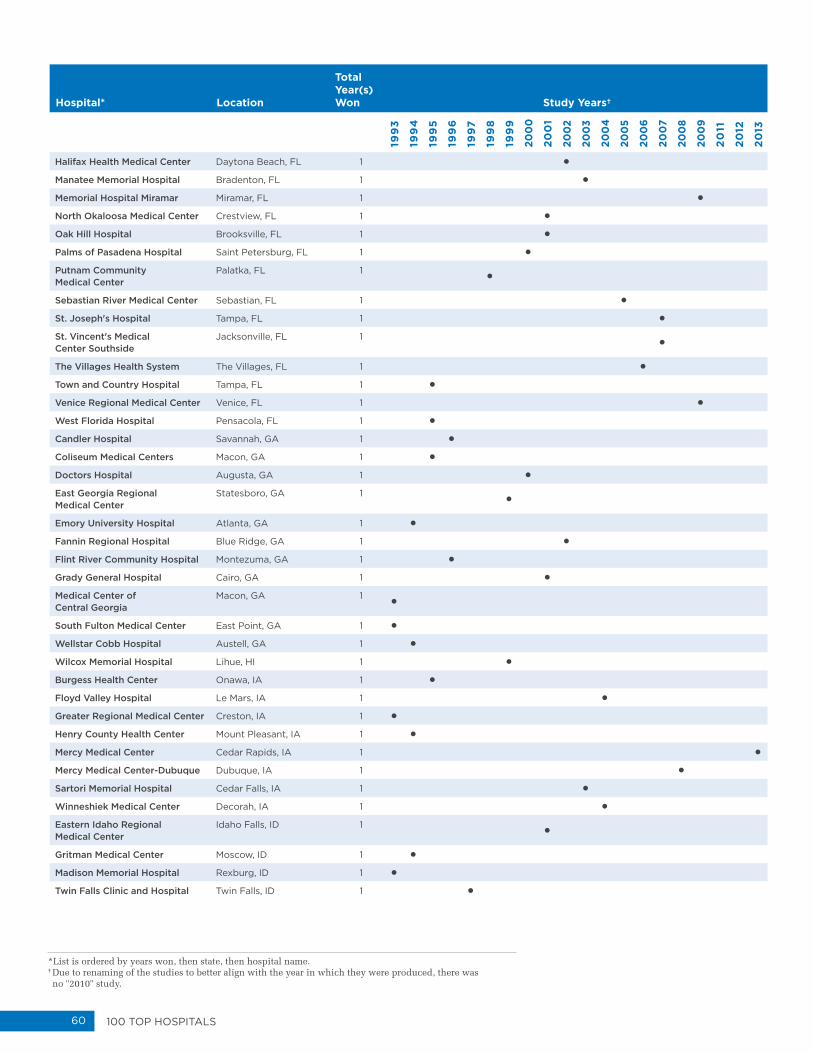
60 100 Top HospiTals
Hospital* Location
Total Year(s) Won Study Years†
199
3
199
4
199
5
199
6
199
7
199
8
199
9
200
0
200
1
200
2
200
3
200
4
200
5
200
6
200
7
200
8
200
9
20
11
2012
2013
Halifax Health Medical Center Daytona Beach, FL 1 ●
Manatee Memorial Hospital Bradenton, FL 1 ●
Memorial Hospital Miramar Miramar, FL 1 ●
North Okaloosa Medical Center Crestview, FL 1 ●
Oak Hill Hospital Brooksville, FL 1 ●
Palms of Pasadena Hospital Saint Petersburg, FL 1 ●
Putnam Community Medical Center
Palatka, FL 1●
Sebastian River Medical Center Sebastian, FL 1 ●
St. Joseph's Hospital Tampa, FL 1 ●
St. Vincent's Medical Center Southside
Jacksonville, FL 1●
The Villages Health System The Villages, FL 1 ●
Town and Country Hospital Tampa, FL 1 ●
Venice Regional Medical Center Venice, FL 1 ●
West Florida Hospital Pensacola, FL 1 ●
Candler Hospital Savannah, GA 1 ●
Coliseum Medical Centers Macon, GA 1 ●
Doctors Hospital Augusta, GA 1 ●
East Georgia Regional Medical Center
Statesboro, GA 1●
Emory University Hospital Atlanta, GA 1 ●
Fannin Regional Hospital Blue Ridge, GA 1 ●
Flint River Community Hospital Montezuma, GA 1 ●
Grady General Hospital Cairo, GA 1 ●
Medical Center of Central Georgia
Macon, GA 1●
South Fulton Medical Center East Point, GA 1 ●
Wellstar Cobb Hospital Austell, GA 1 ●
Wilcox Memorial Hospital Lihue, HI 1 ●
Burgess Health Center Onawa, IA 1 ●
Floyd Valley Hospital Le Mars, IA 1 ●
Greater Regional Medical Center Creston, IA 1 ●
Henry County Health Center Mount Pleasant, IA 1 ●
Mercy Medical Center Cedar Rapids, IA 1 ●
Mercy Medical Center-Dubuque Dubuque, IA 1 ●
Sartori Memorial Hospital Cedar Falls, IA 1 ●
Winneshiek Medical Center Decorah, IA 1 ●
Eastern Idaho Regional Medical Center
Idaho Falls, ID 1●
Gritman Medical Center Moscow, ID 1 ●
Madison Memorial Hospital Rexburg, ID 1 ●
Twin Falls Clinic and Hospital Twin Falls, ID 1 ●
* List is ordered by years won, then state, then hospital name.† Due to renaming of the studies to better align with the year in which they were produced, there was no "2010" study.
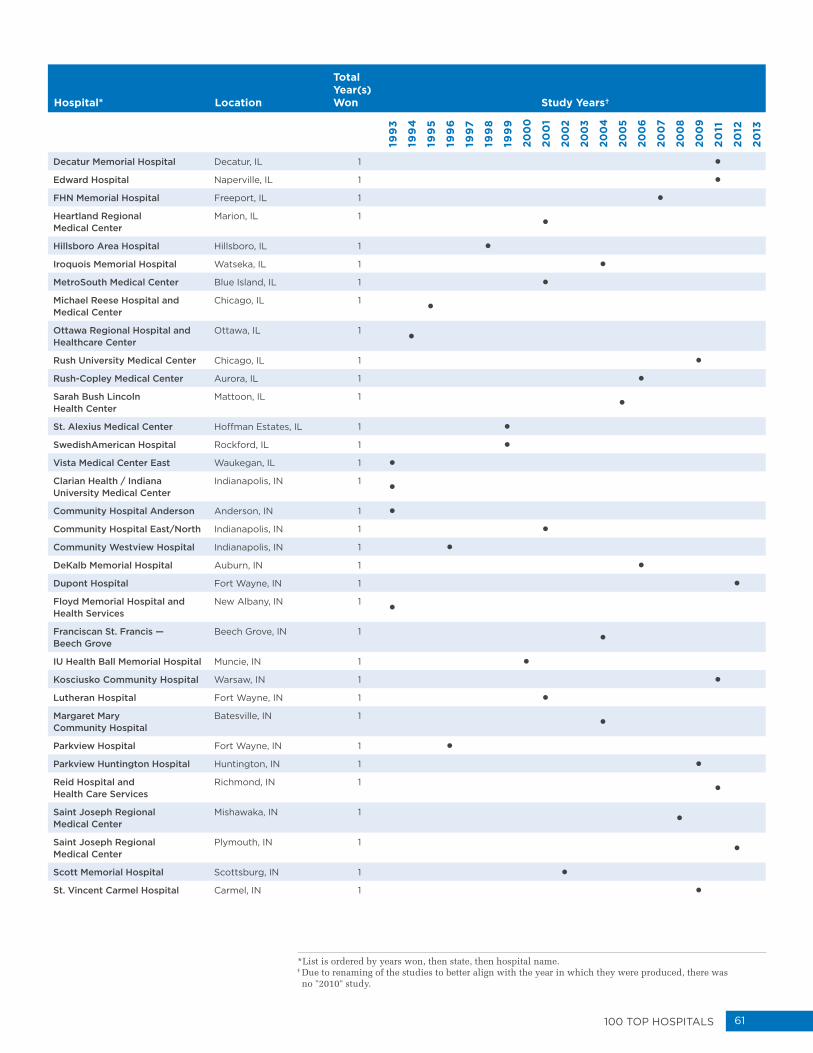
61100 Top HospiTals
Hospital* Location
Total Year(s) Won Study Years†
199
3
199
4
199
5
199
6
199
7
199
8
199
9
200
0
200
1
200
2
200
3
200
4
200
5
200
6
200
7
200
8
200
9
20
11
2012
2013
Decatur Memorial Hospital Decatur, IL 1 ●
Edward Hospital Naperville, IL 1 ●
FHN Memorial Hospital Freeport, IL 1 ●
Heartland Regional Medical Center
Marion, IL 1●
Hillsboro Area Hospital Hillsboro, IL 1 ●
Iroquois Memorial Hospital Watseka, IL 1 ●
MetroSouth Medical Center Blue Island, IL 1 ●
Michael Reese Hospital and Medical Center
Chicago, IL 1●
Ottawa Regional Hospital and Healthcare Center
Ottawa, IL 1●
Rush University Medical Center Chicago, IL 1 ●
Rush-Copley Medical Center Aurora, IL 1 ●
Sarah Bush Lincoln Health Center
Mattoon, IL 1●
St. Alexius Medical Center Hoffman Estates, IL 1 ●
SwedishAmerican Hospital Rockford, IL 1 ●
Vista Medical Center East Waukegan, IL 1 ●
Clarian Health / Indiana University Medical Center
Indianapolis, IN 1●
Community Hospital Anderson Anderson, IN 1 ●
Community Hospital East/North Indianapolis, IN 1 ●
Community Westview Hospital Indianapolis, IN 1 ●
DeKalb Memorial Hospital Auburn, IN 1 ●
Dupont Hospital Fort Wayne, IN 1 ●
Floyd Memorial Hospital and Health Services
New Albany, IN 1●
Franciscan St. Francis — Beech Grove
Beech Grove, IN 1●
IU Health Ball Memorial Hospital Muncie, IN 1 ●
Kosciusko Community Hospital Warsaw, IN 1 ●
Lutheran Hospital Fort Wayne, IN 1 ●
Margaret Mary Community Hospital
Batesville, IN 1●
Parkview Hospital Fort Wayne, IN 1 ●
Parkview Huntington Hospital Huntington, IN 1 ●
Reid Hospital and Health Care Services
Richmond, IN 1●
Saint Joseph Regional Medical Center
Mishawaka, IN 1●
Saint Joseph Regional Medical Center
Plymouth, IN 1●
Scott Memorial Hospital Scottsburg, IN 1 ●
St. Vincent Carmel Hospital Carmel, IN 1 ●
* List is ordered by years won, then state, then hospital name.† Due to renaming of the studies to better align with the year in which they were produced, there was no "2010" study.
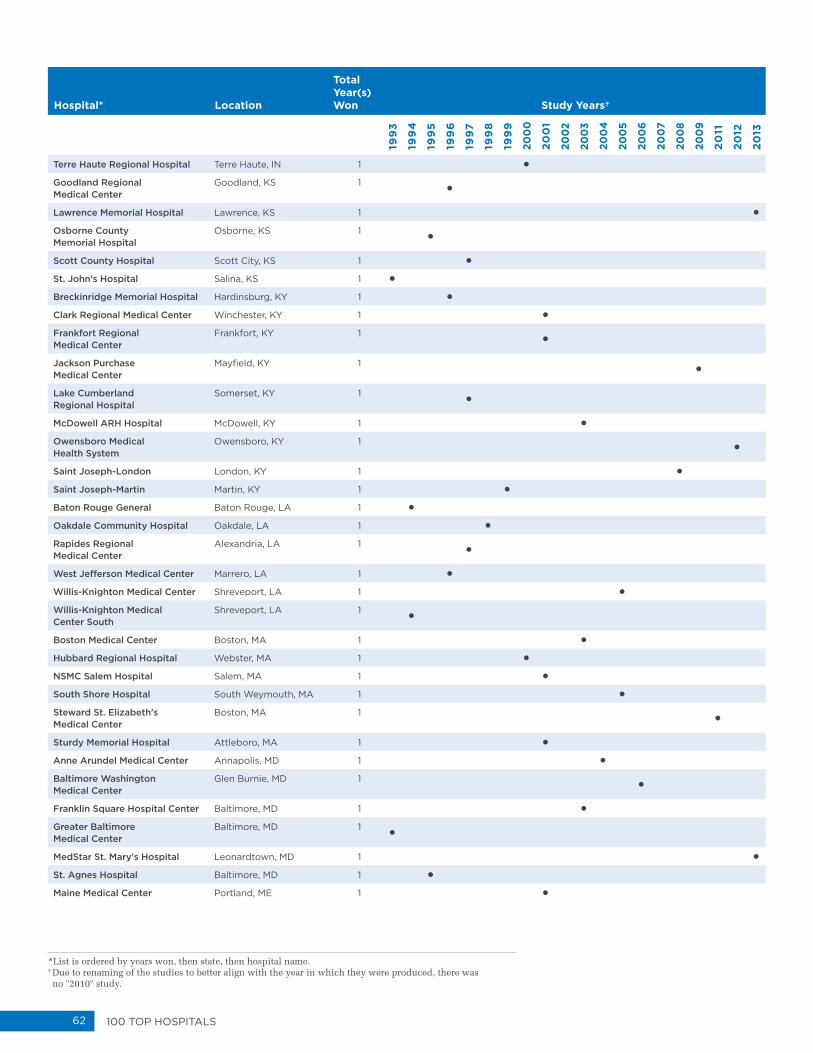
62 100 Top HospiTals
Hospital* Location
Total Year(s) Won Study Years†
199
3
199
4
199
5
199
6
199
7
199
8
199
9
200
0
200
1
200
2
200
3
200
4
200
5
200
6
200
7
200
8
200
9
20
11
2012
2013
Terre Haute Regional Hospital Terre Haute, IN 1 ●
Goodland Regional Medical Center
Goodland, KS 1●
Lawrence Memorial Hospital Lawrence, KS 1 ●
Osborne County Memorial Hospital
Osborne, KS 1●
Scott County Hospital Scott City, KS 1 ●
St. John's Hospital Salina, KS 1 ●
Breckinridge Memorial Hospital Hardinsburg, KY 1 ●
Clark Regional Medical Center Winchester, KY 1 ●
Frankfort Regional Medical Center
Frankfort, KY 1●
Jackson Purchase Medical Center
Mayfield, KY 1●
Lake Cumberland Regional Hospital
Somerset, KY 1●
McDowell ARH Hospital McDowell, KY 1 ●
Owensboro Medical Health System
Owensboro, KY 1●
Saint Joseph-London London, KY 1 ●
Saint Joseph-Martin Martin, KY 1 ●
Baton Rouge General Baton Rouge, LA 1 ●
Oakdale Community Hospital Oakdale, LA 1 ●
Rapides Regional Medical Center
Alexandria, LA 1●
West Jefferson Medical Center Marrero, LA 1 ●
Willis-Knighton Medical Center Shreveport, LA 1 ●
Willis-Knighton Medical Center South
Shreveport, LA 1●
Boston Medical Center Boston, MA 1 ●
Hubbard Regional Hospital Webster, MA 1 ●
NSMC Salem Hospital Salem, MA 1 ●
South Shore Hospital South Weymouth, MA 1 ●
Steward St. Elizabeth's Medical Center
Boston, MA 1●
Sturdy Memorial Hospital Attleboro, MA 1 ●
Anne Arundel Medical Center Annapolis, MD 1 ●
Baltimore Washington Medical Center
Glen Burnie, MD 1●
Franklin Square Hospital Center Baltimore, MD 1 ●
Greater Baltimore Medical Center
Baltimore, MD 1●
MedStar St. Mary's Hospital Leonardtown, MD 1 ●
St. Agnes Hospital Baltimore, MD 1 ●
Maine Medical Center Portland, ME 1 ●
* List is ordered by years won, then state, then hospital name.† Due to renaming of the studies to better align with the year in which they were produced, there was no "2010" study.

63100 Top HospiTals
Hospital* Location
Total Year(s) Won Study Years†
199
3
199
4
199
5
199
6
199
7
199
8
199
9
200
0
200
1
200
2
200
3
200
4
200
5
200
6
200
7
200
8
200
9
20
11
2012
2013
Saint Joseph Hospital Bangor, ME 1 ●
Bay Regional Medical Center Bay City, MI 1 ●
Garden City Hospital Garden City, MI 1 ●
Genesys Regional Medical Center
Grand Blanc, MI 1●
Grand View Hospital Ironwood, MI 1 ●
Lakeland Regional Medical Center
St. Joseph, MI 1●
Mercy Health Partners Muskegon, MI 1 ●
Mercy Hospital Grayling Grayling, MI 1 ●
MidMichigan Medical Center-Clare
Clare, MI 1●
Oaklawn Hospital Marshall, MI 1 ●
Pennock Health Hastings, MI 1 ●
Port Huron Hospital Port Huron, MI 1 ●
Sparrow Health System Lansing, MI 1 ●
Spectrum Health Zeeland Community Hospital
Zeeland, MI 1●
St. Joseph Mercy Port Huron
Port Huron, MI 1●
Abbott Northwestern Hospital Minneapolis, MN 1 ●
Cambridge Medical Center Cambridge, MN 1 ●
Clearwater County Memorial Hospital
Bagley, MN 1●
District One Hospital Faribault, MN 1 ●
Fairview Lakes Medical Center Wyoming, MN 1 ●
Grand Itasca Clinic and Hospital Grand Rapids, MN 1 ●
Mayo Clinic Health System Austin, MN 1 ●
Northfield Hospital and Clinics Northfield, MN 1 ●
Olmsted Medical Center Rochester, MN 1 ●
Perham Memorial Hospital and Home
Perham, MN 1●
St. Francis Regional Medical Center
Shakopee, MN 1●
St. Joseph's Hospital St. Paul, MN 1 ●
Swift County-Benson Hospital Benson, MN 1 ●
University of Minnesota Medical Center, Fairview
Minneapolis, MN 1●
Barnes-Jewish St. Peters Hospital
St. Peters, MO 1●
Freeman Health System Joplin, MO 1 ●
Missouri Southern Healthcare Dexter, MO 1 ●
Moberly Regional Medical Center
Moberly, MO 1●
Ray County Memorial Hospital Richmond, MO 1 ●
* List is ordered by years won, then state, then hospital name.† Due to renaming of the studies to better align with the year in which they were produced, there was no "2010" study.
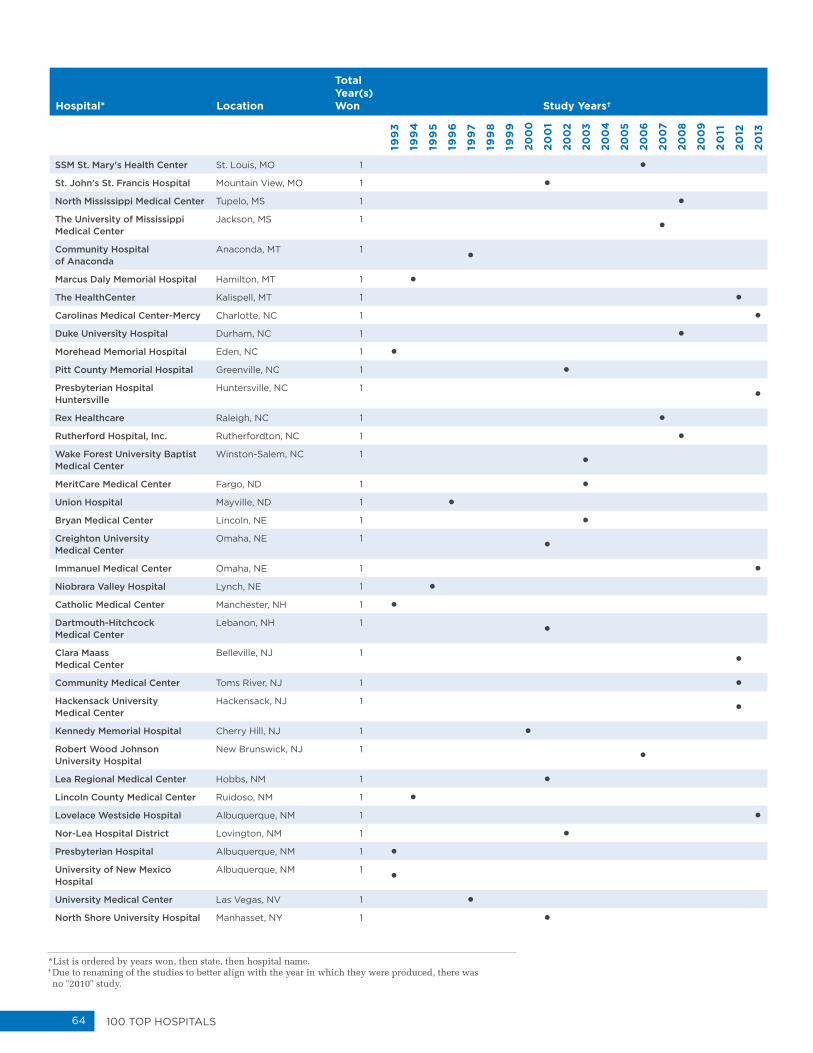
64 100 Top HospiTals
Hospital* Location
Total Year(s) Won Study Years†
199
3
199
4
199
5
199
6
199
7
199
8
199
9
200
0
200
1
200
2
200
3
200
4
200
5
200
6
200
7
200
8
200
9
20
11
2012
2013
SSM St. Mary's Health Center St. Louis, MO 1 ●
St. John's St. Francis Hospital Mountain View, MO 1 ●
North Mississippi Medical Center Tupelo, MS 1 ●
The University of Mississippi Medical Center
Jackson, MS 1●
Community Hospital of Anaconda
Anaconda, MT 1●
Marcus Daly Memorial Hospital Hamilton, MT 1 ●
The HealthCenter Kalispell, MT 1 ●
Carolinas Medical Center-Mercy Charlotte, NC 1 ●
Duke University Hospital Durham, NC 1 ●
Morehead Memorial Hospital Eden, NC 1 ●
Pitt County Memorial Hospital Greenville, NC 1 ●
Presbyterian Hospital Huntersville
Huntersville, NC 1●
Rex Healthcare Raleigh, NC 1 ●
Rutherford Hospital, Inc. Rutherfordton, NC 1 ●
Wake Forest University Baptist Medical Center
Winston-Salem, NC 1●
MeritCare Medical Center Fargo, ND 1 ●
Union Hospital Mayville, ND 1 ●
Bryan Medical Center Lincoln, NE 1 ●
Creighton University Medical Center
Omaha, NE 1●
Immanuel Medical Center Omaha, NE 1 ●
Niobrara Valley Hospital Lynch, NE 1 ●
Catholic Medical Center Manchester, NH 1 ●
Dartmouth-Hitchcock Medical Center
Lebanon, NH 1●
Clara Maass Medical Center
Belleville, NJ 1●
Community Medical Center Toms River, NJ 1 ●
Hackensack University Medical Center
Hackensack, NJ 1●
Kennedy Memorial Hospital Cherry Hill, NJ 1 ●
Robert Wood Johnson University Hospital
New Brunswick, NJ 1●
Lea Regional Medical Center Hobbs, NM 1 ●
Lincoln County Medical Center Ruidoso, NM 1 ●
Lovelace Westside Hospital Albuquerque, NM 1 ●
Nor-Lea Hospital District Lovington, NM 1 ●
Presbyterian Hospital Albuquerque, NM 1 ●
University of New Mexico Hospital
Albuquerque, NM 1●
University Medical Center Las Vegas, NV 1 ●
North Shore University Hospital Manhasset, NY 1 ●
* List is ordered by years won, then state, then hospital name.† Due to renaming of the studies to better align with the year in which they were produced, there was no "2010" study.
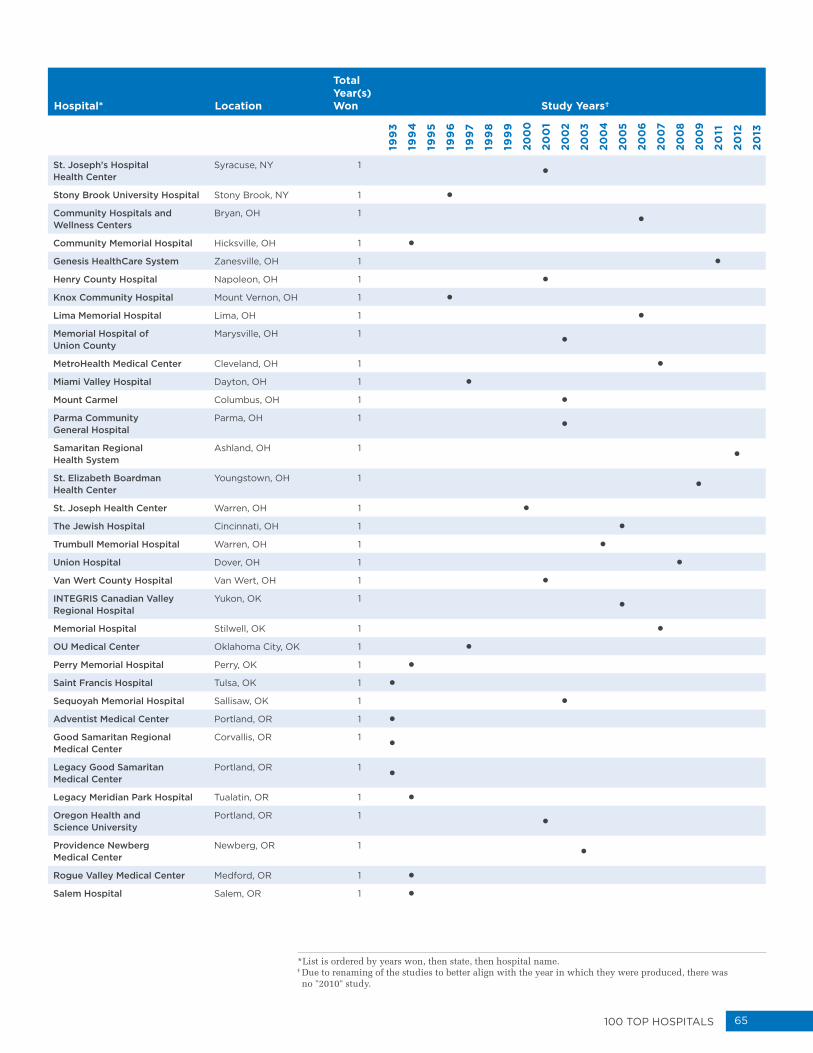
65100 Top HospiTals
* List is ordered by years won, then state, then hospital name.† Due to renaming of the studies to better align with the year in which they were produced, there was no "2010" study.
Hospital* Location
Total Year(s) Won Study Years†
199
3
199
4
199
5
199
6
199
7
199
8
199
9
200
0
200
1
200
2
200
3
200
4
200
5
200
6
200
7
200
8
200
9
20
11
2012
2013
St. Joseph's Hospital Health Center
Syracuse, NY 1●
Stony Brook University Hospital Stony Brook, NY 1 ●
Community Hospitals and Wellness Centers
Bryan, OH 1●
Community Memorial Hospital Hicksville, OH 1 ●
Genesis HealthCare System Zanesville, OH 1 ●
Henry County Hospital Napoleon, OH 1 ●
Knox Community Hospital Mount Vernon, OH 1 ●
Lima Memorial Hospital Lima, OH 1 ●
Memorial Hospital of Union County
Marysville, OH 1●
MetroHealth Medical Center Cleveland, OH 1 ●
Miami Valley Hospital Dayton, OH 1 ●
Mount Carmel Columbus, OH 1 ●
Parma Community General Hospital
Parma, OH 1●
Samaritan Regional Health System
Ashland, OH 1●
St. Elizabeth Boardman Health Center
Youngstown, OH 1●
St. Joseph Health Center Warren, OH 1 ●
The Jewish Hospital Cincinnati, OH 1 ●
Trumbull Memorial Hospital Warren, OH 1 ●
Union Hospital Dover, OH 1 ●
Van Wert County Hospital Van Wert, OH 1 ●
INTEGRIS Canadian Valley Regional Hospital
Yukon, OK 1●
Memorial Hospital Stilwell, OK 1 ●
OU Medical Center Oklahoma City, OK 1 ●
Perry Memorial Hospital Perry, OK 1 ●
Saint Francis Hospital Tulsa, OK 1 ●
Sequoyah Memorial Hospital Sallisaw, OK 1 ●
Adventist Medical Center Portland, OR 1 ●
Good Samaritan Regional Medical Center
Corvallis, OR 1●
Legacy Good Samaritan Medical Center
Portland, OR 1●
Legacy Meridian Park Hospital Tualatin, OR 1 ●
Oregon Health and Science University
Portland, OR 1●
Providence Newberg Medical Center
Newberg, OR 1●
Rogue Valley Medical Center Medford, OR 1 ●
Salem Hospital Salem, OR 1 ●
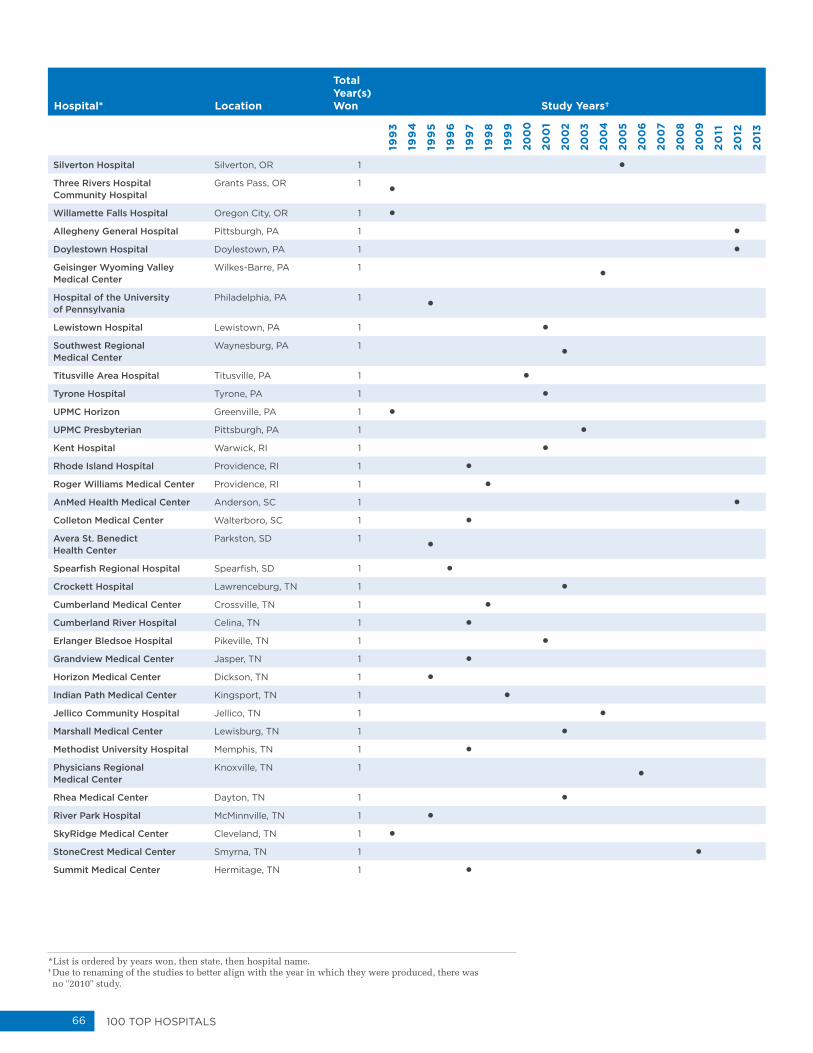
66 100 Top HospiTals
* List is ordered by years won, then state, then hospital name.† Due to renaming of the studies to better align with the year in which they were produced, there was no "2010" study.
Hospital* Location
Total Year(s) Won Study Years†
199
3
199
4
199
5
199
6
199
7
199
8
199
9
200
0
200
1
200
2
200
3
200
4
200
5
200
6
200
7
200
8
200
9
20
11
2012
2013
Silverton Hospital Silverton, OR 1 ●
Three Rivers Hospital Community Hospital
Grants Pass, OR 1●
Willamette Falls Hospital Oregon City, OR 1 ●
Allegheny General Hospital Pittsburgh, PA 1 ●
Doylestown Hospital Doylestown, PA 1 ●
Geisinger Wyoming Valley Medical Center
Wilkes-Barre, PA 1●
Hospital of the University of Pennsylvania
Philadelphia, PA 1●
Lewistown Hospital Lewistown, PA 1 ●
Southwest Regional Medical Center
Waynesburg, PA 1●
Titusville Area Hospital Titusville, PA 1 ●
Tyrone Hospital Tyrone, PA 1 ●
UPMC Horizon Greenville, PA 1 ●
UPMC Presbyterian Pittsburgh, PA 1 ●
Kent Hospital Warwick, RI 1 ●
Rhode Island Hospital Providence, RI 1 ●
Roger Williams Medical Center Providence, RI 1 ●
AnMed Health Medical Center Anderson, SC 1 ●
Colleton Medical Center Walterboro, SC 1 ●
Avera St. Benedict Health Center
Parkston, SD 1●
Spearfish Regional Hospital Spearfish, SD 1 ●
Crockett Hospital Lawrenceburg, TN 1 ●
Cumberland Medical Center Crossville, TN 1 ●
Cumberland River Hospital Celina, TN 1 ●
Erlanger Bledsoe Hospital Pikeville, TN 1 ●
Grandview Medical Center Jasper, TN 1 ●
Horizon Medical Center Dickson, TN 1 ●
Indian Path Medical Center Kingsport, TN 1 ●
Jellico Community Hospital Jellico, TN 1 ●
Marshall Medical Center Lewisburg, TN 1 ●
Methodist University Hospital Memphis, TN 1 ●
Physicians Regional Medical Center
Knoxville, TN 1●
Rhea Medical Center Dayton, TN 1 ●
River Park Hospital McMinnville, TN 1 ●
SkyRidge Medical Center Cleveland, TN 1 ●
StoneCrest Medical Center Smyrna, TN 1 ●
Summit Medical Center Hermitage, TN 1 ●
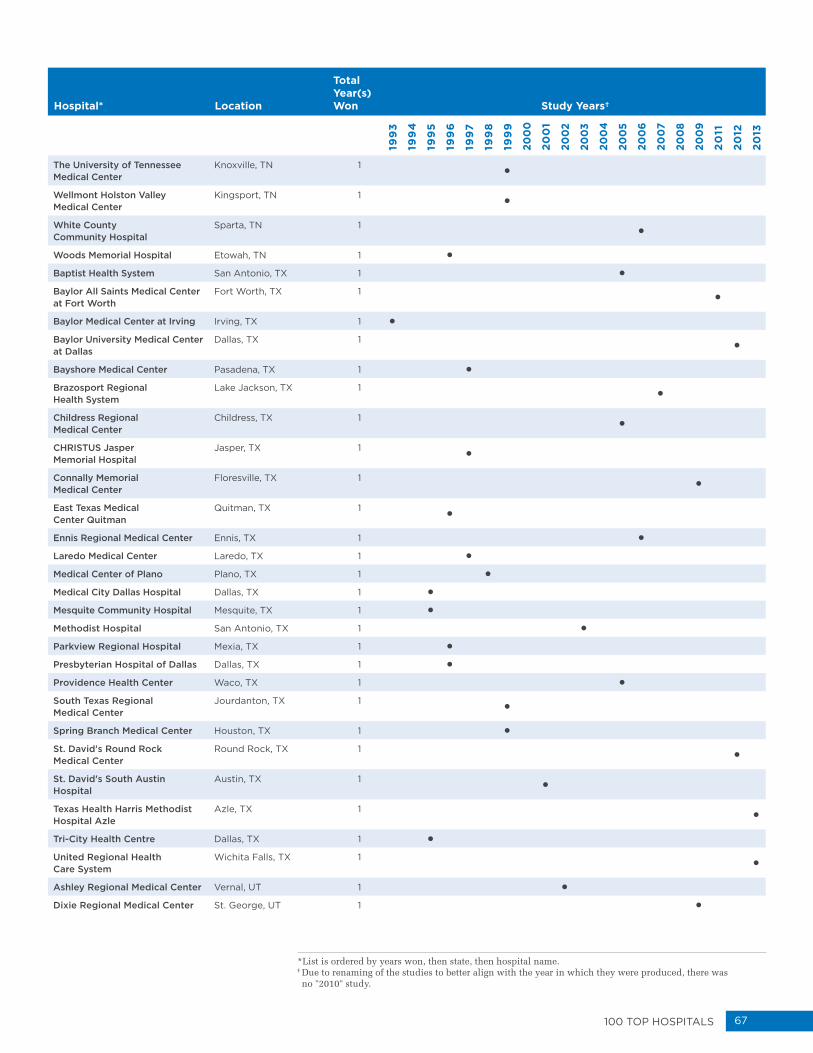
67100 Top HospiTals
* List is ordered by years won, then state, then hospital name.† Due to renaming of the studies to better align with the year in which they were produced, there was no "2010" study.
Hospital* Location
Total Year(s) Won Study Years†
199
3
199
4
199
5
199
6
199
7
199
8
199
9
200
0
200
1
200
2
200
3
200
4
200
5
200
6
200
7
200
8
200
9
20
11
2012
2013
The University of Tennessee Medical Center
Knoxville, TN 1●
Wellmont Holston Valley Medical Center
Kingsport, TN 1●
White County Community Hospital
Sparta, TN 1●
Woods Memorial Hospital Etowah, TN 1 ●
Baptist Health System San Antonio, TX 1 ●
Baylor All Saints Medical Center at Fort Worth
Fort Worth, TX 1●
Baylor Medical Center at Irving Irving, TX 1 ●
Baylor University Medical Center at Dallas
Dallas, TX 1●
Bayshore Medical Center Pasadena, TX 1 ●
Brazosport Regional Health System
Lake Jackson, TX 1●
Childress Regional Medical Center
Childress, TX 1●
CHRISTUS Jasper Memorial Hospital
Jasper, TX 1●
Connally Memorial Medical Center
Floresville, TX 1●
East Texas Medical Center Quitman
Quitman, TX 1●
Ennis Regional Medical Center Ennis, TX 1 ●
Laredo Medical Center Laredo, TX 1 ●
Medical Center of Plano Plano, TX 1 ●
Medical City Dallas Hospital Dallas, TX 1 ●
Mesquite Community Hospital Mesquite, TX 1 ●
Methodist Hospital San Antonio, TX 1 ●
Parkview Regional Hospital Mexia, TX 1 ●
Presbyterian Hospital of Dallas Dallas, TX 1 ●
Providence Health Center Waco, TX 1 ●
South Texas Regional Medical Center
Jourdanton, TX 1●
Spring Branch Medical Center Houston, TX 1 ●
St. David's Round Rock Medical Center
Round Rock, TX 1●
St. David's South Austin Hospital
Austin, TX 1●
Texas Health Harris Methodist Hospital Azle
Azle, TX 1●
Tri-City Health Centre Dallas, TX 1 ●
United Regional Health Care System
Wichita Falls, TX 1●
Ashley Regional Medical Center Vernal, UT 1 ●
Dixie Regional Medical Center St. George, UT 1 ●

68 100 Top HospiTals
* List is ordered by years won, then state, then hospital name.† Due to renaming of the studies to better align with the year in which they were produced, there was no "2010" study.
Hospital* Location
Total Year(s) Won Study Years†
199
3
199
4
199
5
199
6
199
7
199
8
199
9
200
0
200
1
200
2
200
3
200
4
200
5
200
6
200
7
200
8
200
9
20
11
2012
2013
LDS Hospital Salt Lake City, UT 1 ●
Bon Secours St. Mary's Hospital Richmond, VA 1 ●
CJW Medical Center Richmond, VA 1 ●
Culpeper Regional Hospital Culpeper, VA 1 ●
Henrico Doctors' Hospital Richmond, VA 1 ●
INOVA Loudoun Hospital Leesburg, VA 1 ●
Lee Regional Medical Center Pennington Gap, VA 1 ●
Martha Jefferson Hospital Charlottesville, VA 1 ●
Sentara Potomac Hospital Woodbridge, VA 1 ●
Virginia Hospital Center Arlington, VA 1 ●
Allenmore Hospital Tacoma, WA 1 ●
Cascade Valley Hospital and Clincs
Arlington, WA 1●
Deaconess Medical Center Spokane, WA 1 ●
Harrison Medical Center Bremerton, WA 1 ●
Northwest Hospital and Medical Center
Seattle, WA 1●
Othello Community Hospital Othello, WA 1 ●
PeaceHealth St. Joseph Medical Center
Bellingham, WA 1●
Providence Mount Carmel Hospital
Colville, WA 1●
Providence Sacred Heart Medical Center
Spokane, WA 1●
Samaritan Hospital Moses Lake, WA 1 ●
St. Elizabeth Hospital Enumclaw, WA 1 ●
St. John Medical Center Longview, WA 1 ●
Toppenish Community Hospital Toppenish, WA 1 ●
University of Washington Medical Center
Seattle, WA 1●
Virginia Mason Medical Center Seattle, WA 1 ●
Aspirus Wausau Hospital Wausau, WI 1 ●
Aurora BayCare Medical Center Green Bay, WI 1 ●
Aurora St. Luke's Medical Center
Milwaukee, WI 1●
Beaver Dam Community Hospitals, Inc.
Beaver Dam, WI 1●
Columbia St. Mary's Hospital Columbia
Milwaukee, WI 1●
Columbia St. Mary's Hospital Milwaukee
Milwaukee, WI 1●
Community Memorial Hospital Menomonee Falls, WI 1 ●
Froedtert & The Medical College of Wisconsin
Milwaukee, WI 1●
Grant Regional Health Center
Lancaster, WI 1●
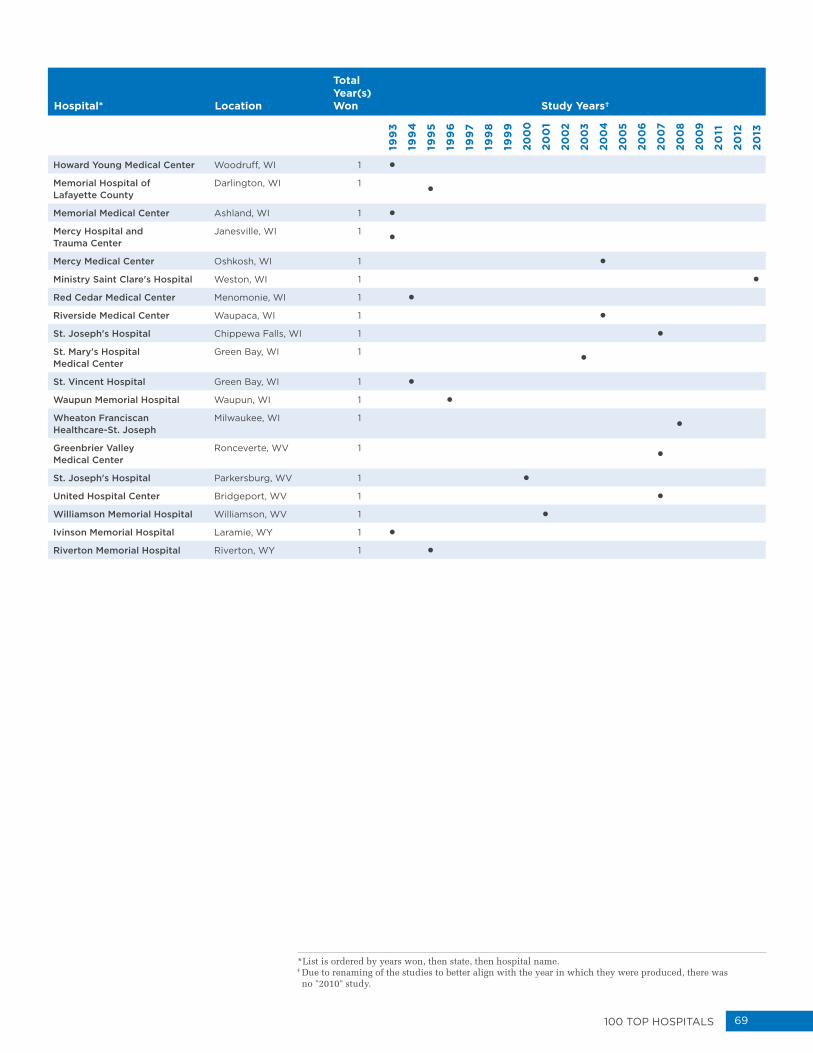
69100 Top HospiTals
* List is ordered by years won, then state, then hospital name.† Due to renaming of the studies to better align with the year in which they were produced, there was no "2010" study.
Hospital* Location
Total Year(s) Won Study Years†
199
3
199
4
199
5
199
6
199
7
199
8
199
9
200
0
200
1
200
2
200
3
200
4
200
5
200
6
200
7
200
8
200
9
20
11
2012
2013
Howard Young Medical Center Woodruff, WI 1 ●
Memorial Hospital of Lafayette County
Darlington, WI 1●
Memorial Medical Center Ashland, WI 1 ●
Mercy Hospital and Trauma Center
Janesville, WI 1●
Mercy Medical Center Oshkosh, WI 1 ●
Ministry Saint Clare's Hospital Weston, WI 1 ●
Red Cedar Medical Center Menomonie, WI 1 ●
Riverside Medical Center Waupaca, WI 1 ●
St. Joseph's Hospital Chippewa Falls, WI 1 ●
St. Mary's Hospital Medical Center
Green Bay, WI 1●
St. Vincent Hospital Green Bay, WI 1 ●
Waupun Memorial Hospital Waupun, WI 1 ●
Wheaton Franciscan Healthcare-St. Joseph
Milwaukee, WI 1●
Greenbrier Valley Medical Center
Ronceverte, WV 1●
St. Joseph's Hospital Parkersburg, WV 1 ●
United Hospital Center Bridgeport, WV 1 ●
Williamson Memorial Hospital Williamson, WV 1 ●
Ivinson Memorial Hospital Laramie, WY 1 ●
Riverton Memorial Hospital Riverton, WY 1 ●
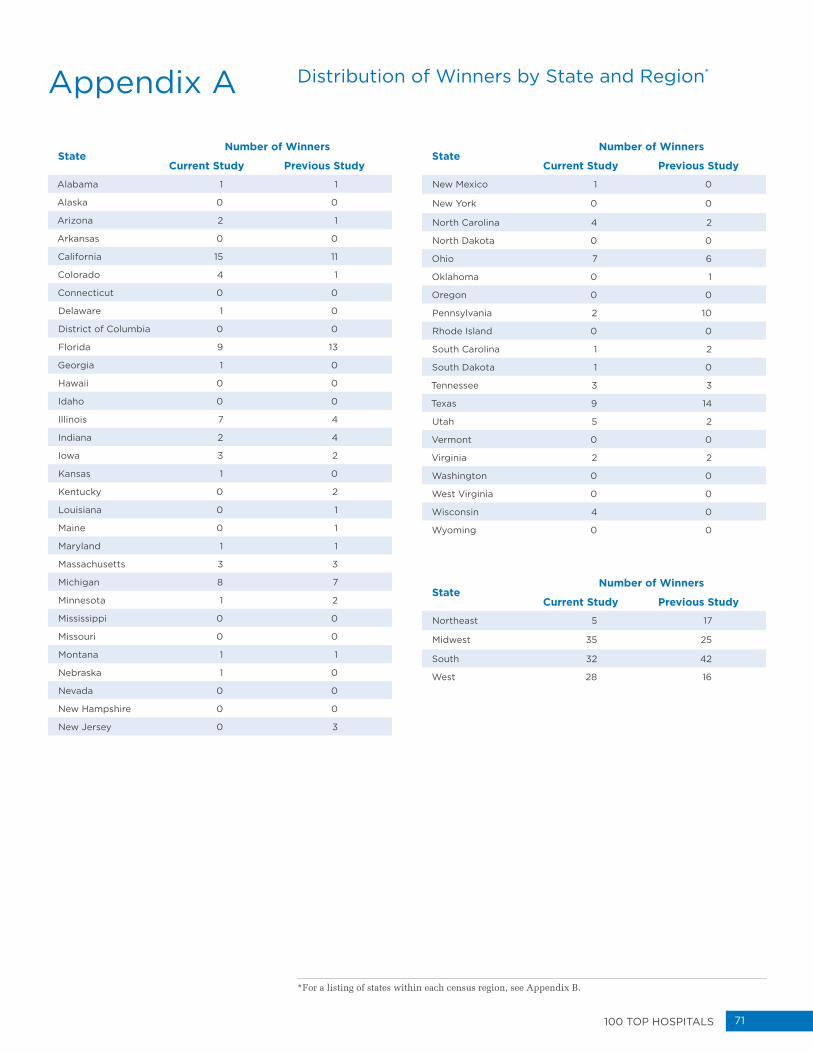
71100 Top HospiTals
Appendix A
StateNumber of Winners
Current Study Previous Study
Alabama 1 1
Alaska 0 0
Arizona 2 1
Arkansas 0 0
California 15 11
Colorado 4 1
Connecticut 0 0
Delaware 1 0
District of Columbia 0 0
Florida 9 13
Georgia 1 0
Hawaii 0 0
Idaho 0 0
Illinois 7 4
Indiana 2 4
Iowa 3 2
Kansas 1 0
Kentucky 0 2
Louisiana 0 1
Maine 0 1
Maryland 1 1
Massachusetts 3 3
Michigan 8 7
Minnesota 1 2
Mississippi 0 0
Missouri 0 0
Montana 1 1
Nebraska 1 0
Nevada 0 0
New Hampshire 0 0
New Jersey 0 3
StateNumber of Winners
Current Study Previous Study
New Mexico 1 0
New York 0 0
North Carolina 4 2
North Dakota 0 0
Ohio 7 6
Oklahoma 0 1
Oregon 0 0
Pennsylvania 2 10
Rhode Island 0 0
South Carolina 1 2
South Dakota 1 0
Tennessee 3 3
Texas 9 14
Utah 5 2
Vermont 0 0
Virginia 2 2
Washington 0 0
West Virginia 0 0
Wisconsin 4 0
Wyoming 0 0
StateNumber of Winners
Current Study Previous Study
Northeast 5 17
Midwest 35 25
South 32 42
West 28 16
Distribution of Winners by State and Region*
* For a listing of states within each census region, see Appendix B.
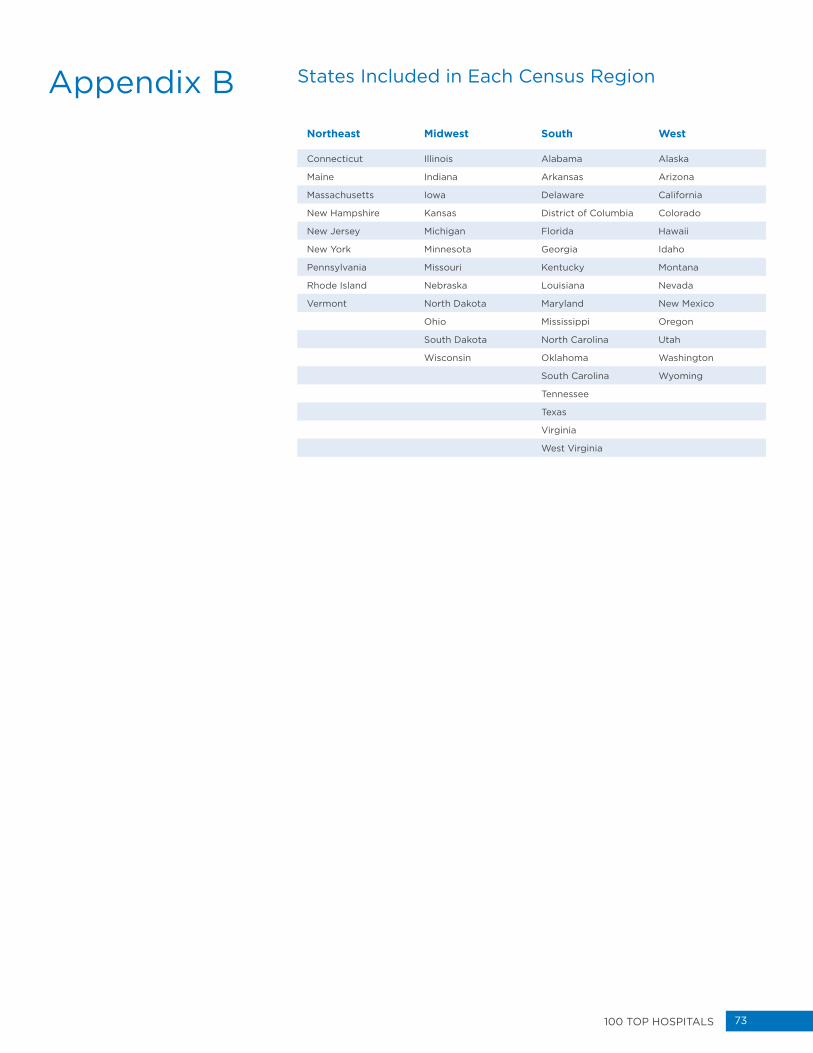
73100 Top HospiTals
Appendix B States Included in Each Census Region
Northeast Midwest South West
Connecticut Illinois Alabama Alaska
Maine Indiana Arkansas Arizona
Massachusetts Iowa Delaware California
New Hampshire Kansas District of Columbia Colorado
New Jersey Michigan Florida Hawaii
New York Minnesota Georgia Idaho
Pennsylvania Missouri Kentucky Montana
Rhode Island Nebraska Louisiana Nevada
Vermont North Dakota Maryland New Mexico
Ohio Mississippi Oregon
South Dakota North Carolina Utah
Wisconsin Oklahoma Washington
South Carolina Wyoming
Tennessee
Texas
Virginia
West Virginia

75100 Top HospiTals
Appendix C: Methodology Details
Methods for Identifying Complications of CareWithout adjusting for differences, comparing outcomes among hospitals is
like comparing the proverbial apples to oranges: hard, if not impossible, to do.
To make valid normative comparisons of hospital outcomes, it is necessary to
adjust raw data to accommodate differences that result from the variety and severity
of admitted cases.
Truven Health AnalyticsSM is able to make valid normative comparisons of mortality
and complications rates by using patient-level data to control effectively for
case mix and severity differences. We do this by evaluating ICD-9-CM diagnosis
and procedure codes to adjust for severity within clinical case mix groupings.
Conceptually, we group patients with similar characteristics (i.e., age, sex, principal
diagnosis, procedures performed, admission type, and comorbid conditions) to
produce expected, or normative, comparisons. Through extensive testing, we have
found that this methodology produces valid normative comparisons using readily
available administrative data, eliminating the need for additional data collection.32
Normative Database DevelopmentFor this study, Truven Health constructed a normative database of case-level data
from the most recent three years of MedPAR data (2009, 2010, and 2011). The data
include both fee-for-service Medicare claims and HMO encounters. Demographic and
clinical data are also included: age, sex, and length-of-stay (LOS); clinical groupings
(MS-DRGs), ICD-9-CM principal and secondary diagnoses1; ICD-9-CM principal and
secondary procedures2; present on admission coding; admission source and type;
and discharge status.
Present-on-Admission Data Under the Deficit Reduction Act of 2005, as of federal fiscal year (FFY) 2008,
hospitals receive reduced payments for cases with certain conditions — such as falls,
surgical site infections, and pressure ulcers — that were not present on the patient’s
admission, but occurred during hospitalization. As a result, CMS now requires all
inpatient prospective payment system hospitals to document whether a patient has
these conditions when admitted. Truven Health proprietary risk-adjustment models
for mortality, complications, and length-of-stay include present-on-admission (POA)
data that was reported in the 2009, 2010, and 2011 MedPAR datasets.
Risk-Adjusted Mortality Index ModelsTruven has developed an overall mortality risk model. From this model, we excluded
long-term care, psychiatric, substance abuse, rehabilitation, and federally owned or
controlled facilities. In addition, we excluded certain patient records from the data
set: psychiatric, substance abuse, rehabilitation, and unclassified cases (MS-DRGs
945, 946, and 999); cases where patient age was less than 65 years; and where patient
transferred to other short-term acute care hospital. Palliative care patients (v66.7) are
included in the mortality risk model, which is calibrated to determine probability of
death for these patients.
1 We used 25 diagnostic codes in the 2011 MedPar data set and 9 in the 2009 and 2010 MedPAR data sets.2 We used 25 procedure codes in the 2011 MedPar data set and 6 in the 2009 and 2010 MedPAR data sets.
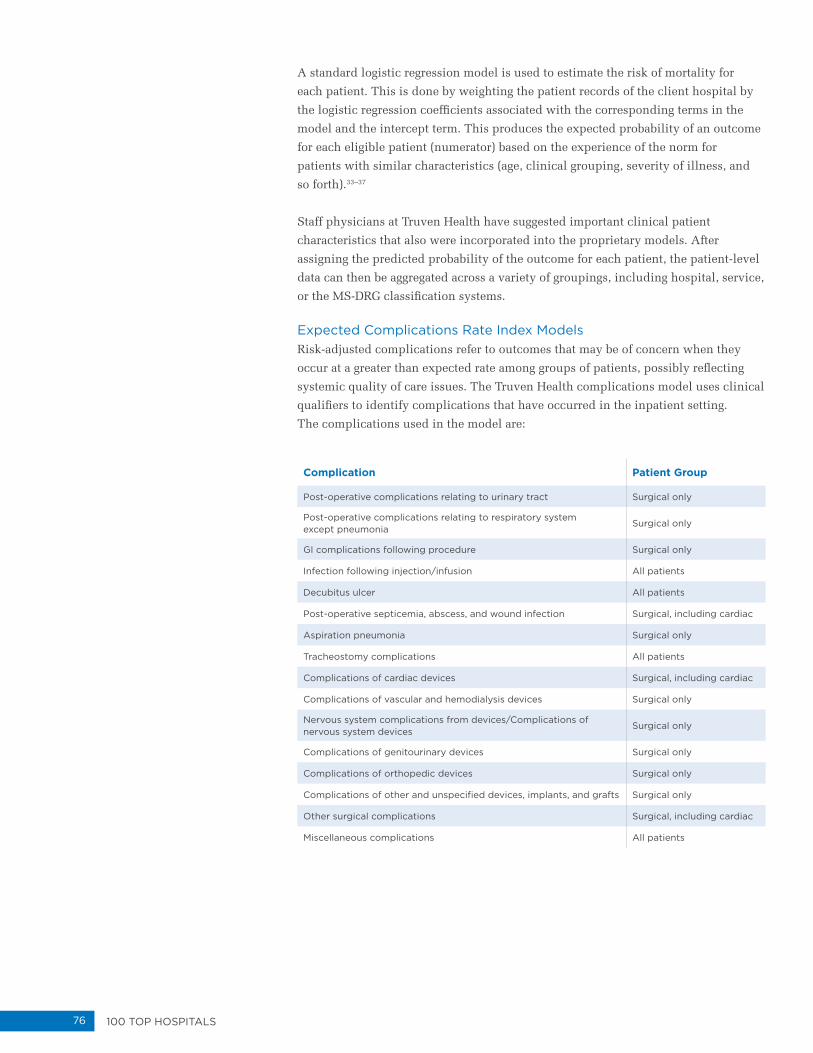
76 100 Top HospiTals
A standard logistic regression model is used to estimate the risk of mortality for
each patient. This is done by weighting the patient records of the client hospital by
the logistic regression coefficients associated with the corresponding terms in the
model and the intercept term. This produces the expected probability of an outcome
for each eligible patient (numerator) based on the experience of the norm for
patients with similar characteristics (age, clinical grouping, severity of illness, and
so forth).33–37
Staff physicians at Truven Health have suggested important clinical patient
characteristics that also were incorporated into the proprietary models. After
assigning the predicted probability of the outcome for each patient, the patient-level
data can then be aggregated across a variety of groupings, including hospital, service,
or the MS-DRG classification systems.
Expected Complications Rate Index ModelsRisk-adjusted complications refer to outcomes that may be of concern when they
occur at a greater than expected rate among groups of patients, possibly reflecting
systemic quality of care issues. The Truven Health complications model uses clinical
qualifiers to identify complications that have occurred in the inpatient setting.
The complications used in the model are:
Complication Patient Group
Post-operative complications relating to urinary tract Surgical only
Post-operative complications relating to respiratory system except pneumonia
Surgical only
GI complications following procedure Surgical only
Infection following injection/infusion All patients
Decubitus ulcer All patients
Post-operative septicemia, abscess, and wound infection Surgical, including cardiac
Aspiration pneumonia Surgical only
Tracheostomy complications All patients
Complications of cardiac devices Surgical, including cardiac
Complications of vascular and hemodialysis devices Surgical only
Nervous system complications from devices/Complications of nervous system devices
Surgical only
Complications of genitourinary devices Surgical only
Complications of orthopedic devices Surgical only
Complications of other and unspecified devices, implants, and grafts Surgical only
Other surgical complications Surgical, including cardiac
Miscellaneous complications All patients
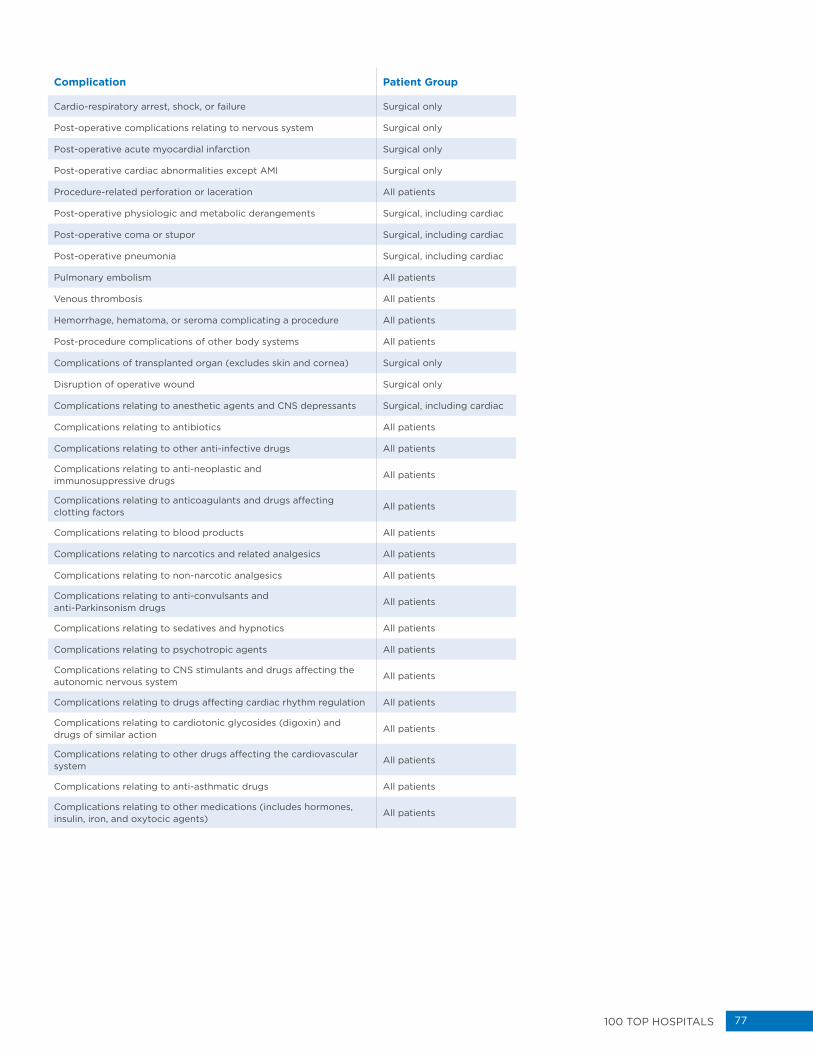
77100 Top HospiTals
Complication Patient Group
Cardio-respiratory arrest, shock, or failure Surgical only
Post-operative complications relating to nervous system Surgical only
Post-operative acute myocardial infarction Surgical only
Post-operative cardiac abnormalities except AMI Surgical only
Procedure-related perforation or laceration All patients
Post-operative physiologic and metabolic derangements Surgical, including cardiac
Post-operative coma or stupor Surgical, including cardiac
Post-operative pneumonia Surgical, including cardiac
Pulmonary embolism All patients
Venous thrombosis All patients
Hemorrhage, hematoma, or seroma complicating a procedure All patients
Post-procedure complications of other body systems All patients
Complications of transplanted organ (excludes skin and cornea) Surgical only
Disruption of operative wound Surgical only
Complications relating to anesthetic agents and CNS depressants Surgical, including cardiac
Complications relating to antibiotics All patients
Complications relating to other anti-infective drugs All patients
Complications relating to anti-neoplastic and immunosuppressive drugs
All patients
Complications relating to anticoagulants and drugs affecting clotting factors
All patients
Complications relating to blood products All patients
Complications relating to narcotics and related analgesics All patients
Complications relating to non-narcotic analgesics All patients
Complications relating to anti-convulsants and anti-Parkinsonism drugs
All patients
Complications relating to sedatives and hypnotics All patients
Complications relating to psychotropic agents All patients
Complications relating to CNS stimulants and drugs affecting the autonomic nervous system
All patients
Complications relating to drugs affecting cardiac rhythm regulation All patients
Complications relating to cardiotonic glycosides (digoxin) and drugs of similar action
All patients
Complications relating to other drugs affecting the cardiovascular system
All patients
Complications relating to anti-asthmatic drugs All patients
Complications relating to other medications (includes hormones, insulin, iron, and oxytocic agents)
All patients
78 100 Top HospiTals
A normative database of case-level data including age, sex, LOS, clinical grouping
(MS-DRGs), and comorbid conditions was constructed using the most recent three
years of available MedPAR data (2009, 2010, and 2011). Long-term care, psychiatric,
substance abuse, rehabilitation, and federally owned or controlled facilities were
not included. In addition, we excluded certain patient records from the data set:
psychiatric, substance abuse, rehabilitation, and unclassified cases (MS-DRGs 945,
946, and 999); cases where patient age was less than 65 years and where patient
transferred to other short-term acute care hospital.
A standard regression model is used to estimate the risk of experiencing a
complication for each patient. This is done by weighting the patient records of the
client hospital by the regression coefficients associated with the corresponding terms
in the prediction models and intercept term. This method produces the expected
probability of a complication for each patient based on the experience of the norm
for patients with similar characteristics. After assigning the predicted probability of
a complication for each patient in each risk group, it is then possible to aggregate the
patient-level data across a variety of groupings.38–41
Patient Safety IndicatorsThe Agency for Healthcare Research and Quality (AHRQ) is a public health service
agency within the federal government’s Department of Health and Human Services.
The agency’s mission includes both translating research findings into better patient
care and providing policymakers and other healthcare leaders with information
needed to make critical healthcare decisions. We use AHRQ’s Patient Safety
Indicators (PSIs) in calculating our risk-adjusted patient safety index performance
measure. This information on PSIs is from the AHRQ website (ahrq.gov):
The AHRQ Quality Indicators measure healthcare quality by using readily
available hospital inpatient administrative data. Patient Safety Indicators are a set
of indicators providing information on potential in-hospital complications and
adverse events following surgeries, procedures, and childbirth. The PSIs were
developed after a comprehensive literature review, analysis of ICD-9-CM codes,
review by a clinician panel, implementation of risk adjustment, and empirical
analyses. The Patient Safety Indicators provide a perspective on patient safety
events using hospital administrative data. Patient Safety Indicators also reflect
quality of care inside hospitals, but focus on surgical complications and other
iatrogenic events.42
For the risk-adjusted patient safety index performance measure, we began our
research with all PSIs that occurred with sufficient frequency to generate provider-
specific output. Of the 20 PSIs included in the original AHRQ methodology, only
15 produced non-zero PSI rates on the Medicare data. Four measures are for birth
or other obstetrical-related conditions, which do not occur in the age group under
study here. Transfusion reactions generated rates that were too low for the AHRQ PSI
software to generate provider-specific output. Due to the unreliability of E coding,
we also excluded complications of anesthesia (PSI 1), foreign body left in during
procedure (PSI 5), postoperative hip fracture (PSI 8), and accidental puncture and
laceration (PSI 15), which rely on E codes. Since the original analysis was done,
death in low-mortality DRGs (PSI 2) no longer has risk values in the model.

79100 Top HospiTals
Since the POA coding has become available with the MedPAR 2009 data set,
pressure ulcer (PSI 3) and postoperative pulmonary embolism or deep vein
thrombosis (PSI 12), which are highly impacted by POA coding, are included.
The AHRQ model version used in this study was Version 4.3, published August
2011. The model used POA coding in MedPAR data.
The final set of 10 PSIs included in this study was:
§ PSI 3: Pressure ulcer
§ PSI 4: Death among surgical inpatients with serious treatable complications
§ PSI 6: Iatrogenic pneumothorax
§ PSI 7: Central venous catheter-related bloodstream infections
§ PSI 9: Postoperative hemorrhage or hematoma
§ PSI 10: Postoperative physiologic and metabolic derangements
§ PSI 11: Postoperative respiratory failure
§ PSI 12: Postoperative pulmonary embolism or deep vein thrombosis
§ PSI 13: Postoperative sepsis
§ PSI 14: Postoperative wound dehiscence
ECRI and PSI: Complementary MethodologiesGiven its high level of importance, we chose to increase our emphasis on patient
safety by using both the PSI (AHRQ) and expected complications rate index (ECRI)
methodologies to calculate two separate outcome measures. Both PSI and ECRI are
methodologies for identifying complications of care. Although the definitions have
some similarities, there are enough differences that the two are useful complements
to each other. ECRI is an overall complication methodology in which the outcome is
the occurrence of one or more of 47 complications of care. The AHRQ PSIs used in
our study are based on 10 separate models that evaluate the occurrence of 10 distinct
complications of care, one of which is mortality related — an adverse outcome that is
not included in ECRI.
Index InterpretationAn outcome index is a ratio of an observed number of outcomes to an expected
number of outcomes in a particular population. This index is used to make
normative comparisons and is standardized in that the expected number of events
is based on the occurrence of the event in a normative population. The normative
population used to calculate expected numbers of events is selected to be similar to
the comparison population with respect to relevant characteristics, including age,
sex, region, and case mix.
The index is simply the number of observed events divided by the number
of expected events and can be calculated for outcomes that involve counts of
occurrences (e.g., deaths or complications). Interpretation of the index relates the
experience of the comparison population relative to a specified event to the expected
experience based on the normative population.

80 100 Top HospiTals
Examples:
10 events observed ÷ 10 events expected = 1.0: The observed number of events
is equal to the expected number of events based on the normative experience.
10 events observed ÷ 5 events expected = 2.0: The observed number of events
is twice the expected number of events based on the normative experience.
10 events observed ÷ 25 events expected = 0.4: The observed number of
events is 60 percent lower than the expected number of events based on the
normative experience.
Therefore, an index value of 1.0 indicates no difference between observed and
expected outcome occurrence. An index value greater than 1.0 indicates an excess
in the observed number of events relative to the expected based on the normative
experience. An index value less than 1.0 indicates fewer events observed than would
be expected based on the normative experience. An additional interpretation is that
the difference between 1.0 and the index is the percentage difference in the number
of events relative to the norm. In other words, an index of 1.05 indicates 5 percent
more outcomes, and an index of 0.90 indicates 10 percent fewer outcomes than
expected based on the experience of the norm. The index can be calculated across a
variety of groupings (e.g., hospital, service).
Core MeasuresCore measures were developed by the Joint Commission and endorsed by the
National Quality Forum (NQF), the nonprofit public-private partnership organization
that endorses national healthcare performance measures, as minimum basic care
standards. They are a widely accepted method for measuring quality of patient care
that includes specific guidelines for heart attack (acute myocardial infarction (AMI)),
heart failure (HF), pneumonia, pregnancy and related conditions, and surgical care.
Our composite core measures mean percent is based on the AMI, HF, pneumonia,
and surgical care areas of this program, using Hospital Compare data reported on the
Centers for Medicare and Medicaid Services (CMS) website. The data in this study
are from the third quarter 2012 database. This contains data from January 1 through
December 31, 2011.
In calculating each hospital’s core measures mean percent, the comparison group
median core- measure value was substituted for a missing core measure. In addition,
the comparison group median core measure value was substituted when the hospital
reported core measures with patient counts less than or equal to 25 or with relative
standard error greater than or equal to 0.30. This was done because the original
reported values were considered statistically unreliable.

81100 Top HospiTals
AMI Core Measures
AMI-8A* Heart attack patients given percutaneous coronary intervention within 90 minutes of arrival
AMI-10* Heart attack patients given a prescription for statin at discharge
HF Core Measures
HF-1 Heart failure patients given discharge instructions
Pneumonia Core Measures
PN-3B Pneumonia patients whose initial emergency room blood culture was performed prior to the administration of the first hospital dose of antibiotics
PN-5C Pneumonia patients given initial antibiotic(s) within 6 hours after arrival
PN-6 Pneumonia patients given the most appropriate initial antibiotic(s)
Surgical Care Improvement Project Core Measures
SCIP_CARD_2 Surgery patients who were taking heart drugs called beta blockers before coming to the hospital, who were kept on the beta blockers during the period just before and after their surgery
SCIP-INF-1 Surgery patients who were given an antibiotic at the right time (within one hour before surgery) to help prevent infection
SCIP-INF-2 Surgery patients who were given the right kind of antibiotic to help prevent infection
SCIP-INF-3 Surgery patients whose preventive antibiotics were stopped at the right time (within 24 hours after surgery)
SCIP-INF-4* Heart surgery patients whose blood sugar (blood glucose) is kept under good control in the days right after surgery
SCIP-INF-9 Surgery patients whose urinary catheters were removed on the first or second day after surgery
SCIP-INF-10 Patients having surgery who were actively warmed in the operating room or whose body temperature was near normal by the end of surgery
SCIP-VTE-1 Surgery patients whose doctors ordered treatments to prevent blood clots after certain types of surgeries
SCIP-VTE-2 Patients who got treatment at the right time (within 24 hours before or after their surgery) to help prevent blood clots after certain types of surgery
* We did not include this measure for small community hospitals due to very low reporting.
82 100 Top HospiTals
30-Day Risk-Adjusted Mortality Rates and 30-Day Risk-Adjusted Readmission RatesThis study currently includes two extended outcome measures — 30-day mortality
and 30-day readmission rates, as defined by the CMS Hospital Compare dataset
(third quarter 2012). The longitudinal data period contained in this analysis is July
1, 2008, through June 30, 2011. The Hospital Compare website and database were
created by CMS, the Department of Health and Human Services, and other members
of the Hospital Quality Alliance. The data on the website come from hospitals that
have agreed to submit quality information that will be made public. Both of the
measures used in this study have been endorsed by the NQF.
CMS calculates the 30-day mortality and 30-day readmission rates from
Medicare enrollment and claims records using sophisticated statistical modeling
techniques that adjust for patient-level risk factors and account for the clustering
of patients within hospitals. Both rates are based on heart attack, heart failure, and
pneumonia patients.
CMS’ three mortality models (heart attack, heart failure, and pneumonia) estimate
hospital-specific, risk-standardized, all-cause 30-day mortality rates for patients
hospitalized with a principal diagnosis of heart attack, heart failure, or pneumonia.
All-cause mortality is defined as death from any cause within 30 days after the
admission date, regardless of whether the patient dies while still in the hospital
or after discharge.
CMS’ three readmission models estimate hospital-specific, risk-standardized,
all-cause 30-day readmission rates for patients discharged alive to a non-acute-
care setting with a principal diagnosis of heart attack, heart failure, or pneumonia.
Patients may have been readmitted back to the same hospital, to a different hospital
or to an acute-care facility. They may have been readmitted for the same condition as
their recent hospital stay or for a different reason (this is to discourage hospitals from
coding similar readmissions as different readmissions).29
HCAHPS Overall Hospital RatingTo measure patient perception of care, this study uses the Hospital Consumer
Assessment of Healthcare Providers and Systems (HCAHPS) patient survey. HCAHPS
is a standardized survey instrument and data collection methodology for measuring
patients’ perspectives of hospital care. HCAHPS is a core set of questions that can
be combined with customized, hospital-specific items to produce information that
complements the data hospitals currently collect to support internal customer
service and quality-related activities.
HCAHPS was developed through a partnership between CMS and AHRQ that had
three broad goals:
§ Produce comparable data on patients’ perspectives of care that allow objective and
meaningful comparisons among hospitals on topics that are important
to consumers

83100 Top HospiTals
§ Encourage public reporting of the survey results to create incentives for hospitals
to improve quality of care
§ Enhance public accountability in healthcare by increasing the transparency of the
quality of hospital care provided in return for the public investment
The HCAHPS survey has been endorsed by the NQF and the Hospital Quality
Alliance. The federal government’s Office of Management and Budget has approved
the national implementation of HCAHPS for public reporting purposes.
Voluntary collection of HCAHPS data for public reporting began in October
2006. The first public reporting of HCAHPS results, which encompassed eligible
discharges from October 2006 through June 2007, occurred in March 2008. HCAHPS
results are posted on the Hospital Compare website, found at hospitalcompare.hhs.
gov, or through a link on medicare.gov. A downloadable version of HCAHPS results
is available.43
For this study edition, we used Hospital Compare data from the third quarter 2012
database. This database contains the HCAHPS results for data period January 1
through December 31, 2011. Although we are reporting hospital performance on
all HCAHPS questions, only performance on the Overall Hospital Rating question,
“How do patients rate the hospital, overall?” is used to rank hospital performance.
Patient responses fell into three categories, and the number of patients in each
category was reported as a percent:
§ Patients who gave a rating of 6 or lower (low)
§ Patients who gave a rating of 7 or 8 (medium)
§ Patients who gave a rating of 9 or 10 (high)
For each answer category, we assigned a weight as follows: 3 equals high or good
performance, 2 equals medium or average performance, and 1 equals low or poor
performance. We then calculated a weighted score for each hospital by multiplying
the HCAHPS answer percent by the category weight. For each hospital, we summed
the weighted percent values for the three answer categories. Hospitals were then
ranked by this weighted percent sum. The highest possible HCAHPS score is 300
(100 percent of patients rate the hospital high). The lowest possible HCAHPS score
is 100 (100 percent of patients rate the hospital low).
Length-of-Stay MethodologiesThe study’s LOS performance measure uses the Truven Health proprietary, severity-
adjusted resource demand methodology. This model now includes POA data that
was reported in the 2010 and 2011 MedPAR datasets. Under the Deficit Reduction
Act of 2005, as of federal fiscal year 2008, hospitals receive reduced payments for
cases in which certain conditions — like falls, surgical site infections, and pressure
ulcers — were not present on the patient’s admission but occur during their
hospitalization. As a result, CMS now requires all inpatient prospective payment
system hospitals to document whether a patient has these conditions when admitted.
84 100 Top HospiTals
Our severity-adjusted resource demand model allows us to produce risk-adjusted
performance comparisons on LOS between or across virtually any subgroup of
inpatients. These patient groupings can be based on clinical groupings, hospitals,
product lines, geographic regions, physicians, etc. This regression model adjusts
for differences in diagnosis type and illness severity, based on ICD-9-CM coding. It
also adjusts for patient age, gender, and admission status. Its associated LOS weights
allow group comparisons on a national level and in a specific market area. This year,
the LOS model has been recalibrated from three years of MedPAR data (2009, 2010,
and 2011), taking into account present on admission (POA) coding.
POA coding allows us to determine appropriate adjustments based on pre-existing
conditions versus complications of hospital care. We calculate expected values from
model coefficients that are normalized to the clinical group and transformed from
log scale.
Performance Measure NormalizationThe mortality, complications, patient safety index, and LOS measures are
normalized, based on the in-study population, by comparison group, to provide a
more easily interpreted comparison among hospitals. To address the impact of bed
size and teaching status, including extent of residency program involvement, and
compare hospitals to other like hospitals, we assign each hospital in the study to
one of five comparison groups (major teaching, teaching, large community, medium
community, and small community hospitals). (Detailed descriptions of the patient
and hospital comparison groups can be found in the Methodology section of
this document.)
For the mortality and complications measures, we base our ranking on the difference
between observed and expected events, expressed in standard deviation units
(z-scores) that have been normalized. We normalize the individual hospital z-scores
by finding the difference between the hospital z-score and the mean z-score for their
comparison group. The difference is then divided by the standard deviation of the
comparison group’s z-scores to produce the normalized z-score for the hospital.
For length-of-stay measure, we base our ranking on the normalized severity-adjusted
LOS index expressed in days. This index is the ratio of the observed and the
normalized expected values for each hospital. We normalize the individual hospital’s
expected values by multiplying them by the ratio of the observed to expected values
for the comparison group. The hospital’s normalized index is then calculated by
dividing the hospital’s observed value by its normalized expected value. We convert
this normalized index into days by multiplying by the average length-of-stay of the
in-study hospitals (grand mean LOS).
85100 Top HospiTals
Interquartile Range MethodologyFor each measure, we calculate an interquartile range (IQR) based on data for all
in-study hospitals. Two outlier points (trim points) are set for each measure: one
upper limit and one lower limit.
A value (X) is considered an outlier if either of the following is true:
X > upper limit outlier point
X < lower limit outlier point
The procedure for calculating the IQR and outlier points is as follows:
§ Determine the first quartile (Q1). This is the 25th percentile value of all records in
the population
§ Determine the third quartile (Q3). This is the 75th percentile value of all records
in the population
§ Calculate the IQR by subtracting Q1 from Q3. (IQR = Q3 – Q1)
§ Calculate the upper limit trim point for PSI index, and the upper and lower limit
trim points for inpatient expense per discharge:
– upper limit = Q3 + (3.0 × IQR)
– lower limit = Q1 – (3.0 × IQR)
§ Calculate the upper and lower limit trim points for operating profit margin:
– upper limit = Q3 + (2.0 × IQR)
– lower limit = Q1 – (2.0 × IQR)
Data points that are outside the IQR limits are considered to be extreme outliers
and are excluded.
Why We Have Not Calculated Percent Change in Specific InstancesPercent change is a meaningless statistic when the underlying quantity can be
positive, negative, or zero. The actual change may mean something, but dividing
it by a number that may be zero or of the opposite sign does not convey any
meaningful information because the amount of change is not proportional to its
previous value.44
We also do not report percent change when the metrics are already percentages.
In these cases, we report the simple difference between the two percentage values.
Protecting Patient PrivacyIn accordance with patient privacy laws, we do not report any individual hospital
data that are based on 11 or fewer patients. This affects the following measures:
§ Risk-adjusted mortality index
§ Risk-adjusted complications index
§ 30-day mortality rates for AMI, heart failure, and pneumonia
(CMS does not report a rate when count is less than 25)
§ 30-day readmission rates for AMI, heart failure, and pneumonia
(CMS does not report a rate when count is less than 25)
§ Average length-of-stay

86 100 Top HospiTals
Medicare Cost Report Line Items Used in the Performance Measures CalculationsA number of our calculations include data from the Medicare Cost Report. Below
you will find our calculations and the Cost Report locations (worksheet, line, and
column) for all of these items. The following apply to the 100 Top Hospitals study
and the hospital Medicare Cost Report for the hospital fiscal year ending in 2011.
In cases where a 2011 cost report was missing or incomplete due to the change in
reporting format (2552-96 replaced by 2552-10), we used the 2010 cost report. Please
note that the locations of the elements will sometimes vary between Cost Reports.
The line and column references are the standard based on CMS Form 2552-96.
Any deviations from this standard are checked by system and manual data analysis
to ensure that the coding has been done properly.
Case Mix- and Wage-Adjusted Inpatient Expense per Discharge [((0.62 × Acute Inpatient Expense ÷ CMS Wage Index) + 0.38 × Acute Inpatient
Expense) ÷ Acute Inpatient Discharges] ÷ Medicare Case Mix Index
Acute Inpatient Expense = Inpatient Expense — (Subprovider Expense — Nursery
Expense — Skilled Nursing Facility Expense — Intermediate-Care Facility
Expense — Other Long-Term Care Facility Expense — Cost Centers without
Revenue (e.g., organ procurement, outpatient therapy, other capital-related
costs, etc.)
Inpatient Expense = Sum Over All Departments
[(Inpatient Department Charges ÷ Department Charges) × Department Cost]
Individual Element Locations in the Medicare Cost Report:
§ Acute Inpatient Discharges — Worksheet S-3, Line 14, Column 15
§ Inpatient Department (cost center) elements:
– Fully Allocated Cost — Worksheet C, Part 1, Column 1
– Total Charges — Worksheet C, Part 1, Column 8
– Inpatient Charges — Worksheet C, Part 1, Column 6
§ Medicare Case Mix Index — Federal Register: CMS Inpatient Prospective Payment
System (IPPS) Fiscal Year 2009 Final Rule
§ CMS Wage Index — CMS Federal Register: CMS IPPS Fiscal Year 2009 Final Rule
§ Medicare Case Mix Index — Federal Register: CMS Inpatient Prospective Payment
System (IPPS) Fiscal Year 2010 Final Rule (if FY end before October 1, 2011) or
2011 (cost report end date October 1 or later)
§ CMS Wage Index — CMS Federal Register: CMS IPPS Fiscal Year 2010 Final Rule
(if FY end before October 1, 2011) or 2011 (cost report end date October 1 or later)

87100 Top HospiTals
Adjusted Operating Profit Margin[(Net Patient Revenue + Other Operating Revenue — (Total Operating Expense +
Related Organization Expense)) ÷ (Net Patient Revenue + Other Operating Revenue)]
× 100
Other Operating Revenue = [Total Other Income — Other Income: Contributions,
Donations, etc. — Other Income from Investments]
Individual Element Locations in the Medicare Cost Report:
§ Net Patient Revenue — Worksheet G-3, Line 3, Column 1
§ Total Other Income — Worksheet G-3, Line 25, Column 1
§ Other Income: Contributions, Donations, etc. — Worksheet G-3, Line 6, Column 1
§ Other Income from Investments — Worksheet G-3, Line 7, Column 1
§ Total Operating Expense — Worksheet G-3, Line 4, Column 1
§ Related Organization Expense — Worksheet A-8, Line 12, Column 2
89100 Top HospiTals
1. Foster DA. HCAHPS 2008: Comparison Results for 100 Top Hospitals Winners
versus Nonwinners. Ann Arbor, MI: Truven Health Analytics Center for
Healthcare Improvement. August 2008.
2. Foster DA. Risk-Adjusted Mortality Index Methodology. Ann Arbor, MI:
Center for Healthcare Improvement, Truven Health Analytics. July 2008.
3. Griffith JR, Alexander JA, Foster DA. Is Anybody Managing the Store? National
Trends in Hospital Performance. Healthc Manag. 2006 Nov–Dec; 51(6):392-405;
discussion 405-6.
4. Griffith JR, Alexander JA, Jelinek RC. Measuring Comparative Hospital
Performance. Healthc Manag. 2002 Jan–Feb; 47(1).
5. Griffith JR, Knutzen SR, Alexander JA. Structural versus Outcomes Measures in
Hospitals: A Comparison of Joint Commission and Medicare Outcomes Scores
in Hospitals. Qual Manag Health Care. 2002; 10(2): 29-38.
6. Shook J, Young J. Inpatient and Outpatient Growth by Service Line: 2006
Truven Health 100 Top Hospitals: Performance Improvement Leaders versus
Peer Hospitals. Ann Arbor, MI: Center for Healthcare Improvement,
Truven Health Analytics. August 2007.
7. Young J. Outpatient Care Standards Followed More Closely at Top-Performing
Hospitals. Ann Arbor, MI: Center for Healthcare Improvement, Truven Health
Analytics. March 2011.
8. Young J. Hospitals Increase Cardiovascular Core Measure Compliance.
Ann Arbor, MI: Center for Healthcare Improvement, Truven Health Analytics.
November 2010.
9. Foster DA. Top Cardiovascular Care Means Greater Clinical and Financial Value.
Ann Arbor, MI: Center for Healthcare Improvement, Truven Health Analytics.
November 2009.
10. Foster DA. Trends in Patient Safety Adverse Outcomes and 100 Top Hospitals
Performance, 2000–2005. Ann Arbor, MI: Center for Healthcare Improvement,
Truven Health Analytics. March 2008.
11. Bonis PA, Pickens GT, Rind DM, Foster DA. Association of a clinical knowledge
support system with improved patient safety reduced complications and shorter
length-of-stay among Medicare beneficiaries in acute care hospitals in the United
States. Int J Med Inform. 2008 Nov;77(11):745-53. Epub 2008 Jun 19.
12. Lee DW, Foster DA. The association between hospital outcomes and diagnostic
imaging: early findings. J Am Coll Radiol. 2009 Nov; 6(11):780-5.
13. Shook J, Chenoweth J. 100 Top Hospitals CEO Insights: Adoption Rates of Select
Baldrige Award Practices and Processes. Ann Arbor, MI: Center for Healthcare
Improvement, Truven Health Analytics. October 2012.
References

90 100 Top HospiTals
14. Foster DA, Cheoweth J. Comparison of Baldrige Award Applicants and
Recipients With Peer Hospitals on a National Balanced Scorecard. Ann Arbor,
MI: Center for Healthcare Improvement, Truven Health Analytics. October 2011.
15. Chenoweth J, Safavi K. Leadership Strategies for Reaching Top Performance
Faster. J Healthc Tech. January 2007. HCT Project Volume 4.
16. McDonagh KJ. Hospital Governing Boards: A Study of Their Effectiveness in
Relation to Organizational Performance. Healthc Manag. 2006 Nov–Dec; 51(6).
17. Bass K, Foster DA, Chenoweth J. Study Results — Proving Measurable
Leadership and Engagement Impact on Quality, CMS Invitational Conference on
Leadership and Quality. Sept 28, 2006.
18. Cejka Search and Solucient, LLC. 2005 Hospital CEO Leadership Survey.
19. HIMSS Analytics, Truven Health Analytics. 2012 HIMSS Analytics Report:
Quality and Safety Linked to Advanced Information Technology Enabled
Processes. Chicago, IL: HIMSS Analytics. April 2012.
20. Chenoweth J, Foster DA, Waibel BC. Best Practices in Board Oversight of
Quality. The Governance Institute. June 2006.
21. Kroch E, Vaughn T, Koepke M, Roman S, Foster DA, Sinha S, Levey S. Hospital
Boards and Quality Dashboards. J Patient Safety. 2(1):10-19, March 2006.
22. 22. Health Research and Educational Trust and Prybil, L. Governance in High-
Performing Organizations: A Comparative Study of Governing Boards in Not-
For-Profit Hospitals. Chicago: HRET in Partnership with AHA. 2005.
23. Foster DA. Hospital System Membership and Performance. Ann Arbor, MI:
Center for Healthcare Improvement, Truven Health Analytics. May 2012.
24. Kaplan RS, Norton DP. The Balanced Scorecard: Measures that Drive
Performance. Harvard Bus Rev, Jan–Feb 1992.
25. The MedPAR data years quoted in 100 Top Hospitals are federal fiscal years — a
year that begins on October 1 of each calendar year and ends on September 30
of the following calendar year. Federal fiscal years are identified by the year in
which they end (e.g., the 2011 fiscal year begins on October 1, 2010 and ends on
September 30, 2011).
26. We obtain ACGME program involvement data annually from the American
Medical Association (AMA). This year’s study is based on the ACGME file
received from the AMA in June 2012.
27. AOA residency information was collected from the AOA website
(http://opportunities.osteopathic.org/) in April 2012.
28. See the AHRQ website at www.ahrq.gov.
29. See the CMS Hospital Compare website at www.hospitalcompare.hhs.gov.
Referenced November 2011.

91100 Top HospiTals
30. Iezzoni L, Ash A, Shwartz M, Daley J, Hughes J, Mackiernan Y. Judging Hospitals
by Severity-Adjusted Mortality Rates: The Influence of the Severity-Adjusted
Method. Am J Public Health. 1996; 86(10):1379-1387.
31. Iezzoni L, Shwartz M, Ash A, Hughes J, Daley J, Mackiernan Y.
Using severity-adjusted stroke mortality rates to judge hospitals.
Int J Qual Health C. 1995; 7(2):81-94.
32. Foster, D. Model-Based Resource Demand Adjustment Methodology.
Truven Health Analytics (July 2012).
33. DesHarnais SI, McMahon LF Jr, Wroblewski RT. Measuring Outcomes of
Hospital Care Using Multiple Risk-Adjusted Indexes. Health Services Research,
26, no. 4 (Oct 1991): 425-445.
34. DesHarnais SI, et al. The Risk Adjusted Mortality Index: A New Measure of
Hospital Performance. Medical Care. 26, no. 12 (Dec 1988): 1129-1148.
35. DesHarnais SI, et al. Risk-Adjusted Quality Outcome Measures: Indexes
for Benchmarking Rates of Mortality, Complications, and Readmissions.
Qual Manag Health Care. 5 (Winter 1997):80-87. 89
36. DesHarnais SI, et al. Measuring Hospital Performance: the Development
and Validation of Risk-Adjusted Indexes of Mortality, Readmissions, and
Complication. Med Car. 28, no. 12 (Dec 1990): 1127-1141.
37. Iezzoni LI, et al. Chronic Conditions and Risk of In-Hospital Death.
Health Serv Res. 29, no. 4 (Oct 1994): 435-460.
38. Iezzoni LI, et al: Identifying Complications of Care Using Administrative Data.
Med Care. 32, no.7 (Jul 1994): 700-715.
39. Iezzoni LI, et al. Using Administrative Data to Screen Hospitals for High
Complication Rates. Inquiry. 31, no. 1 (Spring 1994): 40-55.
40. Iezzoni LI. Assessing Quality Using Administrative Data. Ann Intern Med.
127, no. 8 (Oct 1997): 666-674.
41. Weingart SN, et al. Use of Administrative Data to Find Substandard Care:
Validation of the Complications Screening Program. Med Care. 38, no. 8
(Aug 2000): 796-806.
42. See the Agency for Healthcare Research and Quality (AHRQ) website at
(http://www.qualityindicators.ahrq.gov/data/hcup/psi.htm). Retrieved in
June 2004.
43. See the CMS Hospital Compare website at http://www.cms.hhs.gov/
hospitalqualityinits/30_hospitalhcahps.asp. Referenced on January 28, 2009.
44. The Wall Street Journal, New York, NY, Online Help: Digest of Earnings
(http://online.wsj.com/public/resources/documents/doe-help.htm).

ABOUT TRUVEN HEALTH ANALYTICS
Truven Health Analytics delivers unbiased information, analytic tools, benchmarks, and services to the healthcare industry. Hospitals, government agencies, employers, health plans, clinicians, pharmaceutical, and medical device companies have relied on us for more than 30 years. We combine our deep clinical, financial, and healthcare management expertise with innovative technology platforms and information assets to make healthcare better by collaborating with our customers to uncover and realize opportunities for improving quality, efficiency, and outcomes. With more than 2,000 employees globally, we have major offices in Ann Arbor, Mich.; Chicago; and Denver. Advantage Suite, Micromedex, ActionOI, MarketScan, and 100 Top Hospitals are registered trademarks or trademarks of Truven Health Analytics.
truvenhealth.com | 1.800.366.7526
©2013 Truven Health Analytics Inc. All rights reserved. All other product names used herein are trademarks of their respective owners. HOSP 12199 1212
Visit 100tophospitals.com or send us an email to [email protected]
FOR MORE INFORMATION