
10.0 LAND USE 10.1 I NTRODUCTION - Bayfield County, WI
48
10-1 10.0 LAND USE 10.1 INTRODUCTION The Land Use Element is the central component of a land use plan. This section serves as a mechanism to guide and manage future growth and development while protecting Bayfield County’s vital natural resources. The intent of the land use section is to guide development into the most suitable areas of the county, ensure the compatibility of future land uses, and to allocate growth in accordance with forecast population growth and community needs. In order to accomplish this task, existing land uses have been documented and analyzed. Existing land uses are compared to a wide range of environmental, economic, and social variables to develop an understanding of how existing land use patterns in Bayfield County influence local decision-making, affect the natural resource base, and impact the county’s economy. Land use directly impacts all other elements of this land use plan and vice versa. Transportation, coastal resources, public and community facilities, housing, and population are all related to, if not intimately linked to, land use. Knowledge of the existing land use conditions is correlated with predictions based on population and economic trends to define future land use needs. Bayfield County, for example, is gaining population, thus will require additional residential development. More people ultimately require additional community services, businesses, transportation, and industry. Finding suitable locations for development is key to the land use planning process. Future land uses will be allocated based on the ability of the land to support the proposed activity, costs to provide municipal services, and compatibility with existing and proposed future uses. The land use recommendations and future land use map will serve as a guide to assist county officials, citizens, and developers in managing growth. Recognizing that land use is impacted by a wide array of future variables, some of which can only be assumed or projected based on existing models, it is important that the plan be updated and revised periodically to adjust for changing needs, deviations from population projections, improved knowledge of natural environment, economic conditions, and community values and needs. This section of the land use plan will describe the existing land use conditions, trends, forecasts, and land use controls to create a community land use profile. It will describe community trends, needs, and desires and will create the foundation for the siting of new development. Finally, it will allocate land uses to the most suitable locations and recommendations will be made with regards to land use controls to ensure compatibility with the contents of this plan.
Transcript of 10.0 LAND USE 10.1 I NTRODUCTION - Bayfield County, WI

10-1
10.0 LAND USE 10.1 INTRODUCTION The Land Use Element is the central component of a land use plan. This section serves as a mechanism to guide and manage future growth and development while protecting Bayfield County’s vital natural resources. The intent of the land use section is to guide development into the most suitable areas of the county, ensure the compatibility of future land uses, and to allocate growth in accordance with forecast population growth and community needs. In order to accomplish this task, existing land uses have been documented and analyzed. Existing land uses are compared to a wide range of environmental, economic, and social variables to develop an understanding of how existing land use patterns in Bayfield County influence local decision-making, affect the natural resource base, and impact the county’s economy. Land use directly impacts all other elements of this land use plan and vice versa. Transportation, coastal resources, public and community facilities, housing, and population are all related to, if not intimately linked to, land use. Knowledge of the existing land use conditions is correlated with predictions based on population and economic trends to define future land use needs. Bayfield County, for example, is gaining population, thus will require additional residential development. More people ultimately require additional community services, businesses, transportation, and industry. Finding suitable locations for development is key to the land use planning process. Future land uses will be allocated based on the ability of the land to support the proposed activity, costs to provide municipal services, and compatibility with existing and proposed future uses. The land use recommendations and future land use map will serve as a guide to assist county officials, citizens, and developers in managing growth. Recognizing that land use is impacted by a wide array of future variables, some of which can only be assumed or projected based on existing models, it is important that the plan be updated and revised periodically to adjust for changing needs, deviations from population projections, improved knowledge of natural environment, economic conditions, and community values and needs. This section of the land use plan will describe the existing land use conditions, trends, forecasts, and land use controls to create a community land use profile. It will describe community trends, needs, and desires and will create the foundation for the siting of new development. Finally, it will allocate land uses to the most suitable locations and recommendations will be made with regards to land use controls to ensure compatibility with the contents of this plan.

10-2
General Locational Considerations for Land Uses Locational considerations for land uses are used to determine the most suitable locations in which to allocate uses based on the environmental constraints, costs, safety, and compatibility with existing or other proposed future land uses. Residential Uses • Urban areas can support higher densities of households per acre. • Should be encouraged near existing residential developments, schools, and parks. • Traffic volume. • Infrastructure requirements are linked to development density. • What are the “rural character” requirements? • What is the availability of public services (government, fire, police)?
Commercial Uses • Market theory encourages similar facilities to locate together in corridors or nodes
(commercial clusters). • Usually succeed in high traffic or high visibility areas. • Normally require public water and sewer in urban areas. • Large, high impact facilities often conflict with residential uses.
Industrial Uses • Many such businesses desire access to major transportation routes. • Must normally be located on relatively flat land. • Public water and sewer are necessary. • High incidence of conflict with neighboring residential uses. Agricultural Uses • Suitable environmental factors required (i.e. soils, slope, water, wetlands). • Normally do not require public water and sewer. • Large, high impact facilities often conflict with residential uses. • Proximity to markets and processing facilities is a consideration. Parks and Open Space • Normally do not require public water and sewer. • Environmental factors must be considered. • Low incidence of conflict, although safety concerns exist. General Density Considerations for Land Uses General land use density rules relate to the number of structures, sites, or parcels of a given land use within an area. These general rules are designed to protect and promote environmental quality, minimize costs, and protect health and safety.

10-3
Residential Uses • What is the public perception of development density? What is considered to be too dense? • Sewered vs. unsewered development (more dense = should be sewered). • What density level will allow for preservation of rural character? (One home per 40-acre
concept) • Environmental and open space protection (conservation design subdivision). Commercial Uses • Higher commercial density is generally preferred (cluster commercial uses). Industrial Uses • Higher density is generally preferred (industrial park concept). • Need to address environmental concerns associated with density (concentrate impact). • Need to address the safety concerns associated with density. Agricultural Uses • Need to address the environmental concerns associated with density (concentrate impact). 10.2 BAYFIELD COUNTY LAND USE SURVEY As part of the land use planning process, residents and property owners in Bayfield County were given an opportunity to express their views and concerns regarding land use planning through a county land use survey. The Bayfield County Land Use Planning Steering Committee developed this comprehensive survey with technical assistance from the University of Wisconsin-Extension. In the spring of 2000, 14,175 copies of the survey were distributed with 4,362 returned for a response rate of 31 percent. Some Drummond and South Shore High School students were also given an opportunity to complete the survey. Survey Results – See Appendix A.4 10.3 EXISTING LAND USES WITHIN BAYFIELD COUNTY Land use within Bayfield County is closely linked to the natural resource base and land ownership. Bayfield County’s surface area is approximately 1,502 square miles (961,261 acres). Public lands account for 48.2 percent of the total land area and are comprised of county parks (campgrounds) and forests, national forest lands, and other public lands. Agricultural land uses in Bayfield County occupy approximately 84,222 (1997) acres or 8.7 percent of the total land area of Bayfield County.

10-4
Forested lands account for nearly 82 percent of the total land area of Bayfield County. Most of the county’s forested lands are in national, state-owned, county forest, or large tracts of industrial forest. Surface waters cover 23,676 acres in the county or 2.5 percent of the total area. Natural lakes and impoundments account for 22,685 acres with the balance in an extensive river and stream network. In addition to inland surface water resources, Bayfield County has 86.2 miles of coastal shoreline on Lake Superior. Surface water resources in Bayfield County greatly influence land use patterns. Some degree of shoreland development has occurred on most Bayfield County lakes that are not incorporated into public holdings or trust lands. Within the county, shoreland is being converted to seasonal and second home type residential development very rapidly; and the pool of undeveloped lake frontage in the county is steadily decreasing. Indeed, some of the highest housing unit densities in Bayfield County are in and around inland lakes and coastal areas. Recent trends have included development of the second and even third tiers of shoreland areas. Continued shoreland development at the current level threatens to consume the balance of the county’s developable shorelands within the next 20 years. 10.4 PUBLIC LAND Federal, state, and county government administers public land management policies. While land uses within public holdings are generally fixed according to management directives or local policy, public holdings greatly influence land uses in adjacent areas. Desire for access to the abundant natural resources and solitude provided by public lands have prompted trends in rural residential development, especially in areas with access to public holdings. The development of seasonal/second homes, hunting cabins, and permanent residences has increased significantly in Bayfield County as more people seek the beauty and solace of the “northwoods” environment. Publicly managed lands are depicted in Map 4.1 of Chapter 4. Federal Lands in Bayfield County Chequamegon National Forest (CNNF) Established by presidential proclamation in 1933, the Chequamegon National Forest includes 858,400 acres in six northern Wisconsin counties. Bayfield County’s portion of the CNNF is approximately 270,145 acres, which encompasses much of the central and southeastern portions of the county. National forest lands are managed by the United States Department of Agriculture – Forest Service (USDA-FS), which also develops and administers forest policy and planning. Porcupine Lake Wilderness Area – CNNF (4,292 Acres) Officially designated in 1984, the Porcupine Lake Wilderness Area encompasses 4,446 acres in central Bayfield County near Drummond.
10-5
Rainbow Lake Wilderness Area - CNNF One of the first wildernesses designated through the Eastern Wilderness Act of 1975, the Rainbow Lake Wilderness Area encompasses 6,583 acres of forestlands, unique natural features, abandoned railroad grades, and trails. The Forest Service directs management and policy. Moquah Barrens Wildlife Management Area (MBWMA) Part of the CNNF in northern Bayfield County, the MBWMA is unique ecological preserve which contains remnant pre-settlement pine barren communities. This 7,000-acre area is also managed for a wide range of wildlife and sensitive plant species. Moquah Research Natural Area (RNA) The Moquah RNA is one of the oldest RNA’s in the US. Established in 1935, this 640-acre tract of publicly owned lands serves as an educational and scientific resource and a genetic pool for rare and endangered resources. Moquah Wildlife Management Area (8,705 acres) Wildlife management area established in 1950 through a memorandum of understanding between the Forest Service and the former Wisconsin Conservation Department. Moquah Barrens State Natural Area (MBSNA) A natural preserve protected to study forest succession in the absence of fire. The MBSNA provides a unique habitat for many biological communities. The Forest Service directs management and policy. Whittlesey Creek National Wildlife Refuge The refuge located in the Town of Barksdale was established in October 1999. The purpose of the refuge is for the development, advancement, management, conservation, and protection of fish and wildlife resources. Apostle Islands National Lakeshore Part of a 6,028 acre national park lying at the northern tip of Bayfield County, the Apostle Islands National Lakeshore encompasses both mainland shoreline and the Apostle Islands (Bayfield, Ashland Counties) The National Park Service directs management and policy. State-Owned Lands in Bayfield County The State of Wisconsin owns and manages about 18,000 acres in Bayfield County. These lands are comprised of lands managed for fisheries, wildlife, natural and park areas, and wild rivers areas. Primary management and policy on state-owned lands are directed by the Wisconsin Department of Natural Resources. State owned lands within the county include:
• Bark Bay Slough Natural Area (225 acres) • Bibon Swamp Natural Area (200 acres) • Lost Creek Natural Area (200 acres) • Port Wing Boreal Forest Natural Area (188 acres) • Totogatic Wildlife Area (750 acres) • South Shore Fish and Wildlife Area • White River Fishery Area (1,200 acres)

10-6
County-Owned Lands in Bayfield County Bayfield County owns and manages approximately 168,000 acres of forestlands, county parks, and public areas. Primary management and policy on county-owned lands is directed by Bayfield County. 10.5 REAL ESTATE CLASSES (PROPERTY TAX CLASS) Real estate classes, which are used to determine land assessments and valuations, can be used to conduct a land use analysis. Trends are determined by the conversion from one type of assessment class to another over a period of time. The land use classes used for assessment purposes are: Residentiala, Commercialb, Manufacturingc, Agriculturald, Swamp and Wastee, and Forestf. Excluded from this inventory are lands, which are categorized as “other” or tax-exempt lands. Property tax classes, property values, and ownership in Bayfield County are depicted in Maps 10.1, 10.2, and 10.3. Residential • Total 2001 assessed residential acreage in Bayfield County was 35,118 acres (excluding cities
and village). This classification accounts for approximately nine percent of the total land area in Bayfield County.
• Total residential acreage in Bayfield County increased significantly between 1989 and 2001.
Assessed residential acreage in 1989 was 18,098 acres and 35,118 acres in 2001, a net increase of 94 percent.
• Several municipalities within Bayfield County experienced significant increases in acreage of
lands assessed as ‘residential’. The Town of Barnes gained 6,358 (406% increase) between 1989 and 2001. Other towns experiencing growth in residential assessment during this period include: Grand View- 1819 acres (595%), Town of Bayfield- 1586 acres (141%), Port Wing – 1342 acres (358 %), Bell - 1214 acres (231%), and Drummond –898 acres (188%).
a “Residential” includes any parcel or part of a parcel of untilled land that is not suitable for the production of row
crops, on which a dwelling or other form of human abode is located. b “Commercial” includes properties where the predominant use is the selling of merchandise or a service.
Apartment buildings of four or more units and office buildings c “Manufacturing” property consists of all property used for manufacturing, assembling, processing, fabricating,
making or milling tangible personal property for profit. It also includes establishments engaged in assembling component parts of manufactured products. All manufacturing property is assessed by the Wisconsin Department of Revenue.
d “Agricultural land” means land, exclusive of buildings and improvements that is devoted primarily to agricultural use, as defined by rule.
e “Swampland or wasteland” means bog, marsh, lowland brush, and uncultivated land zoned as shoreland under s. 59.692 and shown as a wetland on a final map under s. 23.32 or other nonproductive lands not otherwise classified.
f “Productive forest land” means land that is producing or is capable of producing commercial forest products.

10-7
• Only two municipalities experienced decreases in acreage of assessed residential lands. The Towns of Barksdale (-382 acres) and Kelly (-26 acres) were the only towns that lost assessed residential acreage between 1989 and 2001.
Commercial • Total 2001 assessed commercial acreage in Bayfield County was 2,744 acres (excluding cities
and village); this figure represents less than 1 percent of the total county acreage. • The acreage of lands assessed for commercial uses varies widely among municipalities in
Bayfield County. Most towns experienced a significant increase in the acreage of lands being assessed as commercial during the period 1989-2001 although some (Kelly, Orienta, Tripp) actually lost commercial acreage.
• Communities with the most commercial lands include: Town of Cable (501 acres), Town of
Bayfield (409 acres), Town of Barnes (406 acres), Town of Hughes (279 acres), and the Town of Namakagon (267 acres).
• Of the 477 businesses in Bayfield County, 114 (24%) of them are in the services sector. These
businesses include lodging establishments, recreation facilities, and health care services. The significant presence of the services sector indicates the influence of the tourism industry to the economy Bayfield County.
Industrial/Manufacturing • Total 2001 assessed manufacturing acreage in Bayfield County was 135 acres (excluding
cities and village), representing significantly less than 1 percent of the total county acreage. • Most towns in Bayfield County have no lands currently assessed for manufacturing
purposes. • Towns with manufacturing lands include: Iron River (67 acres), Drummond (39 acres),
Hughes (20 acres), and Barksdale (9 acres). Agricultural • Bayfield County has approximately 380 farms, with an average farm size of 247 acres1. The
predominant form of agriculture in the county is dairy farming, with 60 milking herds. The size of dairy operations in the county tend to be larger than average farms, as much of the land is devoted to growing forages, corn, and small grains, which are used as feed supplies.
• Total 2001 assessed agricultural acreage in Bayfield County was 75,667 (excluding cities and village) acres or nearly 20 percent of the total county acreage.
1 Wisconsin Agricultural Statistics, 2000.
10-8
• The bulk of the county’s agricultural lands are found in the towns less forested areas nearest to Lake Superior. Towns with the most agricultural lands include: Kelly (9,421 acres), Oulu (9,008 acres), Eileen (8,647 acres), and Mason (8,615 acres). These lands are also some of the most suitable lands for agricultural use in Bayfield County2.
• Towns that experienced the most significant losses of agricultural lands between 1989-2001
include: Eileen (-3,113 acres), Kelly (-2,482 acres), Tripp (-2,241 acres), and Pilsen (-2,055 acres).
• Loss of agricultural land. A prominent trend revealed by the assessment data from 1989 to 2001 is the continual loss of land in the agricultural tax classification. A total of 16,324 acres—an average of 1,360 acres per year—was converted from agriculture to other uses. The Town of Oulu, which previously had the greatest portion of agricultural land in farms, currently has very few family farming operations, although remaining operations tend to be larger in size. The Town’s of Orienta, Port Wing, and parts of Clover also once had many farms, although relatively few remain today due to land selling for recreational and hunting purposes.
• Agriculture Preservation Areas. The map in Appendix A.5 depicts Bayfield County’s Agricultural Preservation Areas as defined by the Bayfield County Farmland Preservation Plan as adopted in 1981. The largest blocks of contiguous agricultural preservation areas are found in the Towns of Eileen, Kelly, Oulu, Lincoln, Mason, Keystone, Pilsen, and Barksdale, with many scattered and isolated pockets distributed throughout the county. Areas identified in the Agricultural Preservation Plan contain the bulk of existing agricultural activity in Bayfield County. It should be noted that these designations were made without the benefit of comprehensive soil reconnaissance data.
Forest
• Total 2001 assessed forest acreage in Bayfield County was 251,508 acres (excluding cities and village), accounting for nearly 66 percent of the total county land area.
• The total assessed forest acreage in the county remained relatively stable (1% increase)
throughout the period 1989-2001, although significant changes occurred locally.
• Bayfield County towns experiencing the greatest decline in forest acreage between 1989 and 2001 include: Namakagon (-31%), Bell (-20%), Mason (-19%), and Bayfield (-18%).
• Bayfield County towns experiencing the greatest increase in forest acreage between 1989
and 2001 include: Pilsen (+59%), Eileen (+44%), Barksdale (+37%), and Orienta (+28%).
2 Bayfield County Farmland Preservation Plan, 1982.
10-9
10.6 SUMMARY Changes in assessed acreage may be a result of actual changes in land use or changes in the definition of use or both. Over the period 1989-2001, significant changes in the acreage by land use type occurred in Bayfield County. The most notable changes have occurred in residential and agricultural uses, although local changes in forest use are also notable. Conversion of agricultural lands to recreational/residential parcels can be inferred, to some extent, by the respective acreage changes to each of these categories. This localized trend mirrors continuing regional and statewide trends towards farmland/forestland to residential conversion. Lands assessed as being commercial have increased significantly by percentage, although these lands represent less than 1 percent of total county lands. Other land use classifications appear to have remained relatively stable over the past 12 years, including manufacturing and forestlands.

10-10
Map 10.1- Property Tax Class

10-11
Map 10.2- Property Value

10-12
Map 10.3- Property Ownership

10-13
Table 10.1: 2001 Real Estate Class Acreage
Municipality Year Total
Assessed Acres*
Residential Acres
Commercial Acres
Manufacturing Acres
Agricultural Acres
Swamp Acres
Forest Acres
Barksdale 2001 13,307 850 137 9 3,133 102 9,076
Barnes 2001 19,783 7,923 406 0 198 172 11,084
Bayfield 2001 14,124 2,707 409 0 2,795 127 8,086
Bayview 2001 8,746 861 36 0 1,338 53 6,458
Bell 2001 7,496 1,739 30 0 543 166 5,018
Cable 2001 30,221 2,158 501 0 1,380 2,050 24,132
Clover 2001 13,405 1,522 38 0 1,383 300 10,162
Delta 2001 18,582 916 23 0 1,462 1,720 14,461
Drummond 2001 11,230 1,376 35 39 1,286 67 8,427
Eileen 2001 20,235 825 91 0 8,647 589 10,083
Grand View 2001 18,616 2,125 50 0 241 1,450 14,750
Hughes 2001 8,909 1,451 279 20 282 283 6,594
Iron River 2001 12,391 2,130 216 67 29 1,200 8,749
Kelly 2001 20,368 428 4 0 9,421 544 9,971
Keystone 2001 13,802 678 119 0 6,673 753 5,579
Lincoln 2001 17,170 763 8 0 2,810 2,875 10,714
Mason 2001 18,078 355 8 0 8,615 1,004 8,096
Namakagon 2001 9,702 1,264 267 0 0 934 7,237
Orienta 2001 26,164 489 0 0 3,931 159 21,585
Oulu 2001 21,814 532 2 0 9,008 667 11,60
Pilsen 2001 6,892 326 5 0 3,026 317 3,218
Port Wing 2001 16,043 1,717 45 0 4,289 583 9,409
Russell 2001 11,234 455 27 0 1,034 210 9,508
Tripp 2001 11,358 360 2 0 2,389 114 8,493
Washburn 2001 11,928 1,050 6 0 1,754 105 9,013 TOTAL TOWNS 381,598 35,000 2,744 135 75,667 16,544 251,508
V Mason 2001 328 118 10 2 174 0 24
C Bayfield 2001 N/A N/A N/A N/A N/A N/A N/A
C Washburn 2001 N/A N/A N/A N/A N/A N/A N/A Source: Wisconsin Department of Revenue *Value reflects 2001 real property subject to taxation as defined by the Wisconsin Department of Revenue. Figure does not include non-taxable lands or lands in assessment class labeled “other”.

Table 10.2: Bayfield County Municipalities Real Estate Class, Percent Change in Assessed Acreage by Class 1989-2001
Municipality Residential
Percent Change 1989 –2001
Residential Percent Change
1998-2001
Commercial Percent Change
1989 -2001
Commercial Percent Change
1998-2001
Agricultural Percent Change
1989 -2001
Agricultural Percent Change
1998-2001
Forest Percent Change
1989 -2001
Forest Percent Change
1998-2001
Barksdale -31.01 -2.19 +136.21 -20.81 -40.46 -2.12 36.89 +4.37
Barnes +406.26 +221.03 +1350.00 +383.33 13.79 +150.63 -13.13 -10.48
Bayfield +141.48 +23.89 +25.08 +0.99 -17.53 +0.98 -18.86 -9.75
Bayview +27.56 +5.39 +12.50 +5.88 -19.78 -1.83 -3.87 +1.17
Bell +231.24 -7.25 +20.00 0.00 -5.89 +5.23 -19.87 +3.72
Cable +63.86 +17.09 +13.35 -0.60 -18.82 -3.70 -1.11 +3.86
Clover +16.01 -21.18 +52.00 -75.16 -37.48 -18.36 +9.07 +13.04
Delta +55.52 +3.15 0.00 0.00 -7.12 0.00 +4.64 +1.25
Drummond +187.87 +33.08 +1650.00 +150.00 -20.81 -1.00 -1.01 +1.06
Eileen +37.73 +7.00 +78.43 +44.44 -26.47 -0.94 +44.43 -1.92
Grand View +594.44 +3.56 +28.21 -5.66 -43.16 -10.74 +1.20 +0.07
Hughes +16.73 +2.18 +200.00 +128.69 -41.00 -30.54 -8.02 N/a
Iron River +4.05 +2.85 +11.34 +5.37 -91.69 -90.46 +0.19 -0.84
Kelly -5.73 0.00 -71.43 +300.00 -20.85 +0.34 +26.09 +1.05
Keystone +260.64 -20.05 +466.67 0.00 -11.43 -2.58 -9.48 +1.83
Lincoln +19.41 +9.47 +100.00 +166.67 -25.21 -21.07 -4.44 -4.02
Mason +66.67 +6.93 0.00 -11.11 +18.76 +0.94 -17.63 -7.39
Namakagon +29.51 -7.80 +47.51 -14.97 N/a N/a -30.50 -13.11
Orienta +83.15 +31.45 -100.00 -100.00 -19.73 -1.18 +28.07 -0.60
Oulu +28.50 +5.35 -66.67 0.00 -2.55 +4.81 +2.31 -3.92
Pilsen +222.77 -5.51 +25.00 0.00 -40.44 -39.04 +59.15 +114.53
Port Wing +357.87 +6.71 +15.38 -13.46 +19.44 +24.32 -15.49 -11.78
Russell +46.30 +13.18 +35.00 +3.85 -12.30 +67.86 -3.77 -6.82
Tripp +18.42 -0.83 -71.43 -50.00 -48.40 -17.99 +30.14 +7.38
10-14
Washburn +23.97 +5.85 +20.00 0.00 -7.88 -1.29 -7.99 -0.17

Bayfield County Municipalities – Land Use Class by Municipality (9 pages) Pages 15-23

10-24
10.7 LAND USE DESIGNATIONS (EXISTING) Core Communities Cities, villages, unincorporated hamlets, and reservations. Core communities are mixed use areas with a generally higher development density than the surrounding rural lands and include the Cities of Bayfield and Washburn; Village of Mason; and unincorporated places of Barnes, Benoit, Cable, Cornucopia, Drummond, Grand View, Herbster, Ino, Iron River, Moquah, Namakagon, Port Superior, and Port Wing; and Red Cliff Reservation. Residential - 5Acres and Less Parcels of land five aces and less containing structures used for human habitation. Land uses within this designation consist of single-family dwellings at a higher development density standard than rural residential (one unit per 40 acres). This land use designation includes moderate, high-density lake development, subdivisions, and planned unit developments. Residential – Greater than five acres Parcels of land greater than five acres containing structures used for human habitation. Land uses within this designation include single-family residential development at a lower development density standard than would be expected with first tier lakeshore development or formal subdivisions. Designation includes rural residential development on parcels of land larger than five acres up to the rural density threshold of one unit per 40 acres. Areas within Bayfield County assigned this designation include limited lakeshore areas, second tier lakeshore development, and pockets of scattered rural residential development throughout the county. Commercial Structures and associated grounds used for the sale of products and services, retail and wholesale operations. While a substantial proportion of commercial businesses are included within the mixed-use areas of the core communities, several areas of commercial use exist beyond these boundaries. These may include generalized commercial clusters associated with resort/recreation areas and highway commercial areas. Industrial Structures and their associated grounds used for fabrication, manufacturing, and assembling parts or for processing raw materials such as, timber, and animal products. Industrial land use areas are found primarily within the mixed-use core communities, although some scattered pockets exist within the county’s rural areas. Agricultural Privately owned lands supporting agricultural activities such as livestock grazing, dairy farming, cropland uses, orchards, cranberry bogs, and Christmas tree growing and harvesting. Lands within this designation are concentrated in the east-central and northwest portions of the county. Federal Lands Federal lands that have been legally designated as national forests or purchase units and other lands under the administration of the Forest Service, including experimental areas. Within

10-25
Bayfield County, federal forestland is comprised of the Chequamegon National Forest. Management and policy on federal forestlands is the responsibility of the USDA-Forest Service. County Forest Lands enrolled in County Forest Law Program. State-Owned Lands Fish and wildlife areas, natural areas, public hunting and fishing grounds, or other special use or management areas owned by the State of Wisconsin. Management and policy on state owned lands is the responsibility of the Wisconsin Department of Natural Resources Industrial Forest Lands owned by private forest products industry. These forests are used primarily for the growing, harvesting and processing wood and wood fiber, pulp, paper and paperboard products. Private Forest Privately owned forest lands, includes: lands enrolled in Forest Crop Law, Managed Forest Law, or privately owned forest land that is producing, forest products. Tribal Lands Trust lands within the Red Cliff Band of Lake Superior Chippewa Indian Reservation.
Table 10.3: Land Use Percentages
Land Use Category Percent of County
Residential (<5 Acres) 1.3%
Residential (>5 Acres) 1.3%
Commercial 0.3%
Industrial <0.1%
Agricultural 8.7%
Federal Lands* 29.1%
State Lands 2.1%
County Lands 17.6%
Private Forest 38.8%
Water Features 2.3%
Unclassified 0.9%
TOTAL 100.0% *Includes U.S. Lands in trust (Red Cliff Reservation)

10-26
10.8 EXISTING LAND USE CONDITIONS Agricultural Agricultural uses account for approximately six percent of the total county land use. Towns with the highest percentage of agricultural lands include: Town of Kelly (38%), Town of Mason (36%), Town of Eileen (32%), and the Town of Oulu (24%). Agricultural use is primarily confined to the east-central and northwestern portions of the county. Portions of the Bayfield Peninsula are suitable for growing irrigated fruit crops such as apples. Farms producing fruit crops are currently found in the Towns of Russell and Bayfield. Residential Residential land uses within Bayfield County constitute less than 3 percent of the total county land use within the county. Present conditions can be summarized by placing the various forms of residential development into three general categories: rural residential, recreational residential, and core community residential. Rural Residential – This form of residential development is generally characterized by scattered, low-density, large lot residential housing development. The rural predominantly wooded character of Bayfield County is an attractive setting for homes, and many new housing units are being constructed in the rural areas. Proximity to job centers and access to transportation routes have made this development option increasingly popular. Employment options which allow individuals to work out of their homes also contributes to the increase in rural residential housing, as more people exit the urban environment seeking the quiet rural setting of the countryside. Lakeshore areas and back lot areas adjacent to lakeshore areas are experiencing continued development, contributing to the total residential increase. Another form of residential development is the “linear development” along town, county, and some state highway routes. Portions of the county which are experiencing this linear development most prominently include:
Recreational residential – This form of residential development within Bayfield County is generally characterized on and off lakeshore and seasonal homes. Off lakeshore recreational housing development has increased in recent years, in part due to high cost and availability of lakeshore property. Conversion of seasonal homes to year-round dwellings has also become increasingly popular.
Core Community Residential – The bulk of residential housing units in Bayfield County are found within the core communities of Bayfield and Washburn; Village of Mason; and unincorporated places of Barnes, Benoit, Cable, Cornucopia, Drummond, Grand View, Herbster, Ino, Iron River, Moquah, Namakagon, Port Superior, and Port Wing; and Red Cliff Reservation. Residential development patterns within these communities are characteristic of small, rural communities of the upper Midwest.

10-27
Commercial Most commercial development within Bayfield County is located within or in close proximity to the incorporated areas or in small commercial development nodes along transportation corridors. These nodes can be defined as unincorporated sites that have developed over time as minor commercial or service centers for their immediate region. Other commercial development clusters have formed over time in close proximity to the lake and rural areas. These clusters consist of resorts, restaurants, taverns, gas stations, shops, or other service businesses. Examples of this secondary node type commercial development are found in the Eau Claire Chain of Lakes area, Lake Namekagon, and the Pike Lake Chain. Industrial Industrial development within the county is primarily confined to the core communities, and less than 0.1 percent of the total county land use is classified as industrial. Industrial development outside of the core communities is found in the Town of Iron River.

10-28
Map 10.4 - Bayfield County Generalized Existing Land Use

10-29
10.9 LOCAL LAND USE PLANNING Several local units of government in Bayfield County have developed land use plans. These documents include background information, goals and objectives, local land use surveys, and future (proposed) land use maps. To date, the following communities in Bayfield County have developed or are in the process of developing land use plans: • City of Bayfield Comprehensive
Plan (2001)
• City of Washburn (1992)
• Town of Barksdale (2000)
• Town of Bayfield (1995)
• Town of Bayview (2001)
• Town of Cable (anticipated 2002)
• Town of Clover (anticipated 2002)
• Town of Delta (in progress)
• Town of Drummond (2001)
• Town of Eileen (2000)
• Town of Grand View (2002)
• Town of Hughes (in progress)
• Town of Iron River (1985)
• Town of Kelly (2001)
• Town of Keystone (2000)
• Town of Lincoln (in progress)
• Town of Mason (in progress)
• Town of Namakagon (2002)
• Town of Orienta (in progress)
• Town of Pilsen (in progress)
• Town of Russell (2001)
• Town of Washburn (2001)
Maps depicting the existing and proposed future land use in these communities are included in this section of the land use plan. Information gathered from these local plans was used to derive the generalized county future land use map and to develop plan recommendations. Generally, the land use classification schemes used in the local planning process are more specialized than the generalized classification system used at the county level. Thus, some land uses depicted in the local plans are not portrayed in the county land use plan (ex. institutional or municipal land use). The intent of the county document as it relates to local planning is to broadly categorize land uses while attempting to remain as consistent with the local plans as possible. Land use decisions affecting communities with approved land use plans should be based on the goals, objectives, recommendations, and the proposed future land use maps of the local plans. Where discrepancies occur between town land use maps and the county land use map, town land use maps are more detailed and should prevail. Goals and objectives of the local plans are included as part of the “Recommendations and Implementation” section of the county land use plan.

10-30
10-30
Town of Barksdale – Existing Land Use

10-31
10-31
Town of Bayfield – Existing Land Use

10-32
10-32
Town of Bayfield – Existing Land Use

10-33
10-33
Town of Cable – Existing Land Use

10-34
10-34
Town of Drummond – Existing Land Use

10-35
10-35
Town of Grand View – Existing Land Use

10-36
10-36
Town of Kelly – Existing Land Use

10-37
10-37
Town of Keystone – Existing Land Use

10-38
10-38
Town of Namakagon – Existing Land Use

10-39
10-39
Town of Pilsen – Existing Land Use

10-40
10-40
Town of Russell – Existing Land Use

10-41
10-41
Town of Washburn - Existing Land Use

10-42
10.10 LAND USE DESIGNATIONS (FUTURE) Core Communities∗ Residential Parcels of land five aces and less containing structures used for human habitation. Planned Unit Development –PUD’s, subdivisions, condominiums A planned combination of diverse land uses, such as housing, recreation, and shopping in one contained development or subdivision. Commercial*
Industrial* Agricultural* Federal Lands* County Forest* State Owned Lands* Private Forest/ Open Space* Developmentally Sensitive Areas / No Development Areas (Overlay) Areas that have excessive slopes or have unique soil or flooding characteristics which limit the ability of an area to support development, or contain significant wooded areas, wetlands, creeks, wildlife habitat or other natural features that are important to a site's stability and visual character. Tribal Lands* 10.11 PROPOSED FUTURE LAND USE MAP A Proposed Future Land Use Map has been prepared for the plan and is illustrated in Map 10.5. This map is intended to reflect how the intentions of the plan’s goal and objective statements can emerge as a tangible reality on the landscape. The Map identifies several land use category regions within the county and a list of recommendations for each of these regions follows in chapter 11 (Recommendations).
∗ Same definition used for Existing Land Use Designation.

10-43
Map 10.5 Proposed Future Land Use

Individual Town Plans – Future Land Use Maps
10-44
Town of Barksdale – Proposed Land Use

10-45
Town of Bayfield – Land Use Plan Map

10-46
Town of Bayview – Proposed Land Use
10-47
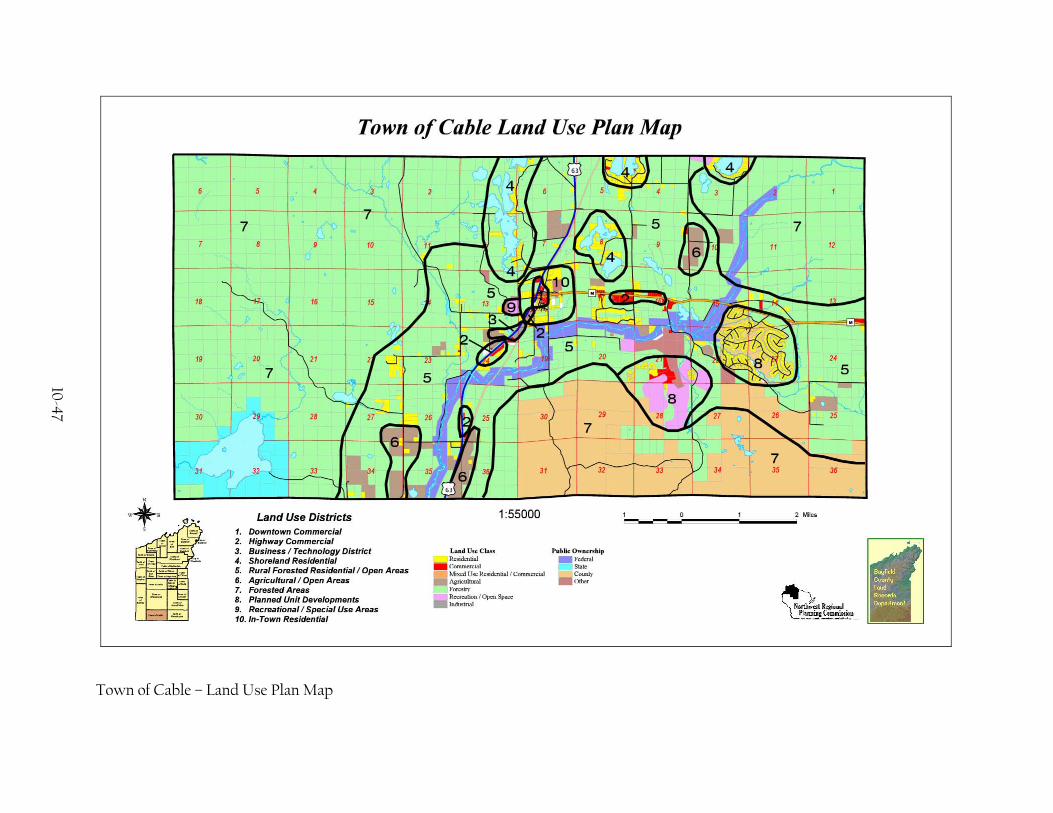
Town of Cable – Land Use Plan Map

10-48
Town of Drummond – Land Use Plan Map

10-49
Town of Eileen – Land Development Guide Map

10-50
Town of Grandview – Proposed Land Use

10-51
Town of Kelly – Proposed Land Use

10-52
Town of Keystone – Land Use Plan Map

10-53
Town of Namakagon – Land Use Plan Map

10-54
Town of Pilsen – Proposed Land Use
10-55
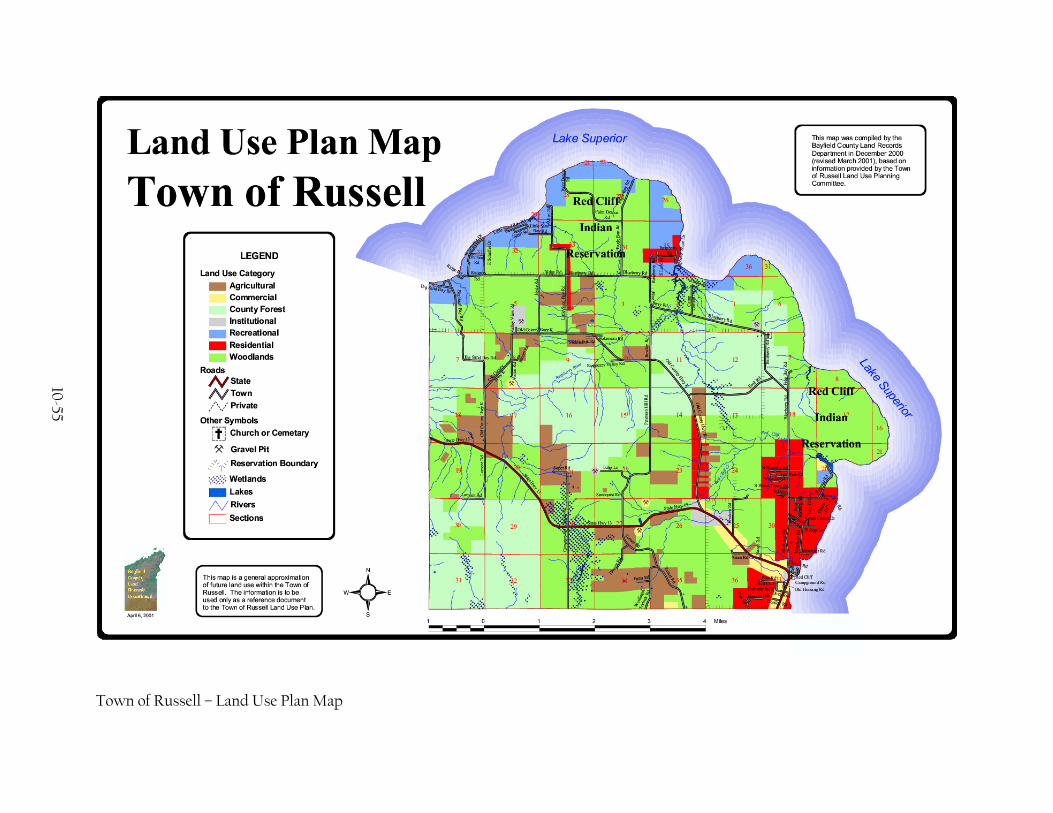
Town of Russell – Land Use Plan Map

10-56
Town of Washburn – Proposed Land Use


