
10-years of CO2, O2 and APO records at two remote sites of Jungfraujoch, Switzerland and Puy de...
22
10-years of CO 2 , O 2 and APO records at two remote sites of Jungfraujoch, Switzerland and Puy de Dôme, France T. Berhanu, M. Schibig, C. Uglietti, M. Leuenberger, A. Colomb ICOS Science Conference, Helsinki 28-Sep-2016
-
Upload
integrated-carbon-observation-system-icos -
Category
Science
-
view
22 -
download
2
Transcript of 10-years of CO2, O2 and APO records at two remote sites of Jungfraujoch, Switzerland and Puy de...

10-years of CO2, O2 and APO records at two remote sites of Jungfraujoch, Switzerland and Puy de Dôme, France
T. Berhanu, M. Schibig, C. Uglietti, M. Leuenberger, A. Colomb
ICOS Science Conference, Helsinki
28-Sep-2016

26%
33.0±1.8 GtCO2/yr ( 91%)
3.4±1.8 GtCO2/yr ( 9%) Source: Global Carbon Project, 2015
44%
30%
Global Carbon budget overview

26%
33.0±1.8 GtCO2/yr ( 91%)
3.4±1.8 GtCO2/yr ( 9%) Source: Global Carbon Project, 2015
44%
30%
Global Carbon budget overview

CO2 – O2 relation in the carbon cycle
Ocean-Atmosphere
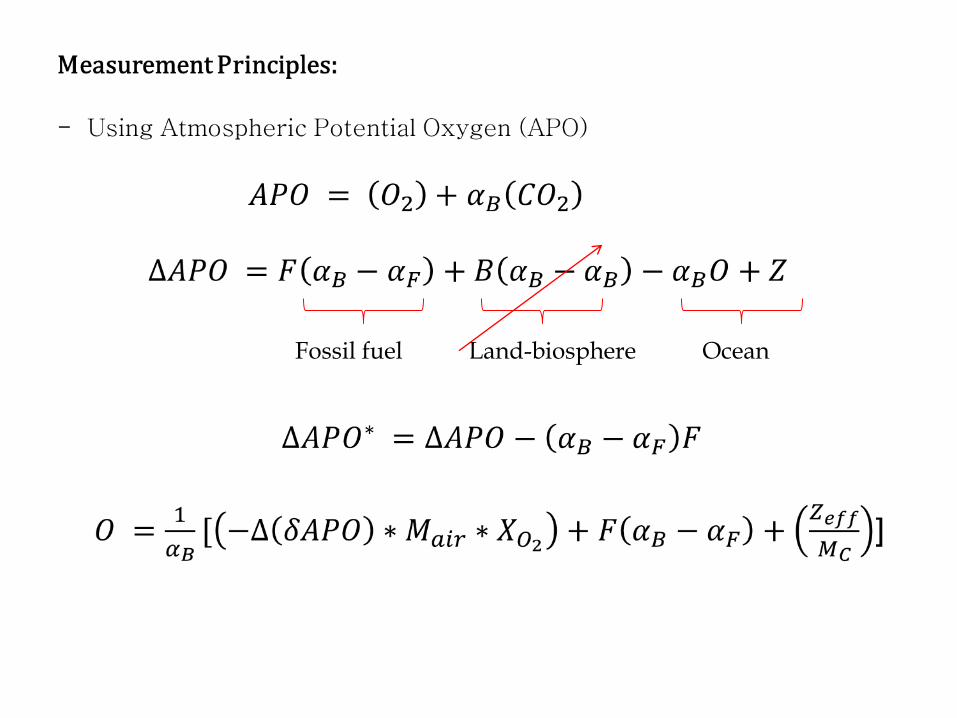
Fossil fuel Land-biosphere Ocean

Keeling and Manning 2006

- 1465 m a.s.l
- Westerly air-
masses
- One
flask/week
(time varies
mostly 11:00-
15:00)
- 3580 m a.s.l- North-westerly
air masses- Duplicate
flasks/ week (06:30-07:30)
Site description and sampling protocol
Puy de Dôme Jungfraujoch

Observed CO2, δ(O2/N2) and calculated APO after filtering (JFJ)
8
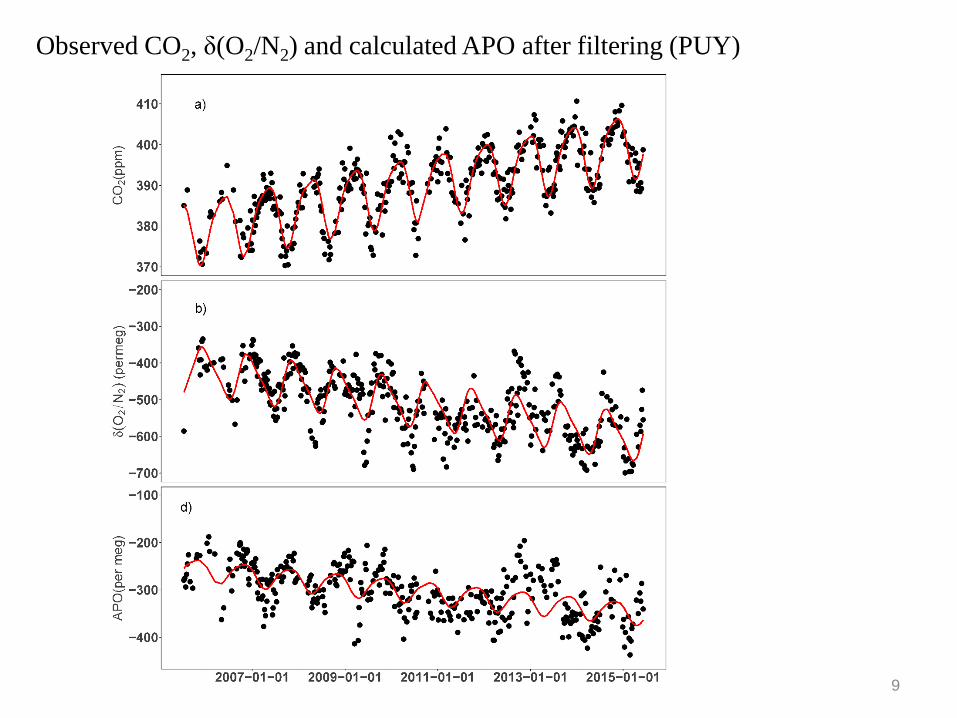
Observed CO2, δ(O2/N2) and calculated APO after filtering (PUY)
9

Seasonalities of CO2, δ(O2/N2) and APO at PUY and JFJ
10
PUYJFJ
Trend Seasonality
JFJ PUY JFJ PUY
CO2 1.99± 0.15
(2.07± 0.06)*
1.99± 0.27 8.88± 0.49
(10.68± 0.11) *
15.52± 0.23
δ(O2/N2) -19.80± 1.76
(-23.6± 0.6) *
-18.6± 2.92 67.37± 4.3
(85.2± 3.04) *
129.79± 7.0
APO -10.04± 0.50
(-9.5± 1.7) ¥
-10.20± 0.88 44.29± 5.44
(44.0± 5.0) ¥
61.99± 5.81
11
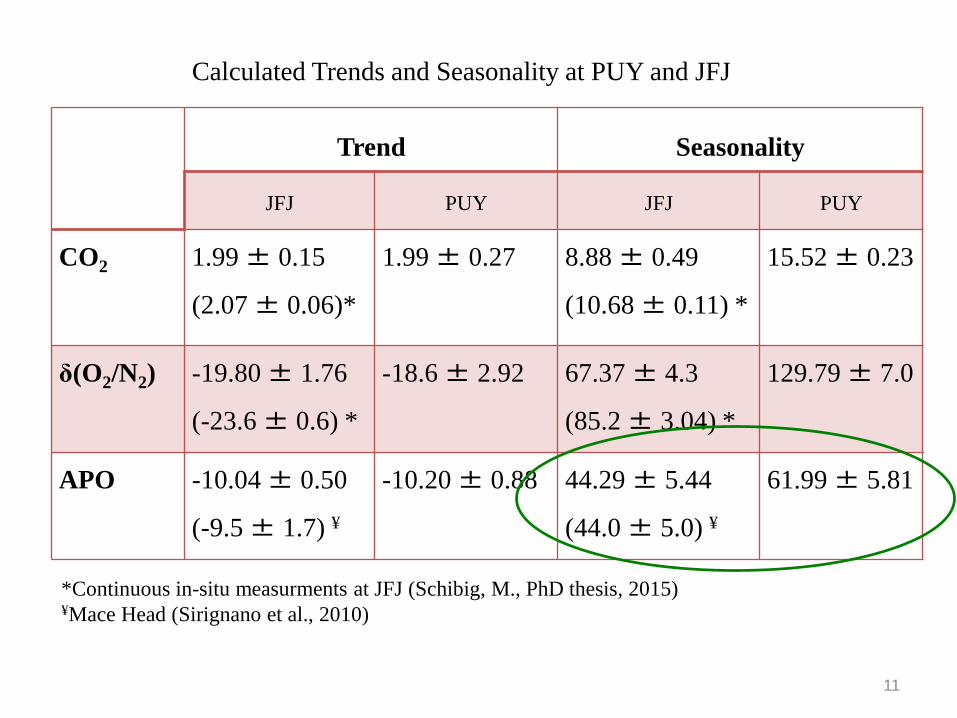
Calculated Trends and Seasonality at PUY and JFJ
*Continuous in-situ measurments at JFJ (Schibig, M., PhD thesis, 2015)¥Mace Head (Sirignano et al., 2010)

Trend Seasonality
JFJ PUY JFJ PUY
CO2 1.99± 0.15 1.99± 0.27 8.88± 0.49 15.52± 0.23
δ(O2/N2) -19.80± 1.76 -18.6± 2.92 67.37± 4.3 129.79± 7.0
APO -10.04± 0.50 -10.20± 0.88 44.29± 5.44 61.99± 5.81
Calculated Trends and Seasonality at PUY and JFJ
12

13
PUYJFJ
Seasonality in APO at PUY and JFJ

14
Seasonality in APO at PUY, JFJ and MH
- Fossil fuel combustion
- Difference in footprint
- Atmospheric condition
PUYJFJMH
(Sirignano et al., 2010)

APO and fossil fuel effect
(Steinbach et al., 2011)
15

(Uglietti et al., 2011)
Foot print of air masses at JFJ during 2005-2009
16

(Lopez et al., 2015)
Foot print of air masses at PUY during 2010-2012
17

Seasonal dependent diurnal variation in PBL at PUY
(Venzac et al., 2009)18
summer
winter

-400
-360
-320
-280
-240
375 380 385 390 395 400 405 410 415 420 425
only fossil fuel emissions
ocean uptakeland
uptake
July 2005
July 2015 ocean outgassing
CO2 (ppm)
AP
O (
per
meg
)
atmospheric increase
19
Partitioning of atmospheric CO2 based on APO data at JFJ
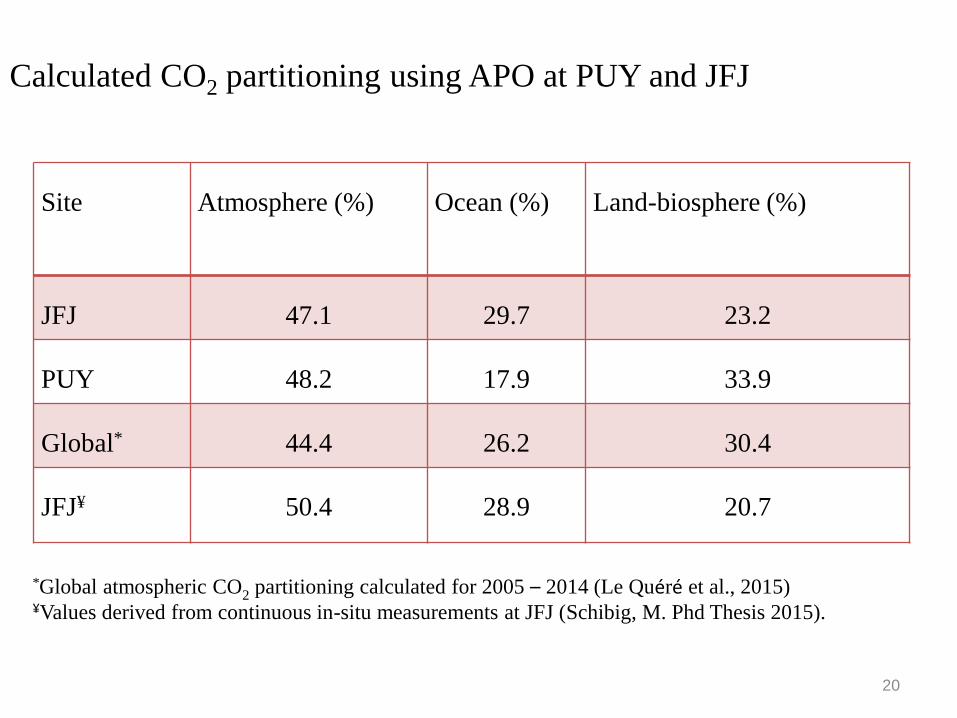
Site Atmosphere (%) Ocean (%) Land-biosphere (%)
JFJ 47.1 29.7 23.2
PUY 48.2 17.9 33.9
Global* 44.4 26.2 30.4
JFJ¥ 50.4 28.9 20.7
Calculated CO2 partitioning using APO at PUY and JFJ
*Global atmospheric CO2 partitioning calculated for 2005 – 2014 (Le Quéré et al., 2015)¥Values derived from continuous in-situ measurements at JFJ (Schibig, M. Phd Thesis 2015).
20

Summary
- Observed significant differences in APO
seasonalities between the two sites are associated
with fossil fuel influence and differences in air-
masses at each site.
- Better comparison can be obtained between the
two sites if samplings at PUY can be made only
during hours of the day when the site is clearly
above the PBL (before 09:00 UTC).
- CO2 partitioning among resrviors using APO
should consider possible anthropogenic influences
.
21

THANK YOU
22


