10 RJLG ES&H Issues Air Sampling and AnalysisAdvances in Electron Microscopy: High-Resolution...
34
ES&H Challenges: Air Sampling and Analysis Gary Casuccio ES&H Challenges of the Nanotechnology Revolution Lawrence Berkeley National Laboratory July 29, 2009
Transcript of 10 RJLG ES&H Issues Air Sampling and AnalysisAdvances in Electron Microscopy: High-Resolution...

ES&H Challenges: Air Sampling and Analysis
Gary CasuccioES&H Challenges of the Nanotechnology Revolution
Lawrence Berkeley National Laboratory
July 29, 2009

Sampling andAnalysis Strategies

The Promise of Nanotechnology
Novel properties/ phenomena/ processes Richard Feynman (1959)
“There’s Plenty of Room at the Bottom”
Could revolutionize science, technology, medicineand space exploration
A new world of products: Next economic engine?
>$2.5 trillion within next decade ~ 2 million nanotech workers

Issues Related to Engineered Nanoparticles Uncertainties
Short/Long Term Health Effects
Societal Concerns Environmental releases Disposal Intended use
Analytical Issues Sampling methodology Analysis protocols Standards

DOE Definition of Engineered Nanoparticle
engineered nanoparticle, a particle intentionally created (in contrastwith natural or incidentally formed) with one or more dimensionsgreater than 1 nanometer and less than 100 nanometers
unbound engineered nanoparticle (UNP), engineered nanoparticlesthat are not contained within a matrix that would be expected toprevent the nanoparticles from being separately mobile and apotential source of exposure
nanostructure (Draft – RJLG), a microscopicagglomerate, aggregate or matrix whichcontains individual particles that are lessthan 100 nm in one or more dimensions
5 nm TiO2 particles
U.S. DOE N456.1: The Safe Handling of Unbound Engineered Nanoparticles,January 5, 2009
500 nm
LaceyGrid

A Matter of Scale

Nanoparticles are not new…
Nanoparticles are all around us ~106 nanoparticles per breath
Natural and anthropogenic origins Naturally occurring
Asbestos, volcanic ash, forest fire smoke,biological structures
Combustion (incidental) particles Soot, metal oxides, welding fumes, diesel
emissions Historical engineered nanoparticles
Pigments, carbon black
Wood smoke
Diesel Emissions
Carbon Black

Sampling for Nanoparticles in the WorkplaceEnvironment
Follow recommendations in Guidance Documents DOE Approach Document1
NIOSH Approaches to Safe Nanotechnology Process specific evaluation
Characterize the “source” and establish a source signature Compare signature to particles collected on worker
exposure or environmental samples
1Department of Energy Nanoscale Science Research Centers: Approach toNanomaterial Environmental Safety & Health, Office of Science, U.S. Departmentof Energy, NSRC Revision 3a, May, 2008.

Sampling for Nanoparticles in the WorkplaceEnvironment
Learn from previous experiences “If we don’t pay attention to the past, we are likely to
make the same mistakes in the future.” The asbestos experience Single crystal ceramic whiskers
Base initial nanoparticle sampling and analysisprotocols on established methodologies Modify as new information becomes available Realize that this is an evolutionary process

How do we evaluate nanoparticles?
In an ideal world, we would have field deployable tools that would acquire
data on individual nanoparticles (size, morphology,composition and concentration) in real time
In the real world, use tools available today and develop methodologies that
can be modified as new tools become available Real time particle counters Microscopy Bulk analytical methods (gravimetry, ICP, etc.) Surface area

What are the measurement issues? Sampling and analysis protocols are developing Nanoparticle measurement is evolving
Direct-read instruments Size selective sampling Filter-based methods
New analytical technology is available Can these new sampling and analysis
technologies be used in a cost effective manner?

Sampling andAnalysis Strategies

Graded Approach to Aerosol Characterization
A necessary andsufficient subset of Level1 and 2 methods for thematerial and situation ofinterest
Elemental composition Chemical composition Particle size
- Physical- Aerodynamic- Thermodynamic- Electrical mobility
Morphology Surface area Biological solubility Etc.
Process knowledge Gross mass or activity
counting Optical particle counting Condensation particle
counting Microscopy
Routine Monitoringand Control
ComprehensiveCharacterization and
Assessment
InitialScreening
and Detection
Level 3Level 2Level 1
Hoover 2009 (draft)

Nanoparticle Sampling at ORNL

Nanoparticle Sampling at ORNL

RJLG’s phased approach to microscopysample analysis
Level I: Screening analysis provides basicinformation on sample characteristics
Level II: More detailed analysis on size,morphology and chemical characteristics
Level III: In-depth research analysis

RJLG’s Level I Microscopy Screening:
Basic information regarding samplecharacteristics
Evaluate particle loading and general samplecharacteristics, including images and spectra ofrepresentative particles
Determination of which subset of samples will proceedto the Level II analysis

RJLG’s Level II Microscopy Analysis:
Describe obvious morphological characteristics ofthe nanoparticle/nanostructure (spherical,elongated, aciniform, surface characteristics)
Predominant size range of nanoparticles(agglomerates or individual particles)
Elemental analysis to provide composition ofrepresentative particles
Estimate of nanoparticle/nanostructureconcentration for worker exposure samples (#/cc)

RJLG’s Level III Microscopy Analysis: R&D
Larger population of particles analyzed
Size distribution of the particles
Determine if particles have homogenous orheterogeneous compositions
Bright Field/Z-Contrast imaging Spectral imaging
Evaluate surface coatings Surface analysis techniques

400kx Magnification
HR-FE-TEM Images ofCarbon Black

HRTEM

Advances in Electron Microscopy:High-Resolution FESEM/STEM
30 kV cold field emission
Magnifications up to2,000,000X
Secondary electron imaging
Bright field and Z-contrastimaging
Energy dispersive X-rayspectroscopy (EDS)
Switch between all operationmodes without changing thespecimen position (includingEDS)
Change accelerating voltageseasily
Silicon Drift Detector forElemental Analysis

X-ray MapBulk/Source Sample
Draft
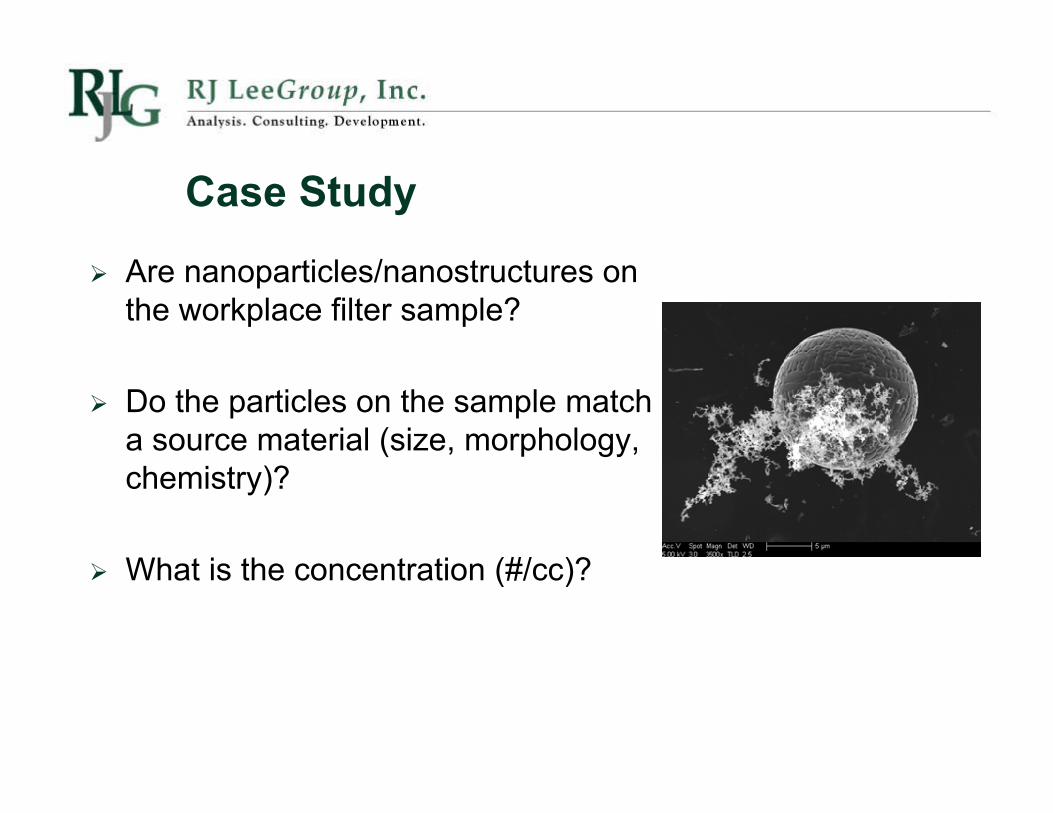
Case Study
Are nanoparticles/nanostructures onthe workplace filter sample?
Do the particles on the sample matcha source material (size, morphology,chemistry)?
What is the concentration (#/cc)?

Analytical Approach Characterize “source” sample using Level II
protocol Define source signature Source material should be representative of the process
Examine workplace samples initially using Level Iprotocol Compare to source and background samples
Select sample(s) for Level II protocol

Establish Source Signature

WorkplaceSample
SourceMaterial
Evaluate worker exposure

X
SourceMaterial
WorkplaceSample

WorkplaceSample
X
X
SourceMaterial

Case Study ResultsNanostructures consistent with the source material
accounted for ~0.3 particles/cc
Nanoparticles/nanostructures not consistent with thesource material accounted for ~40 particles/cc
Other source(s) of nanopartices or bulk sourcematerial may not be representative of allnanoparticle/nanostructures emitted from the source
Implications

Non-asbestiform richterite partic le
Particle Classification Database
FESEM TEM

Proposed Sampling Strategies
Combination of real time particle countersand filter based methods Condensation particle counters Microscopy Bulk analytical methods (gravimetry, ICP, etc.)
Looking to the future Evaluate samplers that can collect samples directly on
TEM grids Explore potential to develop samplers that can integrate
real time data with collection of samples of interest

A Pilot Study of UNP at LBNL
Phase 1: Understand research throughinterviews, demonstrations, analysis of rawmaterials
Phase 2: Develop preliminary control bands List of potential hazards and ways to control them
Phase 3: Validate and modify control bands Sampling and Analysis
Personal exposure Environment Finalize Control Bands
Phase 4: Develop ongoing monitoring plan

Summary Advanced analytical tools are available for the
characterization of nanoparticles Use these tools in a cost-effective manner
Learn from previous experiences Sample in a “smart” manner Automate the process where possible Incorporate information in databases Sampling and analysis protocols are evolving and
will continue to evolve as more informationbecomes available