
1 Rating Trends and Outlook Basic Industries Moody’s 2002 Corporate Finance Credit Outlook...
60
1 Rating Trends and Outlook Basic Industries Moody’s 2002 Corporate Finance Credit Outlook Investor Briefing New York, January 15, 2002
-
date post
22-Dec-2015 -
Category
Documents
-
view
216 -
download
0
Transcript of 1 Rating Trends and Outlook Basic Industries Moody’s 2002 Corporate Finance Credit Outlook...

1
Rating Trends and Outlook
Basic Industries
Moody’s 2002 Corporate Finance Credit Outlook Investor Briefing
New York, January 15, 2002
2
Paper and Forest Products
Mark Gray
Senior Vice President

3
Outline
• Ratings Trends and Activity
• Credit Issues and Ratings Outlooks
• Sector Trends and Outlook

4
0
2
4
6
8
10
12
No.
of I
ssue
rs
Global Forest & Paper Products - Rated Issuers
Total No. of Issuer: 59

5
Global Forest & Paper Rated Issuers
0
2
4
6
8
10
12
Nu
mb
er
of
Issu
ers
2001
2000
Total No. of Issuers: 59

6
Consolidated Industry Debt in the U.S.
Long Term Debt
01020304050607080
Year
in B
illi
on
$

7
Global Forest & Paper Issuers - Mean Ratings
Ba1
Baa3
Ba2

8
Global Forest & Paper Issuers - Rating Changes (LTM)
Investment Grade:
Upgrades: 1
Downgrades: 7
Speculative Grade:
Upgrades: 8
Downgrades: 12

9
Industry FundamentalsPulp and Paper
• Near-term Outlook: Negative. – Demand Driven Downcycle. – Lower Consumer Confidence on Recession and
Sept. 11.
• Intermediate / Longer Term Outlook: Positive. – Little New Capacity Construction– More High Cost Capacity Shut Down– Greater Sector Concentration / Producer Discipline

10
Industry FundamentalsBuilding Materials
• Near-term Outlook: Very Negative– Over-supply– Housing starts may dip on lower consumer
confidence– Canadian quota issue unresolved (lumber)– Fragmented markets with desperate
participants.
11
The Bottom Line
• Recovery in 2002, if– The economy avoids a deep and
prolonged recession, and
– The active and visible portion of the war ends relatively quickly.

12
Overall Ratings Outlook:Negative
• Cash Flow Weak Over the Near Term.
• Lots of Debt Remaining From Acquisitions.
• Weaker Market for Asset Sales.
• Event Risk Still High.
• Liquidity Becoming An Issue (Baa and Below)

13
Sector Outlooks
Market Pulp Stable/neg Positive
Uncoated Freesheet Stable/neg Positive
Newsprint Negative Positive
Packaging grades Negative Stable/pos
Coated paper Stable/neg Neutral/neg
Panels Negative Neutral/neg
Sector Short term Int/long

14
NBSK Pulp Price and Norscan Inventories
0
100
200
300
400
500
600
700
800
900
1000
Dec-93
Jun-94
Dec-94
Jun-95
Dec-95
Jun-96
Dec-96
Jun-97
Dec-97
Jun-98
Dec-98
Jun-99
Dec-99
Jun-00
Dec-00
Jun-01
Aug-01
Oct-01
(US
D/T
)
0
0.5
1
1.5
2
2.5
3
3.5
4
4.5
Inve
ntor
ies
- Mill
ions
of
Tons
NBSK Pulp Prices Norscan InventoriesSource: Pulp & Paper Week

15
Pulp
• Sharp Slowdown in the U.S. Economy
• Strong U.S.$
Intermediate-term: Positive (demand recovery)• Economic Recovery in 2002.
• Current Weakening Trend of the U.S. Dollar.
Longer- term: Negative (over-supply)• New Capacity (South American and Asia) Likely
to Outstrip Demand Growth.
Near-term: Negative (weak demand)

16
US Uncoated Free Sheet Consumption
11.5
12.0
12.5
13.0
13.5
14.0
14.5
15.0
15.519
93
1994
1995
1996
1997
1998
1999
2000
2001
E
2002
E
2003
E
Mil
lio
ns
of
Sh
ort
To
ns
Consumption
Source: American Forest and Paper Association, Pulp and Paper Forcaster, and Miller
Freeman.

17
US Uncoated Free Sheet Capacity
12.5
13.0
13.5
14.0
14.5
15.0
15.519
93
1994
1995
1996
1997
1998
1999
2000
2001
E
2002
E
2003
E
Mil
lio
ns
of
Sh
ort
To
ns
Capacity
Source: American Forest and Paper Association, Pulp and Paper Forcaster, and Miller
Freeman.

18
UCF Capacity vs. Consumption
11.5
12.0
12.5
13.0
13.5
14.0
14.5
15.0
15.519
93
1994
1995
1996
1997
1998
1999
2000
2001
E
2002
E
2003
E
Mil
lio
ns
of
Sh
ort
To
ns
Consumption
Capacity
Source: American Forest and Paper Association, Pulp and Paper Forcaster, and Miller
Freeman.

19
White Paper
• Near-term Weakness in Pulp • Global Excess Capacity• Asian Swing producers
Intermediate-term: Modestly Positive • Lower Capacity Growth• Higher Consumption Growth
Longer- term: Negative • Expected to Follow Pulp
Near-term: Neutral
20
Tissue
Near-term: • Retail - Stable
–Steady Demand –Possible Downshift in Quality
• Away From Home - Negative–Lower Demand–Greater Competition

21
Containerboard
Near-term: Negative• Slowing economy (domestic demand)• Reduced exports
Longer term: Positive
• Low capacity growth
• Consolidation/producer discipline
• Capacity shutdowns
• US producers have relatively good cost position

22
NA Newsprint Consumption
11.011.512.012.513.013.514.0
1993
1994
1995
1996
1997
1998
1999
2000
2001
E
2002
E
Mil
lio
ns
of
Met
ric
To
ns
Consumption
Source: American Forest and Paper Association, Pulp and Paper Forcaster, Miller Freeman
and Bank of America Industry Research Estimates

23
Newsprint & Groundwood
Near-term: Negative• Slowdown in economy• Buyer resistance• Technology risk
Longer term: Positive• Consolidation/ Supplier discipline • No new capacity• Capacity shutdowns/conversions

24
Coated
Near-term: Negative• Overcapacity (new in Europe, conversions in
U.S.)• Imports• Slow Economy (Weaker Demand)
Longer term: Positive• Consolidation (Potential Industry Shake-out) • Weakening US Dollar

25
Lumber
Near-term: Negative • Lower Housing Starts
• Increased Capacity (Especially in the US South)
• Elimination of Canadian Quota

26
Structural Panels
Near-term: Negative
• New OSB Capacity
• Lower Housing Starts
• Weak Industry Participants

27
Chemicals & Allied ProductsRating Trends and Outlook
John Rogers
Vice President / Senior Credit Officer
Investor Conference January 15, 2002

28
Agenda
Rating Trends
Ratings Outlook
Major Rating Issues

29
Baa2
Ba1
Baa3
Rating TrendsChemicals & Allied Products

30
Rating Outlook US Chemical Companies
• Weak Global Economic Outlook– Accelerating After 9/11– Declines in Europe and Asia
• Timing of Rebound Uncertain– Terrorism Creates Uncertainty– Disconnect Between Industry & Economy
• Further Reduction in Bank Exposure
Ratings Outlook: Negative

31
Rating Outlook (Continued) US Chemical Companies
• Negative Industry Factors– Debt Levels Elevated
• Acquisitions and Share Repurchases
– Event Risk and New Capacity– Impact of Cost Reductions
• Not Visible due to Weak Global Demand
• Unable to Rate Through Cycle– Liquidity Concerns Cause Downgrades
Ratings Outlook: Negative
32
Rating Outlook (Continued) US Chemical Companies
• Additional Waivers Required for Financial Covenants in 2002– Acceleration if Downturn Extends Into 2nd Half
• More Defaults – Single B & C Rated Companies at Risk– Acceleration if Downturn Extends Into 2nd Half
• Company By Company Evaluation– Focusing on Liquidity
Ratings Outlook: Negative

33
Rating Outlook US Industrial Gas Companies
• Debt Levels Closer to Normal• Not as Impacted by Downturn
– Even AP With a Large Chemicals Business
• Debt Levels Likely to Remain Stable– Reduced Capex
• Liquidity is Not a Concern– High Level of Guaranteed Revenues
Ratings Outlook: Stable

34
Rating IssuesChemical and Allied Companies
• Liquidity
• Business Risk
• Management Policies
35
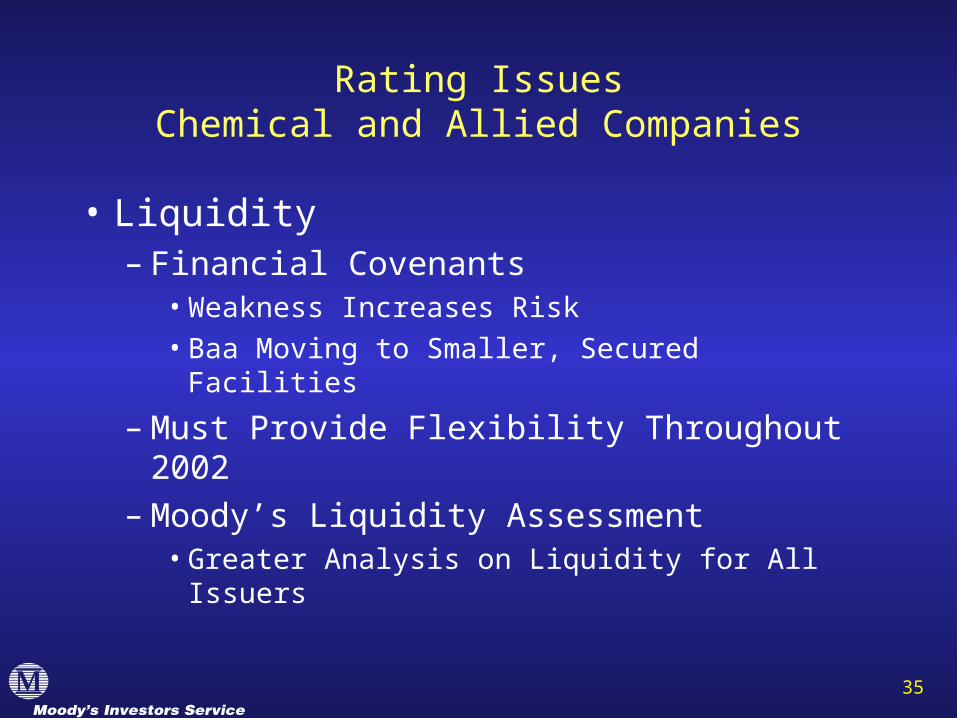
Rating IssuesChemical and Allied Companies
• Liquidity– Financial Covenants
• Weakness Increases Risk• Baa Moving to Smaller, Secured Facilities
– Must Provide Flexibility Throughout 2002– Moody’s Liquidity Assessment
• Greater Analysis on Liquidity for All Issuers

36
Rating IssuesChemical and Allied Companies
• Business Risk– Exposure to Economic Weakness– Commodities - New Capacity/Competition– Specialties - Commoditization/Competition
• Event Risk - All Companies– Acquisitions Greater Negative Impact

37
Major Rating IssuesChemical and Allied Companies
• Management Policies– Changes Due to Economic Weakness
• Growth/Acquisitions• Share Repurchases• Capex/Investments
– Proactive Management of Liquidity and Banking Relationships
– Commitment to Current Rating
38
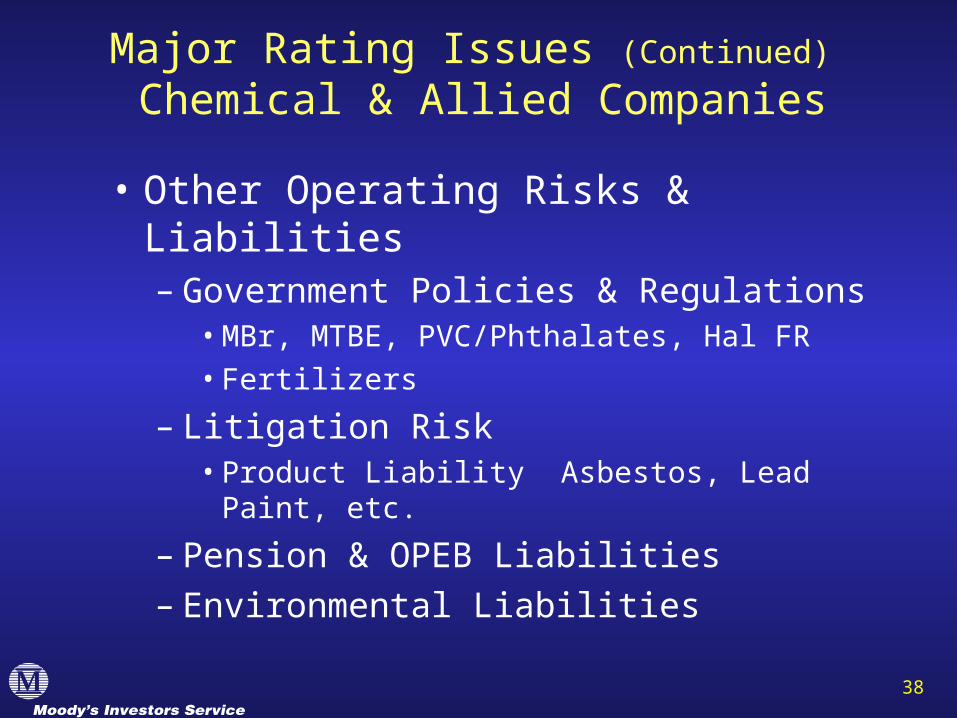
• Other Operating Risks & Liabilities– Government Policies & Regulations
• MBr, MTBE, PVC/Phthalates, Hal FR• Fertilizers
– Litigation Risk• Product Liability Asbestos, Lead Paint, etc.
– Pension & OPEB Liabilities– Environmental Liabilities
Major Rating Issues (Continued) Chemical & Allied Companies

39
Ratings at Risk Chemical & Allied Companies
Companies Rating Outlook Comment
Great Lakes A2 Negative Flame Retardants
Eastman Baa2 Stable Spin-off/Acq. Synergies
Nova Chemicals Baa2 Negative PE & PS Margins
PolyOne Baa2 Stable Rationalization & Costs
Solutia Baa2 U Review Nylon & Asset Sales
Crompton Baa3 Stable Asset Sales
Ferro Baa3 Negative Acq. Syn. & Asset Sales
RPM Baa3 Stable Asset Sales

40
Ratings at Risk Chemical & Allied Companies
Companies Rating Outlook Comment
Equistar Ba1 Negative Liquidity, Margins
IMC Global Ba1 Negative DAP Recovery
KoSa B.V. Ba1 Stable Polyester Fiber Outlook
Borden Inc. Ba3 U. Review Margins, Use of Cash
Georgia Gulf Ba3 Stable Chlor Alkali / PVC Outlook
OM Group Inc. Ba3 Negative Equity Transaction Pending
Single B and C Rated Companies
Are at More Risk by Definition.

41
Global Chemicals Team
US David Neuhaus, VP & Sr. Analyst John Rogers, VP & Sr. Credit. Officer Diane Vargas, VP & Sr. Analyst
Europe Donald Burri, Sr. Vice President
Japan Noriko Kosaka, VP & Sr. Analyst
42
Metals & Mining
Carol Cowan
VP/Senior Analyst

43
Agenda
• Industry Fundamentals
• Key Rating Drivers
• Future Trends

44
Industry Fundamentals
• Industry Outlook Negative
• Volatile supply/demand environment
• Global commodity prices downward trend
• Depleting asset base
• Leveraged financial profile
• Need for reinvestment for growth
• Geopolitical risks

45
Industry Fundamentals
Source: London Metals Exchange
Metals Prices 1990-December 2001
$0.00
$0.20
$0.40
$0.60
$0.80
$1.00
$1.20
$1.40
DE
C.
1989
JUN
. 19
90
DE
C.
1990
JUN
. 19
91
DE
C.
1991
JUN
. 19
92
DE
C.
1992
JUN
. 19
93
DE
C.
1993
JUN
. 19
94
DE
C.
1994
JUN
. 19
95
DE
C.
1995
JUN
. 19
96
DE
C.
1996
JUN
. 19
97
DE
C.
1997
JUN
. 19
98
DE
C.
1998
JUN
. 19
99
DE
C.
1999
JUN
. 20
00
DE
C.
2000
JUN
. 20
01
DE
C.
2001
US
$/lb
(A
lum
inum
, Cop
per
and
Zinc
)
$0.00
$0.50
$1.00
$1.50
$2.00
$2.50
$3.00
$3.50
$4.00
$4.50
$5.00
$5.50
$6.00
US
$/lb
(N
icke
l)
ALUMINUM ($ / lb.) COPPER ($ / lb.) ZINC ($ / lb.) NICKEL ($ / lb.)

46
Key Rating Drivers
• Cost Management
• Business Growth Strategy and ability to execute
• Cash Flow and Capital Structure

47
Cost Management
• Declining ore grades
• Higher energy cost platform
• Higher labor costs
• Currency exposures - US dollar revenues on local currency cost basis
• Environmental and reclamation costs
• Ability to manage cost base throughout the cycle more challenging

48
Business Growth Strategy
• Reserve exploration and new mine development
• Proven/probable reserve position
• Growth opportunities - acquisition or resource development
• Position on risk sharing - structuring of joint venture, partnership arrangements
• Overall risk tolerance
• Desired financial flexibility to maintain long term strategic growth objectives

49
Capital Structure
• Balance between short and long term debt
• Diversity of funding sources
• Access to debt and equity markets
• Off balance sheet exposures
• Leverage targets, coverage ratios over reasonable time frame
• Financial capacity to take advantage of opportunities and weather economic weakness

50
Future Trends
• New resource development to continue costly
• Production cost positions to be pressured
• Access to equity markets for middle and lower tier companies to continue challenging
• China likely to become a major factor from both a consumption and production perspective
• Consolidation to continue
• Ratings will reflect the widening gap between the haves and the have nots

51
Domestic Steel Industry
Grace Kennedy, CFA/AVP

52
Negative Outlook
• Economic environment remains weak
• Industry Specific Issues:
– Overcapacity
– Legacy Costs related to Pension and Health Care Obligations
• Legislative Relief through import restrictions may ameliorate conditions temporarily

53
Economic Environment
• Declining industrial production
• Capital expenditure budgets curtailed
• Interest rate cuts unlikely to support sustained consumer durable spending
• Rising unemployment

54
Industrial Production Jan 1998 through Nov 2001
2400
2500
2600
2700
2800
2900
3000
Souce: Federal Reserve Statistical Release
Gro
ss V
alu
e o
f P
rod
uct
- s
easo
nal
ly a
dju
sted

55
-30
-20
-10
0
10
20
30
40
1980
1981
1982
1983
1985
1986
1987
1988
1990
1991
1992
1993
1995
1996
1997
1998
2000
2001
% C
han
ge f
rom
Pre
ceed
ing
Per
iod
Source: Bureau of Economic Analysis, December 21, 2001
Capital Investmentssequential quarterly change (in %)
2Q01 -14.6%
3Q01 -8.5%
2Q01 -14.6%
3Q01 -8.5%

56
Rising Unemployment
3
4
5
6
7
8
Souce: Department of Labor
Domestic Unemployment thru Dec. 2001
% o
f re
al o
utpu
t, b
ase
year
199
2in
per
cent 5.8% Dec ‘01

57
Steel Industry-Specific Issues
• Overcapacity– Global excess capacity causing pricing pressure and
under-absorption of operating costs
• High Operating Costs– Many US facilities are older and less efficient
– Retiree healthcare benefits require current cash contributions.
– Pensions may require additional funding due to lower pension plan market values

58
Steel Industry Overcapacity

59
Steel IndustryLegislative Relief
• Section 201 Investigation by U.S. ITC found “serious injury” to domestic industry from imports. In February 2002 the president will determine tariffs that may be effective for four years.
• Retiree healthcare “cost-sharing” bills introduced in the Senate (unlikely to become law)

60
What Would Alter the Outlook?
• Economic conditions supporting increased industrial production
• Rationalization of high-cost plants to align supply with demand.– Consolidation talks among U.S. producers
contingent upon legacy employee cost relief
• Relief from legacy employee cost burden


