1 of 64 C © 2006 Prentice Hall Business Publishing Accounting Information Systems, 10/e...
68
1 of 64 C © 2006 Prentice Hall Business Publishing Accounting Information Systems, 10/e Romney/Steinbart HAPTER 3 System Development and Documentation Techniques
-
date post
19-Dec-2015 -
Category
Documents
-
view
245 -
download
7
Transcript of 1 of 64 C © 2006 Prentice Hall Business Publishing Accounting Information Systems, 10/e...
1 of 64
C
© 2006 Prentice Hall Business Publishing Accounting Information Systems, 10/e Romney/Steinbart
HAPTER 3
System Development and Documentation Techniques

2 of 68© 2006 Prentice Hall Business Publishing Accounting Information Systems, 10/e Romney/Steinbart
INTRODUCTION
• Questions to be addressed in this chapter include:– What is the purpose of documentation?– Why do accountants need to understand
documentation?– What documentation techniques are used in
accounting systems?– What are data flow diagrams and flowcharts?
• How are they alike and different?• How are they prepared?
3 of 68© 2006 Prentice Hall Business Publishing Accounting Information Systems, 10/e Romney/Steinbart
INTRODUCTION
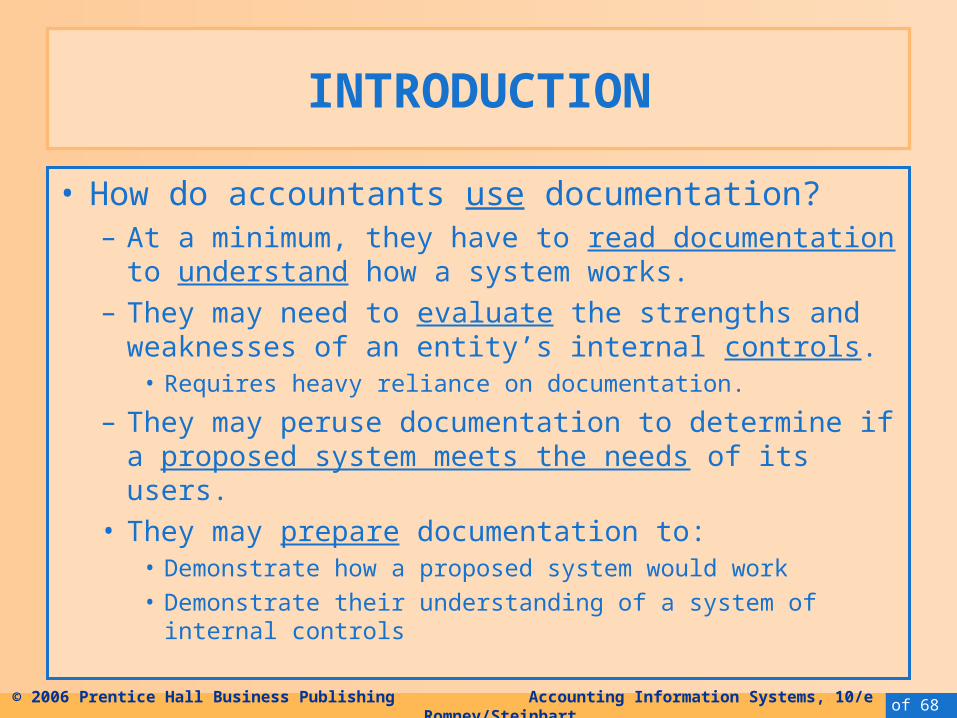
• How do accountants use documentation?– At a minimum, they have to read documentation to
understand how a system works.– They may need to evaluate the strengths and
weaknesses of an entity’s internal controls.• Requires heavy reliance on documentation.
– They may peruse documentation to determine if a proposed system meets the needs of its users.
• They may prepare documentation to:• Demonstrate how a proposed system would work• Demonstrate their understanding of a system of internal
controls
4 of 68© 2006 Prentice Hall Business Publishing Accounting Information Systems, 10/e Romney/Steinbart
INTRODUCTION
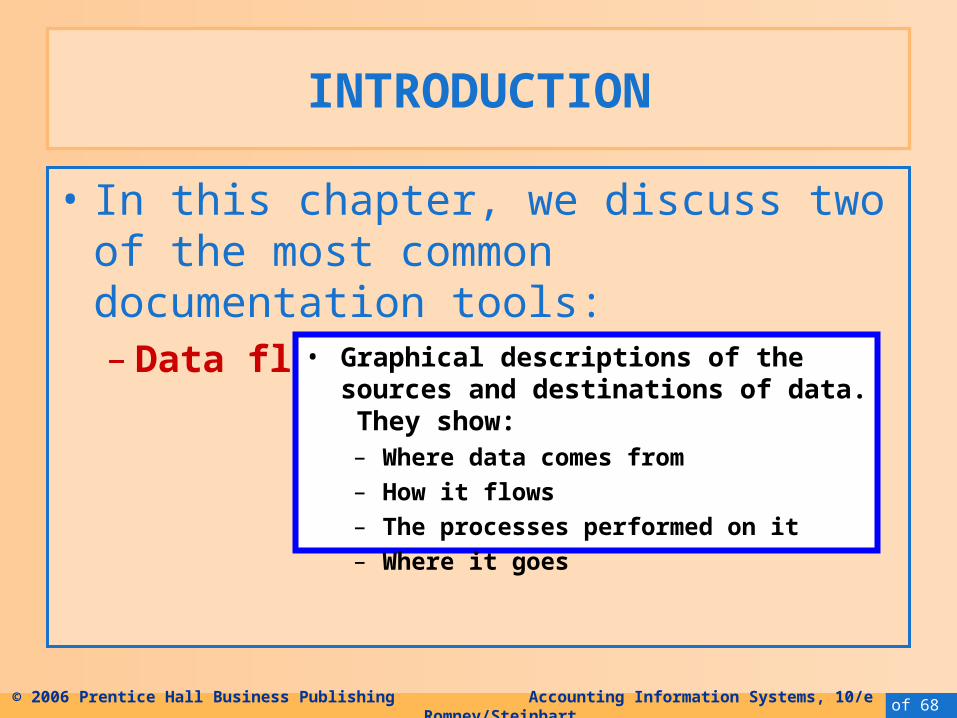
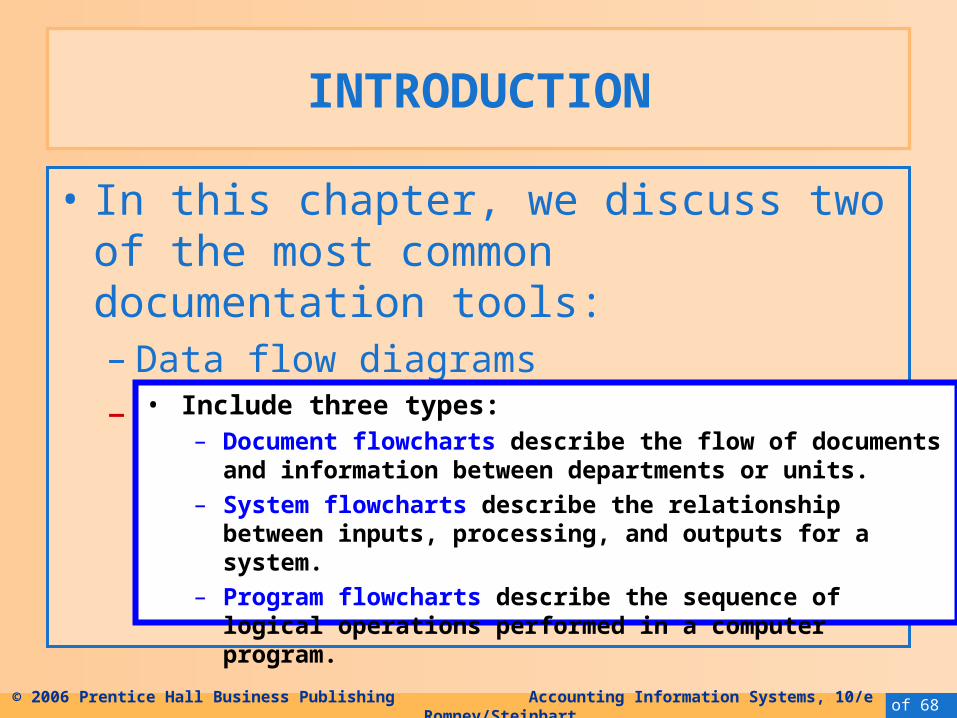
• In this chapter, we discuss two of the most common documentation tools:– Data flow diagrams
• Graphical descriptions of the sources and destinations of data. They show:– Where data comes from
– How it flows
– The processes performed on it
– Where it goes
5 of 68© 2006 Prentice Hall Business Publishing Accounting Information Systems, 10/e Romney/Steinbart
INTRODUCTION
• In this chapter, we discuss two of the most common documentation tools:– Data flow diagrams– Flowcharts
• Include three types:– Document flowcharts describe the flow of documents and
information between departments or units.
– System flowcharts describe the relationship between inputs, processing, and outputs for a system.
– Program flowcharts describe the sequence of logical operations performed in a computer program.
6 of 68© 2006 Prentice Hall Business Publishing Accounting Information Systems, 10/e Romney/Steinbart
INTRODUCTION
• Which method should you use—flowcharts or DFDs?– 62.5% of IS professionals use DFDs.– 97.6% use flowcharts.– Both can be prepared relatively simply using
available software.– Both are tested on professional exams.– CONCLUSION: You need to know them both.
7 of 68© 2006 Prentice Hall Business Publishing Accounting Information Systems, 10/e Romney/Steinbart
DATA FLOW DIAGRAMS
• A data flow diagram (DFD) graphically describes the flow of data within an organization. It is used to:– Document existing systems– Plan and design new systems
• An ERD is a data model, and a DFD is a process model
8 of 68© 2006 Prentice Hall Business Publishing Accounting Information Systems, 10/e Romney/Steinbart
DATA FLOW DIAGRAMS
• A data flow diagram consists of four basic elements:– Data sources and destinations. Also called
external entities– Data flows– Processes– Data stores
9 of 68© 2006 Prentice Hall Business Publishing Accounting Information Systems, 10/e Romney/Steinbart
DATA FLOW DIAGRAMS
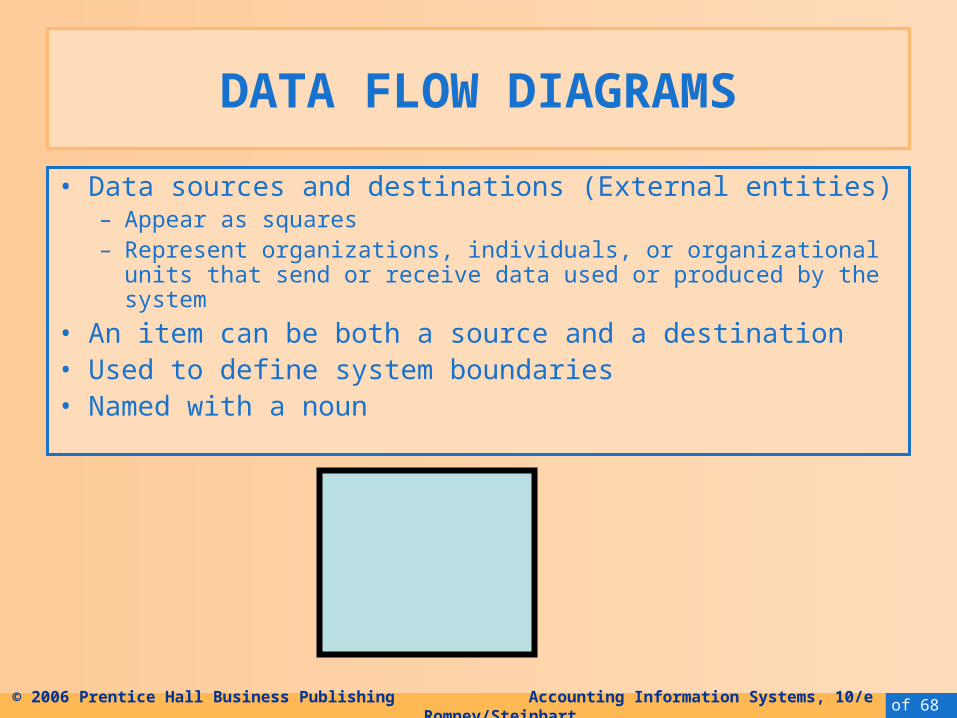
• Data sources and destinations (External entities)– Appear as squares– Represent organizations, individuals, or organizational units that
send or receive data used or produced by the system
• An item can be both a source and a destination• Used to define system boundaries• Named with a noun
10 of 68© 2006 Prentice Hall Business Publishing Accounting Information Systems, 10/e Romney/Steinbart
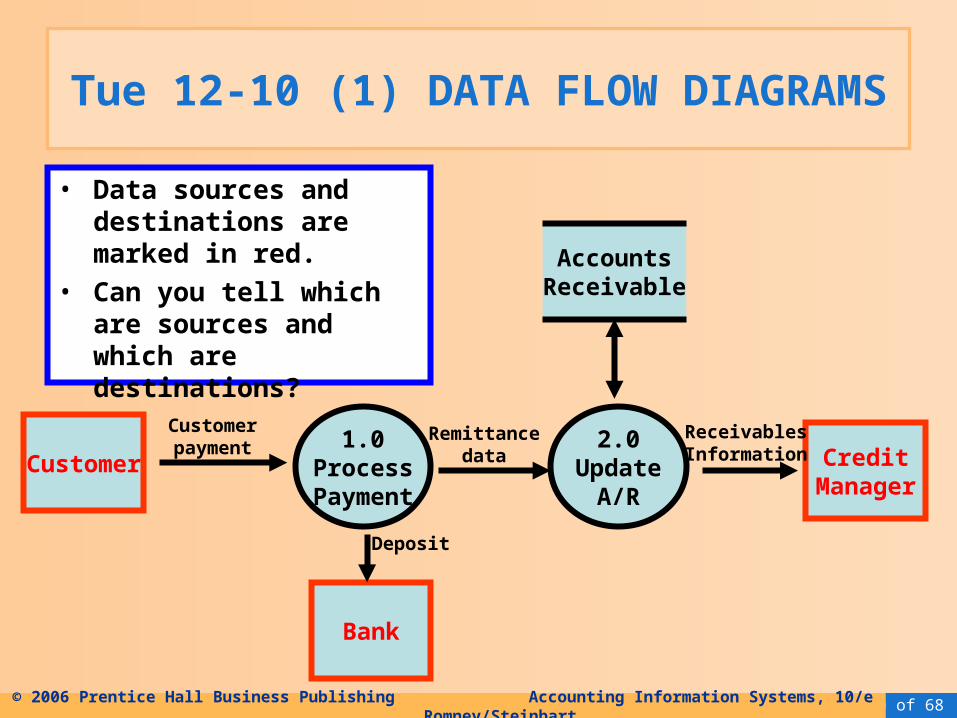
Tue 12-10 (1) DATA FLOW DIAGRAMS
Customer1.0
ProcessPayment
2.0Update
A/R
CreditManager
Bank
AccountsReceivable
Customerpayment
Remittancedata
ReceivablesInformation
Deposit
• Data sources and destinations are marked in red.
• Can you tell which are sources and which are destinations?
11 of 68© 2006 Prentice Hall Business Publishing Accounting Information Systems, 10/e Romney/Steinbart
DATA FLOW DIAGRAMS
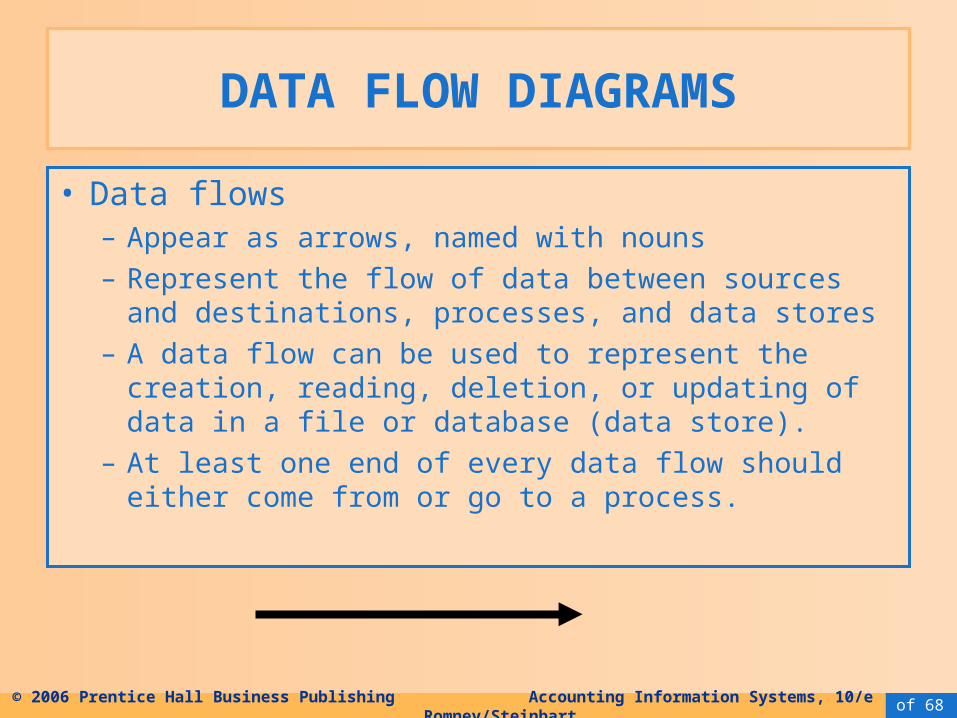
• Data flows– Appear as arrows, named with nouns– Represent the flow of data between sources and
destinations, processes, and data stores– A data flow can be used to represent the creation,
reading, deletion, or updating of data in a file or database (data store).
– At least one end of every data flow should either come from or go to a process.
12 of 68© 2006 Prentice Hall Business Publishing Accounting Information Systems, 10/e Romney/Steinbart
DATA FLOW DIAGRAMS
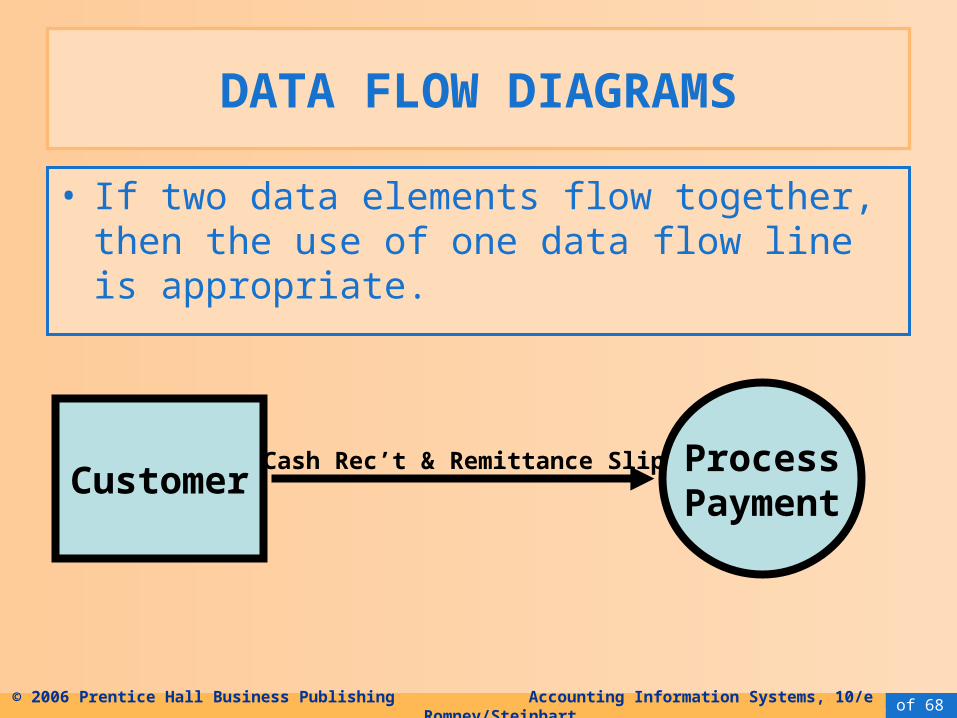
• If two data elements flow together, then the use of one data flow line is appropriate.
CustomerProcessPayment
Cash Rec’t & Remittance Slip
13 of 68© 2006 Prentice Hall Business Publishing Accounting Information Systems, 10/e Romney/Steinbart
DATA FLOW DIAGRAMS
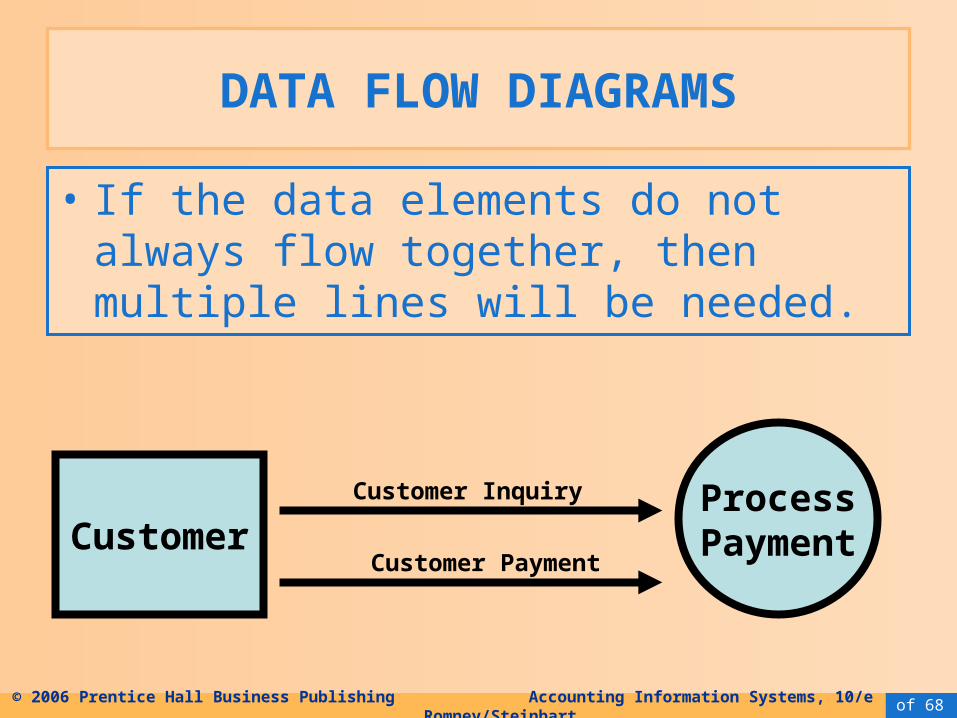
• If the data elements do not always flow together, then multiple lines will be needed.
CustomerProcessPayment
Customer Inquiry
Customer Payment
14 of 68© 2006 Prentice Hall Business Publishing Accounting Information Systems, 10/e Romney/Steinbart
DATA FLOW DIAGRAMS
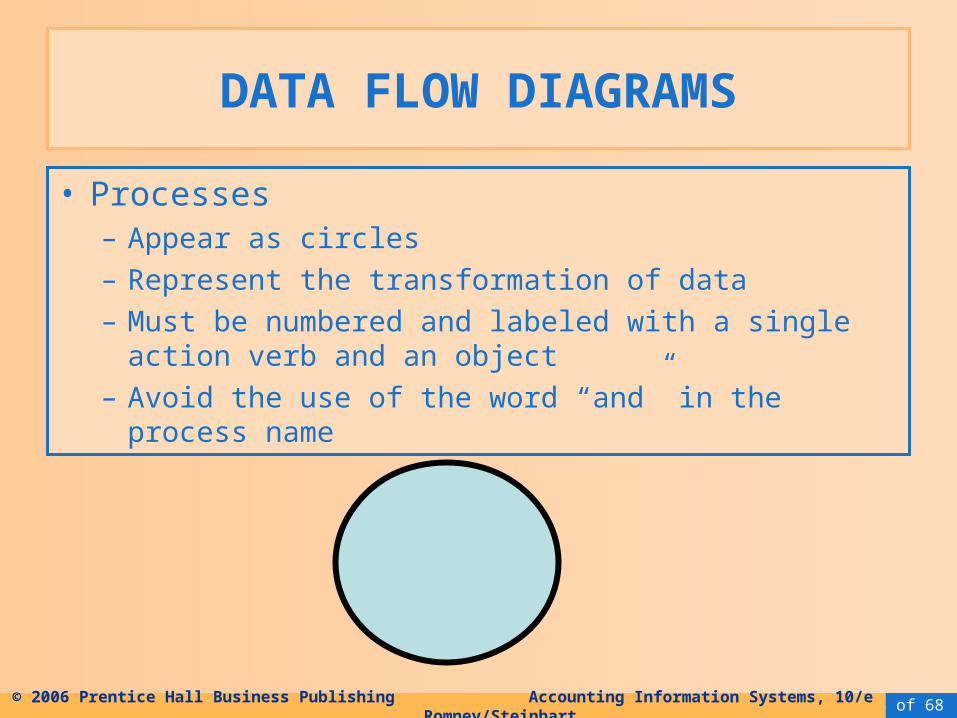
• Processes– Appear as circles– Represent the transformation of data– Must be numbered and labeled with a single action
verb and an object– Avoid the use of the word “and” in the process name
15 of 68© 2006 Prentice Hall Business Publishing Accounting Information Systems, 10/e Romney/Steinbart
DATA FLOW DIAGRAMS
Customer1.0
ProcessPayment
2.0Update
A/R
CreditManager
Bank
AccountsReceivable
Customerpayment
Remittancedata
ReceivablesInformation
Deposit
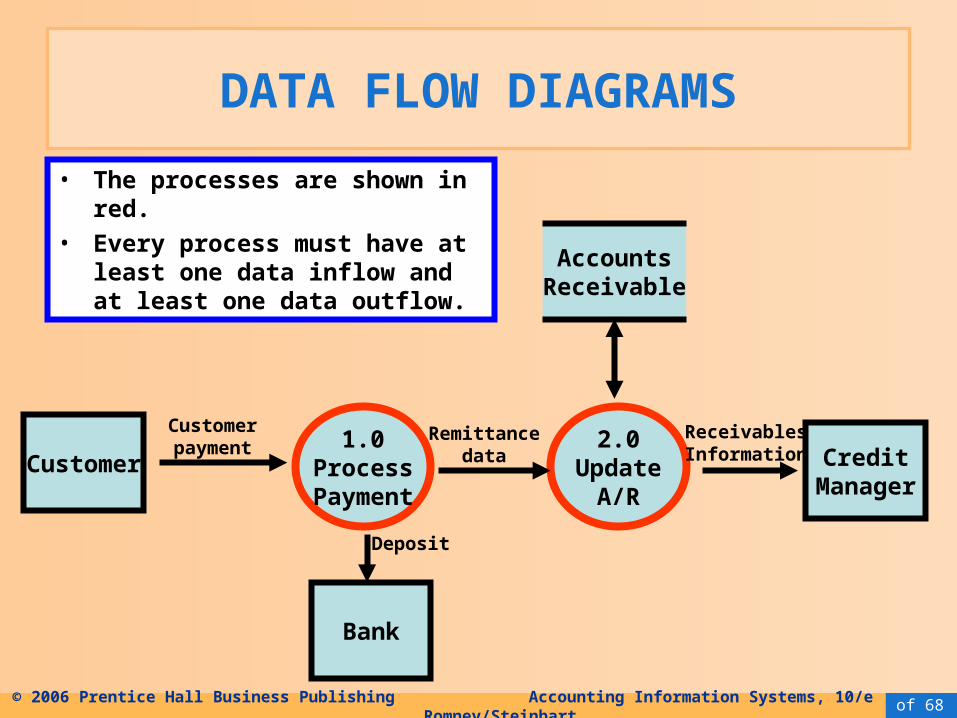
• The processes are shown in red.
• Every process must have at least one data inflow and at least one data outflow.
16 of 68© 2006 Prentice Hall Business Publishing Accounting Information Systems, 10/e Romney/Steinbart
DATA FLOW DIAGRAMS
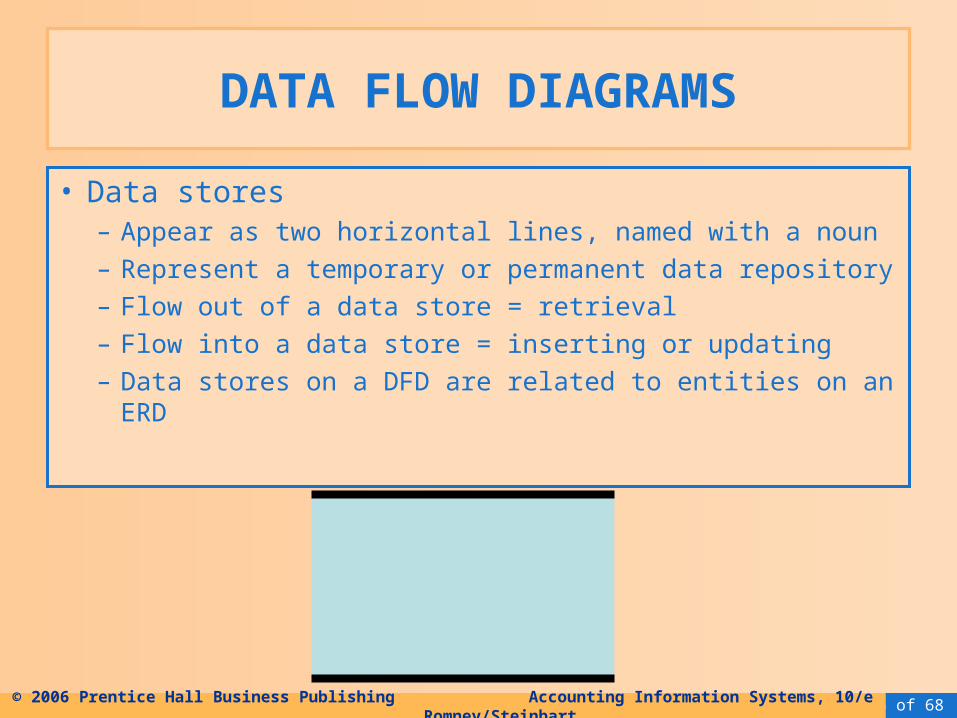
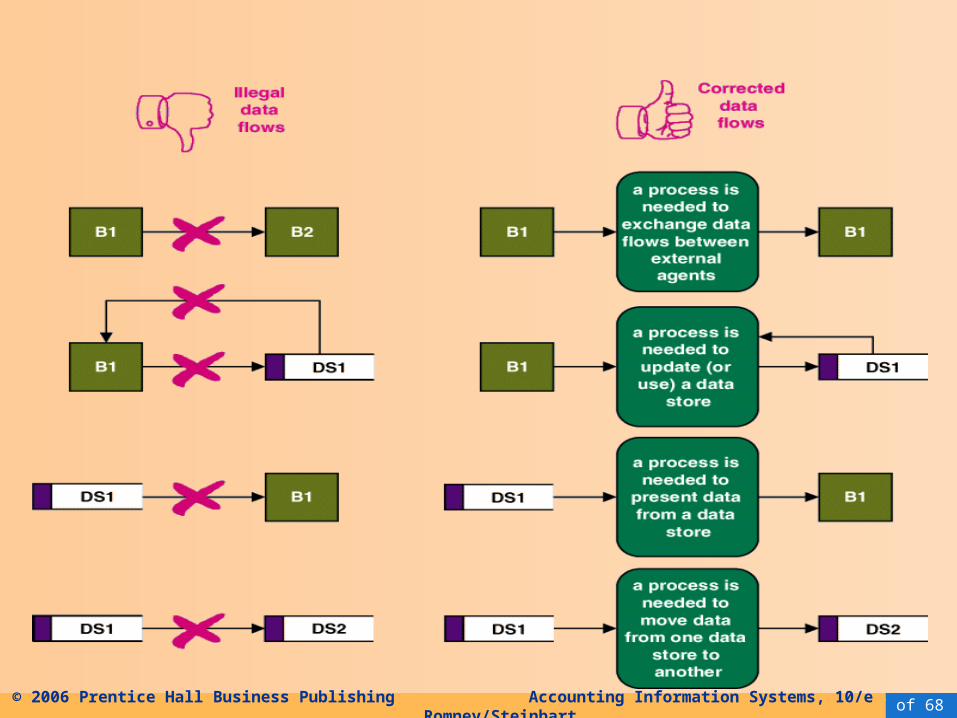
• Data stores– Appear as two horizontal lines, named with a noun– Represent a temporary or permanent data repository– Flow out of a data store = retrieval– Flow into a data store = inserting or updating – Data stores on a DFD are related to entities on an
ERD
17 of 68© 2006 Prentice Hall Business Publishing Accounting Information Systems, 10/e Romney/Steinbart
18 of 68© 2006 Prentice Hall Business Publishing Accounting Information Systems, 10/e Romney/Steinbart
DATA FLOW DIAGRAMS
• Subdividing the DFD:– Few systems can be fully diagrammed on one
sheet of paper, and users have needs for differing levels of detail.
– Consequently, DFDs are subdivided into successively lower levels to provide increasing amounts of detail.
– Some data inputs and outputs will not appear on the higher levels of the DFD but appear as the processes are exploded into greater levels of detail.

19 of 68© 2006 Prentice Hall Business Publishing Accounting Information Systems, 10/e Romney/Steinbart
Thu DATA FLOW DIAGRAMS
• The highest level of DFD is called a context diagram.– It provides a summary-level view of the
system.– It depicts a data processing system and the
external entities that are:• Sources of its input• Destinations of its output
– The process symbol is numbered with a “0”

20 of 68© 2006 Prentice Hall Business Publishing Accounting Information Systems, 10/e Romney/Steinbart
DATA FLOW DIAGRAMS
PayrollProcessing
System
Depart-ments
HumanResources
Govt.Agencies
Employees
Bank
Manage-ment
Time cards
New employee form
Employee change form
Tax report &
payment
Employee checks
Payroll checkPayroll report
• This is the context diagram for the S&S payroll processing system (Figure 3-5 in your textbook).
0
21 of 68© 2006 Prentice Hall Business Publishing Accounting Information Systems, 10/e Romney/Steinbart
Mon 11-10 (2) DATA FLOW DIAGRAMS
• A Level 0 diagram is a projection of the process on the Context diagram. It is like opening up that process and looking inside to see how it works – to show the internal sub-processes
• On a Level 0 diagram, you repeat the external entities but you also expand the main process into its subprocesses. Also data stores will appear at this level.
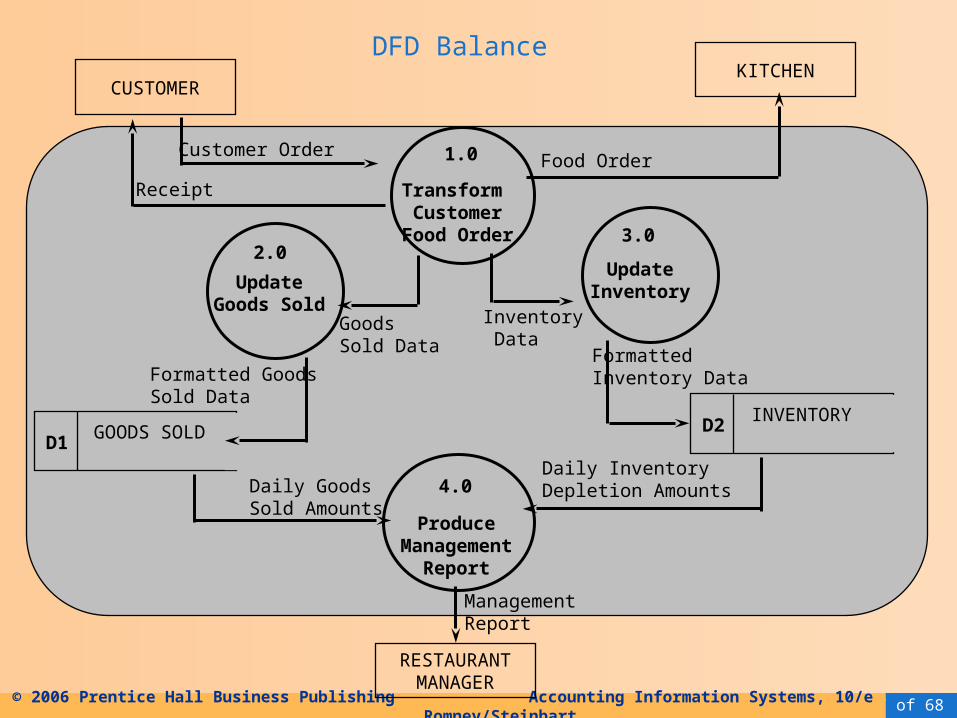
• The Level 0 diagram must “balance” with the Context diagram. This means they should both have the same external entities with the same flows to and from those entities.
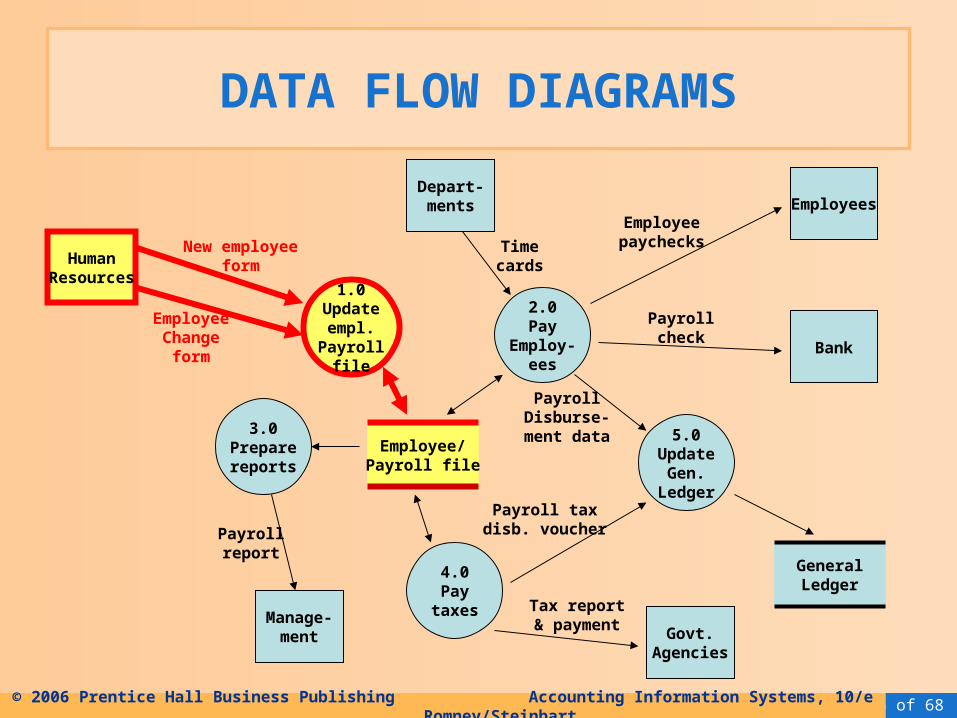
22 of 68© 2006 Prentice Hall Business Publishing Accounting Information Systems, 10/e Romney/Steinbart
DATA FLOW DIAGRAMS
1.0Updateempl.
Payrollfile
2.0Pay
Employ-ees
5.0Update
Gen.Ledger
4.0Pay
taxes
3.0Preparereports
Employee/Payroll file
GeneralLedger
HumanResources
Depart-ments Employees
Bank
Govt.Agencies
Manage-ment
EmployeeChange
form
New employeeform
Timecards
Employeechecks
Payrollcheck
PayrollDisburse-ment data
Payroll taxdisb. voucher
Tax report& payment
Payrollreport
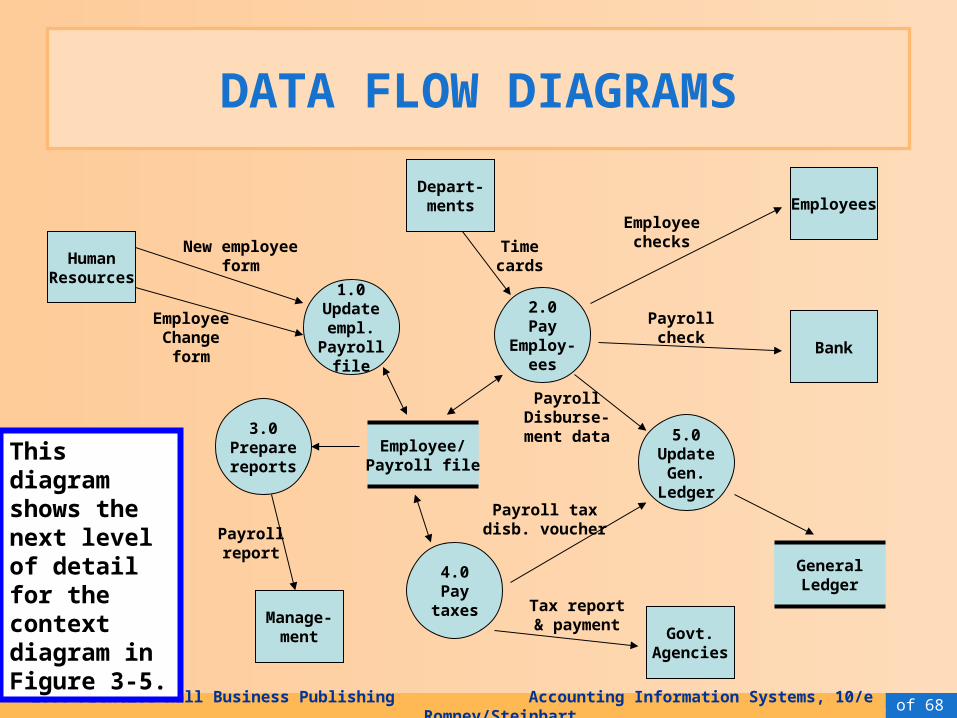
This diagram shows the next level of detail for the context diagram in Figure 3-5.
23 of 68© 2006 Prentice Hall Business Publishing Accounting Information Systems, 10/e Romney/Steinbart
DATA FLOW DIAGRAMS
1.0Updateempl.
Payrollfile
2.0Pay
Employ-ees
5.0Update
Gen.Ledger
4.0Pay
taxes
3.0Preparereports
Employee/Payroll file
GeneralLedger
HumanResources
Depart-ments Employees
Bank
Govt.Agencies
Manage-ment
EmployeeChange
form
New employeeform
Timecards
Employeepaychecks
Payrollcheck
PayrollDisburse-ment data
Payroll taxdisb. voucher
Tax report& payment
Payrollreport
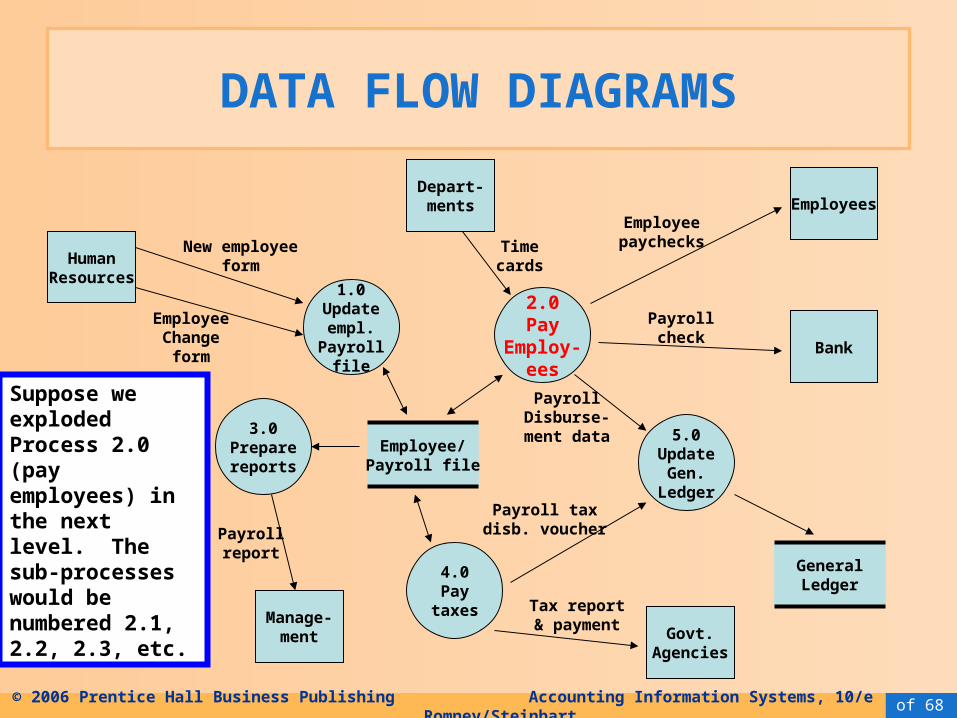
Suppose we exploded Process 2.0 (pay employees) in the next level. The sub-processes would be numbered 2.1, 2.2, 2.3, etc.

24 of 68© 2006 Prentice Hall Business Publishing Accounting Information Systems, 10/e Romney/Steinbart
DATA FLOW DIAGRAMS
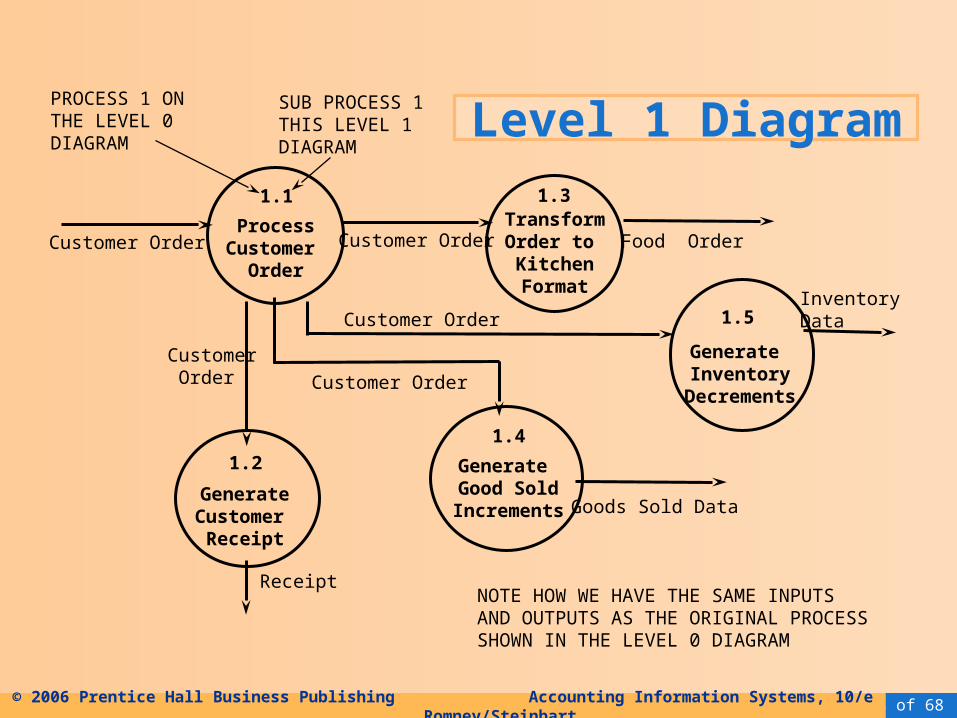
• A Level 1 diagram is a projection of a Level 0 process.
• A Level 1 diagram shows all the processes that comprise a single process on the level 0 diagram.
• It shows how information moves from and to each of these processes.
• Level 1 diagrams may not be needed for all Level 0 processes.
• On Level 1 diagrams we do not repeat external entities. Data stores may not be repeated either.
25 of 68© 2006 Prentice Hall Business Publishing Accounting Information Systems, 10/e Romney/Steinbart
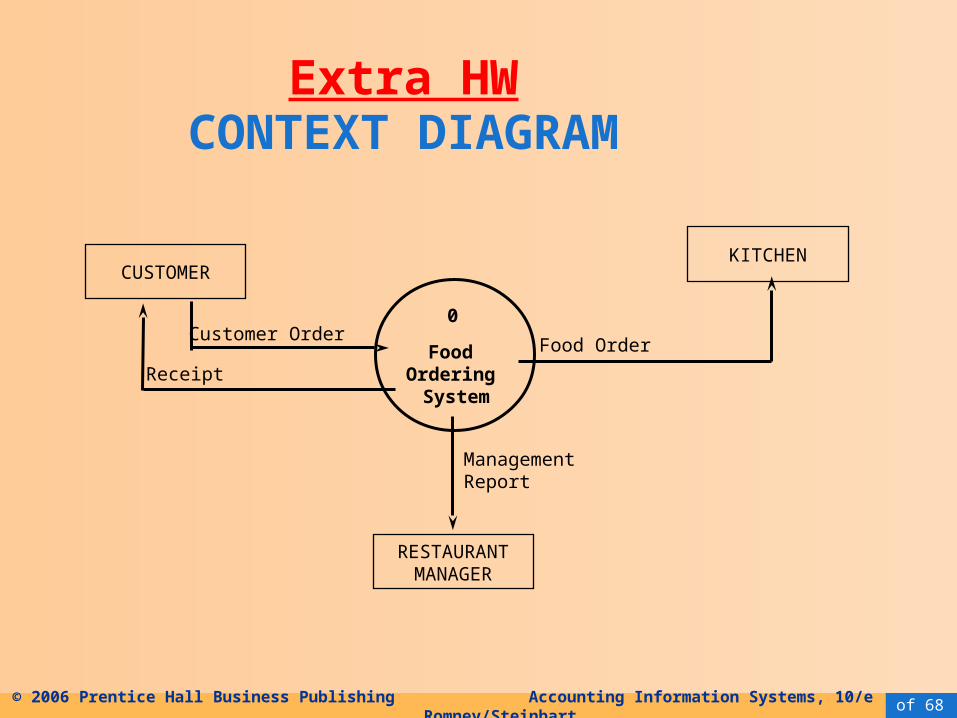
Extra HWCONTEXT DIAGRAM
CUSTOMER
Food Ordering
System
0
Management Report
KITCHEN
RESTAURANTMANAGER
Food OrderCustomer Order
Receipt
26 of 68© 2006 Prentice Hall Business Publishing Accounting Information Systems, 10/e Romney/Steinbart
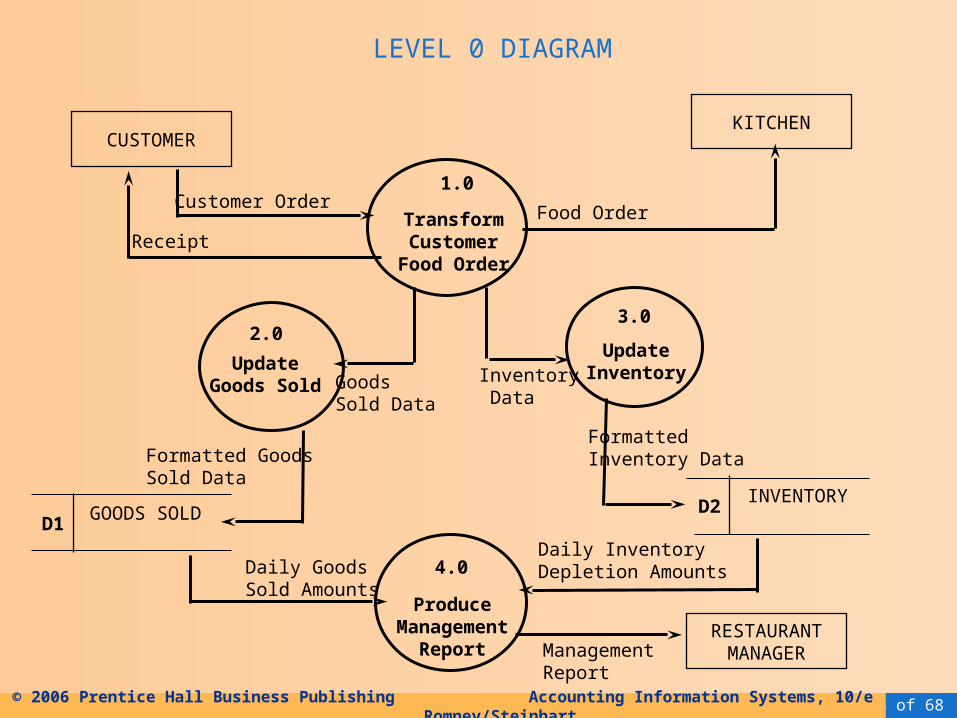
LEVEL 0 DIAGRAM
CUSTOMER
TransformCustomer
Food Order
1.0
Management Report
KITCHEN
RESTAURANTMANAGER
Food OrderCustomer Order
Receipt
UpdateInventoryUpdate
Goods Sold
2.03.0
INVENTORYD2GOODS SOLD
D1
GoodsSold Data
Inventory Data
Formatted Goods Sold Data
Formatted Inventory Data
Daily InventoryDepletion AmountsDaily Goods
Sold AmountsProduce
ManagementReport
4.0
27 of 68© 2006 Prentice Hall Business Publishing Accounting Information Systems, 10/e Romney/Steinbart
DFD Balance
CUSTOMER
Transform Customer
Food Order
1.0
Management Report
KITCHEN
RESTAURANTMANAGER
Food OrderCustomer Order
Receipt
UpdateInventoryUpdate
Goods Sold
2.03.0
INVENTORYD2GOODS SOLD
D1
GoodsSold Data
Inventory Data
Formatted Goods Sold Data
Formatted Inventory Data
Daily InventoryDepletion AmountsDaily Goods
Sold AmountsProduce
ManagementReport
4.0
28 of 68© 2006 Prentice Hall Business Publishing Accounting Information Systems, 10/e Romney/Steinbart
Level 1 Diagram
ProcessCustomer
Order
1.1
Customer Order
PROCESS 1 ON THE LEVEL 0 DIAGRAM
SUB PROCESS 1 THIS LEVEL 1DIAGRAM
TransformOrder to KitchenFormat
1.3
Customer Order Food Order
GenerateCustomer
Receipt
1.2
Customer Order
Generate Inventory
Decrements
Customer Order
Customer Order
1.5
1.4
Generate Good SoldIncrements
InventoryData
Goods Sold Data
ReceiptNOTE HOW WE HAVE THE SAME INPUTS AND OUTPUTS AS THE ORIGINAL PROCESSSHOWN IN THE LEVEL 0 DIAGRAM
29 of 68© 2006 Prentice Hall Business Publishing Accounting Information Systems, 10/e Romney/Steinbart
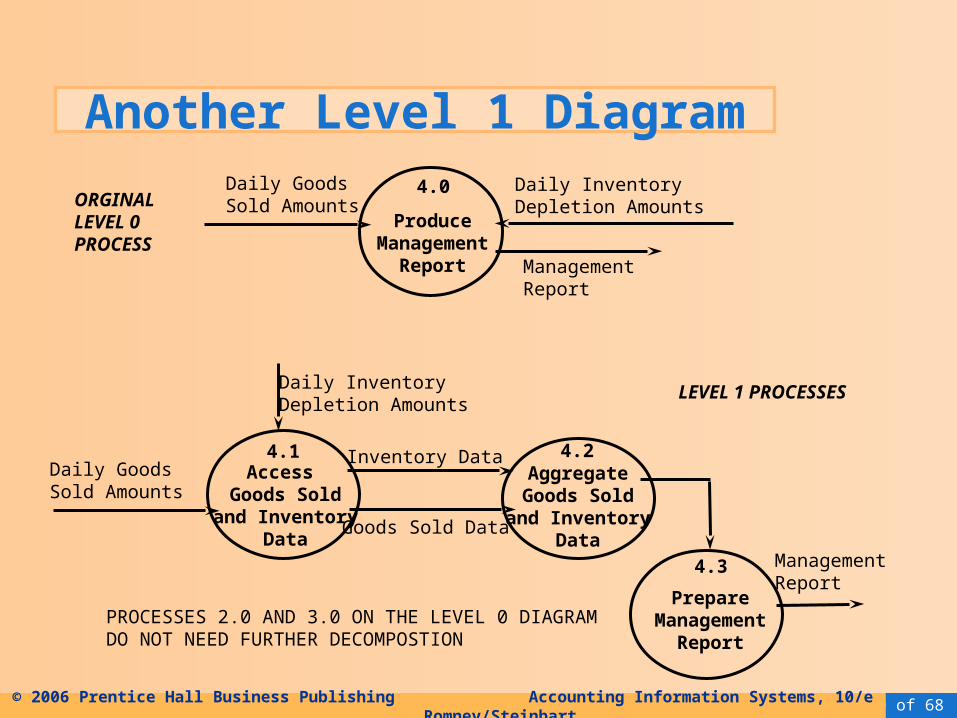
Another Level 1 Diagram
Management Report
Daily InventoryDepletion Amounts
Daily GoodsSold Amounts
ProduceManagement
Report
4.0
4.1Access
Goods Soldand Inventory
Data
Daily GoodsSold Amounts
Daily InventoryDepletion Amounts
Inventory Data
Goods Sold Data
4.2AggregateGoods Sold
and InventoryData
PrepareManagement
Report
4.3 Management Report
ORGINAL LEVEL 0 PROCESS
LEVEL 1 PROCESSES
PROCESSES 2.0 AND 3.0 ON THE LEVEL 0 DIAGRAMDO NOT NEED FURTHER DECOMPOSTION
30 of 68© 2006 Prentice Hall Business Publishing Accounting Information Systems, 10/e Romney/Steinbart
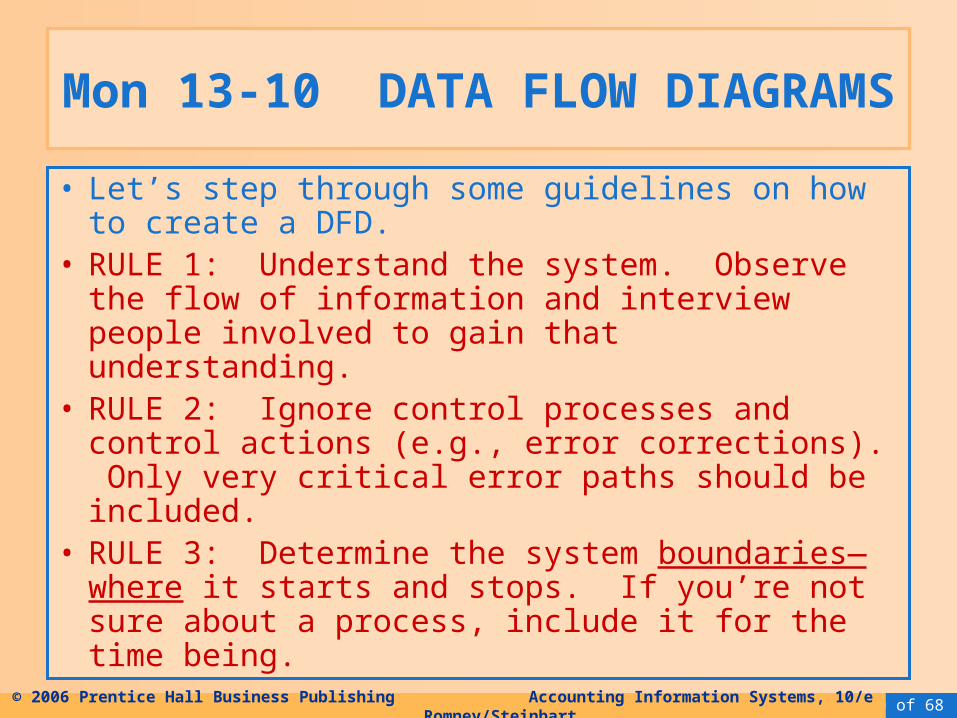
Mon 13-10 DATA FLOW DIAGRAMS
• Let’s step through some guidelines on how to create a DFD.
• RULE 1: Understand the system. Observe the flow of information and interview people involved to gain that understanding.
• RULE 2: Ignore control processes and control actions (e.g., error corrections). Only very critical error paths should be included.
• RULE 3: Determine the system boundaries—where it starts and stops. If you’re not sure about a process, include it for the time being.
31 of 68© 2006 Prentice Hall Business Publishing Accounting Information Systems, 10/e Romney/Steinbart
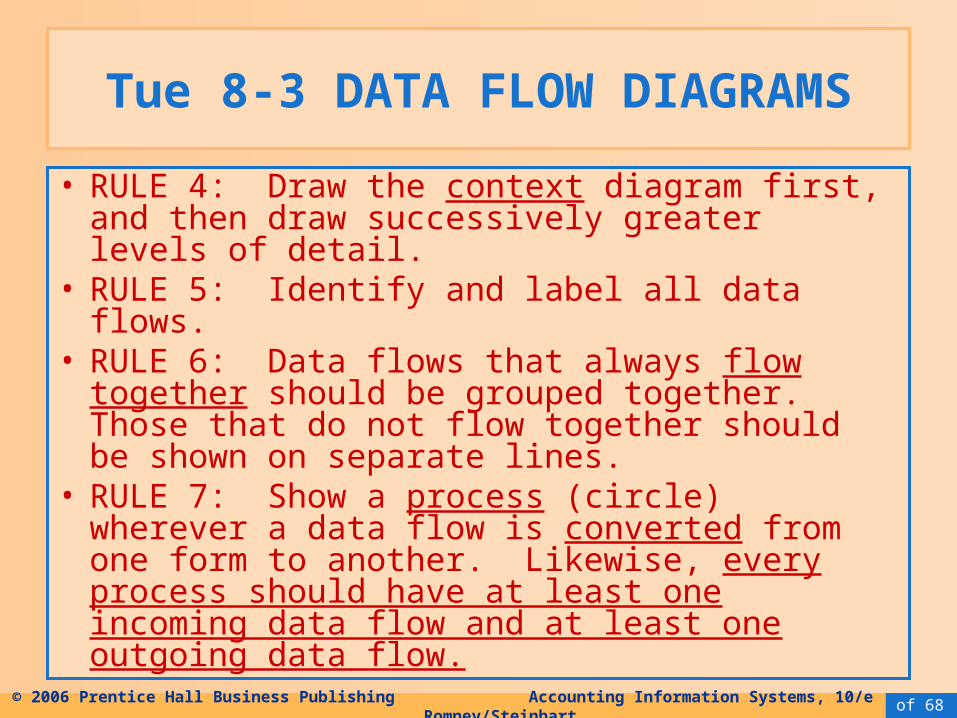
Tue 8-3 DATA FLOW DIAGRAMS
• RULE 4: Draw the context diagram first, and then draw successively greater levels of detail.
• RULE 5: Identify and label all data flows. • RULE 6: Data flows that always flow together
should be grouped together. Those that do not flow together should be shown on separate lines.
• RULE 7: Show a process (circle) wherever a data flow is converted from one form to another. Likewise, every process should have at least one incoming data flow and at least one outgoing data flow.
32 of 68© 2006 Prentice Hall Business Publishing Accounting Information Systems, 10/e Romney/Steinbart
DATA FLOW DIAGRAMS
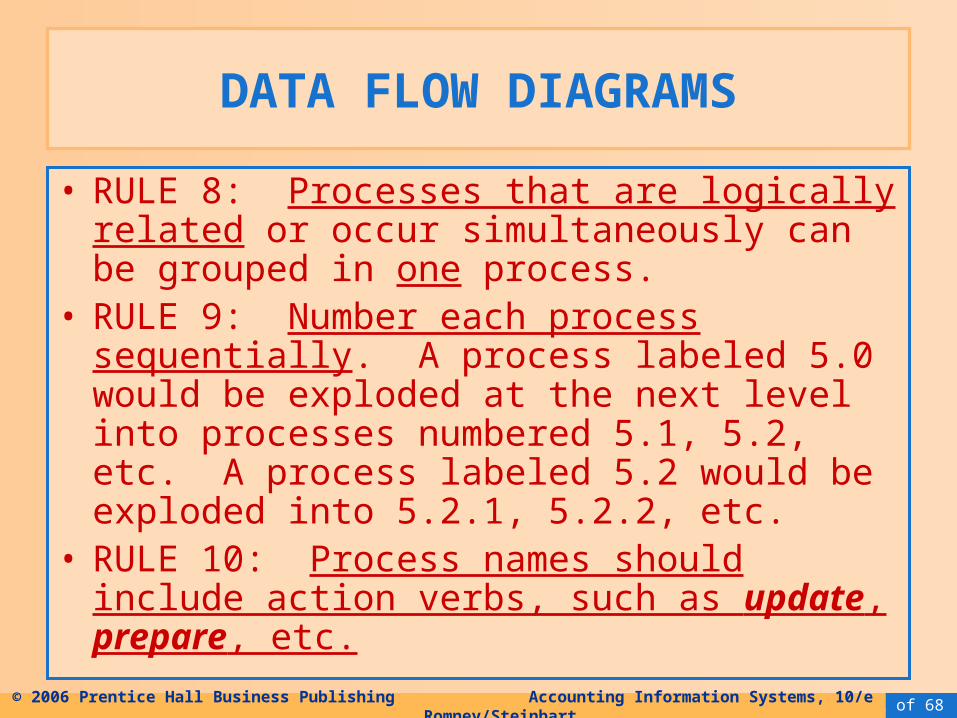
• RULE 8: Processes that are logically related or occur simultaneously can be grouped in one process.
• RULE 9: Number each process sequentially. A process labeled 5.0 would be exploded at the next level into processes numbered 5.1, 5.2, etc. A process labeled 5.2 would be exploded into 5.2.1, 5.2.2, etc.
• RULE 10: Process names should include action verbs, such as update, prepare, etc.
33 of 68© 2006 Prentice Hall Business Publishing Accounting Information Systems, 10/e Romney/Steinbart
DATA FLOW DIAGRAMS
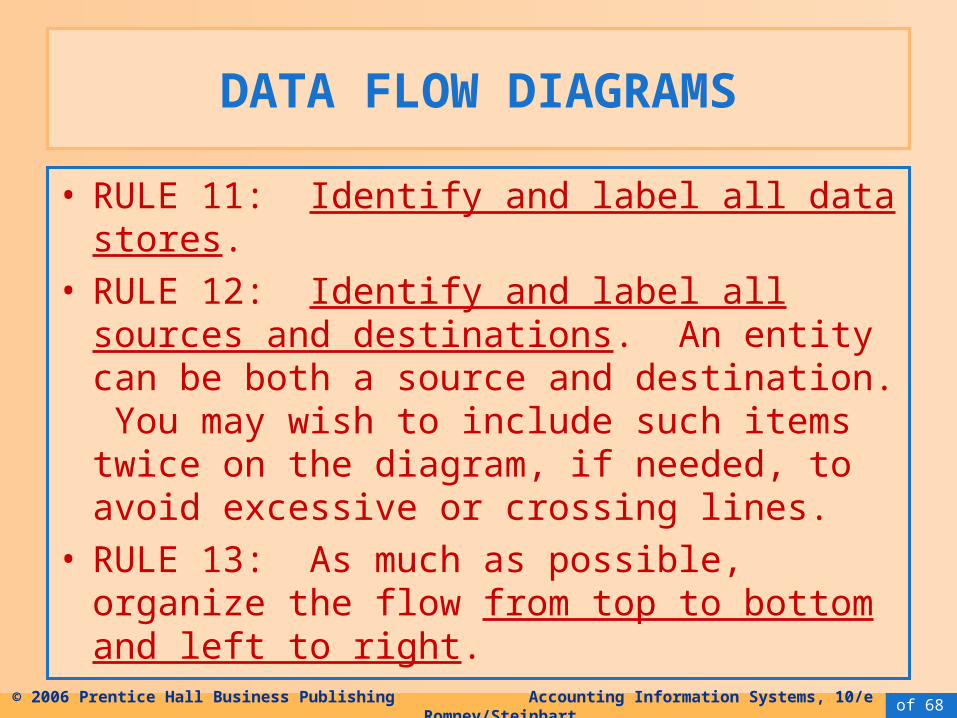
• RULE 11: Identify and label all data stores.• RULE 12: Identify and label all sources and
destinations. An entity can be both a source and destination. You may wish to include such items twice on the diagram, if needed, to avoid excessive or crossing lines.
• RULE 13: As much as possible, organize the flow from top to bottom and left to right.
34 of 68© 2006 Prentice Hall Business Publishing Accounting Information Systems, 10/e Romney/Steinbart
DATA FLOW DIAGRAMS
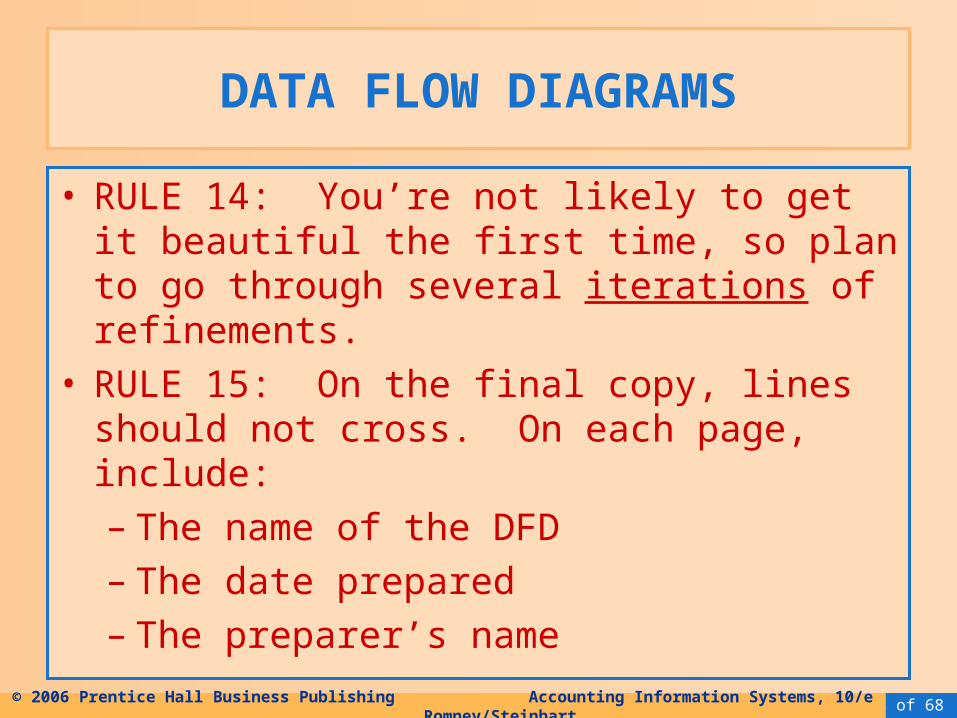
• RULE 14: You’re not likely to get it beautiful the first time, so plan to go through several iterations of refinements.
• RULE 15: On the final copy, lines should not cross. On each page, include:– The name of the DFD– The date prepared– The preparer’s name
35 of 68© 2006 Prentice Hall Business Publishing Accounting Information Systems, 10/e Romney/Steinbart
DATA FLOW DIAGRAMS
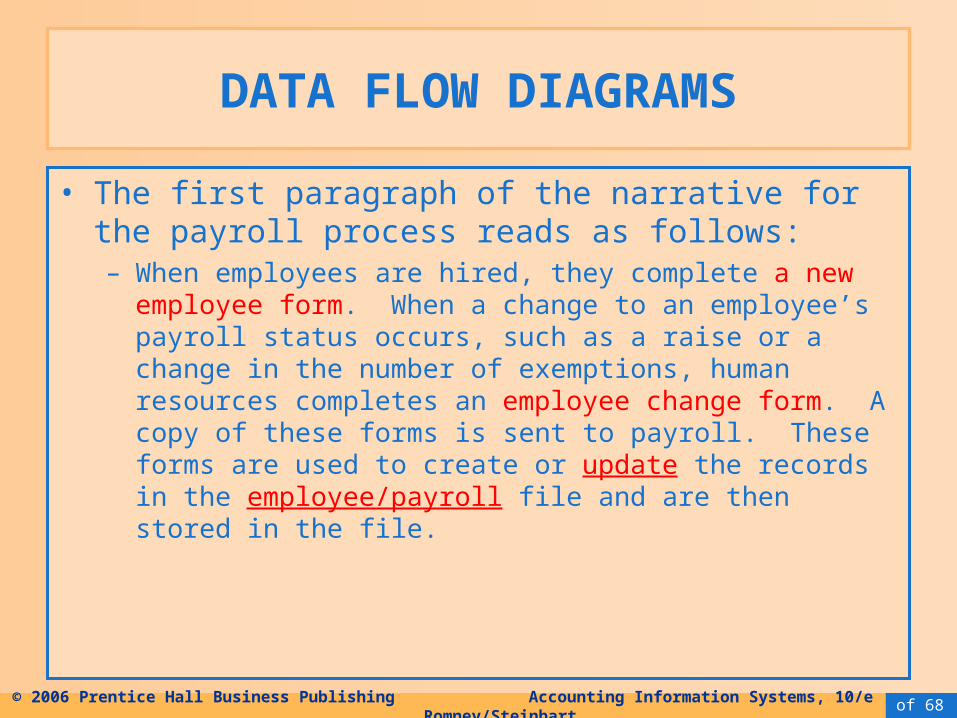
• The first paragraph of the narrative for the payroll process reads as follows:– When employees are hired, they complete a new employee
form. When a change to an employee’s payroll status occurs, such as a raise or a change in the number of exemptions, human resources completes an employee change form. A copy of these forms is sent to payroll. These forms are used to create or update the records in the employee/payroll file and are then stored in the file.
36 of 68© 2006 Prentice Hall Business Publishing Accounting Information Systems, 10/e Romney/Steinbart
DATA FLOW DIAGRAMS
1.0Updateempl.
Payrollfile
2.0Pay
Employ-ees
5.0Update
Gen.Ledger
4.0Pay
taxes
3.0Preparereports
Employee/Payroll file
GeneralLedger
HumanResources
Depart-ments Employees
Bank
Govt.Agencies
Manage-ment
EmployeeChange
form
New employeeform
Timecards
Employeepaychecks
Payrollcheck
PayrollDisburse-ment data
Payroll taxdisb. voucher
Tax report& payment
Payrollreport
37 of 68© 2006 Prentice Hall Business Publishing Accounting Information Systems, 10/e Romney/Steinbart
DATA FLOW DIAGRAMS
• The data flow diagram focuses on the logical flow of data.
• Next, we will discuss flowcharts, which place greater emphasis on physical details.
38 of 68© 2006 Prentice Hall Business Publishing Accounting Information Systems, 10/e Romney/Steinbart
Mon 18-10 FLOWCHARTS
• A flowchart is an analytical technique that describes some aspect of an information system in a clear, concise, and logical manner.
• Flowcharts use a set of standard symbols to depict processing procedures and the flow of data.
39 of 68© 2006 Prentice Hall Business Publishing Accounting Information Systems, 10/e Romney/Steinbart
FLOWCHARTS
• Every shape on a flowchart depicts a unique operation, input, processing activity, or storage medium.
• Before PC’s were common, flowcharts were commonly drawn with templates.
• Now, it is more common to use a software program such as Visio.– Microsoft and Power Point are also used– The software uses pre-drawn shapes, and the
developer drags the shapes into the drawing.

40 of 68© 2006 Prentice Hall Business Publishing Accounting Information Systems, 10/e Romney/Steinbart
Thu 10-3 DOCUMENT FLOWCHARTS
• A document flowchart shows the flow of documents and information among areas of responsibility in an organization.
• These flowcharts trace a document from origin to disposition and show:– Where a document comes from– Where it’s distributed– How it’s used– It’s ultimate disposition– Everything that happens as it flows through the
system
41 of 68© 2006 Prentice Hall Business Publishing Accounting Information Systems, 10/e Romney/Steinbart
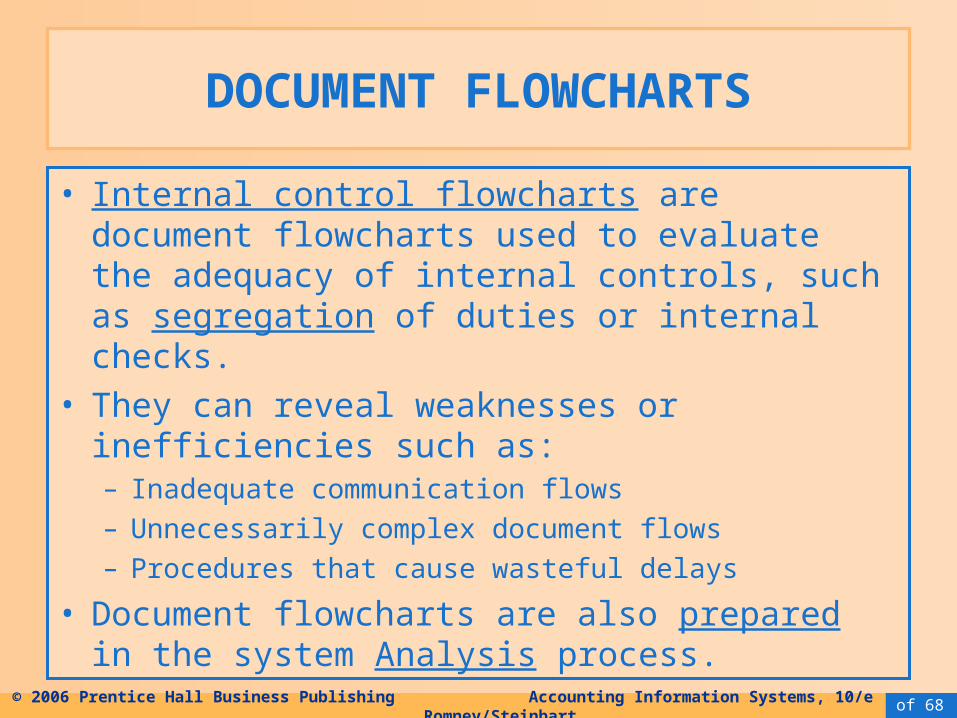
DOCUMENT FLOWCHARTS
• Internal control flowcharts are document flowcharts used to evaluate the adequacy of internal controls, such as segregation of duties or internal checks.
• They can reveal weaknesses or inefficiencies such as:– Inadequate communication flows
– Unnecessarily complex document flows
– Procedures that cause wasteful delays
• Document flowcharts are also prepared in the system Analysis process.
42 of 68© 2006 Prentice Hall Business Publishing Accounting Information Systems, 10/e Romney/Steinbart
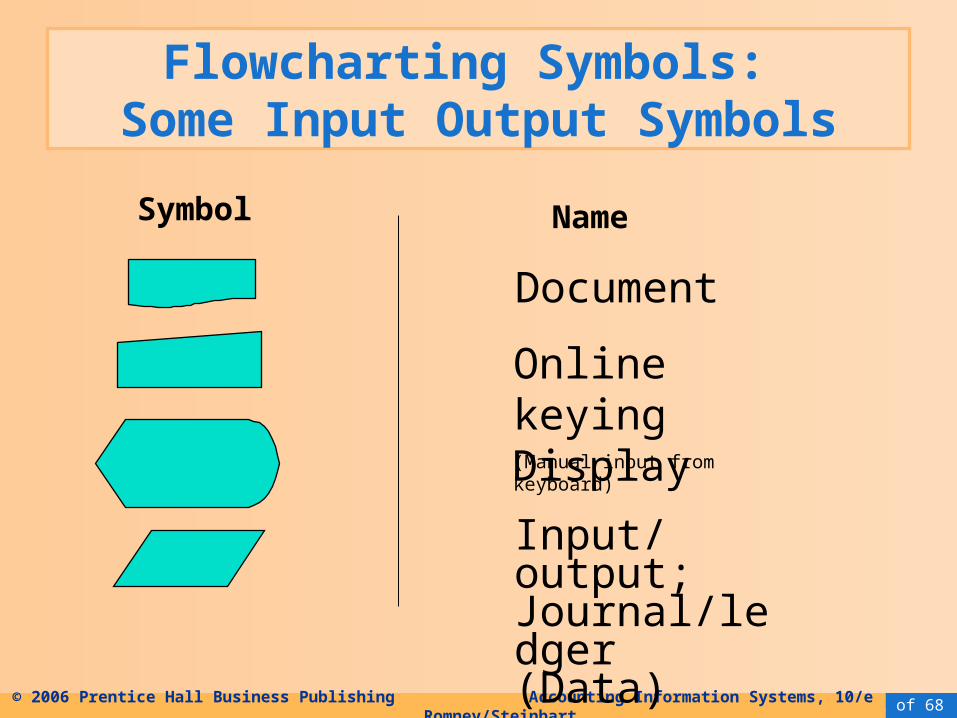
Flowcharting Symbols: Some Input Output Symbols
Document
Online keying(Manual input from keyboard)
Display
Input/output; Journal/ledger (Data)
Symbol Name
43 of 68© 2006 Prentice Hall Business Publishing Accounting Information Systems, 10/e Romney/Steinbart
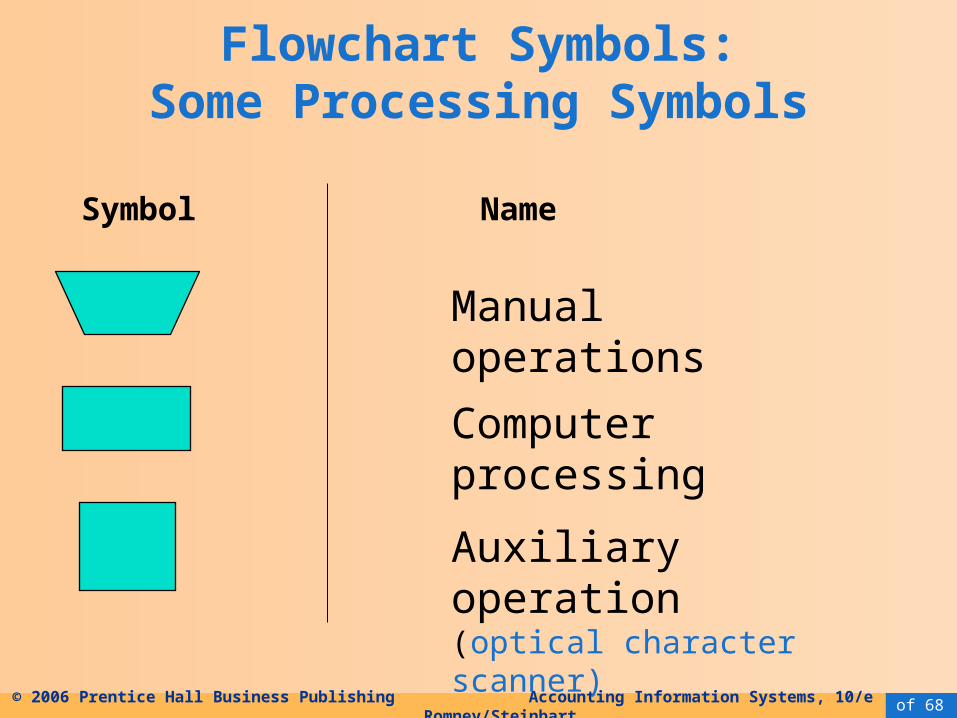
Flowchart Symbols:Some Processing Symbols
Manual operations
Computer processing
Auxiliary operation (optical character scanner)
Symbol Name
44 of 68© 2006 Prentice Hall Business Publishing Accounting Information Systems, 10/e Romney/Steinbart
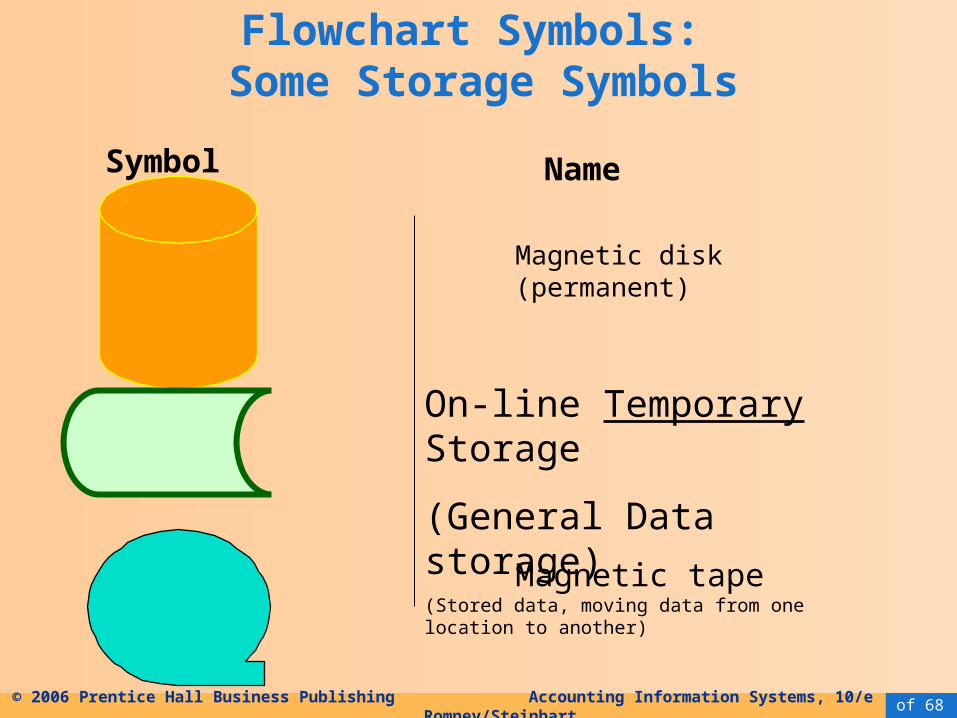
Flowchart Symbols: Some Storage Symbols
Magnetic disk (permanent)
Magnetic tape
Symbol Name
On-line Temporary Storage
(General Data storage)(Stored data, moving data from one location to another)
45 of 68© 2006 Prentice Hall Business Publishing Accounting Information Systems, 10/e Romney/Steinbart
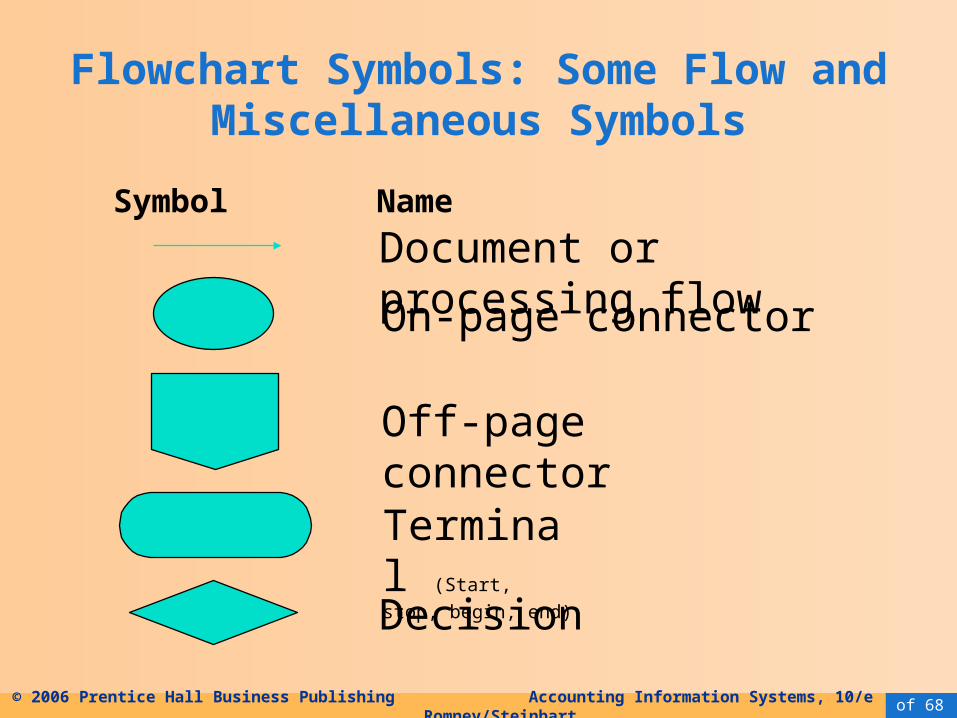
Flowchart Symbols: Some Flow and Miscellaneous Symbols
On-page connector
Off-page connector
Terminal (Start, stop, begin, end)
Decision
Document or processing flowSymbol Name
46 of 68© 2006 Prentice Hall Business Publishing Accounting Information Systems, 10/e Romney/Steinbart
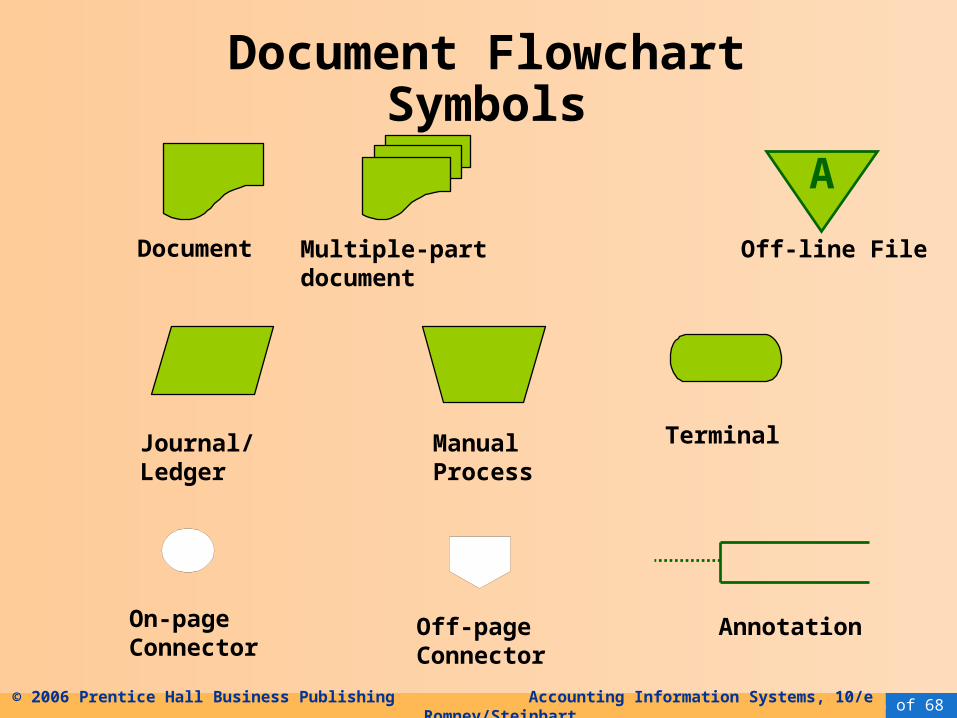
Document Flowchart Symbols
Document Off-line FileMultiple-partdocument
ManualProcess
Journal/Ledger
Terminal
Off-pageConnector
On-pageConnector
A
Annotation
47 of 68© 2006 Prentice Hall Business Publishing Accounting Information Systems, 10/e Romney/Steinbart
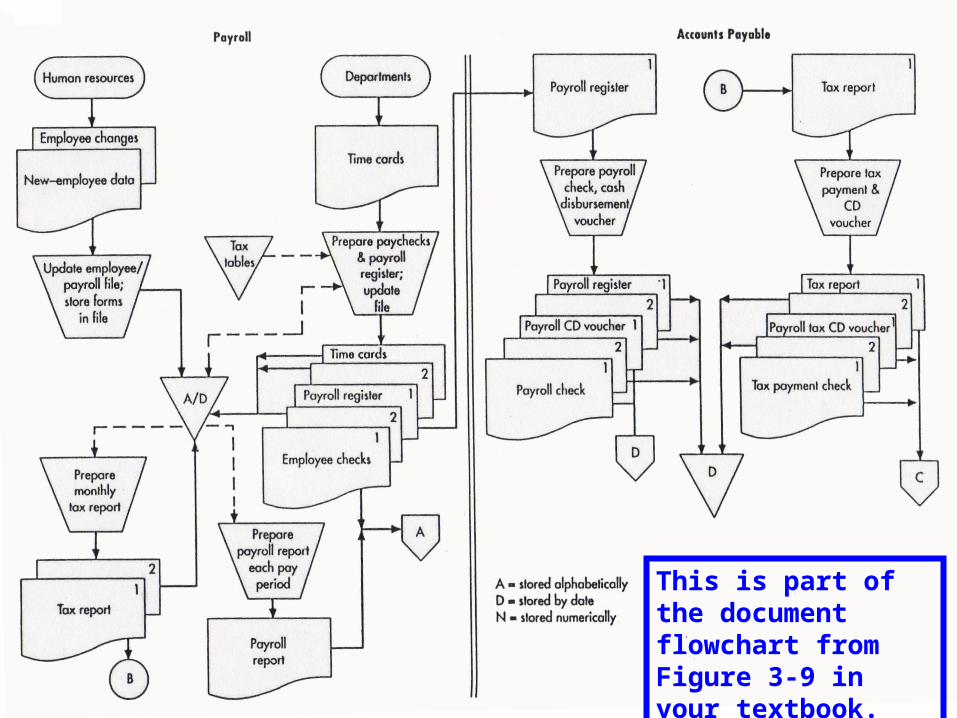
This is part of the document flowchart from Figure 3-9 in your textbook.
48 of 68© 2006 Prentice Hall Business Publishing Accounting Information Systems, 10/e Romney/Steinbart
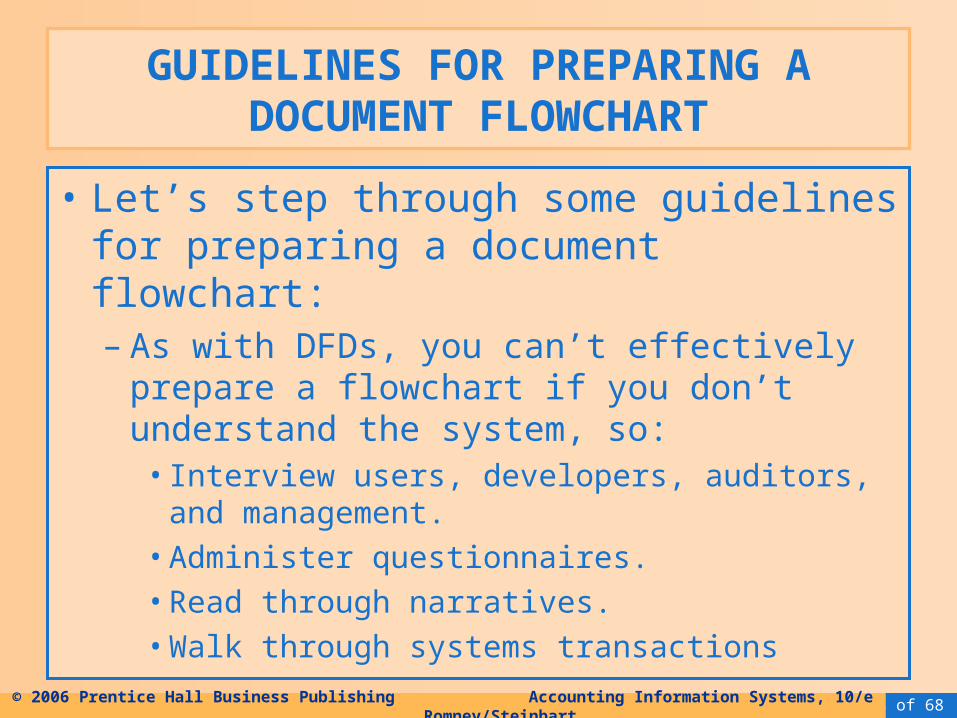
GUIDELINES FOR PREPARING A DOCUMENT FLOWCHART
• Let’s step through some guidelines for preparing a document flowchart:– As with DFDs, you can’t effectively prepare a
flowchart if you don’t understand the system, so:• Interview users, developers, auditors, and
management.• Administer questionnaires.• Read through narratives.• Walk through systems transactions

49 of 68© 2006 Prentice Hall Business Publishing Accounting Information Systems, 10/e Romney/Steinbart
– Identify:• All departments using the system (the parties
who “do” things in the story)• All documents or information flows• All processes performed on the documents
– As you read through a narrative, you may want to mark the preceding items with different shapes (e.g., drawing a rectangle around entities, circling documents, etc.).
Tue 26-10 GUIDELINES FOR PREPARING A DOCUMENT FLOWCHART
50 of 68© 2006 Prentice Hall Business Publishing Accounting Information Systems, 10/e Romney/Steinbart
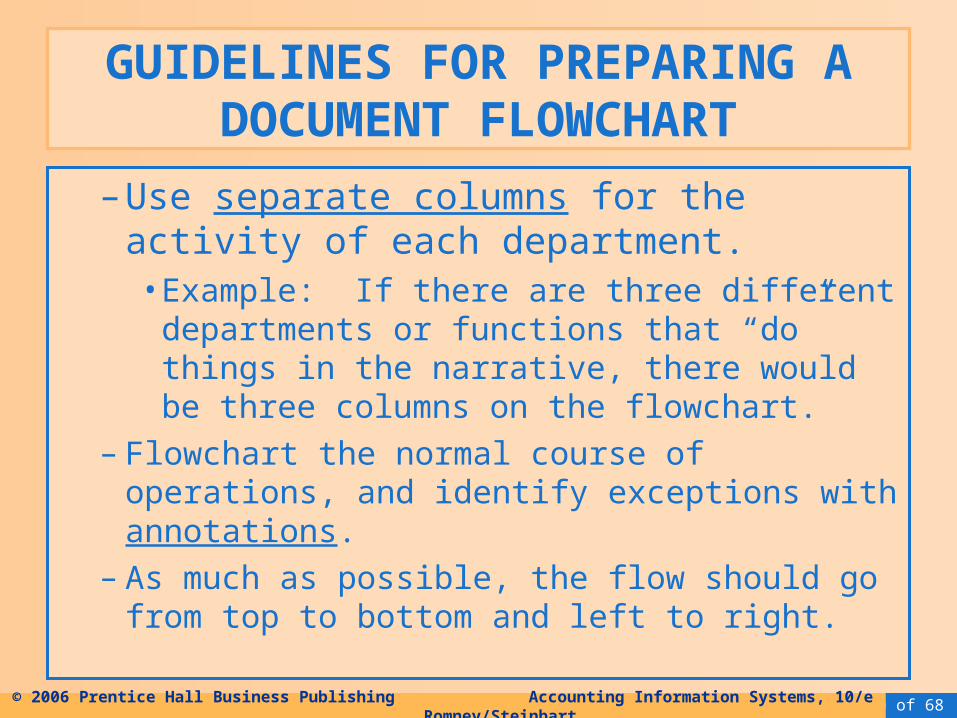
– Use separate columns for the activity of each department.• Example: If there are three different
departments or functions that “do” things in the narrative, there would be three columns on the flowchart.
– Flowchart the normal course of operations, and identify exceptions with annotations.
– As much as possible, the flow should go from top to bottom and left to right.
GUIDELINES FOR PREPARING A DOCUMENT FLOWCHART
51 of 68© 2006 Prentice Hall Business Publishing Accounting Information Systems, 10/e Romney/Steinbart
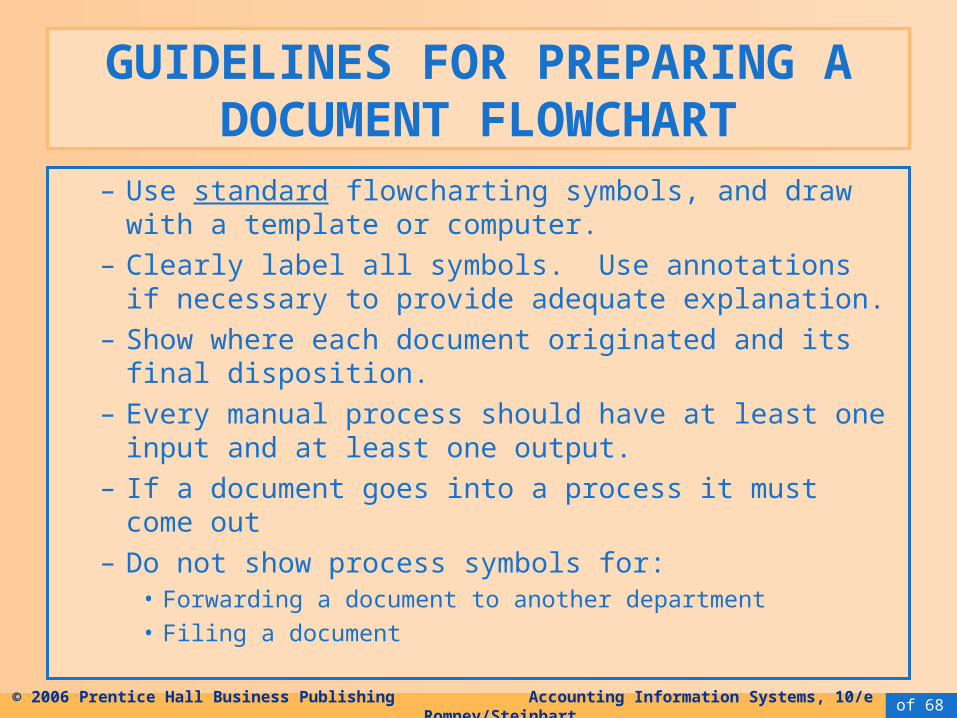
– Use standard flowcharting symbols, and draw with a template or computer.
– Clearly label all symbols. Use annotations if necessary to provide adequate explanation.
– Show where each document originated and its final disposition.
– Every manual process should have at least one input and at least one output.
– If a document goes into a process it must come out– Do not show process symbols for:
• Forwarding a document to another department• Filing a document
GUIDELINES FOR PREPARING A DOCUMENT FLOWCHART
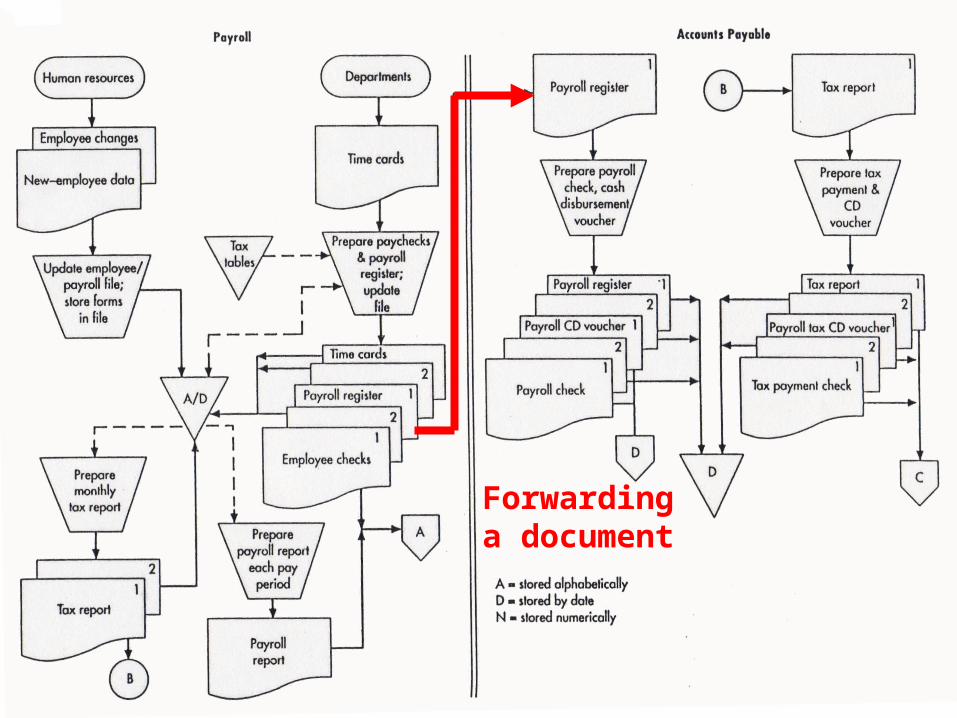
52 of 68© 2006 Prentice Hall Business Publishing Accounting Information Systems, 10/e Romney/Steinbart
Forwardinga document

53 of 68© 2006 Prentice Hall Business Publishing Accounting Information Systems, 10/e Romney/Steinbart
Filinga document
54 of 68© 2006 Prentice Hall Business Publishing Accounting Information Systems, 10/e Romney/Steinbart
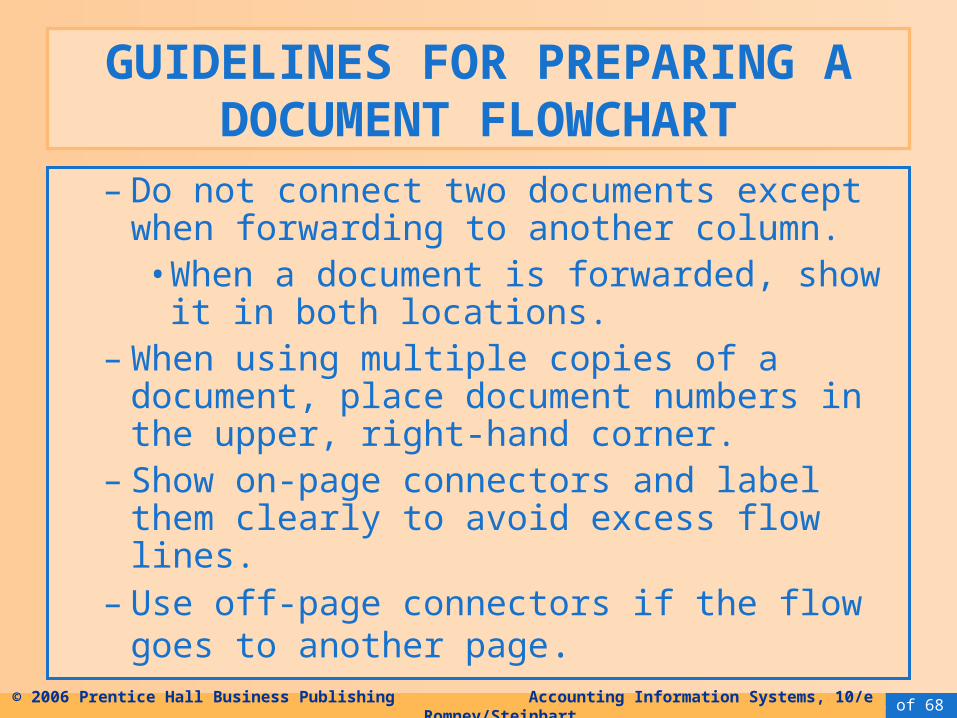
– Do not connect two documents except when forwarding to another column.• When a document is forwarded, show it in
both locations.– When using multiple copies of a document,
place document numbers in the upper, right-hand corner.
– Show on-page connectors and label them clearly to avoid excess flow lines.
– Use off-page connectors if the flow goes to another page.
GUIDELINES FOR PREPARING A DOCUMENT FLOWCHART
55 of 68© 2006 Prentice Hall Business Publishing Accounting Information Systems, 10/e Romney/Steinbart
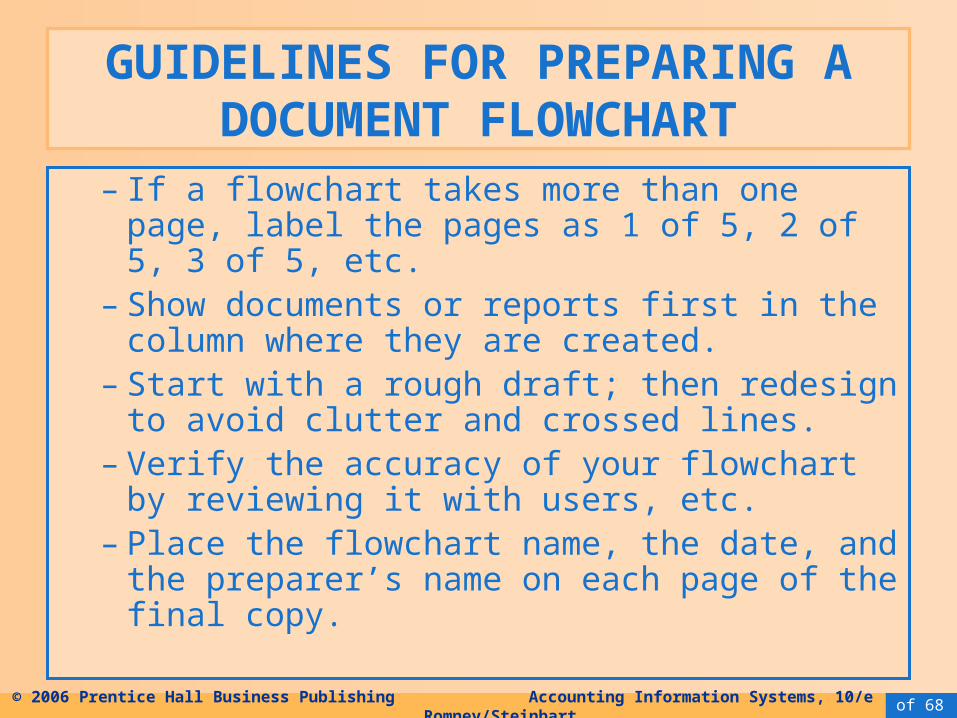
– If a flowchart takes more than one page, label the pages as 1 of 5, 2 of 5, 3 of 5, etc.
– Show documents or reports first in the column where they are created.
– Start with a rough draft; then redesign to avoid clutter and crossed lines.
– Verify the accuracy of your flowchart by reviewing it with users, etc.
– Place the flowchart name, the date, and the preparer’s name on each page of the final copy.
GUIDELINES FOR PREPARING A DOCUMENT FLOWCHART
56 of 68© 2006 Prentice Hall Business Publishing Accounting Information Systems, 10/e Romney/Steinbart
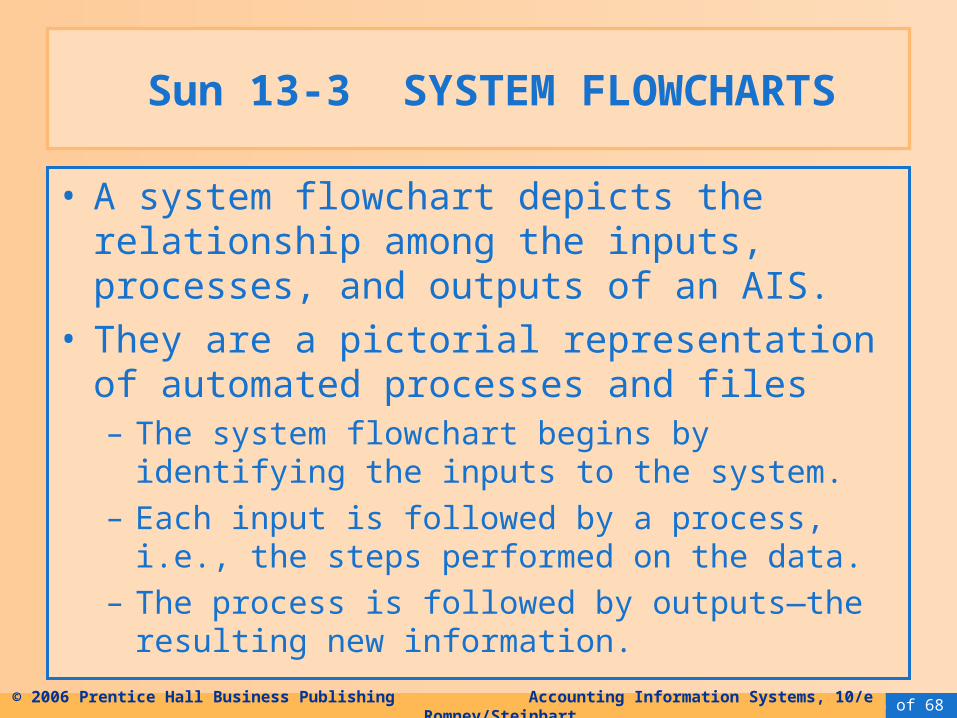
Sun 13-3 SYSTEM FLOWCHARTS
• A system flowchart depicts the relationship among the inputs, processes, and outputs of an AIS.
• They are a pictorial representation of automated processes and files– The system flowchart begins by identifying the inputs
to the system.– Each input is followed by a process, i.e., the steps
performed on the data.– The process is followed by outputs—the resulting new
information.
57 of 68© 2006 Prentice Hall Business Publishing Accounting Information Systems, 10/e Romney/Steinbart
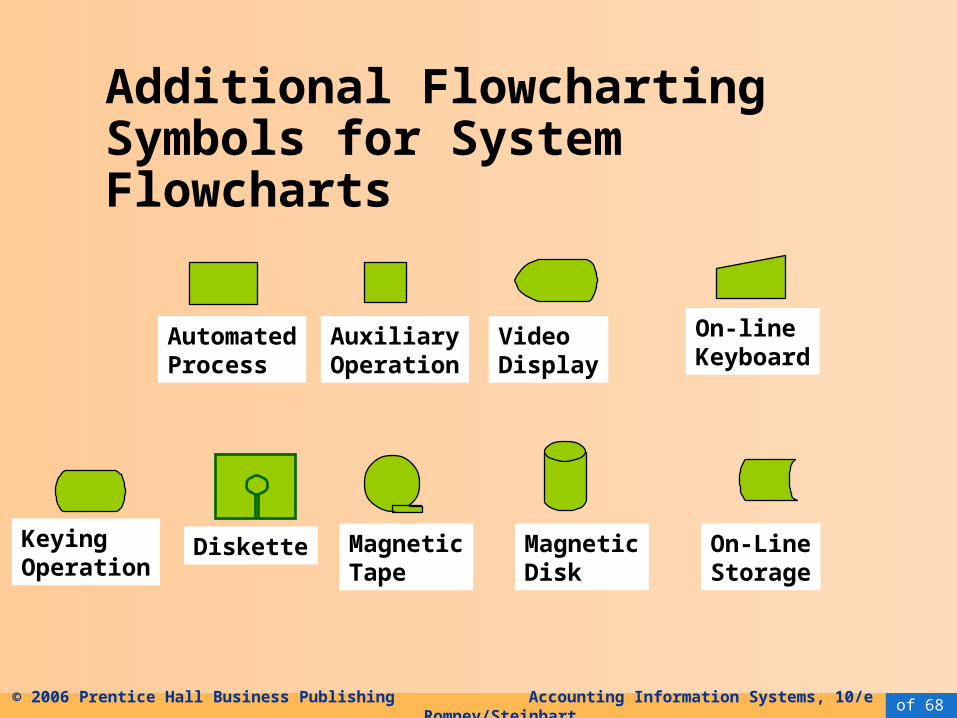
Additional Flowcharting Symbols for System Flowcharts
AutomatedProcess
AuxiliaryOperation
VideoDisplay
On-lineKeyboard
KeyingOperation
MagneticTape
MagneticDisk
On-LineStorage
Diskette
58 of 68© 2006 Prentice Hall Business Publishing Accounting Information Systems, 10/e Romney/Steinbart
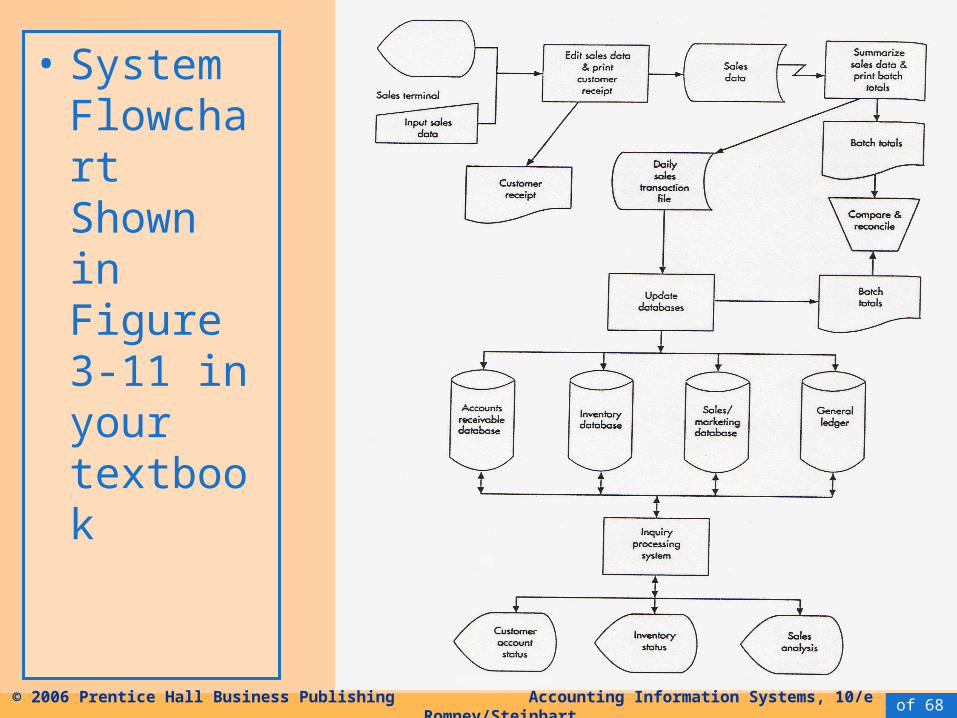
• System Flowchart Shown in Figure 3-11 in your textbook
59 of 68© 2006 Prentice Hall Business Publishing Accounting Information Systems, 10/e Romney/Steinbart
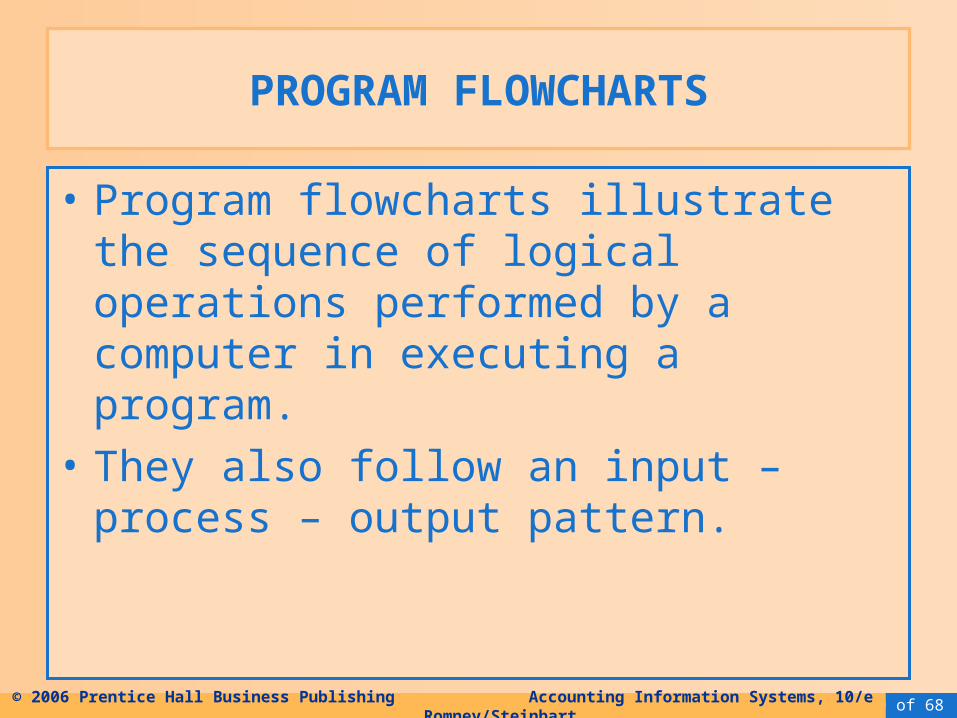
PROGRAM FLOWCHARTS
• Program flowcharts illustrate the sequence of logical operations performed by a computer in executing a program.
• They also follow an input – process – output pattern.
60 of 68© 2006 Prentice Hall Business Publishing Accounting Information Systems, 10/e Romney/Steinbart
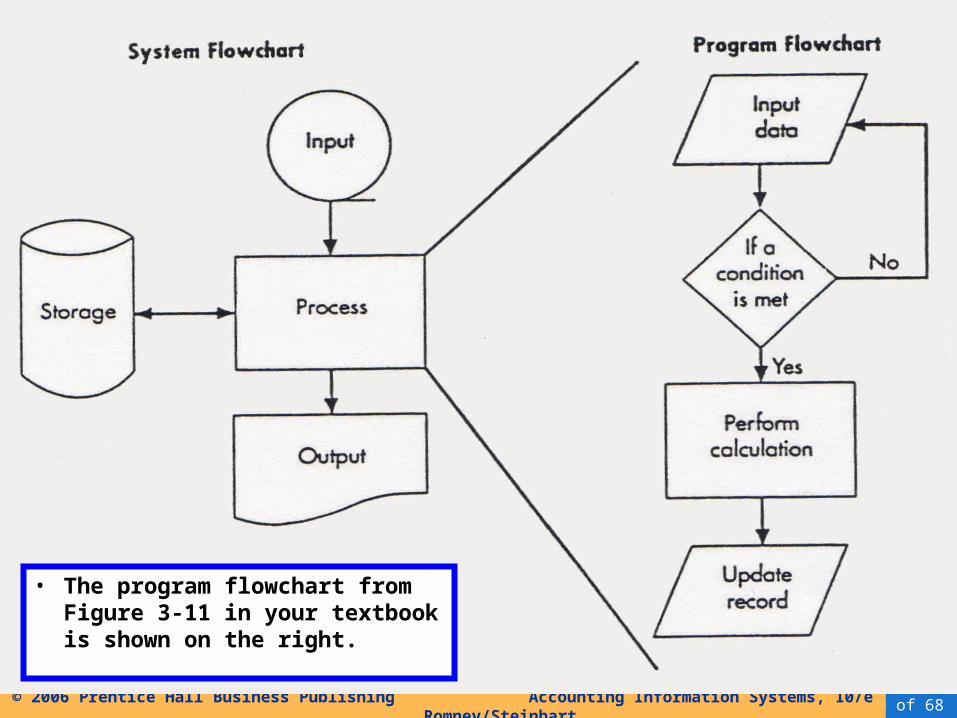
• The program flowchart from Figure 3-11 in your textbook is shown on the right.

61 of 68© 2006 Prentice Hall Business Publishing Accounting Information Systems, 10/e Romney/Steinbart
FLOWCHARTS VS. DFDs
• Now that we’ve examined both flowcharts and DFDs, it may be useful to discuss the differences again.
• DFDs place a heavy emphasis on the logical aspects of a system.
• Flowcharts place more emphasis on the physical characteristics of the system.
62 of 68© 2006 Prentice Hall Business Publishing Accounting Information Systems, 10/e Romney/Steinbart
Mon 15- 3 FLOWCHARTS VS. DFDs
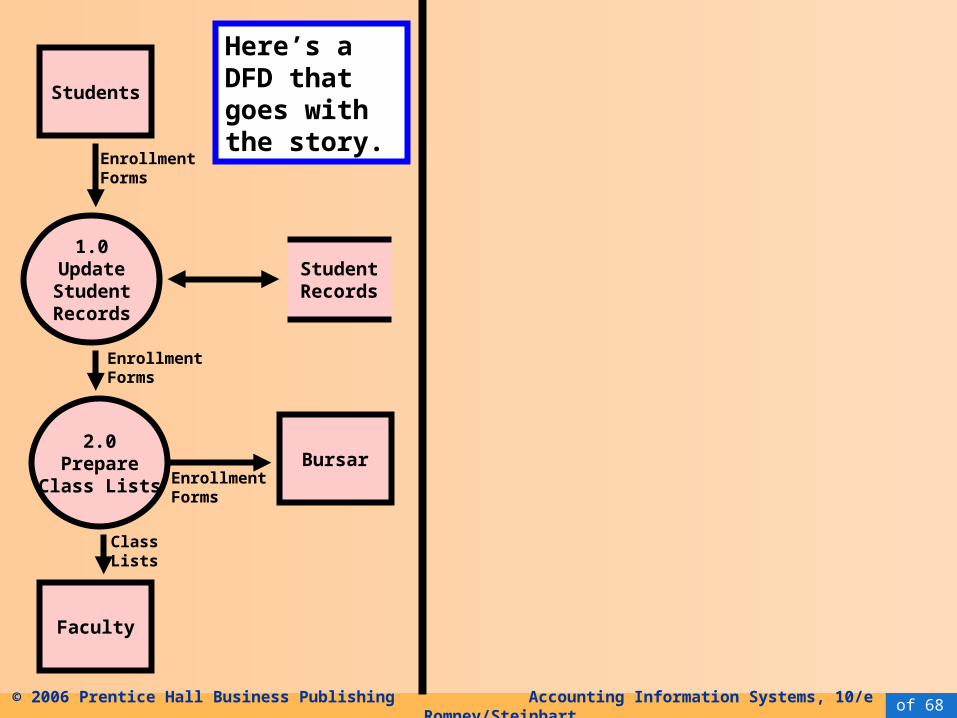
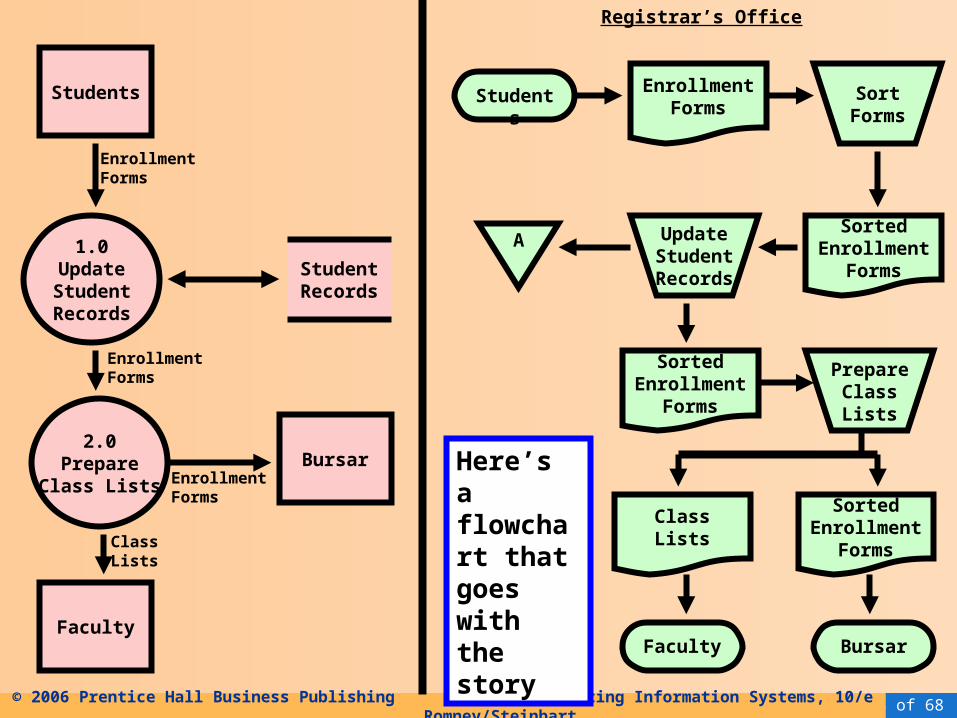
• EXAMPLE: The registrar’s office of a small college receives paper enrollment forms from students. They sort these records alphabetically and then update the student record file to show the new classes. They also prepare class lists from the same data. The sorted enrollment forms are forwarded to the bursar’s office for billing purposes. Class lists are mailed to faculty members.
63 of 68© 2006 Prentice Hall Business Publishing Accounting Information Systems, 10/e Romney/Steinbart
Students
1.0UpdateStudentRecords
2.0Prepare
Class Lists
StudentRecords
Faculty
Bursar
EnrollmentForms
EnrollmentForms
EnrollmentForms
ClassLists
Here’s a DFD that goes with the story.
64 of 68© 2006 Prentice Hall Business Publishing Accounting Information Systems, 10/e Romney/Steinbart
Students
1.0UpdateStudentRecords
2.0Prepare
Class Lists
StudentRecords
Faculty
Bursar
EnrollmentForms
EnrollmentForms
EnrollmentForms
ClassLists
Students
Registrar’s Office
EnrollmentForms
SortForms
SortedEnrollment
Forms
UpdateStudentRecords
A
PrepareClassLists
SortedEnrollment
Forms
ClassLists
SortedEnrollment
Forms
BursarFaculty
Here’s a flowchart that goes with the story
65 of 68© 2006 Prentice Hall Business Publishing Accounting Information Systems, 10/e Romney/Steinbart
Mon 25-10 FLOWCHARTS VS. DFDs
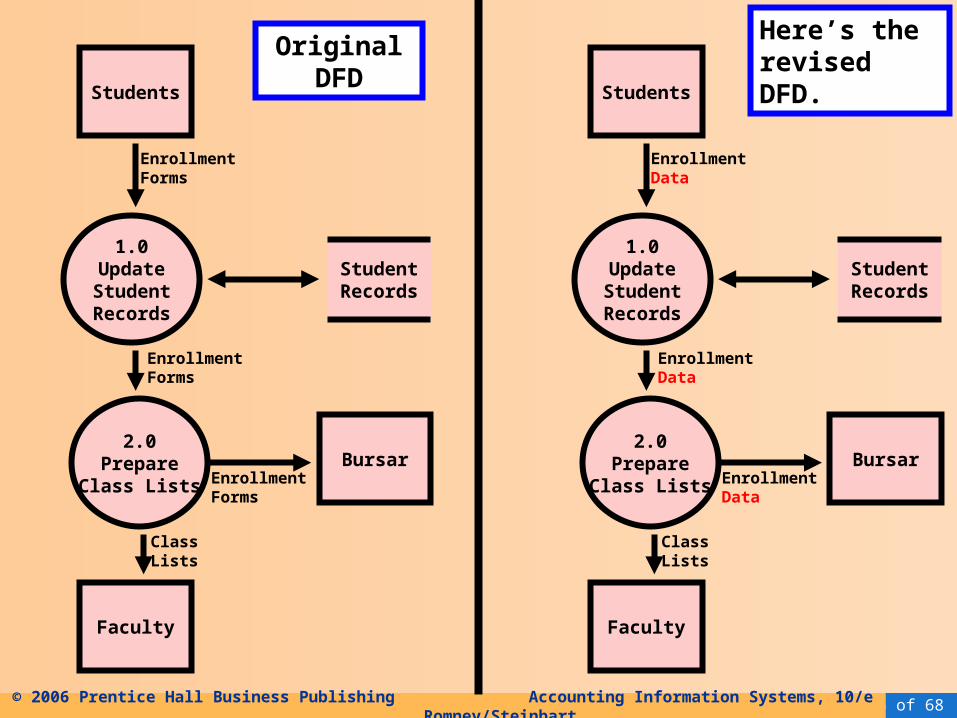
• Now let’s change the story so that students enter enrollment data online. The registrar’s office sends a tape file of the enrollment data to the bursar’s office and continues to send paper class lists to faculty.
66 of 68© 2006 Prentice Hall Business Publishing Accounting Information Systems, 10/e Romney/Steinbart
Students
1.0UpdateStudentRecords
2.0Prepare
Class Lists
StudentRecords
Faculty
Bursar
EnrollmentData
EnrollmentData
EnrollmentData
ClassLists
Original DFD
Students
1.0UpdateStudentRecords
2.0Prepare
Class Lists
StudentRecords
Faculty
Bursar
EnrollmentForms
EnrollmentForms
EnrollmentForms
ClassLists
Here’s the revised DFD.
67 of 68© 2006 Prentice Hall Business Publishing Accounting Information Systems, 10/e Romney/Steinbart
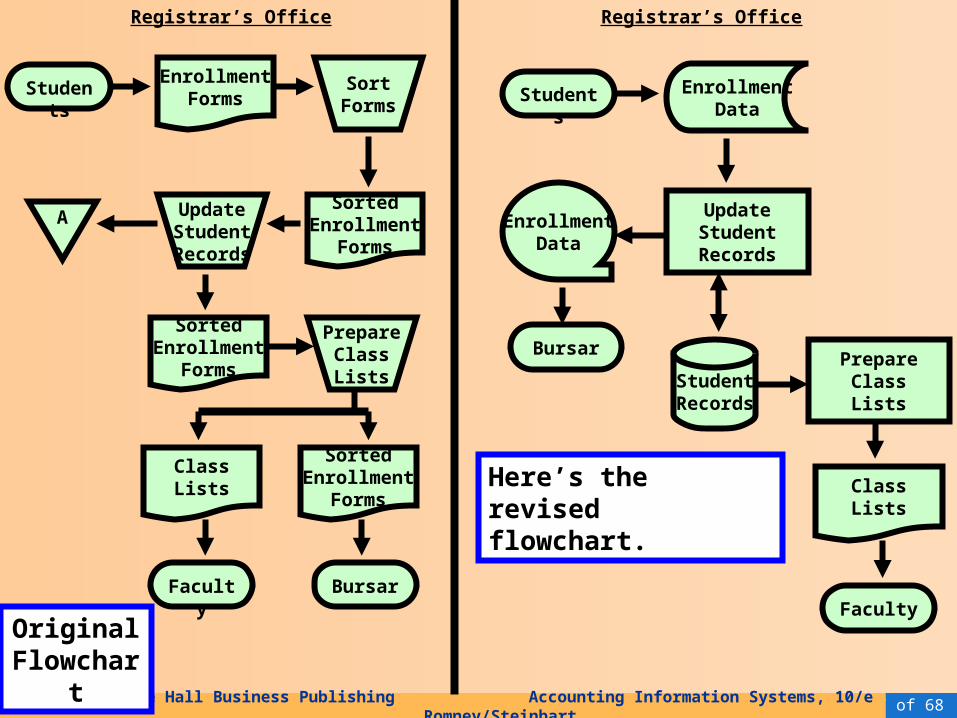
Here’s the revised flowchart.
Registrar’s Office
Students
ClassLists
Bursar
Faculty
EnrollmentData
UpdateStudentRecords
StudentRecords
EnrollmentData
PrepareClassLists
Students
Registrar’s Office
EnrollmentForms
SortForms
SortedEnrollment
Forms
UpdateStudentRecords
A
PrepareClassLists
SortedEnrollment
Forms
ClassLists
SortedEnrollment
Forms
BursarFaculty
Original Flowchart

68 of 68© 2006 Prentice Hall Business Publishing Accounting Information Systems, 10/e Romney/Steinbart
FLOWCHARTS VS. DFDs
• Moral of the Story: Changes in the physical characteristics of the process do affect the flowchart but have little or no impact on the DFD.
• The DFD focuses more on the logic.
• When deciding which tool to employ, consider the information needs of those who will view it.