1 Introduction Background: CS 3810 or equivalent, based on Hennessy and Patterson’s Computer...
23
1 Introduction ckground: CS 3810 or equivalent, based on Hennessy d Patterson’s Computer Organization and Design xt for CS/EE 6810: Hennessy and Patterson’s mputer Architecture, A Quantitative Approach, 5 th Ed pics Measuring performance/cost/power Instruction level parallelism, dynamic and static Memory hierarchy Multiprocessors Storage systems and networks
-
date post
19-Dec-2015 -
Category
Documents
-
view
215 -
download
1
Transcript of 1 Introduction Background: CS 3810 or equivalent, based on Hennessy and Patterson’s Computer...
1
Introduction
• Background: CS 3810 or equivalent, based on Hennessy and Patterson’s Computer Organization and Design
• Text for CS/EE 6810: Hennessy and Patterson’s Computer Architecture, A Quantitative Approach, 5th Edition
• Topics Measuring performance/cost/power Instruction level parallelism, dynamic and static Memory hierarchy Multiprocessors Storage systems and networks
2
Organizational Issues
• Office hours, MEB 3414, by appointment
• TA: Ali Shafiei, office hours and contact info: TBA
• Special accommodations, add/drop policies (see class webpage)
• Class web-page, slides, notes, and class mailing list at http://www.eng.utah.edu/~cs6810
• Grades: Two midterms, 25% each Homework assignments, 50%, you may skip one No tolerance for cheating
3
Lecture 1: Computing Trends, Metrics
• Topics: (Sections 1.1 - 1.5, 1.8 - 1.10)
Technology trends Performance summaries Performance equations

4
Historical Microprocessor Performance
Source: H&P textbook
5
Points to Note
• The 52% growth per year is because of faster clock speeds and architectural innovations (led to 25x higher speed)
• Clock speed increases have dropped to 1% per year in recent years
• The 22% growth includes the parallelization from multiple cores
• Moore’s Law: transistors on a chip double every 18-24 months

6
Clock Speed Increases
Source: H&P textbook
7
Processor Technology Trends
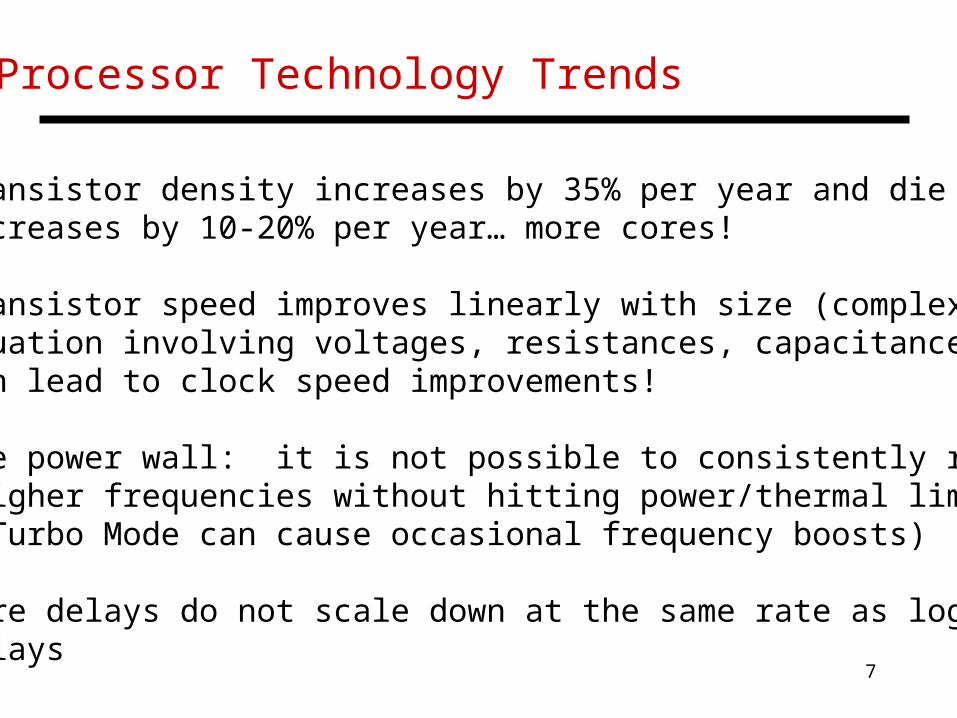
• Transistor density increases by 35% per year and die size increases by 10-20% per year… more cores!
• Transistor speed improves linearly with size (complex equation involving voltages, resistances, capacitances)… can lead to clock speed improvements!
• The power wall: it is not possible to consistently run at higher frequencies without hitting power/thermal limits (Turbo Mode can cause occasional frequency boosts)
• Wire delays do not scale down at the same rate as logic delays
8
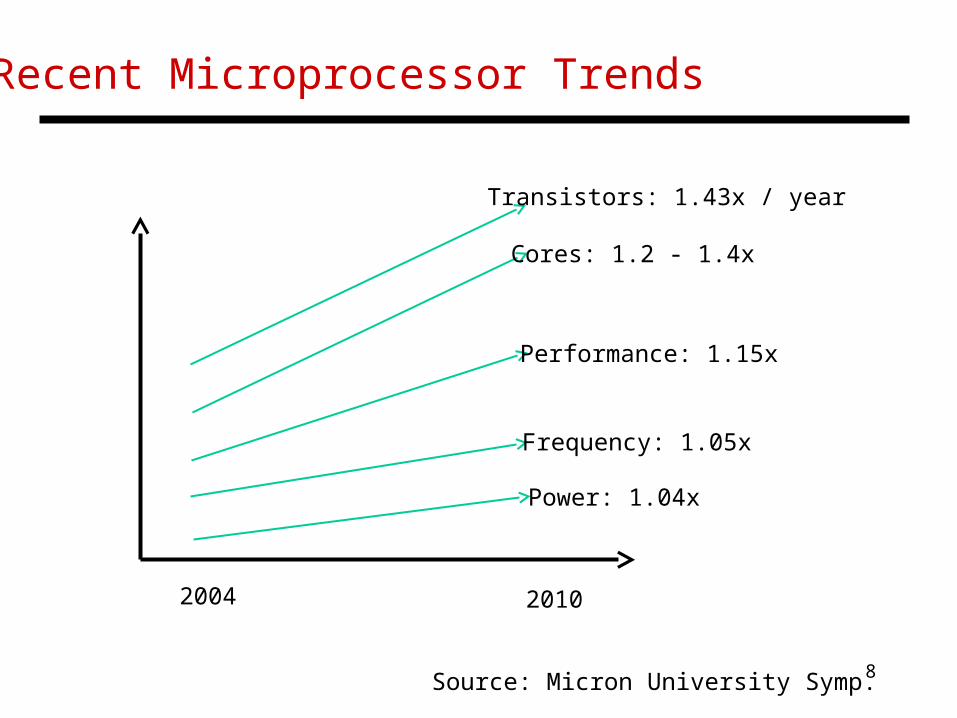
Recent Microprocessor Trends
2004 2010
Source: Micron University Symp.
Transistors: 1.43x / year
Cores: 1.2 - 1.4x
Performance: 1.15x
Frequency: 1.05x
Power: 1.04x
9
What Helps Performance?
• Note: no increase in clock speed
• In a clock cycle, can do more work -- since transistors are faster, transistors are more energy-efficient, and there’s more of them
• Better architectures: finding more parallelism in one thread, better branch prediction, better cache policies, better memory organizations, more thread-level parallelism, etc.
• Core design is undergoing little change, but more cores available per chip; most future innovations will likely be in multi-threaded prog models and memory hierarchies

10
Where Are We Headed?
• Modern trends:
Clock speed improvements are slowing power constraints
Difficult to further optimize a single core for performance Multi-cores: each new processor generation will accommodate more cores Need better programming models and efficient execution for multi-threaded applications Need better memory hierarchies Need greater energy efficiency
11
Modern Processor Today
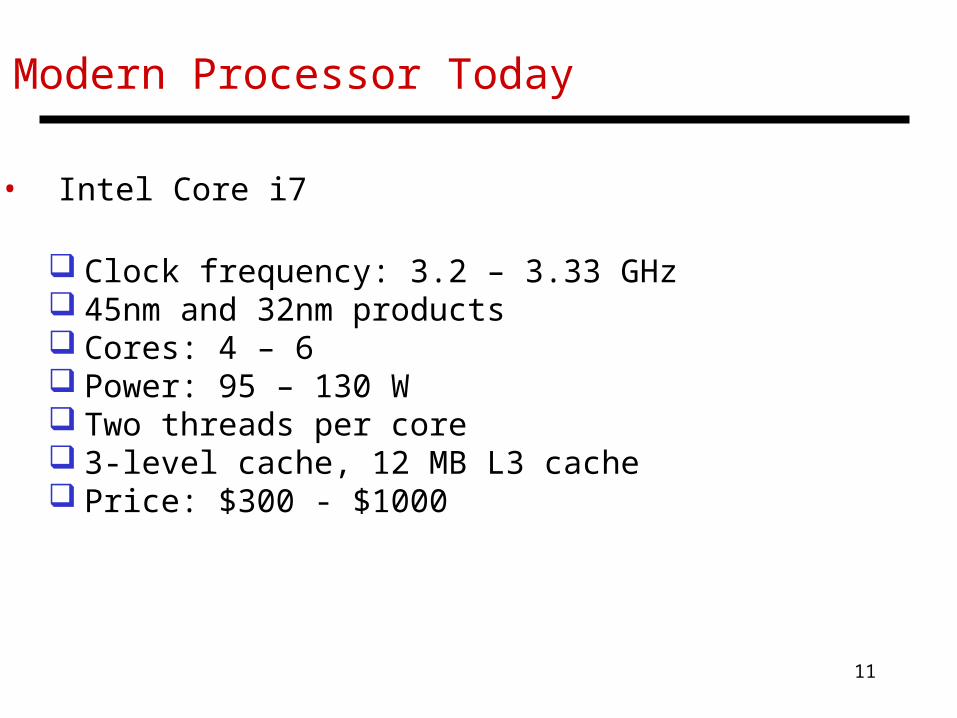
• Intel Core i7
Clock frequency: 3.2 – 3.33 GHz 45nm and 32nm products Cores: 4 – 6 Power: 95 – 130 W Two threads per core 3-level cache, 12 MB L3 cache Price: $300 - $1000
12
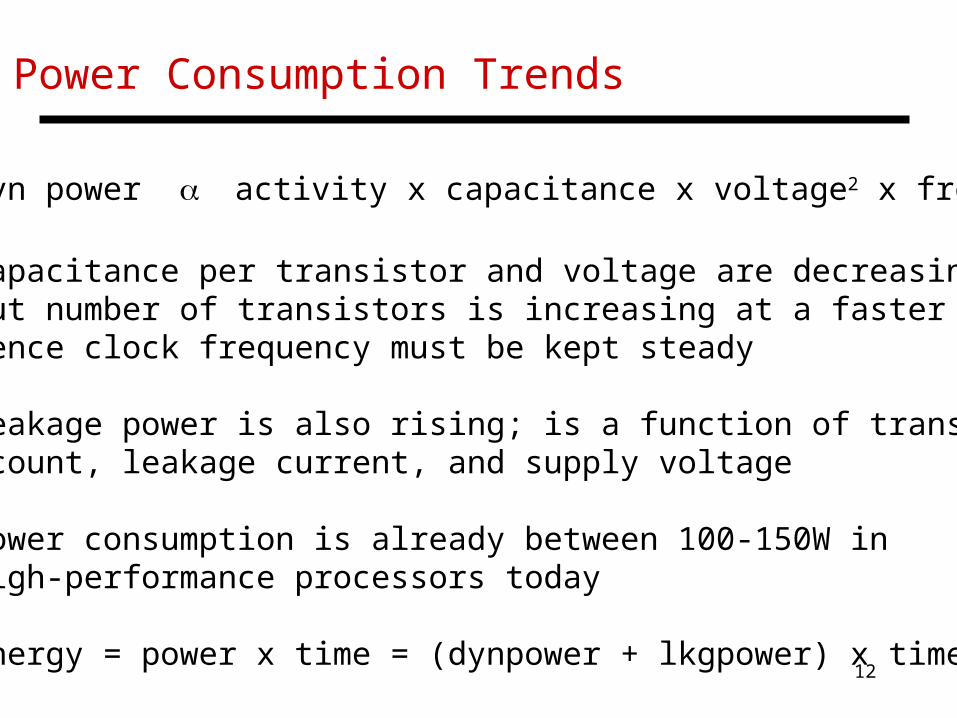
Power Consumption Trends
• Dyn power activity x capacitance x voltage2 x frequency
• Capacitance per transistor and voltage are decreasing, but number of transistors is increasing at a faster rate; hence clock frequency must be kept steady
• Leakage power is also rising; is a function of transistor count, leakage current, and supply voltage
• Power consumption is already between 100-150W in high-performance processors today
• Energy = power x time = (dynpower + lkgpower) x time

13
Power Vs. Energy
• Energy is the ultimate metric: it tells us the true “cost” of performing a fixed task
• Power (energy/time) poses constraints; can only work fast enough to max out the power delivery or cooling solution
• If processor A consumes 1.2x the power of processor B, but finishes the task in 30% less time, its relative energy is 1.2 X 0.7 = 0.84; Proc-A is better, assuming that 1.2x power can be supported by the system

14
Reducing Power and Energy
• Can gate off transistors that are inactive (reduces leakage)
• Design for typical case and throttle down when activity exceeds a threshold
• DFS: Dynamic frequency scaling -- only reduces frequency and dynamic power, but hurts energy
• DVFS: Dynamic voltage and frequency scaling – can reduce voltage and frequency by (say) 10%; can slow a program by (say) 8%, but reduce dynamic power by 27%, reduce total power by (say) 23%, reduce total energy by 17% (Note: voltage drop slow transistor freq drop)

15
Other Technology Trends
• DRAM density increases by 40-60% per year, latency has reduced by 33% in 10 years (the memory wall!), bandwidth improves twice as fast as latency decreases
• Disk density improves by 100% every year, latency improvement similar to DRAM
•Emergence of NVRAM technologies that can provide a bridge between DRAM and hard disk drives
16
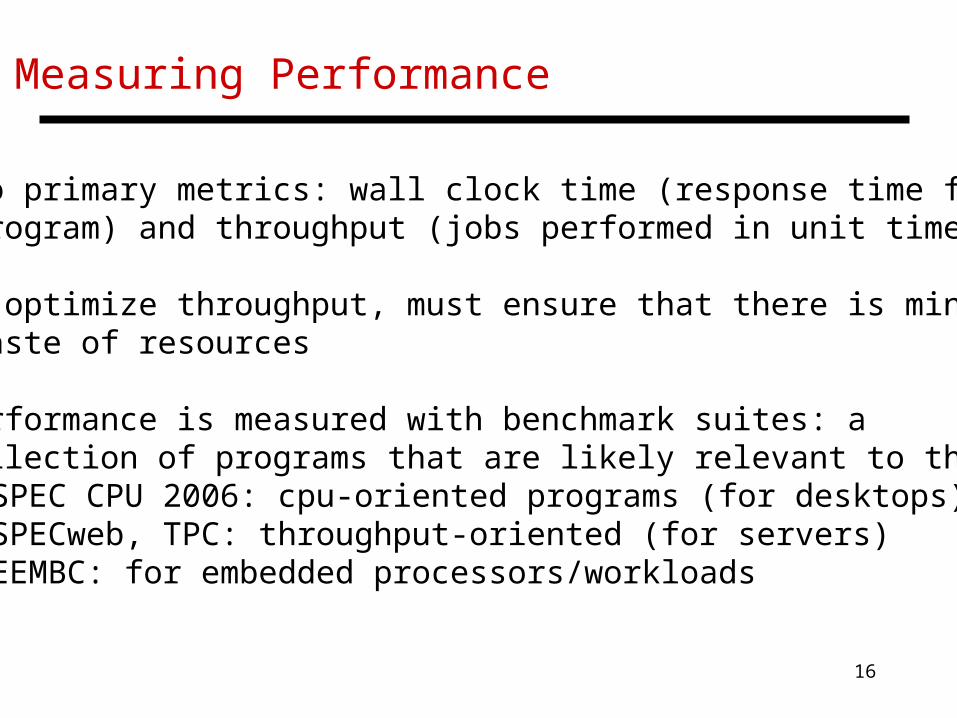
Measuring Performance
• Two primary metrics: wall clock time (response time for a program) and throughput (jobs performed in unit time)
• To optimize throughput, must ensure that there is minimal waste of resources
• Performance is measured with benchmark suites: a collection of programs that are likely relevant to the user
SPEC CPU 2006: cpu-oriented programs (for desktops) SPECweb, TPC: throughput-oriented (for servers) EEMBC: for embedded processors/workloads
17
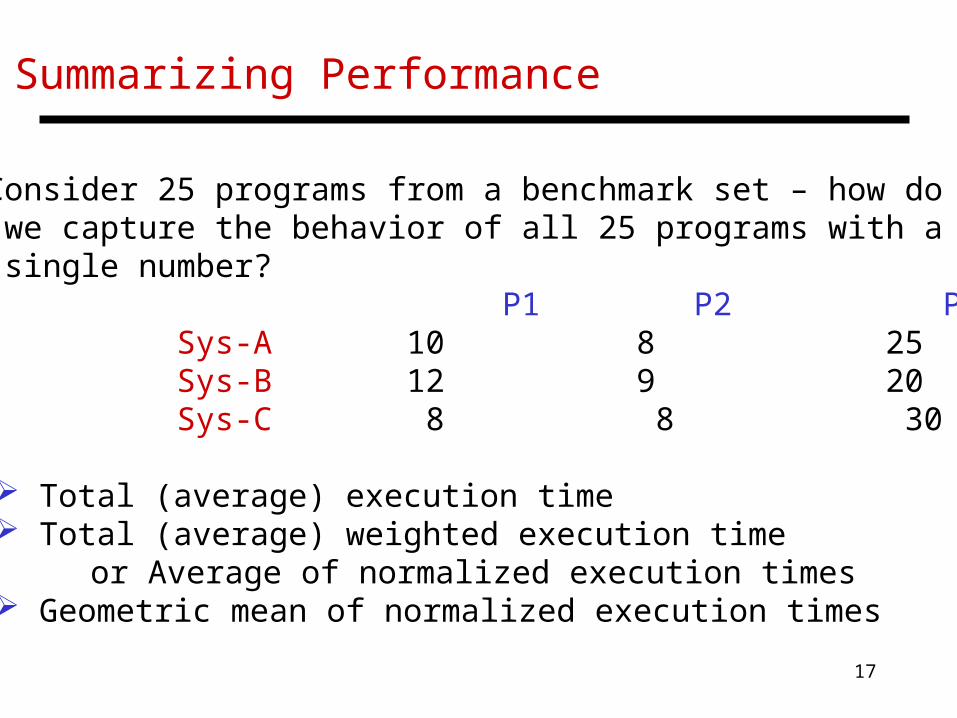
Summarizing Performance
• Consider 25 programs from a benchmark set – how do we capture the behavior of all 25 programs with a single number? P1 P2 P3 Sys-A 10 8 25 Sys-B 12 9 20 Sys-C 8 8 30
Total (average) execution time Total (average) weighted execution time or Average of normalized execution times Geometric mean of normalized execution times
18
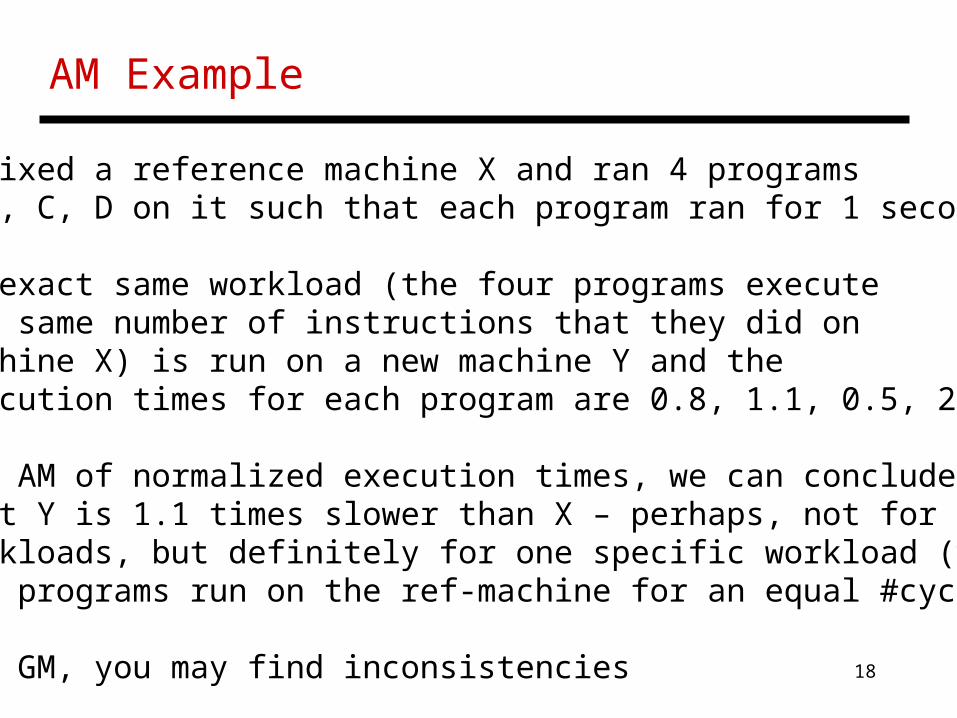
AM Example
• We fixed a reference machine X and ran 4 programs A, B, C, D on it such that each program ran for 1 second
• The exact same workload (the four programs execute the same number of instructions that they did on machine X) is run on a new machine Y and the execution times for each program are 0.8, 1.1, 0.5, 2
• With AM of normalized execution times, we can conclude that Y is 1.1 times slower than X – perhaps, not for all workloads, but definitely for one specific workload (where all programs run on the ref-machine for an equal #cycles)
• With GM, you may find inconsistencies
19
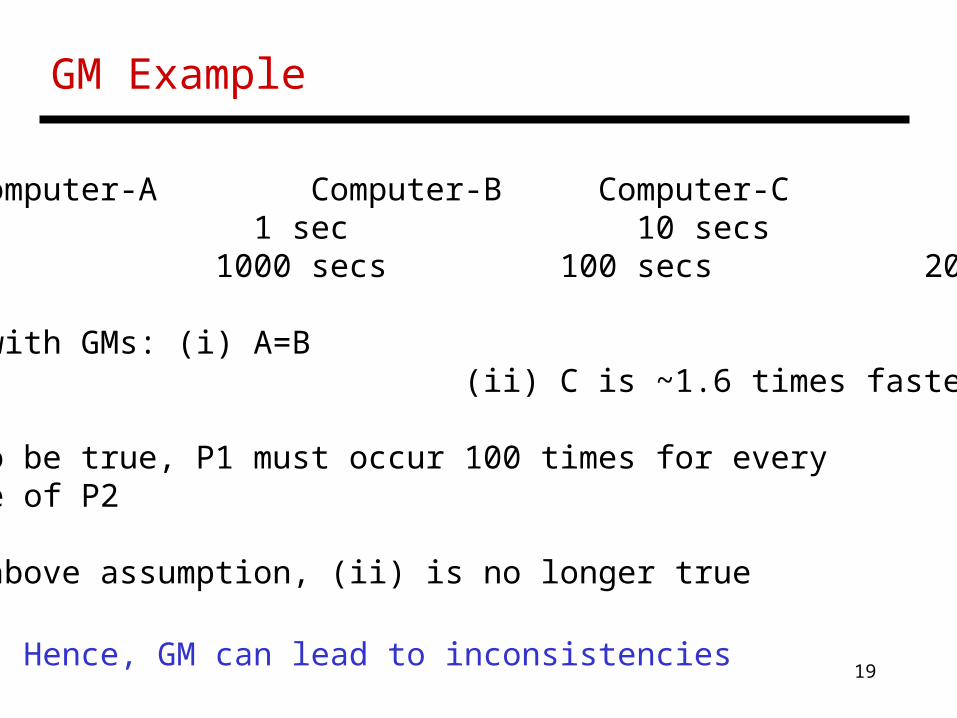
GM Example
Computer-A Computer-B Computer-CP1 1 sec 10 secs 20 secsP2 1000 secs 100 secs 20 secs
Conclusion with GMs: (i) A=B (ii) C is ~1.6 times faster
• For (i) to be true, P1 must occur 100 times for every occurrence of P2
• With the above assumption, (ii) is no longer true
Hence, GM can lead to inconsistencies
20
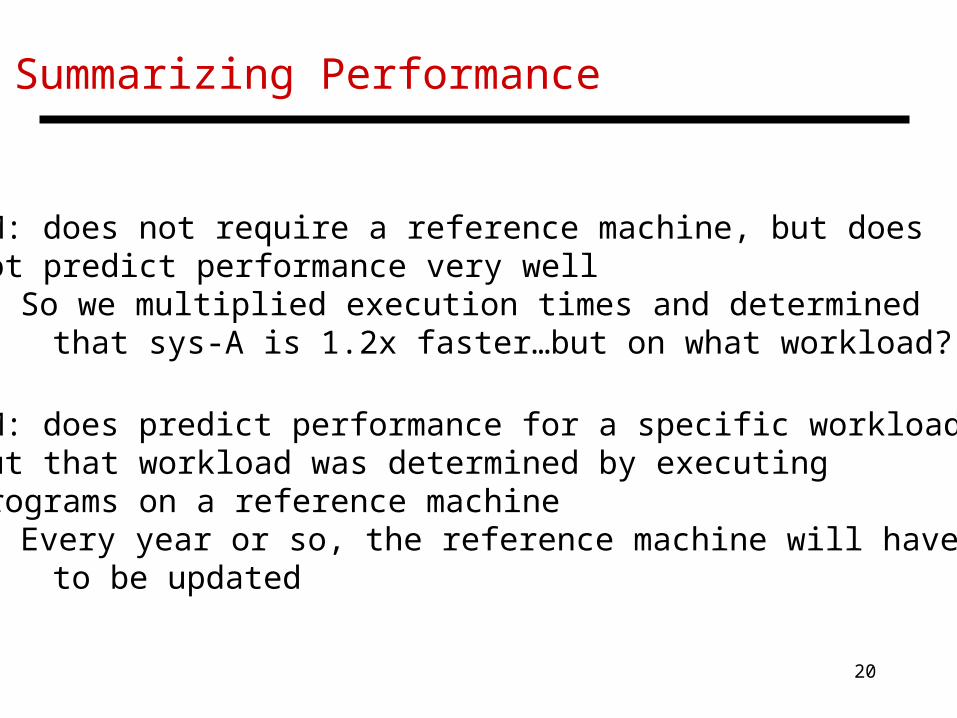
Summarizing Performance
• GM: does not require a reference machine, but does not predict performance very well
So we multiplied execution times and determined that sys-A is 1.2x faster…but on what workload?
• AM: does predict performance for a specific workload, but that workload was determined by executing programs on a reference machine
Every year or so, the reference machine will have to be updated

21
Normalized Execution Times
• Advantage of GM: no reference machine required
• Disadvantage of GM: does not represent any “real entity” and may not accurately predict performance
• Disadvantage of AM of normalized: need weights (which may change over time)
• Advantage: can represent a real workload
22
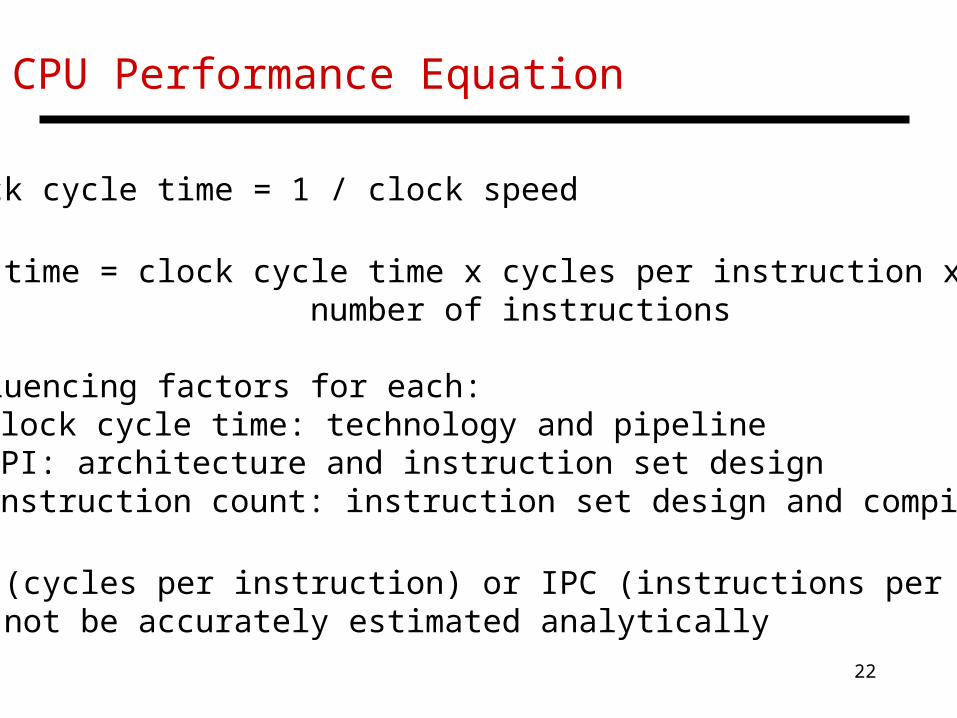
CPU Performance Equation
• Clock cycle time = 1 / clock speed
• CPU time = clock cycle time x cycles per instruction x number of instructions
• Influencing factors for each: clock cycle time: technology and pipeline CPI: architecture and instruction set design instruction count: instruction set design and compiler
• CPI (cycles per instruction) or IPC (instructions per cycle) can not be accurately estimated analytically

23
Title
• Bullet