1 Institutional Data: Where We Win, Where We Face Challenges Dr. Kenyatta Phelps Brailsford College...
18
1 Institutional Data: Where We Win, Where We Face Challenges Dr. Kenyatta Phelps Brailsford College of Arts & Sciences Mr. Anthony Adam Office of Institutional Research
-
Upload
christiana-austin -
Category
Documents
-
view
214 -
download
0
Transcript of 1 Institutional Data: Where We Win, Where We Face Challenges Dr. Kenyatta Phelps Brailsford College...

1
Institutional Data: Where We Win, Where We Face
Challenges
Dr. Kenyatta PhelpsBrailsford College of Arts & Sciences
Mr. Anthony AdamOffice of Institutional Research

2
What is Assessment?
• Process of gathering information to systematically gauge institutional & program effectiveness to document & improve student learning, knowledge, behaviors, and skills.

3
Types of Assessments• Direct assessments require the use of direct
examination or observation of student knowledge or skills against measurable learning outcomes.
• Indirect assessments ask students to reflect on their academic experience and indicate if they believe they have learned and changed.

4
Examples of Direct Assessments– Certification Exams/Licensure Exams – National Major Field Achievement Tests– Course Embedded Assessments – Pre and Posttests
– Alumni Survey – Graduation and Retention Rates – Focus Groups – Exit Interviews
Examples of Indirect Assessments
5
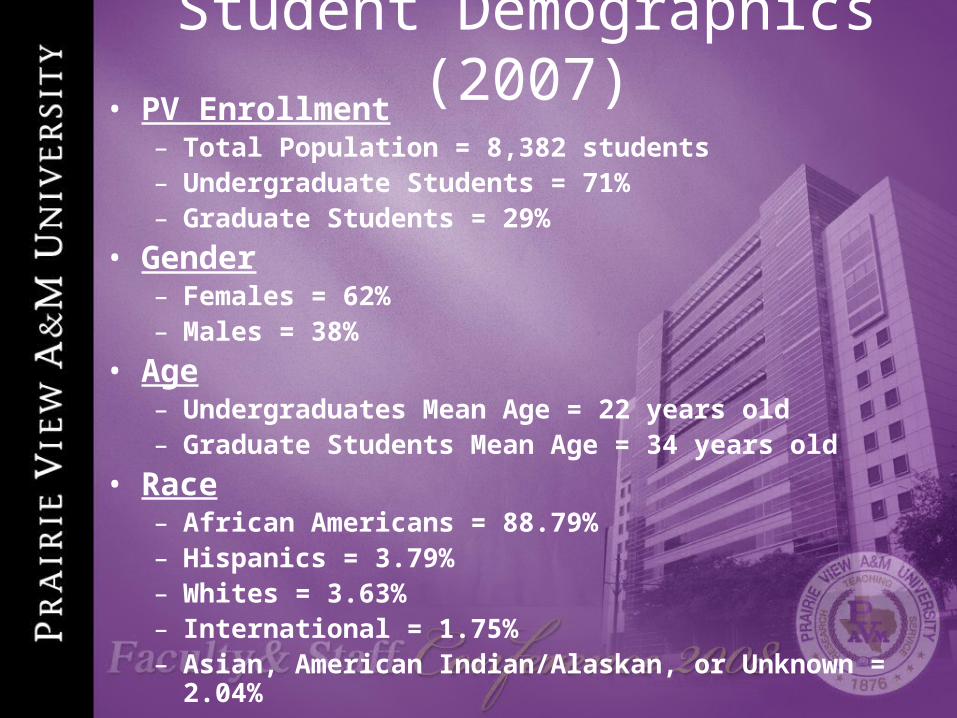
Student Demographics (2007)• PV Enrollment
– Total Population = 8,382 students– Undergraduate Students = 71% – Graduate Students = 29%
• Gender– Females = 62% – Males = 38%
• Age– Undergraduates Mean Age = 22 years old– Graduate Students Mean Age = 34 years old
• Race– African Americans = 88.79%– Hispanics = 3.79%– Whites = 3.63%– International = 1.75% – Asian, American Indian/Alaskan, or Unknown = 2.04%

6
Select Survey & Performance ResultsNational Survey of Student EngagementMeasure of Academic Proficiency & ProgressGrade Distribution Report
Where We Win, Where We Face Challenges

7
NSSE Survey Content
Student Learning & Development
Student Behaviors in College
Student Reactions to College
Institutional Actions & Requirements
Student Background Information

8
Percent of Students Who Participated in High-Impact Educational Practices at Prairie View A&M University and
Selected Peer Institutions13%
23%
9%
23%
23%
17%
9%
26%
17%
17%
12%
33%
16%
20%
16%
36%
0% 25% 50% 75% 100%
LearningCommunities
Researchwith Faculty
Study Abroad
CulminatingSenior
Experiences
Fir
st-y
ear
stu
den
tsS
enio
rs
Prairie View A & M U Texas A&M System
Carnegie Peers NSSE 2007
NSSE 2007

9
Highest Performing Areas
NSSE 2007
Bench. 1 Percent of students who...
Prairie View A &
M U
Texas A&M System
Carnegie Peers
NSSE 2007
LAC 74% 51% 54% 54%
LAC 43% 14% 16% 16%
ACL 62% 42% 60% 59%
ACL 54% 23% 34% 32%
SFI 54% 28% 30% 30%
ACL 89% 59% 66% 62%
ACL 45% 24% 21% 23%
ACL 40% 18% 19% 18%
SFI 43% 22% 22% 24%
EEE 44% 25% 22% 27%
Asked questions/contributed to class discussions2
Talked about career plans with a faculty member or advisor2
Comparison Groups
Worked harder than you expected to meet an instructor's expectations2
Wrote at least one paper or report of 20 pages or more
Made a class presentation2
Spent more than 5 hours/week participating in co-curricular activities
Made a class presentation2
Tutored or taught other students (paid or voluntary)2
Did a community-based project as part of a regular course2
Worked with faculty members on activities other than coursework2
Highest Performing Areas
Quest.
1o.
1r.
3c.
1a.
9d.
First-Year Students
Seniors
1b.
1j.
1k.
1s.
1b.

10
Lowest Performing Areas
Bench. 1 Percent of students who...
Prairie View A &
M U
Texas A&M System
Carnegie Peers
NSSE 2007
LAC 19% 27% 34% 37%
LAC 42% 56% 52% 58%
EEE 33% 52% 36% 40%
EEE 13% 23% 17% 16%
SCE 75% 85% 79% 81%
LAC 14% 25% 32% 33%
LAC 70% 80% 79% 80%
SCE 72% 86% 82% 83%
SCE 65% 81% 80% 80%
SCE 56% 62% 55% 55%
Participated in community service or volunteer work
Participated in a learning community
Positively rated their relationships with other students3
Positively rated their relationships with admin. personnel and offices3
Wrote more than 10 papers or reports of fewer than 5 pages
8c.
Positively rated their relationships with faculty members3
First-Year Students
Seniors
Quest.
3a.
9a.
7b.
7c.
8a.
Comparison GroupsLowest Performing Areas
3e.
10a.
8a.
8b.
Read more than 10 assigned books or book-length packs of readings
Spent more than 10 hours/week preparing for class (studying, etc.)
Said the institution emphasizes studying and academic work4
Positively rated their relationships with other students3
NSSE 2007

11
Measures of Academic Proficiency & Progress
Content Areas• The MAPP test is designed to measure
college students’ skills in reading, writing, and mathematics.
12
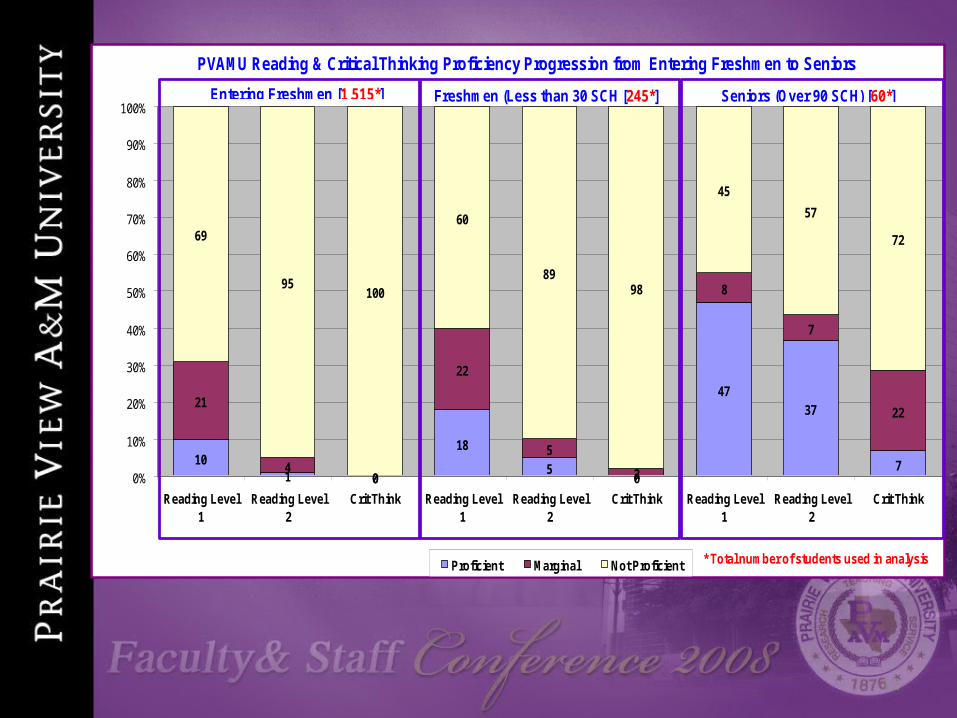
PVAMU Reading & Critical Thinking Proficiency Progression from Entering Freshmen to Seniors
101 0
18
50
4737
7
21
40
22
5
2
8
7
22
69
95100
60
8998
45
57
72
0%
10%
20%
30%
40%
50%
60%
70%
80%
90%
100%
Reading Level1
Reading Level2
Crit Think Reading Level1
Reading Level2
Crit Think Reading Level1
Reading Level2
Crit Think
Proficient Marginal Not Proficient
Seniors (Over 90 SCH) [60*]Entering Freshmen [1,515*] Freshmen (Less than 30 SCH [245*]
* Total number of students used in analysis
13
Documents the total number of grades given for each course, which is composed
of a number of sections.
Grade Distribution ReportFall 2005 – Spring 2008

14
General Education Courses
• Selection: The percentage of students who earned a “D” or “F” in English 1123, Math 1113, History 1313, and Biology 1015.
– English 1123 – English Composition– Math 1113 – College Algebra– History 1313 – U.S. History to 1876– Biology 1015 – General Biology

15
Percentage of Students Who Earned a Grade of a “D” or “F”
24.0
38.1
33.3
13.0
20.9
16.916.6
28.3
26.6
20.3
28.8
31.030.3
20.318.0
22.823.6
22.0
29.3
42.4
53.2 56.3
47.3
29.0
0.0
10.0
20.0
30.0
40.0
50.0
60.0
Fall 2005 Spring 2006 Fall 2006 Spring 2007 Fall 2007 Spring 2008
Semester
% F
ailu
re
BIOL 1015
HIST 1313313
MATH 1113
ENGL 1123
16
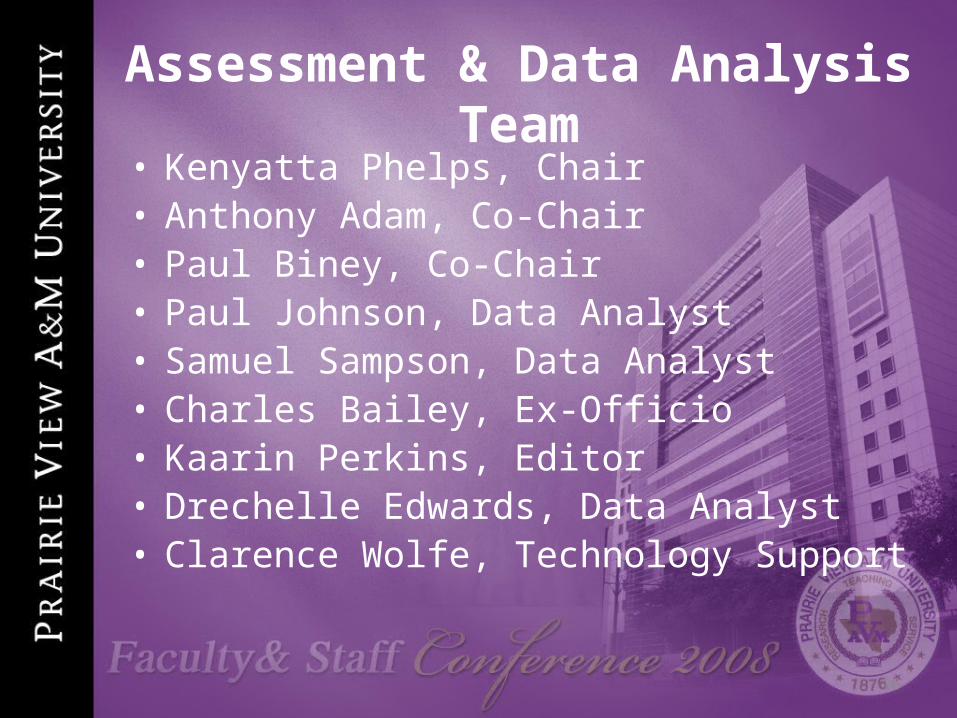
Assessment & Data Analysis Team• Kenyatta Phelps, Chair• Anthony Adam, Co-Chair• Paul Biney, Co-Chair• Paul Johnson, Data Analyst• Samuel Sampson, Data Analyst• Charles Bailey, Ex-Officio• Kaarin Perkins, Editor• Drechelle Edwards, Data Analyst• Clarence Wolfe, Technology Support
17
Assessment & Data Analysis Team
Services we provide:• Analyze and summarize data.• Disseminate assessment findings. • Design assessment instruments. • Provide workshops and trainings.

18
Thank You!
SACS OfficeJuvenile Justice & Psychology
Room 261936-261-5221