1 House Greater Minnesota Economic & Workforce Development Policy Committee January 29, 2015.
31
1 House Greater Minnesota Economic & Workforce Development Policy Committee January 29, 2015
-
Upload
tyler-chandler -
Category
Documents
-
view
220 -
download
2
Transcript of 1 House Greater Minnesota Economic & Workforce Development Policy Committee January 29, 2015.

1
House Greater Minnesota
Economic & Workforce
Development Policy Committee
January 29, 2015
2
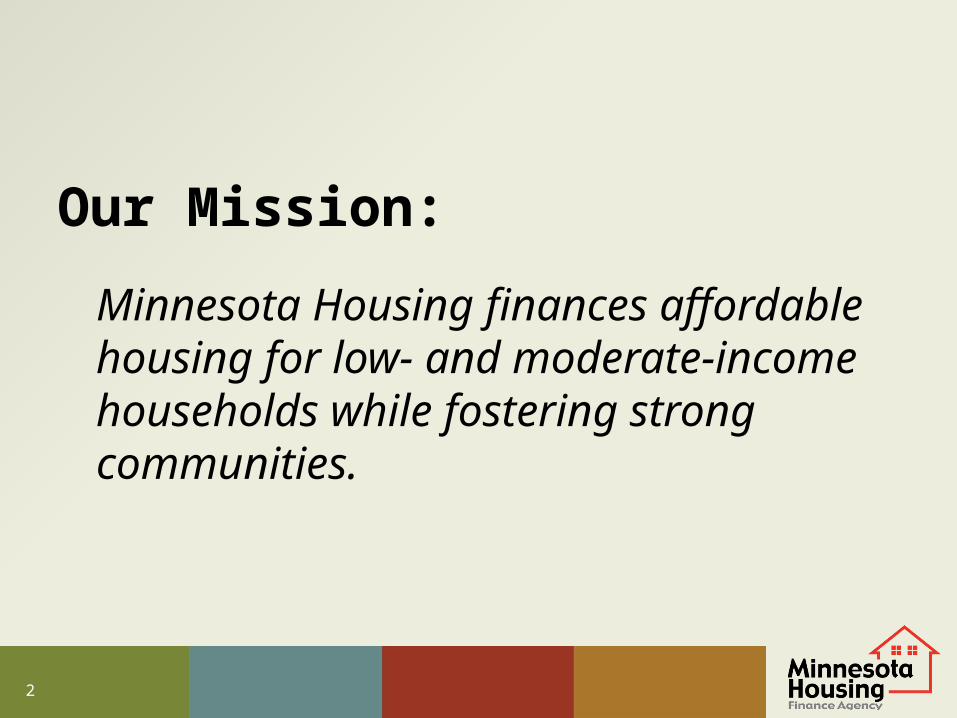
Our Mission:
Minnesota Housing finances affordable housing for low- and moderate-income households while fostering strong communities.
3
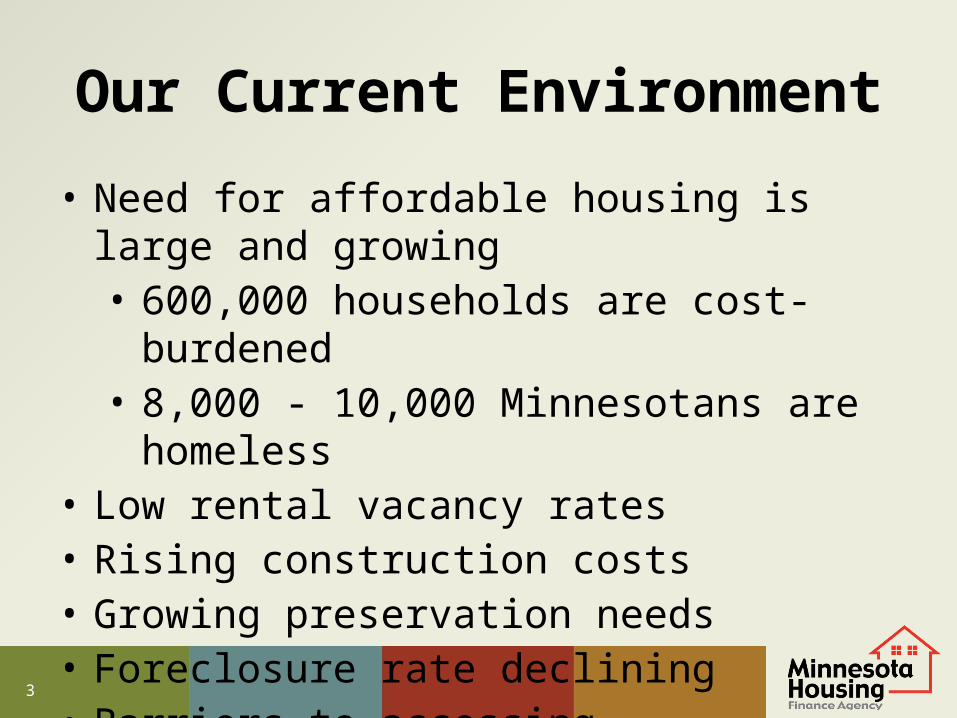
Our Current Environment
• Need for affordable housing is large and growing• 600,000 households are cost-burdened• 8,000 - 10,000 Minnesotans are homeless
• Low rental vacancy rates• Rising construction costs• Growing preservation needs • Foreclosure rate declining• Barriers to accessing homeownership

4
Our Strategic Priorities
1. Preserve federally-subsidized rental housing2. Promote and support successful
homeownership3. Address specific and critical needs in rental
housing markets4. Prevent and end homelessness5. Prevent foreclosures and support community
recovery

5
Sources of Funding
Bond Proceeds & Other Mortgage Capital, 55.6%
Federal Funds, 26.1%
Amortizing Agency Resources, 6.3%
State Appropria-tions, 8.9%Deferred Agency Resources,
3.1%
Source: 2014 Affordable Housing Plan | Total Funding: $794,841,013

6
State Appropriations• No state appropriations are used for agency
administrative costs• 56% of state appropriations serve households
with median annual incomes below $12,000• 61% serve households with median annual
incomes below $19,500
7
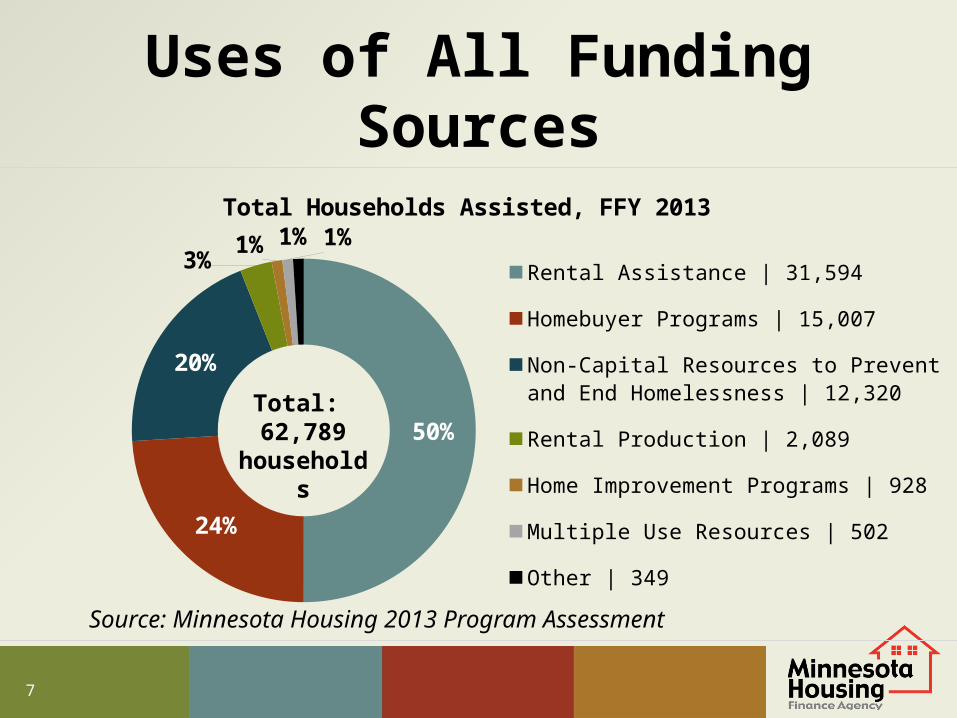
Uses of All Funding Sources
50%
24%
20%
3%1% 1%1%
Total Households Assisted, FFY 2013
Rental Assistance | 31,594
Homebuyer Programs | 15,007
Non-Capital Resources to Prevent and End Home-lessness | 12,320
Rental Production | 2,089
Home Improvement Programs | 928
Multiple Use Resources | 502
Other | 349
Total: 62,789
households
Source: Minnesota Housing 2013 Program Assessment
8
Program Delivery
• Nearly all assistance provided through network of private delivery partners– Lenders – Developers/Property Managers– Social Service Providers
• Programs accessed through a variety of delivery methods– Consolidated RFP, pipeline basis
• We do not own and operate any housing
9
Our Impact
• 62,789 households served in 2013• 2,089 units of new affordable rental units and
affordable rental units preserved– 75% of renters assisted had an annual income under
$20,000
• 2,765 mortgages, 23% to households of color– In 2014, we have increased to 26% HHs of color– Median annual income of homebuyers assisted $48,500
• $782 million total resources allocated
10
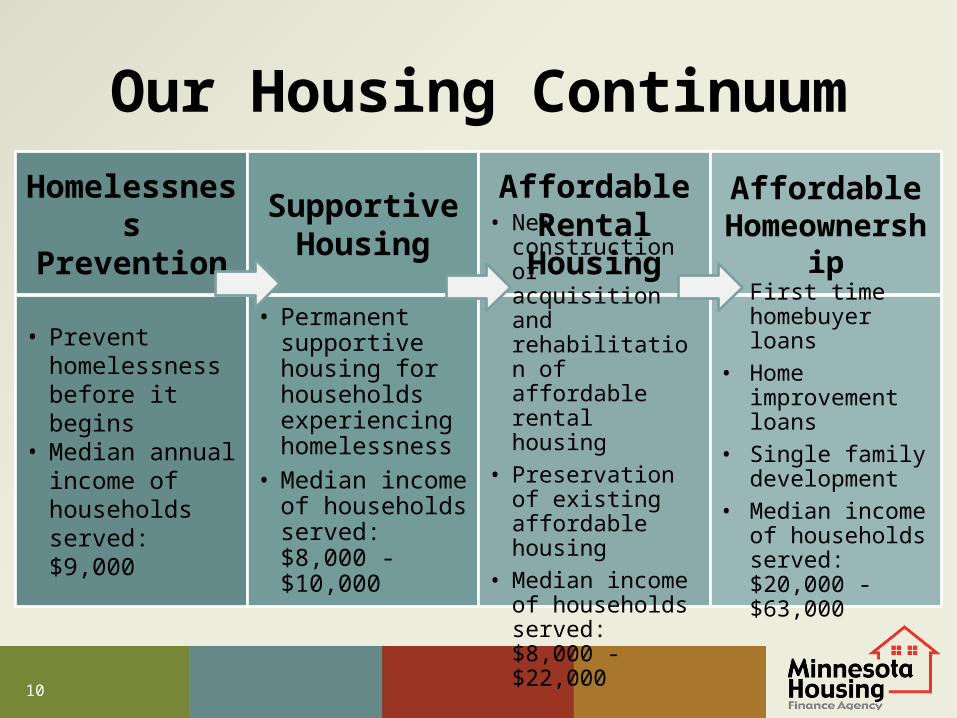
Our Housing Continuum
Homelessness Prevention
Supportive Housing
Affordable Rental Housing
Affordable Homeownership
• Prevent homelessness before it begins
• Median annual income of households served: $9,000
• Permanent supportive housing for households experiencing homelessness
• Median income of households served: $8,000 - $10,000
• New construction or acquisition and rehabilitation of affordable rental housing
• Preservation of existing affordable housing
• Median income of households served: $8,000 - $22,000
• First time homebuyer loans
• Home improvement loans
• Single family development
• Median income of households served: $20,000 - $63,000

11
FY 2016-17 BudgetProgram FY 14-15
BaseFY 16-17
BaseFY 16-17
Governor’s ProposalChallenge $18,406,000 $25,850,000 $25,850,000Housing Trust Fund $20,552,000 $22,942,000 $23,292,000Bridges $5,676,000 $5,676,000 $8,176,000Family Homeless Prevention $15,724,000 $17,038,000 $17,038,000Homeownership Assistance Fund $1,660,000 $1,770,000 $1,770,000Preservation (PARIF) $8,436,000 $8,436,000 $8,436,000Rental Rehabilitation Loans $6,275,000 $7,486,000 $7,486,000Homeownership Rehab Loans *$8,544,000 $5,544,000 $5,544,000HECAT $1,582,000 $1,714,000 $1,714,000Capacity Building $750,000 $750,000 $1,540,000Special Initiatives $890,000 $890,000 0
TOTAL $101,495,000 $98,096,000 $100,846,000* FY 14-15 base for Homeownership Rehab Loans includes $3 million in special appropriations for disaster assistance.
12
Minnesota Housing and Workforce Housing
• Economic Development and Housing Challenge Program (Challenge) - a resource for communities since 1999
• Challenge in Greater Minnesota 2010-2014:– 382 units of affordable rental housing– 368 homeownership opportunities
• Challenge income limits: – 80% statewide media income ($58,000) for rental housing – 115% of statewide median income ($82,000) for
homeownership
13
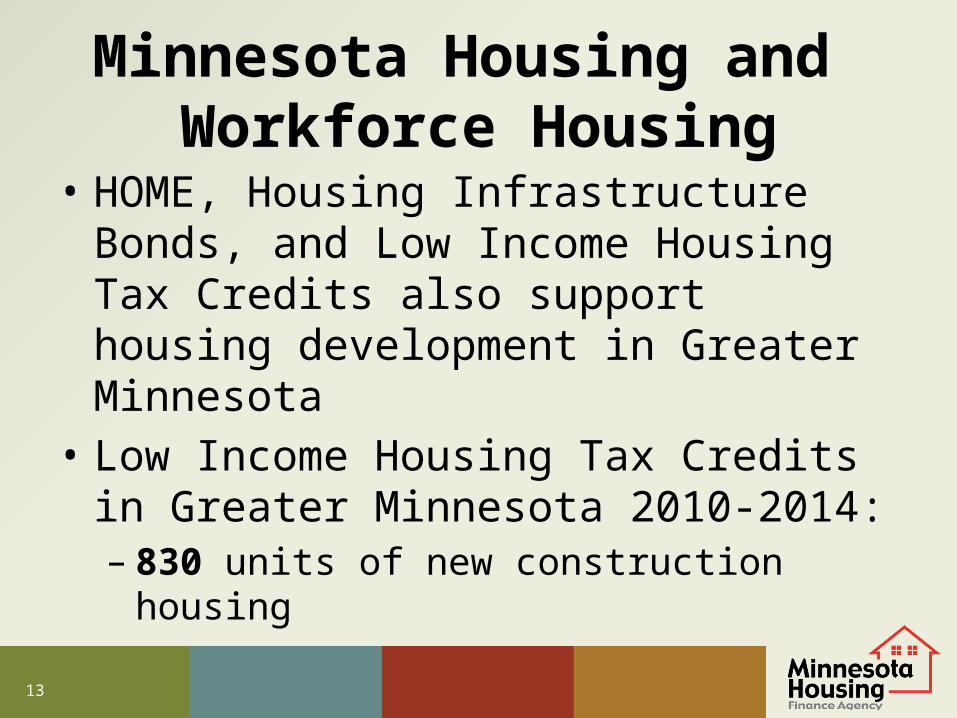
Minnesota Housing and Workforce Housing
• HOME, Housing Infrastructure Bonds, and Low Income Housing Tax Credits also support housing development in Greater Minnesota
• Low Income Housing Tax Credits in Greater Minnesota 2010-2014:– 830 units of new construction housing
14
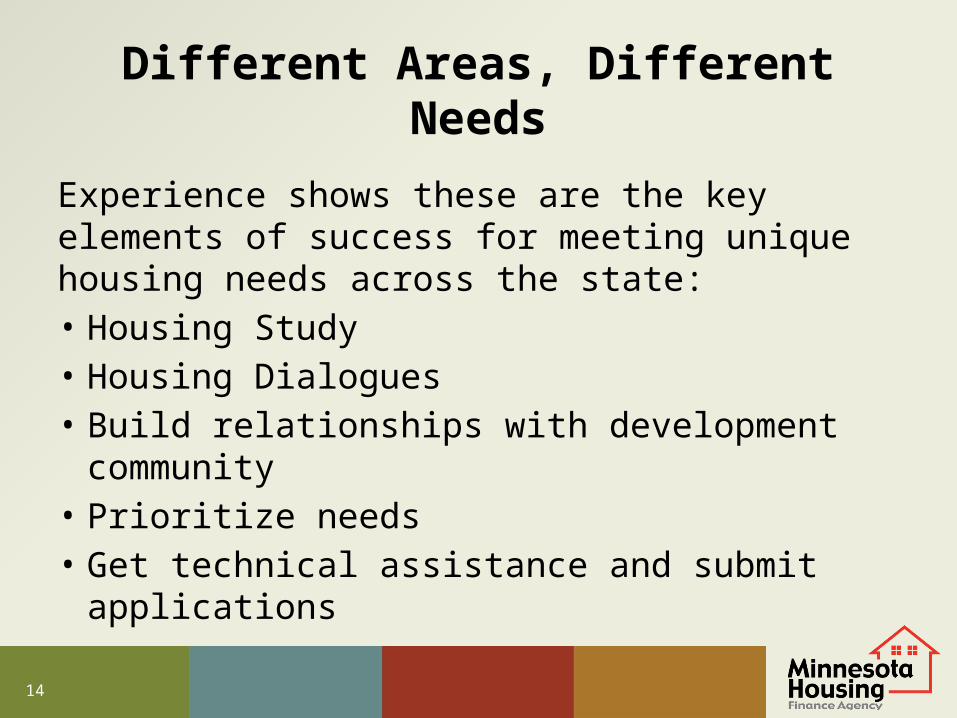
Different Areas, Different Needs
Experience shows these are the key elements of success for meeting unique housing needs across the state:• Housing Study• Housing Dialogues• Build relationships with development community• Prioritize needs• Get technical assistance and submit applications
15
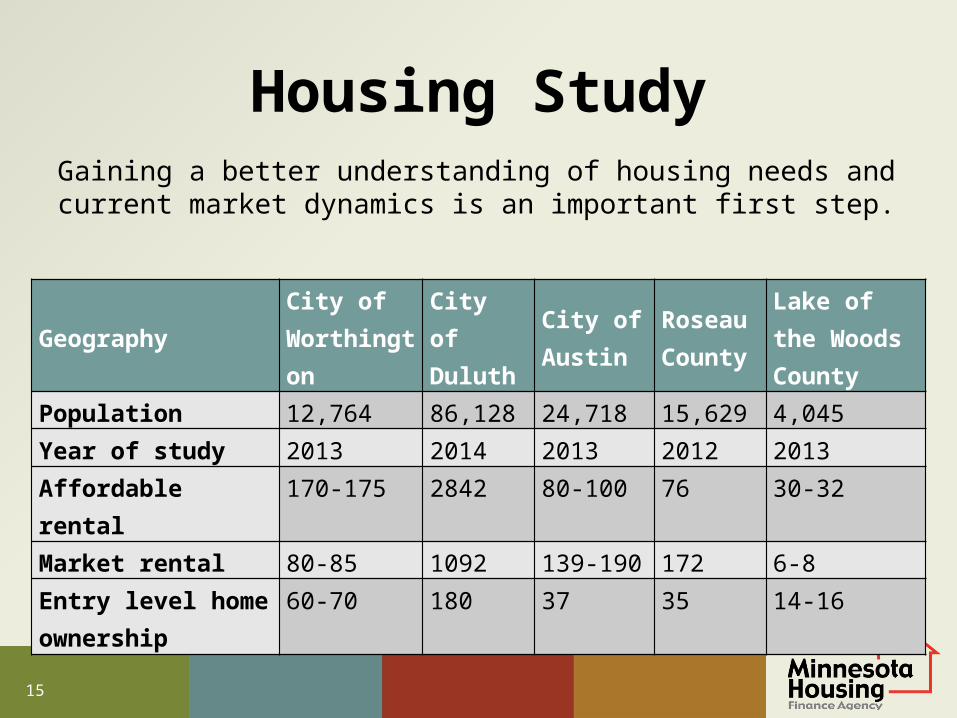
Housing StudyGaining a better understanding of housing needs and current market dynamics is an important first step.
Geography City of Worthington
City of Duluth
City of Austin
Roseau County
Lake of the Woods County
Population 12,764 86,128 24,718 15,629 4,045Year of study 2013 2014 2013 2012 2013Affordable rental 170-175 2842 80-100 76 30-32
Market rental 80-85 1092 139-190 172 6-8Entry level home ownership
60-70 180 37 35 14-16
16
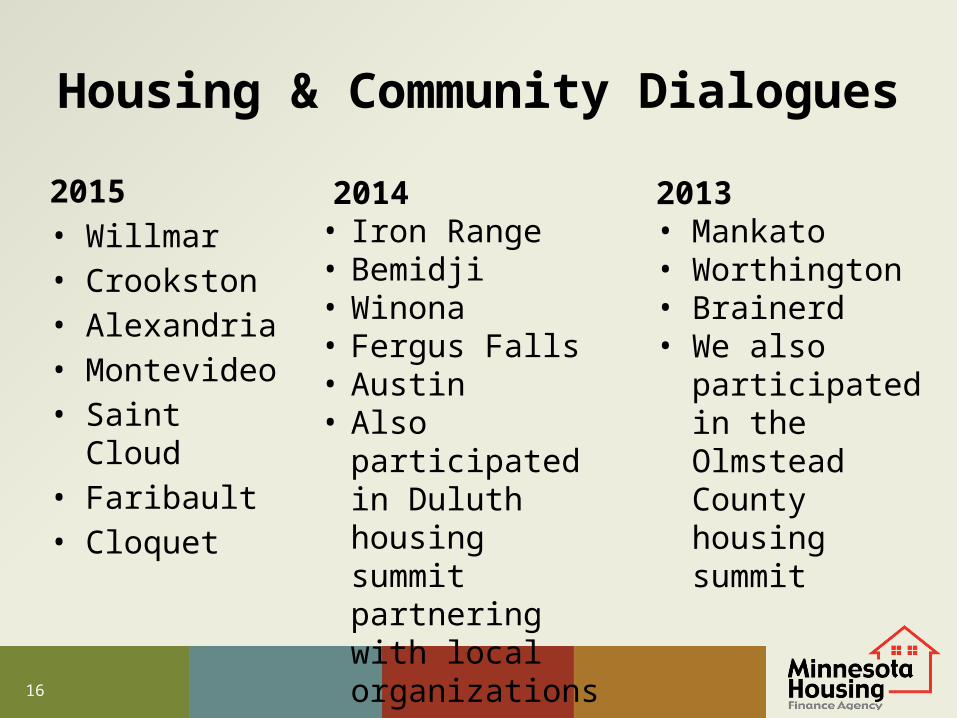
Housing & Community Dialogues
2015• Willmar• Crookston• Alexandria• Montevideo• Saint Cloud• Faribault• Cloquet
2013• Mankato• Worthington• Brainerd• We also
participated in the Olmstead County housing summit
2014• Iron Range• Bemidji• Winona• Fergus Falls• Austin• Also participated in
Duluth housing summit partnering with local organizations
17
Other Housing Discussions
• Duluth Housing Summit• Olmstead County Housing Summit• Workforce Housing discussions in Roseau,
Thief River Falls, Worthington, Jackson• Minnesota Housing Partnership Institutes• MN Association of Development
Organizations, MN Economic Development Association
18
Relationships in the Development Community
• Example: Roseau workforce housing – Housing study proved a market need existed– Minnesota Housing brought experienced
developers to the table– Developers worked with local stakeholders to
create and submit housing proposals– Application was funded and is in progress
19
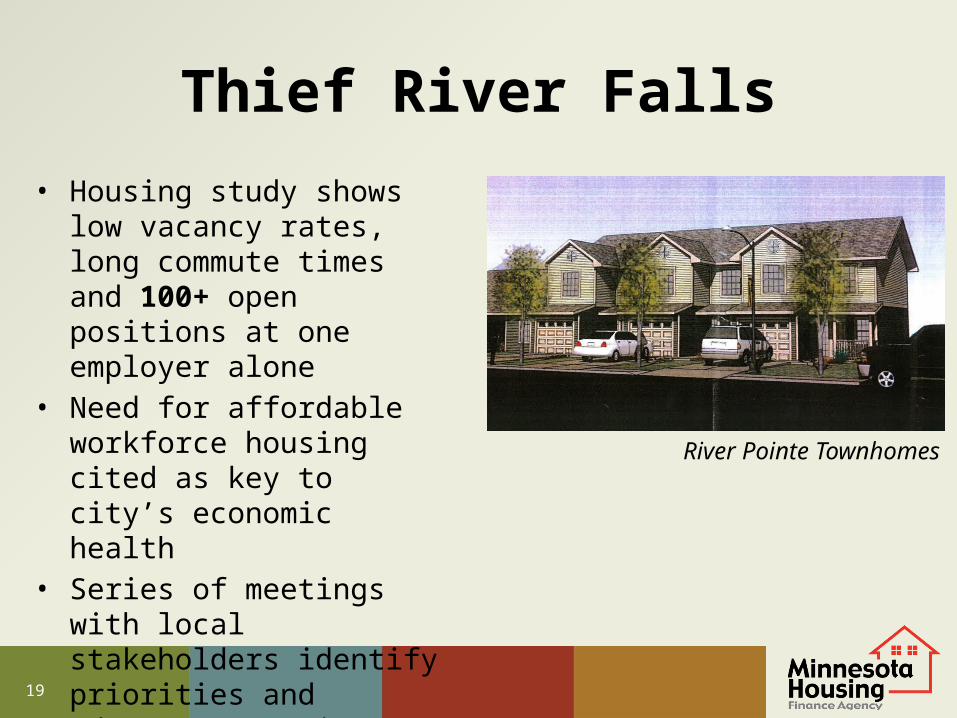
Thief River Falls• Housing study shows low
vacancy rates, long commute times and 100+ open positions at one employer alone
• Need for affordable workforce housing cited as key to city’s economic health
• Series of meetings with local stakeholders identify priorities and educate community on what affordable housing is and isn’t
River Pointe Townhomes
20
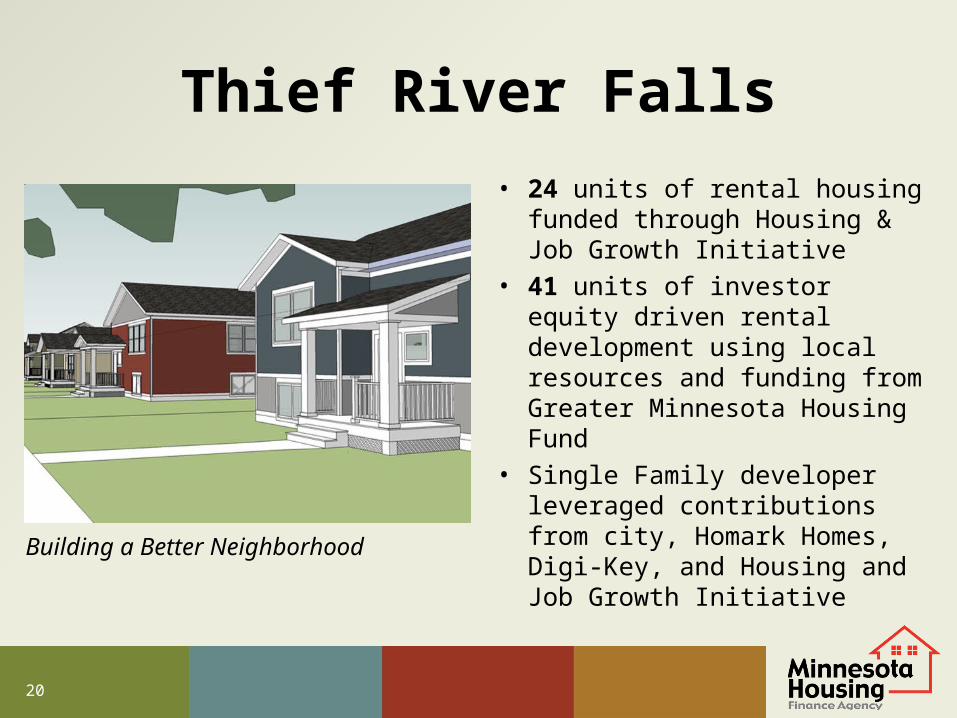
Thief River Falls• 24 units of rental housing funded
through Housing & Job Growth Initiative
• 41 units of investor equity driven rental development using local resources and funding from Greater Minnesota Housing Fund
• Single Family developer leveraged contributions from city, Homark Homes, Digi-Key, and Housing and Job Growth Initiative Building a Better Neighborhood
21
Continuing Challenges and Our Strategies
22
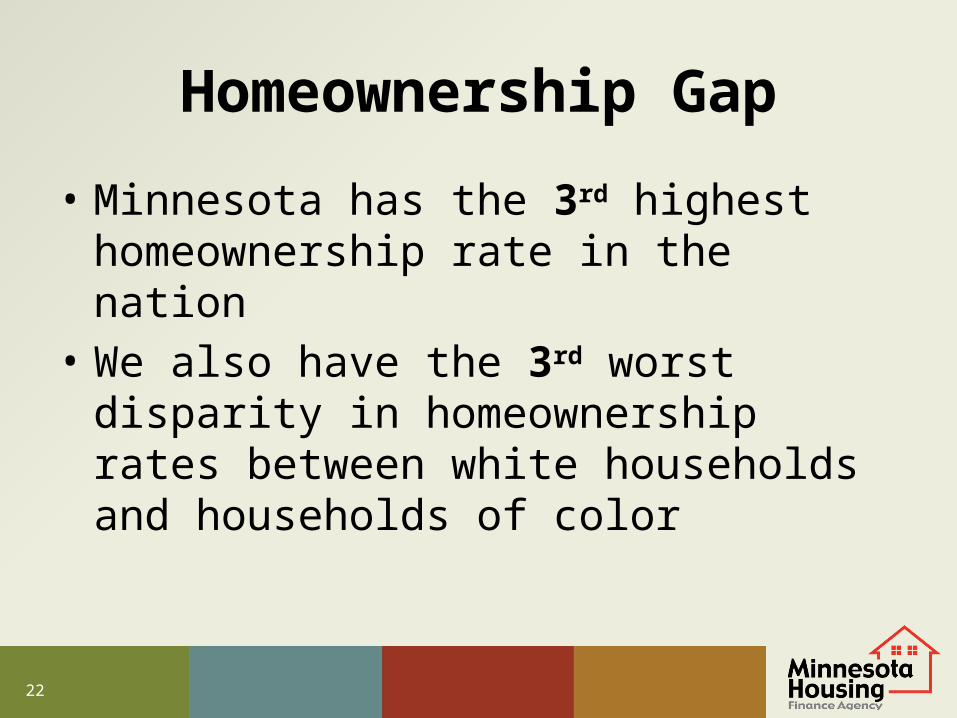
Homeownership Gap
• Minnesota has the 3rd highest homeownership rate in the nation
• We also have the 3rd worst disparity in homeownership rates between white households and households of color
23
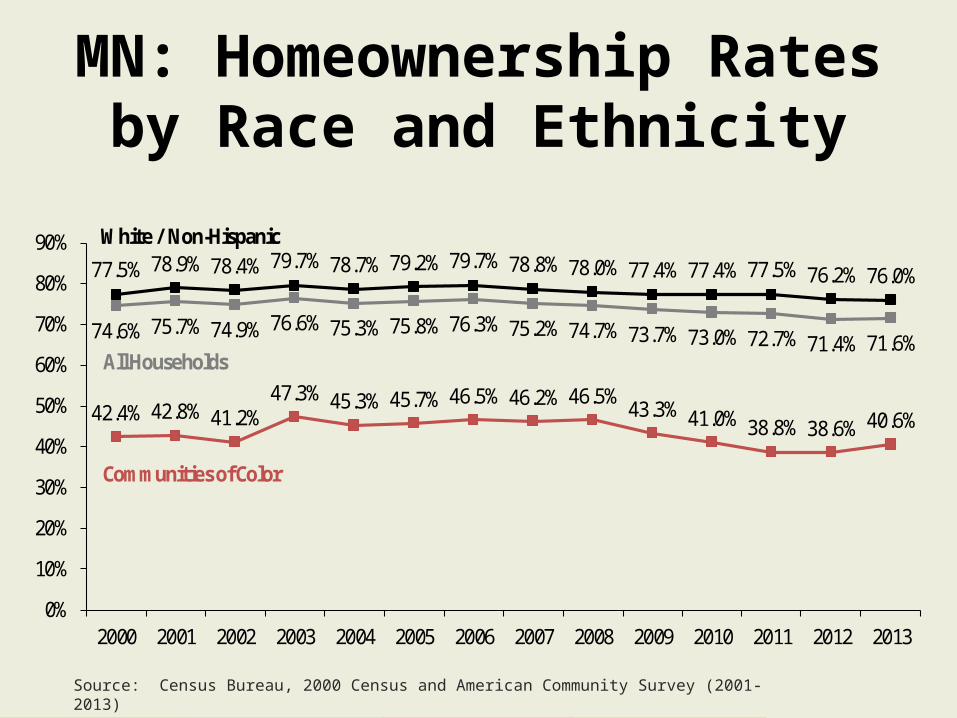
MN: Homeownership Rates by Race and Ethnicity
77.5% 78.9% 78.4% 79.7% 78.7% 79.2% 79.7% 78.8% 78.0% 77.4% 77.4% 77.5% 76.2% 76.0%
42.4% 42.8% 41.2%47.3% 45.3% 45.7% 46.5% 46.2% 46.5%
43.3% 41.0% 38.8% 38.6% 40.6%
74.6% 75.7% 74.9% 76.6% 75.3% 75.8% 76.3% 75.2% 74.7% 73.7% 73.0% 72.7% 71.4% 71.6%
0%
10%
20%
30%
40%
50%
60%
70%
80%
90%
2000 2001 2002 2003 2004 2005 2006 2007 2008 2009 2010 2011 2012 2013
White / Non-Hispanic
Communities of Color
All Households
Source: Census Bureau, 2000 Census and American Community Survey (2001-2013)
24
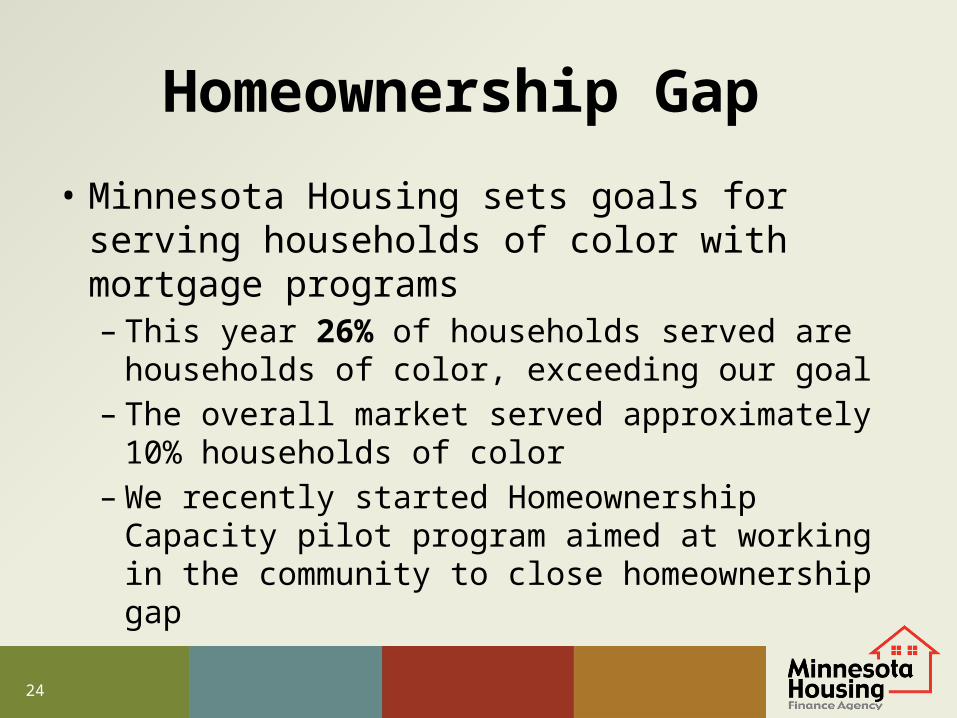
Homeownership Gap
• Minnesota Housing sets goals for serving households of color with mortgage programs– This year 26% of households served are
households of color, exceeding our goal– The overall market served approximately 10%
households of color– We recently started Homeownership Capacity
pilot program aimed at working in the community to close homeownership gap
25
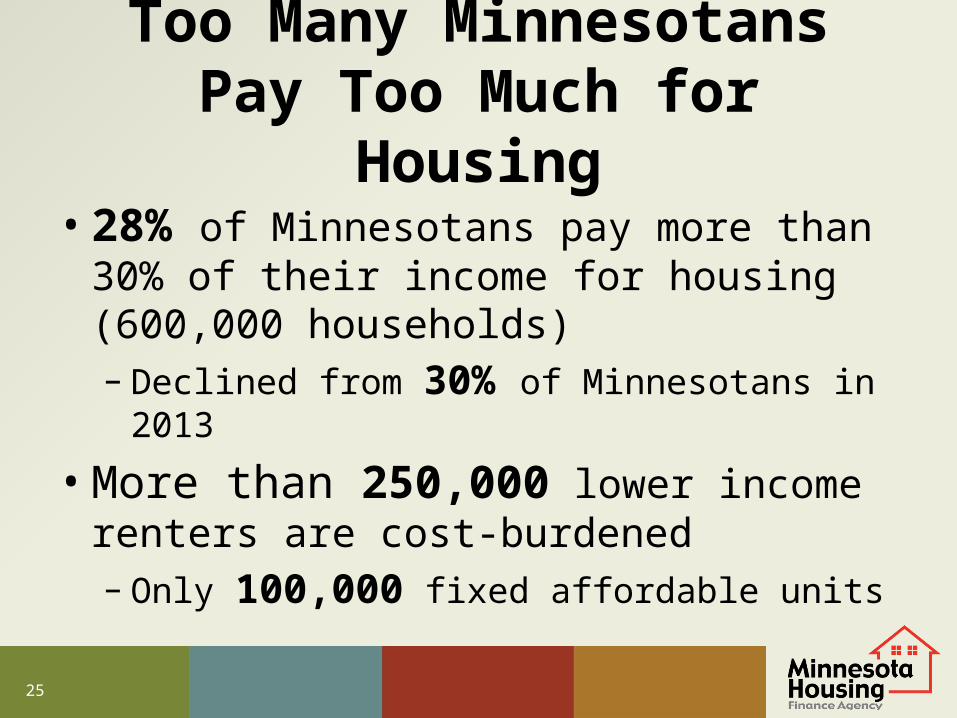
Too Many Minnesotans Pay Too Much for Housing
• 28% of Minnesotans pay more than 30% of their income for housing (600,000 households)– Declined from 30% of Minnesotans in 2013
• More than 250,000 lower income renters are cost-burdened– Only 100,000 fixed affordable units
26
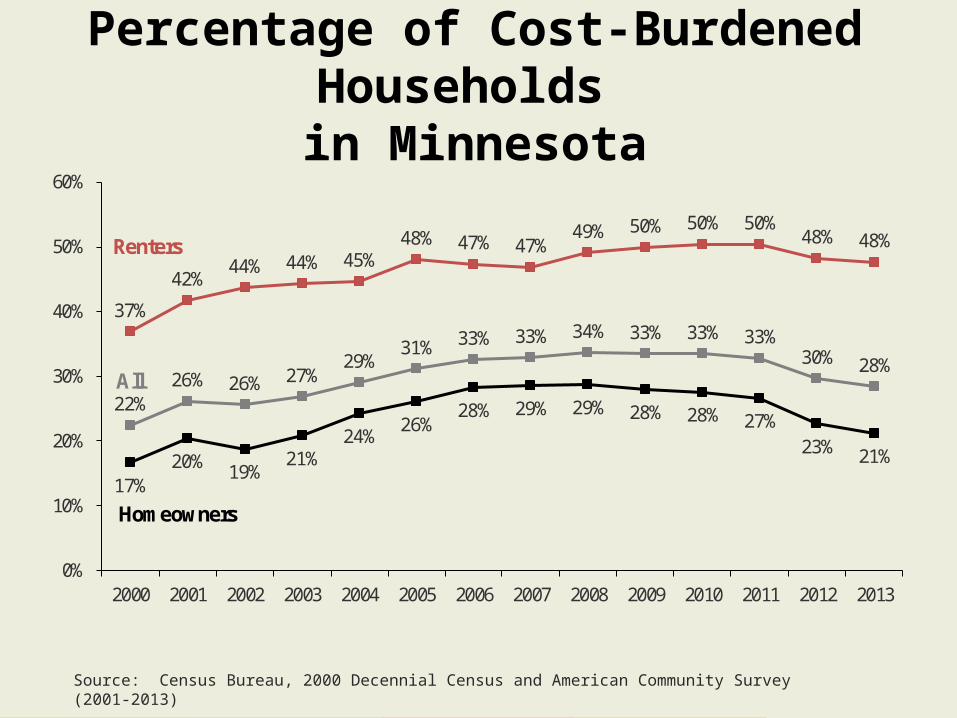
Percentage of Cost-Burdened Households in Minnesota
17%20% 19%
21%24%
26%28% 29% 29% 28% 28% 27%
23% 21%
37%
42%44% 44% 45%
48% 47% 47%49% 50% 50% 50%
48% 48%
22%26% 26% 27%
29%31% 33% 33% 34% 33% 33% 33%
30% 28%
0%
10%
20%
30%
40%
50%
60%
2000 2001 2002 2003 2004 2005 2006 2007 2008 2009 2010 2011 2012 2013
Homeowners
Renters
All
Source: Census Bureau, 2000 Decennial Census and American Community Survey (2001-2013)
27
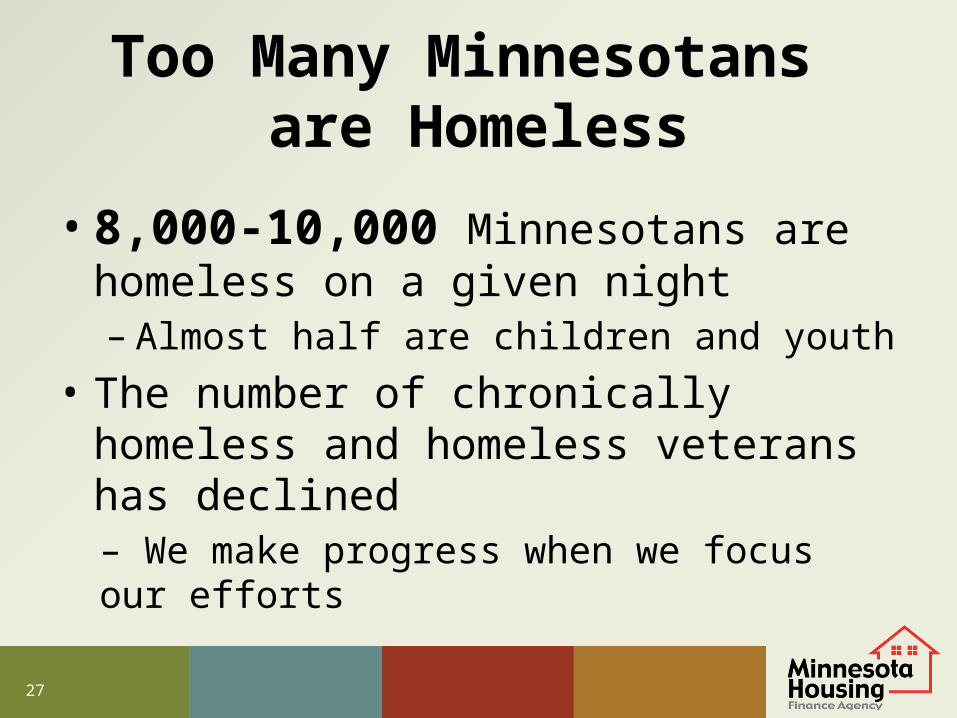
Too Many Minnesotans are Homeless
• 8,000-10,000 Minnesotans are homeless on a given night– Almost half are children and youth
• The number of chronically homeless and homeless veterans has declined– We make progress when we focus our efforts
28
2009 2010 2011 2012 2013 20140
500
1,000
1,500
2,000
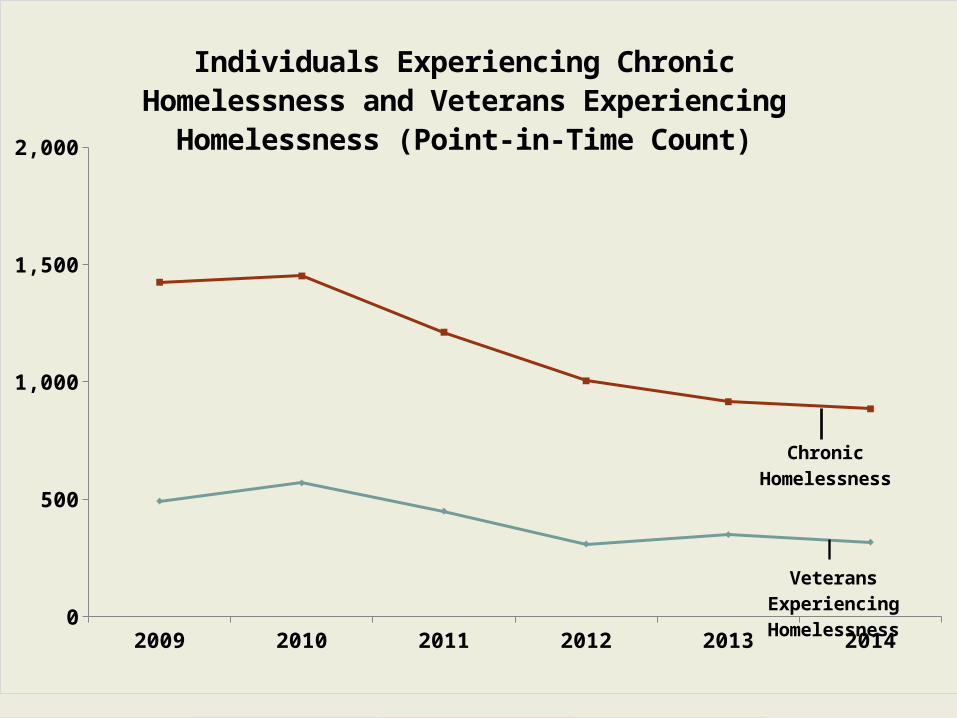
Individuals Experiencing Chronic Homelessness and Veterans Experiencing Homelessness (Point-in-Time Count)
Veterans Experienc-ing Homelessness
Chronic Home-lessness
29
Too Many Minnesotans are Homeless
• The Minnesota Interagency Council on Homelessness has adopted statewide Heading Home Plan to Prevent and End Homelessness– Plan includes many low cost/no cost items
• New investments in Supportive Housing– State Capital Investment allowed us to finance 689
units of new supportive housing this year• Future focus will emphasize families and youth
30
Our Impact
• Stable, affordable, high quality housing is a platform for success
• Our efforts support key state priorities:– Education – Jobs and Workforce Development– Better Government

31
For More Information
Contact:
Mary [email protected]
651.296.5738
Ryan [email protected]
651.296.9820
www.mnhousing.gov