1 Function-Oriented Software Design (continued) Lecture 6 Prof. R. Mall Dept. of CSE, IIT,...
75
1 Function-Oriented Software Design (continued) Lecture 6 Prof. R. Mall Dept. of CSE, IIT, Kharagpur
-
Upload
alexandra-ramsey -
Category
Documents
-
view
222 -
download
2
Transcript of 1 Function-Oriented Software Design (continued) Lecture 6 Prof. R. Mall Dept. of CSE, IIT,...
1
Function-Oriented Software Design
(continued) Lecture 6
Prof. R. MallDept. of CSE, IIT,
Kharagpur
2
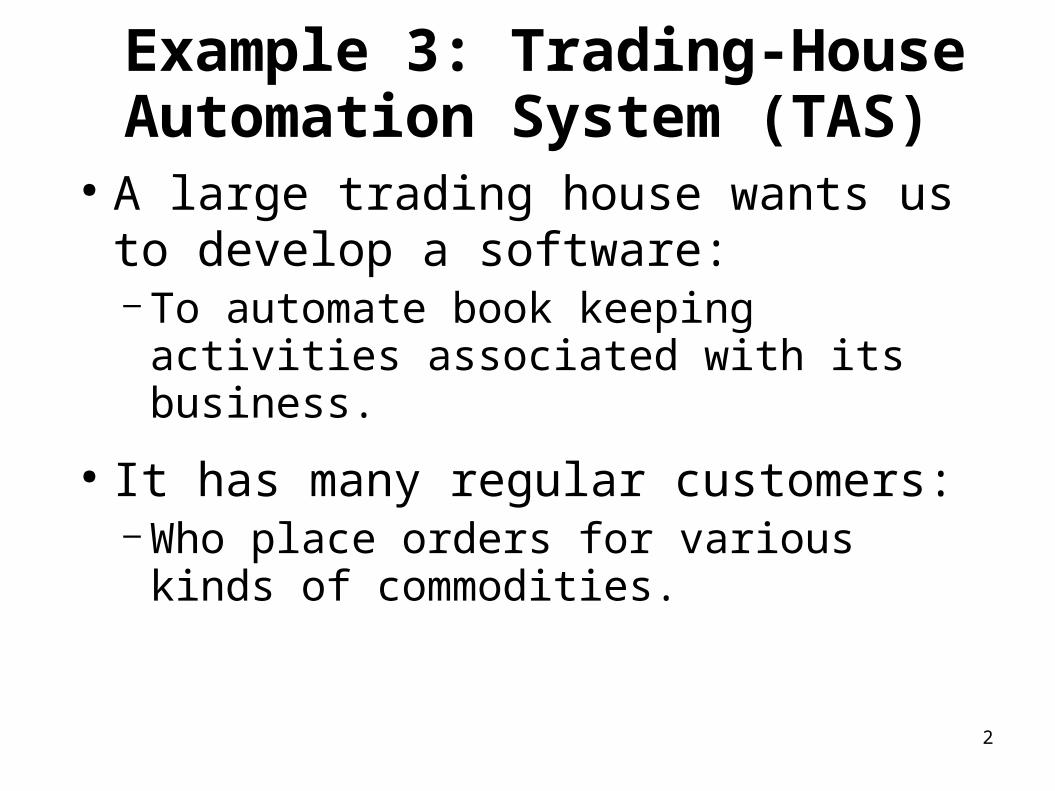
Example 3: Trading-House Automation System (TAS)
● A large trading house wants us to develop a software: – To automate book keeping activities associated with its business.
● It has many regular customers:– Who place orders for various kinds of commodities.

3
Example 3: Trading-House Automation System (TAS)
● The trading house maintains names and addresses of its regular customers.
● Each customer is assigned a unique customer identification number (CIN).
● As per current practice when a customer places order: – The accounts department first checks the
credit-worthiness of the customer.

4
Example: Trading-House Automation System (TAS)
● The credit worthiness of a customer is determined:– By analyzing the history of his payments
to the bills sent to him in the past.
● If a customer is not credit-worthy: – His orders are not processed any further– An appropriate order rejection message is
generated for the customer.
5
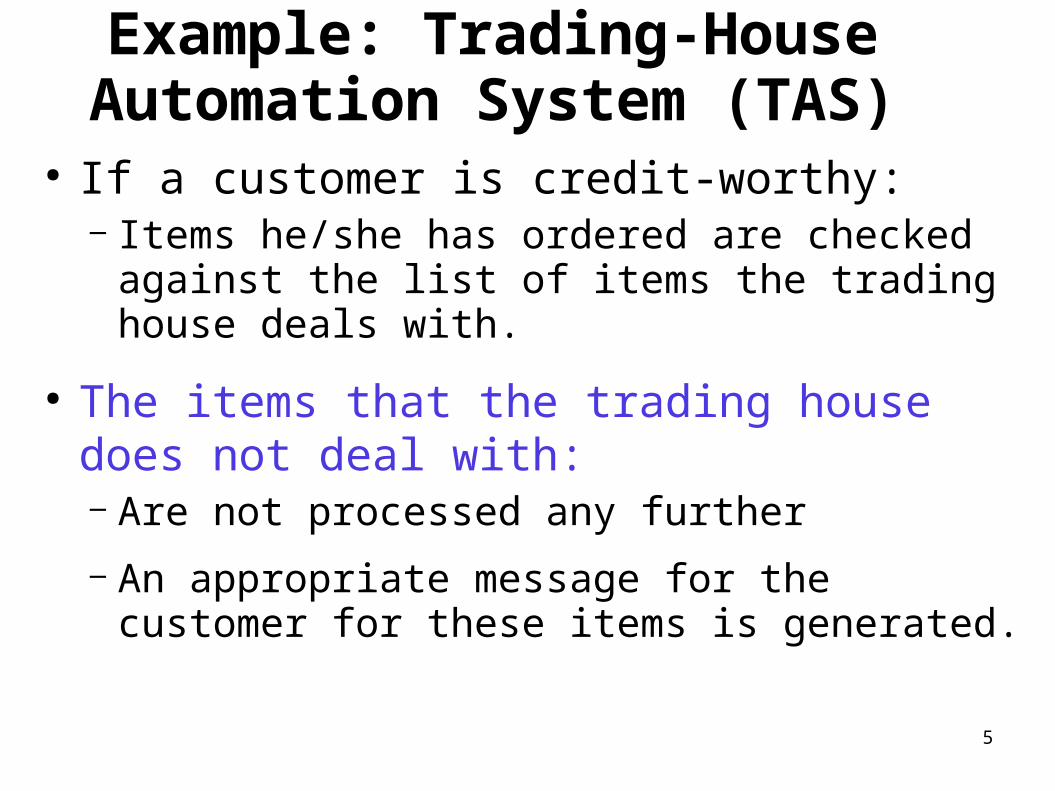
Example: Trading-House Automation System (TAS)
● If a customer is credit-worthy: – Items he/she has ordered are checked
against the list of items the trading house deals with.
● The items that the trading house does not deal with:– Are not processed any further
– An appropriate message for the customer for these items is generated.
6
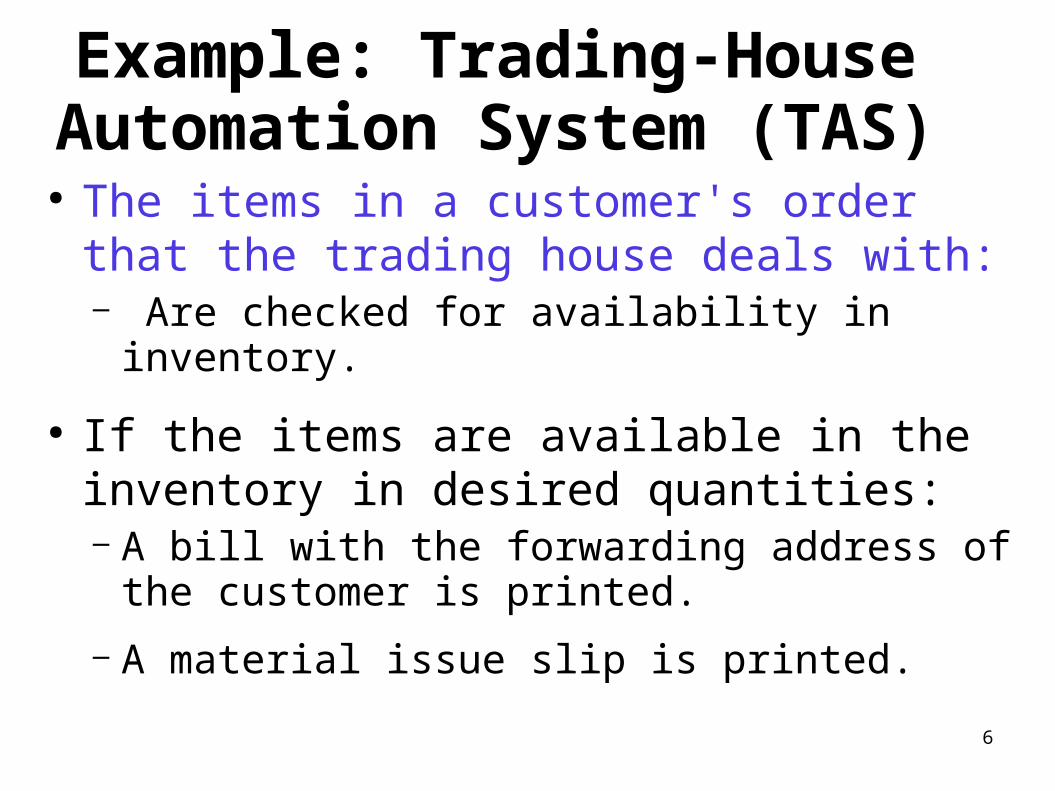
Example: Trading-House Automation System
(TAS)● The items in a customer's order that
the trading house deals with:– Are checked for availability in inventory.
● If the items are available in the inventory in desired quantities: – A bill with the forwarding address of the
customer is printed.
– A material issue slip is printed.

7
Example: Trading-House Automation System (TAS)
● The customer can produce the material issue slip at the store house: – Take delivery of the items.
– Inventory data adjusted to reflect the sale to the customer.

8
Example: Trading-House Automation System (TAS)
● If an ordered item is not available in the inventory in sufficient quantity:– To be able to fulfill pending orders store details in a "pending-order" file :
● out-of-stock items along with quantity ordered.
● customer identification number

9
Example: Trading-House Automation System (TAS)
● The purchase department: – would periodically issue commands to generate indents.
● When generate indents command is issued:– The system should examine the
"pending-order" file – Determine the orders that are pending – Total quantity required for each of the
items.
10
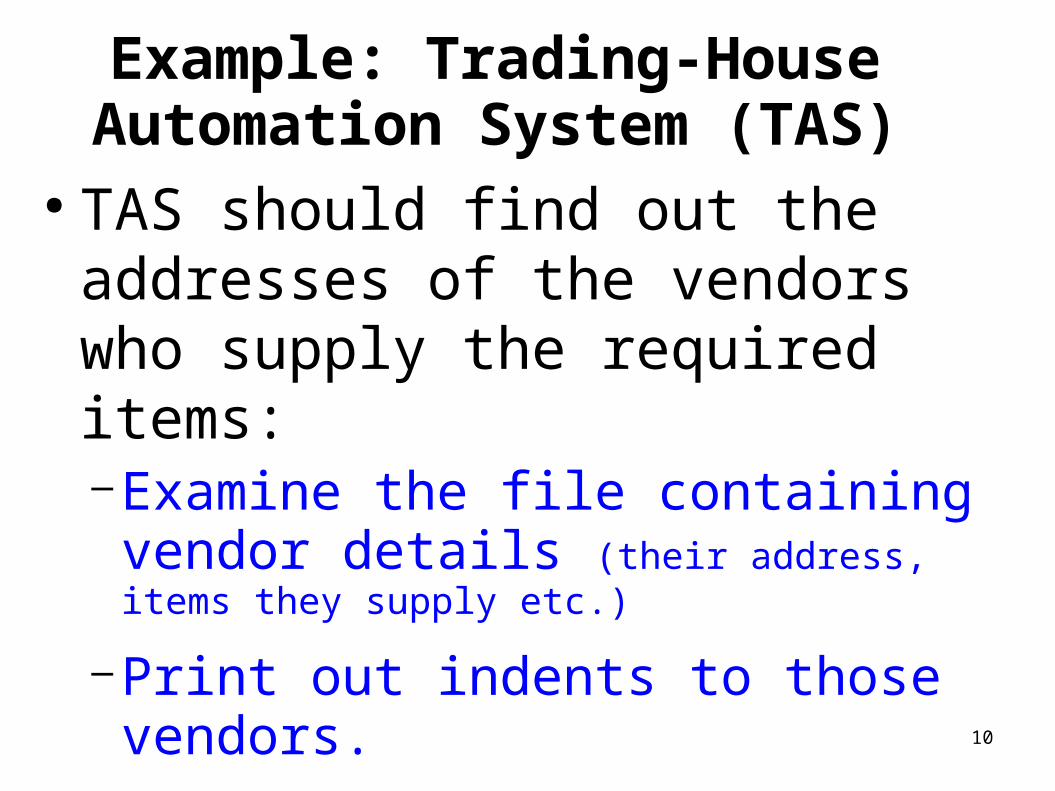
Example: Trading-House Automation System (TAS)
● TAS should find out the addresses of the vendors who supply the required items:–Examine the file containing vendor details (their address, items they supply etc.)
–Print out indents to those vendors.
11
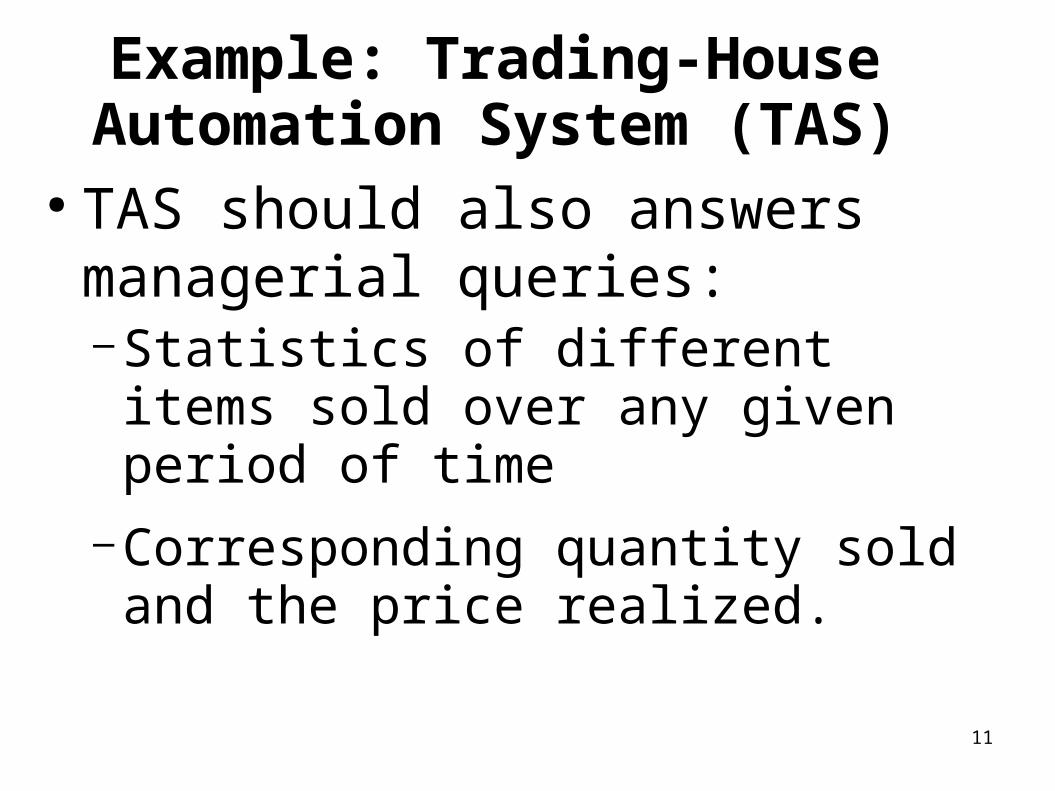
Example: Trading-House Automation System (TAS)
● TAS should also answers managerial queries:–Statistics of different items sold over any given period of time
–Corresponding quantity sold and the price realized.

12
Context Diagram
Trading-House-
Automation-System
0
Manager
Customer
Purchase-Department
query
statistics
orderresponse
Generate-indent
indent
13
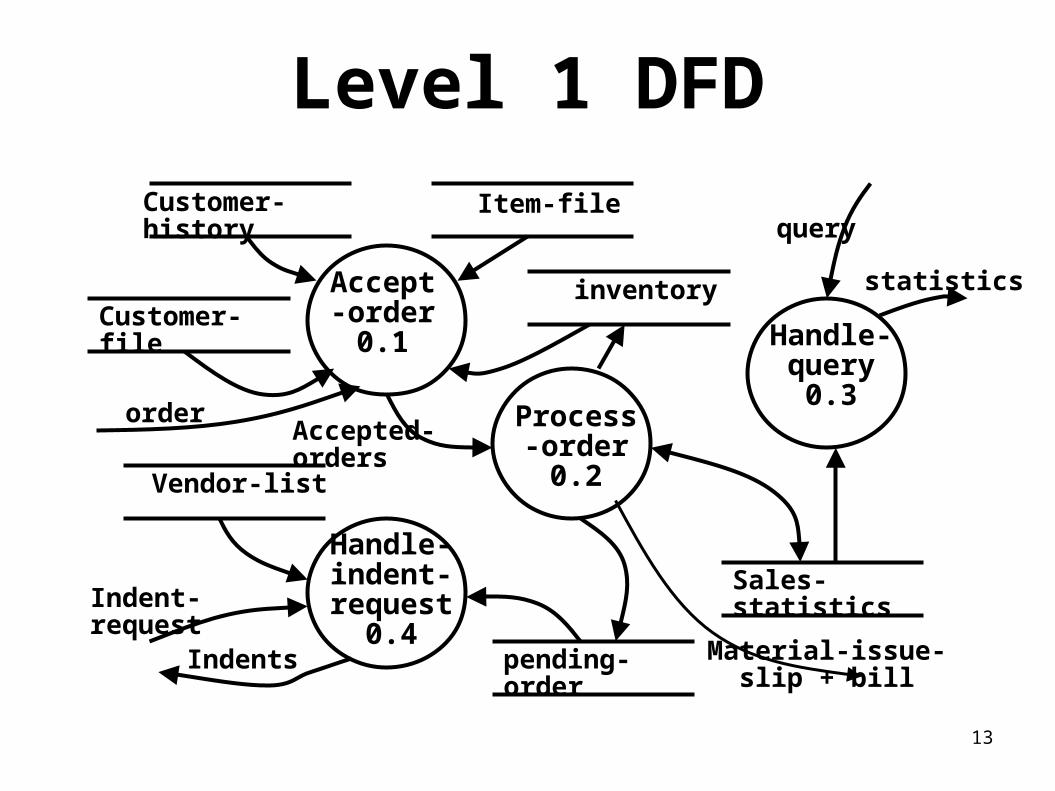
Level 1 DFD
Accept-order
0.1
Process-order
0.2
Handle-indent-request
0.4
Handle-query
0.3
pending-order
Sales-statistics
inventory
Vendor-list
Customer-file
Item-fileCustomer-history
Indent-request
Indents
Accepted-orders
query
statistics
order
Material-issue-slip + bill
14
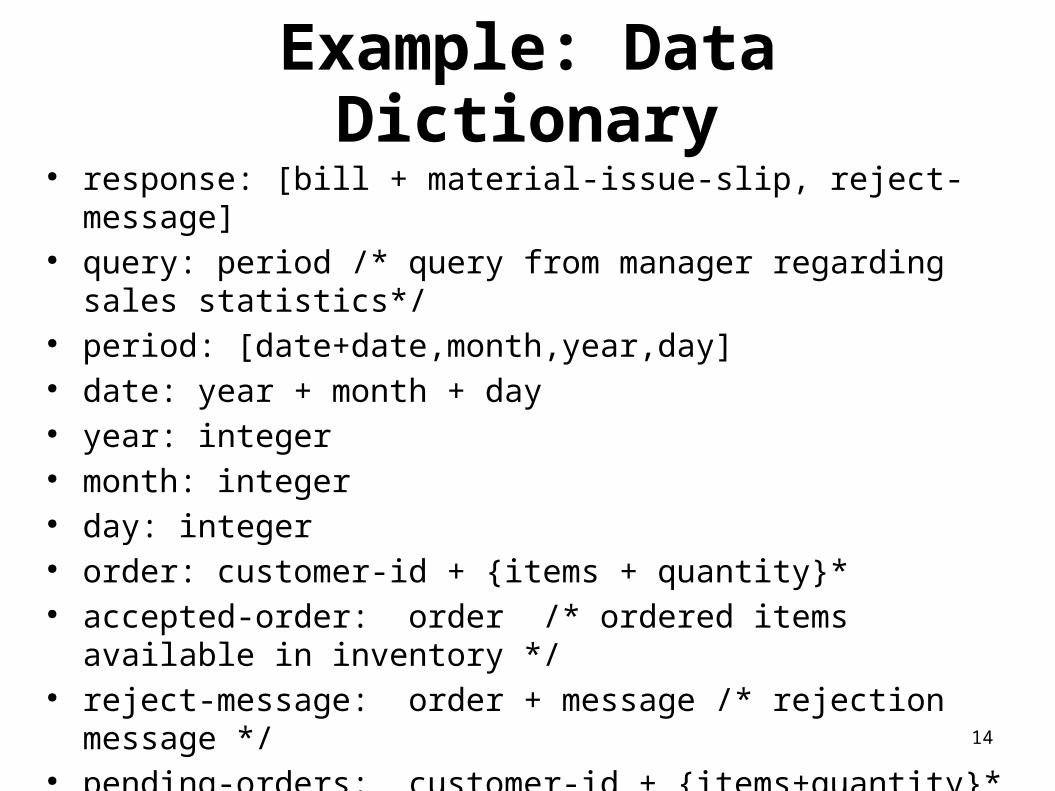
Example: Data Dictionary
● response: [bill + material-issue-slip, reject-message]● query: period /* query from manager regarding sales
statistics*/● period: [date+date,month,year,day]● date: year + month + day● year: integer● month: integer● day: integer● order: customer-id + {items + quantity}* ● accepted-order: order /* ordered items available in
inventory */● reject-message: order + message /* rejection message
*/● pending-orders: customer-id + {items+quantity}* ● customer-address: name+house#+street#+city+pin
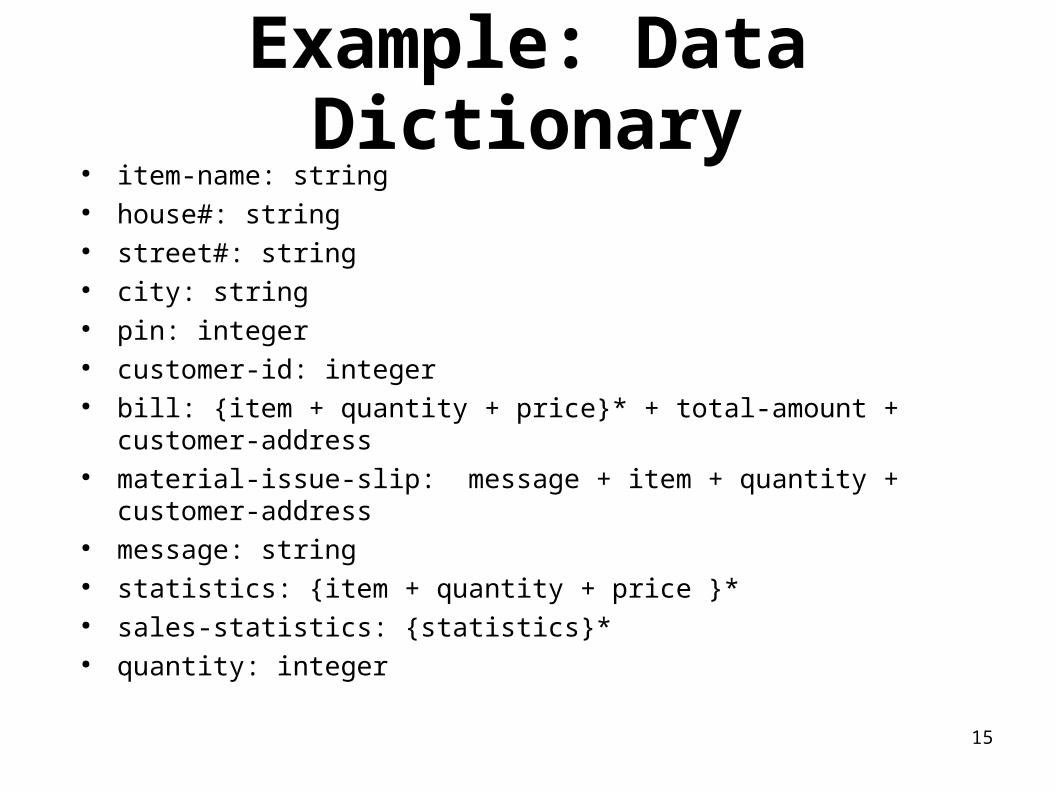
15
Example: Data Dictionary
● item-name: string● house#: string● street#: string● city: string● pin: integer● customer-id: integer● bill: {item + quantity + price}* + total-amount + customer-
address● material-issue-slip: message + item + quantity + customer-
address● message: string● statistics: {item + quantity + price }*● sales-statistics: {statistics}*● quantity: integer
16
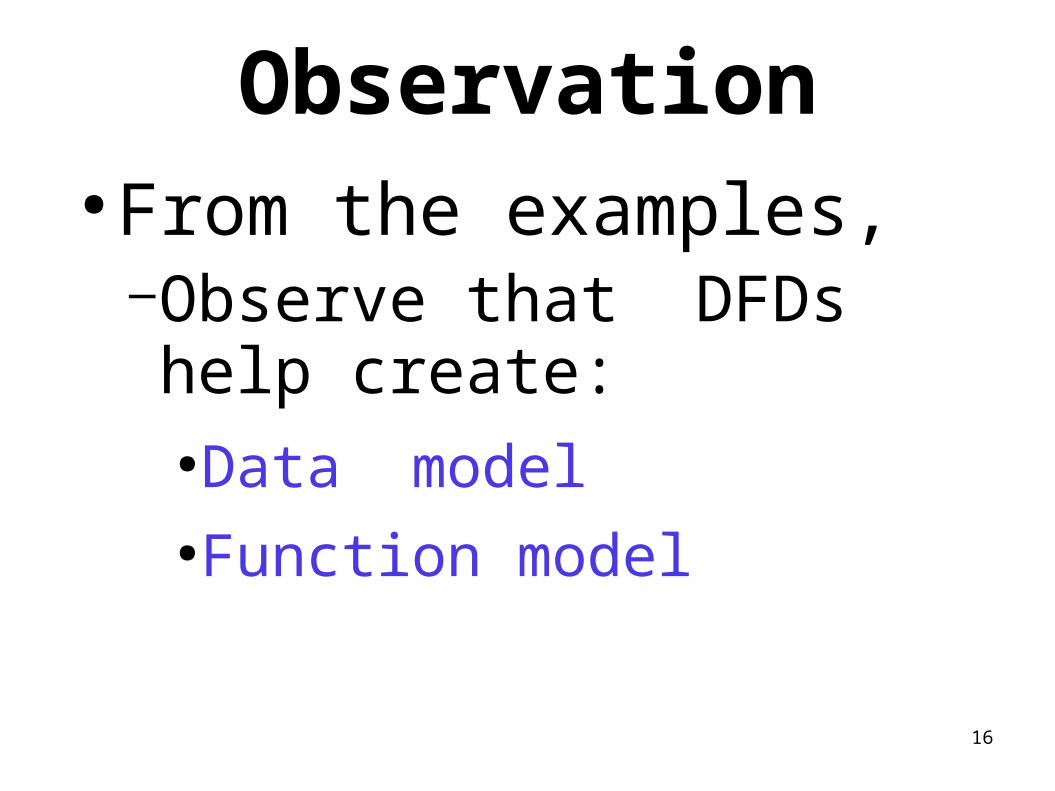
Observation● From the examples,
–Observe that DFDs help create:●Data model ●Function model

17
Observation● As a DFD is refined into greater levels of detail:–The analyst performs an implicit functional decomposition.
–At the same time, refinements of data takes place.
18
Guidelines For Constructing DFDs
● Context diagram should represent the system as a single bubble:–Many beginners commit the mistake of drawing more than one bubble in the context diagram.

19
Guidelines For Constructing DFDs
● All external entities should be represented in the context diagram:– External entities should not appear at any
other level of DFD.
● Only 3 to 7 bubbles per diagram should be allowed:– Each bubble should be decomposed to
between 3 and 7 bubbles.
20
Guidelines For Constructing DFDs
● A common mistake committed by many beginners: –Attempting to represent control information in a DFD.
–e.g. trying to represent the order in which different functions are executed.
21
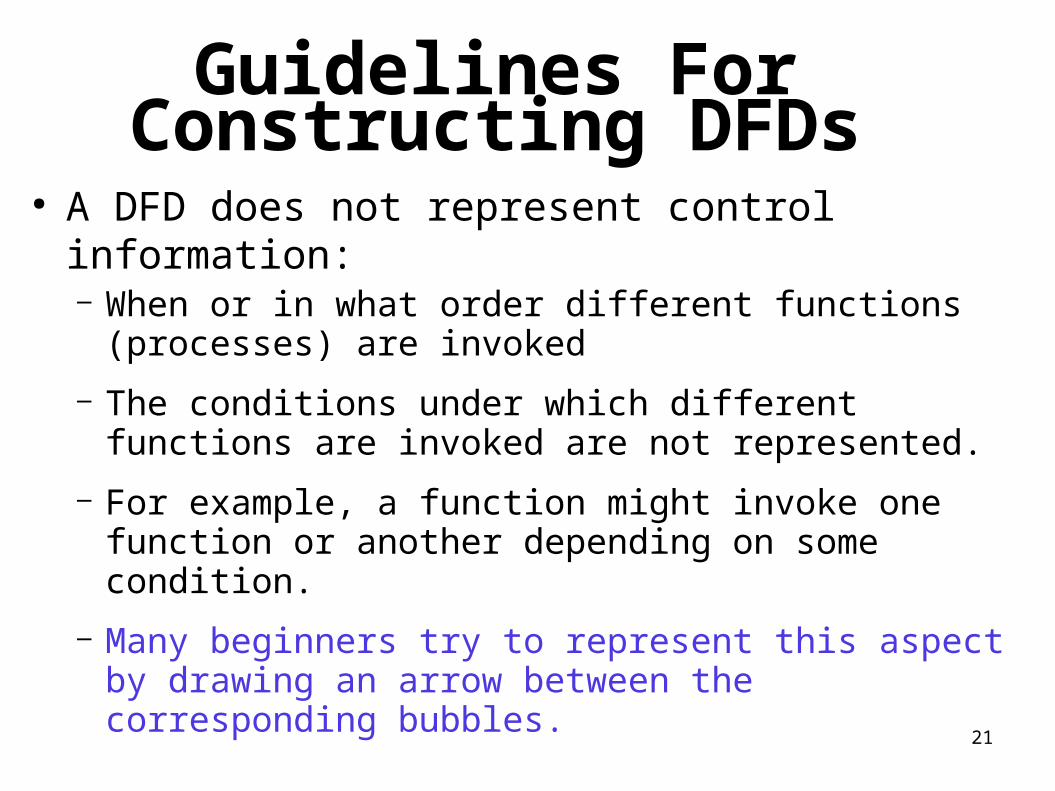
Guidelines For Constructing DFDs
● A DFD does not represent control information:– When or in what order different functions
(processes) are invoked
– The conditions under which different functions are invoked are not represented.
– For example, a function might invoke one function or another depending on some condition.
– Many beginners try to represent this aspect by drawing an arrow between the corresponding bubbles.

22
Example-1● Check the input value:
– If the input value is less than -1000 or greater than +1000 generate an error message
– otherwise search for the numberChec
knumb
er
Generate
Error
Search
number
message
number[found,not-found]
23
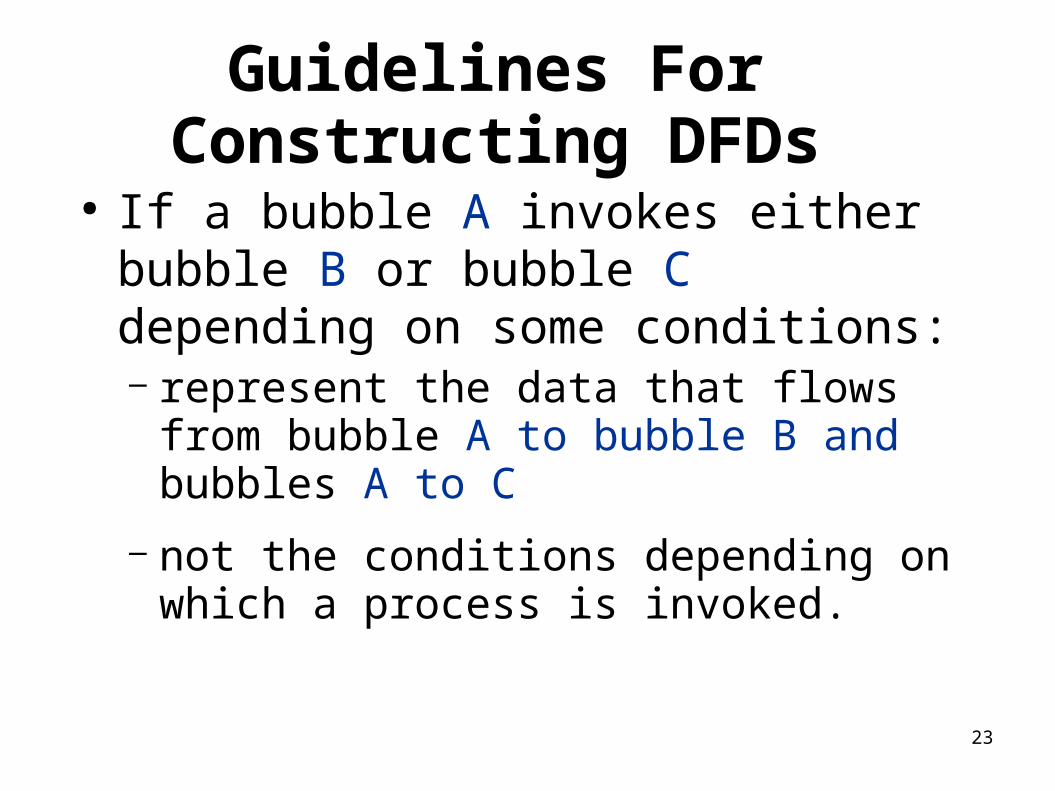
Guidelines For Constructing DFDs
● If a bubble A invokes either bubble B or bubble C depending on some conditions:– represent the data that flows from
bubble A to bubble B and bubbles A to C
– not the conditions depending on which a process is invoked.

24
Example-2● A function accepts the book name to be searched
from the user● If the entered book name is not a valid book name
– Generates an error message,
● If the book name is valid,– Searches the book name in database.
Get-book-name
Print-err-message
Search-book
Error-message
Book-name
Good-book-name
Book-details

25
Guidelines For Constructing DFDs
● All functions of the system must be captured in the DFD model:– No function specified in the SRS
document should be overlooked.
● Only those functions specified in the SRS document should be represented:– Do not assume extra functionality of the
system not specified by the SRS document.

26
Commonly Made Errors
● Unbalanced DFDs● Forgetting to mention the names of the data
flows● Unrepresented functions or data● External entities appearing at higher level DFDs● Trying to represent control aspects● Context diagram having more than one bubble● A bubble decomposed into too many bubbles in
the next level● Terminating decomposition too early● Nouns used in naming bubbles

27
Shortcomings of the DFD Model
● DFD models suffer from several shortcomings:
● DFDs leave ample scope to be imprecise. – In a DFD model, we infer about the
function performed by a bubble from its label.
– A label may not capture all the functionality of a bubble.

28
Shortcomings of the DFD Model
● For example, a bubble named find-book-position has only intuitive meaning:– Does not specify several things:
● What happens when some input information is missing or is incorrect.
● Does not convey anything regarding what happens when book is not found
● or what happens if there are books by different authors with the same book title.

29
Shortcomings of the DFD Model
● Control information is not represented: – For instance, order in which inputs are
consumed and outputs are produced is not specified.
Accept-order
Process-order
Customer-file
Item-fileCustomer-history
Accepted-orders
order
inventory
30
Shortcomings of the DFD Model
● A DFD does not specify synchronization aspects:– For instance, the DFD in TAS example
does not specify:● Whether process-order may wait until the
accept-order produces data● Whether accept-order and handle-order
may proceed simultaneously with some buffering mechanism between them.

31
TAS: Level 1 DFD
Accept-order
Process-order
Handle-indent-request
Handle-query
pending-order
Sales-statistics
inventory
Vendor-list
Customer-file
Item-fileCustomer-history
Indent-request
Indents
Accepted-orders
query
statistics
order
32
Shortcomings of the DFD Model
● The way decomposition is carried out to arrive at the successive levels of a DFD is subjective.
● The ultimate level to which decomposition is carried out is subjective:– Depends on the choice and judgement of the
analyst. ● Even for the same problem,
– Several alternative DFD representations are possible:
– Many times it is not possible to say which DFD representation is superior or preferable.

33
Shortcomings of the DFD Model
● DFD technique does not provide: – Any clear guidance as to how exactly one
should go about decomposing a function:
– One has to use subjective judgement to carry out decomposition.
● Structured analysis techniques do not specify when to stop a decomposition process: – To what length decomposition needs to be
carried out.
34
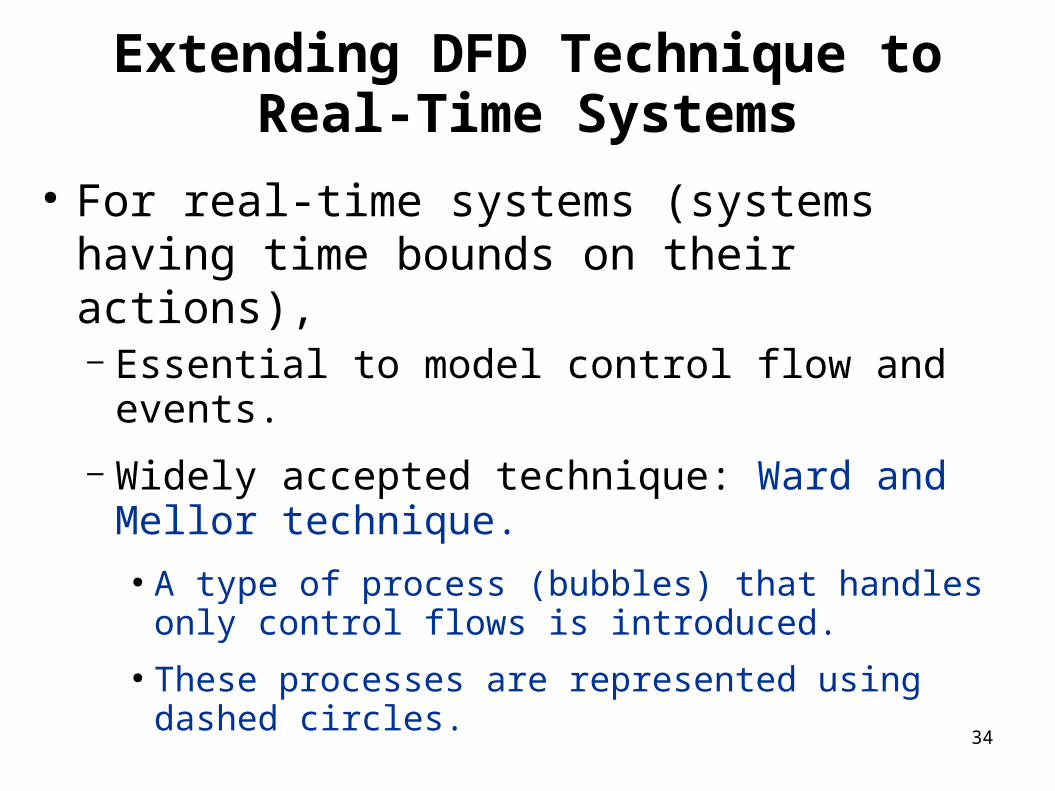
Extending DFD Technique to Real-Time Systems
● For real-time systems (systems having time bounds on their actions), – Essential to model control flow and
events.
– Widely accepted technique: Ward and Mellor technique.
● A type of process (bubbles) that handles only control flows is introduced.
● These processes are represented using dashed circles.

35
Structured Design● The aim of structured design
– Transform the results of structured analysis (i.e., a DFD representation) into a structure chart.
● A structure chart represents the software architecture:– Various modules making up the system,
– Module dependency (i.e. which module calls which other modules),
– Parameters passed among different modules.

36
Structure Chart● Structure chart representation
– Easily implementable using programming languages.
● Main focus of a structure chart: – Define the module structure of a software,
– Interaction among different modules,
– Procedural aspects (e.g, how a particular functionality is achieved) are not represented.

37
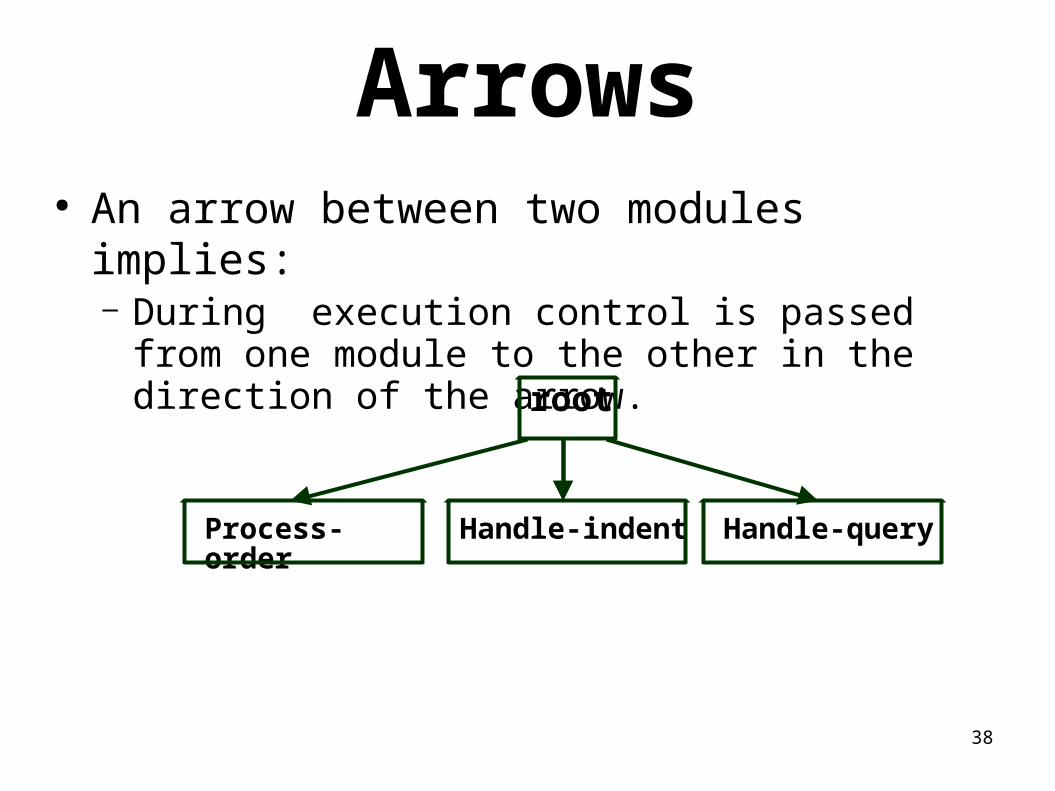
Basic Building Blocks of Structure Chart
● Rectangular box: – A rectangular box represents a module.
– Annotated with the name of the module it represents.
Process-order
38
Arrows● An arrow between two modules implies:
– During execution control is passed from one module to the other in the direction of the arrow.
Process-order
Handle-indent
root
Handle-query
39
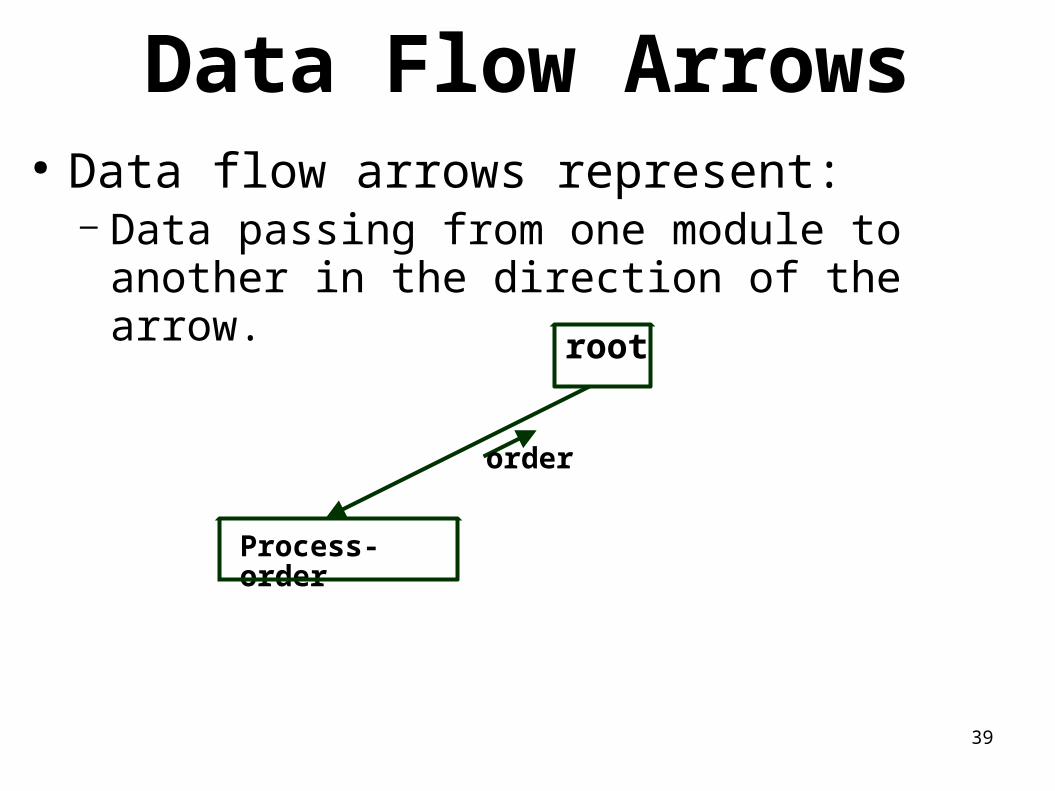
Data Flow Arrows● Data flow arrows represent:
– Data passing from one module to another in the direction of the arrow.
Process-order
root
order

40
Library Modules● Library modules represent frequently
called modules: – A rectangle with double side edges.
– Simplifies drawing when a module is called by several modules.
Quick-sort

41
Selection ● The diamond symbol represents:
– One module of several modules connected to the diamond symbol is invoked depending on some condition.
Process-order Handle-indent
root
Handle-query

42
Repetition● A loop around control flow arrows denotes
that the concerned modules are invoked repeatedly.
Process-order Handle-indent
root
Handle-query

43
Structure Chart● There is only one module at the top:
– the root module.
● There is at most one control relationship between any two modules: – if module A invokes module B,
– Module B cannot invoke module A.
● The main reason behind this restriction:– consider modules in a structure chart to be
arranged in layers or levels.

44
Structure Chart● The principle of abstraction:
–does not allow lower-level modules to invoke higher-level modules:
–But, two higher-level modules can invoke the same lower-level module.

45
Example root
Get-good-data Compute-solution Display-solution
Get-data Validate-data
Valid-numbersValid-numbers
rmsrms

46
Bad Design

47
Shortcomings of Structure Chart
● By looking at a structure chart: – we can not say whether a module calls another module just once or many times.
● Also, by looking at a structure chart:– we can not tell the order in which the different modules are invoked.
48
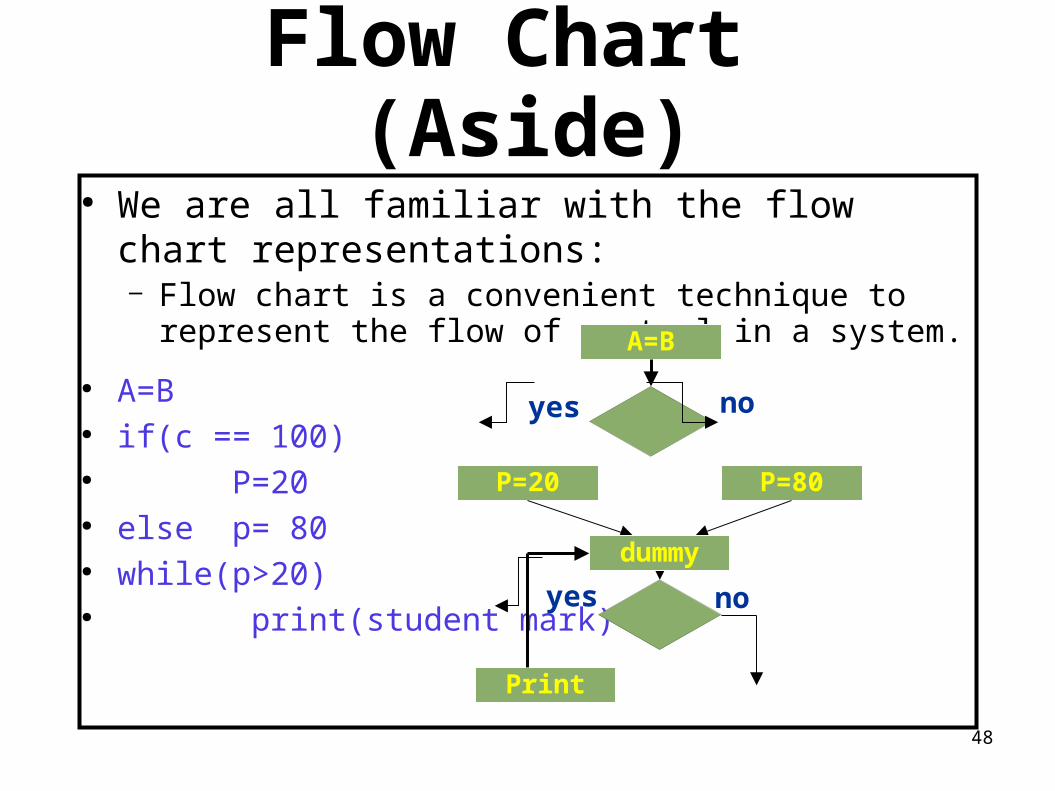
Flow Chart (Aside)● We are all familiar with the flow chart
representations: – Flow chart is a convenient technique to represent
the flow of control in a system.
● A=B● if(c == 100)● P=20● else p= 80● while(p>20)● print(student mark)
A=B
P=20 P=80
yes no
dummy
yes no

49
Flow Chart versus Structure Chart
● A structure chart differs from a flow chart in three principal ways:– It is difficult to identify modules of a
software from its flow chart representation.
– Data interchange among the modules is not represented in a flow chart.
– Sequential ordering of tasks inherent in a flow chart is suppressed in a structure chart.
50
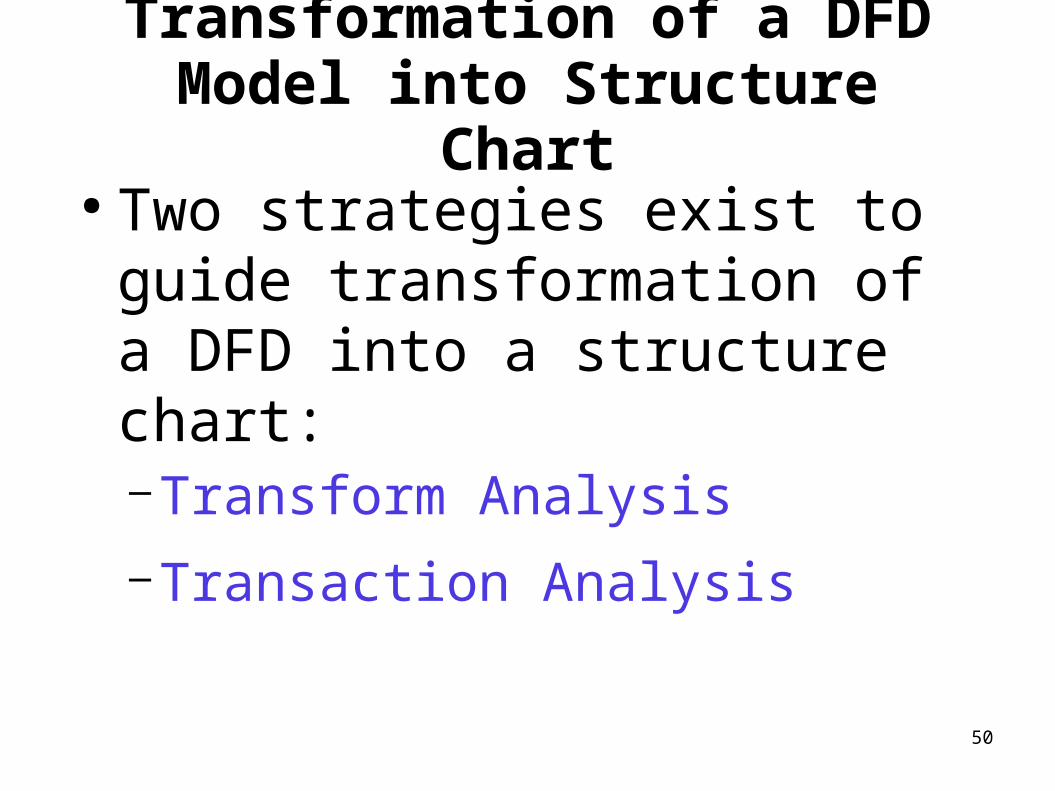
Transformation of a DFD Model into Structure Chart● Two strategies exist to guide transformation of a DFD into a structure chart:–Transform Analysis–Transaction Analysis

51
Transform Analysis● The first step in transform analysis: –Divide the DFD into 3 parts:
● input, ● logical processing, ●output.

52
Transform Analysis● Input portion in the DFD:
– processes which convert input data from physical to logical form.
– e.g. read characters from the terminal and store in internal tables or lists.
● Each input portion: – called an afferent branch.– Possible to have more than one afferent branch in a DFD.
53
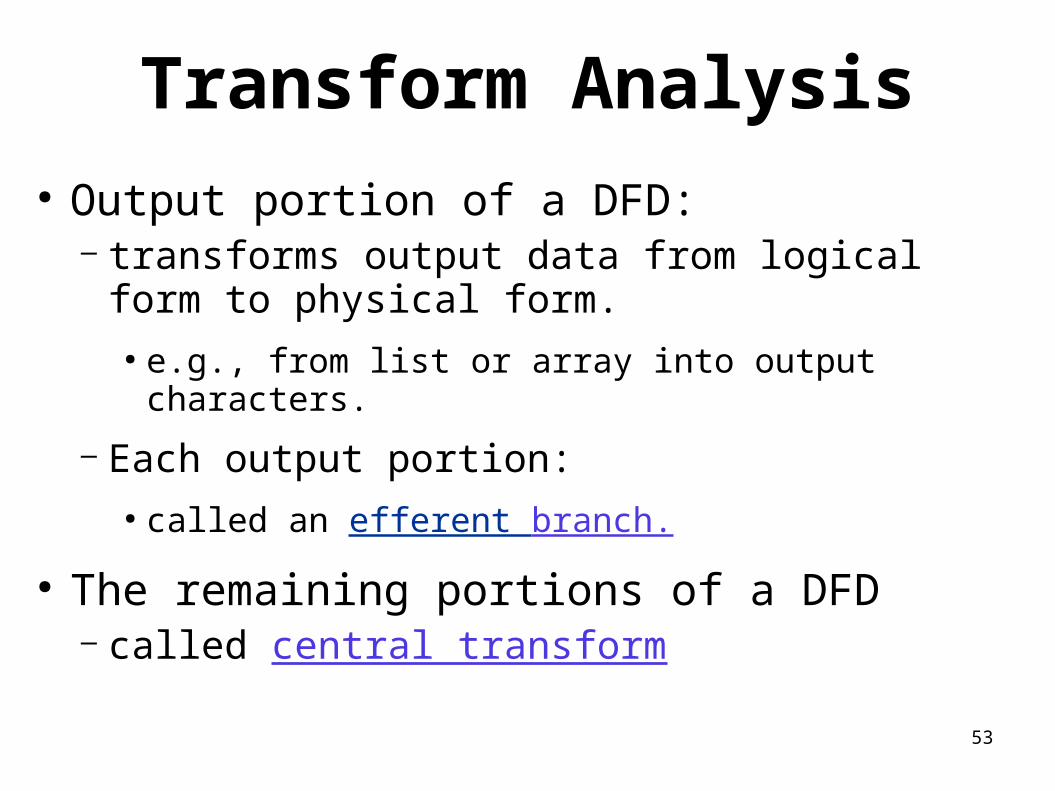
Transform Analysis● Output portion of a DFD:
– transforms output data from logical form to physical form.
● e.g., from list or array into output characters.
– Each output portion: ● called an efferent branch.
● The remaining portions of a DFD– called central transform
54
Transform Analysis
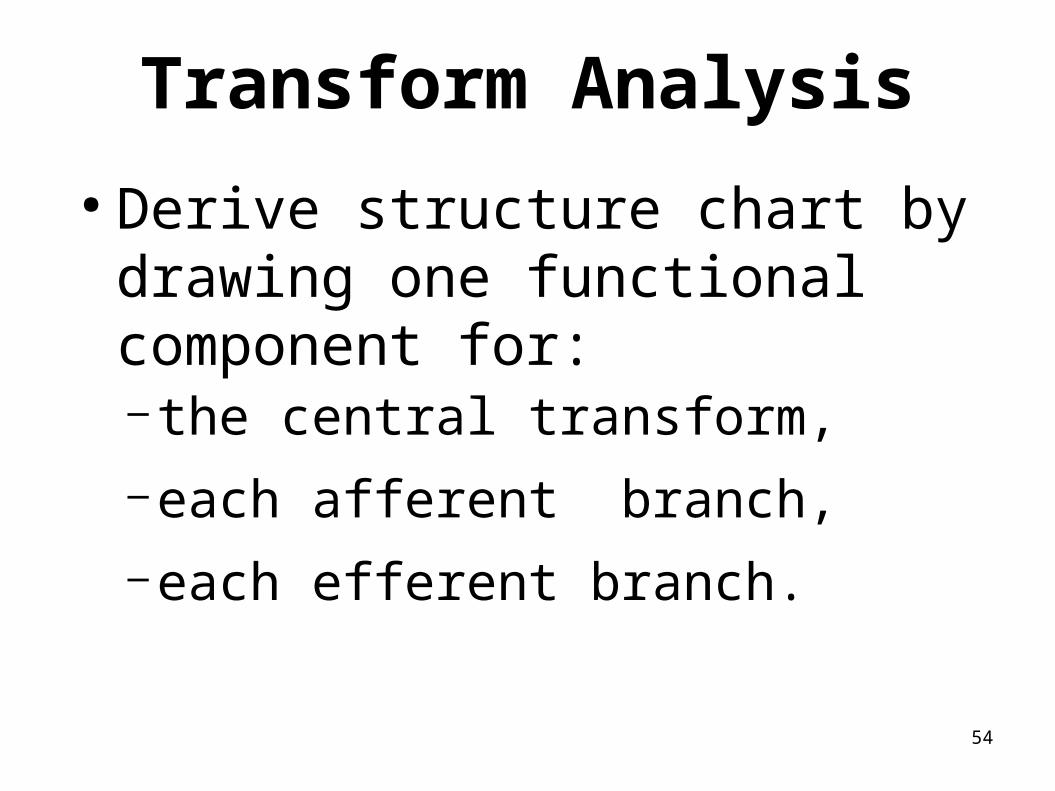
● Derive structure chart by drawing one functional component for: – the central transform, –each afferent branch,–each efferent branch.
55
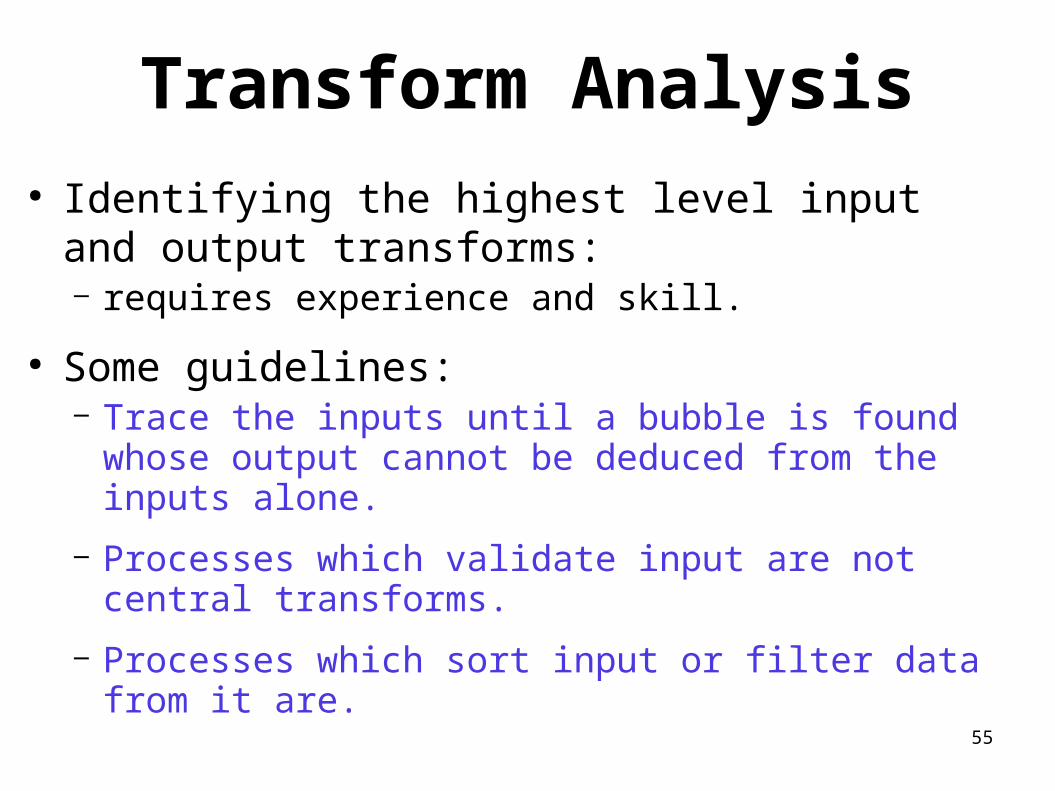
Transform Analysis● Identifying the highest level input and
output transforms: – requires experience and skill.
● Some guidelines:– Trace the inputs until a bubble is found whose
output cannot be deduced from the inputs alone.
– Processes which validate input are not central transforms.
– Processes which sort input or filter data from it are.

56
Transform Analysis● First level of structure chart:
– Draw a box for each input and output units
– A box for the central transform.
● Next, refine the structure chart:– Add subfunctions required by each high-
level module.
– Many levels of modules may required to be added.
57
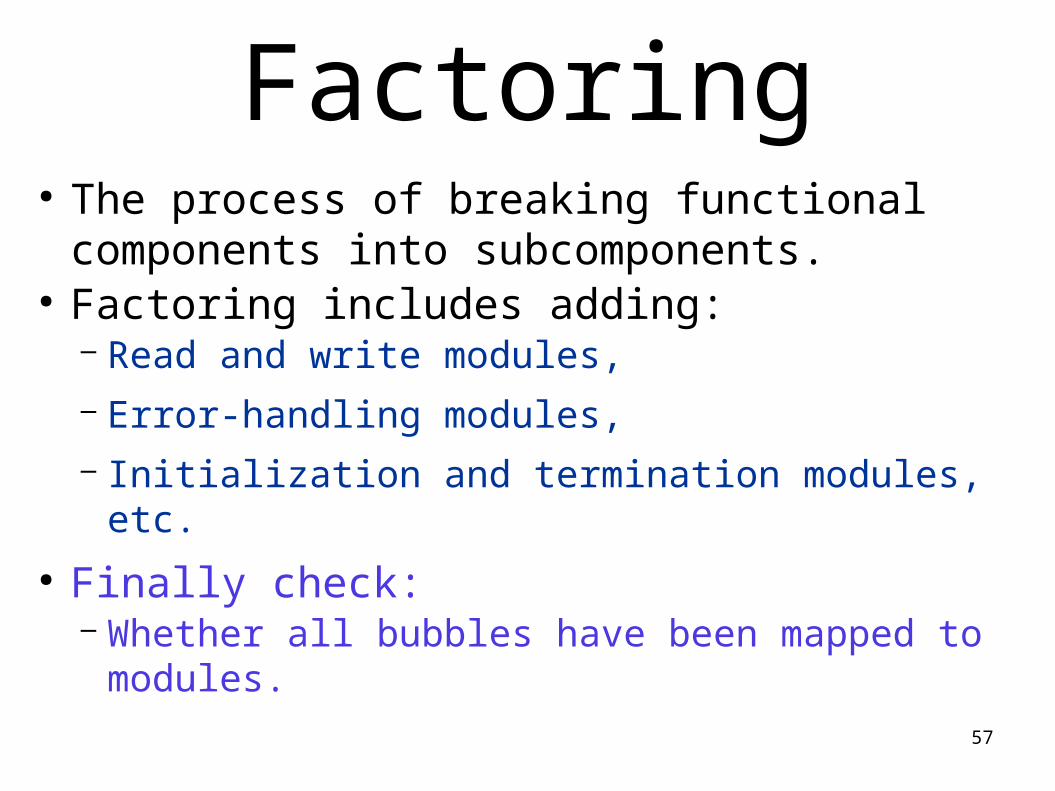
Factoring● The process of breaking functional
components into subcomponents.● Factoring includes adding:
– Read and write modules, – Error-handling modules, – Initialization and termination modules, etc.
● Finally check:– Whether all bubbles have been mapped to
modules.

58
Example 1: RMS Calculating Software
Compute- RMS
0
User
Data-items
result
Context Diagram

59
Example 1: RMS Calculating Software
● From a cursory analysis of the problem description, – easy to see that the system needs to perform:
● accept the input numbers from the user, ● validate the numbers,● calculate the root mean square of the input
numbers, ● display the result.

60
Example 1: RMS Calculating Software
Data-items
result
Read-number
s0.1
Validate-
numbers
0.2
Compute-rms
0.3Display
0.4
RMS
numbers
Valid -numberserror
61
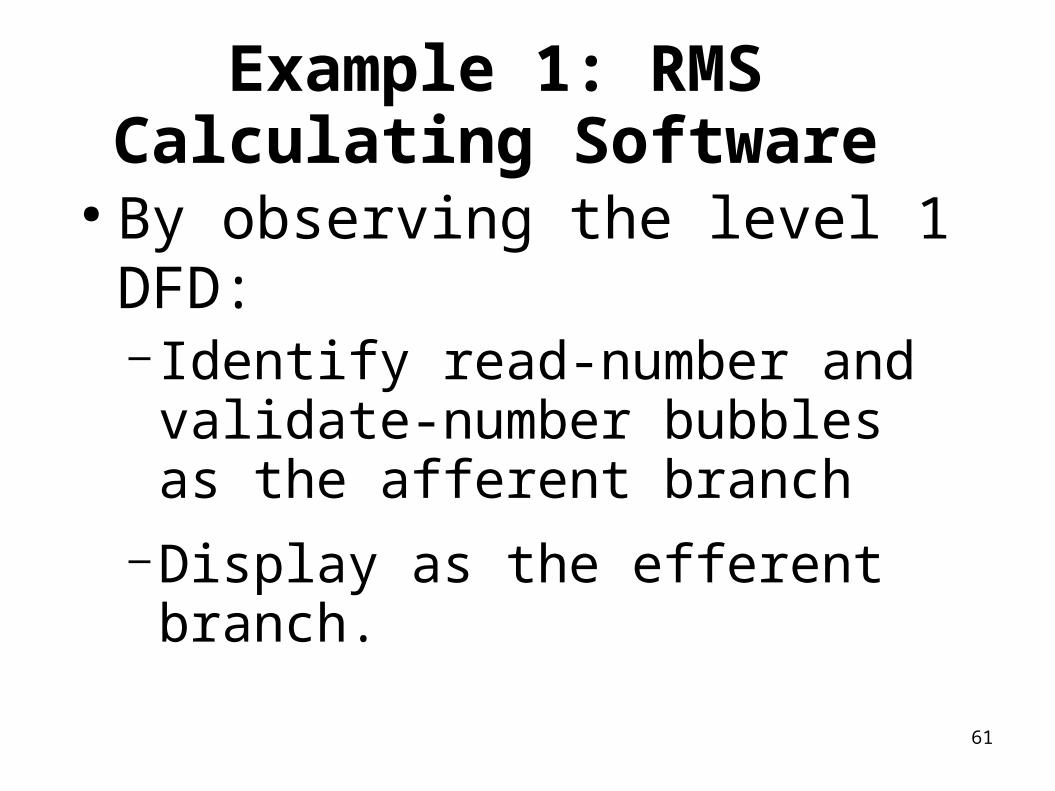
Example 1: RMS Calculating Software
● By observing the level 1 DFD:– Identify read-number and validate-number bubbles as the afferent branch
–Display as the efferent branch.
62
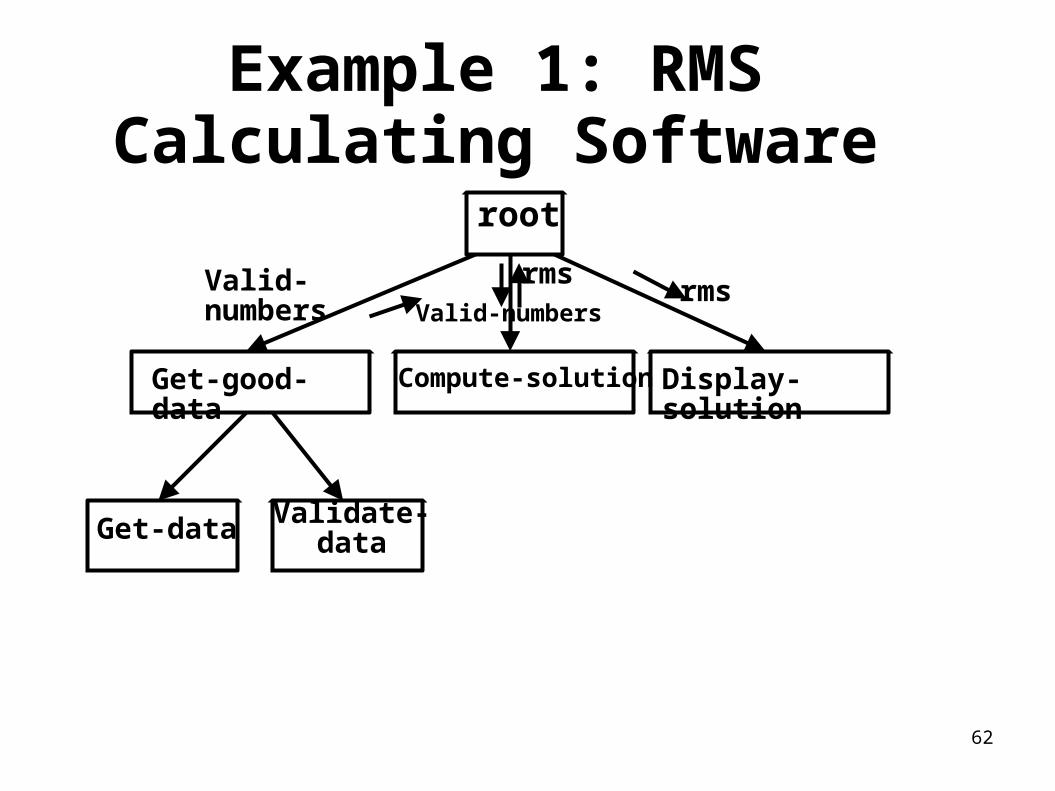
Example 1: RMS Calculating Software
root
Get-good-data
Compute-solutionDisplay-solution
Get-data Validate-data
Valid-numbers Valid-numbers
rmsrms

63
Example 2: Tic-Tac-Toe Computer Game
● As soon as either of the human player or the computer wins, – A message congratulating the winner should be
displayed.
● If neither player manages to get three consecutive marks along a straight line, – And all the squares on the board are filled up,
– Then the game is drawn.
● The computer always tries to win a game.

64
Context Diagram for Example 2
Human Player
Tic-tac-toe
software0
display
move

65
Level 1 DFD
board
Display-board
Check-winner
Validate-move
Play-move
move result
game
66
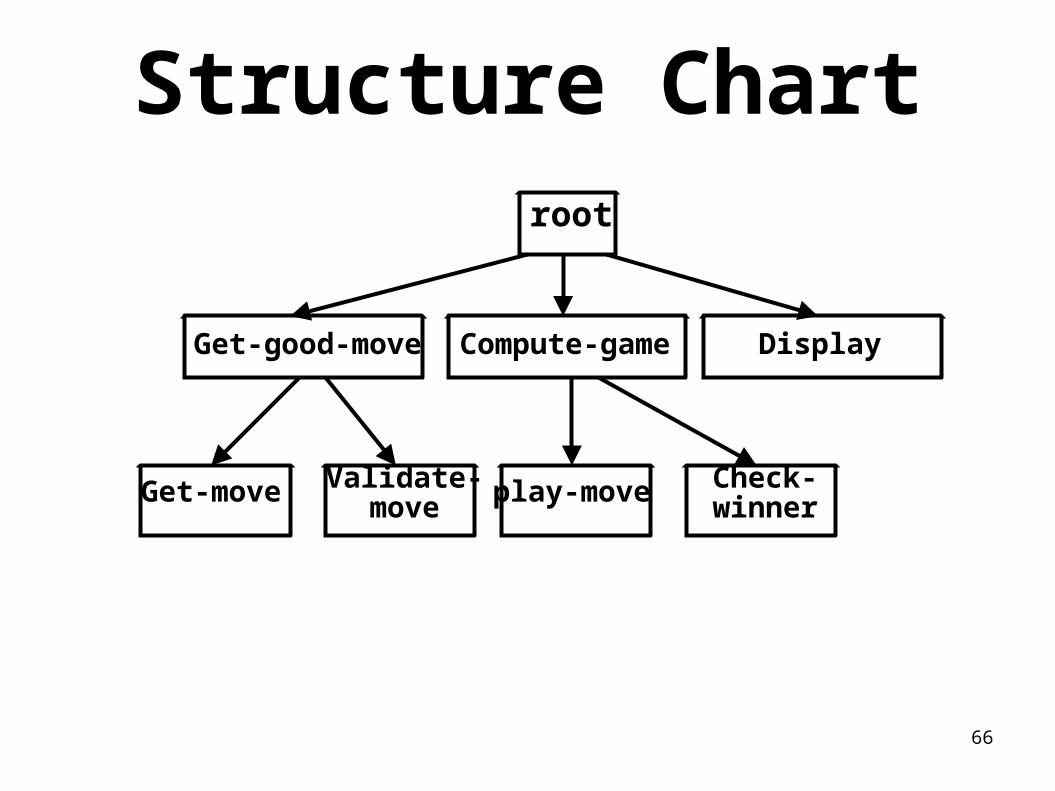
Structure Chartroot
Get-good-move Compute-game
Display
Get-move Validate-move play-move Check-
winner
67
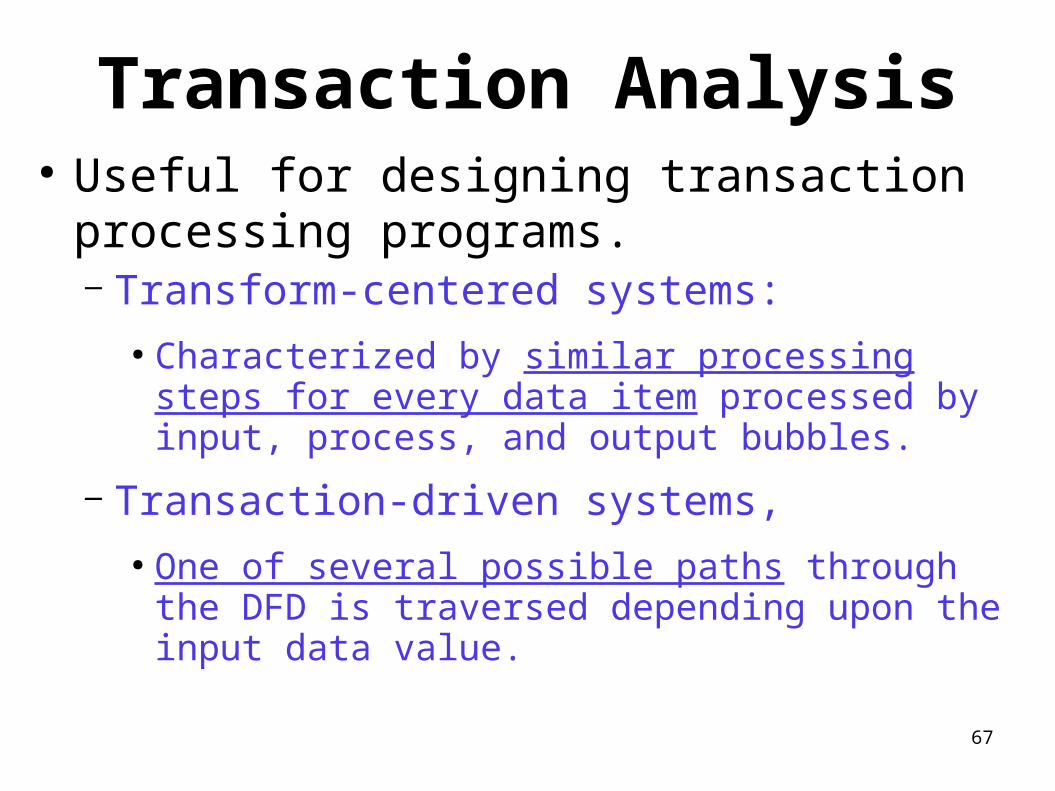
Transaction Analysis● Useful for designing transaction
processing programs. – Transform-centered systems:
● Characterized by similar processing steps for every data item processed by input, process, and output bubbles.
– Transaction-driven systems, ● One of several possible paths through the
DFD is traversed depending upon the input data value.

68
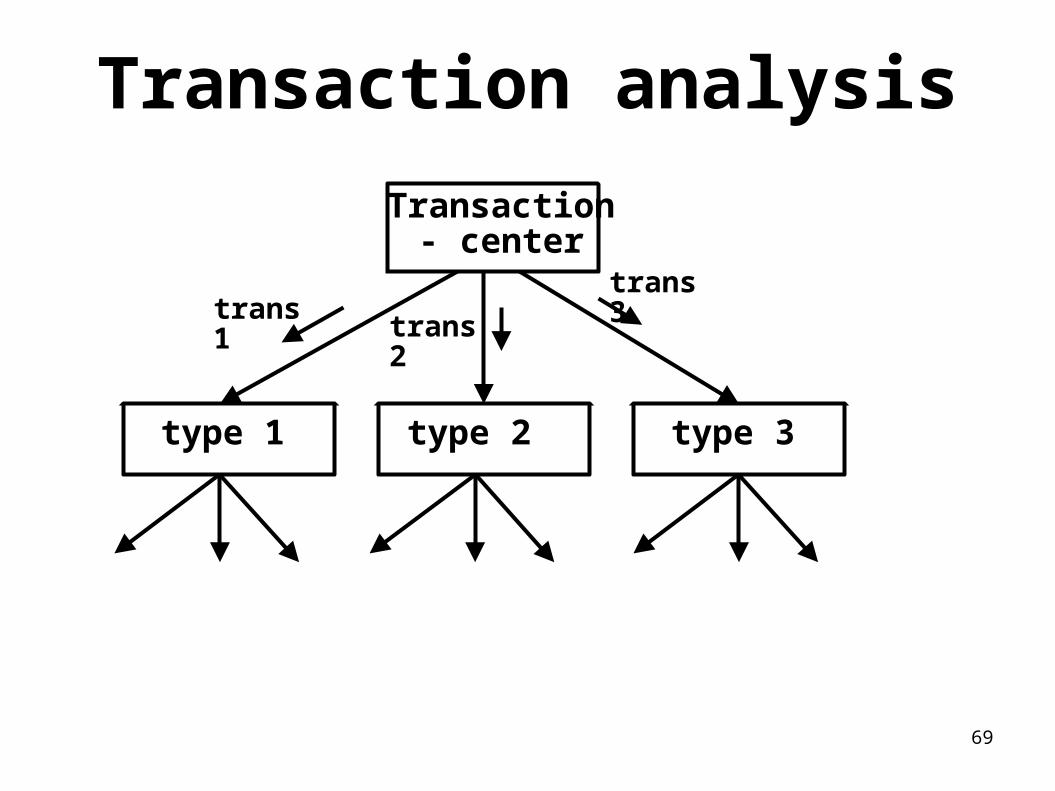
Transaction Analysis
● Transaction:– Any input data value that triggers an
action:– For example, selected menu options might
trigger different functions.– Represented by a tag identifying its type.
● Transaction analysis uses this tag to divide the system into: – Several transaction modules – One transaction-center module.
69
Transaction analysis
Transaction- center
trans 1 trans
2
trans 3
type 1 type 2 type 3
70
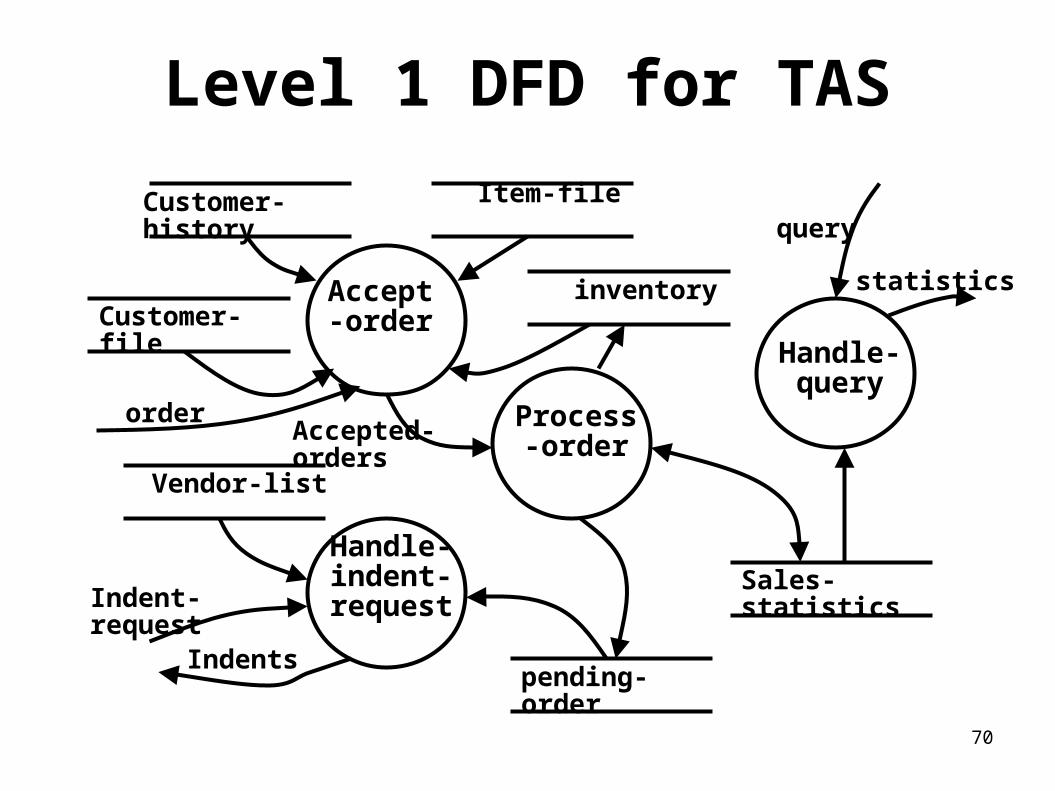
Level 1 DFD for TAS
Accept-order
Process-order
Handle-indent-request
Handle-query
pending-order
Sales-statistics
inventory
Vendor-list
Customer-file
Item-fileCustomer-history
Indent-request
Indents
Accepted-orders
query
order
statistics
71
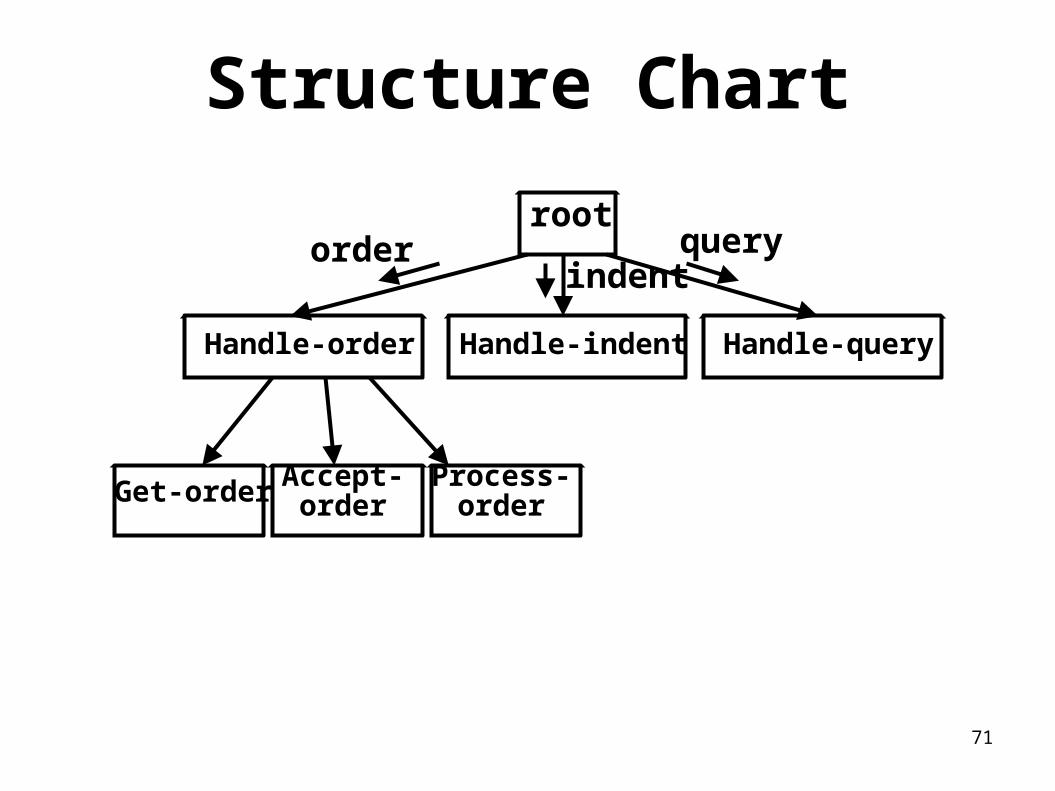
Structure Chart
root
Handle-order Handle-indent Handle-query
Get-order Accept-order Process-order
order queryindent

72
Summary● We first discussed structured analysis of a
larger problem.● We defined some general guidelines
– for constructing a satisfactory DFD model.
● The DFD model though simple and useful– does have several short comings.
● We then started discussing structured design.
73
Summary● Aim of structured design:
– Transform a DFD representation into a structure chart.
● Structure chart represents: – Module structure – Interaction among different modules,
– Procedural aspects are not represented.
74
Summary● Structured design provides two strategies to transform a DFD into a structure chart:–Transform Analysis–Transaction Analysis

75
Summary● We Discussed three examples of
structured design.● It takes a lot of practice to become a
good software designer:– Please try to solve all the problems
listed in your assignment sheet,
– Not only the ones you are expected to submit.