1 A Temporally Consistent NO 2 data record for Ocean Color Work Wayne Robinson, Ziauddin Ahmad,...
21
1 A Temporally Consistent NO 2 data record for Ocean Color Work Wayne Robinson, Ziauddin Ahmad, Charles McClain, Ocean Biology Processing Group (OBPG) NASA, Goddard Space Flight Center ([email protected] ) Tropospheric NO2 measured by satellites Workshop, KNMI, DeBilt, The Netherlands September 10 – 12, 2007
-
Upload
eliza-mich -
Category
Documents
-
view
215 -
download
1
Transcript of 1 A Temporally Consistent NO 2 data record for Ocean Color Work Wayne Robinson, Ziauddin Ahmad,...
1
A Temporally Consistent NO2 data record for Ocean Color Work
Wayne Robinson, Ziauddin Ahmad, Charles McClain,
Ocean Biology Processing Group (OBPG)NASA, Goddard Space Flight Center
Tropospheric NO2 measured by satellites Workshop,KNMI, DeBilt, The Netherlands
September 10 – 12, 2007

2
Background• Ocean Color – starting with satellite top-of-atmosphere
observations, determine the visible radiances leaving the water surface and from them, the chlorophyll concentration and other in-water quantities
• Good ocean color retrievals depend on removing the effects of atmospheric aerosols and gases (about 90% of Lt is atmospheric)
• Many effects have been accounted for (air molecules, ozone, oxygen, moisture, pressure change)
• Recent work has shown importance of NO2 in ocean color retrievals (Ahmad et. al., 2007, Robinson et. al., 2007)
3
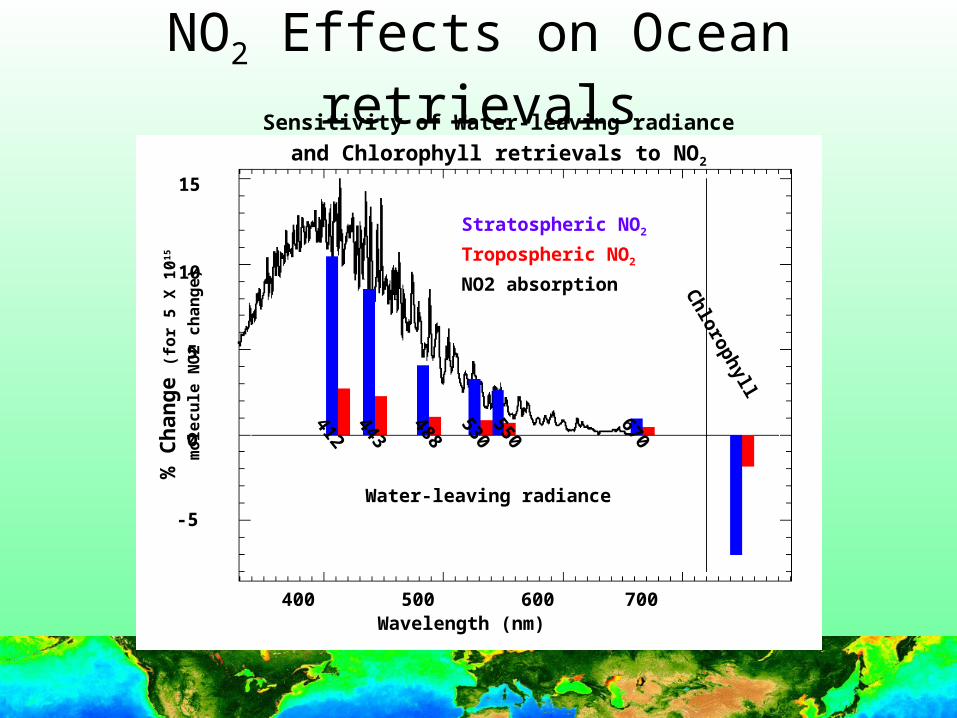
NO2 Effects on Ocean retrievals
Stratospheric NO2
Tropospheric NO2
NO2 absorption
412
443
488
530550
670
Chlorophyll
400 500 600 700Wavelength (nm)
-5
0
5
10
15%
Ch
ang
e (f
or
5 X
10
15
mo
lec
ule
NO
2 c
ha
ng
e)
Sensitivity of Water-leaving radiance
and Chlorophyll retrievals to NO2
Water-leaving radiance
4
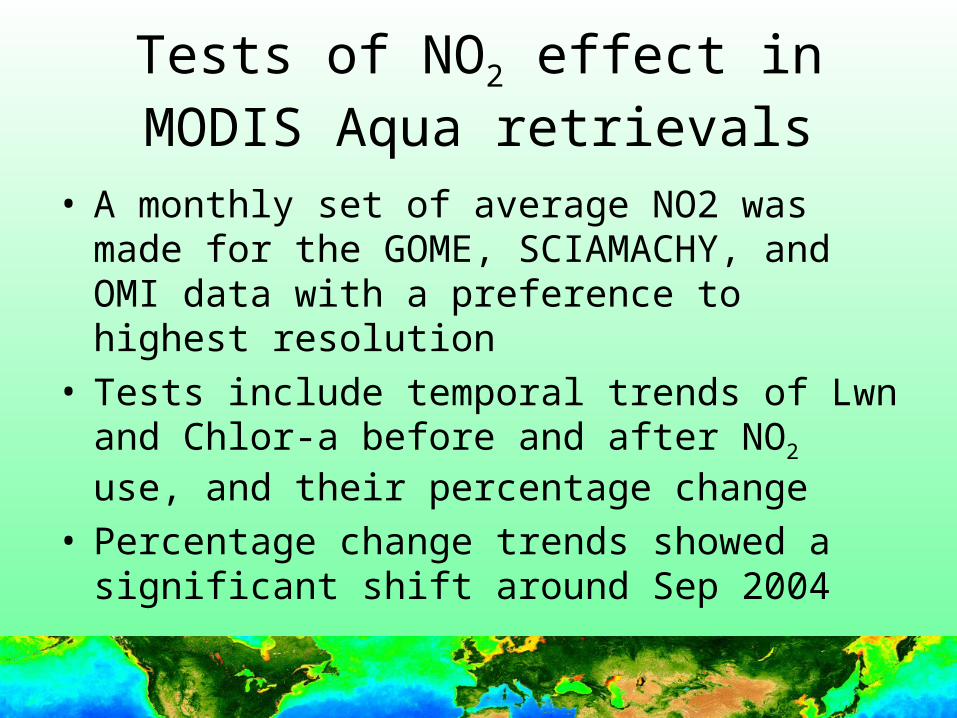
Tests of NO2 effect in MODIS Aqua retrievals
• A monthly set of average NO2 was made for the GOME, SCIAMACHY, and OMI data with a preference to highest resolution
• Tests include temporal trends of Lwn and Chlor-a before and after NO2 use, and their percentage change
• Percentage change trends showed a significant shift around Sep 2004
5
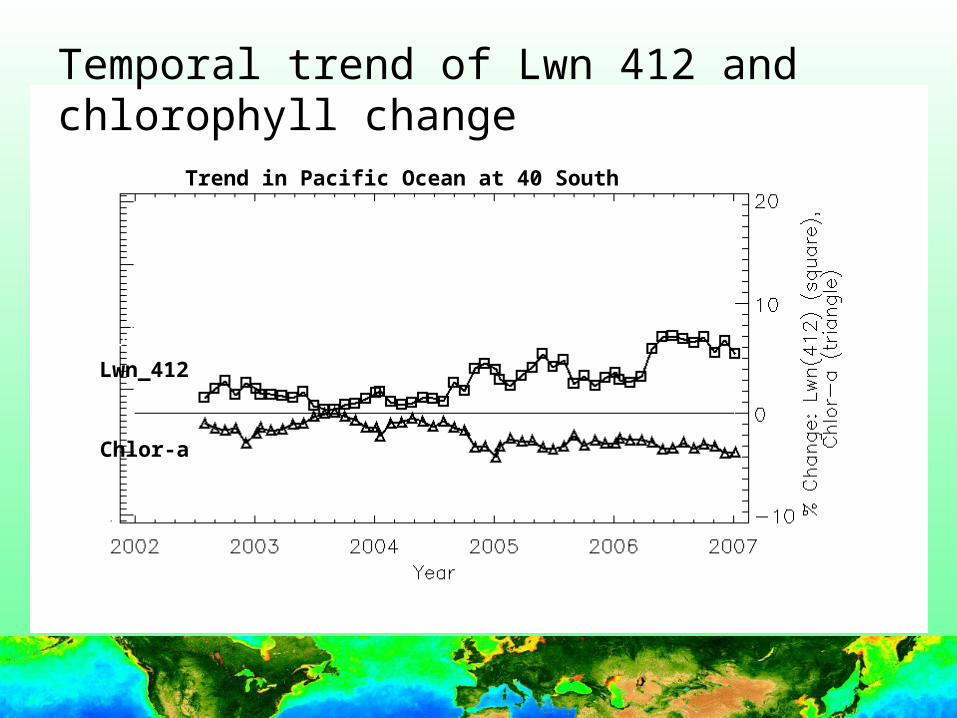
Temporal trend of Lwn 412 and chlorophyll change
Chlor-a
Lwn_412
Trend in Pacific Ocean at 40 South
6
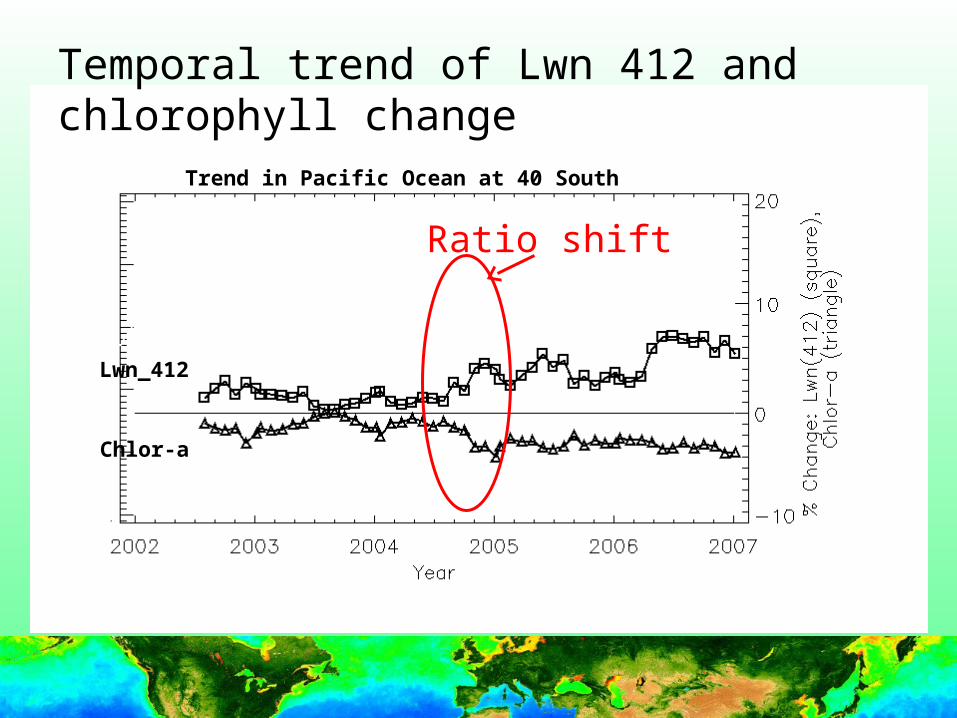
Ratio shift
Temporal trend of Lwn 412 and chlorophyll change
Chlor-a
Lwn_412
Trend in Pacific Ocean at 40 South
7
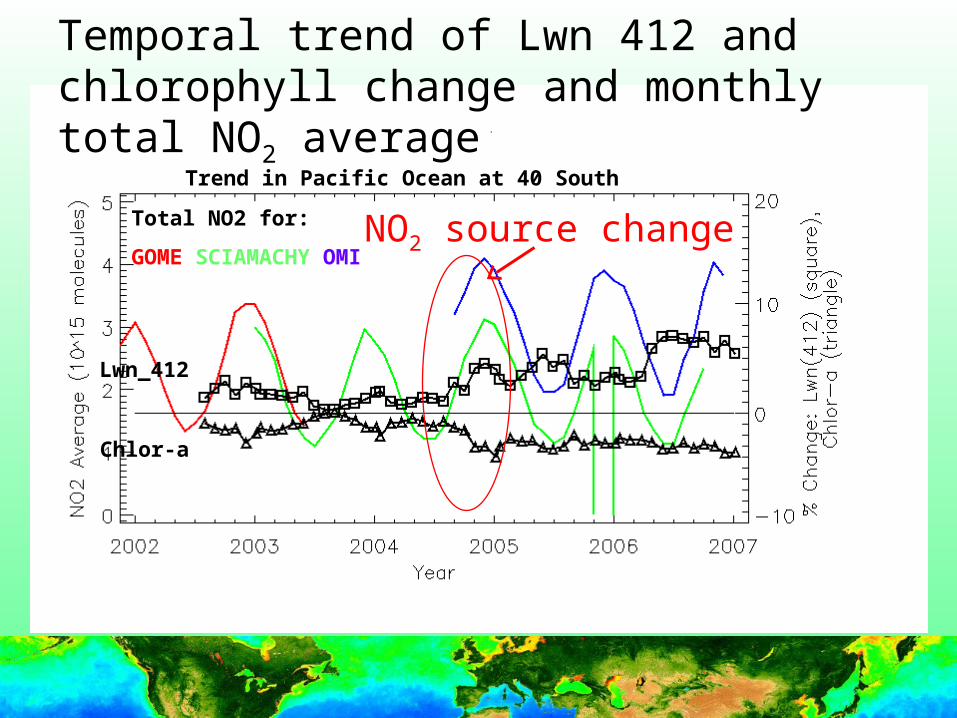
Temporal trend of Lwn 412 and chlorophyll change and monthly total NO2 average
NO2 source changeTotal NO2 for:
GOME SCIAMACHY OMI
Chlor-a
Lwn_412
Trend in Pacific Ocean at 40 South
8
Tests of NO2 effect in MODIS Aqua retrievals
(continued)
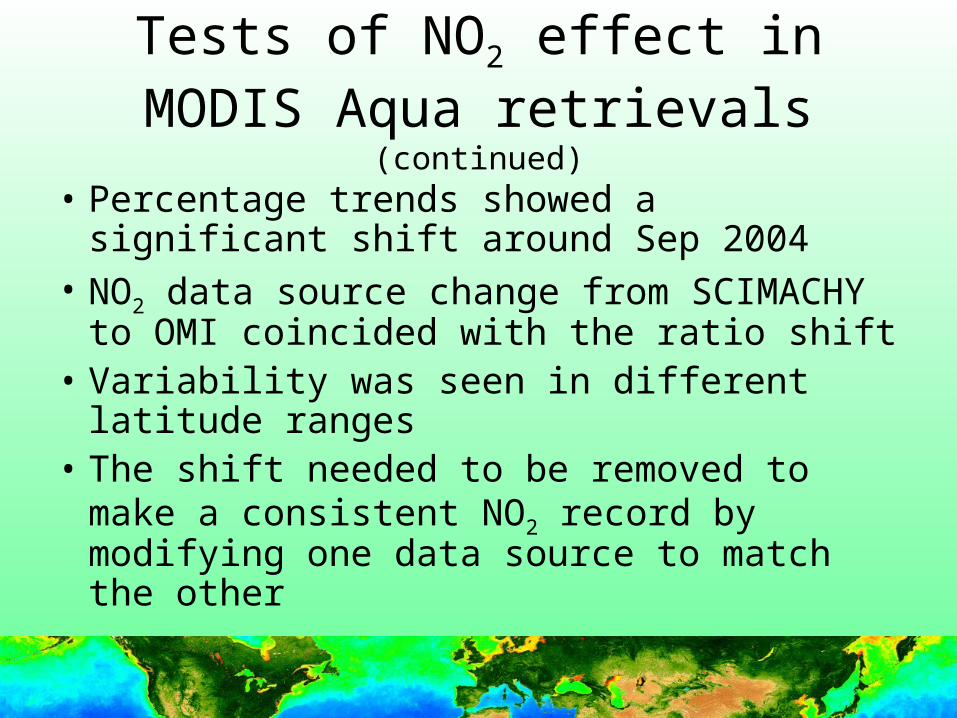
• Percentage trends showed a significant shift around Sep 2004
• NO2 data source change from SCIMACHY to OMI coincided with the ratio shift
• Variability was seen in different latitude ranges
• The shift needed to be removed to make a consistent NO2 record by modifying one data source to match the other
9
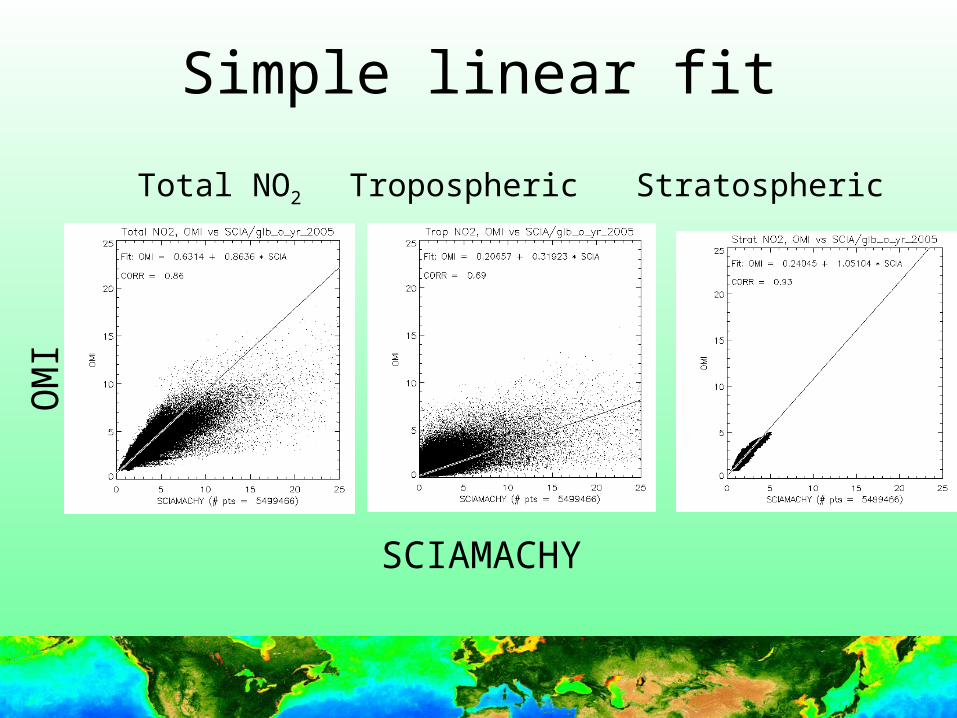
Simple linear fit
Total NO2 Tropospheric Stratospheric
OM
I
SCIAMACHY

10
Problems with linear fit
• Significant biases at some latitudes (esp. 40 S) look for a latitudinal correction
• Non-linear relation for total NO2
determine a non-linear relation
• Low correlation in tropospheric NO2
derive tropospheric NO2 from total - stratospheric
Address these in the correction
11
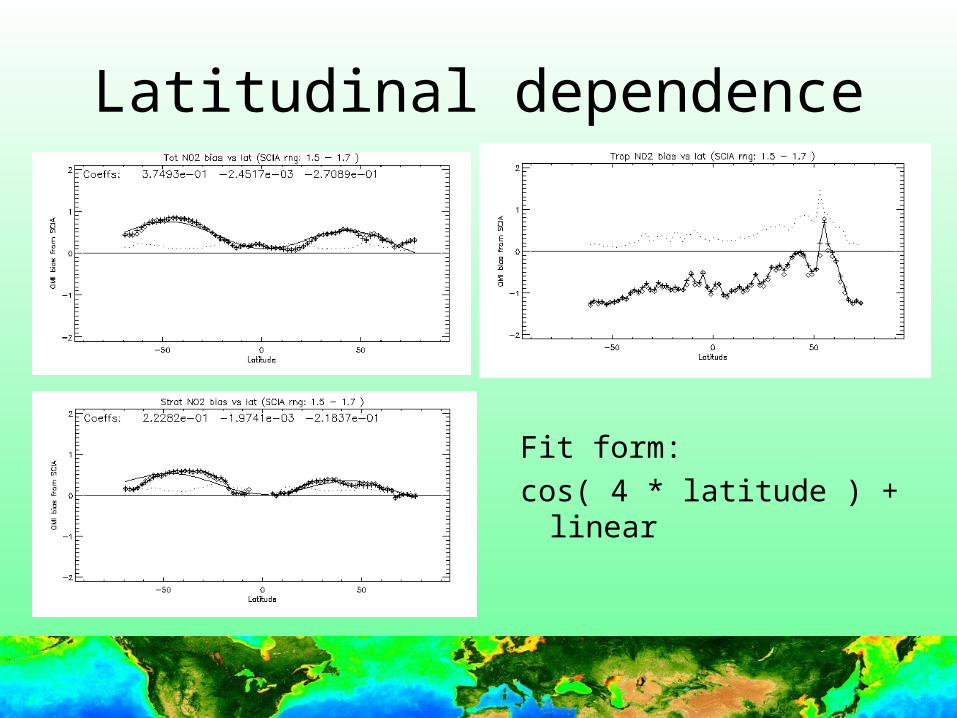
Latitudinal dependence
Fit form:
cos( 4 * latitude ) + linear

12
Latitude dependence, removed
• Note that this technique worked well in other ranges
13
Non-linear relation
• 5 forms of non-linear fit were tested– Best fit was an exponential with constant– Y intercept was relatively low (-0.4 for total)
• Same functional form and coefficients used for stratospheric NO2 (except constant)
– Consistency between stratospheric and total– Fit for total worked relatively well for limited
stratospheric data range
14
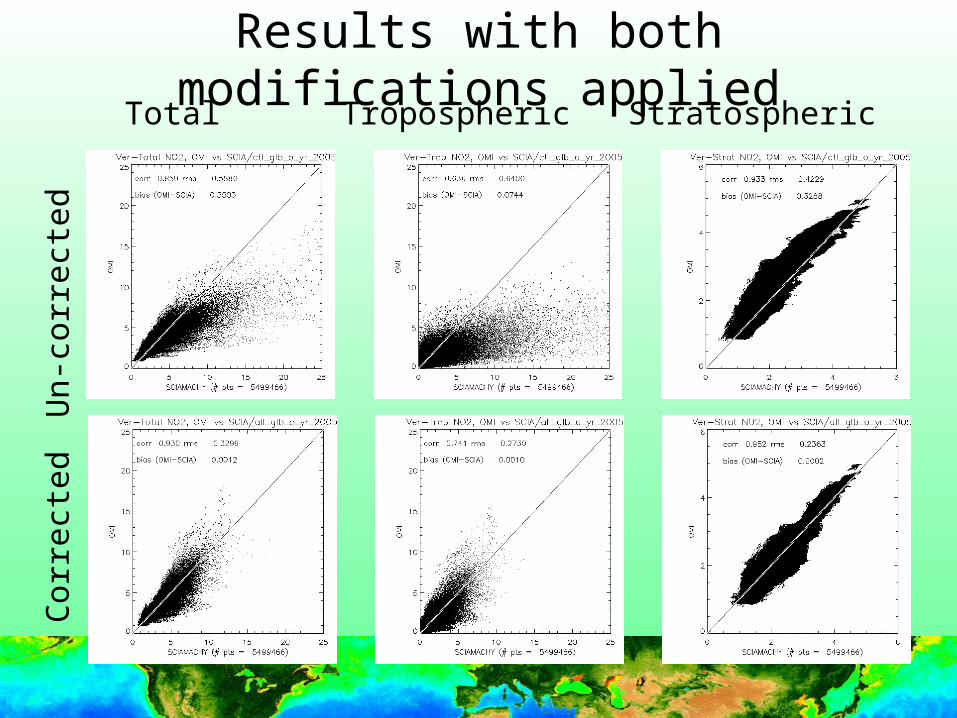
Results with both modifications appliedU
n-co
rrec
ted
Cor
rect
ed
Total StratosphericTropospheric

15
Temporal trend results: before correction
16
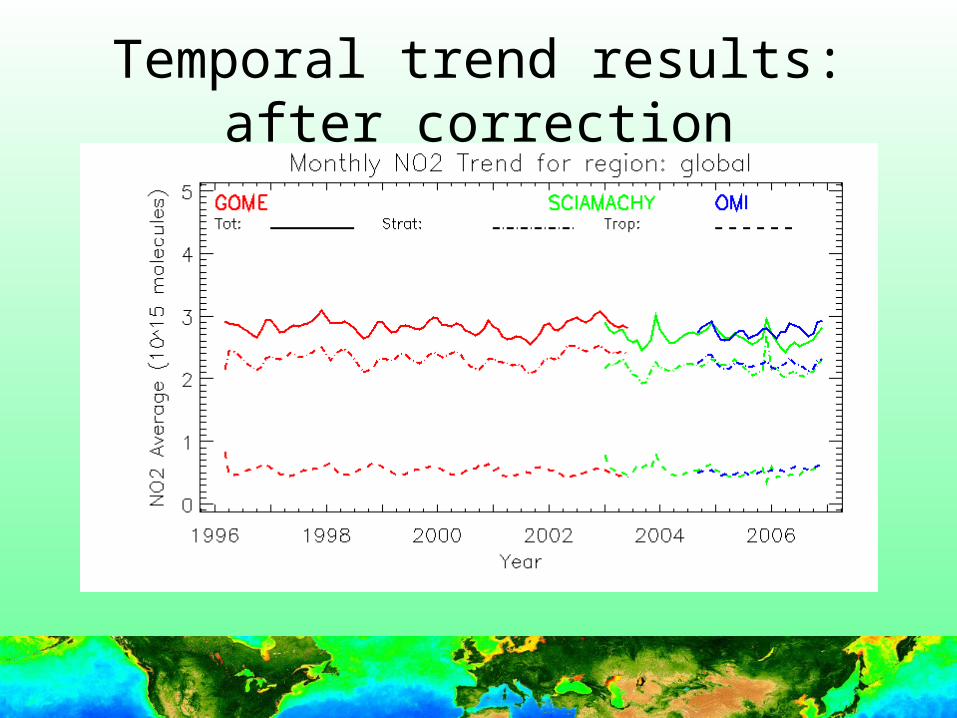
Temporal trend results: after correction
17
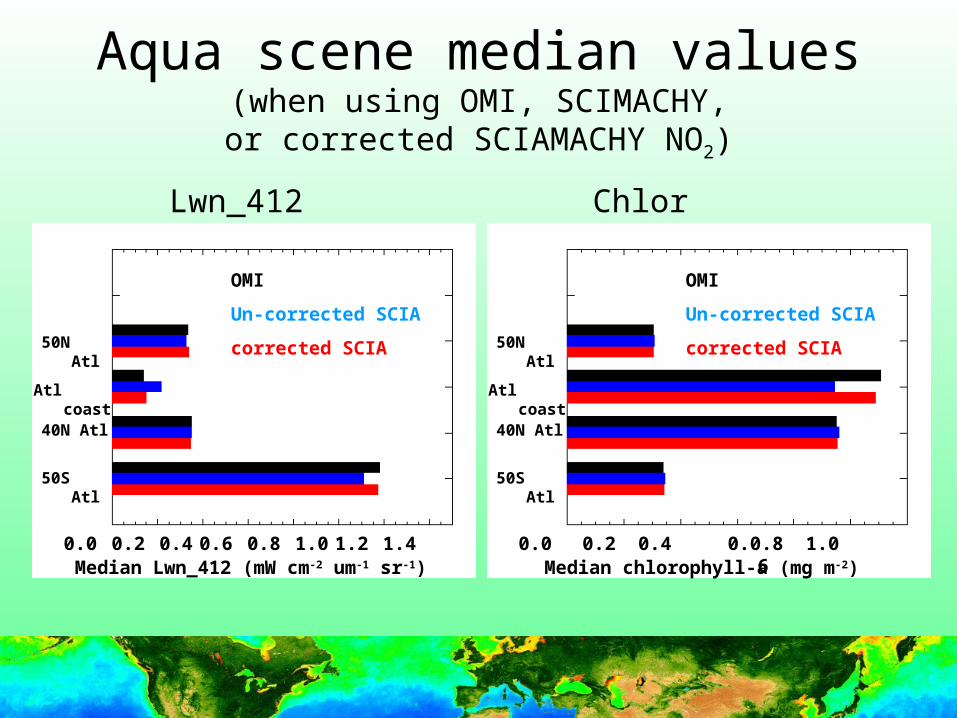
Aqua scene median values(when using OMI, SCIMACHY,or corrected SCIAMACHY NO2)
ChlorLwn_412
237%
OMI
Un-corrected SCIA
corrected SCIA
OMI
Un-corrected SCIA
corrected SCIA50N Atl
Atl coast
40N Atl
50S Atl
0.0 0.2 0.4 0.6 0.8 1.0 1.2 1.4 0.0 0.2 0.4 0.6 1.00.8Median Lwn_412 (mW cm-2 um-1 sr-1) Median chlorophyll-a (mg m-2)
50N Atl
Atl coast
40N Atl
50S Atl
18
Summary
• Modifications to the NO2 data are possible to create more consistent NO2 record for ocean work– Latitudinal modification– Non-linear fit
• Some differences remain and seasonal changes not examined
19
References
• Ahmad, Z., C.R. McClain, J.R. Herman, B. Franz, E.J. Kwiatkowska, W.D. Robinson, E.J. Bucsela, M. Tzortziou, 2007, “Atmospheric Correction for NO2 Absorption in Retrieving Water-Leaving Reflectances from the SeaWiFS and MODIS Measurements”, Appl. Optics 46, pp 6504 – 6512.
• Robinson, W.D., Z. Ahmad, B.A. Franz, S.W. Bailey, C.R. McClain, NO2 Data Use for Ocean Color, on http://oceancolor.gsfc.nasa.gov/staff/wayne/no2/ocrt_talk/ocrt_no2_poster_cor_no2.pdf

20
Extra Slides
21
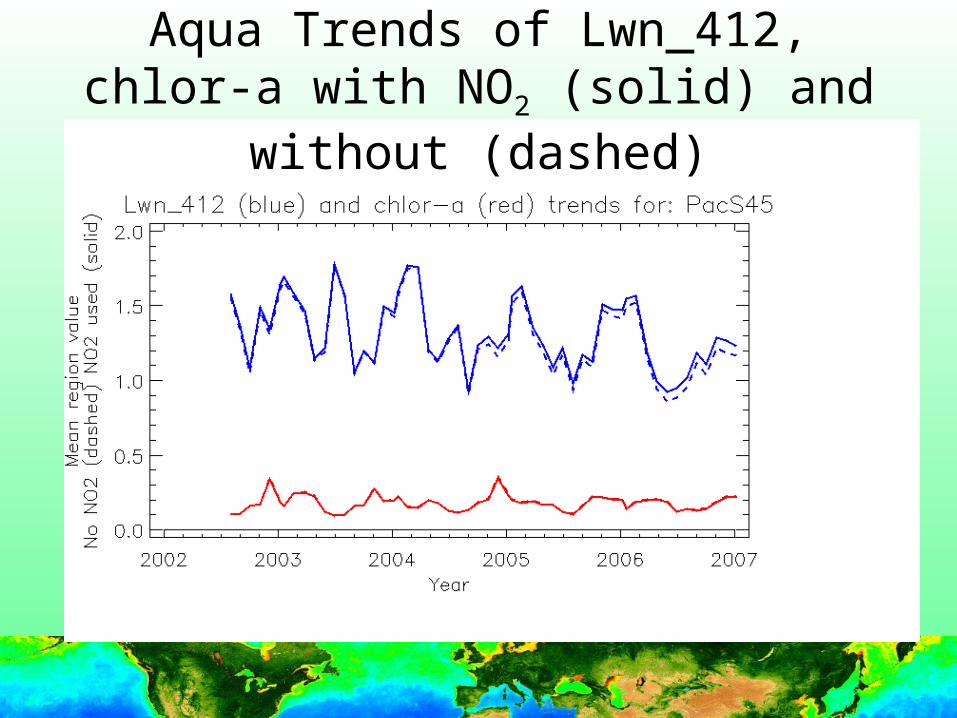
Aqua Trends of Lwn_412, chlor-a with NO2 (solid) and without (dashed)