1 2 3 4 - g5.co.za
27
1 AUDITED GROUP RESULTS for the year ended 30 June 2014 2 Agenda OVERVIEW OF F2014 Section 1 FINANCIAL REVIEW Section 2 SEGMENTAL REVIEW AND PROSPECTS Section 3 GROUP PROSPECTS Section 4 1 2 3 4
Transcript of 1 2 3 4 - g5.co.za

1
AUDITED GROUP RESULTS
for the year ended 30 June 2014
2
Agenda
OVERVIEW OF F2014
Section 1
FINANCIAL REVIEW
Section 2
SEGMENTAL REVIEW AND PROSPECTS
Section 3
GROUP PROSPECTS
Section 4
1 2 3 4

2
3
OVERVIEW OF F2014
4
Financial summary
** F2013 includes losses from Middle East operations and provision for competition commission administrative penalty
*** Including Middle East losses
F2014 vs.
F2013
F2014 Audited
H2 F2014 unaudited
H1 F2014 unaudited
F2013 Audited
Restated*
Revenue – Rm from continuing operations
39% 15 340 7 509 7 831 11 043
Operating profit – Rm** 23% 647 319 328 528
HEPS – Rand 44% 4,07 2,03 2,04 2,83
Fully diluted HEPS – Rand 42% 3,99 1,98 2,01 2,81
Fully diluted HEPS from continuing operations – Rand***
26% 4,00 1,98 2,02 3,18
EPS – Rand 52% 4,01 2,01 2,00 2,64
Fully diluted EPS – Rand 50% 3,94 1,98 1,96 2,62
Dividends per share – cents Maintained policy of 4.0 x covered on adjusted EPS
49% 100,0 55,0 45,0 67,0
Headline earnings:
F2013 incl. losses from Middle East operations, Construction Materials; not material in F2014
F2013 provision for Competition Commission administrative penalty unchanged
* Restated for the adoption of IFRS 11 and IAS 19 (Revised)
OVERVIEW OF F2014

3
5
Revenue: Growth achieved in target sectors and geographies
─ SA power, oil & gas and real estate
─ African mining, transport
Profitability: In line with guidance (except Civil Engineering)
Cash: Pleasing retention of y-o-y cash balance in tough market
BBBEE certification: Reaffirmed as Level 2 contributor at 89.14%
Highlights
SA market: pockets of activity; margins remain under pressure
Civil Engineering: difficult year; slower than expected margin recovery
Labour activism: impacted productivity at some sites; represents 0.1% of group man days worked, limited financial impact*
Lowlights
Results in context
* Refer Appendix 2
OVERVIEW OF F2014
6
FINANCIAL REVIEW

4
7
Income statement
Rm
F2014 vs F2013
%
F2014 Audited
F2013 Audited
Restated*
Revenue from continuing operations 39% 15 340 11 043
Operating profit and margin % including fair value adjustments
F2013: - incl. losses from Middle East operations, not material F2014
- Including provision for competition commission penalty,
unchanged in F2014
23%
647 4.2%
528 4.8%
Profit before interest and taxation 24% 675 543
Finance cost ‒ net - (2) (2)
Profit before taxation 24% 673 541
Effective tax rate % - 34% 38%
Profit from continuing operations 32% 443 335
Loss from discontinued operations Incl. operating losses from Construction Materials and impairment from
Construction Materials
- (3) (48)
Net profit 53% 440 288
* Restated for the adoption of IFRS 11 and IAS 19 (Revised)
FINANCIAL REVIEW
8
* Core margin is total margin adjusted for non-core txns of pension fund gains/deficits, but not adjusted for profit /loss on sale of assets
~ target as guided in H2 F2014 ^ within target if investment costs excluded ** in line with guidance in H2 ‘14
Target range
(set at H1 F2014 reporting date) F2014 Core margin achieved %*
Investments and Concessions 15 – 20% 21.8% Above target
Engineering and Construction
3 – 5%
short-term at lower end of range 2.7% Below target ^
Manufacturing 6 – 8% 8.3% Above target
Construction
Building and
Housing 2 – 4%, short-term low end of range 2.0% On target
Civil
Engineering
4 – 6%, short-term low end of range;
below range ~ 1.8% Below target **
Projects 5 – 8% 6.9% On target
Underlying performance from continuing operations
FINANCIAL REVIEW

5
9
Middle East
‒ Operations closed; costs no longer material (loss R1,5m)
‒ Further progress on final close-out of all matters
‒ Payment flows honoured by clients
‒ Debtors & contracts in progress to recover
Construction Materials
‒ One remaining business, costs no longer material (loss R3,0m)
‒ Interested parties, negotiations in progress
Competition Commission
‒ Leniency obtained on all matters reported
‒ Lack of evidence and factual discrepancies on 4 matters to be settled
‒ Provision assessment of F2013 remains unchanged
‒ Risk of civil claims exists; none received to date
‒ Wider engagement between industry and government has commenced
Legacy issues FINANCIAL REVIEW
10
Cash flow
Working capital
Reduction in advance payment somewhat offset by increase in excess billings
Increase in both current assets and current liabilities with growth in trading
Net finance costs
In line with expectation
Rm
F2014 Audited
F2013 Audited
Restated*
Operating cash 903 685
Working capital changes (519) 267
Finance cost – (net) (2) (2)
FINANCIAL REVIEW
* Restated for the adoption of IFRS 11
Trade and other payables 450 888
Trade and other receivables (597) (811)
Contracts in progress (333) 216
Inventories (39) (26)
Total change (519) 267

6
11
Cash flow
Rm
F2014 Audited
F2013 Audited
Restated*
Operating cash 903 685
Working capital changes (519) 267
Cash generated from operations 384 952
Finance cost – (net) (2) (2)
Cash effects of operating activities (disc. operations) (11) 5
Tax and dividends paid (220) (174)
Net cash generated from operating activities 151 781
Fixed assets and investment property – (net) (160) (238)
Investments and financing – (net) (86) 9
Cash effects of investing and financing activities (disc. operations) 9 16
Effect of exchange rates on cash 41 142
Movement in cash (45) 710
Cash and cash equivalents on hand – end of year 2 921 2 966
Cash and cash equivalents on hand – end of year from cont. operations 2 912 2 954
* Restated for the adoption of IFRS 11
FINANCIAL REVIEW
12
Cash flow
60
1195 956
327
(871)
689
(42)
629
1824
2778 3106
2235 2265
2954 2912
-1000
0
1000
2000
3000
F2007 F2008 F2009 F2010 F2011 F2012 F2013 F2014
Cash generated/(utilised) - net Net cash balance on hand at year-end
36.9% nil nil nil nil nil nil nil
‒ Cash on hand is healthy in current environment
‒ Excess cash will be applied to future equity investments
Rm
Net gearing %
*
* From continuing operations; F2012 and F2013 restated for the adoption of IFRS 11
33
FINANCIAL REVIEW

7
13
Cluster (Rm)
Budget F2015
Original Budget F2014*
Actual F2014
Nature of F2014 spend %
Expansion Replace-
ment Contract specific
Investments and
Concessions 15 17 16 19% 81% -
Engineering and
Construction 13 12 12 52% 48% -
Manufacturing 49 26 38 85% 15% -
Construction 181 254 195 30% 42% 28%
Total 258 309 261 38% 41% 21%
Capital expenditure
Spend relates mainly to rolling replacement of fleet in Intertoll business
Expansionary spend relates to operations and maintenance contracts and nuclear business
Spend relates to (i) capacity expansion; (ii) production line upgrades matched to market demands
Combination of replacement & contract-specific capex for secured Central & Southern African contracts
* Restated for the adoption of IFRS 11
FINANCIAL REVIEW
14
Key financial ratios
F2014 Audited
F2013 Audited
Restated* F2012
Audited
Targets
Net gearing – debt to equity ratio % - - - maximum 33
Cash from operations before working capital changes (Rm)
903 685 425 cash generative
Cash from operations (Rm) 384 952 579 cash generative
Net (decrease) / increase in cash (Rm) – total
(45) 710 24 cash generative
Cash on hand at period end (Rm) – continuing operations
2 912 2 954 2 265 n/a
External guarantees unutilised (Rm) Total facility at year end (Rm)
8 739 12 382
5 652 10 021
5 837 10 147
Sufficient for tender
Return on shareholders equity – % 16.8% 13.0% (14.1%) 15% - 20% medium - long term
Return on shareholders equity – % – continuing operations **
17.3% 16.1% 10.3% 15% - 20% medium - long term
** Excludes Construction Materials, includes Middle East
* Restated for the adoption of IFRS 11 and IAS 19 (Revised)
FINANCIAL REVIEW

8
15
SEGMENTAL REVIEW AND PROSPECTS
Group overview
16 Group strategy: Capacity to deliver over the whole lifecycle The group’s strategy has 4 components:
Capability to deliver over the whole lifecycle
Multiple revenues and improved blended margin
SEGMENTAL REVIEW

9
17
14% 1%
16%
18%
6%
32%
13%
Mining
Industrial
Power
Oil & gas
Water
Real estate
Transport
2%
8% 1%
4%
76%
9%
West Africa
Central Africa
East Africa
Eastern Europe
South Africa
Rest of Southern Africa
R15,340 bn
Traded group revenue
R15,340 bn
By geography By sector
Achieving geographic and sector diversity
SEGMENTAL REVIEW
18
Group structure aligned to deliver the strategy SEGMENTAL REVIEW

10
19
Investments and
Concessions
Engineering and
Construction Manufacturing Construction
Transport
Real Estate
Power
Oil & Gas
Nuclear
Fibre Cement
Steel
Building and Housing
Civil Engineering
Projects
SEGMENTAL REVIEW AND PROSPECTS
20
*F2014 vs
F2013
23.7 23.9
21.8
15
20
25
2012 2013 2014
648
729
905
500
650
800
950
2012 2013 2014
Investments and Concessions
154 174
197
90
140
190
2012 2013 2014
Core Operating Profit (incl. FVAs^) +13%* Revenue + 24%*
Rm Rm
^ FVA = Fair Value Adjustments - Refer Note 12, F2014 AFS for detail of basis of valuation
30%
of F14 group core operating profit
Core Operating Margin %
%
SEGMENTAL REVIEW
Investments and Concessions
Target range 15-20%

11
21
Transport
* O+M = Operations and Maintenance Services; (refer O+M* order book) ** O+M specific to transport concessions, excludes E+C O+M of R284m externally assured
Period under review
Intertoll Europe
Strong performance on existing portfolio
‒ good operating performance continued
‒ growth in value of equity investments
‒ cost efficiencies delivered good results
Intertoll Africa
Annuity income from SANRAL CTROM contracts
‒ award of Magalies N4 West using in-house toll
system
6 of 9 Zimbabwe toll plazas operational as planned
Secured concessions O+M * order book R4,3bn** conservative value
Going forward
Intertoll Europe
Wider geographical focus further East
‒ clear targets in Bosnia, Bulgaria, Croatia,
Russia and Turkey
‒ expect to secure new work by F2016
Intertoll Africa
SANRAL CTROM: new tenders in H1 2015
Zimbabwe O+M* roll-out completion by H2 F2015
Developing new concessions and O+M * projects in
Africa for F2015/16
‒ Ghana, DRC, Nigeria, Kenya & Zimbabwe
Cluster target margin range remains 15 - 20%
SEGMENTAL REVIEW
Investments and Concessions
22
Going forward
Expansionary African footprint:
Real Estate
Period under review
Progress on track on secured private sector development projects:
Kalahari mall retail Upington Operating well
Capital Place mixed use Ghana Under construction
St Aidan’s residential JHB Under construction
The Angle on Oxford mixed use JHB Market testing in progress
Kleinbron industrial Cape Town Bulk infrastructure commenced
Capital Place nearing completion Ghana
New projects in pipeline Ghana
Advanced targeted projects Uganda, Tanzania, Kenya & Nigeria
Cluster target margin range remains 15-20%
SEGMENTAL REVIEW
Investments and Concessions

12
23
Infrastructure Concessions pipeline Project Country ± Rm* Status
N1-N2 Toll Road SA 10,000 Preferred bidder – Court process continues
National route upgrade Phase II Zimbabwe 1,500 In principle funding approved; target close H2 F2015
Accra – Kumasi Road Concession
Ghana 3,000 Final consortium negotiations, preferred bidder status
Various Infrastructure S+E**Africa >3,500 Progressing submissions in support of funding
Power Projects Bulgaria >1,000 Securing equity partner – increased interest post Euro zone crisis
City of Tshwane HQ SA 1,000 Preferred bidder; target close H1 F2015; early works started
Dept. of RD+LR HQ SA 1,000 Preferred bidder; target close H2 F2015
Public Buildings S+E**Africa >2,000 Feasibility studies underway
Kleinbron – industrial & residential SA 500 Internal infrastructure start H1 F2015
Bar Beach Integrated Development
Nigeria 2,500 Negotiating anchor tenants
Pegasus Retail Development Kenya 300 Feasibility
TOTAL >26bn
C
on
cess
ion
s
PPP’s
Infr
a-
stru
ctur
e S
ervi
ced
Bui
ldin
gs
Rea
l Est
ate
dev’s
SEGMENTAL REVIEW
Investments and Concessions
* Total project value, Group Five and other consortium members ** Southern and East Africa
24
Project Country ± Rm* Status
N1-N2 Toll Road SA 10,000 Preferred bidder – Court process continues
National route upgrade Phase II Zimbabwe 1,500 In principle funding approved; target close H2 F2015
Accra – Kumasi Road Concession
Ghana 3,000 Final consortium negotiations, preferred bidder status
Various Infrastructure S+E**Africa >3,500 Progressing submissions in support of funding
Power Projects Bulgaria >1,000 Securing equity partner – increased interest post Euro zone crisis
City of Tshwane HQ SA 1,000 Preferred bidder; target close H1 F2015; early works started
Dept. of RD+LR HQ SA 1,000 Preferred bidder; target close H2 F2015
Public Buildings S+E**Africa >2,000 Feasibility studies underway
Kleinbron – industrial & residential SA 500 Internal infrastructure start H1 F2015
Bar Beach Integrated Development
Nigeria 2,500 Negotiating anchor tenants
Pegasus Retail Development Kenya 300 Feasibility
TOTAL >26bn
C
on
cess
ion
s
PPP’s
Infr
a-
stru
ctur
e S
ervi
ced
Bui
ldin
gs
Rea
l Est
ate
dev’s
Embraces all 4 elements of group growth strategy:
1. Sector expansion
2. Geographic expansion
3. Multidisciplinary expansion
4. Annuity income expansion
* Total project value, Group Five and other consortium members ** Southern and East Africa
Infrastructure Concessions pipeline SEGMENTAL REVIEW
Investments and Concessions
13
25
Investments and
Concessions
Engineering and
Construction Manufacturing Construction
Transport
Real Estate
Power
Oil & Gas
Nuclear
Fibre Cement
Steel
Building and Housing
Civil Engineering
Projects
SEGMENTAL REVIEW AND PROSPECTS
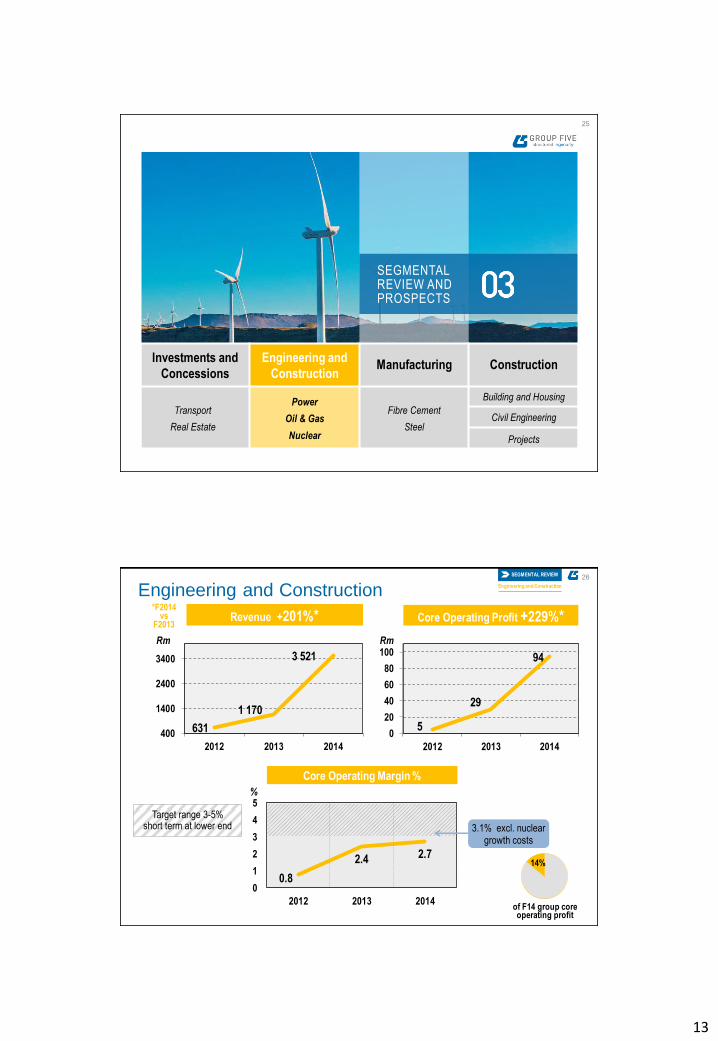
26
Revenue +201%* Core Operating Profit +229%*
Core Operating Margin %
631
1 170
3 521
400
1400
2400
3400
2012 2013 2014
5
29
94
0
20
40
60
80
100
2012 2013 2014
Engineering and Construction
14%
0.8
2.4 2.7
0
1
2
3
4
5
2012 2013 2014
*F2014 vs
F2013
Rm Rm
%
SEGMENTAL REVIEW
Engineering and Construction
3.1% excl. nuclear growth costs
Target range 3-5% short term at lower end
of F14 group core operating profit

14
27
Engineering and Construction
* Renewable Energy Independent Power Producer Programme
Period under review
Power Oil & Gas
South Africa
3 of 4 REIPP* projects connected to Eskom grid
- Klipheuwel Wind 27MW - Dec 13
- Noblesfontein Wind 74MW - April 14
- Touwsrivier Solar 36MW - Jan 14
Jasper Solar 75MW - connection target Sept 14
South Africa
Lagging margins pending final completion
agreements on a current contract
- Substantial increase in scope of work
Strong client base for maintenance, turnaround
and construction contracts
Rest of Africa
ABA gas Nigeria - completed
Kuvaninga gas Mozambique - in progress
Increased bankable IPP tendering activity
Rest of Africa
Developing market in East Africa
Nuclear
South Africa
First contract for Eskom Koeberg Power Station now in early construction phase
SEGMENTAL REVIEW
Engineering and Construction
28
Engineering and Construction
Going forward
South Africa & Rest of Africa
Power
Multiple opportunities have long lead times - lumpy order book
Demand for mining & industrial captive power - F2015/16
Bidding REIPP^ Window 3 & 4
– biomass, wind & solar technologies
– Window 3 – at least one award likely in H1 F2015
West and East Africa gas turbine IPP power bids submitted
‒ R4bn contract progressing to Aug 2014 award
- will significantly increase order book & African footprint
Renewable power slowly expanding into Africa
Oil & Gas
Clean Fuels has been delayed.
Developing opportunity:
– Mozambique LNG^^ projects – bids in progress
– Ghana storage projects
– Tanzania gas systems
Nuclear
2nd Koeberg upgrade bid in adjudication
Secured O+M * order book R284m** conservative value
* O+M = Operations and Maintenance Services (refer O&M order book)
** O+M specific to industrial, oil & gas and power, excludes I&C O+M of R4,3bn, externally assured
Cluster target margin range remains 3-5%; short term at lower end of range
R1 174m order book
74% SA 26%
over-border
SEGMENTAL REVIEW
Engineering and Construction
^ Renewable Energy Independent Power Producer Programme ^^ Liquid Natural Gas

15
29
Investments and
Concessions
Engineering and
Construction Manufacturing Construction
Transport
Real Estate
Power
Oil & Gas
Nuclear
Fibre Cement
Steel
Building and Housing
Civil Engineering
Projects
SEGMENTAL REVIEW AND PROSPECTS
30
*F2014 vs
F2013
1 024 1 061 1 039
700
850
1000
1150
2012 2013 2014
47**
84 86
0
30
60
90
2012 2013 2014
Manufacturing
Revenue -2%* Core Operating Profit +3%*
** R11m closure costs included in F2012 operating results
13%
4.5
7.9 8.3
3
5
7
9
2012 2013 2014
Rm Rm
Core Operating Margin %
%
SEGMENTAL REVIEW
Manufacturing
Target range 6-8%
of F14 group core operating profit

16
31
Manufacturing
Period under review
Everite & ABT
Stagnant domestic volumes
New production line fully commissioned
‒ relieves flat sheet supply constraint
ABT modular housing revenue down
‒ delivery matched with client funding availability
BRI
Margins remain low due to excess market capacity
Steel Pipe
Strong revenue & margin growth in F14
De-bottlenecking capex released capacity
Going forward
Everite & ABT
Traditional building material market flat, offset by:
‒ focus on export markets
‒ added traded complimentary products
Primary equipment upgrades continue
ABT poised for growth
‒ growing demand
‒ improved public sector funding availability
BRI
Focus on lowest cost in tight margin environment
Markets showing some early signs of recovery
Steel Pipe
Water infrastructure gaining momentum
‒ order book remains reasonably strong
‒ margins maintained
Cluster target margin range remains 6-8%
SEGMENTAL REVIEW
Manufacturing
32
Investments and
Concessions
Engineering and
Construction Manufacturing Construction
Transport
Real Estate
Power
Oil & Gas
Nuclear
Fibre Cement
Steel
Building and Housing
Civil Engineering
Projects
SEGMENTAL REVIEW AND PROSPECTS

17
33
52 40
91
116
266 277
(38)
109 66
102
116 120
-100
0
100
200
300
400
2012 2013 2014
2 066
3 236 4 430
2 998 3 217
3 760
1 416 1 718 1 741
6 480
8 171
9 931
500
3000
5500
8000
10500
2012 2013 2014
Construction
Total Revenue +22%*
Projects
Construction total
Building & Housing Civil Engineering 65%
Rm
Core Operating Profit +4%* *F2014
vs F2013
42%
43%
Rm
SEGMENTAL REVIEW
Construction
of F14 group core operating profit
34
1.8
3.3 2.8
0
1
2
3
4
5
2012 2013 2014
Target ranges
2.5 1.2 2.0
0
1
2
3
4
5
2012 2013 2014
Building & Housing
(1.3)
3.4 1.8
-2
0
2
4
6
2012 2013 2014
Civil Engineering
Construction
Core Operating Margins %
F2013 margins include provision for Competition Commission SA penalty
Construction Total
7.2
6.7
6.9
4
5
6
7
8
9
2012 2013 2014
Projects
SEGMENTAL REVIEW
Construction
%
%
% %

18
35
Construction
Period under review
Building and Housing Civil Engineering
South Africa
High levels of turnover
Margins improving in building
Successful awards in mine housing
and healthcare
Rest of Africa
Capital Place in completion
South Africa and Rest of Africa
As at H1, margins were negatively impacted by two contracts
Loss-making DRC mining contract incurred further losses in H2
‒ now complete & valuable lessons learnt, nearing final account
‒ excluding this contract:
• would have achieved lower end of guided range
• group’s contract loss ratio would improve from 23% to 18%
Constructive commercial engagement on both contracts
Middle East
Close-out near complete; payments received per plan
Projects
South Africa
Continued to perform well in mining
(coal) and power sectors
Active in electrical disciplines
Rest of Africa
New mining work in Liberia progressing well
DRC project nearing completion
Awarded large uranium project in Namibia
SEGMENTAL REVIEW
Construction
36
100% SA
R6 833m order book
Going forward
Housing: South Africa
Large order book
Delayed major low-cost / social housing projects
renewed focus for new minister
Housing solutions for mining industry in demand
Housing: Rest of Africa
Interest in mining housing remains
- little traction in the short term
Major mining and oil & gas projects require
construction villages
Building: South Africa
Excellent order book
Margins should continue to slowly improve
Good prospects in coastal regions
Subcontractors and suppliers will remain stretched
Building: Rest of Africa
Short-term prospects in West Africa in bidding
Focus on private developments
Continue to work with G5 Property developments
on a number of opportunities
Building and Housing
0% Over-border
Segment target margin range remains 2-4%, short term at lower end of range
SEGMENTAL REVIEW
Construction
19
37
25%
over-border
75%
SA
R2 442m order book
Civil Engineering
Going forward
South Africa
Tender market expected to remain highly competitive
Delayed rollout of public infrastructure projects to continue into F2015
Activity levels remain quiet across sectors – some activity in roads, private power, water
Some restructuring in progress
Rest of Africa
Opportunities in SADC and in West Africa
Keys sectors will be power, transport and oil & gas
Mining sector slower
Middle East
Focus on agreeing final accounts & collecting cash
Segment target margin range reduced to 3-5%
SEGMENTAL REVIEW
Construction
38
28%
SA
R2 100m order book
72%
over-border
Going forward
South Africa
Mining opportunities:
‒ target opportunities in coal and zinc
‒ gold and platinum particularly weak
Further construction opportunities in renewable
energy prospects
Rest of Africa
Mining activities slower
Power opportunities in conjunction with E&C
Renewed focus on industrial sector
Reduced cross-border work, in the short term
Projects
Segment target margin range remains 5-8%
SEGMENTAL REVIEW
Construction

20
39
Order books
Group outlook
GROUP PROSPECTS
40
Rm
Actual revenue
F2012 F2013 F2014
Transport 555 654 834
Industrial, Oil & Gas 126 59 224
Power - - -
Total 681 713 1 058
Order book: Secured operations and maintenance* – annuity income
F2015
3-year to
F2018
836 1 763
92 -
38 127
966 1 890
* Total secured order book is:
valuation to first review date of secured contracts only
externally assured for the first time in F2014
valued using real cash flows (excluding escalation clauses)
Total
secured *
4 316
92
192
4 600
Order book
* Total R4,6bn order book
R4,8bn - Dec 2013
R4,5bn - Oct 2013
R4,8bn - June 2013
R4,6bn - Dec 2012
GROUP PROSPECTS
Order Books

21
41
Order book still weighted towards SA
Not reflective of over-border replenishment effort
Merely time lag as new projects have long lead times
Total
Building &
Housing
Civil
Engineering Projects E+C
Total order book – Rm 12 549 * 6 833 2 442 2 100 1 174
% Over-border 20% -% 25% 72% 26%
Public over-border 4% - 19% - -
Private over-border 16% - 6% 72% 26%
% Local 80% 100% 75% 28% 74%
Public local 37% 42% 55% 6% 31%
Private local 43% 58% 20% 22% 43%
* Values include only Group Five’s portion of fully secured construction work, externally assured
GROUP PROSPECTS
Order Books Order book: Secured Contracting* - (Construction and E+C)
* Total R12,5bn order book
R14,0bn - Dec 2013
R14,6bn - Oct 2013
R14,2bn - June 2013
R13,5bn - Dec 2012
42
Total
Building &
Housing
Civil
Engineering Projects E+C
Total order book – Rm 12 549 * 6 833 2 442 2 100 1 174
% Over-border 20% -% 25% 72% 26%
Public over-border 4% - 19% - -
Private over-border 16% - 6% 72% 26%
% Local 80% 100% 75% 28% 74%
Public local 37% 42% 55% 6% 31%
Private local 43% 58% 20% 22% 43%
1 year order book from 1 July 14 Rm 9 269 4 667 1 767 1 744 1 091
1 year order book as % of F2014 revenue 70% 105% 47% 100% 33%
Total order book as % of F2014 revenue 95% 154% 65% 121% 36%
Building & Housing and Projects improved their order book during year
E&C in advanced negotiations for large contract which, if awarded, increases order book materially
Civil Engineering order book remains a focus
* Values include only Group Five’s portion of fully secured construction work, externally assured
GROUP PROSPECTS
Order Books Order book: Secured Contracting* - (Construction and E+C)

22
43
By geography By sector
Secured total* order book
7%
1%
12%
7%
9%
31%
33%
Mining
Industrial
Power
Oil & gas
Water
Real estate
Transport
22%
1%
1%
51%
11%
14% 6% 1%
30%
5% 7%
25%
26%
* Total order book comprises secured Contracting and O+M order books
Refer Appendix 1 for graphical representation of Contracting order book
R17,150 bn R17,150 bn
R21,504 bn R21,504 bn
For illustrative purposes
If R4bn* gas
turbine
contract is won
* To be traded over 3 financial years
2% 1% 1%
64%
14%
18% West Africa
Central Africa
East Africa
South Africa
Rest of Southern Africa
Eastern Europe
GROUP PROSPECTS
Order Books
44
Multi-year target opportunity pipeline* Total as at 30 June 2014: R202bn Dec
2013 Pre-Tender & Tender^
International split Local split Total
Total By sector (Rbn) Total Private Public Total Private Public
Mining 28 28 - 22 20 2 50 42 21
Industrial 2 2 - 2 2 - 4 2 2
Power 17 14 3 22 18 4 39 32 29
Oil & Gas 19 14 5 7 5 2 26 26 13
Water - - - 10 - 10 10 13 2
Building 1 1 - 8 5 3 9 9 4
Housing 2 1 1 4 - 4 6 5 2
Transport 22 15 7 36 11 25 58 45 31
Total 91 75 16 111 61 50 202 174 104
Pre-Tender & Tender^
57 49 8 47 29 18 104
45% = International opportunities
25% = SA public sector
* These are the projects targeted by the group – not to be confused with the Contracting (Construction and E+C) order book
^ Value within the multi-year opportunity pipeline in pre-tender and tender stage
Outlook in favour of key growth sectors of mining, oil & gas, power and transport
63% of group awards during the period came from the pipeline presented in June 2013
GROUP PROSPECTS
Order Books

23
GROUP PROSPECTS
45
Order books
Group outlook
46
* O+M = Operations & Maintenance Services
South Africa
Pockets of activity in power, water, transport and real estate (healthcare) sectors
Increased labour activism
No indications of government infrastructure expansion plan yet
Competition revelations has impacted government’s confidence
– A dialogue with government has commenced through industry bodies
Africa
Concession demand improving; specific projects under development
– Pulls through group capabilities in contracting and O+M*
45% of pipeline ex-SA, robust in mining, power, oil & gas, transport
20% of Contracting (Construction and E+C) order book in Africa
‒ 25% of Civil Engineering order book
‒ 72% of Projects order book
‒ 26% of E+C order book, future orientation in Africa
Eastern Europe
Current project portfolio delivering solid results
New target transport concessions markets to benefit medium - long term growth
O+M* opportunities will feed short term incremental growth
GROUP PROSPECTS
Group Outlook Group outlook

24
47
Group outlook
Order books
Total reported order book at R17,1 bn
‒ Contracting R12,5 bn
‒ Operations & Maintenance R4,6 bn
Cash and balance sheet
Retained cash on hand of R2,9 bn, unchanged y-o-y
Strong balance sheet - net ungeared
Earnings Short term outlook largely unchanged from current levels. Medium term stronger
Returns
Group margin
Margin pressure likely to remain around current levels into H1 F2015
‒ Higher contribution from Building & Housing
‒ Pressured SA Civil engineering market
‒ SA content weighting in short term order book
Total ROE at 16.8% (F2013*: 13.0%)
ROE from continuing operations at 17.3% (F2013*: 16.1%)
GROUP PROSPECTS
Group Outlook
* Restated for the adoption of IFRS 11 and IAS 19 (Revised)
48
Executive Committee and Board Changes Executive Committee member - Group Human Resources
Jessie Doorasamy appointed as head of group HR
8 years of executive experience in the group
Is driving capacity building and further group transformation
Group Chief Executive Officer
After 8 years as the Group CEO, Mike Upton is approaching the Group's executive retirement age of 60 at the end of the year
The Board has accordingly initiated a process well ahead of time to appoint Mike Upton's successor and expects to be able to make an announcement within the next few months
Board of Directors
Appointment of prominent non-executives, bringing new perspectives in support of group strategy
Justin Chinyanta A Zambian National with Pan African business experience
Willem Louw Ex Sasol senior executive with large project execution experience
Babalwa Ngonyama Experienced businesswoman and chartered accountant
Vincent Rague A Kenyan national experienced in Pan African project finance
Mark Thompson Ex CFO of Sappi Group and a globally experienced finance executive
GROUP PROSPECTS
Group Outlook

25
49
Progress on group strategy underpins medium term growth
SA: power, oil & gas, nuclear Rest of Africa: power, mining, oil & gas
Growing multi-disciplinary work
Europe: transport concessions Africa : concessions, PPPs, transport, real
estate developments, power, public buildings
Growing annuity income
Geographic expansion
Especially:
power, real estate, oil & gas, transport, water, African mining
Focus on regions of higher GDP growth with need for infrastructure development: Africa: mining, power, oil & gas, transport Europe: transport
Earnings resilience
Aligning with growth sectors
GROUP PROSPECTS
Group Outlook
50
QUESTIONS & ANSWERS

26
51
Forward looking statements
This presentation which sets out the year end results for Group Five Limited for the year ended 30 June 2014 contains ‘forward-looking
statements’, which have not been reviewed or reported on by the Group’s auditors, with respect to the Group’s financial condition, results
of operations and businesses and certain of the Group’s plans and objectives. In particular, such forward looking statements include
statements relating to, amongst others, the Group’s future performance; future capital expenditures, acquisitions, divestitures, expenses,
revenues, financial conditions, dividend policy, and future prospects; business and management strategies relating to the expansion and
growth of the Group; the effects of regulation of the Group’s businesses by governments in the countries in which it operates;
expectations regarding the operating environment and market conditions.
Forward-looking statements are sometimes, but not always, identified by their use of a date in the future or such words as ‘will’,
‘anticipates’, ‘aims’, ‘could’, ‘may’, ‘should’, ‘expects’, ‘believes’, ‘intends’, ‘plans’ or ‘targets’. By their nature, forward-looking statements
are inherently predictive, speculative and involve risk and uncertainty because they relate to events and depend on circumstances that
will occur in the future, involve known and unknown risks, uncertainties and other facts or factors which may cause the actual results,
performance or achievements of the Group, or its industry to be materially different from any results, performance or achievement
expressed or implied by such forward-looking statements.
Forward-looking statements are not guarantees of future performance and are based on assumptions regarding the Group’s present and
future business strategies and the environments in which it operates now and in the future. Undue reliance should not be placed on such
statements and opinions because by nature, they are subjective to known and unknown risk and uncertainties and can be affected by
other factors that could cause actual results and Group plans and objectives to differ materially from those expressed or implied in the
forward looking statements. Neither the Group nor any of its respective affiliates, advisors or representatives shall have any liability
whatsoever (based on negligence or otherwise) for any loss howsoever arising from any use of this presentation or its contents or
otherwise arising in connection with this presentation and do not undertake to publicly update or revise any of its opinions or forward
looking statements whether to reflect new information or future events or circumstances otherwise.
For more information please contact:
Chief Financial Officer
Telephone: +27 10 060 1555
Email: [email protected]
Chief Executive Officer
Telephone: +27 10 060 1555
Email: [email protected]
Our website: www.groupfive.co.za
Mike Upton
Cristina Freitas Teixeira
52

27
53
By geography By sector
Appendix 1: Secured contracting* order book
10% 1%
15%
8%
12%
44%
10% Mining
Industrial
Power
Oil & gas
Water
Real estate
Transport
28%
1%
1%
60%
10% 6% 1%
37%
6% 9%
33%
8%
R12,549 bn R12,549 bn
* To be traded over 3 financial years
For illustrative purposes
R16,903 bn R16,903 bn
4% 2% 1%
80%
13% West Africa
Central Africa
East Africa
South Africa
Rest of Southern Africa
APPENDIX
* Secured contracting order book is the value of the Construction and E+C order books
If R4bn* gas
turbine
contract is won
54
Appendix 2: Strike activity in F2014
Cluster Business Union
Total
Strikes
Protected
Strikes
Man days
Lost
Construction Building and
Housing NUM 4 1 2,640
Construction Civil Engineering NUM, BCAWU,
AUBTW 3 2 20,498
Engineer and
Construct Oil & Gas NUM, NUMSA 9 - 1,303
Total 16 3 24,441 *
* Represents 0.1% of group man days worked
APPENDIX