1 1 Slide IS 310 – Business Statistics IS 310 Business Statistics CSU Long Beach.
35
1 IS 310 – Business Statistics IS 310 – Business Statistics IS 310 Business Statisti cs CSU Long Beach
-
Upload
diego-hosfield -
Category
Documents
-
view
218 -
download
3
Transcript of 1 1 Slide IS 310 – Business Statistics IS 310 Business Statistics CSU Long Beach.

1 1 Slide
Slide
IS 310 – Business StatisticsIS 310 – Business Statistics
IS 310
Business Statistic
sCSU
Long Beach

2 2 Slide
Slide
IS 310 – Business StatisticsIS 310 – Business Statistics
Inferences About Population VariancesInferences About Population Variances
Previously, we have made inferences about population Previously, we have made inferences about population meansmeans and and proportionsproportions. We can make similar . We can make similar inferences about population inferences about population variancesvariances..
Examples:Examples:
A manufacturing plant produces a part whose length should be A manufacturing plant produces a part whose length should be 1.2”. Some 1.2”. Some variation of length variation of length is allowed. We want to is allowed. We want to determine that the variation of length is no more than 0.05”.determine that the variation of length is no more than 0.05”.
The amount of rainfall varies from state to state. A researcher The amount of rainfall varies from state to state. A researcher wants to know if the wants to know if the variation in the amount of rainfall variation in the amount of rainfall in a in a specific state is less than 3”.specific state is less than 3”.
In these cases, we are dealing with population variances (not In these cases, we are dealing with population variances (not means or proportions)means or proportions)

3 3 Slide
Slide
IS 310 – Business StatisticsIS 310 – Business Statistics
Inferences About Population VariancesInferences About Population Variances
Inference about a Population VarianceInference about a Population Variance

4 4 Slide
Slide
IS 310 – Business StatisticsIS 310 – Business Statistics
Inferences About a Population VarianceInferences About a Population Variance
Chi-Square DistributionChi-Square Distribution
Interval EstimationInterval Estimation
Hypothesis TestingHypothesis Testing

5 5 Slide
Slide
IS 310 – Business StatisticsIS 310 – Business Statistics
Inferences About a Population VarianceInferences About a Population Variance
In studying population variances, the following In studying population variances, the following quantity is importantquantity is important
2 22 2
(n – 1) s / (n – 1) s / σσ
This quantity follows a distribution that is called chi-square This quantity follows a distribution that is called chi-square distribution (with n – 1 degree of freedom)distribution (with n – 1 degree of freedom)
As the degree of freedom increases with sample size, the shape of As the degree of freedom increases with sample size, the shape of the chi-square distribution resembles that of a normal the chi-square distribution resembles that of a normal
distributiondistribution..
See Figure 11.1 (10-page 437; 11-page 450)See Figure 11.1 (10-page 437; 11-page 450)

6 6 Slide
Slide
IS 310 – Business StatisticsIS 310 – Business Statistics
Examples of Sampling Distribution of (Examples of Sampling Distribution of (nn - - 1)1)ss22//22
00
With 2 degreesWith 2 degrees of freedomof freedomWith 2 degreesWith 2 degrees of freedomof freedom
2
2
( 1)n s
With 5 degreesWith 5 degrees of freedomof freedomWith 5 degreesWith 5 degrees of freedomof freedom
With 10 degreesWith 10 degrees of freedomof freedomWith 10 degreesWith 10 degrees of freedomof freedom
7 7 Slide
Slide
IS 310 – Business StatisticsIS 310 – Business Statistics
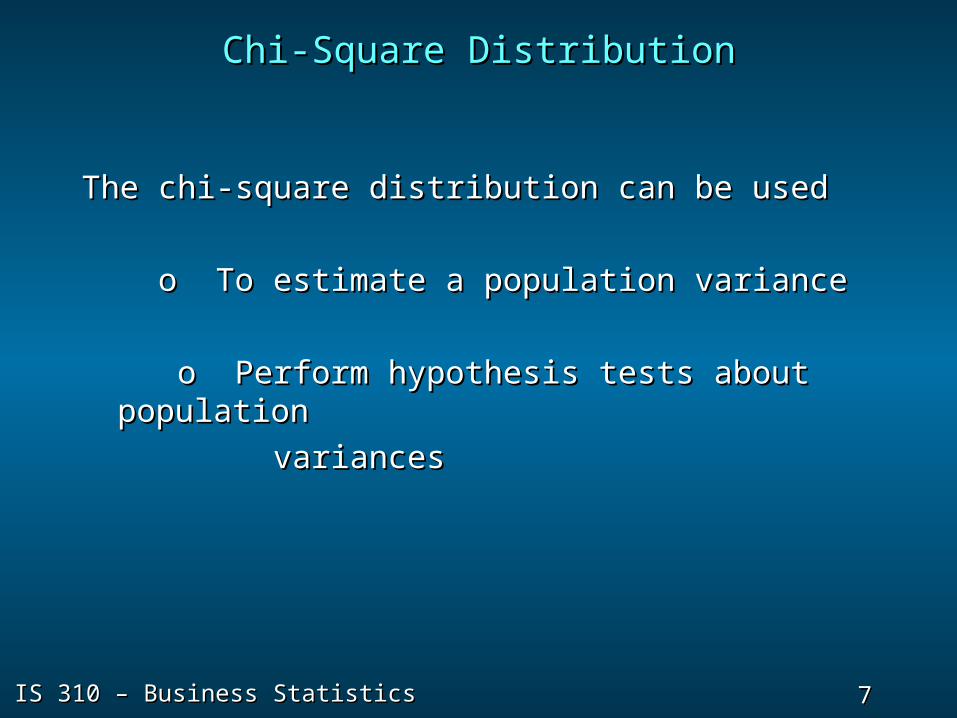
Chi-Square DistributionChi-Square Distribution
The chi-square distribution can be used The chi-square distribution can be used
o To estimate a population variance o To estimate a population variance
o Perform hypothesis tests about populationo Perform hypothesis tests about population
variancesvariances

8 8 Slide
Slide
IS 310 – Business StatisticsIS 310 – Business Statistics
2 2 2.975 .025 2 2 2.975 .025
Chi-Square DistributionChi-Square Distribution
For example, there is a .95 probability of For example, there is a .95 probability of obtaining a obtaining a 22 (chi-square) value such that (chi-square) value such that
We will use the notation to denote the We will use the notation to denote the value for the chi-square distribution that value for the chi-square distribution that provides an area of provides an area of to the right of the stated to the right of the stated value. value.
2 2
2 2

9 9 Slide
Slide
IS 310 – Business StatisticsIS 310 – Business Statistics
95% of thepossible 2 values 95% of thepossible 2 values
22
00
.025.025
2.0252.025
.025.025
2.9752.975
Interval Estimation of Interval Estimation of 22
22 2.975 .0252
( 1)n s
2
2 2.975 .0252
( 1)n s

10 10 Slide
Slide
IS 310 – Business StatisticsIS 310 – Business Statistics
Interval Estimation of Interval Estimation of 22
( ) ( )
/ ( / )
n s n s
1 12
22
22
1 22
( ) ( )
/ ( / )
n s n s
1 12
22
22
1 22
2 2 2(1 / 2) / 2 2 2 2(1 / 2) / 2
22 2(1 / 2) / 22
( 1)n s
2
2 2(1 / 2) / 22
( 1)n s
Substituting (Substituting (nn – 1) – 1)ss22//22 for the for the 22 we get we get
Performing algebraic manipulation we getPerforming algebraic manipulation we get
There is a (1 – There is a (1 – ) probability of obtaining a ) probability of obtaining a 22 valuevalue
such thatsuch that

11 11 Slide
Slide
IS 310 – Business StatisticsIS 310 – Business Statistics
Interval Estimate of a Population VarianceInterval Estimate of a Population Variance
Interval Estimation of Interval Estimation of 22
( ) ( )
/ ( / )
n s n s
1 12
22
22
1 22
( ) ( )
/ ( / )
n s n s
1 12
22
22
1 22
where the where the values are based on a chi-squarevalues are based on a chi-square
distribution with distribution with nn - 1 degrees of freedom and - 1 degrees of freedom and
where 1 - where 1 - is the confidence coefficient. is the confidence coefficient.
12 12 Slide
Slide
IS 310 – Business StatisticsIS 310 – Business Statistics
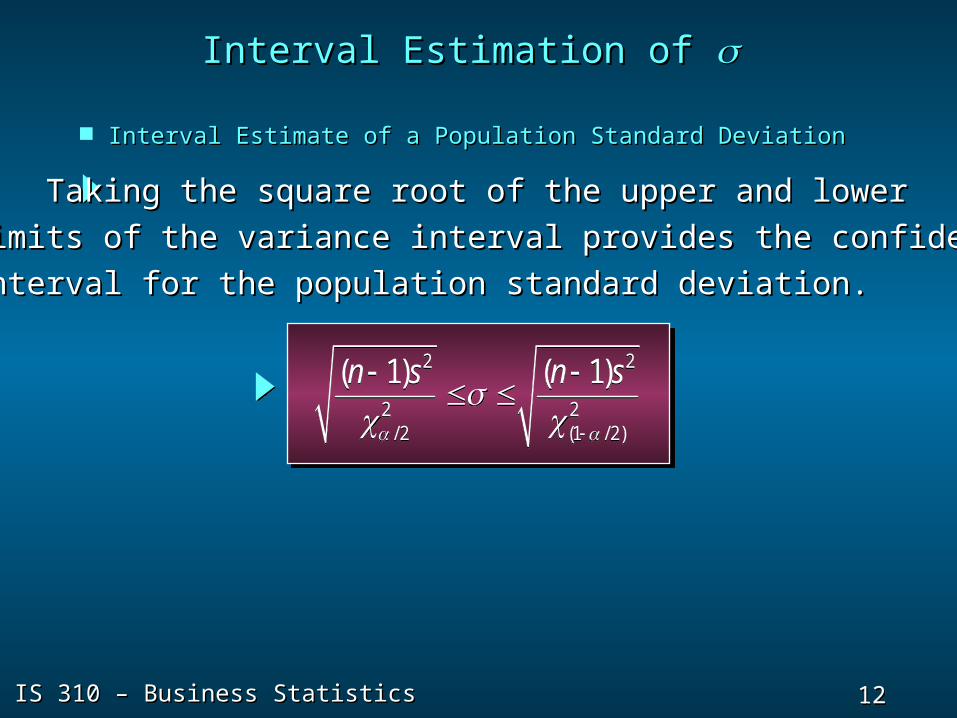
Interval Estimation of Interval Estimation of
Interval Estimate of a Population Standard DeviationInterval Estimate of a Population Standard Deviation
Taking the square root of the upper and lowerTaking the square root of the upper and lower
limits of the variance interval provides the confidencelimits of the variance interval provides the confidence
interval for the population standard deviation.interval for the population standard deviation.
2 2
2 2/ 2 (1 / 2)
( 1) ( 1)n s n s
2 2
2 2/ 2 (1 / 2)
( 1) ( 1)n s n s

13 13 Slide
Slide
IS 310 – Business StatisticsIS 310 – Business Statistics
Buyer’s Digest rates thermostatsBuyer’s Digest rates thermostats
manufactured for home temperaturemanufactured for home temperature
control. In a recent test, 10 thermostatscontrol. In a recent test, 10 thermostats
manufactured by ThermoRite weremanufactured by ThermoRite were
selected and placed in a test room thatselected and placed in a test room that
was maintained at a temperature of 68was maintained at a temperature of 68ooF.F.
The temperature readings of the ten thermostats The temperature readings of the ten thermostats areare
shown on the next slide. shown on the next slide.
Interval Estimation of Interval Estimation of 22
Example: Buyer’s Digest (A)Example: Buyer’s Digest (A)

14 14 Slide
Slide
IS 310 – Business StatisticsIS 310 – Business Statistics
Interval Estimation of Interval Estimation of 22
We will use the 10 readings below toWe will use the 10 readings below todevelop a 95% confidence intervaldevelop a 95% confidence intervalestimate of the population variance.estimate of the population variance.
Example: Buyer’s Digest (A)Example: Buyer’s Digest (A)
Temperature Temperature 67.4 67.8 68.2 69.3 69.5 67.0 68.1 68.6 67.9 67.267.4 67.8 68.2 69.3 69.5 67.0 68.1 68.6 67.9 67.2
ThermostatThermostat 1 2 3 4 5 6 7 8 9 101 2 3 4 5 6 7 8 9 10

15 15 Slide
Slide
IS 310 – Business StatisticsIS 310 – Business Statistics
Degrees
of Freedom .99 .975 .95 .90 .10 .05 .025 .01
5 0.554 0.831 1.145 1.610 9.236 11.070 12.832 15.0866 0.872 1.237 1.635 2.204 10.645 12.592 14.449 16.8127 1.239 1.690 2.167 2.833 12.017 14.067 16.013 18.4758 1.647 2.180 2.733 3.490 13.362 15.507 17.535 20.0909 2.088 2.700 3.325 4.168 14.684 16.919 19.023 21.666
10 2.558 3.247 3.940 4.865 15.987 18.307 20.483 23.209
Area in Upper TailDegrees
of Freedom .99 .975 .95 .90 .10 .05 .025 .01
5 0.554 0.831 1.145 1.610 9.236 11.070 12.832 15.0866 0.872 1.237 1.635 2.204 10.645 12.592 14.449 16.8127 1.239 1.690 2.167 2.833 12.017 14.067 16.013 18.4758 1.647 2.180 2.733 3.490 13.362 15.507 17.535 20.0909 2.088 2.700 3.325 4.168 14.684 16.919 19.023 21.666
10 2.558 3.247 3.940 4.865 15.987 18.307 20.483 23.209
Area in Upper Tail
Interval Estimation of Interval Estimation of 22
Selected Values from the Chi-Square Distribution TableSelected Values from the Chi-Square Distribution Table
Our Our value value
Our Our value value
2.9752.975
For For nn - 1 = 10 - 1 = 9 d.f. and - 1 = 10 - 1 = 9 d.f. and = .05= .05

16 16 Slide
Slide
IS 310 – Business StatisticsIS 310 – Business Statistics
Interval Estimation of Interval Estimation of 22
22
00
.025.025
2
2.0252
( 1)2.700
n s
2
2.0252
( 1)2.700
n s
Area inArea inUpper TailUpper Tail
= .975= .975
2.7002.700
For For nn - 1 = 10 - 1 = 9 d.f. and - 1 = 10 - 1 = 9 d.f. and = .05= .05

17 17 Slide
Slide
IS 310 – Business StatisticsIS 310 – Business Statistics
Degrees
of Freedom .99 .975 .95 .90 .10 .05 .025 .01
5 0.554 0.831 1.145 1.610 9.236 11.070 12.832 15.0866 0.872 1.237 1.635 2.204 10.645 12.592 14.449 16.8127 1.239 1.690 2.167 2.833 12.017 14.067 16.013 18.4758 1.647 2.180 2.733 3.490 13.362 15.507 17.535 20.0909 2.088 2.700 3.325 4.168 14.684 16.919 19.023 21.666
10 2.558 3.247 3.940 4.865 15.987 18.307 20.483 23.209
Area in Upper TailDegrees
of Freedom .99 .975 .95 .90 .10 .05 .025 .01
5 0.554 0.831 1.145 1.610 9.236 11.070 12.832 15.0866 0.872 1.237 1.635 2.204 10.645 12.592 14.449 16.8127 1.239 1.690 2.167 2.833 12.017 14.067 16.013 18.4758 1.647 2.180 2.733 3.490 13.362 15.507 17.535 20.0909 2.088 2.700 3.325 4.168 14.684 16.919 19.023 21.666
10 2.558 3.247 3.940 4.865 15.987 18.307 20.483 23.209
Area in Upper Tail
Interval Estimation of Interval Estimation of 22
Selected Values from the Chi-Square Distribution TableSelected Values from the Chi-Square Distribution Table
For For nn - 1 = 10 - 1 = 9 d.f. and - 1 = 10 - 1 = 9 d.f. and = .05= .05
Our Our value value
Our Our value value 2
.025 2
.025

18 18 Slide
Slide
IS 310 – Business StatisticsIS 310 – Business Statistics
22
00
.025.025
2.7002.700
Interval Estimation of Interval Estimation of 22
nn - 1 = 10 - 1 = 9 degrees of freedom and - 1 = 10 - 1 = 9 degrees of freedom and = .05= .05
2
2
( 1)2.700 19.023
n s
2
2
( 1)2.700 19.023
n s
19.02319.023
Area in UpperArea in UpperTail = .025Tail = .025Area in UpperArea in UpperTail = .025Tail = .025

19 19 Slide
Slide
IS 310 – Business StatisticsIS 310 – Business Statistics
Sample variance Sample variance ss22 provides a point estimate of provides a point estimate of 22..
sx xni2
2
16 39
70
( ) .
.sx xni2
2
16 39
70
( ) .
.
( )..
( )..
10 1 7019 02
10 1 702 70
2 ( ).
.( ).
.10 1 70
19 0210 1 70
2 702
Interval Estimation of Interval Estimation of 22
.33 .33 << 2 2 << 2.33 2.33
A 95% confidence interval for the population A 95% confidence interval for the population variance is given by:variance is given by:

20 20 Slide
Slide
IS 310 – Business StatisticsIS 310 – Business Statistics
Left-Tailed TestLeft-Tailed Test
Hypothesis TestingHypothesis TestingAbout a Population VarianceAbout a Population Variance
22
02
1 ( )n s
22
02
1 ( )n s
where is the hypothesized valuewhere is the hypothesized valuefor the population variancefor the population variance
20 20
•Test StatisticTest Statistic
•HypothesesHypotheses2 2
0 0: H 2 20 0: H
2 20: aH 2 20: aH

21 21 Slide
Slide
IS 310 – Business StatisticsIS 310 – Business Statistics
Left-Tailed Test (continued)Left-Tailed Test (continued)
Hypothesis TestingHypothesis TestingAbout a Population VarianceAbout a Population Variance
Reject Reject HH00 if if pp-value -value << pp-Value approach:-Value approach:
Critical value approach:Critical value approach:•Rejection RuleRejection Rule
Reject Reject HH00 if if 2 2(1 ) 2 2(1 )
where is based on a chi-squarewhere is based on a chi-squaredistribution with distribution with nn - 1 d.f. - 1 d.f.
2(1 ) 2(1 )

22 22 Slide
Slide
IS 310 – Business StatisticsIS 310 – Business Statistics
Right-Tailed TestRight-Tailed Test
Hypothesis TestingHypothesis TestingAbout a Population VarianceAbout a Population Variance
H02
02: H0
202:
Ha : 202Ha : 202
22
02
1 ( )n s
22
02
1 ( )n s
where is the hypothesized valuewhere is the hypothesized valuefor the population variancefor the population variance
20 20
•Test StatisticTest Statistic
•HypothesesHypotheses

23 23 Slide
Slide
IS 310 – Business StatisticsIS 310 – Business Statistics
Right-Tailed Test (continued)Right-Tailed Test (continued)
Hypothesis TestingHypothesis TestingAbout a Population VarianceAbout a Population Variance
Reject Reject HH00 if if 2 2 2 2
Reject Reject HH00 if if pp-value -value <<
22where is based on a chi-squarewhere is based on a chi-square
distribution with distribution with nn - 1 d.f. - 1 d.f.
pp-Value approach:-Value approach:
Critical value approach:Critical value approach:•Rejection RuleRejection Rule

24 24 Slide
Slide
IS 310 – Business StatisticsIS 310 – Business Statistics
Two-Tailed TestTwo-Tailed Test
Hypothesis TestingHypothesis TestingAbout a Population VarianceAbout a Population Variance
22
02
1 ( )n s
22
02
1 ( )n s
where is the hypothesized valuewhere is the hypothesized valuefor the population variancefor the population variance
20 20
•Test StatisticTest Statistic
•HypothesesHypotheses
Ha : 202Ha : 202
H02
02: H0
202:

25 25 Slide
Slide
IS 310 – Business StatisticsIS 310 – Business Statistics
Two-Tailed Test (continued)Two-Tailed Test (continued)
Hypothesis TestingHypothesis TestingAbout a Population VarianceAbout a Population Variance
Reject Reject HH00 if if pp-value -value <<
pp-Value approach:-Value approach:
Critical value approach:Critical value approach:•Rejection RuleRejection Rule
2 2 2 2(1 / 2) / 2 or 2 2 2 2(1 / 2) / 2 or Reject Reject HH00 if if
where are based on awhere are based on achi-square distribution with chi-square distribution with nn - 1 d.f. - 1 d.f.
2 2(1 / 2) / 2 and 2 2(1 / 2) / 2 and

26 26 Slide
Slide
IS 310 – Business StatisticsIS 310 – Business Statistics
Recall that Buyer’s Digest is ratingRecall that Buyer’s Digest is rating
ThermoRite thermostats. Buyer’s DigestThermoRite thermostats. Buyer’s Digest
gives an “acceptable” rating to a thermo-gives an “acceptable” rating to a thermo-
stat with a temperature variance of 0.5stat with a temperature variance of 0.5
or less.or less.
Hypothesis TestingHypothesis TestingAbout a Population VarianceAbout a Population Variance
Example: Buyer’s Digest (B)Example: Buyer’s Digest (B)
We will conduct a hypothesis test (withWe will conduct a hypothesis test (with
= .10) to determine whether the ThermoRite= .10) to determine whether the ThermoRite
thermostat’s temperature variance is “acceptable”.thermostat’s temperature variance is “acceptable”.

27 27 Slide
Slide
IS 310 – Business StatisticsIS 310 – Business Statistics
Hypothesis TestingHypothesis TestingAbout a Population VarianceAbout a Population Variance
Using the 10 readings, we willUsing the 10 readings, we will
conduct a hypothesis test (with conduct a hypothesis test (with = .10) = .10)
to determine whether the ThermoRiteto determine whether the ThermoRite
thermostat’s temperature variance isthermostat’s temperature variance is
““acceptable”.acceptable”.
Example: Buyer’s Digest (B)Example: Buyer’s Digest (B)
Temperature Temperature 67.4 67.8 68.2 69.3 69.5 67.0 68.1 68.6 67.9 67.267.4 67.8 68.2 69.3 69.5 67.0 68.1 68.6 67.9 67.2
ThermostatThermostat 1 2 3 4 5 6 7 8 9 101 2 3 4 5 6 7 8 9 10

28 28 Slide
Slide
IS 310 – Business StatisticsIS 310 – Business Statistics
HypothesesHypotheses2
0 : 0.5H 20 : 0.5H
2: 0.5aH 2: 0.5aH
Hypothesis TestingHypothesis TestingAbout a Population VarianceAbout a Population Variance
Reject Reject HH00 if if 22 >> 14.684 14.684
Rejection RuleRejection Rule

29 29 Slide
Slide
IS 310 – Business StatisticsIS 310 – Business Statistics
Degrees
of Freedom .99 .975 .95 .90 .10 .05 .025 .01
5 0.554 0.831 1.145 1.610 9.236 11.070 12.832 15.0866 0.872 1.237 1.635 2.204 10.645 12.592 14.449 16.8127 1.239 1.690 2.167 2.833 12.017 14.067 16.013 18.4758 1.647 2.180 2.733 3.490 13.362 15.507 17.535 20.0909 2.088 2.700 3.325 4.168 14.684 16.919 19.023 21.666
10 2.558 3.247 3.940 4.865 15.987 18.307 20.483 23.209
Area in Upper TailDegrees
of Freedom .99 .975 .95 .90 .10 .05 .025 .01
5 0.554 0.831 1.145 1.610 9.236 11.070 12.832 15.0866 0.872 1.237 1.635 2.204 10.645 12.592 14.449 16.8127 1.239 1.690 2.167 2.833 12.017 14.067 16.013 18.4758 1.647 2.180 2.733 3.490 13.362 15.507 17.535 20.0909 2.088 2.700 3.325 4.168 14.684 16.919 19.023 21.666
10 2.558 3.247 3.940 4.865 15.987 18.307 20.483 23.209
Area in Upper TailSelected Values from the Chi-Square Distribution TableSelected Values from the Chi-Square Distribution Table
For For nn - 1 = 10 - 1 = 9 d.f. and - 1 = 10 - 1 = 9 d.f. and = .10= .10
Hypothesis TestingHypothesis TestingAbout a Population VarianceAbout a Population Variance
Our Our value value Our Our value value 2
.10 2
.10

30 30 Slide
Slide
IS 310 – Business StatisticsIS 310 – Business Statistics
22
00 14.68414.684
Area in UpperArea in UpperTail = .10Tail = .10Area in UpperArea in UpperTail = .10Tail = .10
Hypothesis TestingHypothesis TestingAbout a Population VarianceAbout a Population Variance
Rejection RegionRejection Region
2 22
2
( 1) 9.5
n s s
2 2
22
( 1) 9.5
n s s
Reject Reject HH00Reject Reject HH00
31 31 Slide
Slide
IS 310 – Business StatisticsIS 310 – Business Statistics
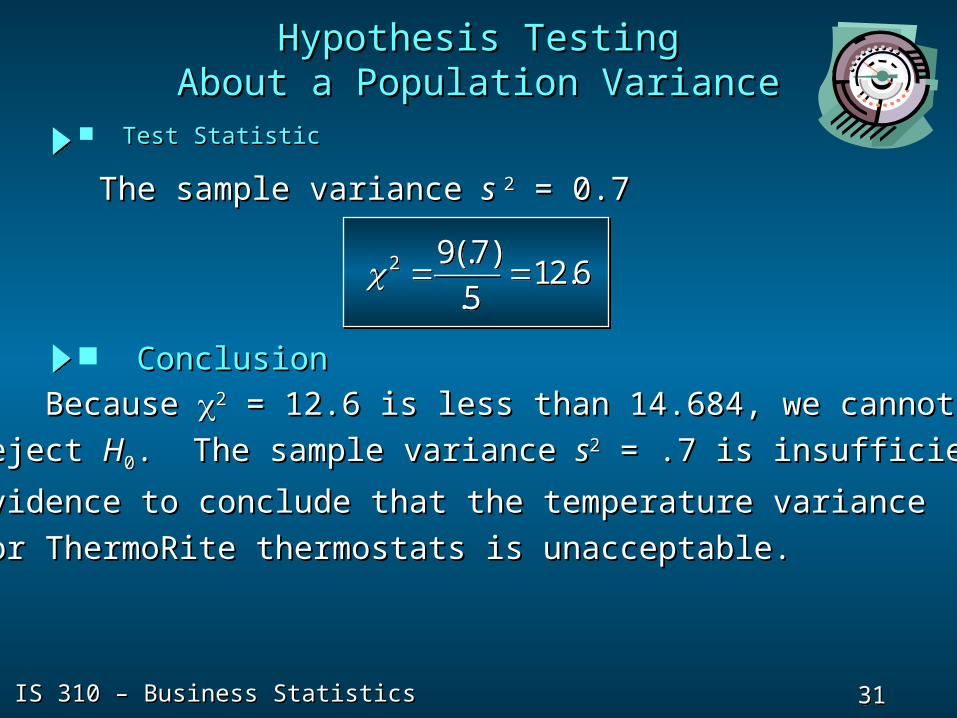
Test StatisticTest Statistic
2 9(.7)12.6
.5 2 9(.7)
12.6.5
Hypothesis TestingHypothesis TestingAbout a Population VarianceAbout a Population Variance
Because Because 22 = 12.6 is less than 14.684, we cannot = 12.6 is less than 14.684, we cannot
reject reject HH00. The sample variance . The sample variance ss22 = .7 is insufficient = .7 is insufficient
evidence to conclude that the temperature varianceevidence to conclude that the temperature variance
for ThermoRite thermostats is unacceptable.for ThermoRite thermostats is unacceptable.
ConclusionConclusion
The sample variance The sample variance s s 22 = 0.7 = 0.7

32 32 Slide
Slide
IS 310 – Business StatisticsIS 310 – Business Statistics
Using the Using the pp-Value-Value
• The sample variance of The sample variance of s s 22 = .7 is = .7 is insufficient evidence to conclude that theinsufficient evidence to conclude that the temperature variance is unacceptable (>.5).temperature variance is unacceptable (>.5).
• Because the Because the pp –value > –value > = .10, we = .10, we cannot reject the null hypothesis.cannot reject the null hypothesis.
• The rejection region for the ThermoRite The rejection region for the ThermoRite thermostat example is in the upper tail; thus, thethermostat example is in the upper tail; thus, the appropriate appropriate pp-value is less than .90 (-value is less than .90 (22 = 4.168) = 4.168) and greater than .10 (and greater than .10 (22 = 14.684). = 14.684).
Hypothesis TestingHypothesis TestingAbout a Population VarianceAbout a Population Variance
A precise A precise pp-value-valuecan be found usingcan be found usingMinitab or Excel.Minitab or Excel.
A precise A precise pp-value-valuecan be found usingcan be found usingMinitab or Excel.Minitab or Excel.

33 33 Slide
Slide
IS 310 – Business StatisticsIS 310 – Business Statistics
Sample ProblemSample Problem
Problem # 4 (10-Page 443; 11-Page 457)Problem # 4 (10-Page 443; 11-Page 457)
Given: 2Given: 2
n = 18 s = 0.36n = 18 s = 0.36
The 90% confidence interval estimate for population variance is:The 90% confidence interval estimate for population variance is:
2 2 2 2 22 2 2 2 2
(n – 1) s / (n – 1) s / ΧΧ ≤ ≤ σσ ≤ (n – 1) s / ≤ (n – 1) s /ΧΧ
.05 .95.05 .95
[(18 – 1) (0.36)/27.587 < < [(18 – 1) (0.36)/8.672)[(18 – 1) (0.36)/27.587 < < [(18 – 1) (0.36)/8.672)
34 34 Slide
Slide
IS 310 – Business StatisticsIS 310 – Business Statistics
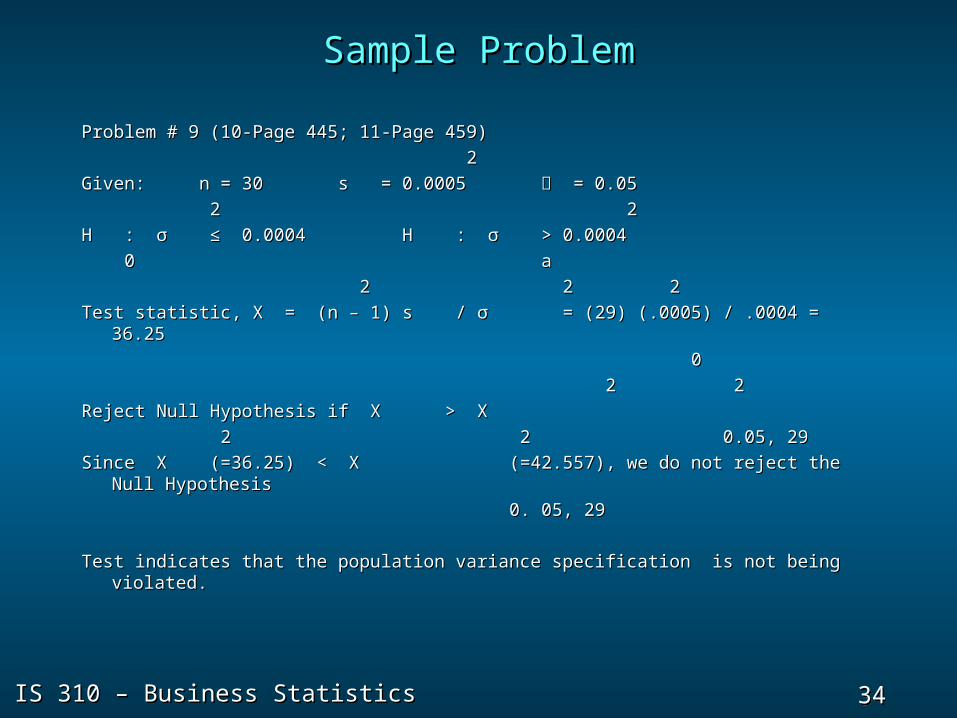
Sample ProblemSample Problem
Problem # 9 (10-Page 445; 11-Page 459)Problem # 9 (10-Page 445; 11-Page 459)
22
Given: n = 30 s = 0.0005 = 0.05Given: n = 30 s = 0.0005 = 0.05
2 22 2
H : H : σσ ≤ 0.0004 H : ≤ 0.0004 H : σσ > 0.0004 > 0.0004
0 a0 a
2 2 22 2 2
Test statistic, Test statistic, ΧΧ = (n – 1) s / = (n – 1) s / σσ = (29) (.0005) / .0004 = 36.25 = (29) (.0005) / .0004 = 36.25
00
2 22 2
Reject Null Hypothesis if Reject Null Hypothesis if ΧΧ > > ΧΧ
2 2 0.05, 292 2 0.05, 29
Since Since ΧΧ (=36.25) < (=36.25) < ΧΧ (=42.557), we do not reject the Null (=42.557), we do not reject the Null HypothesisHypothesis
0. 05, 29 0. 05, 29
Test indicates that the population variance specification is not being violated.Test indicates that the population variance specification is not being violated.

35 35 Slide
Slide
IS 310 – Business StatisticsIS 310 – Business Statistics
End of Chapter 11End of Chapter 11