062011 sanofi seminar
41
• Discovery Compound Differentiation using Toxicogenomics • Investigative miRNA Expression Analysis Molecular Toxicology in Drug Discovery at AstraZeneca Joe Milano 6/16/2011
Transcript of 062011 sanofi seminar

• Discovery Compound Differentiation using Toxicogenomics
• Investigative miRNA Expression Analysis
Molecular Toxicology in Drug Discovery at AstraZeneca
Joe Milano6/16/2011

Outline
Introduction to our approach to microarray analysis Differentiating compounds based on renal transcript
profiles to support drug discovery project progression Establish miRNA analysis capability in AstraZeneca Safety
Assessment miRNA expression and target prediction to understand 2,5-
hexanedione testicular effects

Analysis ApproachRat 230 2.0 Array
31000Transcripts
ANOVAp=0.05
Statistics
FinalGeneList
Filter LowExpressing Genes
Signal DetectionAlgorithm
List Analysis
Ontology Enrichment
Pathways Analysis

Pathway Analysis Toxicity Analysis Workflow tool helps to analyze the
dataset(s) in view of toxicogenomics and drug response information contained in the MetaCore database
GeneGo toxic pathology biomarkers GeneGo toxicity processes GeneGo toxicity maps GO Processes GO Molecular functions GO Localizations
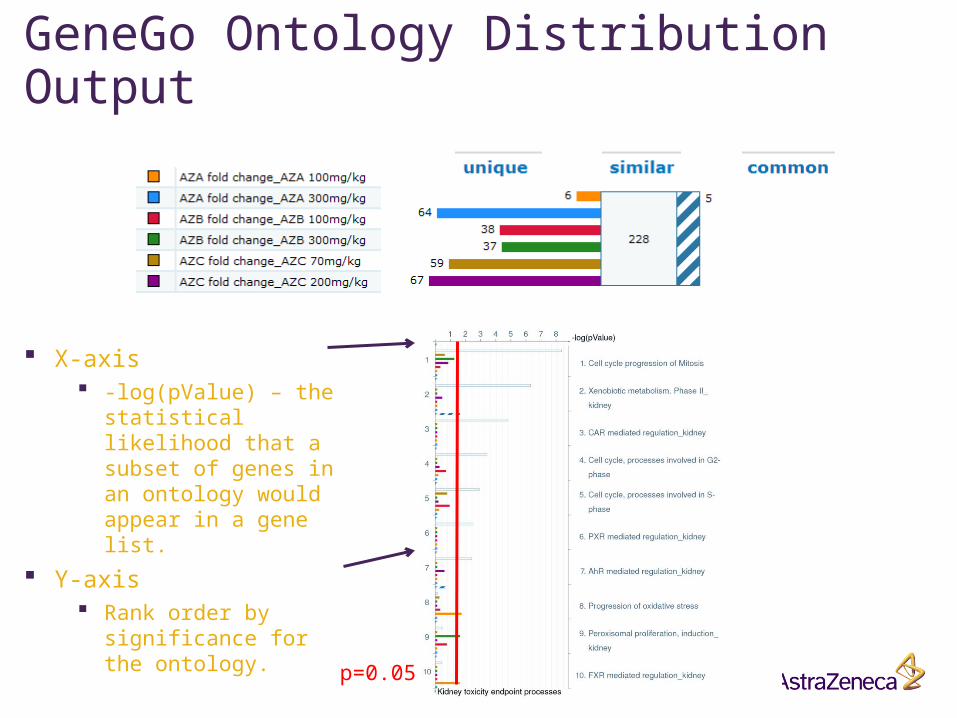
GeneGo Ontology Distribution Output
X-axis -log(pValue) – the
statistical likelihood that a subset of genes in an ontology would appear in a gene list.
Y-axis Rank order by
significance for the ontology.
p=0.05
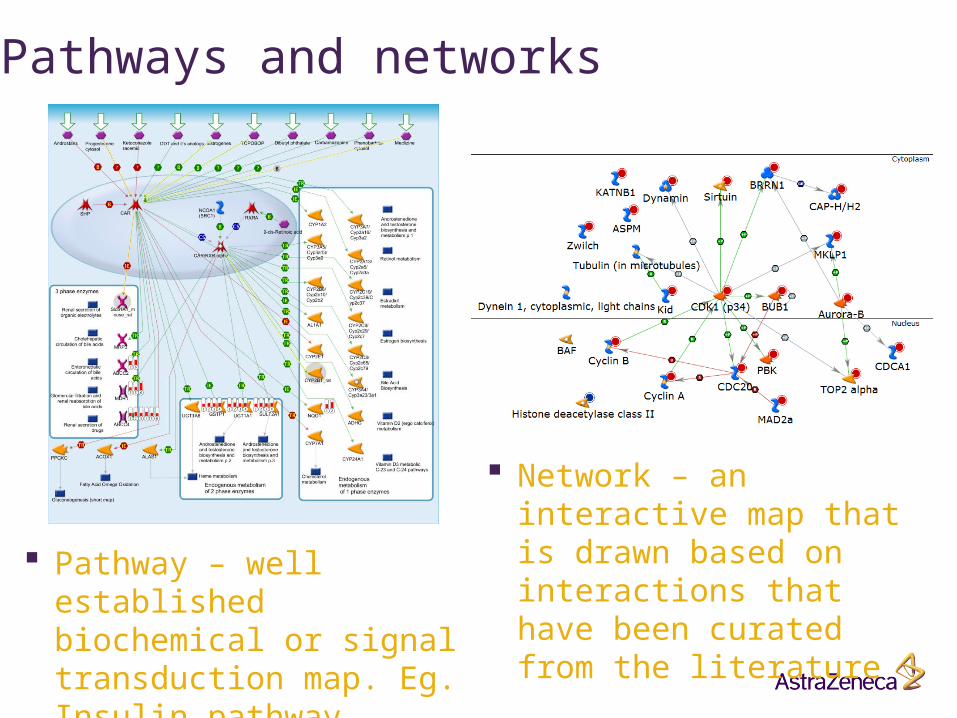
Pathways and networks
Pathway – well established biochemical or signal transduction map. Eg. Insulin pathway, apoptosis pathway
Network – an interactive map that is drawn based on interactions that have been curated from the literature

Outline
Introduction to our approach to microarray analysis Differentiating compounds based on renal transcript
profiles to support drug discovery project progression Establish miRNA analysis capability in AstraZeneca Safety
Assessment miRNA expression and target prediction to understand 2,5-
hexanedione testicular effects

Discovery Phase Compound Differentiation Compound AZ123 has entered development with known
kidney tox. Presence of intracytoplasmic hyaline droplets Increase in urine volume, urine protein and urine NAG Indicative of renal tubular injury
Follow-up investigative compounds A, B and C are being evaluated using a 14-day rat tox study
Similar structures and pharmacology One of these will be selected for further development
Solution (or at least part of the solution)
Applied transcript profile analysis to differentiate compounds and support a selection decision
Results evaluated with standard pathology, clinical chemistry and urine protein biomarkers of nephrotoxicity (Kim1, NGAL, aGST etc.)
Based on these analyses nephrotoxicity rank ordering Compound C > Compound A ≈ Compound B
Selection of Compound A supported by toxicogenomics analysis
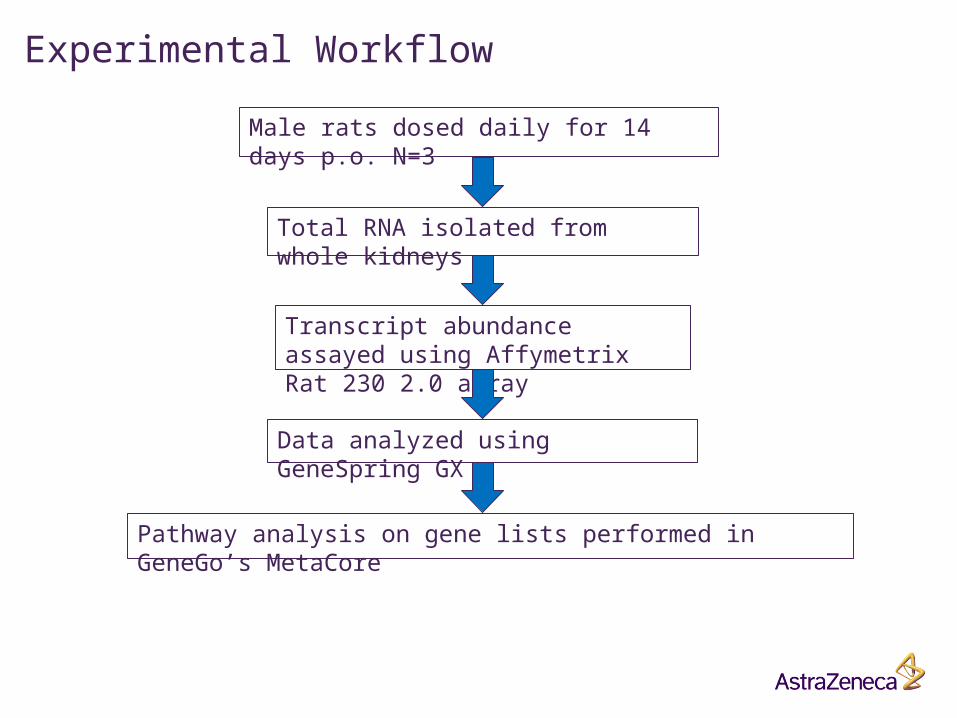
Experimental Workflow
Male rats dosed daily for 14 days p.o. N=3
Total RNA isolated from whole kidneys
Transcript abundance assayed using Affymetrix Rat 230 2.0 array
Pathway analysis on gene lists performed in GeneGo’s MetaCore
Data analyzed using GeneSpring GX

Affymetrix Data Analysis GeneSpring GX 10.0
PLIER16 used for probe summarization Data was filtered based on low raw signal Statistical analyses (t-test or ANOVA) p=0.05 Lethality at high dose for 2 compounds made statistical
analysis difficult
Gene lists were analyzed in MetaCore’s Toxicity Analysis Workflow using 1.3-fold threshold
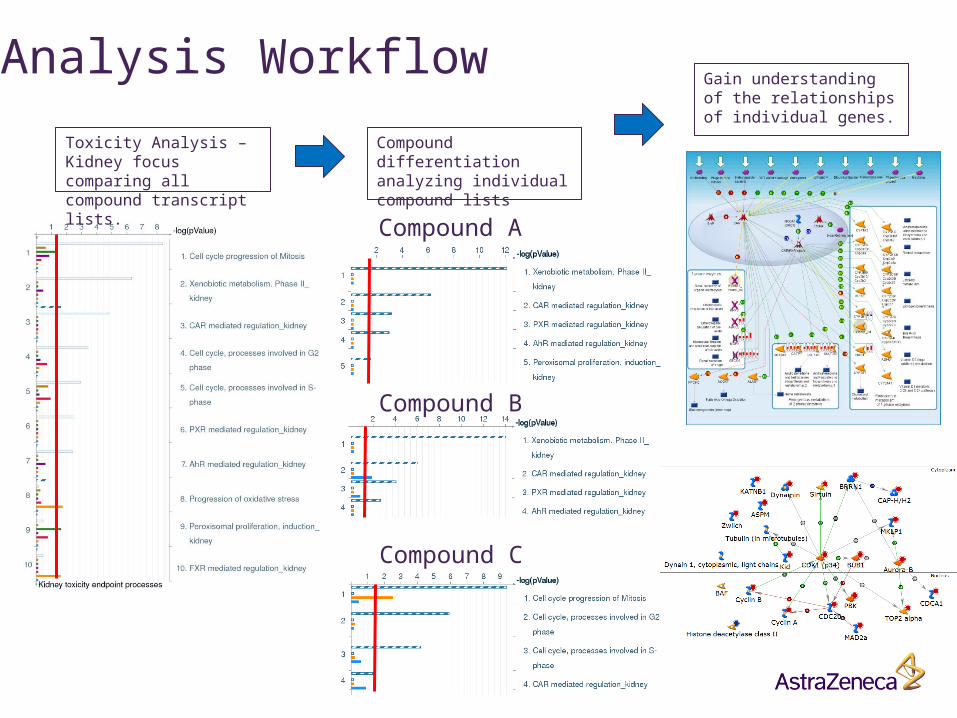
Analysis Workflow
Compound A
Compound B
Compound C
Toxicity Analysis – Kidney focus comparing all compound transcript lists.
Compound differentiation analyzing individual compound lists
Gain understanding of the relationships of individual genes.

Toxicity Workflow- Compare All Lists Each show about the
same number of gene changes
Compound C shows twice the number of genes within 1.3-fold threshold
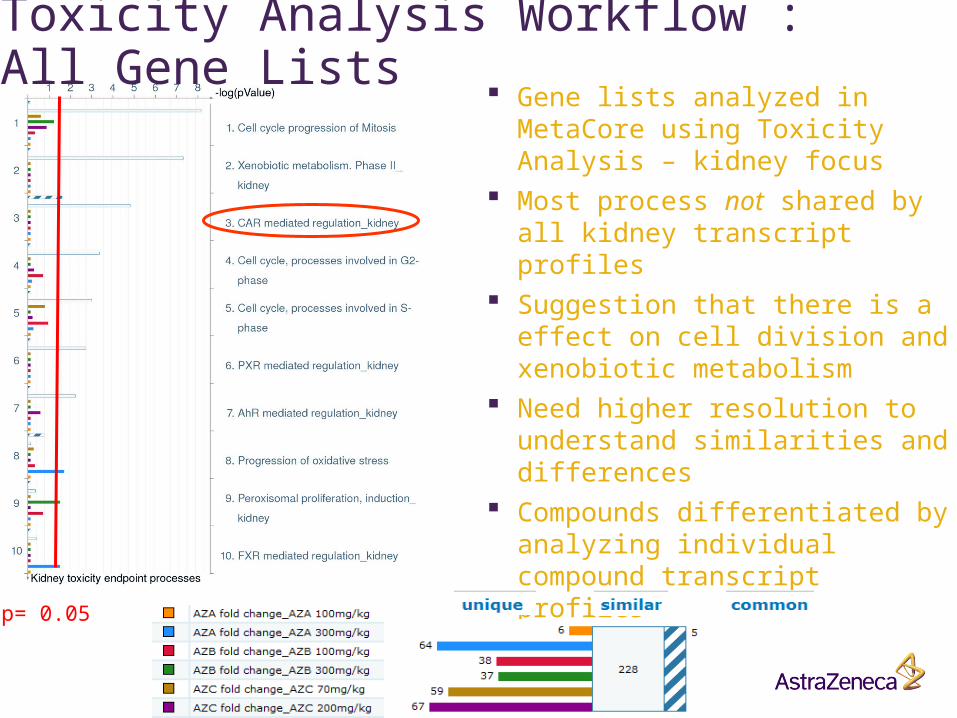
Toxicity Analysis Workflow : All Gene Lists
p= 0.05
Gene lists analyzed in MetaCore using Toxicity Analysis – kidney focus
Most process not shared by all kidney transcript profiles
Suggestion that there is a effect on cell division and xenobiotic metabolism
Need higher resolution to understand similarities and differences
Compounds differentiated by analyzing individual compound transcript profiles
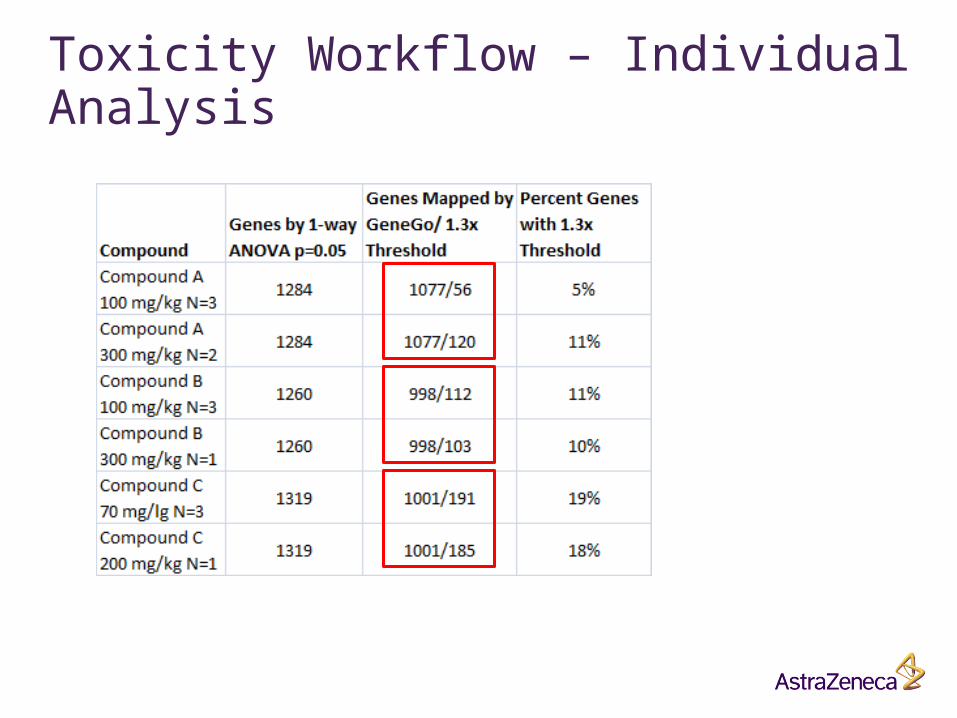
Toxicity Workflow – Individual Analysis
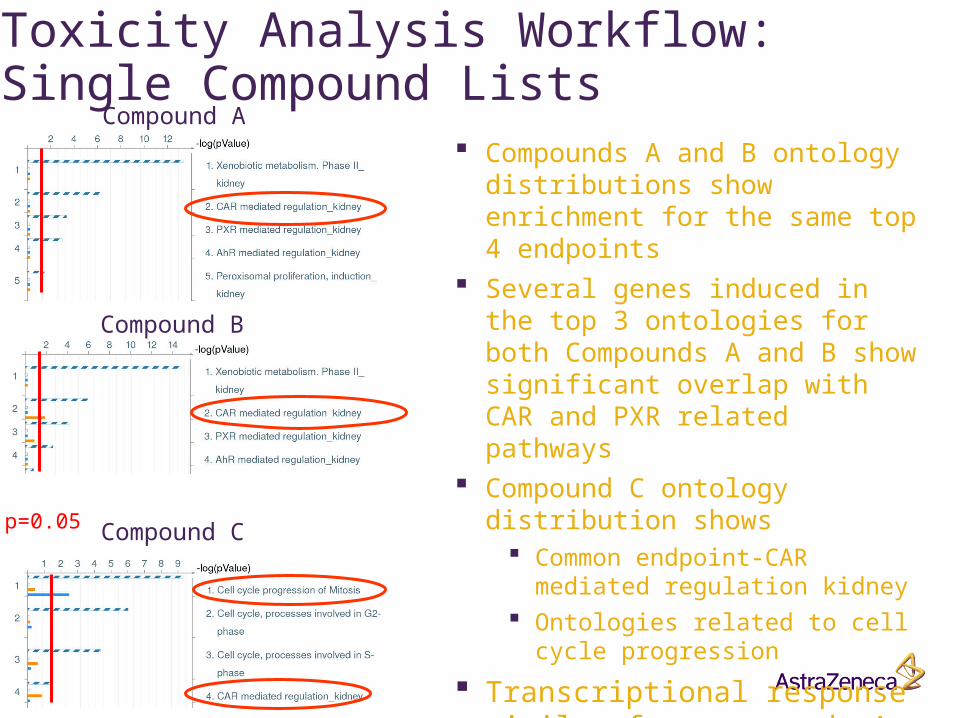
Toxicity Analysis Workflow: Single Compound Lists
Compounds A and B ontology distributions show enrichment for the same top 4 endpoints
Several genes induced in the top 3 ontologies for both Compounds A and B show significant overlap with CAR and PXR related pathways
Compound C ontology distribution shows
Common endpoint-CAR mediated regulation kidney
Ontologies related to cell cycle progression
Transcriptional response similar for compounds A and B different for Compound C
Compound A
Compound B
Compound Cp=0.05
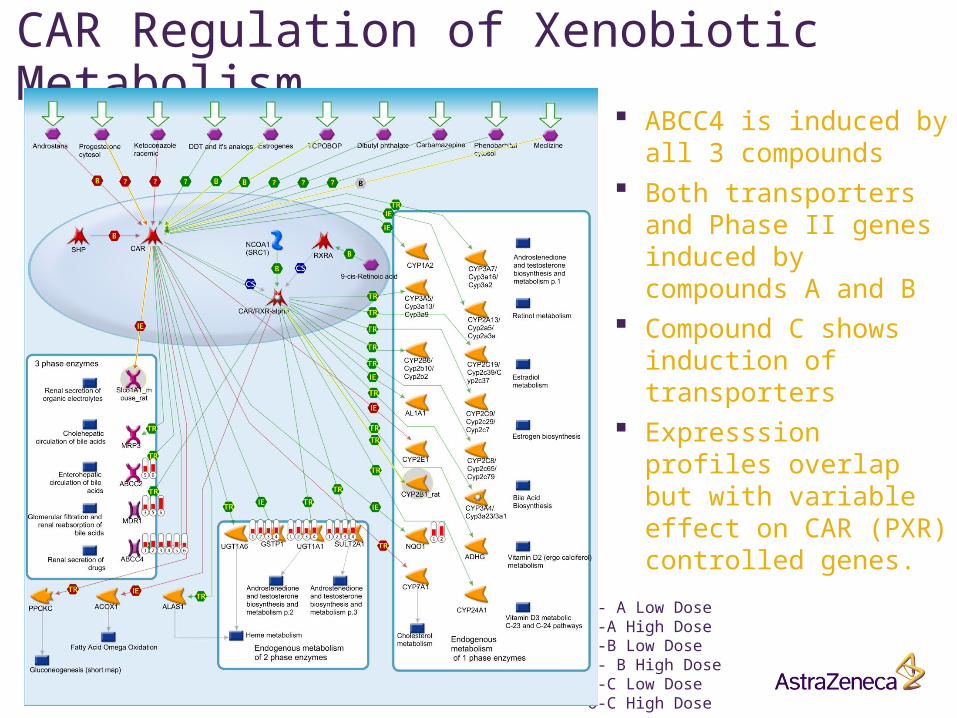
CAR Regulation of Xenobiotic Metabolism ABCC4 is induced by all 3
compounds Both transporters and
Phase II genes induced by compounds A and B
Compound C shows induction of transporters
Expresssion profiles overlap but with variable effect on CAR (PXR) controlled genes.
1- A Low Dose2-A High Dose3-B Low Dose4- B High Dose5-C Low Dose6-C High Dose
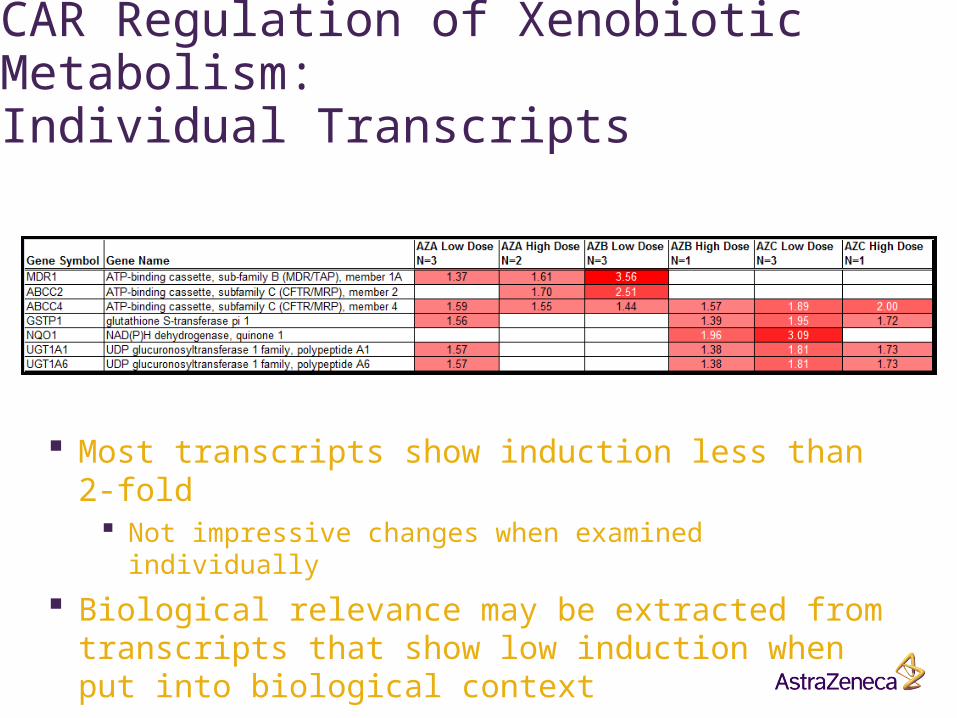
CAR Regulation of Xenobiotic Metabolism:Individual Transcripts
Most transcripts show induction less than 2-fold Not impressive changes when examined individually
Biological relevance may be extracted from transcripts that show low induction when put into biological context
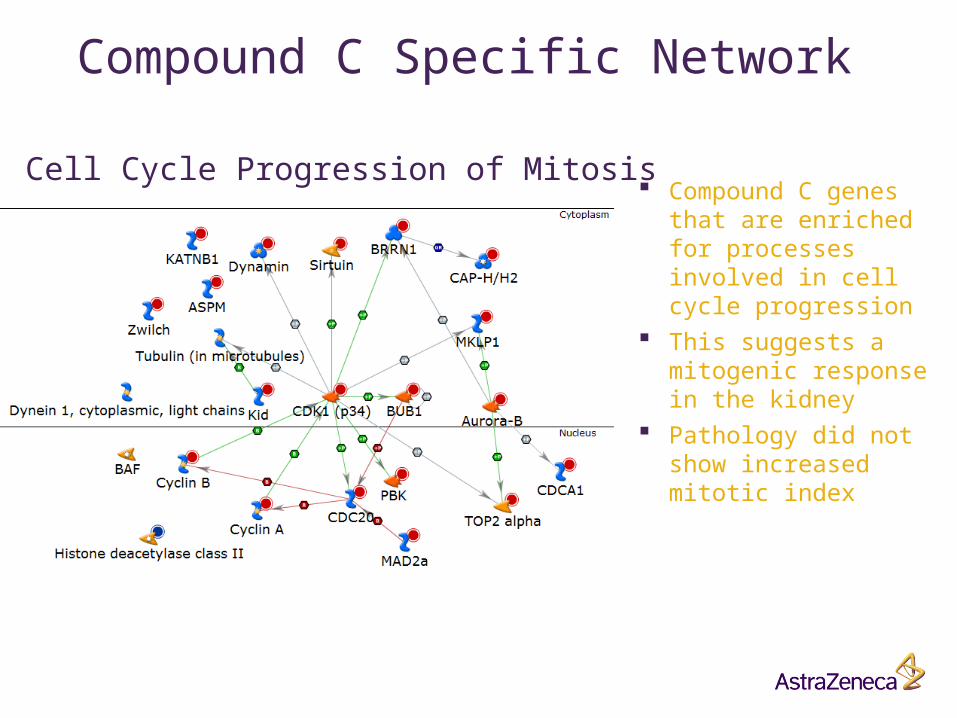
Compound C genes that are enriched for processes involved in cell cycle progression
This suggests a mitogenic response in the kidney
Pathology did not show increased mitotic index
Cell Cycle Progression of Mitosis
Compound C Specific Network
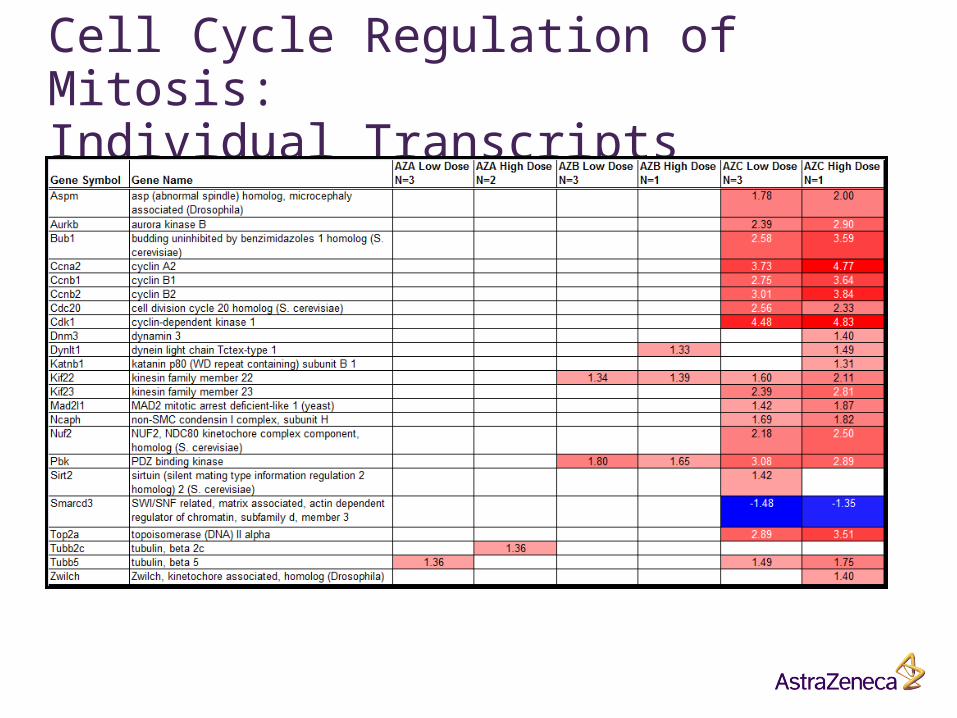
Cell Cycle Regulation of Mitosis:Individual Transcripts
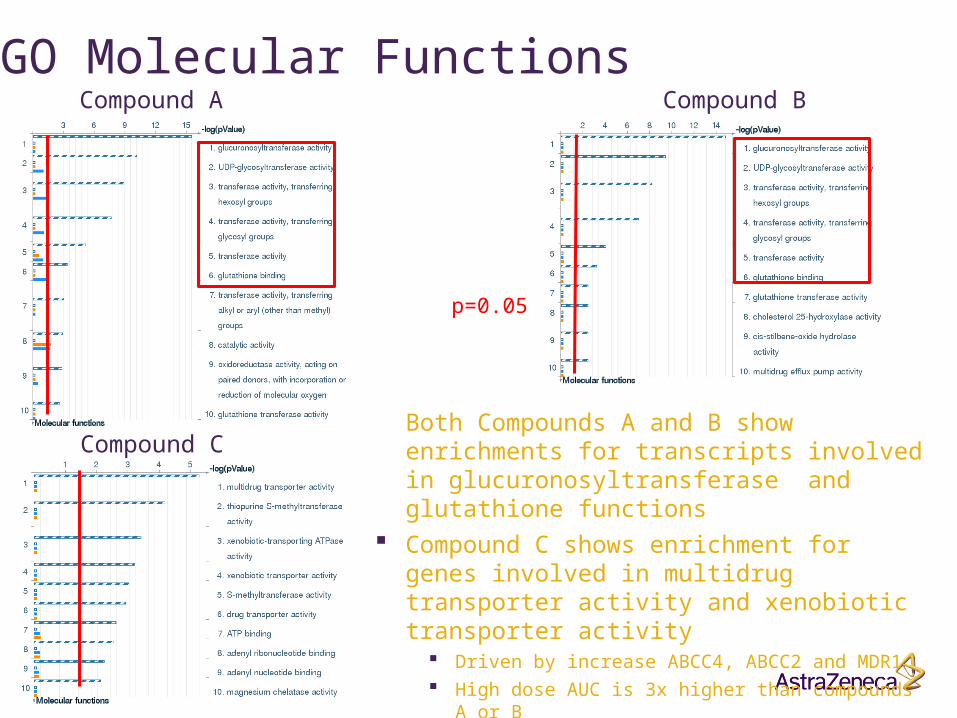
GO Molecular Functions
Both Compounds A and B show enrichments for transcripts involved in glucuronosyltransferase and glutathione functions
Compound C shows enrichment for genes involved in multidrug transporter activity and xenobiotic transporter activity
Driven by increase ABCC4, ABCC2 and MDR1 High dose AUC is 3x higher than compounds A or B Suggests potential for drug accumulation at 14 days
Compound C
Compound A
p=0.05
Compound B
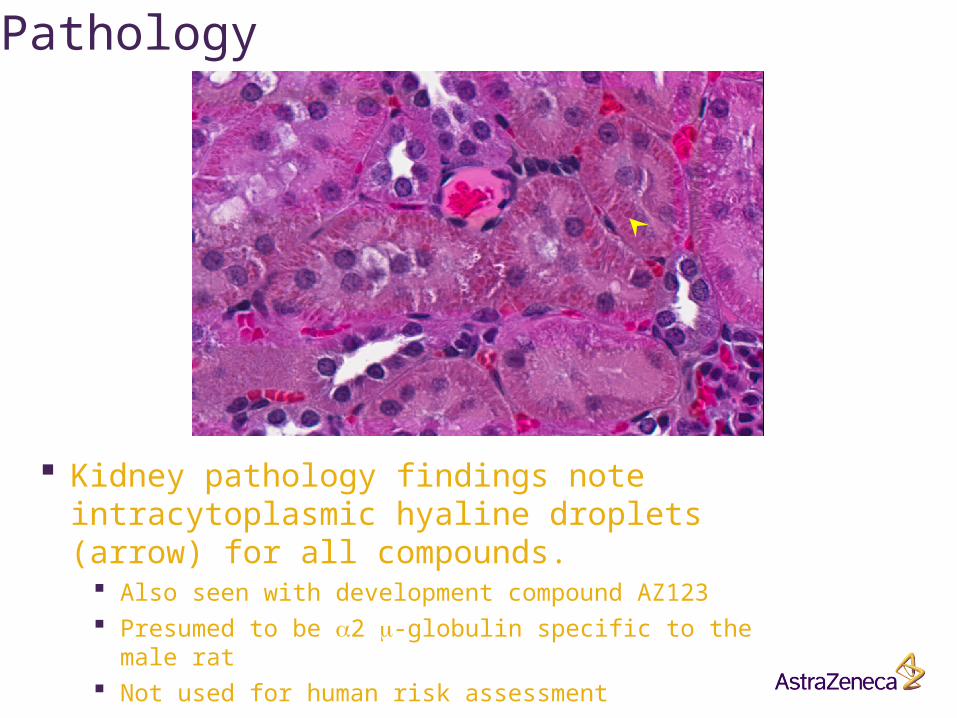
Pathology
Kidney pathology findings note intracytoplasmic hyaline droplets (arrow) for all compounds.
Also seen with development compound AZ123 Presumed to be 2 -globulin specific to the male rat Not used for human risk assessment
No difference between compounds
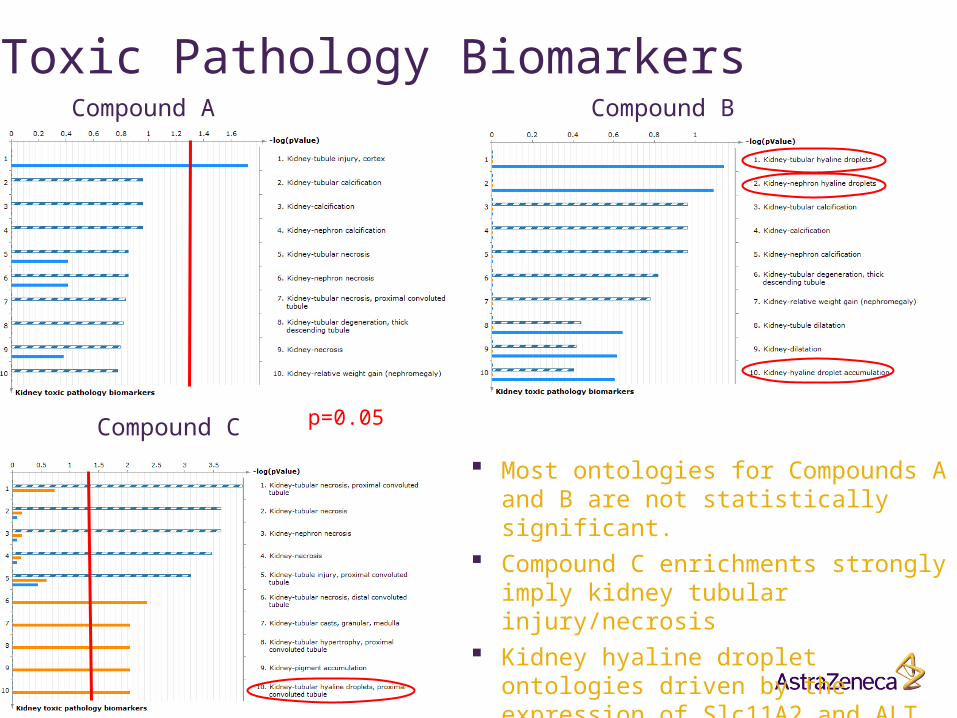
Toxic Pathology Biomarkers
Most ontologies for Compounds A and B are not statistically significant.
Compound C enrichments strongly imply kidney tubular injury/necrosis
Kidney hyaline droplet ontologies driven by the expression of Slc11A2 and ALT.
Compound BCompound A
Compound C p=0.05
Clinical Chemistry
Data from all compounds show increase in LDH, albumin, aGST and GSTYb1 in urine
Indicators of tubular damage Increased albumin has been associated with renal hyaline
droplets Also seen at same time point with AZ123
Compound C data show Kim1 protein increase in remaining high dose animal and robust induction of Kim1 transcript at both doses

Data Summary
Compounds A and B behave similarly with respect to toxicity networks Induction of Xenobiotic Response genes, UGTs, GST reductase
Compound C is different from the other 2 Induction of genes involved in cell cycle control suggesting a mitogenic
response – regenerative?
While no difference was found by pathology, Compound C data show induction of Kim1, enrichment for transcripts associated with renal tubular damage and up-regulation of cell cycle control genes
Nephrotoxicity rank ordering Compound C > Compound A Compound B
Compound B later found to be a mutagen (Ames) and clastogen (rat micronucleus)
These data support selection of Compound A to move forward
Outline
Introduction to our approach to microarray analysis Differentiating compounds based on renal transcript
profiles to support drug discovery project progression Establish miRNA analysis capability in AstraZeneca Safety
Assessment miRNA expression and target prediction to understand 2,5-
hexanedione testicular effects
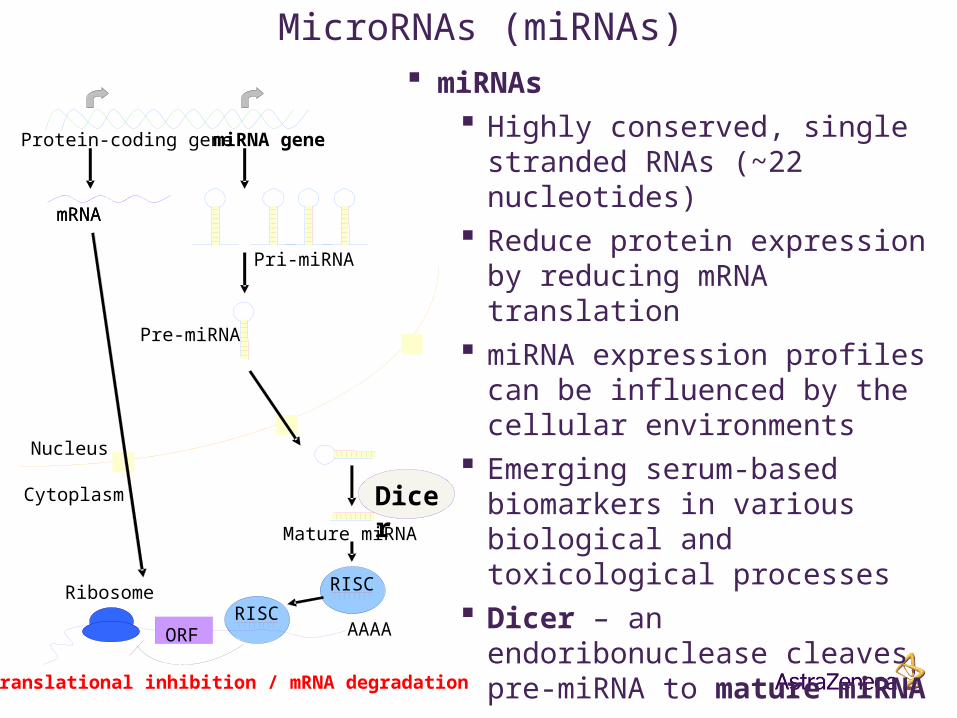
MicroRNAs (miRNAs) miRNAs
Highly conserved, single stranded RNAs (~22 nucleotides)
Reduce protein expression by reducing mRNA translation
miRNA expression profiles can be influenced by the cellular environments
Emerging serum-based biomarkers in various biological and toxicological processes
Dicer – an endoribonuclease cleaves pre-miRNA to mature miRNA
RISC – RNA induced silencing complex
Nucleus
Cytoplasm
mRNAmRNA
Protein-coding gene miRNA gene
Pre-miRNA
Pri-miRNA
DicerMature miRNA
RISC
RISCAAAA
Translational inhibition / mRNA degradation
Ribosome
ORF
Using miRNAs for Mechanistic Investigation and Biomarker Assessment miRNAs are known to have specific tissue expression
Promising tissue specific biomarkers of toxicity
Little is know about actual gene silencing targets and regulated pathways for many miRNAs.
Used 2,5-hexanedione, Sertoli cell-specific toxicant, to examine whether miRNAs might be potential biomarkers of testicular toxicity.
Compared predicted target pathway ontologies to known target pathway ontologies to confirm roles of miRNAs in testis.
Experimental Design and Outcome
14-day rat study using the testicular toxicant, 2,5-hexanedione in drinking water ad libitum
Left testis was taken for RNA isolation and miRNA analysis on ABI Taqman miRNA array
8 miRNAs were differentially regulated Applied two analysis strategies for miRNA evaluation miRNAs were entered into a publicly available target prediction
algorithm (miRDB) which generated a list of 375 predicted targets Analyzed in GeneGo’s MetaCore database for known targets and
interaction network construction yielding a list of 74 genes. Both analysis strategies suggest miRNA targets involved FSH
signaling, cell cycle and cell adhesion pathways.
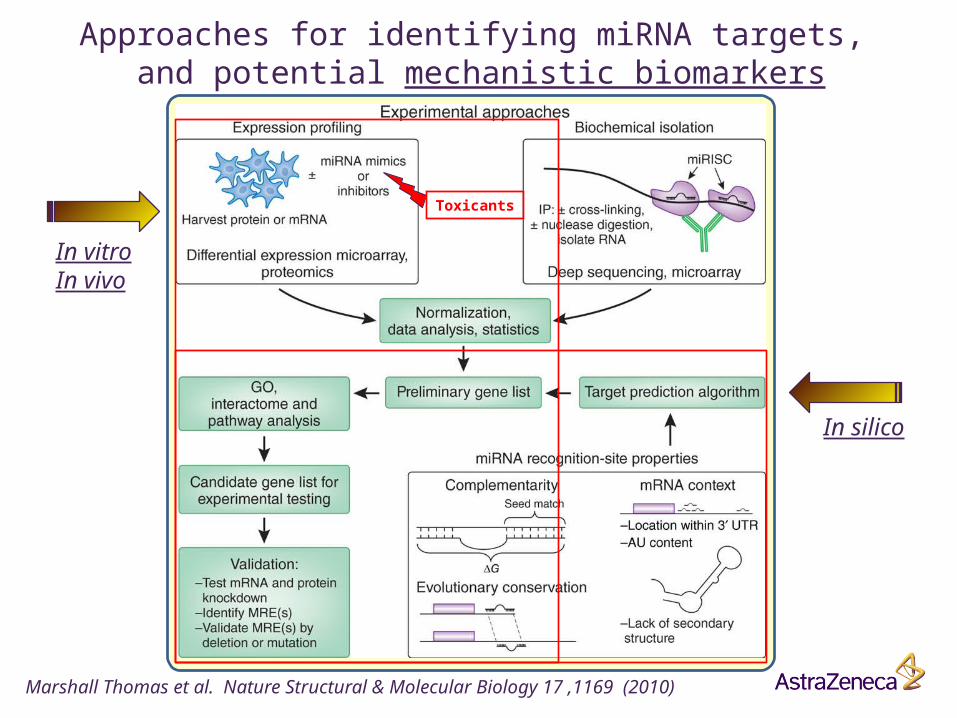
Approaches for identifying miRNA targets, and potential mechanistic biomarkers
Marshall Thomas et al. Nature Structural & Molecular Biology 17 ,1169 (2010)
In vitroIn vivo
In silico
Toxicants
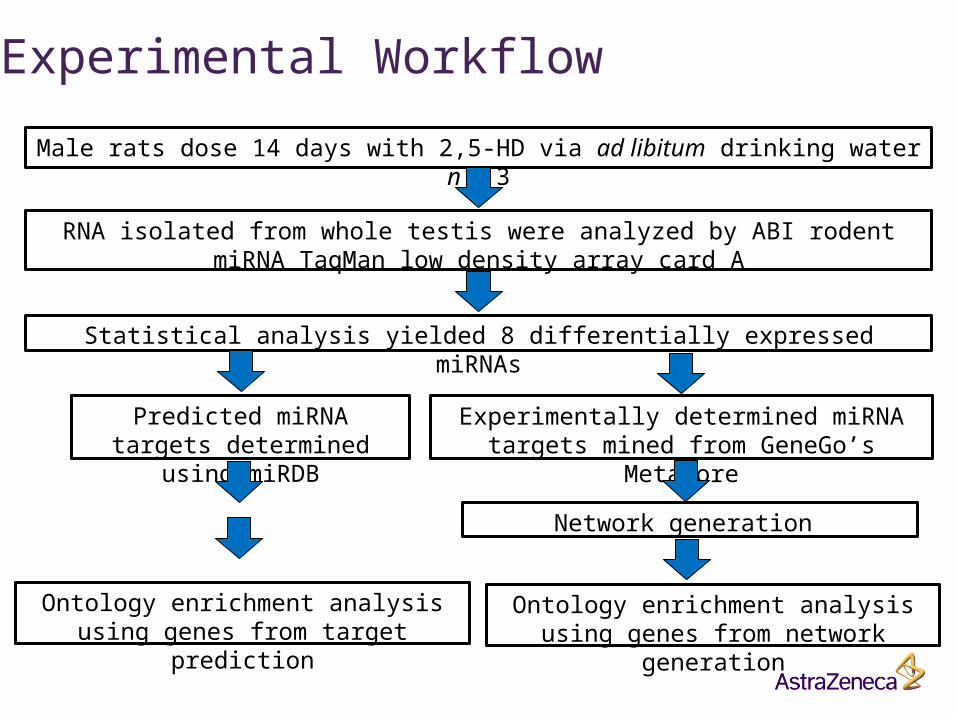
Male rats dose 14 days with 2,5-HD via ad libitum drinking water n = 3
RNA isolated from whole testis were analyzed by ABI rodent miRNA TaqMan low density array card A
Statistical analysis yielded 8 differentially expressed miRNAs
Predicted miRNA targets determined using miRDB
Experimentally determined miRNA targets mined from GeneGo’s MetaCore
Network generation
Ontology enrichment analysis using genes from network generation
Ontology enrichment analysis using genes from target prediction
Experimental Workflow
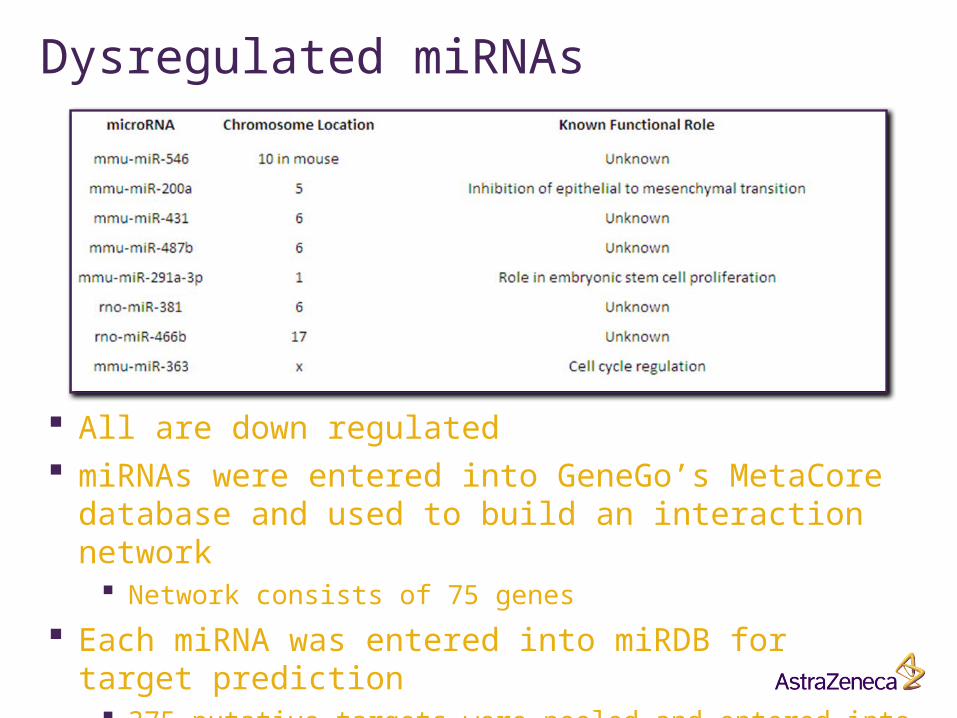
Dysregulated miRNAs
All are down regulated miRNAs were entered into GeneGo’s MetaCore database
and used to build an interaction network Network consists of 75 genes
Each miRNA was entered into miRDB for target prediction 375 putative targets were pooled and entered into MetaCore for
Enrichment Analysis
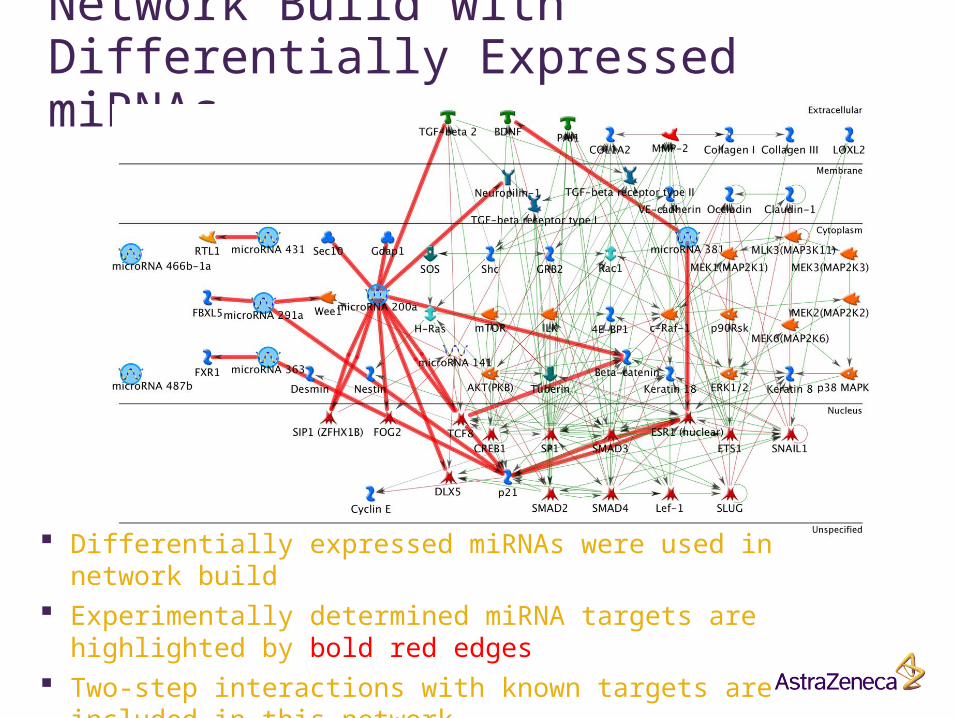
Network Build with Differentially Expressed miRNAs
Differentially expressed miRNAs were used in network build Experimentally determined miRNA targets are highlighted by bold red
edges Two-step interactions with known targets are included in this network
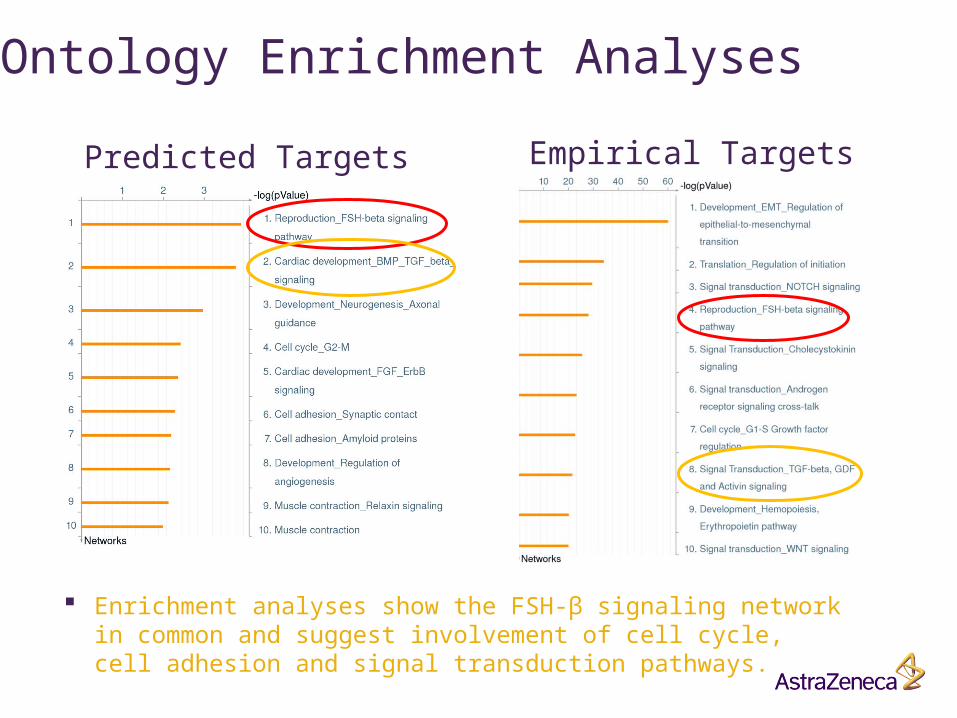
Ontology Enrichment Analyses
Predicted Targets Empirical Targets
Enrichment analyses show the FSH-β signaling network in common and suggest involvement of cell cycle, cell adhesion and signal transduction pathways.
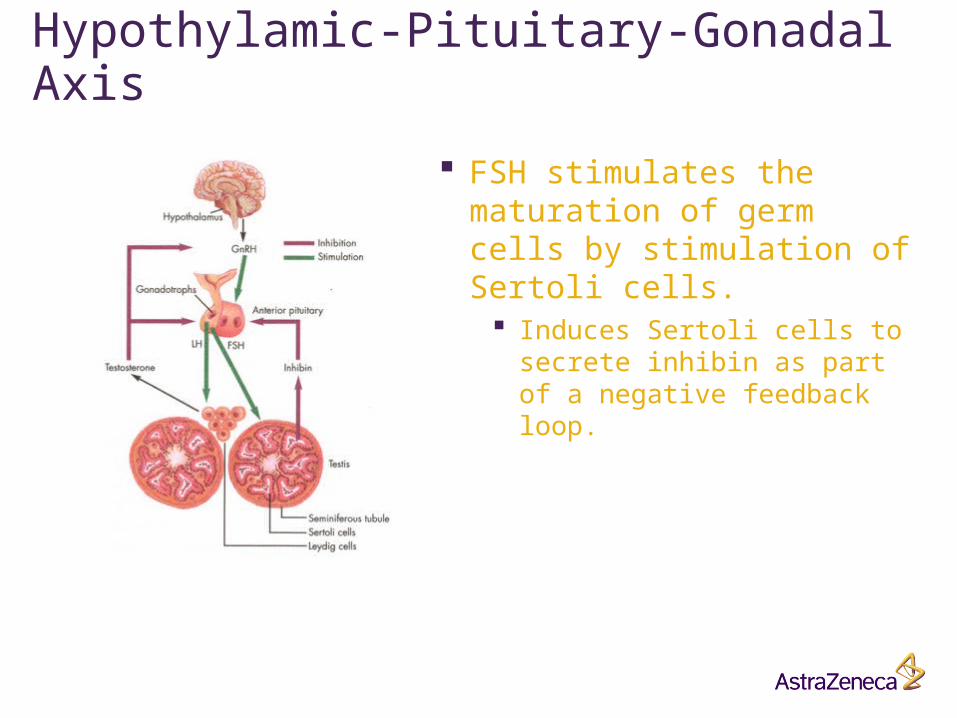
Hypothylamic-Pituitary-Gonadal Axis
FSH stimulates the maturation of germ cells by stimulation of Sertoli cells.
Induces Sertoli cells to secrete inhibin as part of a negative feedback loop.
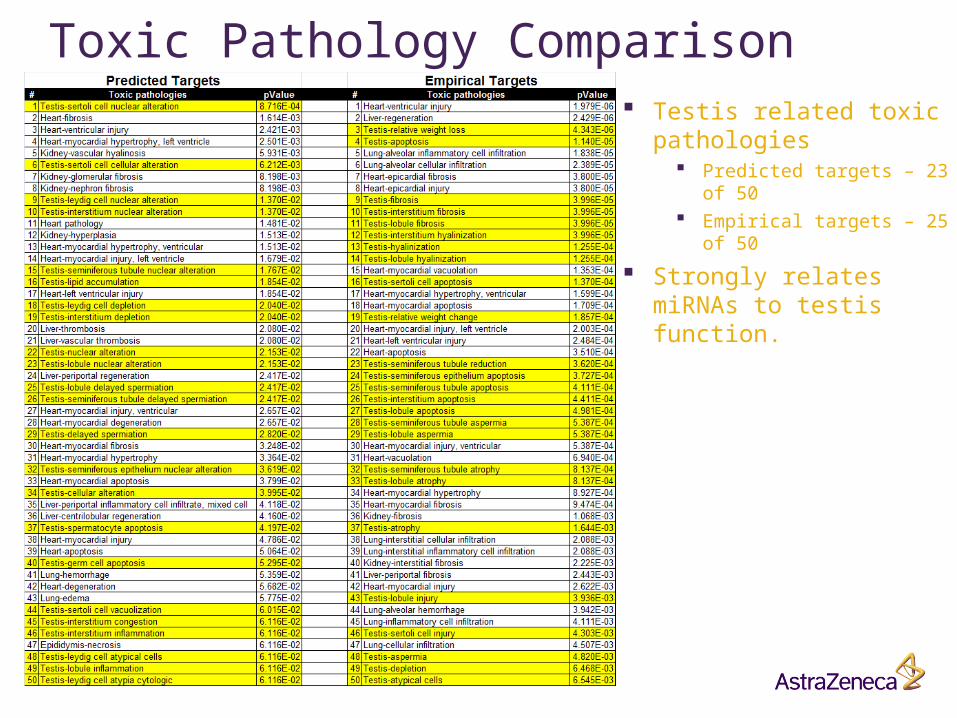
Toxic Pathology Comparison Testis related toxic
pathologies Predicted targets – 23 of 50 Empirical targets – 25 of 50
Strongly relates miRNAs to testis function.
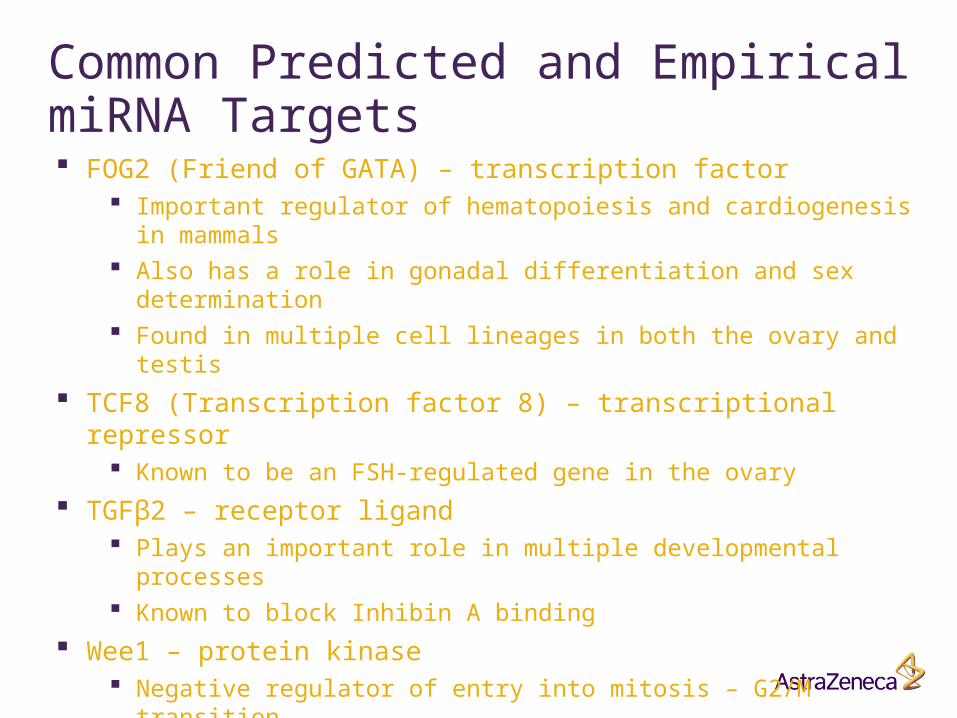
Common Predicted and Empirical miRNA Targets FOG2 (Friend of GATA) – transcription factor
Important regulator of hematopoiesis and cardiogenesis in mammals Also has a role in gonadal differentiation and sex determination Found in multiple cell lineages in both the ovary and testis
TCF8 (Transcription factor 8) – transcriptional repressor Known to be an FSH-regulated gene in the ovary
TGFβ2 – receptor ligand Plays an important role in multiple developmental processes Known to block Inhibin A binding
Wee1 – protein kinase Negative regulator of entry into mitosis – G2/M transition Known to control the activity of M-phase promoting factor – CyclinB/Cdc2
by inhibitory phosphorylation Transcript is decreased in the testis of men with spermatogenic failure

Conclusions Predicted targets for 8 dysregulated miRNAs in the testis
show enrichment for biologically relevant pathways related to 2,5-hexanedione toxicity
Two strategies for assessing the biological context of 8 dysregulated miRNAs in the testis show enrichment for genes involved in FSH-β signaling, a pathway critical to Sertoli cells stimulation and Germ cell maturation.
In silico approach demonstrates that miRNAs play important roles in regulation of testicular function
Combining miRNA profiling with interactome/pathway analysis is a promising approach for identifying biological/toxicologically-relevant miRNA-mRNA interactions, and potential mechanistic miRNAs biomarkers
Further study of miRNAs in plasma and testis is ongoing
Acknowledgements
Hank Lin Brandon Jeffy Yvonne Dragan Linda Barone
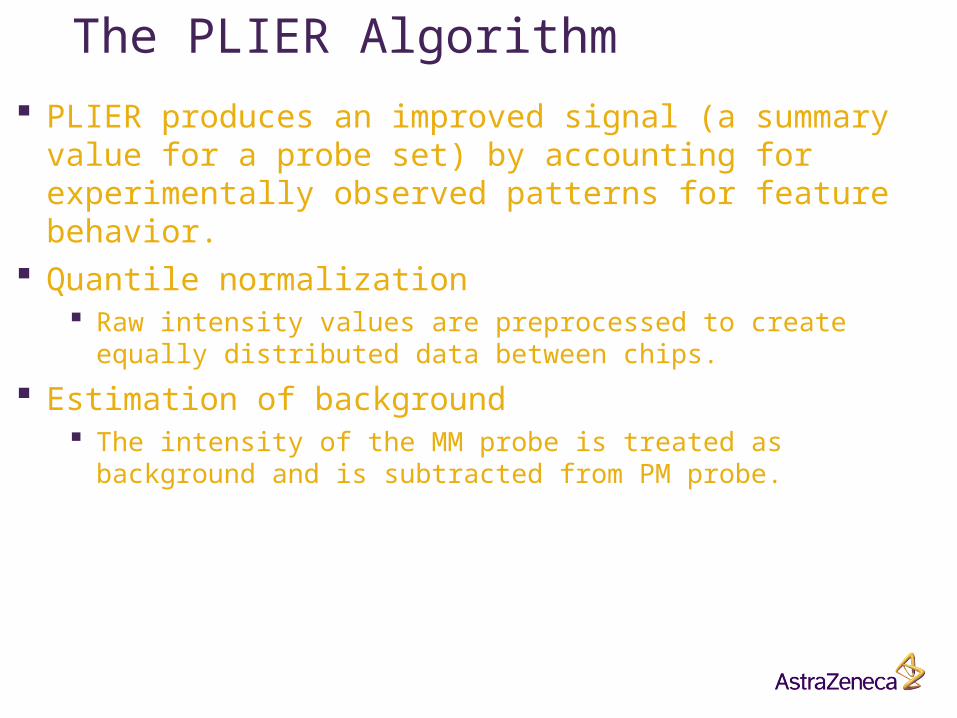
The PLIER Algorithm
PLIER produces an improved signal (a summary value for a probe set) by accounting for experimentally observed patterns for feature behavior.
Quantile normalization Raw intensity values are preprocessed to create equally distributed
data between chips.
Estimation of background The intensity of the MM probe is treated as background and is
subtracted from PM probe.
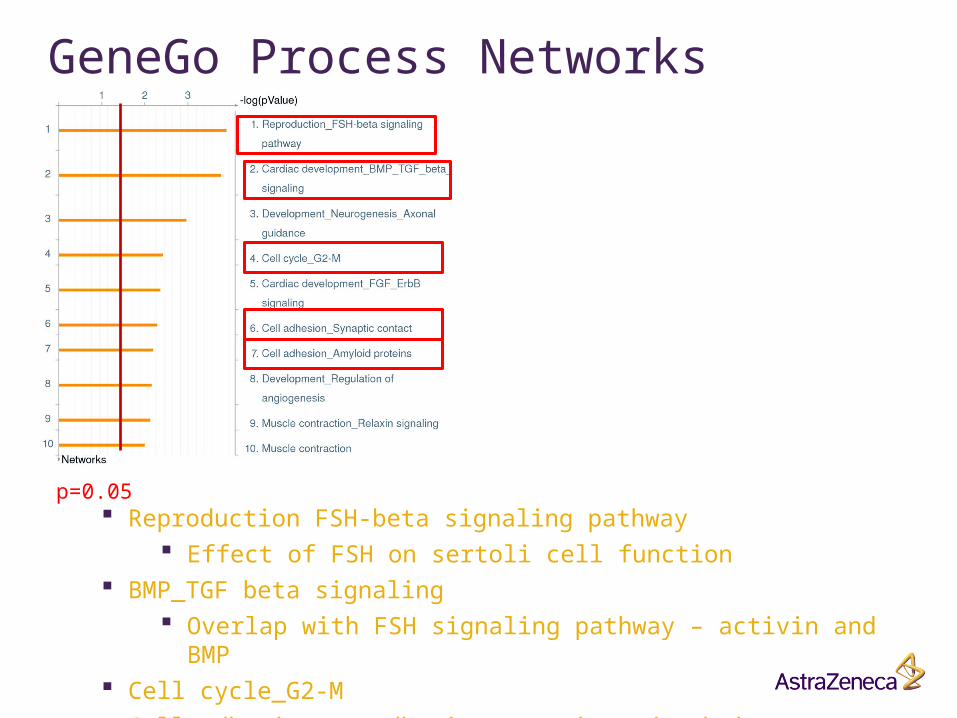
GeneGo Process Networks
Reproduction FSH-beta signaling pathway Effect of FSH on sertoli cell function
BMP_TGF beta signaling Overlap with FSH signaling pathway – activin and BMP
Cell cycle_G2-M Cell adhesion – cadherin, catenin and ephrin
p=0.05