03 - Robert Boyd
37
1 Sul ph ur Outlook Presented at Fertilizer Outlook and Technology Conference Dr. Robert Boyd . PentaSul , October 2009
Transcript of 03 - Robert Boyd
8/17/2019 03 - Robert Boyd
http://slidepdf.com/reader/full/03-robert-boyd 1/37
1
Sulphur Outlook
Presented at
Fertilizer Outlook and Technology
Conference
Dr. Robert Boyd
.
PentaSul
,
October 2009

8/17/2019 03 - Robert Boyd
http://slidepdf.com/reader/full/03-robert-boyd 2/37
2
Forward Looking Statements
PentaSul is an independent market researchorganization with offices in the US and Canada.
PentaSul has a close working relationship with FRC
(Fertecon Research Centre), based in London, UK.
sulphur sector with diligence and care, but cannot accept
responsibility for decisions that are made based on the
.avoid errors and omissions, but accuracy of prices,
analysis and forecasts cannot be guaranteed.
PentaSul
8/17/2019 03 - Robert Boyd
http://slidepdf.com/reader/full/03-robert-boyd 3/37
3
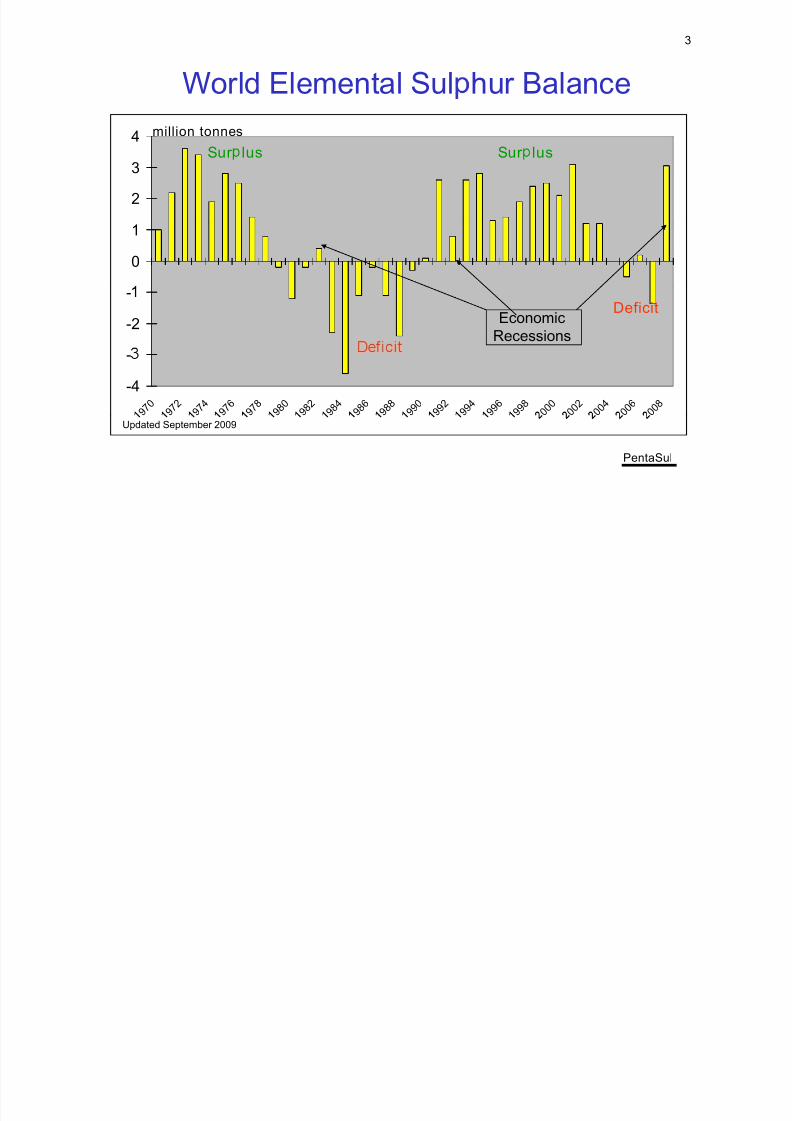
World Elemental Sul hur Balance4
Sur lus Sur lus
million tonnes
2
3
0
1
-2
-Deficit
EconomicRecessions
-4
-
9 7 0
9 7 2
9 7 4
9 7 6
9 7 8
9 8 0
9 8 2
9 8 4
9 8 6
9 8 8
9 9 0
9 9 2
9 9 4
9 9 6
9 9 8
0 0 0
0 0 2
0 0 4
0 0 6
0 0 8
PentaSul
Updated September 2009
8/17/2019 03 - Robert Boyd
http://slidepdf.com/reader/full/03-robert-boyd 4/37
4
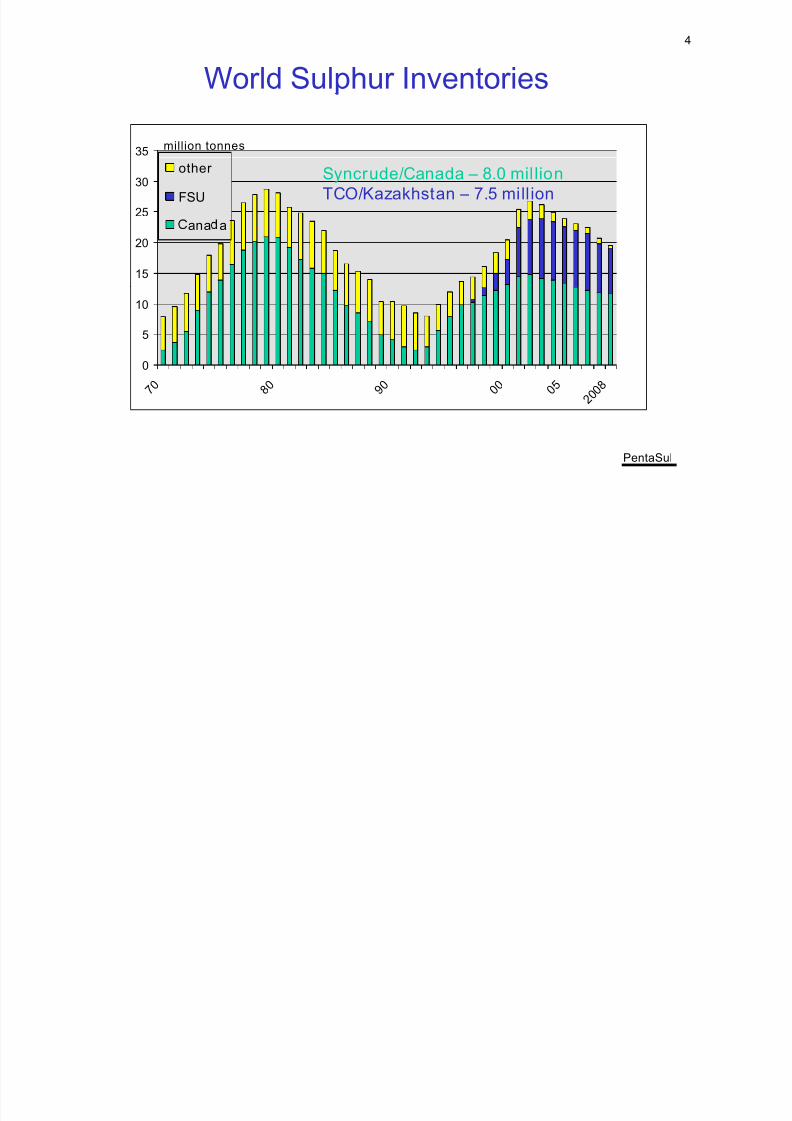
World Sulphur Inventories
35million tonnes
25
30
other
FSUSyncrude/Canada – 8.0 mil lionTCO/Kazakhstan – 7.5 mill ion
15
20
ana a
5
10
0
7 0 8 0 9 0 0 0 0 5 2 0
0 8
PentaSul
8/17/2019 03 - Robert Boyd
http://slidepdf.com/reader/full/03-robert-boyd 5/37
5
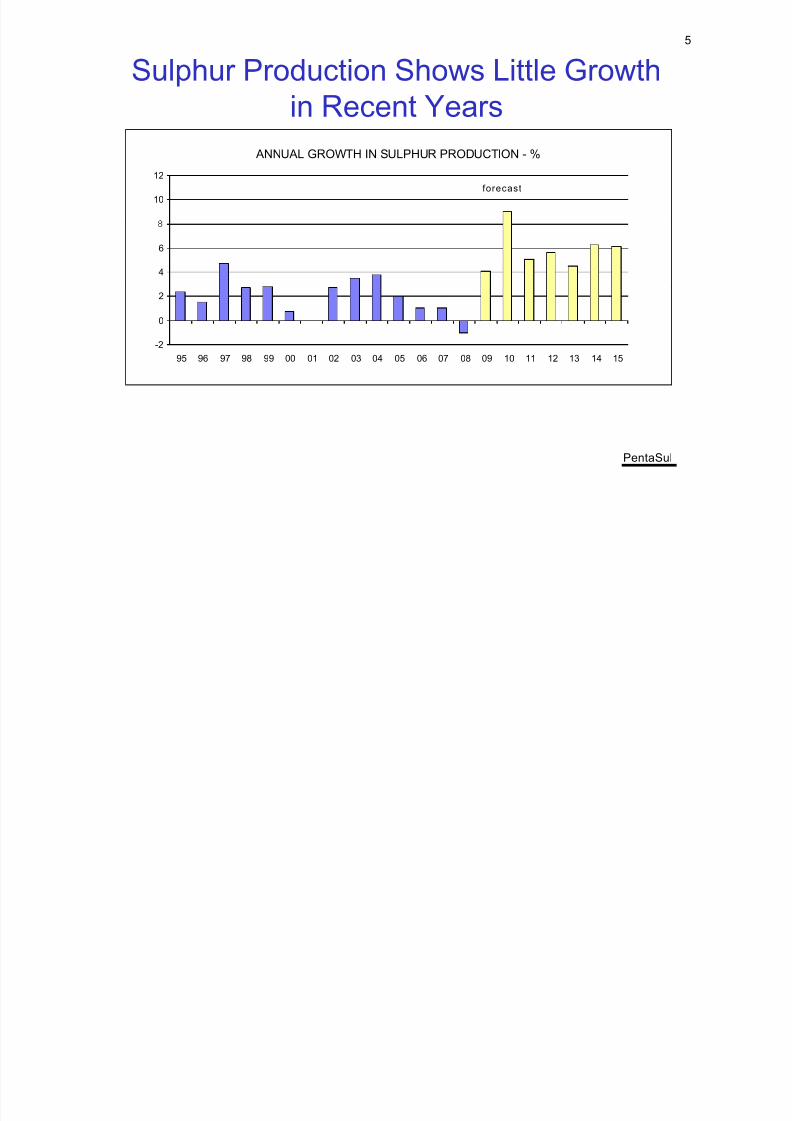
Sulphur Production Shows Little Growthin Recent Years
ANNUAL GROWTH IN SULPHUR PRODUCTION - %
10
12forecast
4
6
-2
0
2
95 96 97 98 99 00 01 02 03 04 05 06 07 08 09 10 11 12 13 14 15
PentaSul

8/17/2019 03 - Robert Boyd
http://slidepdf.com/reader/full/03-robert-boyd 6/37
6
Consum tion Takes Massive Hit in 2008
ANNUAL GROWTH IN SULPHUR CONSUMPTION - %
8
10forecast
-
0
2
4
-8
-6
-4
-
-
95 96 97 98 99 00 01 02 03 04 05 06 07 08 09 10 11 12 13 14 15
PentaSul
or su p ur eman a s rom . m on onnes n
2007 to 45.0 million tonnes in 2008.
8/17/2019 03 - Robert Boyd
http://slidepdf.com/reader/full/03-robert-boyd 7/37
77
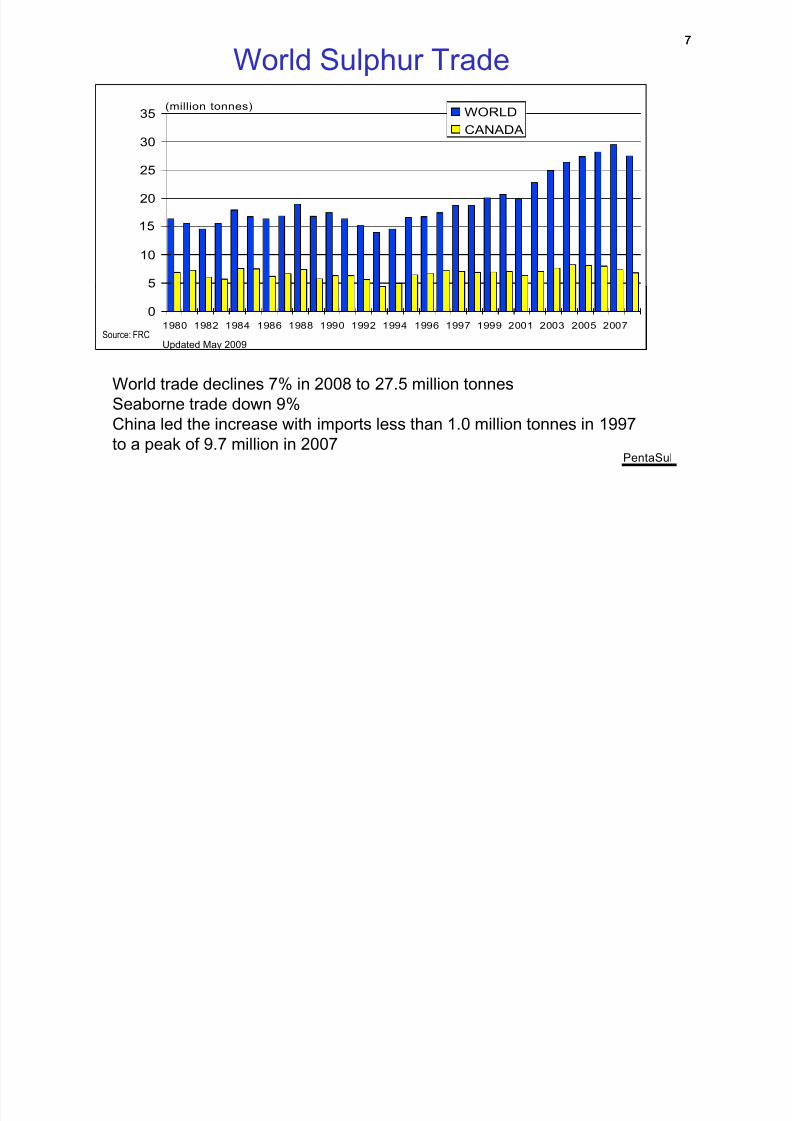
World Sulphur Trade
30
35 WORLD
CANADA
(million tonnes)
20
25
5
10
01980 1982 1984 1986 1988 1990 1992 1994 1996 1997 1999 2001 2003 2005 2007
Updated May 2009Source: FRC
World trade declines 7% in 2008 to 27.5 million tonnesSeaborne trade down 9%
PentaSul
China led the increase with imports less than 1.0 million tonnes in 1997
to a peak of 9.7 million in 2007

8/17/2019 03 - Robert Boyd
http://slidepdf.com/reader/full/03-robert-boyd 8/37
8
Importers- ranked by 2008 importsonnes
Market Imports Origin
, , , ,
Morocco 3,088,000 Russia, Kaz., ME
USA 2 966 000 Canada Mexico Venez.
Brazil 2,226,000 Canada, USA, ME
Tunisia 1,694,000 Russia, Kaz., ME
India 1,516,000 ME
South Africa 967,000 Canada, ME
Australia 714,000 ana a
Ukraine, Jordan, Mexico,
Indonesia, Israel.350,000 – 500,000
PentaSul

8/17/2019 03 - Robert Boyd
http://slidepdf.com/reader/full/03-robert-boyd 9/37
9
World Sul hur Trade Colla ses in Q42008
PentaSul

8/17/2019 03 - Robert Boyd
http://slidepdf.com/reader/full/03-robert-boyd 10/37
10
China Sulphur Imports
China Sulphur Imports by Month
1400
16002008 20092007
'000 tonnes
800
1000
200
400
0
J F M A M J J A S O N D
PentaSul April 2009 imports set new record – 1.5 million tonnes

8/17/2019 03 - Robert Boyd
http://slidepdf.com/reader/full/03-robert-boyd 11/37
11
Key World Sulphur Price Now cfr China
$ per tonne
Current pricesDelivered to China $60-65/tonneVancouver $35-45 fob
PentaSul
ADNOC – October $45/tonne fob

8/17/2019 03 - Robert Boyd
http://slidepdf.com/reader/full/03-robert-boyd 12/37
12
Elemental Sulphur Balance & Price4 450
Million tonnes US$/tonne fob Vancouver
2
3
350
400
Balance
Price fob Vancr.
0
1
200
250Deficit Deficit
-2
-1
100
150
urp us
-4
-3
0
50
PentaSul
1 9 1 9 1 9 1 9 1 9 1 9 1 9 1 9 1 9 1 9 1 9 1 9 1 9 1 9 1 9 2 0 2 0 2 0 2 0 2 0

8/17/2019 03 - Robert Boyd
http://slidepdf.com/reader/full/03-robert-boyd 13/37
13
World Elemental Sulphur Production and Demand
70000
80000
‘000 tonnes SForecast
50000
60000
30000
40000
10000
20000
7%13%
20%24%
China as %World
0
1990 1995 2000 2005 2010 2015
demand
PentaSul
as +o er ne na eman
Revised September 2009
8/17/2019 03 - Robert Boyd
http://slidepdf.com/reader/full/03-robert-boyd 14/37
14
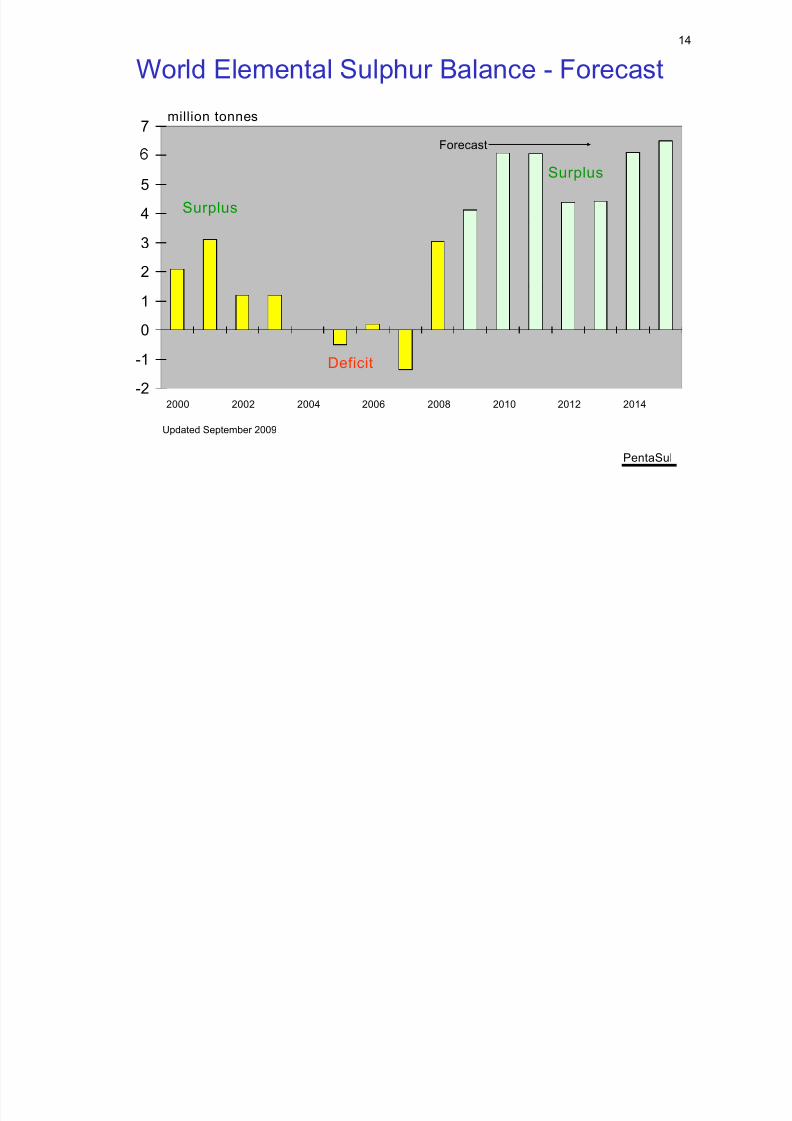
World Elemental Sulphur Balance - Forecast
7Forecast
million tonnes
4
5
Surplus
Surplus
2
3
0
1
-2
-1
2000 2002 2004 2006 2008 2010 2012 2014
Deficit
PentaSul
Updated September 2009
8/17/2019 03 - Robert Boyd
http://slidepdf.com/reader/full/03-robert-boyd 15/37
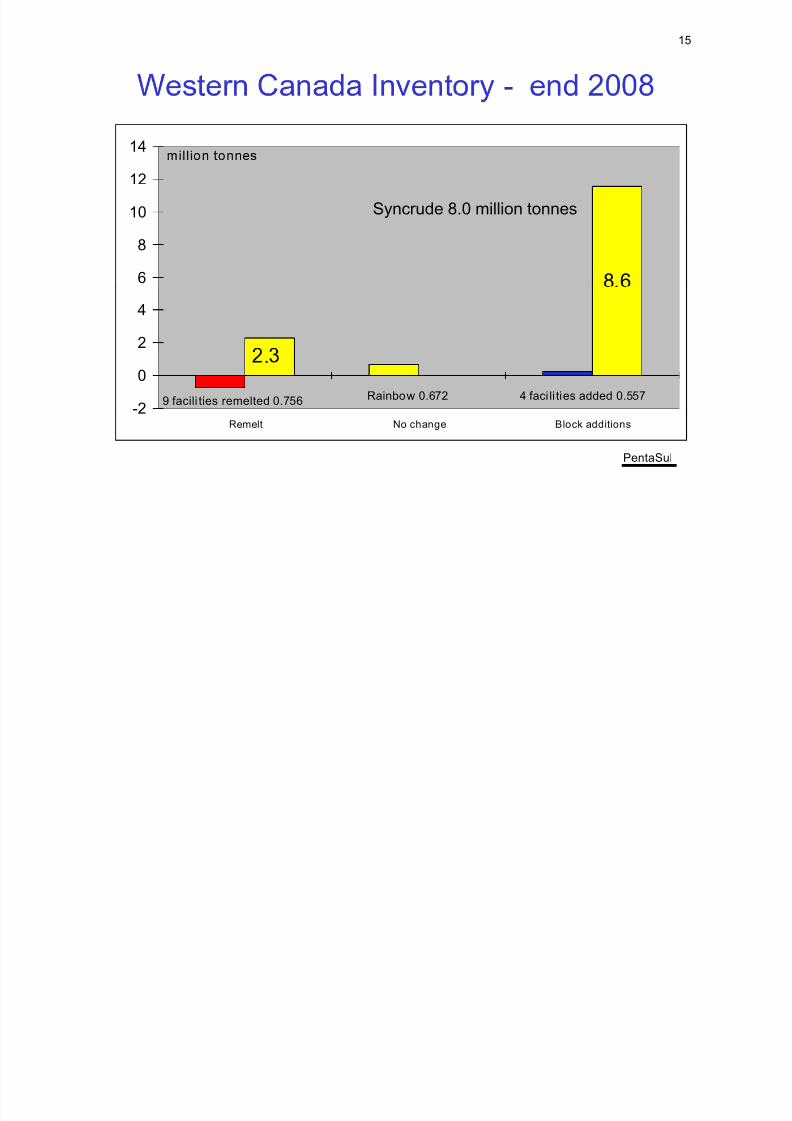
15
- 14
10
12
Syncrude 8.0 million tonnes
6
8
8.6
2
4
-2
0
9 facili ties remelted 0.756
.Rainbow 0.672 4 faci li ties added 0.557
PentaSul
Remelt No change Block additions

8/17/2019 03 - Robert Boyd
http://slidepdf.com/reader/full/03-robert-boyd 16/37
16
Sul hur Production from Oilsands O erations
Surface/Insitu Mining Sulphur
AthabascaFort
t upgra ers tonnes (2008)
Syncrude 745,000Suncor 340,000
eaceRiver
McMurray CNRL -
Nexen/Opti -
Edmonton
Upgraders
AOSP (Scotford) 317,000
Calgary
,
Regina SK (Co-op) 135,000
PentaSul
TOTAL 1,647,000
2007 total – 1,768,000

8/17/2019 03 - Robert Boyd
http://slidepdf.com/reader/full/03-robert-boyd 17/37
17
Ft. McMurray Region Sulphur Production Forecast
FORECAST ELEMENTAL SULPHUR PRODUCTION(‘000 tonnes)
2007 2008 2009 2010 2011 2012 2013
Red indicates recentrevisions to forecast
• Suncor struggles with
Sulphur recovery 5,100 – 5,400 tonnesper million bbl/SCO
Oil ‘000 bbls/day 230 250 350 350 350 350 350Sulphur tonnes 433 375 450 500 500 500 500
pro uc on, re ucescapex for upgraderexpansion planned for2010/2011 – now muchlater.
Sulphur recovery 6,700 tonnes permillion bbl SCO
Oil ‘000 bbls/day 325 350 350 350 370 400 400Sulphur tonnes 764 750 800 850 900 1,000 1,000
• Nexen/Opti startsproduction at Long Lakein early 2009, has start-
up problems. Has
Sulphur recovery 6,300 tonnes permillion bbl SCO
Oil ‘000 bbls/day 0 0 45 110 150 175 175
Sulphur tonnes 0 0 100 250 350 400 400
originally planned for2012.• CNRL on stream inearly 2009. Block
exen pSulphur recovery 8,900 tonnes permillion bbl SCO Oil 0 15 37 60 60 60 60Sulphur 0 0 30 195 195 195 195
pouring systems inplace.
1 million tonnes of
PentaSul
TOTAL Sulphur 1,197 1,125 1,380 1,795 1,845 2,095 2,095 removed from the
forecast.

8/17/2019 03 - Robert Boyd
http://slidepdf.com/reader/full/03-robert-boyd 18/37
18
(‘000 tonnes)
2007 2008 2009 2010 2011 2012 2013 Scotford 1 ‘ 323 354 360 500 620 620 620
Scotford 2 DELAYED • Estimates run from $30-80 billion
nergy
NW Upgrader STALLED
Fort Hills DELAYED
.
• Future prospects will be influencedby lower oil prices.
• Abilit to finance ma or ro ects
Synenco CUT
Total DELAYED
now an issue.
• Major reduction in capex for 2009.
• Mining projects fare better than
StatoilHydro DELAYED
Petro-Canada Strathcona 0 10 70 100 100 100 100
upgraders.
PentaSul
TOTAL Sulphur 323 364 430 600 720 720 720
8/17/2019 03 - Robert Boyd
http://slidepdf.com/reader/full/03-robert-boyd 19/37
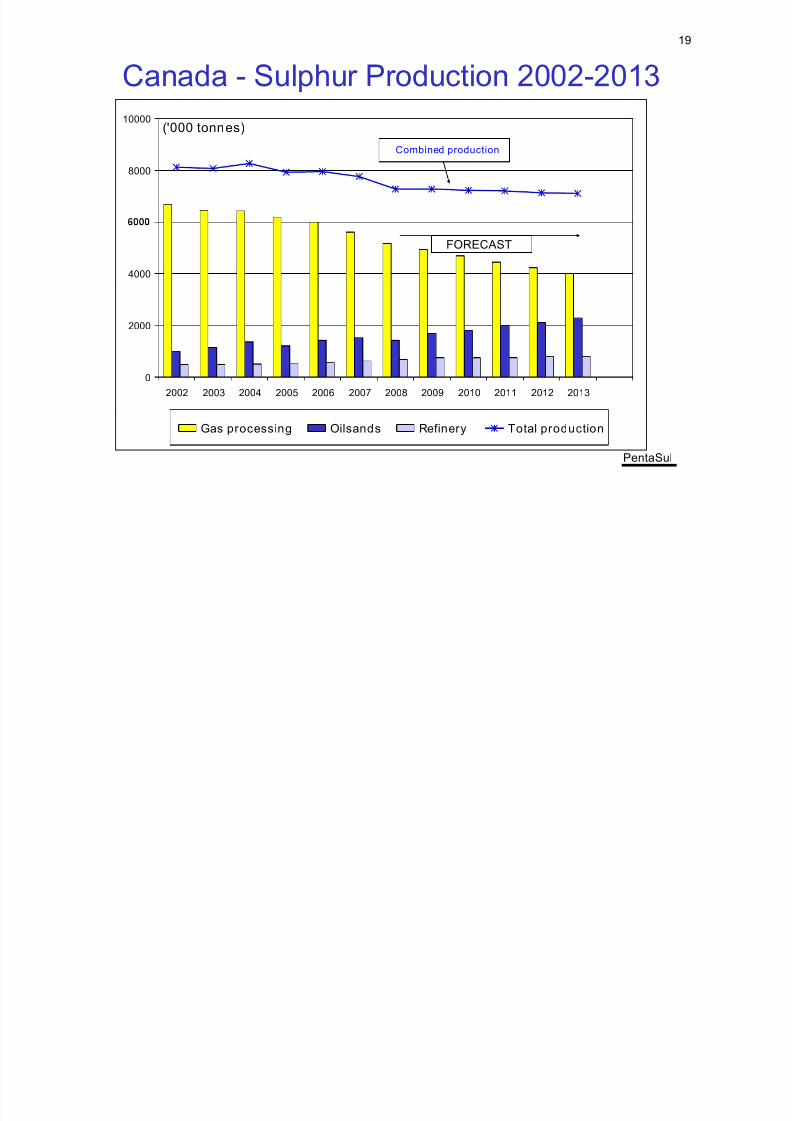
19
Canada - Sulphur Production 2002-201310000
('000 tonnes)
Combined production
8000
4000
FORECAST
2000
0
2002 2003 2004 2005 2006 2007 2008 2009 2010 2011 2012 2013
PentaSul
Gas processing Oilsands Refinery Total production
8/17/2019 03 - Robert Boyd
http://slidepdf.com/reader/full/03-robert-boyd 20/37
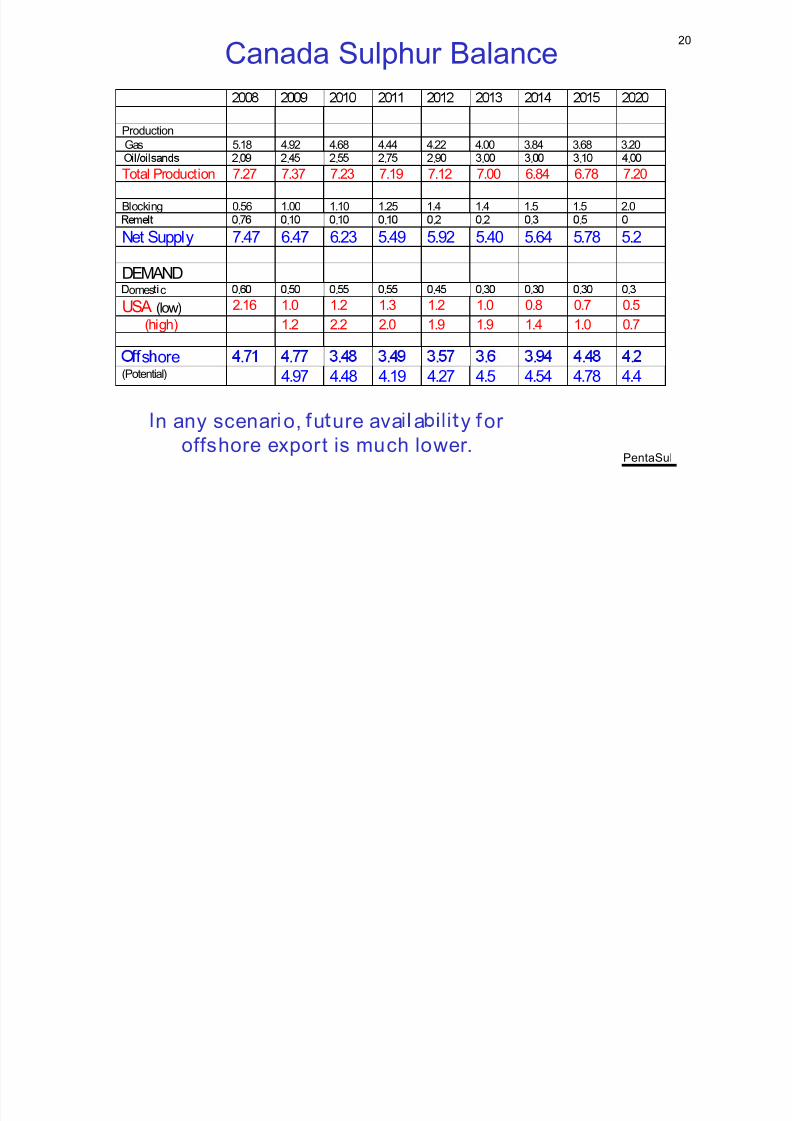
20
Canada Sulphur Balance
ProductionGas 5.18 4.92 4.68 4.44 4.22 4.00 3.84 3.68 3.20
. . . . . . . . .
Total Production 7.27 7.37 7.23 7.19 7.12 7.00 6.84 6.78 7.20
Blocking 0.56 1.00 1.10 1.25 1.4 1.4 1.5 1.5 2.0. . . . . . . .
Net Supply 7.47 6.47 6.23 5.49 5.92 5.40 5.64 5.78 5.2
DEMANDomes c . . . . . . . . .
USA (low) 2.16 1.0 1.2 1.3 1.2 1.0 0.8 0.7 0.5
(high) 1.2 2.2 2.0 1.9 1.9 1.4 1.0 0.7
s ore . . . . . . . . .(Potential) 4.97 4.48 4.19 4.27 4.5 4.54 4.78 4.4
PentaSul
n any scenar o, u ure ava a y or
offshore export is much lower.
8/17/2019 03 - Robert Boyd
http://slidepdf.com/reader/full/03-robert-boyd 21/37
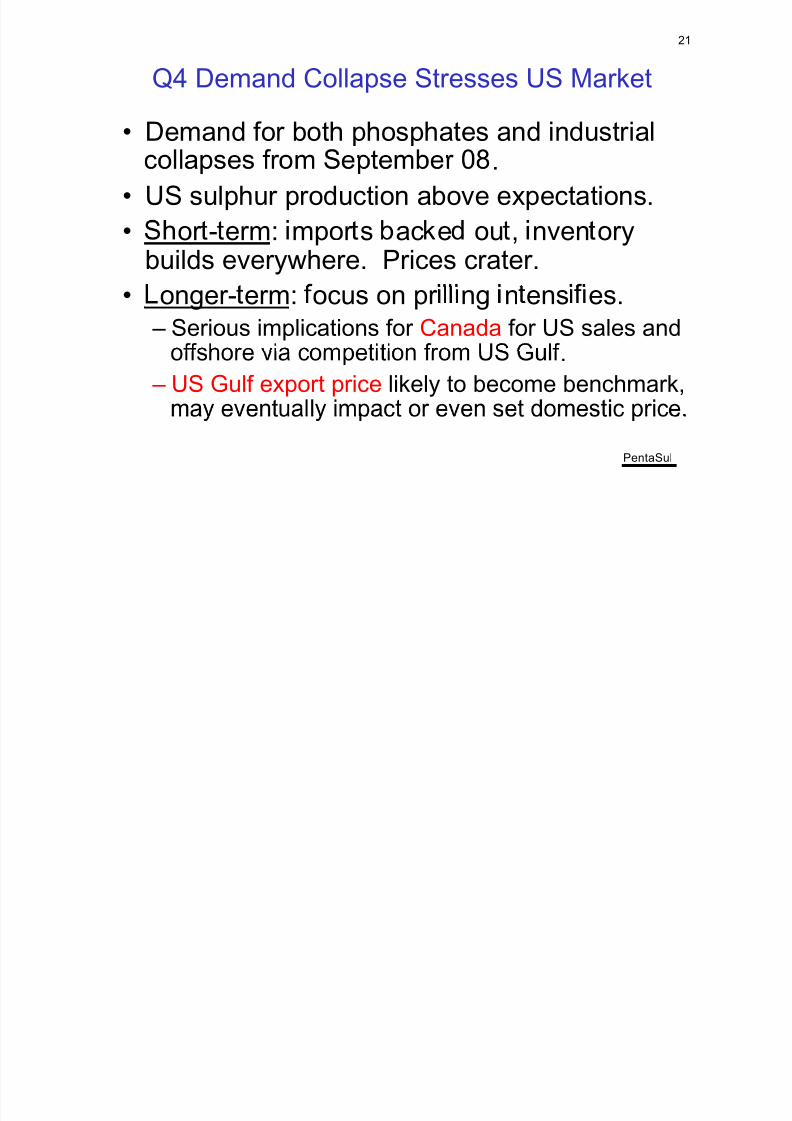
21
Q4 Demand Collapse Stresses US Market
• Demand for both phosphates and industrial.
• US sulphur production above expectations.
• or - erm: mpor s ac e ou , nven ory
builds everywhere. Prices crater.• onger- erm: ocus on pr ng n ens es. – Serious implications for Canada for US sales and
. – US Gulf export price likely to become benchmark,
PentaSul

8/17/2019 03 - Robert Boyd
http://slidepdf.com/reader/full/03-robert-boyd 22/37
22
US Sul hur Prices Hi h Volatile in 2008
TAMPA SULPHUR PRICES Annual Average (1980-2007), Quarterly (08/9)
700
US $/t
500
600
Q2
Q3
200
300
400
Q1
0
100
Q1Q2
Q3
PentaSul
8/17/2019 03 - Robert Boyd
http://slidepdf.com/reader/full/03-robert-boyd 23/37
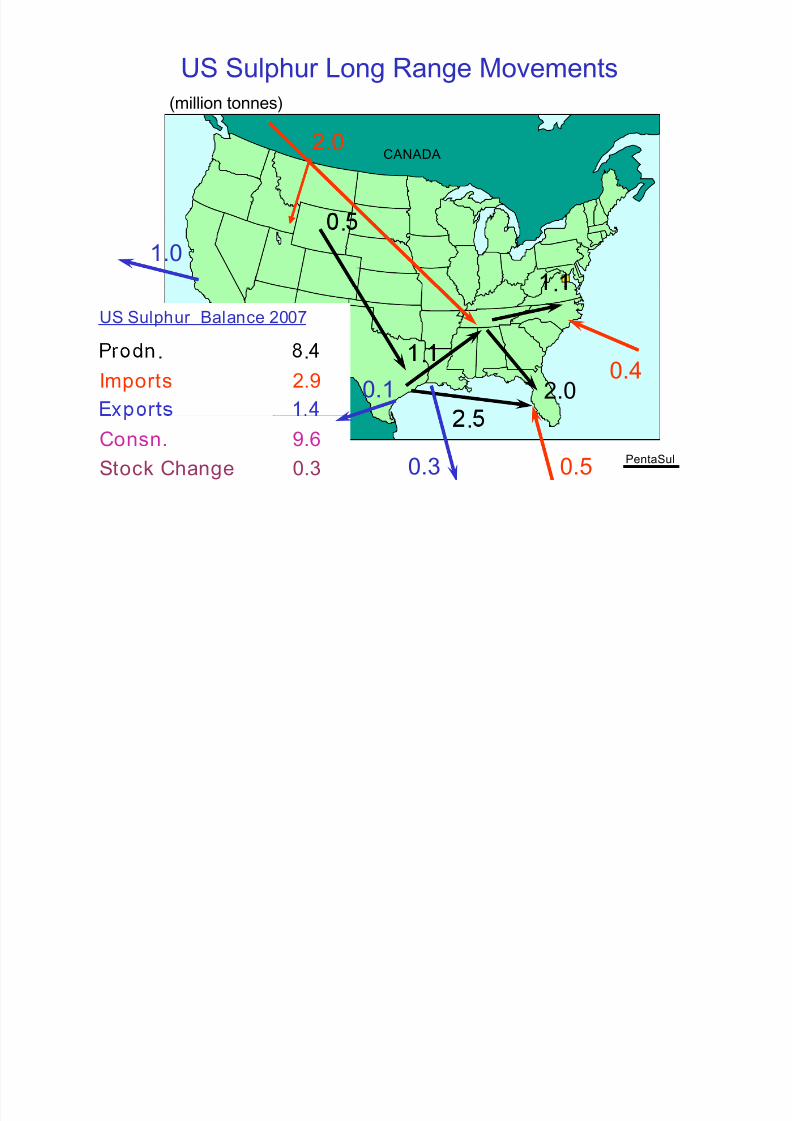
23
US Sulphur Long Range Movements
2.0CANADA
(million tonnes)
1.0
.
US Sulphur Balance 2007
.
. .
Imports 2.9 0.42.0
.0.1
PentaSulPentaSul
Consn. 9.6
Stock Change 0.3 0.5
.
0.3
8/17/2019 03 - Robert Boyd
http://slidepdf.com/reader/full/03-robert-boyd 24/37
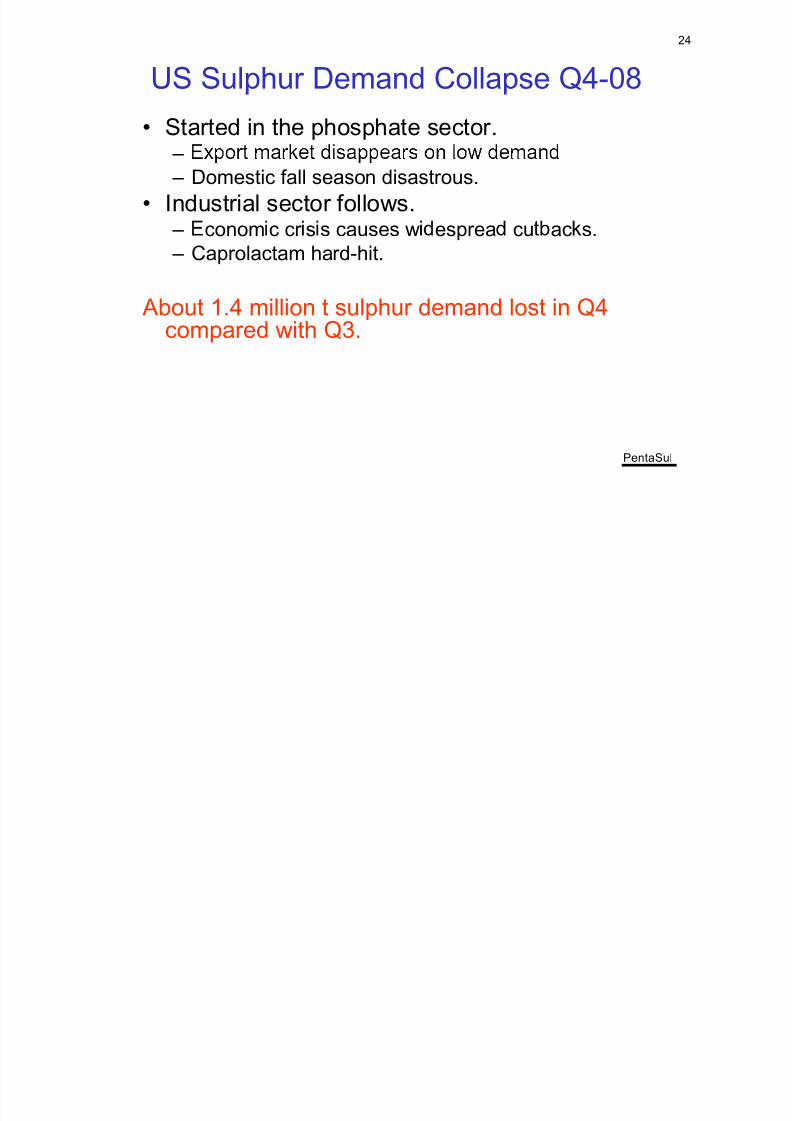
24
US Sulphur Demand Collapse Q4-08• Started in the phosphate sector.
–
– Domestic fall season disastrous.• Industrial sector follows. – conom c cr s s causes w esprea cu ac s. – Caprolactam hard-hit.
About 1.4 million t sulphur demand lost in Q4compared with Q3.
PentaSul
8/17/2019 03 - Robert Boyd
http://slidepdf.com/reader/full/03-robert-boyd 25/37
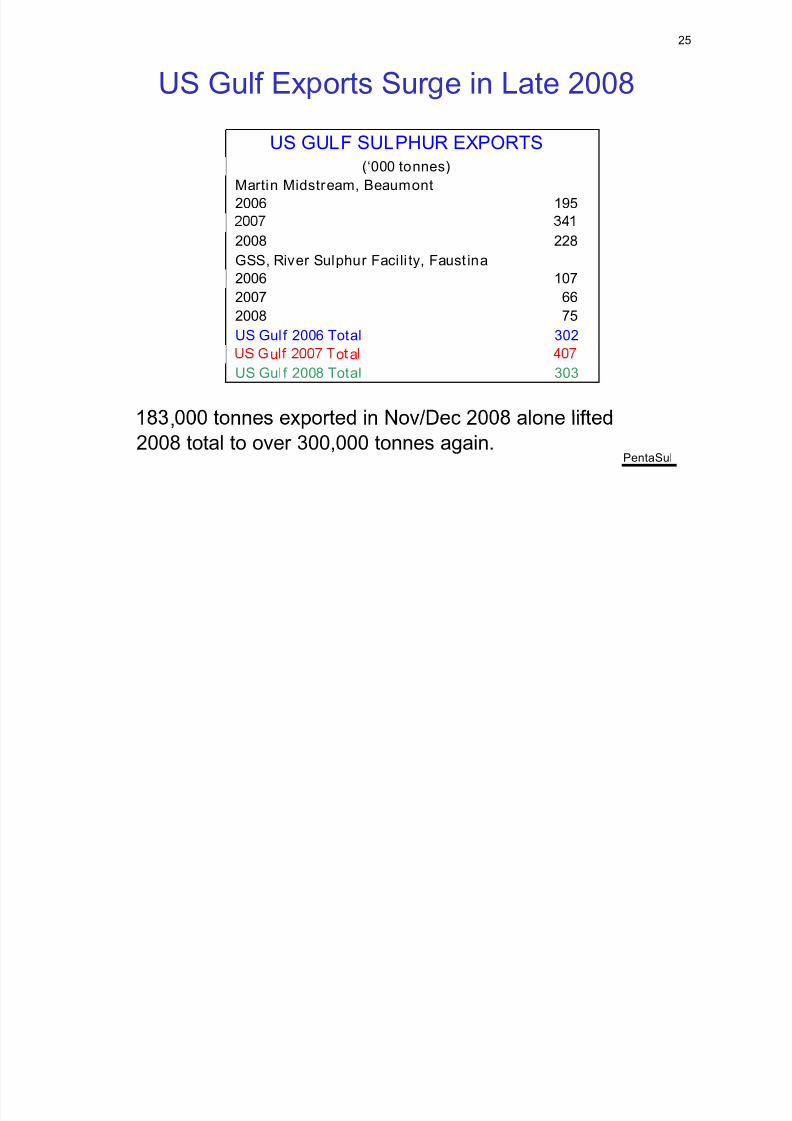
25
US Gulf Ex orts Sur e in Late 2008US GULF SULPHUR EXPORTS
(‘000 tonnes)
Martin Midstream, Beaumont2006 195
2008 228
GSS, River Sulphur Facili ty, Faust ina
2006 107
2007 66
2008 75
US Gulf 2006 Total 302
u o a
US Gulf 2008 Total 303
PentaSul
,
2008 total to over 300,000 tonnes again.
8/17/2019 03 - Robert Boyd
http://slidepdf.com/reader/full/03-robert-boyd 26/37
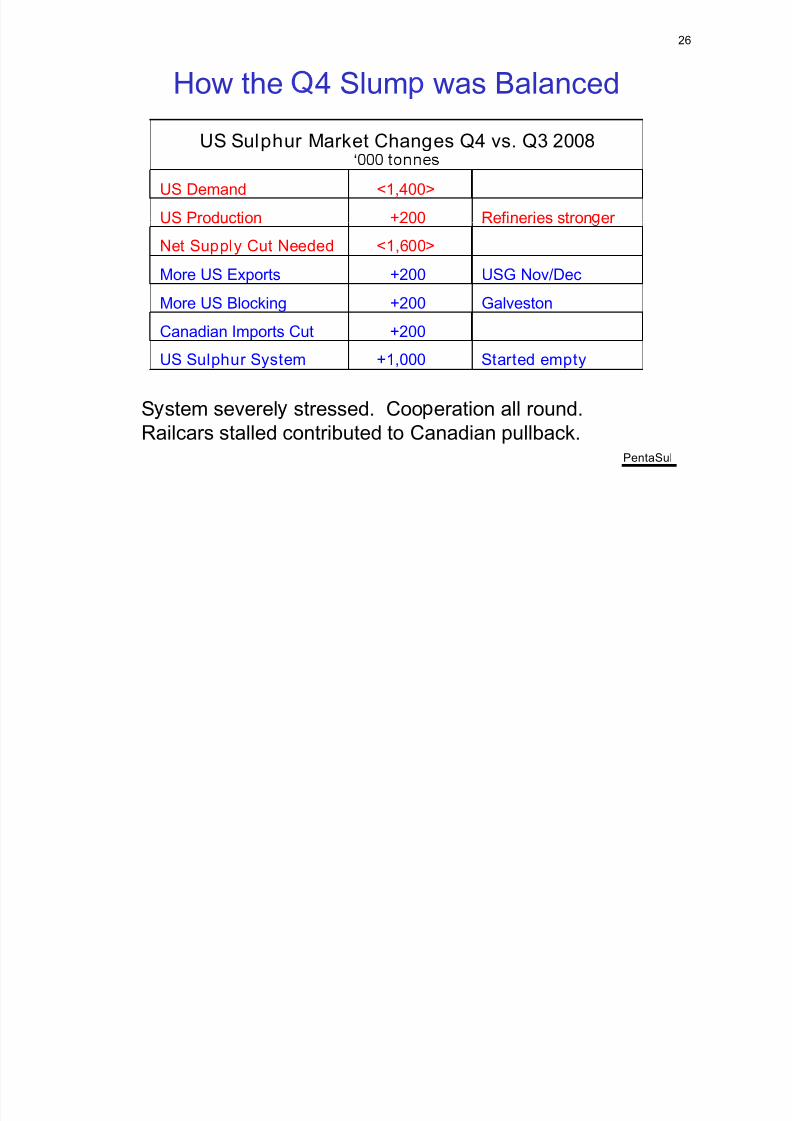
26
How the 4 Slum was BalancedUS Sulphur Market Changes Q4 vs. Q3 2008
‘
US Demand <1,400>
US Production +200 Refineries stron er
Net Supply Cut Needed <1,600>
More US Exports +200 USG Nov/Dec
More US Blocking +200 Galveston
Canadian Imports Cut +200
US Sulphur System +1,000 Started empty
S stem severel stressed. Coo eration all round.
PentaSul
Railcars stalled contributed to Canadian pullback.

8/17/2019 03 - Robert Boyd
http://slidepdf.com/reader/full/03-robert-boyd 27/37
27
US Sulphur Balance
2006 2007 2008
DEMAND 11.25 11.52 10.02- Cons. 9.85 10.00 8.75- xpor s . . .
CA+ 1.10 1.11 0.97US Gulf 0.30 0.41 0.30
. . .- Recovered 8.39 8.28 8.59
Oil Refining 6.96 7.00 7.43
Gas Processing 1.43 1.28 1.16- mpor s . . .
Canada 2.10 2.09 2.16
Mexico 0.48 0.42 0.36
Venezuela 0.36 0.34 0.34
er - - .
STOCK CHANGE 0.08 (0.37) 1.54
PentaSul
million tonnes

8/17/2019 03 - Robert Boyd
http://slidepdf.com/reader/full/03-robert-boyd 28/37
28
US Sulphur Market Rebalances in 2009
• Phosacid ca acit utilization ram s u inFebruary/March to 70% and to >80% by thesummer.
• .• Strong US Gulf exports all year.
• Canadian im orts will be about 1 million tonnesless than in 2008.
• Slightly higher refinery sulphur production.
- .350,000 tonnes inventory now being drawn down.
PentaSul
8/17/2019 03 - Robert Boyd
http://slidepdf.com/reader/full/03-robert-boyd 29/37
29
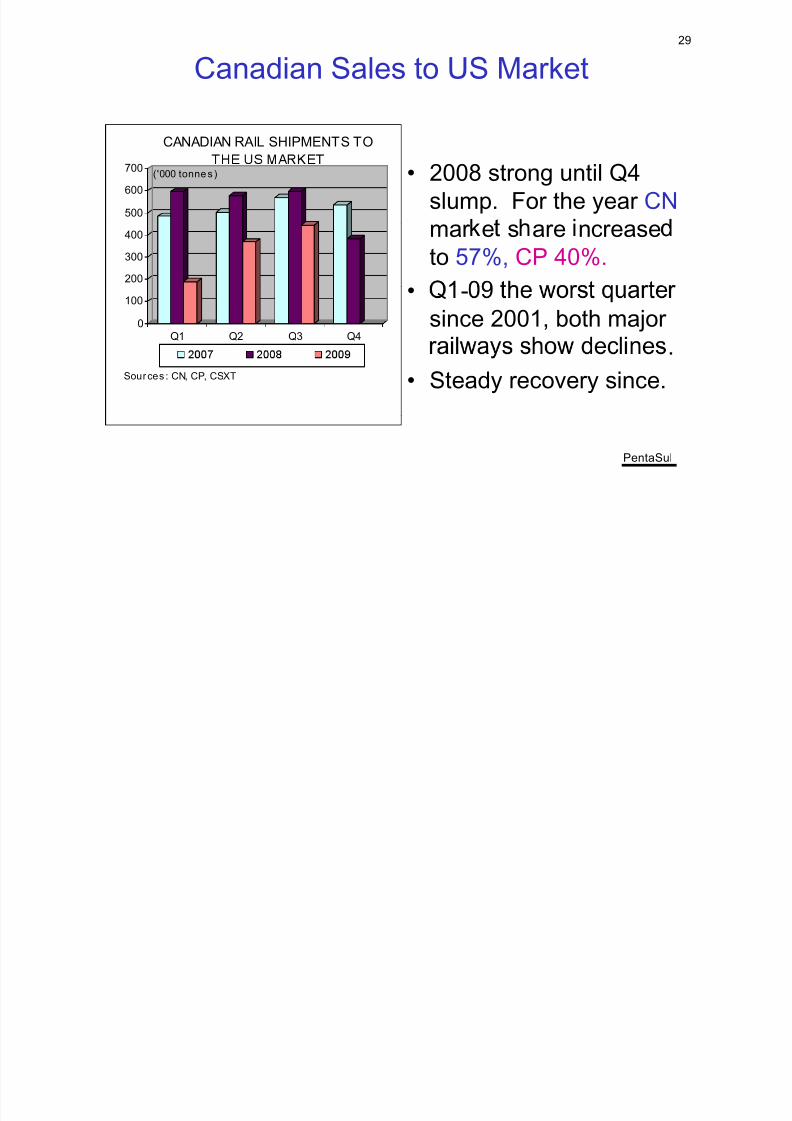
Canadian Sales to US Market
CANADIAN RAIL SHIPMENTS TO
• 2008 strong until Q4slump. For the year CN500
600
700
('000 tonnes)
mar e s are ncreaseto 57%, CP 40%.
200
300
400
• -since 2001, both major0
100
Q1 Q2 Q3 Q4
.
• Steady recovery since.Sources : CN, CP, CSXT
PentaSul
30

8/17/2019 03 - Robert Boyd
http://slidepdf.com/reader/full/03-robert-boyd 30/37
30
US Sulphur Market Rebalances in 2009
US Sulphur Supply/Demand Changes Quarter-on-Quarter‘000 tonnes
Q4-08 Q1-09 Q2-09 Q3-09Demand <1,400> +100 +400 +400
Production +200 <100> +50 <100>,
Canadian Imports <200> <200> +200 +75
Offshore Imports 0 <150> 0 +25
Blockin <200> +50 +100 0
Exports <200> <350> +200 <20>Inventory +1,000 <850> +150 <420>
PentaSul
31
8/17/2019 03 - Robert Boyd
http://slidepdf.com/reader/full/03-robert-boyd 31/37
31
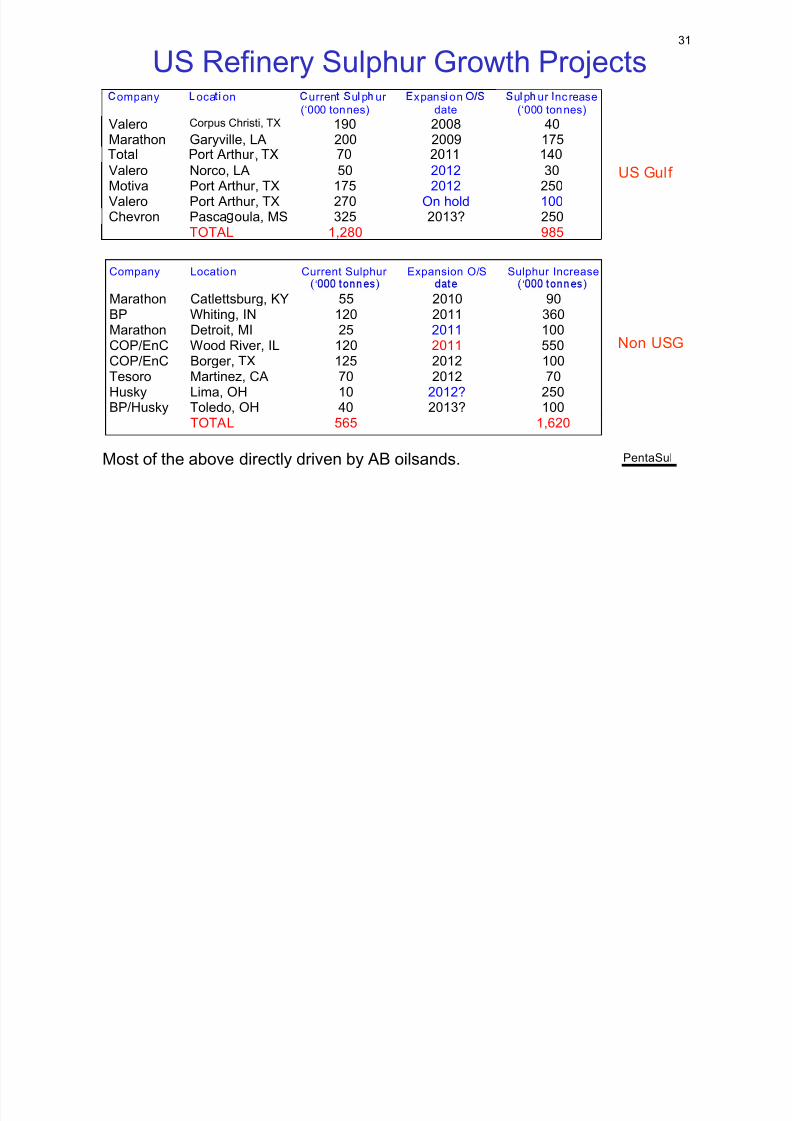
US Refinery Sulphur Growth Projectsompany oca on urren u p ur
(‘000 tonnes)xpans on
dateu p ur nc rease(‘000 tonnes)
Valero Corpus Christi, TX 190 2008 40Marathon Garyville, LA 200 2009 175
,Valero Norco, LA 50 2012 30
Motiva Port Arthur, TX 175 2012 250Valero Port Arthur, TX 270 On hold 100Chevron Pasca oula, MS 325 2013? 250
US Gulf
TOTAL 1,280 985
Company Location Current Sulphur‘ Expansion O/S Sulphur Increase‘
Non USG
Marathon Catlettsburg, KY 55 2010 90BP Whiting, IN 120 2011 360Marathon Detroit, MI 25 2011 100COP/EnC Wood River, IL 120 2011 550
COP/EnC Borger, TX 125 2012 100Tesoro Martinez, CA 70 2012 70Husky Lima, OH 10 2012? 250BP/Husky Toledo, OH 40 2013? 100
PentaSul
TOTAL 565 1,620
Most of the above directly driven by AB oilsands.
32
8/17/2019 03 - Robert Boyd
http://slidepdf.com/reader/full/03-robert-boyd 32/37
32
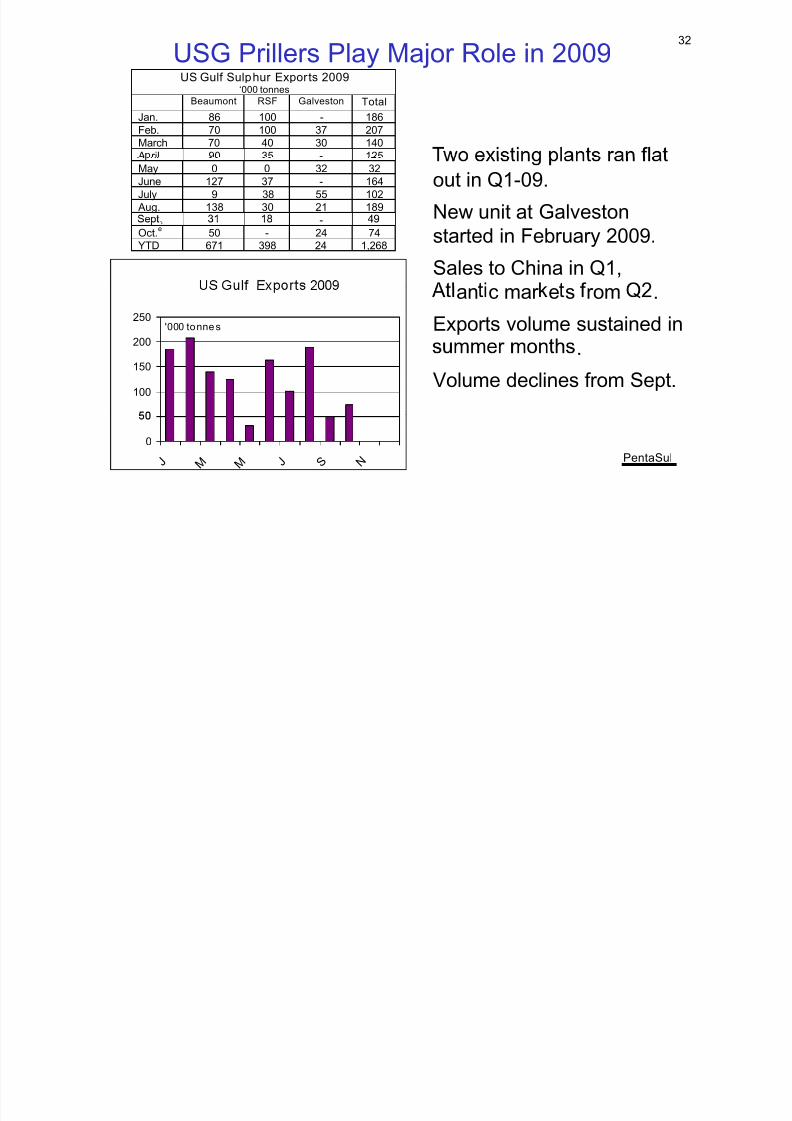
USG Prillers Play Major Role in 2009US Gulf Sulphur Exports 2009
‘000 tonnes
Beaumont RSF Galveston Total
Jan. 86 100 - 186
Feb. 70 100 37 207
March 70 40 30 140
A ril 90 35 - 125
out in Q1-09.New unit at Galveston
May 0 0 32 32
June 127 37 - 164July 9 38 55 102
Aug. 138 30 21 189
-
started in February 2009.
Sales to China in Q1,
.
Oct.e 50 - 24 74
YTD 671 398 24 1,268
an c mar e s rom .
Exports volume sustained in200
250'000 tonnes
.
Volume declines from Sept.100
150
PentaSul
0
J M M J S N
33

8/17/2019 03 - Robert Boyd
http://slidepdf.com/reader/full/03-robert-boyd 33/37
33
US Sulphur Active PrillersWest Coast• Four existing CA plants well-matched to present and
ex ected sur lus of around 0.8-1.0 million tonnes/ ear.• Marsulex CA plant assumed dead.• Small WA plant still has a role.
• Martin Midstream - 4,200 tonnes/day capacity at
Beaumont and 150,000 tonnes prill storage. – , ,
• GSS – 4,000 tonnes/day at RSF New Orleans with90,000 tonnes prill storage; (XOM, Shell, Marathon)
- , ,prill and 650,000 tonne block storage capacity.(Subscribers BP,XOM,Shell, Valero for first two lines.Third line will include other subscribers - L ondell
PentaSul
15,000 tonnes/day total nominal prilling capacity available.
34
8/17/2019 03 - Robert Boyd
http://slidepdf.com/reader/full/03-robert-boyd 34/37
34
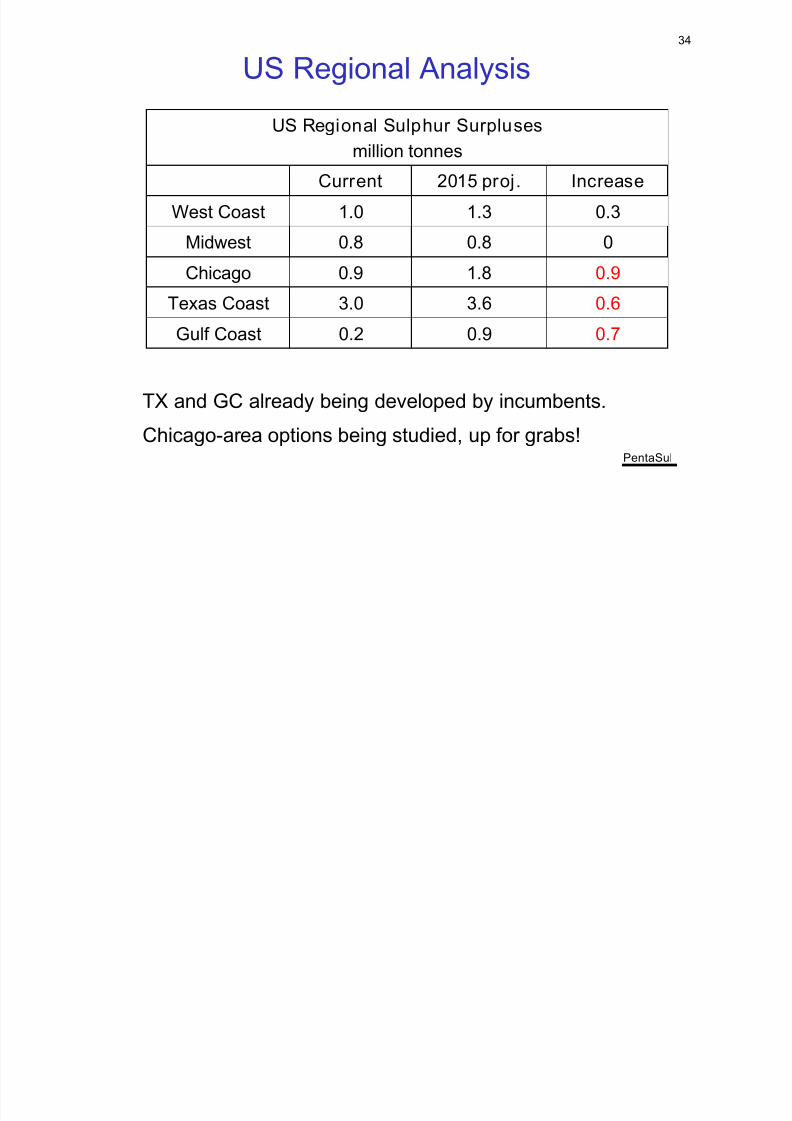
US Regional Analysis
US Regional Sulphur Surpluses
million tonnes
Current 2015 proj. IncreaseWest Coast 1.0 1.3 0.3
Midwest 0.8 0.8 0
Chicago 0.9 1.8 0.9Texas Coast 3.0 3.6 0.6
Gulf Coast 0.2 0.9 0.7
TX and GC already being developed by incumbents.
PentaSul
Chicago-area options being studied, up for grabs!
35
8/17/2019 03 - Robert Boyd
http://slidepdf.com/reader/full/03-robert-boyd 35/37
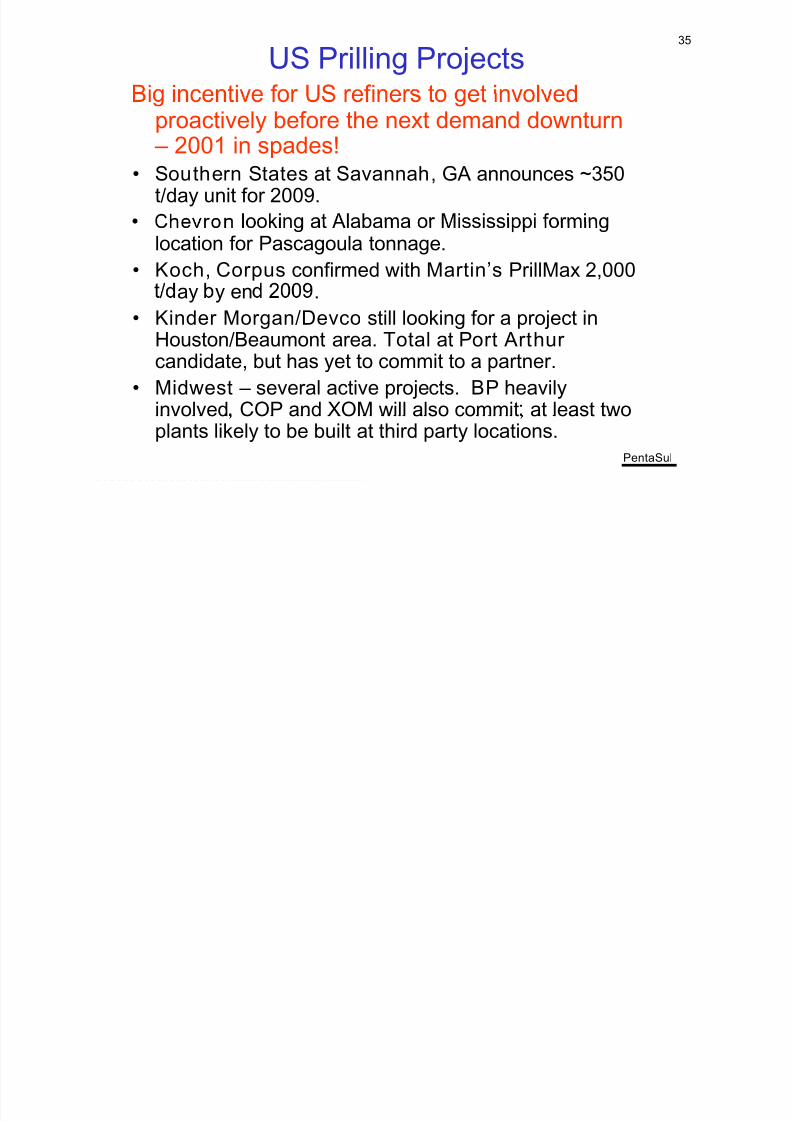
35
US Prilling Projects
proactively before the next demand downturn – 2001 in spades!
• Southern States at Savannah, GA announces ~350t/day unit for 2009.
location for Pascagoula tonnage.
• Koch, Corpus confirmed with Martin’s PrillMax 2,000ay y en .
• Kinder Morgan/Devco still looking for a project inHouston/Beaumont area. Total at Port Arthur
candidate, but has yet to commit to a partner.• Midwest – several active projects. BP heavily
involved COP and XOM will also commit at least two
PentaSul
plants likely to be built at third party locations.
36

8/17/2019 03 - Robert Boyd
http://slidepdf.com/reader/full/03-robert-boyd 36/37
36
US Sulphur Balance
2008 2009 2010 2011 2012 2013 2015
DEMAND 10.02 11.3 11.1 11.4 11.9 12.4 12.6- Cons. 8.75 8.6 9.0 9.2 9.3 9.3 9.0- Exports 1.27 2.7 2.1 1.9 2.6 3.1 3.6
CA+ 0.97 1.1 1.1 1.1 1.1 1.1 1.1US Gulf 0.30 1.6 1.0 0.8 1.5 2.0 2.5
. . . . . . .- Recovered 8.59 8.9 8.9 9.0 9.3 10.0 10.4
Oil Refining 7.43 7.7 7.9 8.0 8.3 9.0 9.4
Gas Processing 1.16 1.2 1.0 1.0 1.0 1.0 1.0- mpor s . . . . . . .
Canada 2.16 1.4 1.5 1.5 1.7 1.4 1.2
Mexico 0.36 0.5 0.4 0.5 0.5 0.5 0.5
Venezuela 0.34 0.3 0.3 0.4 0.4 0.5 0.5
er . - - - - - -
STOCK CHANGE 1.54 (0.2) -0- -0- -0- -0- -0-
PentaSul
million tonnes
37

8/17/2019 03 - Robert Boyd
http://slidepdf.com/reader/full/03-robert-boyd 37/37
Possible Evolution of a 21st Century
u p ur xpor n us ry
Past and Present Future??
• Mining industry exportsvia Webb-Pomerene org.
• Acceptance of non-CA
sulphur exports from USas a ermanent feature.
to accommodate
structural surplus.
• Commitment toestablishing a marketing
• os - u pr ngunits built – not structuralbut standby.
,customers regardless ofdomestic market.
• 2008 market downturnprecipitates more projectsincluding non-US Gulf
to become a benchmark,could possibly replace the
“ ”
PentaSul
locations. .