013 RPS Urban Growth - Expert Conference Outcome Report - Residential Developable Capacity for...
69
Residential Develo pable Capaci t y for Auckland A Rep o r t on t h e 013 Top ic Ur ban Gr ow t h f or t he A UP In d epen d en t Hear i n g Pan el by th e 013 E xp ert Group ____________________________________________ 013EG: Residential Developable Capacity for Auckland 1
Transcript of 013 RPS Urban Growth - Expert Conference Outcome Report - Residential Developable Capacity for...

8/20/2019 013 RPS Urban Growth - Expert Conference Outcome Report - Residential Developable Capacity for Auckland
http://slidepdf.com/reader/full/013-rps-urban-growth-expert-conference-outcome-report-residential-developable 1/69
Residential Developable Capacity
for Auckland
A Report on the 013 Topic Urban Growth for the
AUP Independent Hearing Panel
by the 013 Expert Group
______________________________________________________________________________________
013EG: Residential Developable Capacity for Auckland 1
8/20/2019 013 RPS Urban Growth - Expert Conference Outcome Report - Residential Developable Capacity for Auckland
http://slidepdf.com/reader/full/013-rps-urban-growth-expert-conference-outcome-report-residential-developable 2/69
Table of Contents
Table of Contents............................................................................................................................ 2
Executive Summary ........................................................................................................................ 4
Introduction ..................................................................................................................................... 6
1.1 Objective ............................................................................................................................ 6
1.2 IHP Memo .......................................................................................................................... 6
1.3 Issues ................................................................................................................................. 7
2.0 Forecasts of Demand for Future Auckland Dwellings ........................................................... 14
2.1 Background ...................................................................................................................... 14
Population and Household Projections .................................................................................. 14
2.2 ............................................................................................................................................. 14
2.3 Demand for Dwelling Types ............................................................................................. 15
2.4 Retirement Villages .......................................................................................................... 15
2.5 Social Housing ................................................................................................................. 15
3.0 Forecasts of Supply of Future Auckland Dwellings ............................................................... 17
3.1 Scope ............................................................................................................................... 17
3.2 Data Sources ................................................................................................................... 17
3.3 Developable Capacity ...................................................................................................... 18
3.4 The Formation of the Auckland Council Development Capacity Model ............................. 18
3.5 What the ACDC15 Model is Intended to Provide .............................................................. 19
3.6 How the ACDC15 Model Calculates Development Capacity ............................................ 20
4.0 Output Results of the Development Capacity Modelling ....................................................... 26
4.1 Considering the ouput results of earlier development capacity modelling ......................... 26
4.2 Properties Excluded from the ACDC15 Modelling ............................................................ 26
4.3 The Output Results of the ACDC15 Model. ...................................................................... 26
4.4 The ACDC15 Model Results in Map Form. ....................................................................... 30
4.5 Future Opportunities that the ACDC15 Creates. ............................................................... 30
5.0 Issues that will affect Reality from the ACDC15 Results ....................................................... 31
5.1 Issues that will reduce the achieved reality from the ACDC15 results............................... 31
5.2 Issues that will increase the achieved reality from the ACDC15 results ............................ 33
6.0 Future Work Recommended by the 013EG .......................................................................... 35
______________________________________________________________________________________
013EG: Residential Developable Capacity for Auckland 2

8/20/2019 013 RPS Urban Growth - Expert Conference Outcome Report - Residential Developable Capacity for Auckland
http://slidepdf.com/reader/full/013-rps-urban-growth-expert-conference-outcome-report-residential-developable 3/69
6.1 The increase in household numbers to be used in the Unitary Plan ................................. 35
6.2 The impact of issues that will affect the development feasible numbers ........................... 35
7.0 Conclusions ......................................................................................................................... 36
Appendices ................................................................................................................................... 37
Appendix A: Expert Conferencing Group ...................................................................................... 38
Appendix B: Population and Demographic Analysis ..................................................................... 39
Appendix C: Property Development Expert Group ........................................................................ 40
Appendix D: Extra Comments from 013EG Members ................................................................... 41
Appendix E: The ACDC15 Model Results in Map Form ................................................................ 61
______________________________________________________________________________________
013EG: Residential Developable Capacity for Auckland 3

8/20/2019 013 RPS Urban Growth - Expert Conference Outcome Report - Residential Developable Capacity for Auckland
http://slidepdf.com/reader/full/013-rps-urban-growth-expert-conference-outcome-report-residential-developable 4/69
Executive Summary
Inevitably when a grouping of experts is convened there will be robust debate and disagreement.
This process has not resolved all matters in contention, and not everyone whose name appears in
the appendices necessarily agrees with all matters in this report. However a consensus was
reached on the primary objective of assisting Auckland Council to develop and refine its principal
growth model to better account for the commercial realities of housing supply – what is termed
here “developable capacity”. Through an intense period of work the Group has reached a point
where, despite individual differences, it is satisfied that the model is now producing credible
outcomes – and the further refinement that will continue will only enhance that prospect.
The Auckland Unitary Plan Independent Hearings Panel (IHP), following hearings on Urban
Growth Topic 013, formally requested further expert conferencing on matters of expected urban
land Demand, Supply and Monitoring, seeking to resolve conflicting evidence on these matters
received during the hearings process. This is the Report on that expert conferencing.
The primary matter this 013 Expert Group (013EG) has been focussed on is considering the
Proposed Auckland Unitary Plan (PAUP) Plan Enabled capacity (ie the maximum theoretical
capacity), relative to the developable capacity (ie the plan-enabled capacity that is actually feasible
to be delivered by the property development industry).
A focus of this conferencing has been on whether there is sufficient plan-enabled capacity which is
also commercially viable, to accommodate Auckland’s future housing requirement. Further, a
proportion of the development feasible capacity itself may not be developed because it does not
suit the owners’ objectives within the planning and even if an owner chooses to re-develop, they
may choose to develop less dwellings on a site than the theoretical maximum.
The Auckland Plan is based on trying to accommodate an additional 400,000 households, based
on an additional 1,000,000 persons. Some of the 013EG are of the view that as there is greater
probability that the 700,000 to 800,000 increase in population will arise, the increase in household
numbers allowed for within the Auckland Plan (of 400,000), should also be reduced. Others within
the 013EG are of the view that as the Auckland Plan adopted a standard precautionary approach,
it is safer to over-estimate the outcome than to underestimate it, and the 400,000 extra households
target should not be changed without further robust review.
During the early stages of the 013EG work, it was agreed that three separate approaches toidentifying developable capacity would be defined. The 013EG agreed that Patrick Fontein (PF),
Adam Thompson (AT) and Doug Fairgray (DF) would each create separate developable capacity
Models. The aim of each of the 3 Models, would be to allow AC’s RIMU to subsequently produce a
Computer Model that would take into account the economic aspects of property development and
market assessment.
Once each of the Modellers had completed their work (in April-May 2015), the intention was for the
013EG to review each of the Models, and take out the best parts of each the 3 Models, and have
RIMU incorporate this into an Auckland Council Development Capacity (ACDC15) Model. This
activity was completed in late May – early June, following which RIMU started developing the ACDC15.
______________________________________________________________________________________
013EG: Residential Developable Capacity for Auckland 4

8/20/2019 013 RPS Urban Growth - Expert Conference Outcome Report - Residential Developable Capacity for Auckland
http://slidepdf.com/reader/full/013-rps-urban-growth-expert-conference-outcome-report-residential-developable 5/69
At the end of June – early July, RIMU had the ACDC15 Model “up and running” and the model has
been iteratively improved and refined since then. Results and data presented are outputs of the
model as at 20 July 2015. Broadly, the ACDC15 Model replicates the feasibility assessment that a
property developer could be expected to apply when considering whether they are willing and able
to develop a residential property on any particular land parcel.
The 013EG sought guidance on the various inputs into the ACDC15 from a separate property
development experts group (PDEG), that were assembled, with the assistance of the Property
Council of NZ, to provide and agree the input data and to peer review the overall ACDC15 Model
inputs.
The ACDC15 assesses the feasibility of the identified development potential of every Residential
and some Business zoned parcels in Auckland, on a parcel-by-parcel fine grained basis.
The initial output of the ACDC15 development feasible dwellings, which total 64,420, or 20% of the
CfGS13 (published) dwellings and 11.4% of the ACDC15 plan-enabled. If we were to add the
19,000 HNZC dwellings (conservative) that the PAUP allows, this would provide a total
developable feasible dwelling number of 83,420 or 26% of the reported CfGS13 plan enabled.
The results have been provided in Tabular and Chart form, broken down by Local Board areas.
Maps have been produced by RIMU that show the results on a parcel-by-parcel fine grained basis.
The ACDC15 Model is a very powerful tool to consider “what if” scenarios in future planning for the
IHP and AC. The ACDC15, in combination with the CfGS model which feeds it the development
opportunities to test, is relatively quickly able to model the impact of potential changes in zoning
rules, overlays, zoning locations etc on not only plan-enabled capacity, but now also development
feasible capacity. This should be very beneficial for the IHP and AC in months and years to come.
While the ACDC15 results provide a much improved assessment of the likely reality of how many
dwellings will be provided within the 2010MUA, there remain a number of issues that will affect
whether the “development attractive” identified parcels within the ACDC15 will be developed, and
then the number of dwellings that are in reality developed, compared to the ACDC15 Model
results.
The 013EG was not able to reach a consensus view on the effects of the above issues, so each of
the 013EG members were provided the opportunity to present their individual thoughts in Appendix
D.
______________________________________________________________________________________
013EG: Residential Developable Capacity for Auckland 5

8/20/2019 013 RPS Urban Growth - Expert Conference Outcome Report - Residential Developable Capacity for Auckland
http://slidepdf.com/reader/full/013-rps-urban-growth-expert-conference-outcome-report-residential-developable 6/69
Introduction
The Auckland Unitary Plan Independent Hearings Panel (IHP), following hearings on Urban
Growth Topic 013, formally requested further expert conferencing on matters of expected urban
land Demand, Supply and Monitoring, seeking to resolve conflicting evidence on these matters
received during the hearings process.
1.1 Objective
This is the Report on that expert conferencing. It considers key matters on demand and supply of
urban land, and draws these together to address the specific requirements of the IHP’s Memo of
25 February 2015.
The primary matter this 013 Expert Group (013EG) has been focussed on is considering the
Proposed Auckland Unitary Plan (PAUP) Plan Enabled capacity (ie the maximum theoretical
capacity available under the notified provisions), relative to the developable capacity (ie the planenabled capacity that is actually feasible to be delivered by the property development industry).
1.2 IHP Memo
Having heard evidence on Topic 013 that showed significant disagreement among experts in their
assessment of Auckland’s capacity for housing, the Independent Hearings Panel (IHP), issued a
Memo seeking that relevant experts work to resolve differences and report back to the IHP by 17
July 2015. To assist the process, the IHP appointed a panel and facilitator (Attachment 1). The key
content of the Memo is as follows:The experts are requested to conference on the following matters.
1. Forecasts of demand for Urban Land
In relation to the forecasts of demand for urban land (residential, commercial and
industrial) in Auckland, conflicting evidence has been presented to the Panel. In
many cases a source of conflict is the lack of a consistent foundation on which
opinions or judgements are based. The Panel asks the experts to identify the
relevant issues and if possible agree on:
i. sources of data for population projections;
ii. rates of population growth and any projected changes in rates over time; and
iii. methods to project demand for residential, commercial and industrial land over
time, inclusive of methods to reflect the likely preferences of demand-side
participants for particular attributes of sites (e.g. location, size, accessibility)
such that these preferences are considered when comparing demand with
supply.
2. Forecasts of supply of Urban Land
In relation to the forecasts of supply of urban land (i.e. land readily able to bedeveloped and used for residential, commercial and industrial uses) conflicting
______________________________________________________________________________________
013EG: Residential Developable Capacity for Auckland 6

8/20/2019 013 RPS Urban Growth - Expert Conference Outcome Report - Residential Developable Capacity for Auckland
http://slidepdf.com/reader/full/013-rps-urban-growth-expert-conference-outcome-report-residential-developable 7/69
evidence has been presented as to how best to estimate “developable supply” from
the theoretical “enabled supply” data, and also the quality and timing of the data
used (e.g. the most up to date aerial photographs and any subsequent changes to
land use). In addition, most forecasts have not included the metric of the number of
years of supply that is expected to be available through time to meet forecast
demand (e.g. the number of years of supply of developable land for various landuses at various locations at 2016, 2017, 2018, and so on).
The Panel asks the experts to identify the relevant issues and if possible agree on:
i. data sources, including their currency, to derive plausible forecasts of
developable supply of urban land;
ii. methods to derive plausible forecasts of developable supply from the data,
inclusive of methods that take into account the practicality and economics of
developing land identified as not occupied by buildings in developed zones (e.g.
the proportion that is developable of industrial sites without buildings, and the
proportion of areas around buildings used for open space and parking);
iii. methods to ground-proof sample data (e.g. the extent of vacant land identified
in the CBD) in order to provide confidence in the resulting forecasts; and
iv. methods to match supply and demand over time in order to derive measures of
the number of years of developable supply available through time (by land use
and location).
3. Regular reporting on the state of the Auckland property markets
The notified PAUP anticipates the Council will report regularly on the state of the
Auckland property markets, with the purpose of improving the functioning of these
markets. Based on the methods and data considered under points (1) and (2)
above and any other relevant matters, the Panel asks the experts to identify what
they consider to be the most important components of such a report on the
Auckland property markets.
These directions guide the structure of this report.
1.3 Issues
A core issue for Auckland is the provision of capacity for additional housing. The Auckland Plan
objective is to accommodate up to 400,000 extra dwellings region-wide in the period out to 2041,
which is based on a high growth projection from 2011. The Auckland Plan also seeks to
accommodate 60 to 70 percent of the projected growth within the Metropolitan Area 2010 (MUA
2010), with 30 to 40 per cent outside it, including in the proposed Future Urban Zones, satellite
towns, and rural and coastal areas, a strategic objective that is replicated within the RPS.
The requirement is for sufficient capacity – through the amount of land area and zoning provisions
– to accommodate these additional dwellings. This is particularly relevant for the 60 to 70 per cent
of growth intended for inside the MUA 2010, where a substantial share of the additional growth is
planned to be from intensification and redevelopment of established residential and other sites.
______________________________________________________________________________________
013EG: Residential Developable Capacity for Auckland 7

8/20/2019 013 RPS Urban Growth - Expert Conference Outcome Report - Residential Developable Capacity for Auckland
http://slidepdf.com/reader/full/013-rps-urban-growth-expert-conference-outcome-report-residential-developable 8/69
While the PAUP is the key planning document that will set Auckland on the path towards achieving
these targets, it will not be the planning document for the whole 30 year planning period.
Accordingly it needs to set a direction that indicates a strong movement towards enabling the
achievement of them.
In relation to this, a number of specific issues have been identified in the expert conferencing.
1.3.1 Developable Capacity vs Plan-enabled capacity
In the Topic 013 hearing in late 2014, a key matter was the divergence of views amongst experts
as to whether the PAUP provides for sufficient capacity for the additional housing needs identified,
and over what time period this should cover. This was because while the plan-enabled capacity
indicated enough to accommodate the projected growth, not all of the additional capacity which is
enabled by the PAUP will necessarily be taken up, as owners may choose not to redevelop what is
plan enabled, and many sites may not be commercially viable.
Consequently, a focus of this conferencing was on whether there is sufficient plan-enabled
capacity, which is also commercially viable, to accommodate Auckland’s future housing
requirement. A closely related matter is the extent to which plan-enabled capacity may become
available if that land, while zoned for development, is currently being used for activities like
schools, churches, and service infrastructure.
The distinction between “plan-enabled capacity”, and “developable capacity” is important. Plan-
enabled capacity is the number of additional dwellings which may be developed according to the
provisions of the PAUP. This capacity was estimated from the Capacity for Growth Study 2013
(CfGS13).
However, since not all of the plan-enabled capacity will be economically viable to develop, it is
important to consider developable capacity, which is the number of additional dwellings which are
both plan-enabled and are commercially viable to develop.
The modelling therefore starts from the premise that while not all plan-enabled development will
necessarily be developed, a strong prerequisite for development to be feasibile is that it must first
be plan-enabled. This also reflects a practical consideration in that there is no information on which
to base a site-scale assessment of non-plan-enabled capacity, other than noting the potential for it
to occur.
These concepts are illustrated in the diagram below:
______________________________________________________________________________________
013EG: Residential Developable Capacity for Auckland 8

8/20/2019 013 RPS Urban Growth - Expert Conference Outcome Report - Residential Developable Capacity for Auckland
http://slidepdf.com/reader/full/013-rps-urban-growth-expert-conference-outcome-report-residential-developable 9/69
Further, a proportion of the development feasible capacity itself may not be developed because it
does not suit the owners’ objectives within the planning horizon (e.g. an owner of a mixed usezoned site with an office-retail building on it, that could be re-developed to residential, chooses not
to redevelop to residential) and even if an owner chooses to re-develop, they may choose to
develop fewer dwellings on a site than the theoretical maximum. This can also be offset by
developments that exceed plan limits (via resource consent), future plan changes, and
amalgamation. The group accepts that these factors exist to a greater or lesser degree, but were
unable to agree in the time available on the amount or degree to which they can reasonably be
forecast to play out over time.
The amount of residential developable capacity within the MUA 2010 is especially important. This
is because much of that capacity will need to come from the redevelopment of areas already used
for housing, and for other urban purposes, and to achieve the Auckland Plan (and PAUP RPS)
70:40 outcome those established areas would need to be re-developed to provide for a substantial
share of the 70% share of total growth sought.
1.3.2 Assessing developable capacity
Most residential development occurs through commercial processes, where decisions to develop
or redevelop are based on the assessed likelihood of achieving a return for the cost, effort and risk
involved. While there is no single method for such assessment, the general approach is consistent
within the property development industry – estimation of the likely return from the sale of a new
dwelling(s); analysis of the likely costs including the land (usually with existing improvements),
______________________________________________________________________________________
013EG: Residential Developable Capacity for Auckland 9

8/20/2019 013 RPS Urban Growth - Expert Conference Outcome Report - Residential Developable Capacity for Auckland
http://slidepdf.com/reader/full/013-rps-urban-growth-expert-conference-outcome-report-residential-developable 10/69
construction and site development, professional fees, development contributions, service
connections, finance, and costs of sale; estimation of the net return (sale price less costs); and
assessment of whether that return will provide sufficient margin for the effort and risk to be
worthwhile, usually from the perspective of both developer, and a bank or other finance source.
This assessment is typically undertaken on a site-by-site basis, for a specific development.
However, it is also possible to apply the method at a wider regional level, in order to assess
developable capacity more widely, as an input to the planning process. The CfGS13 model and
processes already contains or can generate much of the information needed to broadly replicate
this process, on a parcel-by-parcel basis which accords well with the real world process whereby
(re)development occurs from many decisions, at a small scale. Other information, notably on likely
sales values and dwelling development costs, is available at a fine geographic level from sales and
consent statistics, and also from expert input from property developers.
The combined availability of information on plan-enabled capacity and expertise about property
development has made it possible to build on the CfGS13 existing capability to assess plan-
enabled capacity, and to then assess those enabled opportunities for their commercial feasibility.
1.3.3 Redevelopment vs greenfield development
Redevelopment of urban land (commonly termed “brownfield development”) is generally more
difficult and more costly in a commercial sense than the urban development of rural land
(commonly termed “greenfield development”). Key reasons include the value of improvements on
the land – especially existing buildings – which mean the upfront costs can be higher than for the
equivalent area of unimproved rural land, and the fragmented ownership and small parcel sizes of
urban land which means that much of the redevelopment occurs at a small scale and in an ad hoc
way.
The need to purchase already urbanised land means that the (zoned) opportunity for intensification
(relative to the existing improvements) is a core driver of all development. Intensification allows the
cost of purchasing the land and the existing improvements to be spread across a greater number
of new dwellings. The greater the degree of intensification possible (i.e. the greater the extent of
the “up-zoning”), the more likely that redevelopment will be economically viable 1.
The opportunity for intensification is a key consideration in assessing developable capacity.
1.3.4 Economic trends and viable redevelopment
The urban environment is dynamic, and the economics of development and redevelopment change
over time. This is because land values are closely influenced by growth in an urban economy, as
are the economics of intensification, whereas the value of improvements on the land is subject to
ageing and depreciation. This means that for residential properties the common track is for land
value (LV) to account for a gradually increasing share of total property value or capital value (CV).
1
The same concept applies to rural land greenfield development – the opportunity for urban development is a significantintensification opportunity relative to the existing use, and the value of existing improvements is usually minimal.
______________________________________________________________________________________
013EG: Residential Developable Capacity for Auckland 10

8/20/2019 013 RPS Urban Growth - Expert Conference Outcome Report - Residential Developable Capacity for Auckland
http://slidepdf.com/reader/full/013-rps-urban-growth-expert-conference-outcome-report-residential-developable 11/69
The improvement value (IV) typically grows more slowly than the land value, and IV tends to
account for a gradually decreasing share of CV.
As the size of the urban economy grows, land in proximity to amenities of value (the CBD, coast,
transport links etc) increases, and there is economic pressure for intensification of land use, to
utilise the increasingly valuable land resource more efficiently. That pressure is ideally supported
by planning provisions, to enable more intensive use of land by up-zoning. The Auckland Plan has
anticipated that many existing urban areas would be up-zoned substantially to allow for a more
“compact Auckland” than could be achieved without upzoning. The ideal planning outcomes to
realisable outcomes match is to up-zone in areas that are economically viable to re-develop. The
greater the degree of up-zoning vis-a-vis existing improvements, the more likely the re-
development will be economically viable, and thus the enabled outcome will be more likely to
occur, subject of course to demand, identifiable via land value.
1.3.5 Social versus commercial economic drivers
A significant portion (around 6%) of Auckland’s housing stock is ‘social housing’, predominantly
that currently owned by Housing New Zealand Corporation (HNZC). While market viability (for
rental returns) is an important driver of HNZC development decisions, there are other drivers
(including providing adequate capacity for future social housing needs, and better matching
dwelling stock with the demography of social housing demand) and different development
opportunities for HNZC, especially because their substantial land holdings and access to capital
allow considerable scope for site amalgamation and large scale redevelopment. This means that
methods to analyse the commercial viability of redeveloping privately-owned land – while
appropriate for assessing developable capacity of most residential areas – are not likely to
translate accurately to the likely outcomes on HNZC land.
As part of its corporate responsibilities, HNZC has undertaken significant analysis of the
development capacity of its property portfolio, under a range of PAUP outcomes, and the key
outputs from that work have been made available for this study.
The capacity, and feasible capacity analysis of land within the areas supplied by HNZC have
therefore been replaced with the data supplied by HNZC.
1.3.6 Special housing areas (SHAs)
A significant component of housing supply in the short to medium term is expected from theSpecial Housing Areas (SHAs). Once gazetted as SHAs the PAUP zoning provisions are
operative. Nevertheless, housing development in the SHAs is subject to the same economic
viability requirements as other housing development, and the capacity and developable capacity in
the SHAs is as identified through the developable capacity modelling.
The gazetted dwelling outcomes in the SHA areas, when compared against the measured plan-
enabled capacity (when the sites within the SHA are considered individually), also provide an
indication of the degree to which amalgamation, aggregation and master planning could increase
yields. Some owners apply to up-zone based on the PAUP provisions, while others have chosen to
apply for less density than is allowed.
______________________________________________________________________________________
013EG: Residential Developable Capacity for Auckland 11

8/20/2019 013 RPS Urban Growth - Expert Conference Outcome Report - Residential Developable Capacity for Auckland
http://slidepdf.com/reader/full/013-rps-urban-growth-expert-conference-outcome-report-residential-developable 12/69
1.3.7 Demand context
An important part of the assessment of developable capacity is a consideration of housing
demand. Auckland’s demand for housing is not just growing, it is also changing, especially as the
population ages, and changes ethnically, socially and economically. Housing preferences can and
do change, not only as a result of changes in population structure and household types, but also as
the mix of opportunities and affordability varies in response to broader economic factors and theplanning and development system.
Further, the housing market is dynamic, with “churn” through sale and purchase of 6-7% of
dwellings annually, as some households enter the market, some relocate and/or upgrade, and
some depart. This churn means that the additional capacity developed in Auckland will not simply
be for ‘new’ households, but also for existing households moving.
Recent demand-side information relevant to the developable capacity estimates includes the latest
StatisticsNZ population projections for Auckland, and the Housing We’d Choose (HWC) research,
an investigation for Auckland Council (AC) into current housing preferences including dwellingtypes, locations, and value ranges. As the HWC Report was released at the end of the 013EG
work, the 013EG has not had sufficient time to provide a consensus comment on the HWC Report.
Some individual members’ comments relating to the HWC report are presented further in Appendix
D.
In this context, it is also important to recognise that redevelopment of established urban land will
result in a changing mix of dwellings, as a proportion of the existing stock of predominantly
detached dwellings are replaced by new, predominantly attached dwellings, including duplexes,
terrace housing and apartments, as well as a proportion of replacement. In combination with this, a
significant share of plan-enabled capacity is in mixed use and centre zones, where the typology is
expected to be predominantly provided as apartments and terrace houses.
One implication is that the assessment of developable capacity also needs to take into account the
overall marketability of different dwelling types, including apartments and town centre living.
No specific analysis of demand by housing type and price was undertaken by the conference
group. This is however required to fully understand whether the supply that is both enabled and is
commercially feasible under the PAUP, as estimated by the ACDC model, is also able to be taken
up by the market, particularly with consideration as to whether low-middle income households can
afford to purchase these dwellings.
1.3.8 Will housing supply under the PAUP match demand over time?
The IHP requested that the 013EG evaluate:
“ …methods to match supply and demand over time in order to derive measures of
the number of years of developable supply available through time (by land use and
location)”.
This addresses the core question of whether the PAUP will enable sufficient new housing
construction to meet demand, or what economists would define as an ‘efficient housing market’.This is relevant under the RMA because an efficient housing market is required for social and
______________________________________________________________________________________
013EG: Residential Developable Capacity for Auckland 12

8/20/2019 013 RPS Urban Growth - Expert Conference Outcome Report - Residential Developable Capacity for Auckland
http://slidepdf.com/reader/full/013-rps-urban-growth-expert-conference-outcome-report-residential-developable 13/69
economic wellbeing. The expert group considered methods of forecasting new housing
construction using the ACDC model. The input variables in the model are able to be adjusted to
simulate changes that influence the commercial feasibility of development over time. The variables
that were considered included:
• The depreciation of capital improvements, which in most cases occurs over a 50-100 year
period (i.e. at 1-2% per annum)
• The increase in construction costs, which historically have increased over time.
• The increase in land value, which have historically increased over time.
Some analysis, which tested the impact of the above three variables on commercial feasibility of
development over time, was presented to the conference group. This scenario showed significant
increases over time.
However the matter was contentious and no consensus was reached. Some members held the
view that it is crucial to consider whether the housing market will be economically efficient underthe PAUP because they considered this essential for new construction (supply) to be able to match
demand.
Further discussion on this by individual member authors is included in Appendix D
______________________________________________________________________________________
013EG: Residential Developable Capacity for Auckland 13
8/20/2019 013 RPS Urban Growth - Expert Conference Outcome Report - Residential Developable Capacity for Auckland
http://slidepdf.com/reader/full/013-rps-urban-growth-expert-conference-outcome-report-residential-developable 14/69
2.0 Forecasts of Demand for Future Auckland Dwellings
2.1 Background
The Auckland Plan is based on the 2006 Census (2010 rebased) Statistics NZ (SNZ) high growth
projection of an approximate 1,000,000 additional persons, requiring (along with demographic and
household formation rate changes), an additional 400,000 households over the 2011-2041 period.
This was adopted as a standard precautionary approach – on the basis that in planning for growth
over the long term, it is safer to over-estimate the outcome than to underestimate it, particularly
when also seeking to make Auckland ‘the world’s most liveable city’. Planning for a high growth
rate enables the city to be ready to accommodate medium or a low growth outcome if that is what
eventuates, as well as the high. The RPS ‘has regard’ to the Auckland Plan targets and seeks to
accommodate between 60 and 70 percent of growth within the Metropolitan Area 2010 (MUA
2010), which, of the high’s 400,000 requires provision to be made for some 240,000 to 280,000
extra dwellings within the MUA2010 over the next 30 years.
2.2 Population and Household Projections
The difference of opinion between experts on expected growth is largely explainable by the ‘age’ of
the then extant projections, being based off the 2006 Census (rebased and updated several times
since), the 2011 Census having been delayed by the Christchurch Earthquakes. New projections
and population estimates, accounting for 2013 Census data, are starting to be released by
Statistics New Zealand, including the recent release of sub-national population projections. Further
releases including household projections are expected over coming months.
On the 1
st
July, 013EG member Prof Richard Bedford, provided comments in a note to the 013EG(provided in full as Appendix B), as summarised in italics below.
“How likely is it that Auckland will have to house an additional 1 million people by 2043?”
“Barring major disasters, and assuming there is recovery in the Australian economy, my
assessment of the estimates provided by the projections is that Auckland’s population is
likely to grow by somewhere between 700,000 and 800,000 over the next 30 years
However, forecasts of population growth become increasingly unreliable as you get further
from the base population over time”.
The 700,000 to 800,000 medium projection is lower than the 1,000,000 high projection assumedwithin the Auckland Plan. Dr Bedford identified:
“a “high” variant which, at the national level, has a population for 2043 that has a
probability of being achieved of 5%; [and] a “medium” variant which has a
population for 2043 that has a probability of being achieved of 50% achievement
associated with it..”
The Group notes that the developable capacity modelling is independent of the growth projections.
Some of the 013EG are of the view that as there is greater probability that the 700,000 to 800,000
increase in population will arise, the increase in household numbers allowed for within the
Auckland Plan (of 400,000), should also be reduced. Others within the 013EG took the view that as
______________________________________________________________________________________
013EG: Residential Developable Capacity for Auckland 14
8/20/2019 013 RPS Urban Growth - Expert Conference Outcome Report - Residential Developable Capacity for Auckland
http://slidepdf.com/reader/full/013-rps-urban-growth-expert-conference-outcome-report-residential-developable 15/69
the Auckland Plan adopted a standard precautionary approach, it being safer to over-estimate the
outcome than to underestimate it, the 400,000 extra households target should not be changed
without further robust review. Some of the 013EG Members have provided further comment on this
in Appendix D.
2.3 Demand for Dwelling Types
Housing demand, expressed as the dwellings occupied by households (owning or renting),
represents the combination inter alia of people’s dwelling preferences, their ability to pay, and the
available dwelling supply. Preferences for dwelling types and locations, and households’ ability to
pay, all vary over time. This means that the medium and long term demand for dwellings will not be
a simple pro rata increase in current dwelling supply patterns.
This is important because the compact city strategy depends on intensification of residential areas,
and a shift from the current predominance of detached dwellings toward greater shares of the
housing estate being made up of terrace housing and apartments. That change in housing
composition would depend on corresponding shifts in preferences for dwelling types, and locations.
Understanding the potential for such shifts in preferences and demand is an important aid to
understanding the implications of the feasibility modelling analysis, which provides the core of this
research. The HWC research released on the 10th July is an important start, but as indicated
earlier, the 013EG has not had sufficient time to provide expert comment on the HWC Report..
2.4 Retirement Villages
Housing demand is made up predominantly of private households in private dwellings. However, it
also includes households living in group or organised structures, notably retirement villages, and
portfolios of dwellings owned and/or operated by social housing providers such as Housing New
Zealand (HNZC).
It is important to understand the dimensions of retirement village demand. The IHP has already
received evidence on expected growth of retirement villages. For modelling purposes, and this may
need to be complemented by an assessment of the residential dwelling density range of retirement
villages relative to other housing typologies.
2.5 Social Housing
Social housing currently accounts for an estimated 6% of total housing demand in Auckland. This
estimate is based on the HNZC portfolio of 30,800 dwellings (around 5.9% of total dwelling
numbers in Auckland) together with allowance for smaller providers.
The economics of providing social housing differ from those for commercial developers selling to
the private market. HNZC is required to generate a return for its key shareholder (the
Government), which derives predominantly from rental yields on its properties. HNZC seeks
‘market rental’ yields from its properties, and this is a key driver of its development intentions. In
addition, HNZC is seeking to achieve more intensive utilisation of its land holdings, to add
dwellings to meet future demand for social housing, as well as to utilise the value of its land in
order to improve its dwelling portfolio. In some other areas, HNZC is reducing it’s land holdings.
______________________________________________________________________________________
013EG: Residential Developable Capacity for Auckland 15
8/20/2019 013 RPS Urban Growth - Expert Conference Outcome Report - Residential Developable Capacity for Auckland
http://slidepdf.com/reader/full/013-rps-urban-growth-expert-conference-outcome-report-residential-developable 16/69
HNZC has identified a long-term (30-50 year) intention to increase its dwelling numbers by some
39,0002, to a total of nearly 70,000 dwellings. However, it also identifies that this would be closer to
19,000 additional dwellings without changes to some PAUP provisions.
These figures are difficult to translate into a figure directly comparable to the ACDC model outputs
in terms of ‘feasible as at today’, as they cover development that will not occur all at once but over
a long time period. Nevertheless, capacity and feasibility analysis for this land has been replaced
with a total of 19,000 dwellings.
2 Evidence of Mr Sowry for Topic 013 hearing,
______________________________________________________________________________________
013EG: Residential Developable Capacity for Auckland 16
8/20/2019 013 RPS Urban Growth - Expert Conference Outcome Report - Residential Developable Capacity for Auckland
http://slidepdf.com/reader/full/013-rps-urban-growth-expert-conference-outcome-report-residential-developable 17/69
3.0 Forecasts of Supply of Future Auckland Dwellings
3.1 Scope
The major focus of the conferencing effort has been on the commercial feasibility of enabled
capacity for housing. This was a major area of contention in the Topic 013 evidence, particularly
the degree to which plan-enabled capacity would be viable for development (developable
capacity). Other streams of analysis and expert conferencing are considering the supply of land for
business and other urban uses.
The key matters as set out in the IHP Memo are:
i. data sources, including their currency, to derive plausible forecasts of developable
supply of urban land;
ii. methods to derive plausible forecasts of developable supply from the data, inclusive
of methods that take into account the practicality and economics of developing land
identified as not occupied by buildings in developed zones (e.g. the proportion that is
developable of industrial sites without buildings, and the proportion of areas around
buildings used for open space and parking);
iii. methods to ground-proof sample data (e.g. the extent of vacant land identified in the
CBD) in order to provide confidence in the resulting forecasts; and
iv. methods to match supply and demand over time in order to derive measures of the
number of years of developable supply available through time (by land use and
location).
3.2 Data Sources“..data sources, including their currency, to derive plausible forecasts of
developable supply of urban land; (2.i)
The primary data source for the assessment of plan-enabled supply is Auckland Council’s
Research, Investigation and Monitoring Unit (RIMU) Capacity for Growth Study (CfGS) database.
This dataset collated from a large variety of sources covers all land parcels in Auckland, and
includes information on parcel size, dimensions, location, zoning, current land use, improvement
and land values, and so on. This is the basis for the Council’s assessment of plan-enabled dwelling
capacity, including potential for infill and vacant capacity, and plan-enabled potential for
redevelopment of parcels.
Important matters raised in the conferencing (and earlier Topic 013 evidence) include the degree to
which land parcels are zoned as residential and have development capacity, but are currently used
for activities which are seen to have limited likelihood of being converted to residential uses. The
particular current uses include land that is part of school grounds, land used for churches and
religious activity, and land occupied by infrastructure. This information is sourced from Council’s
Rating Database using the Actual Property Use field on a dominant (by sum of rateable area by
parcel) basis.
To examine the implications of this, Council’s modelling has included runs with and withoutproperties identified as currently used for schools, churches and infrastructure. There has also
______________________________________________________________________________________
013EG: Residential Developable Capacity for Auckland 17

8/20/2019 013 RPS Urban Growth - Expert Conference Outcome Report - Residential Developable Capacity for Auckland
http://slidepdf.com/reader/full/013-rps-urban-growth-expert-conference-outcome-report-residential-developable 18/69
been effort to eliminate gaps or accumulation errors in the dataset, including for properties where
the current level of development/improvement was initially understated.
This is important, because if the value of improvements is understated in the model, that will act to
overstate the viability of redevelopment, and potentially identify developable capacity where there
may be none.
3.3 Developable Capacity
“…methods to derive plausible forecasts of developable supply from the
data, inclusive of methods that take into account the practicality and
economics of developing land …” (2.ii)
The core technical aspect of the conferencing / research was analysis of the developable capacity
for dwellings, on all suitably zoned land parcels, that have the potential to be utilised for residential
dwelling purposes.
Evidence to the IHP on Topic 013 highlighted disagreement among experts on the adequacy of theplan-enabled capacity for housing in the PAUP provisions. In particular, the CfGS identified the
plan-enabled capacity for dwellings. This reflects what the PAUP enables, in terms of what is
allowed under the majority of the most relevant zoning provisions, and taking into account the
characteristics of land parcels and existing development.
However, it is recognised that what the Plan enables will not necessarily be developed within the
planning time frame, or at all. That is because development which is enabled may not necessarily
be economically viable. Further, a proportion of the commercially developable capacity itself may
not be developed because it does not suit the owners’ objectives within the planning horizon (e.g.
an owner of a mixed use zoned site with an office-retail building on it, that could be re-developed to
residential, chooses not to redevelop to residential) and even if an owner chooses to re-develop,
they may choose to develop less dwellings on a site than the theoretical maximum.
This makes it important to take into account development viability, as well as Plan enablement, and
to recognise that developable capacity, followed by the actual dwellings provided, will be less than
the plan-enabled capacity.
3.4 The Formation of the Auckland Counci l Development Capacity Model
Since the formation of AC in 2010, RIMU has been developing the CfGS database, which allowsfor the assessment of theoretical plan enabled capacity. From 2011 through to 2014, the CfGS has
only been able to assess theoretical plan-enabled capacity, without consideration of how much of
the plan-enabled capacity is likely to be developed in the 30 year timeframe of the Auckland Plan.
As part of that development work, capacity modelling of development feasibility by Board area,
down to Neighbourhoods, down to Census Area Units (CAU’s), down to Meshblocks (MB’s), and
then down to each individual property parcel has been undertaken..
______________________________________________________________________________________
013EG: Residential Developable Capacity for Auckland 18

8/20/2019 013 RPS Urban Growth - Expert Conference Outcome Report - Residential Developable Capacity for Auckland
http://slidepdf.com/reader/full/013-rps-urban-growth-expert-conference-outcome-report-residential-developable 19/69
The CfGS has always anticipated that a matching of theoretical plan-enabled capacity would be
followed by a matching of realisable development potential and market assessment 3.
The work of this 013EG and the creation of the Auckland Council Development Capacity
(ACDC15) Model is the formation of what the CfGS intended.
During the early stages of the 013EG work, it was agreed that three separate approaches to
identifying developable capacity would be defined. The 013EG agreed that Patrick Fontein (PF),
Adam Thompson (AT) and Doug Fairgray (DF) would each create separate developable capacity
Models.
The aim of each of the 3 Models, was to allow AC’s RIMU to subsequently produce a Computer
Model that would take into account the economic aspects of property development and market
assessment.
Once each of the Modellers had completed their work (in April-May 2015), the intention was for the
013EG to review each of the Models, and take out the best parts of each the 3 Models, and have
RIMU incorporate this into an ACDC15. This activity was completed in late May – early June,
following which RIMU started developing the ACDC15.
At the end of June – early July, RIMU had the ACDC15 Model “up and running” and the model has
been iteratively improved and refined since then. Results and data presented through this report
are outputs of the model as at 20 July 2015. It is expected that the model and assumptions it relies
upon will be continuously improved and updated.
In the sections below we discuss the details of the ACDC15 Model.
3.5 What the ACDC15 Model is Intended to ProvideBroadly, the ACDC15 Model replicates the feasibility assessment that a property developer could
be expected to apply when considering whether they are willing and able to develop a residential
property on any particular land parcel. The overall question is whether the development could be
sold at a price able to generate sufficient return: sales revenue less all costs, in $ and/or
percentage terms, to make the development feasible. If a development provides insufficient
financial return, then in the experience of the PDEG, the NZ property development financing
system will be unable (or not willing) to fund such developments.
This requires assessment of the development which is enabled on a site (from the CfGS output) in
terms of its likely sale price, less the cost of the property (land and improvements), the construction
and site works costs, professional fees, council charges (including development contributions),
additional costs associated with such aspects as heritage overlay and slope, connections to
services, costs of sale and financing.
3 Capacity for Growth Study 2013: Methodology and Assumptions, Section 2.2 page 6.
______________________________________________________________________________________
013EG: Residential Developable Capacity for Auckland 19

8/20/2019 013 RPS Urban Growth - Expert Conference Outcome Report - Residential Developable Capacity for Auckland
http://slidepdf.com/reader/full/013-rps-urban-growth-expert-conference-outcome-report-residential-developable 20/69
Since this estimation is sensitive to the specific characteristics of each parcel, the AC model
operates using a ‘bottom up’ approach by working through all residential and residential friendly
business4 zoned properties in the CfGS dataset 5 (350,000+ parcels).
The ACDC15 model, in addition to plan and existing characteristics data sourced from the CfGS,
requires a range of development costs and price related inputs if it is to provide reliable results.
There has been considerable effort to provide robust information for these inputs. The 013EG
sought guidance on these various inputs into the ACDC15 from a separate property development
experts group (PDEG), who were assembled, with the assistance of the Property Council of NZ, to
provide and agree the relevant input data and to peer review the overall ACDC15 Model inputs.
The members of the PDEG, and the companies they represent, are listed in Appendix C.
The ACDC15 Model evaluates the developable feasible capacity that the PAUP has enabled,
relative to today’s sale prices and development costings. These variables may change over time,
which is discussed in greater detail in section 5. The ACDC can also be used in future to model
other longer term scenarios.
3.6 How the ACDC15 Model Calculates Development Capacity
As discussed in earlier sections, the ACDC15 start with the base CfGS data set managed by
RIMU.
The base data set has a large amount of information on every property parcel in Auckland,
including site size, parcel dimensions, frontages, existing dwelling number(s), existing building size
and areas, existing use, the existing zone, improvement value (IV), land value (LV), capital value
(CV), year built, and more.
The CfGS data also provides the PAUP zone, maximum heights and number of key planning
parameters. For residentially zoned sites calculated dwelling capacity is provided, and for
business-zoned parcels, maximum site permitted floorspace6,
Each parcel is also tagged with various spatial relationships such as meshblock, CAU, a
neighbourhood, a Local Board area, and Precinct (if applicable).
Additional data about a parcel’s relationships with Publically Owned Land, SHAs, existing
Watercare Moratoria Areas, and intersection with a set of pre-collated physical constraints are also
provided.
4 General Business, Business Park, Light and Heavy Industry as well as some of the use specific zones are not included.
5 Assessment of all parcels is potentially possible but rural residential development, and business specific developments
would operate under quite different costs and sales assumptions and has not been covered. There are also a large
number of ‘other’ zones in the PAUP that are not included in this assessment.
6 The reported Residential in Business Areas figures in the CfGS are based on Business Area-wide scale assumptions
regarding likely outcomes (percent build out, residential allocation factor and gross dwelling floor area), rather than site-specific assumptions.
______________________________________________________________________________________
013EG: Residential Developable Capacity for Auckland 20

8/20/2019 013 RPS Urban Growth - Expert Conference Outcome Report - Residential Developable Capacity for Auckland
http://slidepdf.com/reader/full/013-rps-urban-growth-expert-conference-outcome-report-residential-developable 21/69
RIMU developed and ran the ACDC15 using FME software, which is able to calculate a large
amount of data for the assessed parcels, and provides results outputs as both tables and spatial
data to graphically represent the outputs.
3.6.1 Evaluating the sale price for each property typology for each location
The price that a developer is able to sell a given type of property for (on a $/m2
basis), variesdependent on location. A 100m2 apartment in Parnell will be able to be sold at a higher price than
an identically specified apartment in (say) Papakura.
The expected sale price of new dwellings is strongly correlated to the sale price of existing
dwellings in a location – a new dwelling may attract a slight premium over an existing dwelling of
otherwise identical characteristics, but it is not likely be significantly different. In addition, the price
of all dwelling typologies in a location is related to the price of stand-alone dwellings, with attached
dwellings (on a building floor area basis) generally selling at a discount to stand-alone dwellings in
the same location, as the stand-alone has a larger land component included.
RIMU provided detailed actual house sale price data for stand-alone houses throughout Auckland
for each of Auckland’s 409 CAUs, for 2014 and 2015 ytd, to the PDEG, in dataset form and
displayed graphically on an Auckland Map. The PDEG assessed the actual sales data information
and made some small adjustments to take into account the larger section sizes in certain areas (eg
Dairy Flat), some sale anomalies caused by large land parcel transactions, and other
inconsistencies within the dataset. Values for CAUs where low numbers or no detached dwelling
sales had occurred were also created by the PDEG based on their collective experience.
After the small PDEG modifications (in less than 15% of the CAUs), each of the 409 CAUs were
categorised to draw relativity for:
"what would an average quality and average size house sell for on a (say) 600m 2 section in
this CAU sell for?”
Each CAU was thus categorised into 10 distinct sale price bands, with for example Otara and
Clendon in Category 1 and Parnell and Herne Bay in Category 10.
This location categorisation then drives the selection of the floorspace, price and other cost
assumptions from the data supplied by PDEG, such that the enabled capacity for dwellings being
‘costed’ by the model are the most appropriate to the location.
The primary focus for RLB (a member of the PDEG) was to provide the development cost
information that provides a mid-range cost for all of the residential development typologies
considered within the ACDC15, in an Auckland context in 2015. This was provided by RLB to the
PDEG and the 013EG in a detailed cost report.
3.6.2 The land required per dwelling and average dwell ing size
An average house or apartment built in a lower sale price band (eg Clendon) will be smaller than
the average house or apartment size in a higher sale price band (eg Parnell).
The PDEG carefully considered a large base of new residential development projects undertakenduring the last 12-24 months in Auckland, and also during the last 5-15 years, and carefully
______________________________________________________________________________________
013EG: Residential Developable Capacity for Auckland 21
8/20/2019 013 RPS Urban Growth - Expert Conference Outcome Report - Residential Developable Capacity for Auckland
http://slidepdf.com/reader/full/013-rps-urban-growth-expert-conference-outcome-report-residential-developable 22/69
considered the average dwelling size for each building typology, within each sale price band. After
the average dwelling sizes were determined, the average land area per dwelling were considered
for each typology and each dwelling7.
The PDEG also considered the dwelling typology most likely to be financially viable for each CAU
(defined by each sales price band) relative to the PAUP zoning provided., Based on the location
category, zoning and density of development the ACDC is then able to determine from the cost
information provided what dwelling will be developed on each site with identified dwelling capacity -
the maximum capacity being tested.
Further future iterations of the ACDC could run a development feasibility model for all the possible
typologies possible on a parcel, (for example sites where apartments are possible tested for
terraced houses) but this presented some iteration and ‘choosing’ difficulties for RIMU – i.e. to
choose which of the infinite number of alternate development options to run across Auckland’s
450,000+ parcels - and was thus not able to be tested in this present round.
The PDEG met on a number of occasions and refined the earlier numbers iteratively after furtherconsideration and consultation by each of the PDEG Members. The final agreed numbers were
then provided to RIMU for inclusion within the ACDC15.
3.6.3 The likely property development costs for each typology and sales price band
The specification (and thus development cost) that a successful developer will provide a dwelling
for in each sales band, varies. For example, for an economically viable development in Clendon,
the specification and development costs (on a $/m2 basis) will be lower than a similarly sized
dwelling in Parnell.
Rider Levett Bucknall (RLB), a Quantity Surveying practice, was part of the PDEG. RLB was
provided with all of the dwelling typologies, and the sale price categorisation bands, including the
identification of each suburb’s categorisation. RLB used its extensive database of building and
development costs to provide 2015 “mid range” development costs for each dwelling typology, for
each sales category. The RLB focus included all demolition costs, build costs, site / civil /
landscaping costs, design fees, planning, build and resource consent fees, legal and survey,
project management and bank required contingencies.
The PDEG then reviewed and assisted with assessing the finance costs for developments
considering the timeframes to completion, and the sales and marketing costs typical of
developments.
The development profit or risk margin to make a project feasible is determined by the financier.
The financier requires a certain risk margin buffer, without which they will not provide the required
finance. Advice from the PDEG is that a bank will at most lend to 60-65% of a project’s value on
completion, or 80% of cost, whichever is the lesser. The other 20% of cost has to be provided by a
7
This latter information has not been utilised in the modelling as the individual site characteristics and zoning determinethe land area of each dwelling enabled by the plan an each site.
______________________________________________________________________________________
013EG: Residential Developable Capacity for Auckland 22

8/20/2019 013 RPS Urban Growth - Expert Conference Outcome Report - Residential Developable Capacity for Auckland
http://slidepdf.com/reader/full/013-rps-urban-growth-expert-conference-outcome-report-residential-developable 23/69
developer as capital or equity. Not being able to meet the above requirements will prevent a
project’s ability to be funded. In 2015, financiers of larger scale residential development projects in
Auckland target a risk margin of 25%, with some being prepared to accept slightly lower, but
always above 20%. For the ACDC15, the PDEG recommended a benchmark of 20% risk margin
for project viability.
This margin is represented as the difference between total site revenue (from sale of the
development excluding GST) and the total costs incurred to create the development (excluding
GST), as a percentage of those costs. Once GST and Profit taxes are paid the net return to the
developer is less than 20%.
3.6.4 Development levies and utili ty connection charges
Development levies are charged for development projects based on the extra dwellings being
provided on a site. Likewise all of the utility companies also charge developers with connection
fees. For the ACDC15, the development levies and utility connection fees payable have been
applied on a regional basis for the modelled development typology.
Recommended future Improvements include linking to an accurate schedule of what all these fees
are for each property type and for each Auckland property parcel in line with variations to various
policy changes and fees schedules.
3.6.5 Extra factors for which the ACDC15 has made allowance
There are a few further factors that affect the plan-enabled dwelling numbers on a given parcel, as
defined below:
i. Existing Dwellings. The difficulty for a developer to purchase a land parcel from multipleowners increases with every extra dwelling on a site. This translates into a small price
premium to purchase 2 units, to an increased site premium for a developer to deal with 10
owners to buy 10 existing dwellings, etc, as these unit owners are likely to seek a premium
when they are aware a developer is trying to amass multiple properties. A factoring
mathematical formula was agreed between the PDEG and RIMU to allow for this,
essentially increasing the price above CV that a developer would have to pay, relative to
the increasing number of owners that have to be dealt with, on one parcel.
ii. Site frontage. Parcels with relatively larger site frontage are able to accommodate slightly
more dwellings per hectare, than sites with smaller frontages, or rear lot sites as less land
area is set aside for site access and setbacks. Urban design guidelines have a bearing on
this issue also. A factoring mathematical formula was agreed between the PDEG and RIMU
to allow for this.
iii. Site size. Very large sites will require setting aside land for internal roads and internal
landscaping to a greater degree than medium sized sites that achieve the same
streetscape amenity or service provision from the public roading network. A factoring
mathematical formula was agreed between the PDEG and RIMU to allow for this.
iv. Heritage, volcanic viewshafts, floodplain, severely sloping sites, major infrastructureconstraints. The ACDC15 plan enabled capacity has made allowances for the various
______________________________________________________________________________________
013EG: Residential Developable Capacity for Auckland 23

8/20/2019 013 RPS Urban Growth - Expert Conference Outcome Report - Residential Developable Capacity for Auckland
http://slidepdf.com/reader/full/013-rps-urban-growth-expert-conference-outcome-report-residential-developable 24/69
constraints, including overlays suggested by the PAUP or topographical or physical issues
not considered in the capacity modelling. These are incorporated into the feasibility
modelling as relatively arbitrary costs added as a site total cost figure to development sites
affected by the constraint, effectively reflecting the time-cost of obtaining expert reports and
some allowance for the costs of redesign or structural changes. This approach could be
improved with improved information as to how these constraints might affect developmentcosts (or capacity) - but is a large and complex issue in itself.
3.6.6 A descr ipt ion of how the ACDC15 assesses plan enabled capacity
The ACDC15 assesses the feasibility of the identified development potential of every Residential
and some Business zoned parcels in Auckland.
The ACDC15 starts with the given Parcel size and area attributes, and the number of dwellings on
the existing site etc. For residential zones other than THAB, it then assesses how many dwellings
are possible on the parcel using the PAUP zoning parameters, which approximate the adjustment
factors.
For THAB and residential on business land, the PAUP rules control the building floorspace
possible (through height and coverage HIRB and so on) – this is accurately assessed by the CfGS,
but the business area-wide assumptions are replaced with site-specific dwelling floor areas which
are used to derive the maximum number of dwellings possible in the enabled floor area after
setting aside floorspace for circulation and services (and only above ground level in business
areas, all levels in THAB). This dwelling figure is then adjusted with the factors highlighted in
section 3.6.5 above. This is the maximum theoretically possible dwellings for that business parcel.
It then finishes by deducting the existing dwellings from the maximum possible. After the existing
dwelling(s) deduction, we reach the ACDC15 plan-enabled capacity.
It is important to note that the ACDC15 has different assessment criteria on the plan-enabled
criteria, relative to the CfGS, so the ACDC15 plan-enabled numbers vary from the earlier CfGS.
The ACDC15 plan-enabled numbers are very high, as they consider the plan-enabled development
opportunity of every business site, irrespective of the quality or extent of the improvements. E.g.
i. Assume a 10,000m2 site that is now zoned THAB under the PAUP, and has had 50 good
quality terrace homes built in the last 10 years. The ACDC15 assesses plan-enabled
numbers and assumes that a total of 190 apartments could be built on this site (if vacant).
Therefore the ACDC15 will assume a plan-enabled capacity of an extra 140 dwellings.
However, once the ACDC15 considers the financial feasibility of this parcel, with a new
development of 190 apartments, with the developer having to buy the 50 near new terrace
homes before commencing re-development, this particular parcel will likely show up as not
being viable. Similarly, consider a subdivision of houses built within the last 15-30 years,
and that falls under the PAUP zoned mixed housing urban or mixed house suburban zone.
Under the site size parameters the ACDC15 maximises opportunity and many sites will now
show 2 houses can be built on that site, even though the house on that site is reasonably
large, in good condition and in the middle of the site. This is why the ACDC15 will show
many subdivisions created 15-30 years ago as showing 1 potential extra dwelling as
______________________________________________________________________________________
013EG: Residential Developable Capacity for Auckland 24

8/20/2019 013 RPS Urban Growth - Expert Conference Outcome Report - Residential Developable Capacity for Auckland
http://slidepdf.com/reader/full/013-rps-urban-growth-expert-conference-outcome-report-residential-developable 25/69
ACDC15 plan enabled redevelopment, on many sites, although in many instances the re-
development will not be financially feasible.
ii. The model thereby replicates the reasoning and decision making process behind why a
developer will not build the 140 additional dwellings (In the first example) or single
additional dwelling (in the second) that are plan-enabled, but not feasible at this point in
time.
3.6.7 Descr ipt ion of how the ACDC15 assesses development feasible capacity
To start a development project, a developer first has to purchase the site, for which the current CV
of the property was considered as the price required to purchase the site. Future iterations of the
ACDC may allow a factoring, to allow for changes between the CV date and the differences in that
CAU’s average actual sale prices, relative to the time that the CV was issued. The same approach
could also be applied to the components of redevelopment costs, and to the expected sale price of
dwellings.
After the ACDC15 plan-enabled capacity has been calculated for a parcel, the ACDC15 “looks up”
the re-development typology most suitable for that parcel (as defined by the PDEG) relative to the
provided PAUP zoning.
The ACDC15 then calculates the redevelopment costs for that parcel using all of the development
costs for that built form typology on that parcel (as provided by the PDEG). The Council
development levies and utility connection charges are then added, and then the land purchase
costs, providing the total development cost.
Great care must be taken with the application of GST. Residential land is (normally) purchased
inclusive of GST and all development costs within the property development industry are provided
on a GST exclusive basis. Sales prices of completed dwellings include GST. For this ACDC15
Model (and any tax abiding property development), the land price GST component is deducted,
then all of the calculations are carried out on a GST exclusive basis, and when the properties are
sold, the GST component of the sale price is deducted (and provided directly to the IRD) before
reaching the developer.
So the total development sale price (on a GST exclusive basis) able to be achieved on a particular
parcel, within any particular CAU, is then compared to the total development cost required to
complete the development. The sales v costs comparison provides a margin result on a total dollar
and percentage basis. Developments that have a gross positive margin greater than 20% are
considered as economically feasible.
The ACDC15 Model tallies up all of the plan-enabled capacity that is economically feasible. The
results are then able to be provided in tabular and graphical format.
______________________________________________________________________________________
013EG: Residential Developable Capacity for Auckland 25

8/20/2019 013 RPS Urban Growth - Expert Conference Outcome Report - Residential Developable Capacity for Auckland
http://slidepdf.com/reader/full/013-rps-urban-growth-expert-conference-outcome-report-residential-developable 26/69
4.0 Output Results of the Development Capacity Modelling
4.1 Considering the ouput results of earlier development capacity modelling
As discussed in section 3.4 above, PF, AT and DF have all completed separate development
capacity Models in April-May 2015. Whilst all of these development capacity Models were created
with different methodologies, all produced results within a range of 20-40%.
The CfGS13 produced two sets of plan-enabled results. The CfGS13 produced a “maximum” plan-
enabled capacity number of 681,542 dwellings, on sites assessed in the ACDC, which considered
maximising every site within all town centres and an assumed proportion of the floorspace on
these properties converted to residential. The CfGS13 also produced the lower “published” figure
of 321,622 dwellings, which applied a reduction factor within the town centre areas, to arrive at the
321,622 dwellings.
For clarity and consistency, SD4/PF, AT and DF have compared the development capacity outputs
of their models to the lower CfGS13 “published” plan-enabled dwelling numbers.
4.2 Properties Excluded from the ACDC15 Modelling
The ACDC15 Model has excluded HNZC owned properties, as these are subject to a master-
planning approach to substantially increase their dwelling numbers, and thereby densities. HNZC
has an ability to substantially benefit from amalgamation of its owned sites. HNZC has intimated
that it would target an extra 19,000 dwellings on its land holdings, under the current PAUP
planning framework. With a substantial relaxation of the PAUP planning restrictions, HNZC say it
could target a number twice this, circa 38,000 extra dwellings. For this initial ACDC15
development capacity analysis, considered under the PAUP, the conservative base 19,000dwellings should be added to the ACDC15 results.
The ACDC15 Model excludes sites that are subject to designations. The Model also excludes
residentially zoned sites that are used as schools, reserves or churches as identified by the
existing use in the Rating database. There are still some schools and churches shown, but now
very few. These will likely balance out the few bits of land that some schools and churches and
reserves across Auckland may sell off for residential development in the 30 year timeframe.
4.3 The Output Results of the ACDC15 Model.
Table 1 on the following page shows the output results of the ACDC15 Model, broken down into
the Local Board areas.
The first column shows the CfGS13 “published” plan-enabled number of 321,622 dwellings. This
can be compared to the much higher CfGS13 “maximum” plan enabled number of 681,542 which
is closer to the starting point of the ACDC methodology (accounting for adjustment factors). The
following column has the ACDC15 plan-enabled number, totalling 565,408 dwellings, which bears
similarity to the CfGS maximum, and is much higher than the CfGS13 “published” plan-enabled
number, for the reasons outlined in Section 3.6.6 above.
______________________________________________________________________________________
013EG: Residential Developable Capacity for Auckland 26

8/20/2019 013 RPS Urban Growth - Expert Conference Outcome Report - Residential Developable Capacity for Auckland
http://slidepdf.com/reader/full/013-rps-urban-growth-expert-conference-outcome-report-residential-developable 27/69
______________________________________________________________________________________
013EG: Residential Developable Capacity for Auckland 27

8/20/2019 013 RPS Urban Growth - Expert Conference Outcome Report - Residential Developable Capacity for Auckland
http://slidepdf.com/reader/full/013-rps-urban-growth-expert-conference-outcome-report-residential-developable 28/69

8/20/2019 013 RPS Urban Growth - Expert Conference Outcome Report - Residential Developable Capacity for Auckland
http://slidepdf.com/reader/full/013-rps-urban-growth-expert-conference-outcome-report-residential-developable 29/69

8/20/2019 013 RPS Urban Growth - Expert Conference Outcome Report - Residential Developable Capacity for Auckland
http://slidepdf.com/reader/full/013-rps-urban-growth-expert-conference-outcome-report-residential-developable 30/69
4.4 The ACDC15 Model Results in Map Form.
Now that the ACDC15 Model is “up and running”, the powerful RIMU computing system and FME
software provides a wide array of mapping opportunities.
Appendix E shows a Map of Auckland of the dwelling typologies that are either ACDC15 plan-
enabled (in the lighter colours) and with the development feasible in the darker colours.
The following page in Appendix E shows a Map of Auckland with calculated site gross profits from
undertaking the plan-enabled development, in various profit bands, indicated by different colours.
This Map has been provided on a parcel-by-parcel basis, i.e. considering the development capacity
using a fine grained analysis, that the CfGS13 had envisaged would take place sometime into the
future. All of the bright red coloured parcels are “residential development feasible”. All of the
orange coloured parcels make a small margin, but insufficient for the development to be able to
attract development financing.
The final page of Appendix E shows a Map of Auckland with proportional symbols highlighting the
scale of the developments the ACDC15 determines as feasible, i.e where the large projects are
and where the smaller projects are.
4.5 Future Opportunit ies that the ACDC15 Creates.
The ACDC15 Model is a very powerful tool to consider “what if” scenarios in future planning for the
IHP and AC. The ACDC15, in combination with the CfGS model which feeds it the development
opportunities to test, is relatively quickly able to model the impact of potential changes in zoning
rules, overlays, zoning locations etc on not only plan-enabled capacity, but now also development
feasible capacity. This should be very beneficial for the IHP and AC in months and years to come.
______________________________________________________________________________________
013EG: Residential Developable Capacity for Auckland 30

8/20/2019 013 RPS Urban Growth - Expert Conference Outcome Report - Residential Developable Capacity for Auckland
http://slidepdf.com/reader/full/013-rps-urban-growth-expert-conference-outcome-report-residential-developable 31/69
5.0 Issues that will affect Reality from the ACDC15 Resul ts
While the ACDC15 results provide a much improved assessment of the likely reality of how many
dwellings will be provided within the 2010MUA, there remain a number of issues that will affect
whether the “development attractive” identified parcels within the ACDC15 will be developed, and
then the number of dwellings that are in reality developed, compared to the ACDC15 Modelresults.
All of these issues are outlined below. The 013EG agree that all of these issues will impact the
results that can be achieved in reality, in the directions mentioned below, however in the time
available the 013EG has not been able to agree the extent to which each factor will influence the
30 year developed reality. Each issue and variance is discussed in outline below.
5.1 Issues that wil l reduce the achieved reality from the ACDC15 results
5.1.1 Development Chance
There are a large number of sites that are plan-enabled and development feasible, however the
owner may be very content to not re-develop this site to intensified residential, as the ACDC15
development feasible numbers indicate. Eg.
i. A warehouse in a Mixed Use Zone that the occupier and owner is perfectly happy to
continue utilising as a warehouse, yet the Model has assumed a feasible development
capacity of an extra 150 dwellings, which show a development margin in excess of 20%.
The occupier could well draw strategic advantage from the central location, and continue
operating the warehouse from the site.
ii. Many of the recently developed bulk retail areas are on what were Business 4 sites and are
now often zoned mixed use sites. These sites have a relatively low level of improvements
(meaning their development potential will often show up as “residential development
feasible”), however many of the owners of these relatively new retail stores, will not want to
change their use to residential. Many of these sites have also been subdivided into strata
titles, with many owners in a body corporate system (i.e. not easy for a developer to buy).
iii. An old villa sits on a large 1,479m2 site, zoned mixed house suburban. There are no
heritage restrictions and the site has a good frontage and can be re-developed into 7
dwellings under the PAUP. The site is sold and the new purchaser decides to fully renovatethe villa, extend the house substantially and landscape the grounds. What was once
considered a development site, now has lost it’s immediate re-development potential.
5.1.2 Capacity Util isation
The ACDC15 plan-enabled numbers will always identify the maximum plan-enabled possible
dwelling numbers for that site.
However, often developers will choose to develop a site to less than its full potential, as this may
result in dwellings that better suit the buyer market in the locality, or reflect their particular area of
______________________________________________________________________________________
013EG: Residential Developable Capacity for Auckland 31

8/20/2019 013 RPS Urban Growth - Expert Conference Outcome Report - Residential Developable Capacity for Auckland
http://slidepdf.com/reader/full/013-rps-urban-growth-expert-conference-outcome-report-residential-developable 32/69
speciality (e.g. terrace houses), or may be due to their limited ability to raise funding for a very
large development.
If a site is shown as development feasible, the ACDC Model allows for the full plan enabled
numbers to be carried forward into the total dwellings feasible output numbers.
What if the site that was shown as development feasible, was then re-developed at a much lower
density than the PAUP allowed? Eg.
i. Assume a large 10,000m2 site zoned THAB, allowing 4 storeys which provides a maximum
200 apartments. This development may be a very large $120-150m development, that due
to the scale and complexity cannot be staged and has to thus be completed in one large
project. The developer may not be willing (or may be financially unable, due to insufficient
equity) to undertake the grand $120-150m development, and instead chooses to undertake
a smaller 60 terrace house scheme, which can be completed in 3 lower risk stages of 20
terrace homes in each stage. The overall profit for the developer may be lower, but the
development can be carried out with a much lower risk profile. If the 60 terrace homedevelopment was to be completed, the ACDC15 allowance of 200 units would have lost
140 of these. Builders, who also partake in development work, often fall into this “under-
utilisation” category. The builder may be happy to build 20 terrace homes every year, for a
3 year period. The builder may have a competitive advantage on his build costs, which
means he can afford a slightly higher land price per dwelling, for a lower risk development.
ii. The owner of a THAB zoned site, very close to one of the rail stations, decides to build their
dream home, single level, oblivious to the development potential that this site may have
had. The 8 units possible for this THAB zoned site have been reduced to 1 developed.
5.1.3 Infrastructure Constraints:
There are many anecdotes about situations where a site is zoned and plan-enabled for
intensification, and the owner of the site has been able to create a feasible development for the
site, but there is insufficient infrastructure presently available to cope with the increased dwellings
proposed on the property, and no obvious or immediate solution to that issue. The Group noted
that timely infrastructure provision is a significant factor.
5.1.4 Development Sites costing more than the CV
When there is a shortage of available development sites, the few that are available often become
more difficult to purchase. The CV of a particular site is often related to the historic use of that site.
When a site gets “up-zoned”, the owner of a site often then seeks a “premium” for his site. Assume
a site that has a 2014CV of $1m has been upzoned to THAB in the PAUP. The owner gets some
property advice, which is that the upzoning to THAB should make his site more valuable. Over a 6
month period the owner gets on average a real estate agent or developer knocking on his door
once a month wanting to buy his site. The owner thinks this extra demand for his site is great, and
he ups his asking price for his site to $2m. A site that would have been development feasible at
______________________________________________________________________________________
013EG: Residential Developable Capacity for Auckland 32

8/20/2019 013 RPS Urban Growth - Expert Conference Outcome Report - Residential Developable Capacity for Auckland
http://slidepdf.com/reader/full/013-rps-urban-growth-expert-conference-outcome-report-residential-developable 33/69
$1m is now no longer feasible at a $2m asking price. The site doesn’t get sold or re-developed,
unless the owner is willing to drop his asking price.
5.2 Issues that wil l increase the achieved reality from the ACDC15 results
5.2.1 Site Amalgamation
The ACDC15 does not (as yet) make any allowance for the benefit of amalgamations and
aggregation.
Many of the sites near or in town centres are small sites with fragmented ownership. Many of these
types of sites are zoned to take reasonably substantial intensification (ie THAB or Town Centre).
The smaller sites are often difficult to re-develop. If an owner is able to purchase 2-4 adjacent
sites, then the larger site will likely provide a better chance of carrying out a reasonable scale
development.
The mixed house zoned sites also have density restrictions, which are reduced or eliminated for
sites greater than 1,200m2. This makes amalgamating sites in the mixed house zone a very
beneficial activity to achieve this bonus.
Whilst there are good amalgamation benefits, the site amalgamation process does require
substantial effort, and often results in the purchasing entity having to pay a premium to the
adjoining owner (see also 5.1.4 above)
Auckland Council data shows that an average of 100 residential sites / projects across Auckland
have been amalgamated per year in recent years, so this has not been a widespread process,
despite several legacy plans having similar ‘large site density bonus’ available.
While the Group agreed that removing density controls, particularly in the mixed housing zones,
would be beneficial to the prospect of amalgamation it took this matter no further..
5.2.2 The effects of time improving viability on any chosen site
All of the 013EG members agree that in a normal housing market, land values appreciate faster
than improvement values - i.e. a property that is not subject to refurbishment or re-development
works, when the CV increases, the proportion of the LV increases over time, as a percentage.
This gradual increase of the land component of an ageing property will mean that gradually the
ageing properties will become more re-development attractive over time. This means that some ofthe land parcels that are not development feasible now or in the near future, may in time improve
their development viability.
Not all members were persuaded about the extent of this and cautioned against the assumption
that on-going increases in property prices would occur indefinitely, citing examples of some cities
overseas where there has been dramatic long term reductions in house prices, largely attributed to
the land component decreasing in value, so in these instances the LV decreases as a proportion of
the CV.
Appendix D contains some members’ individual thoughts on this matter. .
______________________________________________________________________________________
013EG: Residential Developable Capacity for Auckland 33

8/20/2019 013 RPS Urban Growth - Expert Conference Outcome Report - Residential Developable Capacity for Auckland
http://slidepdf.com/reader/full/013-rps-urban-growth-expert-conference-outcome-report-residential-developable 34/69
5.2.3 Very effective developers being able to perform better than the “ mid range” .
The development cost and sales data has purposely been provided as a “mid range” number.
The development costs are what an average developer is likely to incur. There will be some
developers who with experience have been able to create a competitive advantage and provide a
slightly lower cost base than their competitors. There will be some site owners who have owned
the site for many years, and may well have purchased the land parcel for a price substantially
below it’s current CV. For their development feasibility, they may choose to place the site in at its
historic purchase price.
The sale prices are the average attainable for that entire CAU. There will be some sites that have a
slightly better outlook, or a park view, that is able to command a slight premium in new build sale
price (on a $/m2) than the average CAU sale price, for that area. There are also some developers
who have a very good market reputation, and through positive promotion from the local real estate
network, have an excess demand of buyers for his product. The developer may be able to slightly
increase his prices from the average, and excess demand means he is still able to sell his product.
Very effective developers are often good at considering a concept design, and then maximising the
bulk and location design onto a given site. They are able to get a better utilisation of building area
onto a site, than the average developer.
Very effective developers are likely to be able to pick up very good sites, and turn a site with a
marginal development feasibility (ie in the 10-20% margin range), and prior to the project starting,
turn this development opportunity into a 20%+ risk margin project. This will increase the number of
development feasible dwellings, from that shown as feasible at 20%+ currently.
______________________________________________________________________________________
013EG: Residential Developable Capacity for Auckland 34

8/20/2019 013 RPS Urban Growth - Expert Conference Outcome Report - Residential Developable Capacity for Auckland
http://slidepdf.com/reader/full/013-rps-urban-growth-expert-conference-outcome-report-residential-developable 35/69
6.0 Future Work Recommended by the 013EG
The 013EG members have been meeting regularly for 5 months, however there are a number of
items that have not able to be covered fully. These are areas that the 013EG recommend need
further future review by experts in these areas.
6.1 The increase in household numbers to be used in the Unitary Plan
The 013EG has not been able to reach a consensus view on what household numbers should be
used in the Unitary Plan. Some of the Members in the 013EG consider that it could prove fruitful to
form a separate expert group to consider the following:
i. Whether using a medium population growth projection, which is shown to have greater
probability, is prudent.
ii. Whether the conclusions from the above warrant changing the 400,000 extra households
target set within the Auckland Plan.
iii. The impact that future dwelling typologies likely to be created in Auckland during the next
30 years, will have on household formation numbers (as outlined in Section 2.3).
iv. Consider the impact of retirement villages and social housing providers (e.g. HNZC) will
have on the future household formation numbers (as outlined in Section 2.4 and 2.5).
6.2 The impact of issues that wi ll affect the development feasible numbers
Section 5 of this report highlighted a series of issues that the 013EG could not reach consensus on
their likely impact on the feasible residential developable capacity. Appendix D includes a number of the 013EG members’ further individual thoughts on these and
other issues.
The following issues are identified as matters that require further attention:
6.2.1 Issues that wil l reduce the achieved reality from the ACDC15 resul ts
i. Development chance
ii. Capacity utilisation
iii. Infrastructure constraints:iv. Development sites costing more than the CV
6.2.2 Issues that wil l increase the achieved reality from the ACDC15 resul ts
v. Site amalgamation
vi. The effects of time improving viability on any chosen site
vii. Very effective developers being able to perform better than the “mid range”
______________________________________________________________________________________
013EG: Residential Developable Capacity for Auckland 35

8/20/2019 013 RPS Urban Growth - Expert Conference Outcome Report - Residential Developable Capacity for Auckland
http://slidepdf.com/reader/full/013-rps-urban-growth-expert-conference-outcome-report-residential-developable 36/69
7.0 Conclusions
A property development experts group provided robust development costs and sales price data
which have enabled AC’s RIMU team to set up the Auckland Council Development Capacity
(ACDC) Model, that is able to import CfGS calculated plan enabled capacity, make some
adjustments to dwelling capacity in more intensive developments reflecting zoning and typology,followed by more importantly development feasible capacity.
The ACDC15 Model has estimated that the currently enabled development feasible capacity
enabled by the PAUP on the sites modelled is 64,420 dwellings.
The results of the ACDC15 development feasible dwellings are generally consistent with the
results of earlier pilot development capacity modelling undertaken by SD4/PF, AT and DF, which
identified that developable capacity is less than plan-enabled capacity.
As well as the currently feasible capacity, there is the HNZC potential of 19,000 dwellings (lower
scenario only) to be developed over the period to 2041.
Moreover, there are a number of issues that will affect the actual dwellings that could be developed
within the 30 year timeframe, and the 013EG have divergent views on the impact of the following
issues:
Issues that wi ll reduce the achieved reality f rom the ACDC15 results
i. Development chance
ii. Capacity utilisation
iii. Infrastructure constraintsiv. Development sites costing more than the CV
Issues that wi ll increase the achieved reality from the ACDC15 results
i. Site amalgamation
ii. The effects of time improving viability on any chosen site
iii. Very effective developers being able to perform better than the “mid range”
The Group accepts that the anticipated effect of all of the above issues is dependent on a range ofassumptions that are made. Confidence in those assumptions may requires further expert group
assessment.
The ACDC15 Model is a very powerful tool to test “what if” scenarios in future planning for the IHP
and AC. The ACDC15 is quickly able to model the impact of potential changes in zoning rules,
overlays, zoning locations etc on plan enabled capacity and also development feasible capacity.
This should be very beneficial for the IHP and AC in months and years to come.
______________________________________________________________________________________
013EG: Residential Developable Capacity for Auckland 36

8/20/2019 013 RPS Urban Growth - Expert Conference Outcome Report - Residential Developable Capacity for Auckland
http://slidepdf.com/reader/full/013-rps-urban-growth-expert-conference-outcome-report-residential-developable 37/69
APPENDICES
______________________________________________________________________________________
013EG: Residential Developable Capacity for Auckland 37

8/20/2019 013 RPS Urban Growth - Expert Conference Outcome Report - Residential Developable Capacity for Auckland
http://slidepdf.com/reader/full/013-rps-urban-growth-expert-conference-outcome-report-residential-developable 38/69

8/20/2019 013 RPS Urban Growth - Expert Conference Outcome Report - Residential Developable Capacity for Auckland
http://slidepdf.com/reader/full/013-rps-urban-growth-expert-conference-outcome-report-residential-developable 39/69
Appendix B: Population and Demographic Analysis
______________________________________________________________________________________
013EG: Residential Developable Capacity for Auckland 39

8/20/2019 013 RPS Urban Growth - Expert Conference Outcome Report - Residential Developable Capacity for Auckland
http://slidepdf.com/reader/full/013-rps-urban-growth-expert-conference-outcome-report-residential-developable 40/69
"
!"#$%! '() *)+$% ,$%! $%! -(*./%0 /% $*12,$%!3 .(#"
(+.")4$5/(%. (% 5-" !"#(0)$6-/1 !/#"%./(%
#$%&'() *+),-()" ./01 23"4
)7879: 8;987<9=3
5+6 7$8('6$-9 8'$9: 6- 5+; <+'0'9)=: >->/0'6$-9 &'?+ @++9 '6 (+%-() 0+?+0: ,-(:-7+ 7-96&: 9-; '6 -?+( 43A333 ,-( 6&+ 1+'( +9)$98 +'%& 7-96& $9 23"4B C: 6&$:
0$D+01 6- @+%-7+ 6&+ E9+; 9-(7'0FG H( '(+ ;+ 7-(+ 0$D+01 6- (+?+(6 6- '?+('8+9+6 8'$9: -, '(-/9) "3A333I"2A333 ;&$%& >(+?'$0+) 6&(-/8& 6&+ "JJ3: '9) 7-:6
-, 6&+ 2333:G
K-; 7/%& $7>'%6 $: (+:$)+96$'0 7$8('6$-9A ': )$:6$9%6 ,(-7 7-?+7+96 -, >+->0+-9 6+7>-('(1 ?$:': ,-( :6/)1 -( ;-(DA &'?$98 -9 L/%D0'9)=: &-/:$98 7'(D+6G
M&-/0) 6&+ 0'(8+ 9+6 7$8('6$-9 8'$9: ,(-7 ;&'6 $: %'00+) E>+(7'9+96 '9) 0-98I6+(7 7$8('6$-9F NOPQ I >+->0+ +96+($98 '9) 0+'?$98 6&+ %-/96(1 ,-( "2 7-96&: -(
7-(+R :$7>01 @+ '))+) 6- 6&+ >->/0'6$-9 +'%& 1+'(A -( :&-/0) ;+ '%D9-;0+)8+7-(+ %0+'(01 6&'6 6&+:+ 8'$9: '(+ ' %-7>0+S 7$S -, >+->0+ ;&- %'9 0$?+ $9 6&+
%-/96(1 @1 ($8&6 N+B8B 5<+(: '9) L/:6('0$'9:R '9) >+->0+ ;&- (+T/$(+ ?$:': -,
)$,,+(+96 61>+: 6- :6'1 $9 6&+ %-/96(1A '9) 6&'6 %/((+9601 6&+ 7'U-($61 -, 6&+ 0'66+(NV3WR '(+ :6/)+96: '9) 6+7>-('(1 ;-(D+(:G
K': 7$8('6$-9 @+%-7+ 6&+ D+1 )($?+( -, >->/0'6$-9 8(-;6& $9 L/%D0'9) -( $:
9'6/('0 $9%(+':+ :6$00 6&+ 7'U-( %-96($@/6-( 6- 8(-;6&G
K-; 0$D+01 $: $6 6&'6 L/%D0'9) ;$00 &'?+ 6- &-/:+ '9 '))$6$-9'0 " 7$00$-9 >+->0+
@1 23XYG
.;>7 <7=?;9=7=3
Q&+ 0'6+:6 OPQ 7$8('6$-9 )'6' ;+(+ (+0+':+) -9 22 ./9+ N,-( 6&+ 1+'( +9)+) Z'1
Y3 23"4RB Q&+ OPQ 9+6 7$8('6$-9 8'$9 ;': 4[AV33 ': ' (+:/06 -, ' (+%-() 9/7@+(
-, '(($?'0: N""4A"33R '9) :7'00+( 9/7@+(: -, )+>'(6/(+: N4[AY33RB "
C9 '))$6$-9 6- '(-/9) V3A333 >+->0+ ,(-7 -6&+( %-/96($+:A 6&+(+ ;+(+ Y4A3335+; <+'0'9) '9) L/:6('0$'9 %$6$\+9: $9 6&+ OPQ '(($?'0:B H, 6&+ V3A333 %$6$\+9: -,
-6&+( %-/96($+: -901 "YA333 &') (+:$)+9%+ ?$:':B Q&+ (+:6 &') 6+7>-('(1 ;-(D
'9) :6/)1 ?$:':B L(-/9) XVA333 -, 6&+ OPQ '(($?'0: 8'?+ '))(+::+: $9 L/%D0'9)': 6&+ >0'%+: ;&+(+ 6&+1 ;-/0) @+ (+:$)$98B L6 0+':6 &'0, -, 6&+:+ ;-/0) &'?+
@++9 :6/)+96:B Q&+ 9+6 8'$9 6- L/%D0'9)=: >->/0'6$-9 N',6+( 22A333 OPQ
)+>'(6/(+: '(+ 6'D+9 $96- '%%-/96R $9 6&+ 1+'( +9)+) Z'1 23"4 ;': 2]A333B
" M6'6$:6$%: 5+; <+'0'9) N23"4R C96+(9'6$-9'0 Q('?+0 '9) Z$8('6$-9^ Z'1 23"4B
22 ./9+ 23"4A M6'6$:6$%: 5+; <+'0'9)A _+00$986-9B
8/20/2019 013 RPS Urban Growth - Expert Conference Outcome Report - Residential Developable Capacity for Auckland
http://slidepdf.com/reader/full/013-rps-urban-growth-expert-conference-outcome-report-residential-developable 41/69
2
5+6 8'$9: -, 4[A333 6- 5+; <+'0'9)=: >->/0'6$-9 '(+ 9-6 0$D+01 6- @+%-7+ 6&+
E9+; 9-(7'0FB L: +%-9-7$% %-9)$6$-9: $9 L/:6('0$' $7>(-?+A '9) 6&+ 5< )-00'(:6'1: '6 6&+ 0-;+( 0+?+0: $6 $: &+')$98 ,-( 6&$: ;++DA 6&+(+ ;$00 @+ %&'98+: $9 6&+
>'66+(9: -, 7$8('6$-9 -, 5+; <+'0'9)+(: '8'$9B 5/7@+(: (+6/(9$98 ;$00 :0'%D+9-,, '9) 9/7@+(: 0+'?$98 ;$00 ($:+B
#+:$)+9%+ ?$:' '>>(-?'0: &'?+ ,0/%6/'6+) '(-/9) X3IX4A333 >+( '99/7 ,-( 7-:6 -, 6&+ >':6 )+%')+B Q&+ 8(+'6 7'U-($61 -, 6&+:+ '(+ '>>(-?+) -9I:&-(+ ,-( >+->0+
;&- '0(+')1 &'?+ ' U-@ $9 5<B Q&+:+ E$77$8('96F 9/7@+(: '(+ /90$D+01 6-
%&'98+B Q&+1 (+>(+:+96 6&+ +T/$?'0+96 -, '(-/9) 23W -, 6&+ %-7@$9+) 6-6'09/7@+(: -, 6+7>-('(1 ;-(D+(: '9) :6/)+96: ;&- %-7+ $9 +'%& 1+'(B Q&+ 8(+'6
7'U-($61 -, 6&+ 0'66+( )- 0+'?+ 6&+ %-/96(1 ',6+( %-7>0+6$98 6&+$( T/'0$,$%'6$-9: -(%-96('%6:B H901 23I24 >+(%+96 -, 6&-:+ ;&- %-7+ 6- 5+; <+'0'9) -9 :6/)+96 '9)
6+7>-('(1 ;-(D ?$:': +9) /> 6('9:$6$-9$98 6- (+:$)+9%+ ',6+( 4 1+'(:B
`/((+9601 OPQ 9+6 7$8('6$-9 $: %-96($@/6$98 7-(+ 6- '99/'0 >->/0'6$-9 8(-;6& $96&+ L/%D0'9) (+8$-9 6&'9 9'6/('0 $9%(+':+ '%%-()$98 6- M6'6$:6$%: 5+; <+'0'9)=:
:/@9'6$-9'0 >->/0'6$-9 +:6$7'6+:B '9) 6&$: $: 0$D+01 6- %-96$9/+ ': 0-98 ': 9+6 7$8('6$-9 0+?+0: (+7'$9 '6 6&+$( &$8& 0+?+0:B C9 6&+ 1+'( +9)+) Y3 ./9+ 23"XA ,-(
+S'7>0+A 6&+ L/%D0'9) (+8$-9=: >->/0'6$-9 $: +:6$7'6+) 6- &'?+ $9%(+':+) @1YXA333B2 Q&+ +:6$7'6+) 9+6 7$8('6$-9 8'$9 -, "JA]33 '%%-/96+) ,-( 4V >+(%+96 -,
6&+ $9%(+':+a 9'6/('0 $9%(+':+ N"XAY33R '%%-/96+) ,-( X2 >+(%+96B
_&$0+ OPQ 9+6 7$8('6$-9 8'$9: (+7'$9 '6 6&+ %/((+96 (+%-() 0+?+0: 9'6/('0
$9%(+':+ ;$00 %-96$9/+ 6- &'?+ 6&+ :7'00+( :&'(+ -, 8(-;6&B K-;+?+(A $, 9+6 7$8('6$-9 8'$9: ,'00 @'%D 6- "JJ3:b2333: 0+?+0:A 9'6/('0 $9%(+':+ ;$00 '8'$9
@+%-7+ 6&+ 7'U-( )($?+( -, >->/0'6$-9 8(-;6& $9 6&+ (+8$-9B L/%D0'9)=: 0'(8+Z'-($ '9) O'%$,$% >->/0'6$-9:A ;&$%& @-6& &'?+ &$8&+( ,+(6$0$61 6&'9 6&+c/(->+'9 '9) L:$'9 +6&9$% >->/0'6$-9:A ;$00 +9:/(+ 9'6/('0 $9%(+':+ (+7'$9: '
:$89$,$%'96 )($?+( -, 8(-;6& $9 9/7@+(: -, (+:$)+96: ,-( :-7+ 6$7+ 1+6B
6;?@AB:C;9 ?<;D78:C;9=3
M6'6$:6$%: 5+; <+'0'9)=: 0'6+:6 :/@9'6$-9'0 >(-U+%6$-9:A %-?+($98 6&+ >+($-)
23"YI23XYA &'?+ @++9 )+($?+) ,(-7 6&+ 9'6$-9'0 >(-U+%6$-9: >(-)/%+) /:$98
:6-%&':6$% N>(-@'@$0$:6$%R ,-(+%':6$98 7+6&-):BY Q&(++ >(-U+%6$-9 ?'($'96: '(+>(+:+96+) ,-( +'%& (+8$-9 '9) 6+(($6-($'0 '/6&-($61^ ' E&$8&F ?'($'96 ;&$%&A '6 6&+
9'6$-9'0 0+?+0A &': ' >->/0'6$-9 ,-( 23XY 6&'6 &': ' >(-@'@$0$61 -, @+$98 '%&$+?+)-, 4Wa ' E7+)$/7F ?'($'96 ;&$%& &': ' >->/0'6$-9 ,-( 23XY 6&'6 &': ' >(-@'@$0$61
-, @+$98 '%&$+?+) -, 43W '%&$+?+7+96 '::-%$'6+) ;$6& $6a '9) ' E0-;F ?'($'96
;&$%&A '6 6&+ 9'6$-9'0 0+?+0A &': ' >(-@'@$0$61 -, @+$98 '%&$+?+) -, J4WB
Q&+ E&$8&FA E7+)$/7F '9) E0-;F >(-U+%6$-9: ,-( 6&+ L/%D0'9) (+8$-9=: >->/0'6$-9
@+6;++9 23"Y '9) 23XY '(+ :&-;9 $9 Q'@0+ "B Q&+ E&$8&F ?'($'96 >(-)/%+: '9
2 M6'6$:6$%: 5+; <+'0'9) N23"XR M/@9'6$-9'0 O->/0'6$-9 c:6$7'6+:^ L6 Y3 ./9+23"X N>(-?$:$-9'0RB 22 H%6-@+( 23"XA M6'6$:6$%: 5+; <+'0'9)A _+00$986-9BY M6'6$:6$%: 5+; <+'0'9) N23"XR 5'6$-9'0 O->/0'6$-9 O(-U+%6$-9:^ 23"XN@':+RI
23]VA 2V 5-?+7@+( 23"XA M6'6$:6$%: 5+; <+'0'9)A _+00$986-9B

8/20/2019 013 RPS Urban Growth - Expert Conference Outcome Report - Residential Developable Capacity for Auckland
http://slidepdf.com/reader/full/013-rps-urban-growth-expert-conference-outcome-report-residential-developable 42/69
Y
$9%(+':+ $9 >->/0'6$-9 NJYJA]33R ;&$%& $: %0-:+ 6- 6&+ " 7$00$-9 '))$6$-9'0 >+->0+
6&+ OdLO '::/7+: @/6 6&$: $: @':+) -9 ' >(-U+%6+) >->/0'6$-9 ,-( 5+; <+'0'9);&$%& M6'6$:6$%: 5+; <+'0'9) %-9:$)+(: &': -901 ' 4 >+(%+96 %&'9%+ -, @+$98
'%&$+?+) @1 23XYB Q&+ E7+)$/7F >(-U+%6$-9 >(-)/%+: '(-/9) 233A333 ,+;+(>+->0+ ,-( L/%D0'9) @1 23XYB Q&+ )$,,+(+9%+: @+6;++9 6&+ E7+)$/7F '9) 6&+
E0-;FbF&$8&F ?'($'96: '6 +'%& ,$?+ 1+'( >+($-) $9 6&+ >(-U+%6$-9 :+($+: '(+ :&-;9$9 Q'@0+ "B
!"#$% '( )*+,%-.%/ 0+01$".2+34 +5 61-7$"3/ *%82+39 :;'<=:;><
)*+,%-.2+3 ?255%*%3-%4
@%"* A+B C%/21D E28F C%/=A+B E28F=C%/
"#$% $&'%"## $&'%"## $&'%"## # #
"#$( $)""*## $)&)*## $)+#$## "&### "%)##
"#"% $+$%'## $+)+*## $("#+## *%)## *%"##"#"( $(#%+## $('#'## $'++"## (+"## ()%##
"#%% $((+"## "#$#*## "$%%$## $"%%## $"")##
"#%( $')$+## "$"%### ""(&)## $)$%## $)$)##
"#&% "#"(%## """'%## "&%"(## "#$### "#%*##
,-./01
"#$%2"#&% *%*$## +%)$## '%')## "#$### "#%*##
Q&+ 6;- )+7-8('>&$% >(-%+::+: )($?$98 6&+ 8(-;6& N-( )+%0$9+R -, '91>->/0'6$-9 '(+ 9'6/('0 $9%(+':+ N6&+ @'0'9%+ -, @$(6&: -?+( )+'6&:R '9) 9+6
7$8('6$-9 N6&+ @'0'9%+ -, '(($?'0: -?+( )+>'(6/(+:RB Q&+ >(-U+%6+) 8(-;6& $9
L/%D0'9)=: >->/0'6$-9 $: :&-;9 ,-( 6&+ 6&(++ >(-U+%6$-9 ?'($'96: $9 Q'@0+ 2B Q&+)'6' (+,+( 6- '))$6$-9: 6- 6&+ >->/0'6$-9 )/($98 +'%& -, 6&+ 4 1+'( >+($-):
@+6;++9 23"YI"V '9) 23YVIXY ,(-7 9'6/('0 $9%(+':+ >0/: 9+6 7$8('6$-9B
!"#$% :( )*+,%-.%/ 8*+B.F 23 61-7$"3/G4 0+01$".2+3
:;'<='H .+ :;<H=><
)*+,%-.2+3@%"* A+B C%/21D E28F
"#$%2$( $"'%## $*%%## $+)'##
"#$(2"% '$&## $"$### $*#)##
"#"%2"( ('(## $"%&## $*)*##
"#"(2%% (%*## $$')## $**'##
"#%%2%( +&*## $$"*## $*$*##
"#%(2&% )))## $#)%## $&("##
3.045 *%*$## +%)$## '%')##

8/20/2019 013 RPS Urban Growth - Expert Conference Outcome Report - Residential Developable Capacity for Auckland
http://slidepdf.com/reader/full/013-rps-urban-growth-expert-conference-outcome-report-residential-developable 43/69
X
Q&+ (+:>+%6$?+ %-96($@/6$-9: -, 9'6/('0 $9%(+':+ '9) 9+6 7$8('6$-9 N,(-7-?+(:+': ': ;+00 ': -6&+( >'(6: -, 5+; <+'0'9)R '(+ :&-;9 $9 Q'@0+ YB
!"#$% <( I".1*"$ 23-*%"4% "3/ 3%. D28*".2+39 61-7$"3/ *%82+3
:;'<='H .+ :;<H=><
)*+,%-.2+3
@%"* A+B C%/21D E28F
6407-45 89:-;4<;
"#$%2$( )'%## +%%## +)'##
"#$(2"% +$&## ($### '#)##
"#"%2"( )'(## (%&## ')*##
"#"(2%% )%*## +')## '*'##
"#%%2%( *&*## +"*## '$*##
"#%(2&% &))## ))%## (("##
3.045 %+*$## &*)$## *%')##
6;0 =8>-408.9
"#$%2$( )#### (#### $#####
"#$(2"% "#### &#### )####
"#"%2"( "#### &#### )####
"#"(2%% "#### &#### )####
"#%%2%( "#### &#### )####
"#%(2&% "#### &#### )####
3.045 $)#### "(#### &#####
Q&+ >(-U+%6$-9: ,-( L/%D0'9) :&-; 6&'6 8'$9: ,(-7 9'6/('0 $9%(+':+ +S%++) 9+6 7$8('6$-9 $9 '00 >+($-):A +S%+>6 23"YI"V ;&+(+ 6&+ %/((+96 ?+(1 &$8& 9+6 8'$9:
'(+ >0'1$98 -/6B *+1-9) 23"V '00 6&(++ >(-U+%6$-9 ?'($'96: '::/7+ '?+('8+
'99/'0 9+6 7$8('6$-9 8'$9: ;$00 (+?+(6 6- 0+?+0: 6&'6 ;+(+ 7-(+ %-77-9 $9 6&+>':6B Q&$: $: 9-6 /9(+'0$:6$%a '6 '00 6$7+: $9 6&+ >':6 ;&+9 9+6 7$8('6$-9 &':
>+'D+) '6 '9 /9/:/'001 &$8& 0+?+0 $6 &': ,'00+9 '8'$9 ',6+( -9+ -( 6;- 1+'(:B
C6 $: $7>-(6'96 6- D++> $9 7$9) 6&'6 6&+ %/((+96 &$8& 9+6 7$8('6$-9 8'$9 $: )/+ 6-
@-6& '9 $9%(+':+ $9 9/7@+(: -, OPQ '(($?'0: '9) ' )+%(+':+ $9 9/7@+(: -, OPQ)+>'(6/(+:A +:>+%$'001 )+>'(6/(+: -, 5+; <+'0'9)+(:B _&+9 6&+ +%-9-71 $9
L/:6('0$' (+%-?+(: $6 $: &$8&01 0$D+01 6&'6 9/7@+(: -, 5+; <+'0'9)+(: &+')$98
'%(-:: 6&+ Q':7'9 ;$00 $9%(+':+ '8'$9B
C9 6&+ %':+ -, 9'6/('0 $9%(+':+A 6&+ 0-; '9) 7+)$/7 >(-U+%6$-9 ?'($'96: '::/7+8(')/'0 )+%0$9+: $9 ,+(6$0$61 ;&$0+ 6&+ &$8& :%+9'($- '::/7+: ' ($:+ $9 6&+ '?+('8+

8/20/2019 013 RPS Urban Growth - Expert Conference Outcome Report - Residential Developable Capacity for Auckland
http://slidepdf.com/reader/full/013-rps-urban-growth-expert-conference-outcome-report-residential-developable 44/69
4
9/7@+( -, %&$0)(+9 ' ;-7'9 ;$00 &'?+ )/($98 6&+$( (+>(-)/%6$?+ '8+:B Q&+ 0'66+(
:%+9'($- :++7: 7-:6 /90$D+01A +:>+%$'001 8$?+9 6&+ 80-@'0 6(+9) 6-;'(): 0-;+(,+(6$0$61 +?+(1;&+(+ '9)A $9 5+; <+'0'9)A 6&+ 8(-;6& $9 9/7@+(: -, %&$0)0+::
%-/>0+: $9 (+%+96 1+'(:BX d90+:: 5+; <+'0'9)+(: :6'(6 &'?$98 0'(8+( ,'7$0$+:'8'$9 9'6/('0 $9%(+':+ ;$00 )+%0$9+ @+%'/:+ 6&+ 9/7@+( -, )+'6&: $: 8-$98 6- ($:+
:6+')$01 ': 6&+ @'@1 @--7 8+9+('6$-9: 7-?+ 6&(-/8& 6&+ -0)+( '8+: $9 6&+>->/0'6$-9B
0;C9E F;<GB<H
*'(($98 7'U-( )$:':6+(:A '9) '::/7$98 6&+(+ $: (+%-?+(1 $9 6&+ L/:6('0$'9
+%-9-71A 71 '::+::7+96 -, 6&+ +:6$7'6+: >(-?$)+) @1 6&+ >(-U+%6$-9: $: 6&'6 L/%D0'9)=: >->/0'6$-9 $: 0$D+01 6- 8(-; @1 :-7+;&+(+ @+6;++9 [33A333 '9)
V33A333 -?+( 6&+ 9+S6 Y3 1+'(:B K-;+?+(A ,-(+%':6: -, >->/0'6$-9 8(-;6&
@+%-7+ $9%(+':$9801 /9(+0$'@0+ ': 1-/ 8+6 ,/(6&+( ,(-7 6&+ @':+ >->/0'6$-9 -?+(
6$7+B
Q&+ @+:6 6&'6 '>>(-'%& $9 %':+: 0$D+ L/%D0'9)A ;&$%& &'?+ T/$6+ )19'7$%>->/0'6$-9 :6(/%6/(+: '9) 7$8('6$-9 ('6+:A $: 6- '::/7+ 6&'6 6&+ ,-(+%':6: ,-(
8(-;6& -?+( 6&+ 9+S6 )+%')+ '(+ 0$D+01 6- @+ (+':-9'@01 (+0$'@0+A @/6 6&'6 @+1-9)6&'6 6&+1 '(+ (+'001 U/:6 $9)$%'6$-9: -, ;&'6 7$8&6 &'>>+9B #+I%'0$@('6$98 6&+
)+7'9) ,-( &-/:$98 '9) 0'9) $9 L/%D0'9) $9 232Y -9 6&+ @':$: -, />I)'6+)
>(-U+%6$-9: ;-/0) @+ ' >(/)+96 :6('6+81B
X M$7-9 `-00$9: N23"4R E#$:+ -, 6&+ %&$0)0+:: %-/>0+:FA M$7-9 `-00$9:A 5+;
<+'0'9) K+('0)A Y3 ./9+ 23"4A >B LY3B

8/20/2019 013 RPS Urban Growth - Expert Conference Outcome Report - Residential Developable Capacity for Auckland
http://slidepdf.com/reader/full/013-rps-urban-growth-expert-conference-outcome-report-residential-developable 45/69
8/20/2019 013 RPS Urban Growth - Expert Conference Outcome Report - Residential Developable Capacity for Auckland
http://slidepdf.com/reader/full/013-rps-urban-growth-expert-conference-outcome-report-residential-developable 46/69
Appendix D: Extra Comments from 013EG Members
This Appendix has been provided to give 013EG Members a free opportunity to express their
views, mainly on items that other 013EG Members may not necessarily have consensus on.
D1. Comments provided by Patrick Fontein
Having 20 years of on the ground property development experience, and having developed
hundreds of residential dwellings in Auckland in that time period, and having been involved in
development capacity modelling for the last 4 years, I have carefully considered the following
issues and their likely impact on the ACDC15 development feasible capacity numbers.
Studio D4’s (SD4) and I have been carrying out development capacity modelling from 2011
through to 2014, with much of the work carried out on behalf of AC and the RIMU team. The SD4
methods use a Fine Grained Analysis (FGA) approach, considering the development feasibility of
Auckland, by Board area, down to Neighbourhoods, down to Census Area Units (CAU’s), down to
Meshblocks (MB’s), and then down to each individual property parcel. The FGA approach
assesses the likelihood of developing any particular property parcel, over the timeframe of the
Auckland Plan, given the planning framework provided for that site.
Firstly some comments on population growth and household projections
The 013EG Group very late in the process were presented with a suggestion that the 400,000
extra household numbers to be accomodated within the Auckland Plan, be reduced. I and a
number of other members of the 013EG disagreed that such a fundamental shift in numbers could
be “signed off by this 013EG” at such a late stage, without substantial further review.
I suggested that a further expert group be set up to consider the following, but a consensus was
not reached, therefore it is included in my section of the Appendix:
i. Review the Auckland Plan’s adopted standard precautionary approach, in it being safer to
over-estimate the outcome than to underestimate, i.e. in using a high population growth
projection.
ii. Whether using a medium growth projection, which is shown to have greater probability, is
considered prudent.
iii. Whether the conclusions from the above warrant changing the 400,000 extra households
target set within the Auckland Plan.
iv. The impact that future dwelling typologies likely to be created in Auckland during the next
30 years, will have on household formation numbers. (as outlined in Section 2.3)
v. Consider the impact retirement villages and social housing providers (e.g. HNZC) will have
on the future household formation numbers. (as outlined in Section 2.4 and 2.5)
Here also are some comments that I believe the commercial property industry (most of the PCNZ
Members) and the Auckland business community’s views on an efficient housing market.
______________________________________________________________________________________
013EG: Residential Developable Capacity for Auckland 41

8/20/2019 013 RPS Urban Growth - Expert Conference Outcome Report - Residential Developable Capacity for Auckland
http://slidepdf.com/reader/full/013-rps-urban-growth-expert-conference-outcome-report-residential-developable 47/69
An eff ic ient funct ioning housing market
An efficient housing market is one where demand can be reasonably quickly matched with supply.
An efficient housing market is one where prices don’t fluctuate wildly, and the impact of
“speculators” is reduced or minimised. An efficient housing market is one where the primary focus
is on housing occupiers, rather than a sector where investors choose to participate based primarily
on the short-medium term future anticipated capital growth.
For business operating in Auckland (as in any other major city globally), they desire a ready pool of
employees to fulfil the employment demands of the company. The Auckland Plan has a huge
emphasis on “liveability” and this is an ideal match for employers, as if Auckland is a great place to
live, then there will be plenty of people who want to reside in Auckland, providing a plentiful supply
of employees.
So what do Auckland businesses want to see in the Auckland housing market? Businesses want
an efficient functioning housing market, that provides sensible affordable housing solutions to all its
current and potential employees. Employees need to be able to find affordable housingopportunities as without affordability, many current or potential employees will not be able to afford
to live in Auckland (or sufficiently close to their employment), such that many will eventually depart
Auckland (or not come), which then will lead to a gradual decline in the competitiveness of
Auckland based businesses. (the San Diego effect, where businesses and public sector
organisations are unable to attract employees as the housing affordability is so poor).
Part of the employee housing satisfaction equation is for Auckland residents to have reasonable
and sensible renting and ownership options. A housing market that is so unaffordable, so as to
inhibit 1st home buyers the opportunity to “get on the ladder”, is not efficient. The danger for
Auckland’s businesses competitiveness is that if their employees desires for housing ownership
can not be supplied in Auckland, than those (often younger) employees will relocate elsewhere.
One of the key indicators of housing affordability is the average house price to average income
ratio for that city. During the 15-20 year period, in Auckland this ratio has increased from circa 5.0
in 1998 (the year the Auckland Regional Growth Strategy was adopted), to in 2014-2015 sit at a
ratio of circa 9.0. Whilst many major international cities have a higher ratio than provincial cities,
with Auckland now at a level of 9.0, many would consider this as “extremely unaffordable”.
A stated goal of the Auckland Plan is to improve Auckland housing affordability. The current
Council has a stated objective to provide policies that bring housing affordability back to 5.5 (on theabove scale). This does not necessarily mean that current house prices have to drop, it means that
substantially greater new dwellings have to be provided at (more) affordable prices.
The 013EG has varying views on the impact of the future Auckland Unitary Plan housing planning
provisions on long term Auckland brownfield development capacity.
I believe it is the Auckland Plan objective to improve housing affordability by re-dressing the 15-20
year supply imbalance.
______________________________________________________________________________________
013EG: Residential Developable Capacity for Auckland 42

8/20/2019 013 RPS Urban Growth - Expert Conference Outcome Report - Residential Developable Capacity for Auckland
http://slidepdf.com/reader/full/013-rps-urban-growth-expert-conference-outcome-report-residential-developable 48/69
Considering the issues which will effect Reality from the ACDC15 Results
Using my professional judgement what impact will the issues below have on the realistic
development feasible capacity over a 30 year period, relative to the ACDC15 result of 83,420
development feasible dwellings.
1. Issues that will reduce the achieved reality f rom the ACDC15 results
i. Development chance Over a 30 year time period, this will likely knock out 30-40% of
the development feasible dwelling numbers. There are just so many property owners
who are very content with the existing use of their property.
ii. Capacity utilisation. This will probably have a greater reduction effect in the lower sale
price areas, where developers are likley to build lower cost terrace homes, than
apartments. Many of the Pacifica cultures are also not likely to be attracted to
apartment living, which will affect built typologies in their neighbourhoods.
iii. Infrastructure constraints: utility providers stifle development. This is just so
important to resolve. Hopefully the utility providers will study the ACDC15 Maps very
carefully and ensure sufficient infrastructure is provided in locations athat show
intensification is development feasible.
iv. Development sites costing more than the CV. As the current PAUP does not provide
sufficiently upzoned brownfield land opportunity, until there is an increase in upzoned
land, this issue will continue to be a problem. Site owners who have been “blessed” with
a substantial upzoning, will feel that they are entitled to a windfall profit as a result. This
can be substantially reduced, by providing developers with greater supply opportunities.
2. Issues that will increase the achieved reality from the ACDC15 results
i. Site amalgamation. Amalgamation is a time consuming and costly exercise, that only a
limited number of developers have the patience to undertake. The low level of
development feasible sites in the mixed housing zones, predominantly I believe due to
the density restrictions, mean that only the THAB zoned sites will benefit substantially
from amalgamation. My strong suggestion is to abolish the density rules in the mixed
house zones, and focus on the design controls for these areas.
ii. The effects of time improving viability on any chosen site. There is no doubt that a
number of areas that were developed 30-40 years ago (such as Farm Cove) that are
not development feasible currently, will get closer to becoming development feasible in
the 20-30 year timeframe of the Auckland Plan. However the converse could be said in
that a land owner sitting on a site that is not development feasible today, would sit back
and wait for his house to “deteriorate” for a 20-30 year period, so that in Year 28 he can
under-take an intensified development. Many of these owners will choose to renovate
and / or extend their property, such that unless a property is upzoned substantially,
these sites will stay similar to what they are now. In summary, I believe the future
overall development capacity dwellings achieved by “waiting” will be far less than DF is
advocating. DF believes that the trends of the last 15-20 years can continue to be
followed, in considering Auckland’s housing development capacity for the next 30
______________________________________________________________________________________
013EG: Residential Developable Capacity for Auckland 43

8/20/2019 013 RPS Urban Growth - Expert Conference Outcome Report - Residential Developable Capacity for Auckland
http://slidepdf.com/reader/full/013-rps-urban-growth-expert-conference-outcome-report-residential-developable 49/69
years. I have taken care to try and understand DF’s views on the effect of time making
developments economically feasible. It is a fallacy to use trends for the last 15-20
years, which have seen Auckland move to extreme unaffordability, and extrapolate this
and expect house sale prices to continue to increase at a far greater rate than
development costs, and compound this effect out over a 30 year period. If DF’s theories
are to be believed, there will be no one left in Auckland who can afford to own their ownhome.
iii. Very effective developers being able to perform better than the “mid range”.
Having personal property development experience at looking for “creative angles”, I do
believe that there will be a number of very effective developers who are able to turn
land parcels that are currenly showing a 10-20% margin, into a 20%+ project. Care
needs to be taken, not to extrapolate this effect into a large number of land parcels will
all of a sudden be development feasible, as experience has also shown, that when a
creative developer creates a new niche, most of the land owners who own sites that this
new niche can be developed on, increase their land prices, to make the new niche farless viable (effect 1 iv. above).
In summary considering all of the above, I believe the reducing issues 1. above will almost cancel
out the increasing issues of 2. above. In the end 2c may just have the biggest impact and I believe
that the PAUP 83,420 development feasible dwelling number may in reality yield approx 100,000
extra dwellings over the 30 year period of the Auckland Plan, within the 2010MAU.
I believe the only realistic response to get far closer to the 240-280,000 Auckland Plan target of
dwellings within the 2010MAU is to:
i. Eliminate the density rules in the mixed housing zones, which will single handedly providethe biggest impetus to affordable housing.
ii. Substantially up-zone all areas of missed opportunity, similar to that identified by David
Gibbs and the NZIA.
iii. Educate the NIMBY’s on the finacial effects of upzoning. As long as AC maintains strong
urban design controls, all property owners of upzoned land will financially benefit to a
greater degree than sites that have had no zoning changes.
______________________________________________________________________________________
013EG: Residential Developable Capacity for Auckland 44
8/20/2019 013 RPS Urban Growth - Expert Conference Outcome Report - Residential Developable Capacity for Auckland
http://slidepdf.com/reader/full/013-rps-urban-growth-expert-conference-outcome-report-residential-developable 50/69
D2. Comments provided by Adam Thompson
Time Frame Over the life of the PAUP (approximately ten years) in the order of 100,000 new dwellings arerequired to meet demand. Of these approximately 65,000 dwellings will need to be built within theMUA to meet the target of the Auckland Plan over this period. The results of ACDC model shouldin my opinion be considered within the context of whether this MUA growth target is able to be
achieved.
Forecasting Capacity The IHP requested that the expert group evaluate “…methods to match supply and demand overtime in order to derive measures of the number of years of developable supply available throughtime (by land use and location)”. This addresses the core question of whether the PAUP willenable sufficient new housing construction to meet demand, or what economists would define asan ‘efficient housing market’. This is relevant under the RMA because an efficient housing marketis required for social and economic wellbeing.
The expert group considered methods of forecasting new housing construction using the ACDCmodel. The input variables in the model are able to be adjusted to simulate changes that influencethe commercial feasibility of development over time. The variables that were considered included:• The depreciation of capital improvements, which in most cases occurs over a 50-100 year
period (i.e. at 1-2% per annum)• The increase in construction costs, which historically have increased over time.• The increase in land value, which have historically increased over time.
A case study analysis was presented to the conference group by another member which tested theimpact of the above three variables on commercial feasibility of development over time. Thisscenario showed significant increases in construction over time.The case study included a worked example in which the total project revenue was forecast toincrease from approximately $7.5m in 2015 to $9.0m in 2025.
The expectation that house prices would continue to increase in value indefinitely, relativeto incomes, was a major point of disagreement.
I raised the concern that, if it was assumed that the analysis represented a ‘ten unit development’ itwould mean that under this forecast, the average house price would increase from $750,000 in2015 to $900,000 in 2025. While it was agreed that such a scenario would increase the number ofproperties that are commercially feasibile for development, I raised the concern that this wouldmean that under this scenario the housing market would become significantly less economicallyefficient, with the practical implication being that fewer people could afford to purchase newhouses, as they would be significantly less affordable, and ultimately fewer houses would be built. Another member put forward the view that an economically efficient housing market could be
defined in respect of the proportion of households owned rather than rented their dwelling (tenure),with higher levels of ownership reflecting a more efficient market. I disagree with this view, andconsidered the tenure was an indicator of an efficient housing market, however was not a measureof an efficient housing market.
In my view the measure of an efficient housing market was whether there were no ‘market failures’,and of most relevance to economists was whether new housing could be delivered to be market atcompetitive or low prices that reflected the fundamental cost of production. I put forward theexample that new three bedroom family houses can be built for $300,000 - $400,000 in an efficienthousing market and this is seen in other similar cities in New Zealand and overseas, and that forsupply to be able to match demand it is pre-requisite that housing is able to be produced in thisprice range because this is the maximum that over half of all first home buyers or low income
households are able to afford.
______________________________________________________________________________________
013EG: Residential Developable Capacity for Auckland 45

8/20/2019 013 RPS Urban Growth - Expert Conference Outcome Report - Residential Developable Capacity for Auckland
http://slidepdf.com/reader/full/013-rps-urban-growth-expert-conference-outcome-report-residential-developable 51/69
In my opinion, the only variable that should be considered as a certainty over time in the Aucklandhousing market was the depreciation of capital improvements. I have modelled this and found thatonly minor increases (of 1-2%) in the commercial feasibility of new developments could beexpected over the next decade.
I also noted that other departments in the Council were concerned about the rapid decrease inhousing affordability, and were investigating methods to increase affordability, and that the case
study was contrary to the expectation that of house prices will inevitably increase from $750,000 to$900,000 over the next decade.
Housing Demand I raised the concern that apartments could not be expected to account for a large proportion of thefuture housing housing stock, as very few cities that are comparable to Auckland are able toachieve more than 15-20% apartments and most tend to have around 10%. The main reason forthis is that apartments are the most expensive type of housing when measured on a per sqm orper bedroom basis.
No specific analysis of demand by housing type and price was undertaken by the conferencegroup. This is however required to fully understand whether the supply that is enabled andcommercially feasible under the PAUP, as estimated by the ACDC model, is also able to be takenup by the market, particularly with consideration of whether low-middle income households canafford to purchase these dwellings.
Housing We’d Choose I raised concerns about the methodology of the Housing We’d Choose report. First, that thehousing options that respondents were asked to choose between were for dwellings that hadvarying prices (e.g. a $350,000 apartment versus a $500,000 terrace house). However in practicehome buyers would choose between houses of a similar value and would trade-off other factorssuch as location and size. Second, that the price option for apartments presented to respondentswas significantly lower than the current market price. This is likely to result in an over-estimate for
the preference for apartments. It was also noted that the report states that the survey is not arepresentative sample of the population.
HNZC I raised the concern that HNZC was not part of the private sector housing market, and was subjectto changes in political preferences over time, and for this reason should not be relied upon toprovide for the future housing needs of the Auckland population. I noted that the assumption theHNZC would build and sell 19,000 dwellings (which is included in the modelling results) couldoverstate future rates of construction, and that these figures should be considered separately tothe private housing market.
Indicators of Housing Sector Performance (Monitoring)
1. House price-to-income ratio Ratio of the median price of a dwelling unit and themedian annual household income
2. Rent-to-income ratio Ratio of the median annual rent of a dwelling unit and themedian annual income of renters
3. Mortgage servicing cost Average weekly cost of servicing mortgage debt formedian price and lower quartile price of adwelling
4. Construction rate Total number of housing units produced annually per
1,000 people, by type and size
______________________________________________________________________________________
013EG: Residential Developable Capacity for Auckland 46
8/20/2019 013 RPS Urban Growth - Expert Conference Outcome Report - Residential Developable Capacity for Auckland
http://slidepdf.com/reader/full/013-rps-urban-growth-expert-conference-outcome-report-residential-developable 52/69
5. Floor area per person Median useable living space per person (insquare metres) for existing and new housing
6. Non-compliant housing Incidence of housing stock that is not compliant withcurrent regulations
7. Housing investment Total investment in housing as a percentage of gross city
product
8. Mortgage debt ratio Ratio of total mortgage loans to all housing stock value
9. Land development ratio Average ratio between the median land price of adeveloped lot in a typical subdivision on theurban boundary and the median price of raw,undeveloped land
10. Infrastructure expenditure ratio Ratio of the total expenditures (operations, maintenance,per capita and capital) on infrastructure services(roads, sewerage, drainage) during the currentyear
Regards, Adam
Adam Thompson | Director | Urban EconomicsT 9 963 8776 | M 021 480220 | E [email protected] | W ue.nz Building 1, 3 Ceres Court, Albany, Auckland 6011
______________________________________________________________________________________
013EG: Residential Developable Capacity for Auckland 47

8/20/2019 013 RPS Urban Growth - Expert Conference Outcome Report - Residential Developable Capacity for Auckland
http://slidepdf.com/reader/full/013-rps-urban-growth-expert-conference-outcome-report-residential-developable 53/69
D3. Comments provided by Fraser Colegrave
“I recognise and greatly appreciate the significant effort devoted to reach this point. The modellingundertaken represents a quantum leap in our collective understanding, and will prove invaluable inshaping that understanding as this process continues.
Overall, I generally endorse the findings of this report. However, I equally note and agree with thecomments made by Patrick Fontein in this appendix.
More generally, I note that the analysis clearly shows the desired 70:40 split will be very difficult toachieve, and hence that a different approach is required to avoid the risk of a profound andprolonged undersupply of land. For example, the results of this report show that the number ofdwellings feasible for redevelopment today is only 16% of the 400,000 target, and hence that thelion’s share will need to come from other sources.
I urge the panel to factor this into their broader considerations of residential land supply.”
Fraser Colegrave Managing Director
Insight Economics D 09 366 6416 M 021 346 553
Level 5, Tower 1, 205 Queen Street, Auckland 1010 PO Box 106 303, Commerce Street, Auckland www.insighteconomics.co.nz
______________________________________________________________________________________
013EG: Residential Developable Capacity for Auckland 48

8/20/2019 013 RPS Urban Growth - Expert Conference Outcome Report - Residential Developable Capacity for Auckland
http://slidepdf.com/reader/full/013-rps-urban-growth-expert-conference-outcome-report-residential-developable 54/69
D4. Comments provided by Richard Burton
As a model I believe the methodology is sound but as with all models the input assumptions effectthe mathematical results generated by the model.
Dwelling Demand On the demand side, Richard Bedford has stated the following
"SNZ have identified a 50% probability that the medium projection for the national population willbe achieved by 2043, and a 5% probability that the high projection will be achieved”
In my opinion the IHP should use the medium projection as the basis for assessing supply. Thereare good grounds (as discussed in Richard’s report) to suggest the population growth may in factfall short of the medium projections but this is conjecture at this point and only time will tell.However planning for an unrealistic high growth rate could lead to investment decisions,particularly in infrastructure which prove unnecessary and encourage planning policies which havea negative impact on Auckland’s residential character.
Dwelling Supply On the supply side the model has produced an output of developable dwellings based on theassumptions adopted of:
· ACDC Model 64,420 · HCNZ 19,000 · Total 83,420
This is less than 50% of the projected demand even based on the medium projection. It should benoted that this is a snap shot in time, ie the developable dwellings using the assumptions stated,the costings and the sales data as at the base date.
However there is another way of putting it. There is a supply of developable land as of now of
some 83,000 households against a current demand for dwellings also as of now. There are variousfigures on what the current demand is depending on perceived shortfall in housing supply and theaverage annual demand for new dwellings. Whatever the number chosen, it is a relatively smallfraction of the 83,000 current dwelling supply. There is no necessity to supply now developablebrownfields capacity sufficient for more than 200,000 households. That proposition has no moresense than providing operative zoning for all the greenfields land supply for the next 30 years.Providing sufficient supply for say the next 10 years does make sense and Council can thenmonitor the take up of supply and monitor the type of housing typologies that are developed.
There is another very important matter to consider. Up zoning is best done after detailedneighbourhood area studies have been undertaken looking at constraints and opportunities in eacharea. These with a few exceptions have not been done by Council. Without such studies up zoning
can lead to development occurring in areas which are later found to be inappropriate. To take oneexample, significant parts on the central isthmus still have combined sewer/stormwater systems.These have severe capacity restraints and are very difficult and prohibitively expensive to replace.Neighbourhood Plans could identify which area can absorb intensification using the existingservices. Intensification should only be permitted to proceed in areas which have had properplanning and infrastructure studies completed and the results can then be added into the plan byway of plan change.
Amalgamat ion of Ti tles The PAUP has its core intensification strategy the presumption that residential sites will beamalgamated in order to obtain significant density incentives. In the MHS zone density increasesfrom 1:400m2 up to 1:200m2 on sites greater than 1200m2. In the MHU zone density goes from1:300m2 to unlimited density for sites greater than 1200m2. In most areas the 1200m2 can beachieved by the amalgamation of 2 sites. Historical evidence of low levels of amalgamation are
______________________________________________________________________________________
013EG: Residential Developable Capacity for Auckland 49

8/20/2019 013 RPS Urban Growth - Expert Conference Outcome Report - Residential Developable Capacity for Auckland
http://slidepdf.com/reader/full/013-rps-urban-growth-expert-conference-outcome-report-residential-developable 55/69
misleading in that they occurred in an environment where there was no density bonus foramalgamation. With a density bonus of 100% in MHS and unlimited in the MHU there is asignificant incentive for amalgamation. It is unfortunate that the model is based on noamalgamation of titles as this is directly contrary to the intention of the PAUP. Without theconsideration of site amalgamation I question the veracity of the models output. The dwellingsupply may be 83,000 households but with amalgamation it may be much more. I believe themodel should be run showing various scenarios of site amalgamation across MHS, MHU and
THAB zones.
Unlimited Density Calls for up zoning to provide the required development capacity confuse density with building bulkand location. Density is a very crude control and relates only to the number of dwellings permittedon a site of a given area. I have suggested to the 013 Expert Group that the important controls thatdetermine the built form in a given zone are: Height, Height to Boundary, Coverage, Landscaping, Impervious Areas, Yards, Building Lengthand Parking. These controls determine the maximum building envelope permitted in a zone andthus determine the zones “character”. Unlimited density within a framework of core bulk andlocation controls need not affect that character.
I suggested to the 013 Expert Group that the model be run on the basis of no density control butclear bulk and location delineations between the MHS, MHU and THAB zones. Unfortunately timeconstraints prevented this from being undertaken but comments from other members of the groupindicated the likelihood that this would materially increase the supply of developable land.
I took this suggestion to the Topic 059 -063 Workshop. This led to the formation of an expert grouprepresenting most major submitters who met to discuss the concept. A further meeting is proposedimmediately prior to the start of mediation.
Regards
Richard
Richard J Burton +64 21 720 107 +64 9 4860 783
______________________________________________________________________________________
013EG: Residential Developable Capacity for Auckland 50

8/20/2019 013 RPS Urban Growth - Expert Conference Outcome Report - Residential Developable Capacity for Auckland
http://slidepdf.com/reader/full/013-rps-urban-growth-expert-conference-outcome-report-residential-developable 56/69
D5. Comments provided by Douglas Fairgray
This Appendix sets out additional material which Dr Douglas Fairgray considers is relevant to the
expert conferencing on developable capacity, according to the IHP Memo of February 25.
It covers three key issues:
1. Future developable capacity and how this changes over time. This is recognised as an
important by the 013EG, but it was not possible within the time frame to achieve agreement on
the method to be established in the ACDC15;
2. Demographic changes and implications for Auckland’s household structure and housing needs
3. Some recent information on housing capacity, in relation to the Future Urban Land Supply
Strategy
1. Future Developable Capacity
The ACDC15 estimates developable capacity in the current situation. It does not look forward, to
estimate developable capacity at future points in time, as the market grows and changes.
This section describes a methodology to estimate developable capacity at future points in time.
The method applies the core calculation of the ACDC15 model, and allows for ongoing trends in
the key influences on viable development – property values, construction costs, and dwelling
prices.
Rationale
The method is based on the knowledge that the urban environment is dynamic, and the economics
of development and redevelopment change over time. The ACDC15 model takes account of the
fact that a major driver of residential redevelopment is the potential for intensification of land use,
typically from the (planning) opportunity to increase the level of improvement on a land parcel,
particularly by replacing one dwelling with two or more dwellings. This potential is reflected in the
plan-enabled capacity.
Generally, the greater the possible increase in improved value, the more likely that redevelopment
will be viable - always in the context of market feasibility.
Over time, the viability of redevelopment changes, because market conditions and property values
change. In particular, land values (LV) change at different rates from improvement values (IV) andthe LV component of total capital value (CV) generally increases over time. This shift generally
improves the viability of redevelopment, since the costs tend to increase more slowly (or reduce)
relative to the potential gains. The reason is that in most instances the value of the existing
improvements on a land parcel (IV) represents a cost to redevelopment. Where the value of
existing improvements is high, the cost of redevelopment is high relative to the potential gains, and
the potential net return is lower. This is the reason why redevelopment is much more likely to be
viable on a site where there is low improvement value (such as one old small dwelling) and there is
scope for considerable intensification (such as developing four new dwellings).
Over time, land values generally increase faster than improvement values. This is largely because
land values are influenced by growth in an urban economy, and as growth generally improves the
______________________________________________________________________________________
013EG: Residential Developable Capacity for Auckland 51

8/20/2019 013 RPS Urban Growth - Expert Conference Outcome Report - Residential Developable Capacity for Auckland
http://slidepdf.com/reader/full/013-rps-urban-growth-expert-conference-outcome-report-residential-developable 57/69
economics of land intensification. However, while LV tends to grow with the economy trend, the
value of improvements on the land is subject to ageing and depreciation, as well as the economy
growth. That is because the improvements on the land generally reflect the highest and best use at
the time of their construction. From that point, the LV progressively changes with the economy, but
the IV component does not. Over time, the IV component is typically upgraded to keep pace with
the growth in the underlying LV, through both refurbishment and/or expansion of the existingstructures, or through replacement of the improvements by more intensive use. The catch-up with
the LV shift is typically through increasing the built space on the land, so that the improvement
value again reflects the (current) highest and best use.
The change in relative values of LV and IV is a core driver of urban renewal and intensification. As
the size of the urban economy grows, there is pressure for intensification of land use, to utilise the
land resource more efficiently. That pressure is commonly supported by planning provisions, to
enable more intensive use of land including for the city economy to maintain or enhance its
efficiency. That is reflected in the PAUP’s provisions to enable residential intensification. The
process of change is captured for the current situation in the ACDC15 model.
However, the current situation does not capture the future circumstances, where a growing
population and economy will see changes in the land market, which will directly affect the viability
of redevelopment.
This makes it very important that any assessment of developable capacity is based not simply on a
snapshot of what it is currently viable to redevelop, but rather on what development and
redevelopment will be viable over the planning period, as the economy grows and the value
structure of parcels (including existing improvements) changes in real terms.
ACDC15 method to estimate changes in viabil ity o f redevelopment
The ACDC15 model provides the method for assessing future viability. It calculates the net return
from redevelopment – from sales value, less the costs of the land (LV and IV) and costs of
construction and sale.
The same method may be applied in future situations. The difference is that estimates of future
sales values, land costs (LV and IV) and construction costs and sale are required.
The viability of redevelopment at future points in time can be estimated taking into account the
three main influences, and their combined effects, as follows:
i. Future cost (LV [current 2014 LV adjusted by the % change in LV] + IV [current IV
adjusted by the % change in IV] + Construction Costs [current costs adjusted by the %
change in costs]);
ii. Compared with Future sales value (current sales value, adjusted by the % change in
value which reflects the % change in LV and the % change in costs);
iii. Future return = future sales value less future costs as %, and as a $ amount. This is
the same formula, applied with the future sales and cost estimates.
Estimating Future Costs and Values
______________________________________________________________________________________
013EG: Residential Developable Capacity for Auckland 52

8/20/2019 013 RPS Urban Growth - Expert Conference Outcome Report - Residential Developable Capacity for Auckland
http://slidepdf.com/reader/full/013-rps-urban-growth-expert-conference-outcome-report-residential-developable 58/69
A key part of the assessment is the estimates of the medium and long term changes in LV, IV and
construction costs, and maintaining relativity among these estimates, consistency with the
underlying economic outlook, and consistency with historical patterns.
The issue then is to have robust and consistent estimates of the future costs and values. This
requirement is the norm for most projection or forecasting work.
There is considerable information available to inform those estimates – from both understanding of
the Auckland urban economy, and from information on short and long term actual trends and
patterns.
First, there is a strong conceptual and actual link between economic growth, and land values. The
value of (Auckland’s) urban land can be expected to grow in real terms in response to (at least) the
rate of real growth in the economy. This is because the (positive) growth in the size of the economy
means that the potential return from using the land (occupied by that economy) is correspondingly
larger. The efficiency gains from co-location, which flow through directly as intensification of land
use, means that urban economies do not simply expand their land area pro rata with their(population) size. Rather, the growth in the market means that the benefits of intensification
(especially in inner areas where efficiencies are greatest) will increase. This makes it generally
more cost effective and efficient to intensify than to sprawl.
That does not mean that there is no outward growth, or that no more land is taken up for urban
uses. A larger economy means that more land can be efficiently used for urban purposes.
Nevertheless, as urban economies grow the percentage increase in urban land area will be
generally less than the percentage increase in the size of the economy, as some of the growth is
accommodated through more intensive use of existing urban land 8.
The value of improvements (dwellings and other built structures) generally does not rise at the
same rate as land value. There are two main reasons for this. Once improvements are built they
tend to define the intensity of use for the land, as at the time of their construction. This means that
the potential intensity of use of the land continues to increase as the economy grows (and is
reflected in land value), whereas the actual intensity of use is largely defined by the built structures
on the land. This effect applies together with the fact built structures age, and generally depreciate
over time. The consequence is that over time the improvement value generally decreases as a
share of the total capital value of properties - at least until the improvements are replaced or
upgraded to sustain more intensive utilisation of the land.
This pattern is evident in a range of studies (for example, Zheng9 found that Auckland residential
land prices increased far ahead of total residential property values in the 2000-2007 period, while
8 If this did not occur, then it would mean that the benefits of co-location have topped out, and there is no longer a gain ineconomic efficiency from a larger urban economy9 Guanyu Zheng- The New Zealand Productivity Commission: The Effect of Auckland's Metropolitan Urban Limit on
Land Prices, March 2013
______________________________________________________________________________________
013EG: Residential Developable Capacity for Auckland 53

8/20/2019 013 RPS Urban Growth - Expert Conference Outcome Report - Residential Developable Capacity for Auckland
http://slidepdf.com/reader/full/013-rps-urban-growth-expert-conference-outcome-report-residential-developable 59/69
analysis of CfGS data shows that 2011 and 2014 residential land values increased at 1.75 times
the rate of improvement values.
Second, there is detailed information to identify the relative rates of change in land value and
improvement values over time. Data from Corelogic indicates that over the 1995 to 2015 period
(the longest time frame for which reliable information can be provided) the rate of increase in LV
(9.1%pa) was more than double the rate of increase in IV (4.4%pa), on a per sqm basis.
This differential was evident in every time period, and for each of the former TLAs within Auckland.
The pattern is expected because of different mix of processes through which values change.
Nevertheless, it shows the pattern is clear and consistent over time, and across locations within
Auckland.
It is important to link the trends in land values especially to economic fundamentals, rather than
just the historic trends. This is because property prices in Auckland have risen considerably faster
than the underlying growth in the economy and population base. While the increase in dwelling
prices in the early 2000s for Auckland was similar to the growth in every other region of NewZealand and to the rest of New Zealand as a whole (according to REINZ median property price
data) from 2012 the increase in Auckland and Canterbury has been well ahead of other regions. In
these regions (at least) housing affordability is a major issue. Over-estimating the rate of future
growth in LV would overstate the rate at which developable capacity would increase over time.
Nevertheless, Auckland’s growth is projected to continue, driving the need for more dwelling
capacity, so it is important to allow for ongoing change in the market without assuming that
dwelling cost increases must continue to be ahead of the fundamentals.
The initial modelling further indicates that the differential between LV and IV is a key influence,
whatever the rates of change. Hence the initial focus on the scale and consistency of that
differential, by location and over time.
Third, there is information available from the StatisticsNZ series on construction costs, based on
the construction costs PPI for inputs and outputs. Longer term, this indicates real shifts in the order
of 2.3%pa.
These trends may be used to inform estimates of future changes.
The information on the changes in LV, and the changes in construction costs, may be used to
indicate the future shifts in underlying dwelling prices, since land value and construction cost are
the main components of changes in new dwelling costs.
Status
This method has been developed in the course of the conferencing. While the general concept is
agreed that future changes in property values and relative shifts in the LV and IV components of
value will affect developable capacity going forward, there has been no agreement on the specific
model to be applied.
Initial runs of this component of the model have indicated that over time, the amount of
developable capacity will steadily increase. However, the application of this – or an equivalentcapability, has not been agreed through the conferencing.
______________________________________________________________________________________
013EG: Residential Developable Capacity for Auckland 54
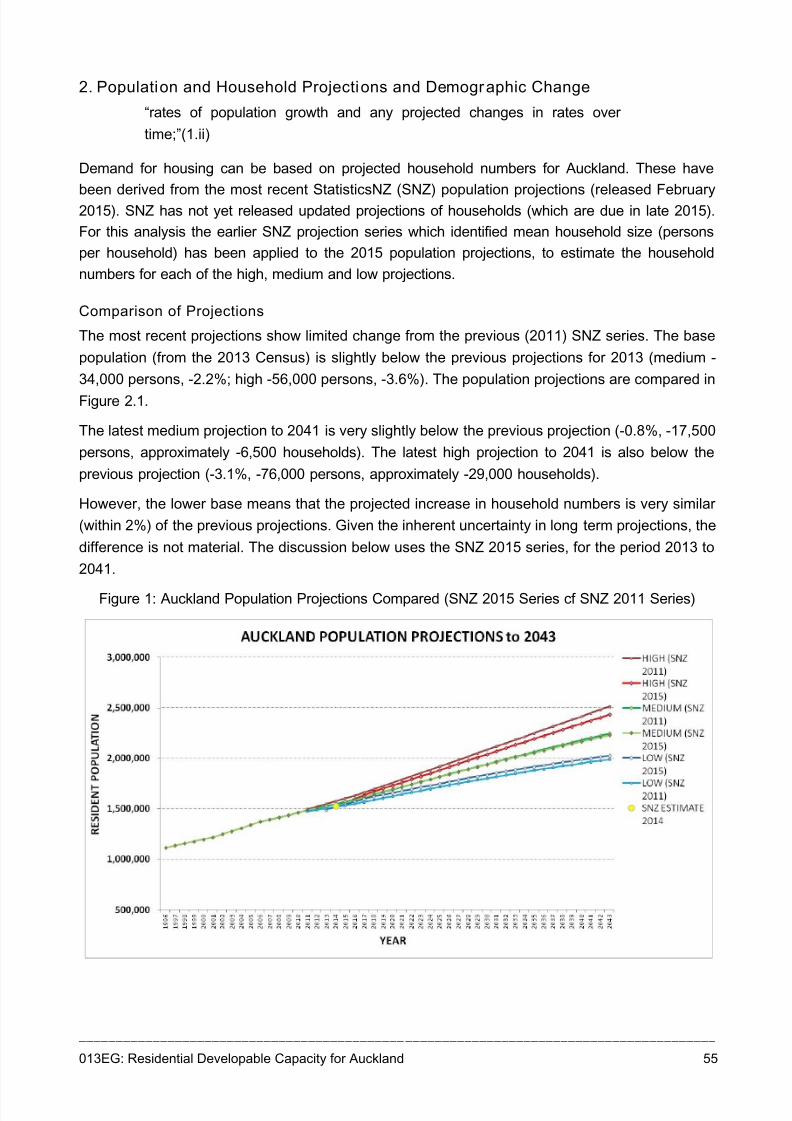
8/20/2019 013 RPS Urban Growth - Expert Conference Outcome Report - Residential Developable Capacity for Auckland
http://slidepdf.com/reader/full/013-rps-urban-growth-expert-conference-outcome-report-residential-developable 60/69
2. Population and Household Projections and Demographic Change
“rates of population growth and any projected changes in rates over
time;”(1.ii)
Demand for housing can be based on projected household numbers for Auckland. These have
been derived from the most recent StatisticsNZ (SNZ) population projections (released February2015). SNZ has not yet released updated projections of households (which are due in late 2015).
For this analysis the earlier SNZ projection series which identified mean household size (persons
per household) has been applied to the 2015 population projections, to estimate the household
numbers for each of the high, medium and low projections.
Comparison of Projections
The most recent projections show limited change from the previous (2011) SNZ series. The base
population (from the 2013 Census) is slightly below the previous projections for 2013 (medium -
34,000 persons, -2.2%; high -56,000 persons, -3.6%). The population projections are compared in
Figure 2.1.
The latest medium projection to 2041 is very slightly below the previous projection (-0.8%, -17,500
persons, approximately -6,500 households). The latest high projection to 2041 is also below the
previous projection (-3.1%, -76,000 persons, approximately -29,000 households).
However, the lower base means that the projected increase in household numbers is very similar
(within 2%) of the previous projections. Given the inherent uncertainty in long term projections, the
difference is not material. The discussion below uses the SNZ 2015 series, for the period 2013 to
2041.
Figure 1: Auckland Population Projections Compared (SNZ 2015 Series cf SNZ 2011 Series)
______________________________________________________________________________________
013EG: Residential Developable Capacity for Auckland 55
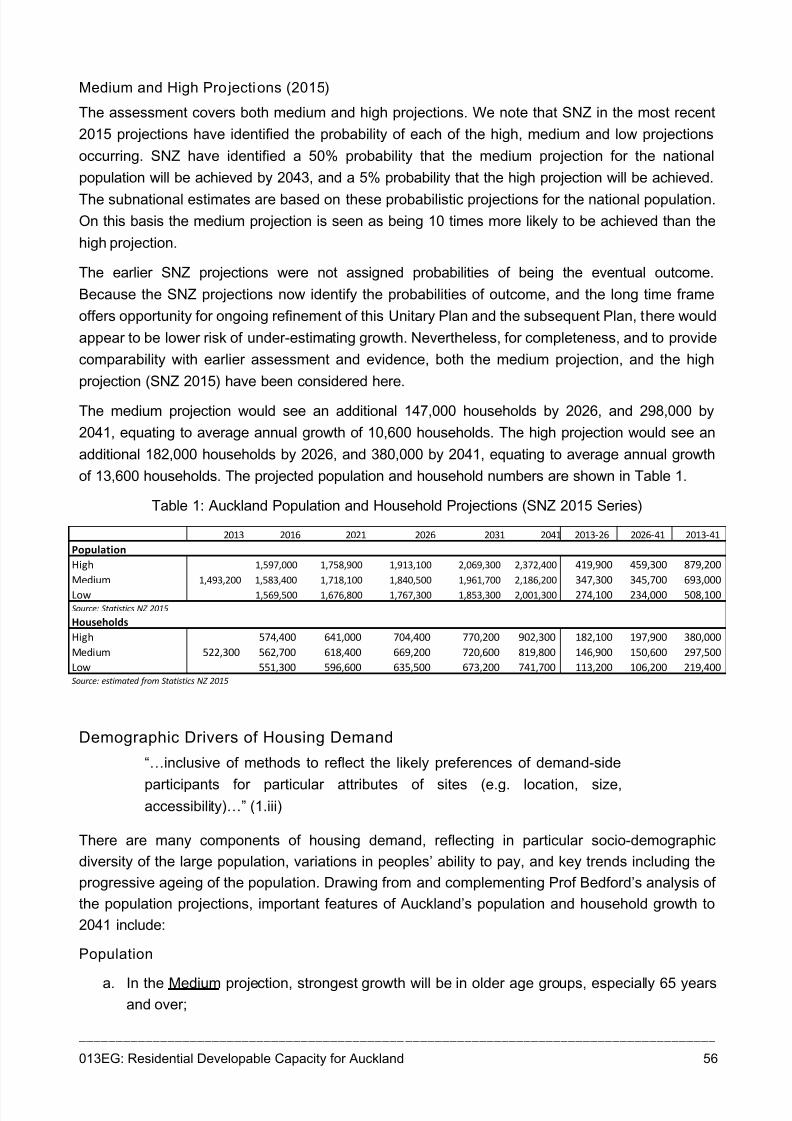
8/20/2019 013 RPS Urban Growth - Expert Conference Outcome Report - Residential Developable Capacity for Auckland
http://slidepdf.com/reader/full/013-rps-urban-growth-expert-conference-outcome-report-residential-developable 61/69
Medium and High Pro jections (2015)
The assessment covers both medium and high projections. We note that SNZ in the most recent
2015 projections have identified the probability of each of the high, medium and low projections
occurring. SNZ have identified a 50% probability that the medium projection for the national
population will be achieved by 2043, and a 5% probability that the high projection will be achieved.
The subnational estimates are based on these probabilistic projections for the national population.On this basis the medium projection is seen as being 10 times more likely to be achieved than the
high projection.
The earlier SNZ projections were not assigned probabilities of being the eventual outcome.
Because the SNZ projections now identify the probabilities of outcome, and the long time frame
offers opportunity for ongoing refinement of this Unitary Plan and the subsequent Plan, there would
appear to be lower risk of under-estimating growth. Nevertheless, for completeness, and to provide
comparability with earlier assessment and evidence, both the medium projection, and the high
projection (SNZ 2015) have been considered here.
The medium projection would see an additional 147,000 households by 2026, and 298,000 by
2041, equating to average annual growth of 10,600 households. The high projection would see an
additional 182,000 households by 2026, and 380,000 by 2041, equating to average annual growth
of 13,600 households. The projected population and household numbers are shown in Table 1.
Table 1: Auckland Population and Household Projections (SNZ 2015 Series)
Demographic Drivers of Housing Demand
“…inclusive of methods to reflect the likely preferences of demand-side
participants for particular attributes of sites (e.g. location, size,accessibility)…” (1.iii)
There are many components of housing demand, reflecting in particular socio-demographic
diversity of the large population, variations in peoples’ ability to pay, and key trends including the
progressive ageing of the population. Drawing from and complementing Prof Bedford’s analysis of
the population projections, important features of Auckland’s population and household growth to
2041 include:
Population
a. In the Medium projection, strongest growth will be in older age groups, especially 65 yearsand over;
2013 2016 2021 2026 2031 2041 2013-26 2026-41 2013-41
Population
High 1,597,000 1,758,900 1,913,100 2,069,300 2,372,400 419,900 459,300 879,200
Medium 1,493,200 1,583,400 1,718,100 1,840,500 1,961,700 2,186,200 347,300 345,700 693,000
Low 1,569,500 1,676,800 1,767,300 1,853,300 2,001,300 274,100 234,000 508,100
Source: Statistics NZ 2015
Households
High 574,400 641,000 704,400 770,200 902,300 182,100 197,900 380,000
Medium 522,300 562,700 618,400 669,200 720,600 819,800 146,900 150,600 297,500
Low 551,300 596,600 635,500 673,200 741,700 113,200 106,200 219,400
Source: estimated from Statistics NZ 2015
______________________________________________________________________________________
013EG: Residential Developable Capacity for Auckland 56

8/20/2019 013 RPS Urban Growth - Expert Conference Outcome Report - Residential Developable Capacity for Auckland
http://slidepdf.com/reader/full/013-rps-urban-growth-expert-conference-outcome-report-residential-developable 62/69
b. However, substantial growth is also expected in 30-49 and 50-64 year age groups;
c. Less growth is expected among 20-29 year age groups;
d. Children (0-15 years) will account for a smaller share of the population;
e. Except for the period 2013-18, when net migration gains are slightly higher than the
contribution from natural increase, the latter, in Auckland, is projected to make a largercontribution to population growth than net migration through to 2043 (SNZ).
f. In the High projection, strongest growth is also expected in the older age groups, and the
30-64 age groups;
g. However, in the high projection there could be substantial increase in younger age groups,
with more children because of an assumed increase in fertility rates;
h. While the population will progressively change and will age, neither projection implies an
old population.
Households
i. This means the household structure will not be greatly different from 2013;
j. The biggest increase will be single person and couple households (especially in older age
groups), which will together account for 48% of households (43% currently);
k. However, family households will make up a large share of total (47% compared with 52%
currently), with non-family households the balance, of 5%;
l. The age of households will change, consistent with population ageing. However, numbers
will increase in all age ranges, including 15-40yrs (+26%), 40-64 years (+43%), and 65 and
over (+136%);
m. Assuming current income patterns for each household type and age cohort will continue,
then the strongest increase will be in low income households (<$30,000pa), and in the low-
medium ($30-50,000pa) cohort by 2041;
n. However, there will be growth across all income groups. Low income households would
account for 22% (currently 19%) and low-medium households 16% (currently 15%). High
($100,000+) and high-medium ($70-100,000pa) income households would make up about
50% of the total, compared with 54% currently;
o. Most of the growth in low and low-medium income households will be single persons and
couples in the older age groups.
These figures suggest that while the structure of demand will change, and the age and income mix
of households will alter in line with the changes in the population, the Auckland housing market will
not be characterised by fundamental structural shifts in the period to 2041. The ongoing growth in
the population, especially the net inflows of migrants generally in the relatively young age groups,
will mean that the largest part of the market will represent continuation of the current structure,
albeit with the net addition of households in the older age groups characterised more by smaller
size, and often lower incomes.
______________________________________________________________________________________
013EG: Residential Developable Capacity for Auckland 57
8/20/2019 013 RPS Urban Growth - Expert Conference Outcome Report - Residential Developable Capacity for Auckland
http://slidepdf.com/reader/full/013-rps-urban-growth-expert-conference-outcome-report-residential-developable 63/69
The analysis indicates progressive and incremental change in the market over the period to 2041,
rather than substantial short term changes.
It also indicates that the changes in the nature of housing supply – especially the increasing share
of terrace house and apartment dwellings which is associated with redevelopment and
intensification – will need to be supported by changes in market preferences as much as changes
arising from demographic shift.
3 A range of sources of housing capacity
The PAUP enables residential activity and development in a range of zones and locations, with
capacity arising from the combination of zoned areas, the zoning provisions applying to those
areas, and the cadastral structure as it affects those provisions, together with the economics of
development. While the main focus of this conferencing is on developable capacity in the
established urban areas inside the MUA, it is also important to understand the enabled and
developable capacity in other zones and locations inside and outside the MUA. This includes
greenfield areas such as the Future Urban Zone, areas where development is already consented(identified generally as “special areas’), rural areas, and business areas, as well as locations
(including the HNZC land) where other development drivers apply.
The HNZC land and capacity has been generally incorporated as an addition to the modelling. As
part of the wider demand and supply context, it is also directly relevant to consider the potential of
the Future Urban Zone through the period to 2041 – not least because the 70:40 strategy applies
to the longer term, and does not indicate an interim 70:40 target within the life of the PAUP.
Future Urban Zone
The proposed Future Urban Zone (FUZ) is an area of some 10,800 ha which is intended to provide
substantial capacity for urban development, mainly on the edge of urban Auckland, within the RUB.
The CfGS did not identify the potential capacity in the FUZ, because at that time there had been no
detailed assessment of its potential capacity, nor was there information on the likely time frame in
which infrastructure to service the FUZ development would be available. The FUZ will be enabled
for urban development through a structure plan and plan change process, for which the availability
of service infrastructure (three waters and roading) is a critical pre-requisite.
During 2015, Council has consulted with land holders and developers and the infrastructure
providers, to develop the Future Urban Land Supply Strategy (FULSS). The FULSS was reportedon to Council on July 6, 2015. The report contains estimates of the total dwelling capacity of the
FUZ, and detail on the scale and timing of the likely availability of the land for urban residential
uses. These are summarised in Table 1.
The FULSS Report identifies capacity for some 104,750 dwellings in the FUZ (range 92,900 to
116,600). Table 2 draws together information from the FULSS report10 shows the mid-point of the
capacity range for each location. It indicates that there will be capacity for 33,600 dwellings in the
10 Auckland Council Draft Future Urban Land Supply Strategy, July 2015 – Tables on p 6 and p8
______________________________________________________________________________________
013EG: Residential Developable Capacity for Auckland 58
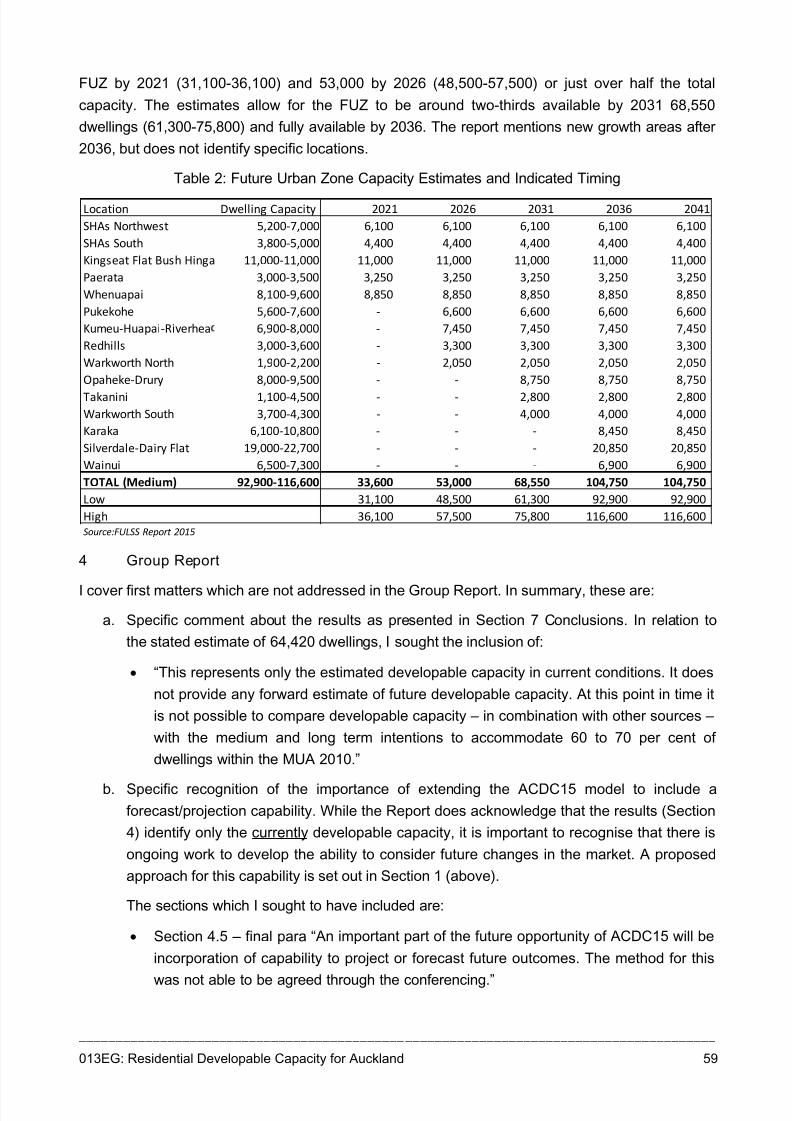
8/20/2019 013 RPS Urban Growth - Expert Conference Outcome Report - Residential Developable Capacity for Auckland
http://slidepdf.com/reader/full/013-rps-urban-growth-expert-conference-outcome-report-residential-developable 64/69
FUZ by 2021 (31,100-36,100) and 53,000 by 2026 (48,500-57,500) or just over half the total
capacity. The estimates allow for the FUZ to be around two-thirds available by 2031 68,550
dwellings (61,300-75,800) and fully available by 2036. The report mentions new growth areas after
2036, but does not identify specific locations.
Table 2: Future Urban Zone Capacity Estimates and Indicated Timing
4 Group Report
I cover first matters which are not addressed in the Group Report. In summary, these are:
a. Specific comment about the results as presented in Section 7 Conclusions. In relation to
the stated estimate of 64,420 dwellings, I sought the inclusion of:
• “This represents only the estimated developable capacity in current conditions. It does
not provide any forward estimate of future developable capacity. At this point in time it
is not possible to compare developable capacity – in combination with other sources –
with the medium and long term intentions to accommodate 60 to 70 per cent of
dwellings within the MUA 2010.”
b. Specific recognition of the importance of extending the ACDC15 model to include a
forecast/projection capability. While the Report does acknowledge that the results (Section
4) identify only the currently developable capacity, it is important to recognise that there is
ongoing work to develop the ability to consider future changes in the market. A proposed
approach for this capability is set out in Section 1 (above).
The sections which I sought to have included are:
• Section 4.5 – final para “An important part of the future opportunity of ACDC15 will be
incorporation of capability to project or forecast future outcomes. The method for this
was not able to be agreed through the conferencing.”
Location Dwelling Capacity 2021 2026 2031 2036 2041
SHAs Northwest 5,200-7,000 6,100 6,100 6,100 6,100 6,100
SHAs South 3,800-5,000 4,400 4,400 4,400 4,400 4,400
Kingseat Flat Bush Hinga 11,000-11,000 11,000 11,000 11,000 11,000 11,000
Paerata 3,000-3,500 3,250 3,250 3,250 3,250 3,250
Whenuapai 8,100-9,600 8,850 8,850 8,850 8,850 8,850
Pukekohe 5,600-7,600 - 6,600 6,600 6,600 6,600
Kumeu-Huapai-Riverhea 6,900-8,000 - 7,450 7,450 7,450 7,450
Redhills 3,000-3,600 - 3,300 3,300 3,300 3,300
Warkworth North 1,900-2,200 - 2,050 2,050 2,050 2,050
Opaheke-Drury 8,000-9,500 - - 8,750 8,750 8,750
Takanini 1,100-4,500 - - 2,800 2,800 2,800
Warkworth South 3,700-4,300 - - 4,000 4,000 4,000
Karaka 6,100-10,800 - - - 8,450 8,450
Silverdale-Dairy Flat 19,000-22,700 - - - 20,850 20,850
Wainui 6,500-7,300 - - - 6,900 6,900
TOTAL (Medium) 92,900-116,600 33,600 53,000 68,550 104,750 104,750
Low 31,100 48,500 61,300 92,900 92,900
High 36,100 57,500 75,800 116,600 116,600
Source:FULSS Report 2015
______________________________________________________________________________________
013EG: Residential Developable Capacity for Auckland 59
8/20/2019 013 RPS Urban Growth - Expert Conference Outcome Report - Residential Developable Capacity for Auckland
http://slidepdf.com/reader/full/013-rps-urban-growth-expert-conference-outcome-report-residential-developable 65/69
• Section 7, final para : “Further development of the Model, particularly its capabilities to
look forward in time, will considerably extend its usefulness.”
c. Acknowledgment that there was not opportunity for the initial findings on future capacity to
be presented and explained to the Group;
d. The inclusion of comments to provide balance (in my view) to the anecdotal matters
presented in Sections 5.2.1 Development chance and 5.2.2 Capacity utilisation.
The paragraphs which I sought to have included are:
• Section 5.2.1 final para “However, it is important to recognise that development
chance will also change over time, particularly as properties change hands,
established improvements age, and market conditions change in the future. For this
reason, care must be taken to ensure that perceptions of development chance
through 2015 eyes are not assumed to apply into the medium or long term future.”
•
Section 5.2.2 final para “Again, it is very important to recognise that developmentexpectations and perceptions of what is feasible chance will also change over time,
with the turnover of property ownership and market conditions changing in the
future. For this reason, care must be taken to ensure that perceptions of capacity
utilisation through 2015 eyes are not assumed to apply into the medium or long term
future.”
I also cover matters which are included in the Group Report with which I disagree. In summary,
these are:
e. Section 1.3.8 – will housing supply under the PAUP match demand over time ?
• I disagree with aspects of the material presented in the two paragraphs of this
section, including the view that the PAUP by itself will enable an efficient housing
market. In my view, that position is overly simplistic, and while the PAUP is certainly
one component of the market there are other important and inter-related aspects
which require more thorough consideration.
• I disagree with the contention that the Group was able to consider methods of
forecasting. There was not sufficient opportunity to present detail of the intended
approach, or to utilise the initial ACDC15 outputs for all of Auckland.
J D M Fairgray
22 July 2015
______________________________________________________________________________________
013EG: Residential Developable Capacity for Auckland 60

8/20/2019 013 RPS Urban Growth - Expert Conference Outcome Report - Residential Developable Capacity for Auckland
http://slidepdf.com/reader/full/013-rps-urban-growth-expert-conference-outcome-report-residential-developable 66/69
Appendix E: The ACDC15 Model Results in Map Form
______________________________________________________________________________________
013EG: Residential Developable Capacity for Auckland 61
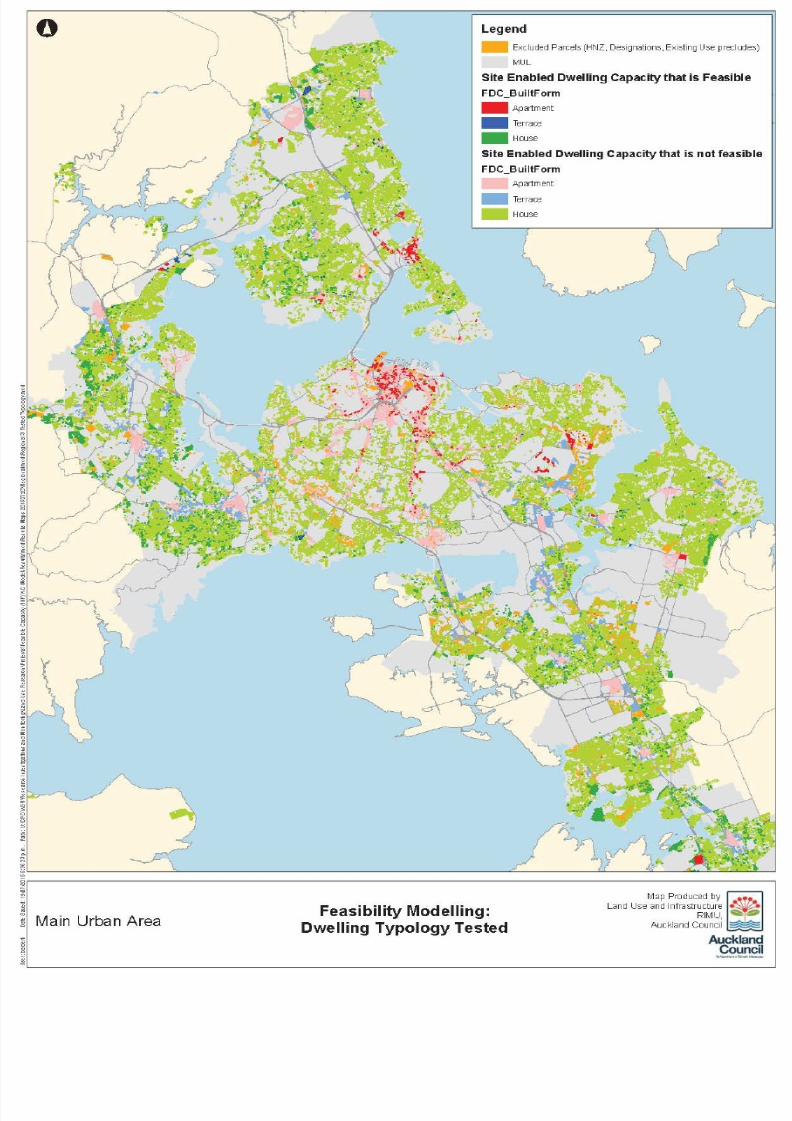
8/20/2019 013 RPS Urban Growth - Expert Conference Outcome Report - Residential Developable Capacity for Auckland
http://slidepdf.com/reader/full/013-rps-urban-growth-expert-conference-outcome-report-residential-developable 67/69
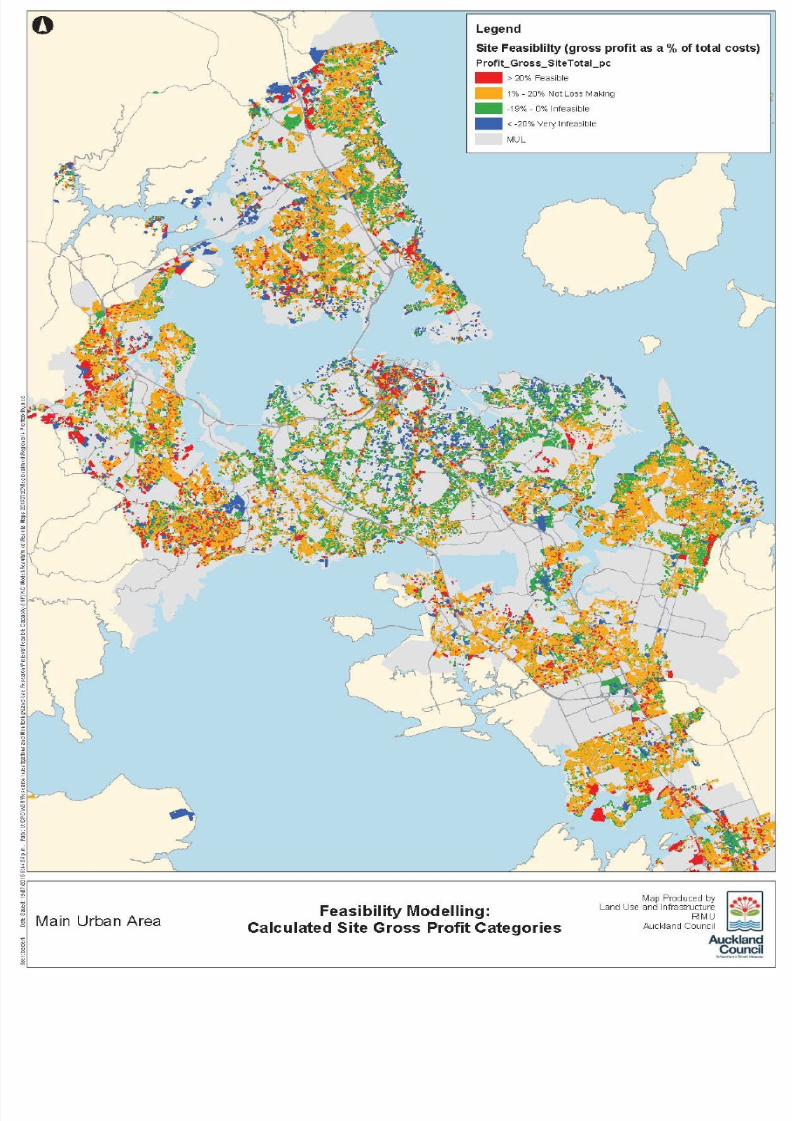
8/20/2019 013 RPS Urban Growth - Expert Conference Outcome Report - Residential Developable Capacity for Auckland
http://slidepdf.com/reader/full/013-rps-urban-growth-expert-conference-outcome-report-residential-developable 68/69

8/20/2019 013 RPS Urban Growth - Expert Conference Outcome Report - Residential Developable Capacity for Auckland
http://slidepdf.com/reader/full/013-rps-urban-growth-expert-conference-outcome-report-residential-developable 69/69


![[rps/rcp/rp/dp] - Auckland Unitary Plan Operative in Partunitaryplan.aucklandcouncil.govt.nz/Images/Auckland Unitary Plan... · plan and district plan provisions[rps/rcp/rp/dp]. ...](https://static.fdocuments.net/doc/165x107/5aff7d9a7f8b9a68498fd696/rpsrcprpdp-auckland-unitary-plan-operative-in-unitary-planplan-and-district.jpg)