大仁科技大學 檢據核銷流程說明及合格憑證範例 - TAJEN · 大仁科技大學 檢據核銷流程說明及合格憑證範例 一、原始憑證 原始憑證包括外來憑證、對外憑證及內部憑證,其中:
Upload
miles-mcdonaldCategory
view
245download
0
陳慕義晉加股份有限公司www.statplusinc.com
循證醫學Evidence-Based Medicine
• 循證醫學是謹慎、明確、據判斷力的運用現有最佳證據的醫學。
• 以客觀臨床科學研究結果為依據,用以決定並應用於個別病人的醫療護理計畫。
What are clinical trials?
• FDA– A clinical trial is the clinical investigation of a
drug which is administered or dispensed to, or used involving one or more human subjects.
• 台灣行政院衛生署– 藥品施用於病人或健康自願者身上,已發現或
驗證其療效,認明其不良反應、研究該藥品在人體的吸收、分布、代謝和排泄過程,以確定其有效性和安全性的系統性研究。

發現新化學物質
物理化學性狀的研究
毒性試驗與安全性試驗
藥理試驗
第 一 階 段 (Phase I)
第 二 階 段 (Phase II)
第 三 階 段 (Phase III)
新藥審查
第 四 階 段 (Phase IV)( 新藥監視期
實驗室研
究
前臨床試驗
階段
(
動物試
驗)
人體臨床試驗階
段
新藥上
市
2~3 年
3~5 年
3~5 年
2~3 年
IND
NDA
3~5 年
Phase I
• 根據臨床前藥理研究結果,首次在人體(健康)進行研究藥物的周密試驗。
• 目的是觀察藥物在人體內的作用機制:藥物動力學,藥物在人體內的吸收速率和程度、在體內重要器官的分布和維持情況、代謝、排泄的速率和程度等,和藥效學、耐受性和安全性。


Phase II
• 適應症確立後,第一批病人接受研究藥物。
• 觀察最大耐受劑量以下的劑量範圍,找出具最佳療效、沒有或可接受的副作用的相應劑量範圍,進而訂定最佳劑量,以及評價效果。
• 考慮治療可行性。


Phase III
• 基於前期研究結果,以確定研究藥物的有效性和安全性、受益和危害比率。
• 需選擇需要接受治療的病人,以確定臨床效用。受試者包括特殊群(如老年人),以觀察普遍耐受性。


Phase IV
• 新藥獲准註冊上市後的大型研究,監察普遍臨床使用時的不良反應和毒性。
• 研究目的為進一步了解安全性和療效等的詳細資料、收集長期安全性數據、其他未被發現的適應症等等。
• 流行病學研究:提供經濟上的間接影響信息,幫助地方醫療管理人員制訂醫療政策,更有效分配資源。

International Conference on Harmonization (ICH)
• International Conference on Harmonization of Technical Requirements for the Registration of Pharmaceuticals for Human Use
• 緣由:各國臨床研究規範發展不同,實施時間有別,原則雖相同,但具體內容細節則有別,以致新藥上市申請要分別在每一國家按當地法規,重複進行各類試驗和研究,耗費時間、人力、物力,結果是增長新藥上市申請時間、延遲病人獲得新藥治療的機 會,總樣本數大增,及暴露於臨床研究潛在危害的人數增加,以上均是不道德行為。因此全球三個製藥最發達地區(美國、日本、歐洲)於 1990 年 4月在比利時布魯塞爾成立ICH ,之後每兩年開會一次,直至完成制定或全球認定的統一規範。
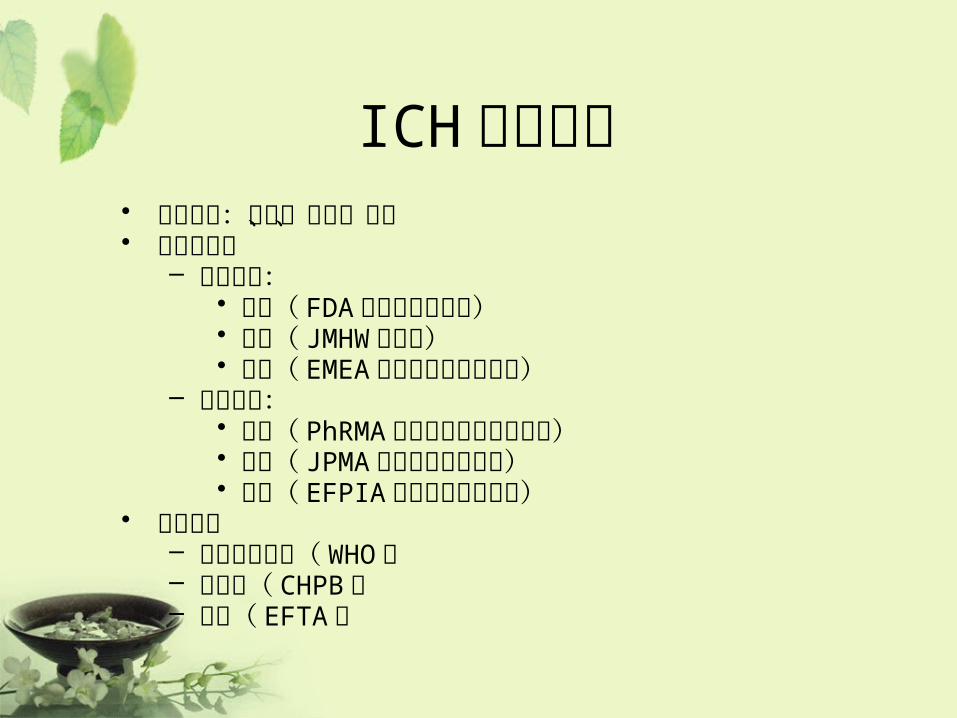
ICH組織結構• 組織成員:美國、日本、歐洲• 程序委員會
– 管理機構:• 美國( FDA食品藥物管理 局)• 日本( JMHW厚生省)• 歐洲( EMEA歐洲藥品評審委員會)
– 工業機構:• 美國( PhRMA美國製藥生產研發協會)• 日本( JPMA日本製藥工業協會)• 歐洲( EFPIA歐盟製藥工業協會)
• 觀察機構– 世界衛生組織( WHO )– 加拿大( CHPB )– 歐洲( EFTA )

ICH工作進程• ICH 1 : 1991/11 (比利時布魯塞爾)
• ICH 2 : 1993/10 (美國奧蘭多)• ICH 3 : 1995/11 (日本橫濱)• ICH 4 : 1997/7 (比利時布魯塞爾)• ICH 5 : 2000/11 (美國聖地牙哥)• ICH 6 : 2003/11 (日本大阪)
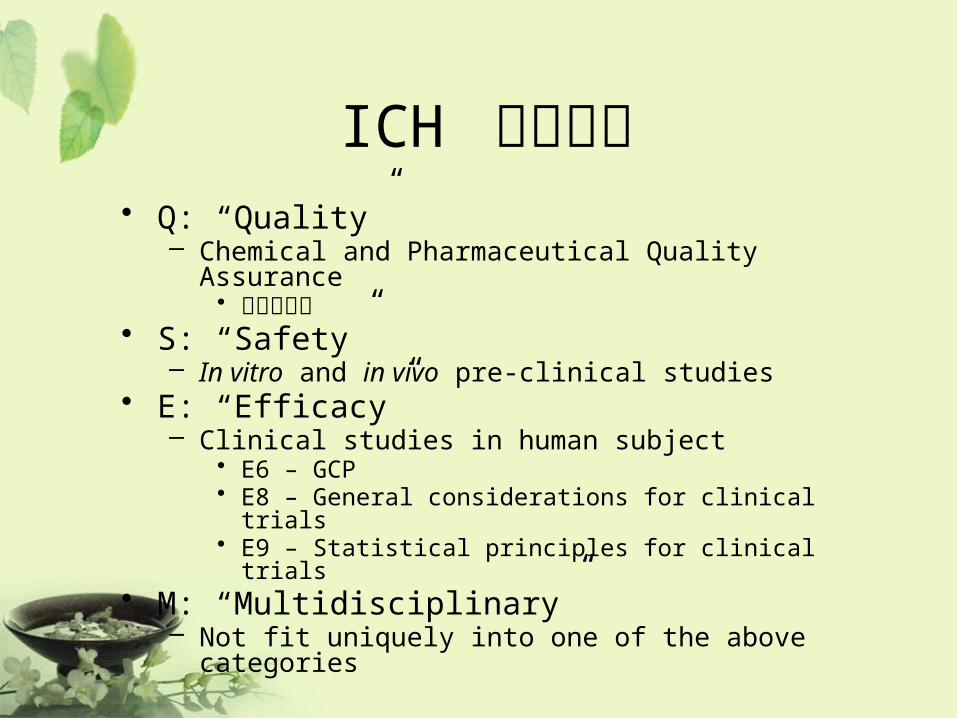
ICH 制定規範• Q: “Quality”
– Chemical and Pharmaceutical Quality Assurance• 安定性試驗
• S: “Safety”– In vitro and in vivo pre-clinical studies
• E: “Efficacy”– Clinical studies in human subject
• E6 – GCP• E8 – General considerations for clinical trials• E9 – Statistical principles for clinical trials
• M: “Multidisciplinary”– Not fit uniquely into one of the above categories

Contract Research OrganizationCRO
• 受託研究機構–指一個商業性或學術性的研究機構,試
驗委託者可將某些工作和職責轉移至該機構。
• 工作範圍包括臨床研究中的研究方案設計和編寫、研究執行和管理、監測、資料數據處理、統計學分析、總結報告、稽查、規章制度的提交和其他服務。

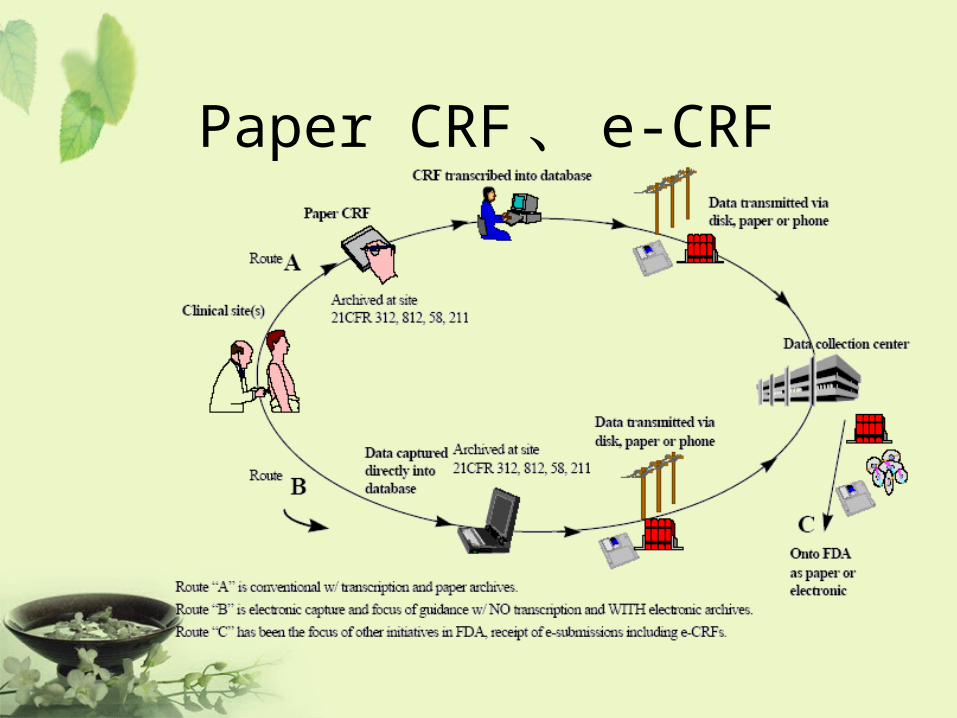
Paper CRF 、 e-CRF

Basic Principle on Clinical Trial Design
• Objective– To obtain an unbiased and reliable assessment of
given regimen response, independent of any known or unknown prognostic factors.
• PrincipleAllocation at random Representative
Blinding Reliability
Control group Reproducibility

Allocation at Random
• Tends to produce treatment groups in which the distributions of prognostic factors are similar– Stratification
• If there are known factors that could affect the outcome (center, age, sex, baseline risk)
• Only one or few factors used for stratification– Block
• Block size divisible by number of treatment• Block size of two is not used

Simpson’s Paradox
Success Regimen A Regimen BOverall Yes 289 (83%) 273 (78%)
No 61 (17%) 77 (22%)
Group 1 Yes 234 (83%) 81 (93%)(Male) No 36 (17%) 6 (7%)
Group 2 Yes 55 (69%) 192 (73%)(Female) No 25 (31%) 71 (27%)

Permuted-Block Randomization
• Random Allocation within each block– 1,2,3,4
• By Random Selection of Blocks– TTPP– PPTT– TPTP– TPPT– PTPT– PTTP

Blinding
• To limit the occurrence of conscious and unconscious bias in the conduct and interpretation of a clinical trial– Open– Single Blind– Double Blind
• To maintain the blind a control must look, smell, taste and feel the same as the comparator of interest, whether the treatment is a placebo or an active control – maybe with double dummy.
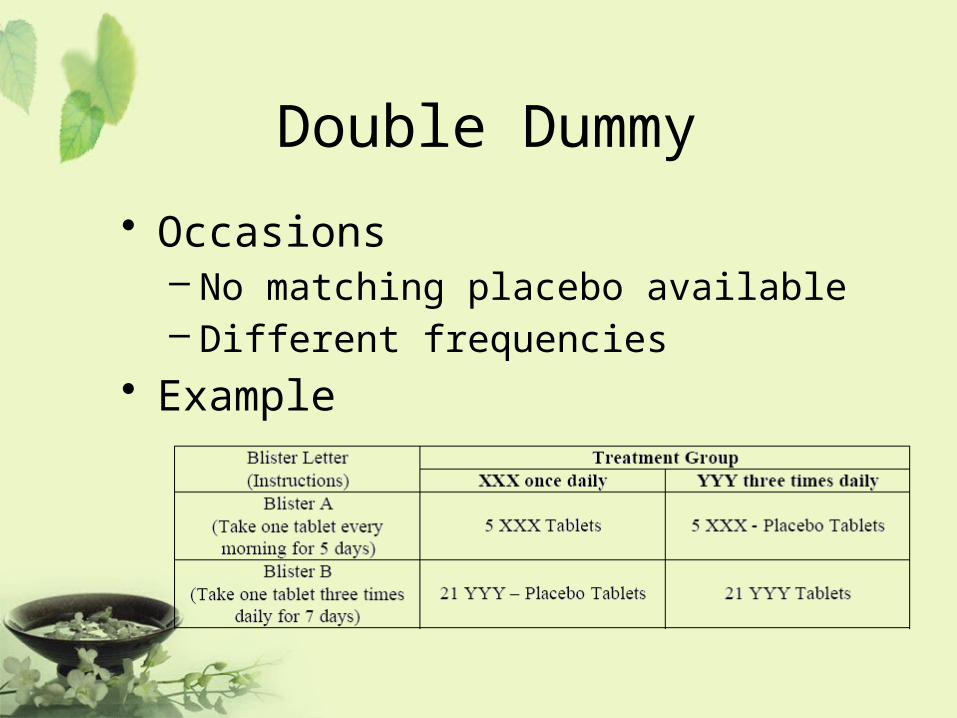
Double Dummy
• Occasions– No matching placebo available– Different frequencies
• Example

Control Groups• Placebo control
• U.S. FDA (most desirable)• Other countries (less acceptable)• Unethical (sometime)
• Active comparator control• Established, standard treatment used for the
condition• Three treatment group (placebo & active)
• Historical control• Cancer trial
• No control (observational study)
Representative
• The primary variable (“target” variable, primary endpoint) should be the variable capable of providing the most clinically relevant and convincing evidence directly related to the primary objective of the trial. – ICH E9

Reliability
• If any of the efficacy or safety assessments was not standard, i.e., widely used and generally recognized are reliable, accurate and relevant (able to discriminate between effective and ineffective agents), its reliability, accuracy and relevance should be documented. It may be helpful to describe alternatives considered but rejected. – ICH E3

Reproducibility
• If the outcome is to be recorded on different sessions then one should know the repeatability of the measure so one can appropriately quantify any longitudinal treatment effect.
Three Key Components• Experimental unit
– A subject from a targeted population under study• Treatment
– It could be a placebo or any combinations of (pharmaceutical entity, diet, surgical procedure, diagnostic test, medical device, no treatment)
• Evaluation– Efficacy analysis (Clinical endpoints)– Safety assessment (Adverse experience, Laboratory test
results)– Others (Quality of life assessment, Pharmacoeconomics and
outcomes research)
Adequate and Well-controlled Study
• Objective (clear)
• Methods of analysis (appropriate statistical methods)
• Design (valid for addressing scientific questions)
• Selection of subjects (assurance of the disease under study)
• Assignment of subjects (minimize bias)
• Participants of studies (minimize bias)
• Assessment of responses (well-defined and reliable)
• Assessment of the effect (accurate and reliable)
Key Statistical Concepts
• Bias and Variability• Hypothesis Testing• Type I Error and Power• Confounding and Interaction• Statistical Difference vs Clinical Difference• Sample Size

Bias
• An inclination or preference that interferes with impartial judgment (Webster’s Dictionary, 1984)
• A systematic error that enters a clinical trial and distorted the data obtained as opposed to a random error (Spilker, 1991)
• It measures the closeness of the test result to the true value (e.g., population mean)
• Accuracy

Variability
• A measure of precision or reliability that is referred to as the degree of closeness of clinical results to the true value regarding the targeted patient population
• The higher precision, the more likely the result can be reproduced
• Precision

Less bias, small variability Large bias, small variability
Less bias, large variability Large bias, large variability
Bias and Variability
Bias and Variability
• It is not possible to avoid bias and variability in real world.
• It is important to – identify, – eliminate, and – control
the bias/variability to an acceptable limit.
Step on Performing Hypotheses Testing
• Choose the null hypothesis that is to be questioned.• Choose an alternative hypothesis that is of particular
interest to the investigators.• Select a test statistic, and define the rejection region
(or a rule) for decision making about when to reject the null hypothesis and when not to reject it.
• Draw a random sample by conducting a clinical trial.• Calculate the test statistic and its corresponding p-
value.• Make conclusion according to the predetermined rule.
Type of Hypotheses Testing
• Test for Equivalence• Test for Non-inferiority• Test for Superiority
– Clinical– Statistical

Test for Equivalence
• Purpose– To show that the test drug can reach the
same therapeutic effect as that of a standard therapy (or an active agent) or they are therapeutically equivalent
Test for Equivalence• Hypothesis
– Null hypothesis: There is a clinically meaningful difference between the test drug and the standard therapy
– Alternative hypothesis: There is no clinically meaningful difference between the test drug and the standard therapy
• The rejection of the null hypothesis suggests that there is no clinically meaningful difference between the test drug and the standard therapy and hence we conclude that the test drug is equivalent to the standard therapy.
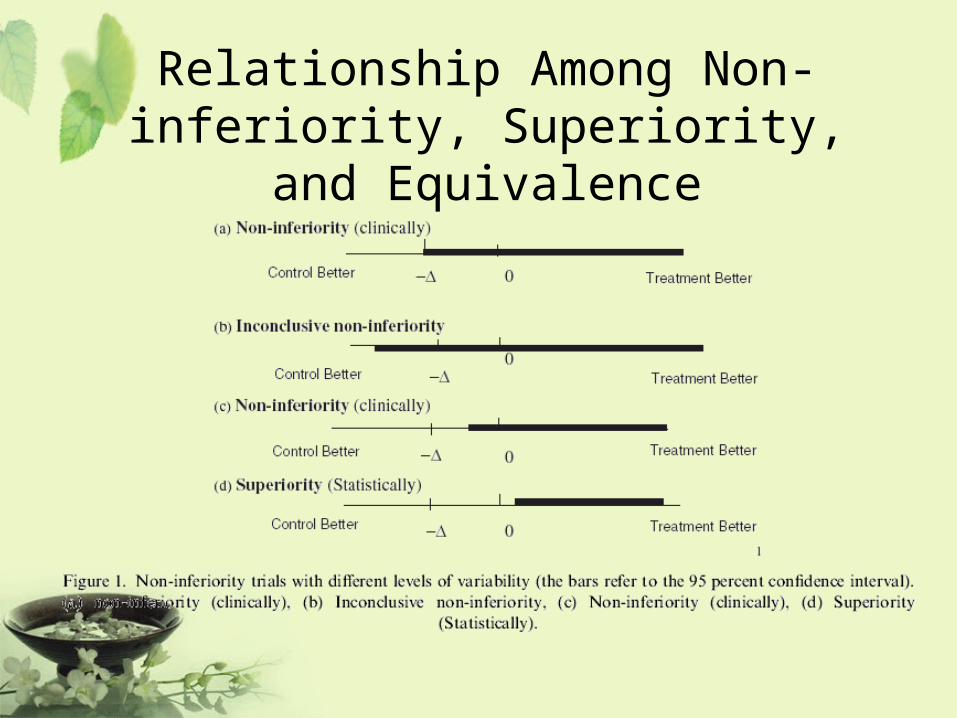
Test for Non-inferiority
• Purpose– To show that the test drug is no worse than
a standard therapy or an active agent
• Situations where it is applicable– The test drug is less toxic– The test drug is easier to administer– The test drug is less expensive
Test for Non-inferiority• Hypothesis
– Null hypothesis: The test drug is inferior to the standard therapy
– Alternative hypothesis: The test drug is not inferior to the standard therapy
• The concept is to reject the null hypothesis and conclude that the difference between the test drug and the standard therapy is less than a clinically meaningful difference and hence the test drug is no worse than the standard therapy.

Test for Superiority
• Purpose– To show that the test drug is superior to a
standard therapy or an active agent

Test for Superiority• Hypothesis (Statistically -> Clinically)
– Null hypothesis: There is no clinically meaningful difference between the test drug and the standard therapy
– Alternative hypothesis: The test drug is superior tothe standard therapy
• The rejection of the null hypothesis suggests that the difference between the test drug and the standard therapy is greater than a clinically meaningful difference and hence we conclude that the test drug is superior to the standard therapy.

Relationship Among Non-inferiority, Superiority, and Equivalence
µs-d µs µs+d
[ | ]
| ¬ Equivalence ® |
There is no clinically significantly meaningful difference between the test drug and the standard therapy. It is usually referred to as two-sided equivalence.

Relationship Among Non-inferiority, Superiority, and Equivalence
µs-d µs µs+d
[ | ]
Inferiority® | ¬ Non-inferiority
Non-inferiority = at least as effective as …
It is also referred to as one-sided equivalence
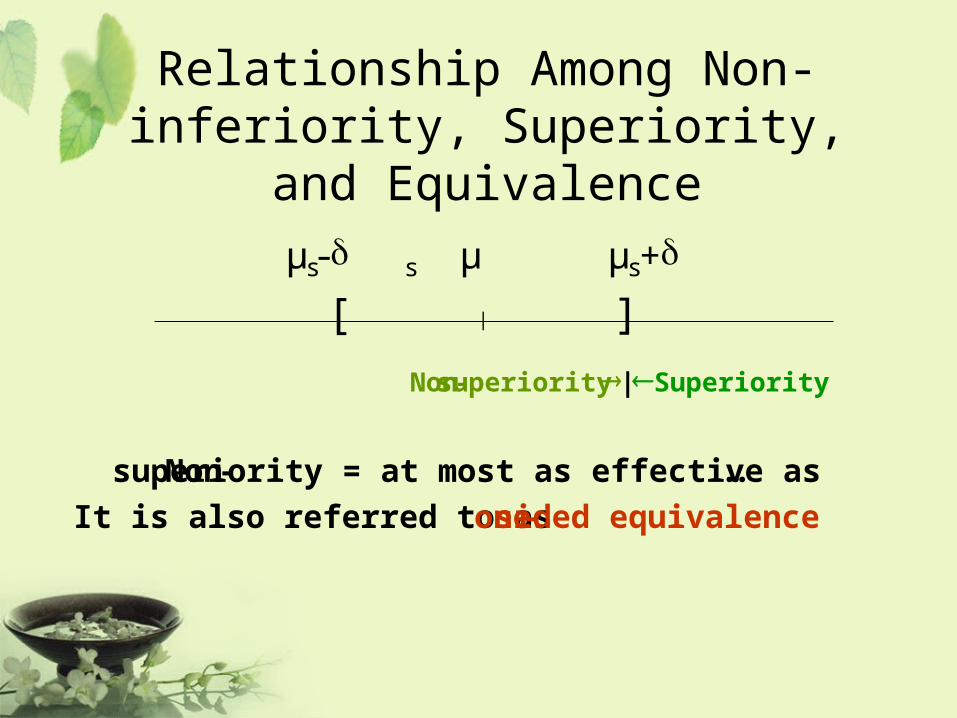
Relationship Among Non-inferiority, Superiority, and Equivalence
µs-d µs µs+d
[ | ]
Non-superiority ® | ¬ Superiority
Non-superiority = at most as effective as …
It is also referred to as one-sided equivalence

Relationship Among Non-inferiority, Superiority, and Equivalence
µs-d µs µs+d
[ | ]
Inferiority ® | ¬ Equivalence ® | ¬ Superiority
| ¬ Non-inferiority
Non-superiority ® |
One-sided Equivalence

Relationship Among Non-inferiority, Superiority, and Equivalence
µs-d µs µs+d
[ | ]
Inferiority ®| ¬ Equivalence ®| ¬ Superiority
H0: µT-µs £ -d H0: |µT-µs | ³ d H0: µT-µs £d
Ha: µT-µs > -d Ha: |µT-µs | < d Ha: µT-µs > d
Would like to reject the null hypothesis and conclude the alternative hypothesis
Relationship Among Non-inferiority, Superiority, and Equivalence
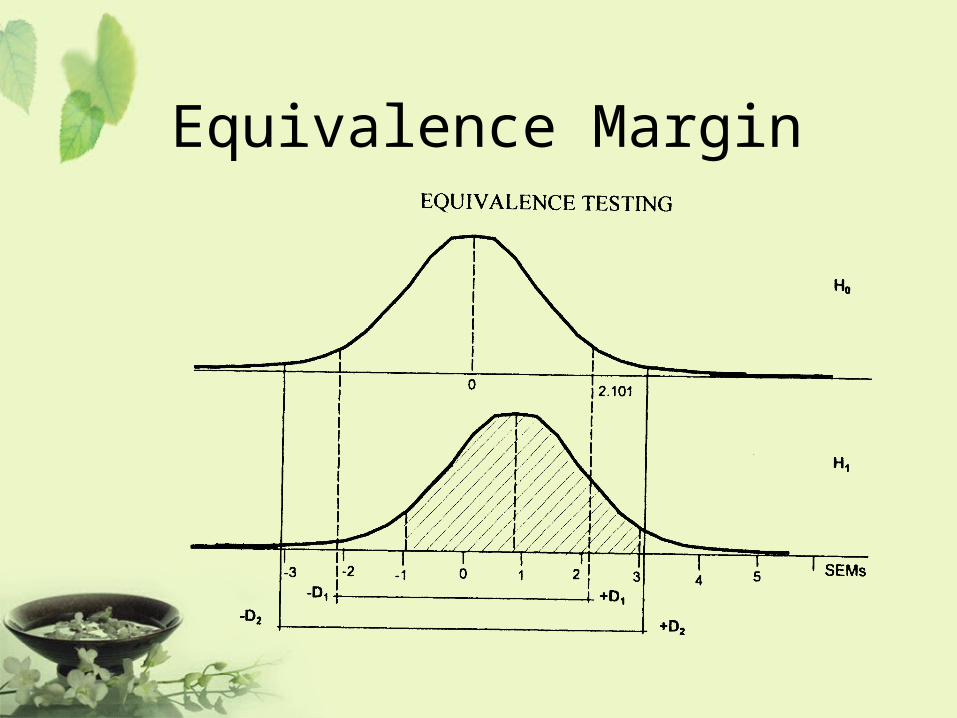
Equivalence Margin

Type I Error and Power
Null hypothesis: The drug is ineffectiveAlternative hypothesis: The drug is effective
Type I error : the drug works when in fact it doesn’t.
Type II error : the drug doesn’t work when in fact it does.
P-value : the probability of observing a type I error.
Power : the probability of correctly concluding that the drug
works when in fact it does.
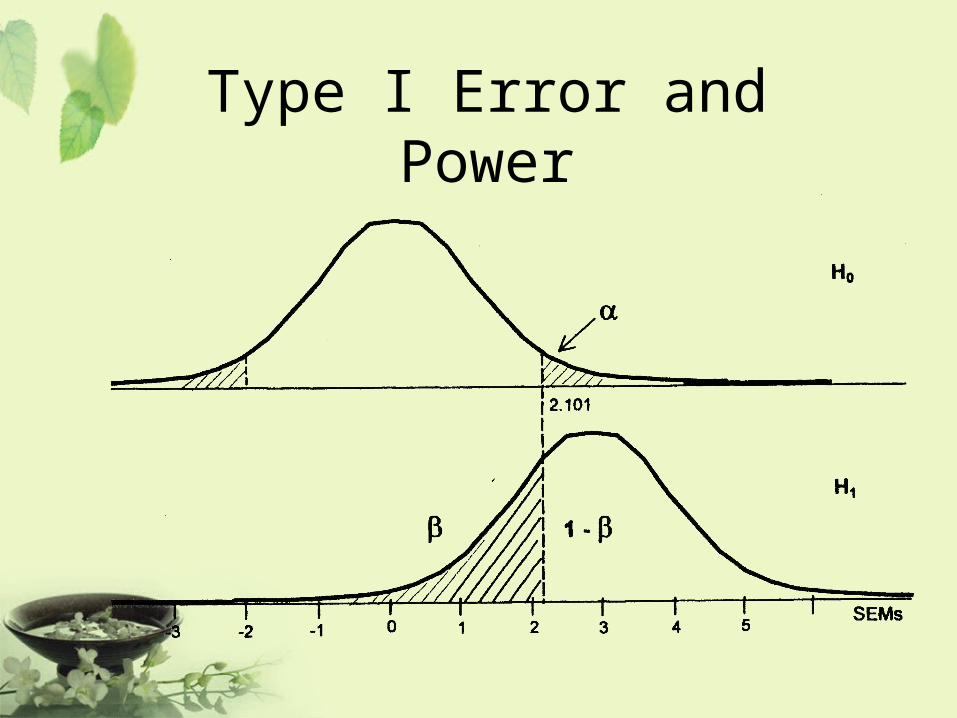
Type I Error and Power

Type I Error and Power
• Decrease type I error will result in increasing type II error, and consequently decreasing power.
• Increase sample size will decrease both type I and type II errors.
• Fixed type I error and select a sample size to achieve the desired power.
Confounding and Interaction
• Confounding– Confounding effects are defined as effects
which are contributed by various factors that cannot be separated by the design under study.
• Interaction– The interaction effect between factors is
defined as the joint effect contributed by more than one factor.
Confounding
• Lab Example– Dr. Anderson noticed that recent laboratory test results failed
to pass QC/QA requirements– Dr. Anderson decided to improve the laboratory procedure
by purchasing a more advanced equipment– The accuracy and precision of the laboratory test results
improve significantly and meet the QC/QA
• Question– It is not clear whether the improvement in laboratory test
results is due to the advanced new equipment or due to the analyst who has more experience than the previous analyst.
Interaction
• Quantitative interaction
Quantitative interaction between treatment and center (or study site) indicates that the treatment differences are in the same direction across centers but the magnitude differs from center to center.
• Qualitative interaction
Substantial treatment differences occur in different directions in different centers.

Center-by-Treatment Interaction
Quantitative interaction - centers could be combined.
Center 1 Center 2
Treatment
Treatment
Control
Control

Center-by-Treatment Interaction
Qualitative interaction - centers cannot be combined.
Center 1 Center 2
Drug A
Drug A
Drug B
Drug B

Confounding and Interaction• Study design should avoid or be able to
account for potential– Confounding factors– Interaction factors
• Objectives– To provide a valid and fair assessment of the
treatment effect– To assess the treatment difference efficiently
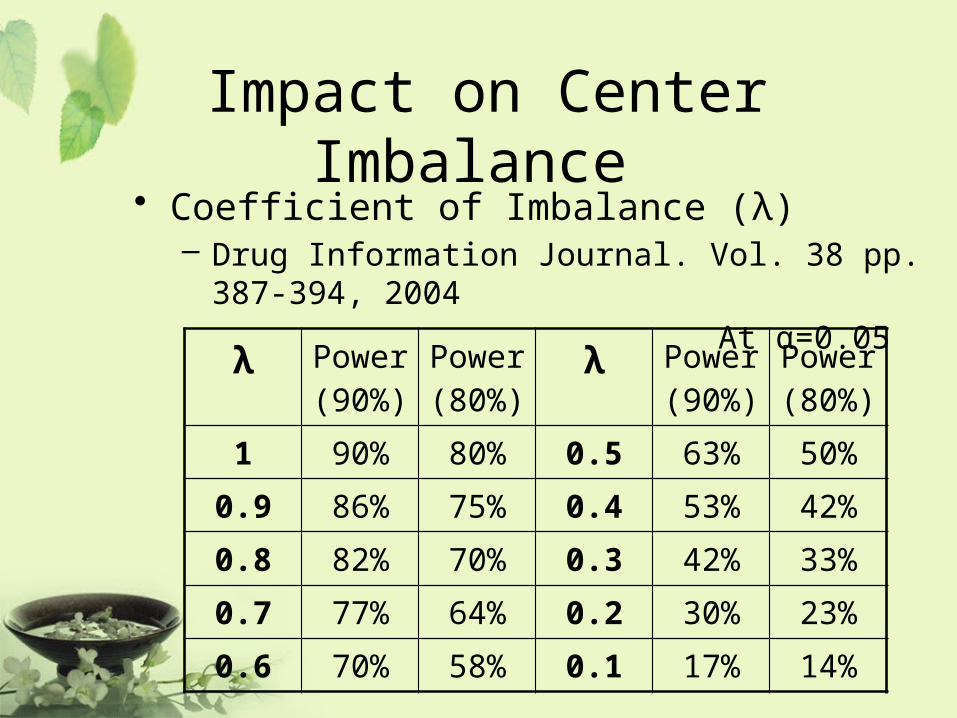
Impact on Center Imbalance • Coefficient of Imbalance (λ)
– Drug Information Journal. Vol. 38 pp. 387-394, 2004
At α=0.05
λ Power (90%)
Power (80%)
λ Power (90%)
Power (80%)
1 90% 80% 0.5 63% 50%
0.9 86% 75% 0.4 53% 42%
0.8 82% 70% 0.3 42% 33%
0.7 77% 64% 0.2 30% 23%
0.6 70% 58% 0.1 17% 14%

Example of Center Imbalance
SourceSample
SizeNo. of
Country1-α/2 1-β λ
Adjusted
Power
Trial I 885 29 0.95 0.8 0.90739 0.761
Trial II 143 9 0.95 0.8 0.45696 0.474
Trial III 518 25 0.95 0.8 0.86231 0.739
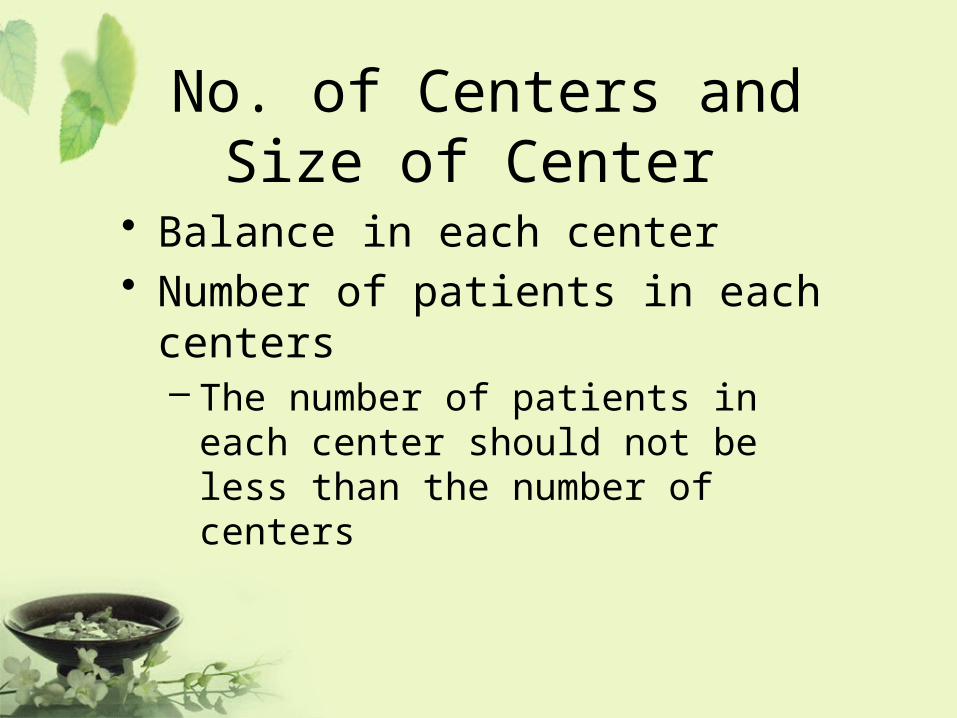
No. of Centers and Size of Center
• Balance in each center • Number of patients in each centers
– The number of patients in each center should not be less than the number of centers

Statistical Difference vs. Scientific Difference
• Clinical Scientists & Researchers– The observed difference is of clinical meaning and
yet not statistically significance (You must be out of your mind!)
– The observed difference is of little clinical meaning but it is statistically significant (Who cares?)
• Statisticians– P-value must be less than 0.05 in order to have
statistical meaning
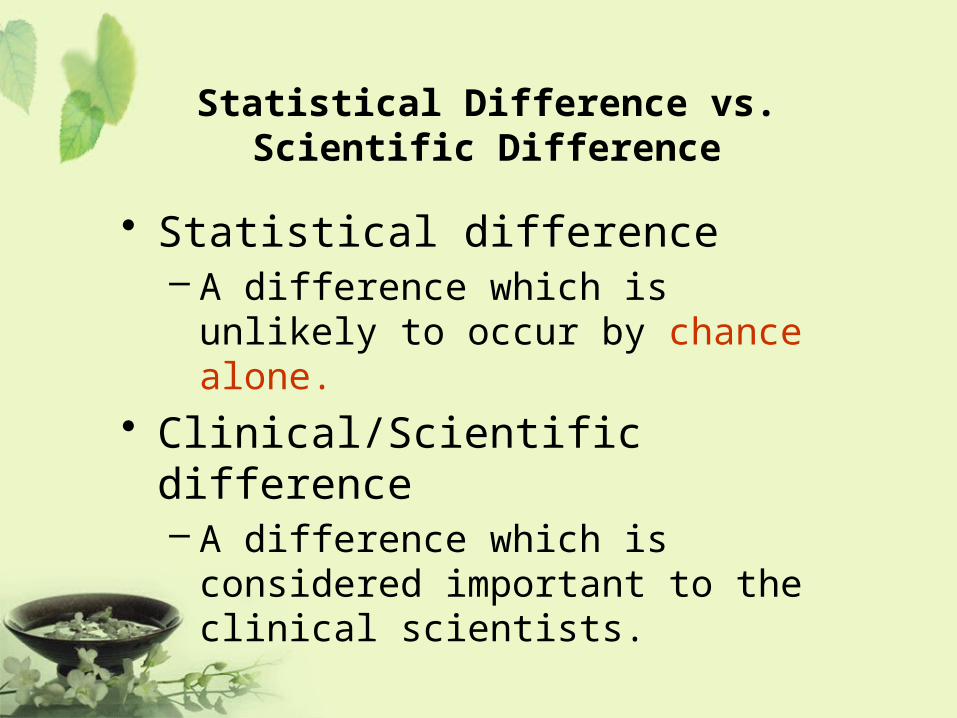
Statistical Difference vs. Scientific Difference
• Statistical difference– A difference which is unlikely to occur by
chance alone.
• Clinical/Scientific difference– A difference which is considered important
to the clinical scientists.
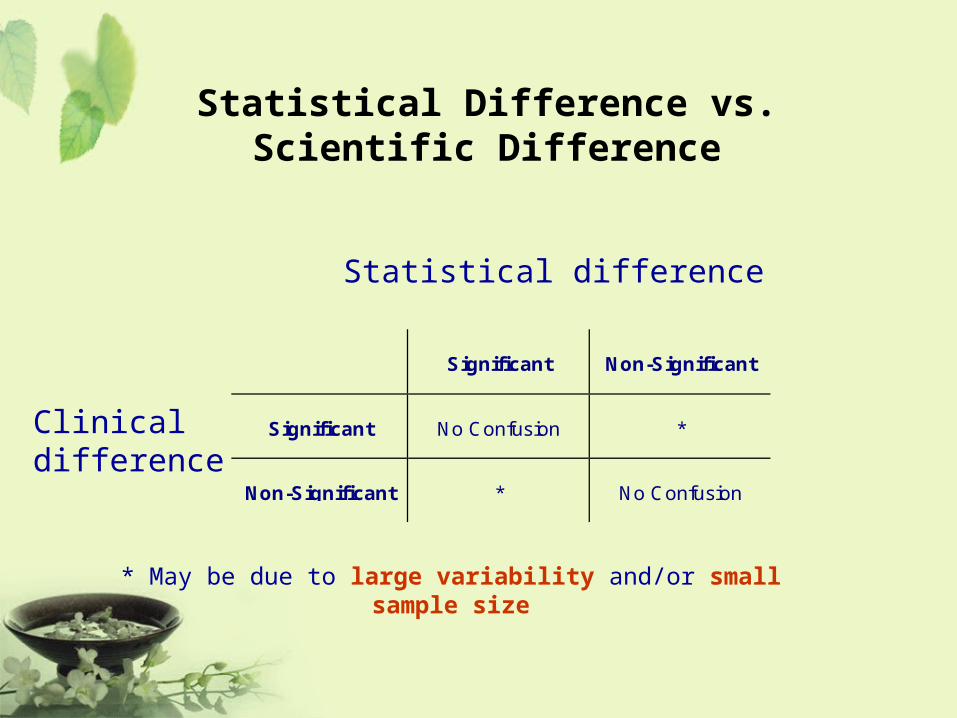
Statistical Difference vs. Scientific Difference
Significant Non-Significant
Significant No Confusion *
Non-Significant * No Confusion
Statistical difference
* May be due to large variability and/or small sample size
Clinicaldifference

Sample Size DeterminationInformation Required
• Study objectives– Test for equivalence– Test for non-inferiority– Test for superiority (clinically/statistically)
• Study design– Parallel or crossover– Group sequential design– Other designs
• Primary study endpoint(s)– Continuous or discrete– Multiple study endpoints

Sample Size DeterminationInformation Required
• Clinically meaningful difference– Clinically important difference– Non-inferiority/superiority margin– Equivalence/similarity limit
• Significance level– 1% or 5%
• Desired power– 80% or 90%
• Other information, e.g.,– Stratification?– 1:1 ratio or 2:1 ratio?– Log-transformation?

Parallel Design – Equivalence
Hypotheses
• : Population mean of the treatment• : Population mean of the control• : Equivalence limit.
CT1CT0 :H vs.:H
T
C

Parallel Design – Equivalence
Two one-sided test procedure (Schuirmann, 1987)
• Test statistics
• Reject the null hypothesis if
CT
CTCT2
CT
CTCT1
ˆ
ˆˆT
ˆ
ˆˆT
nn
nn
nn
nn
2nn,22nn,1 CTCTtT and tT

Parallel Design – Equivalence
Power
1
1
CT
CTCT
CT
CTCT
znn
nn
znn
nn

Parallel Design – Equivalence
Sample size calculation
CT
2CT
222/
C
where
)(
)/11()(
knn
kzzn
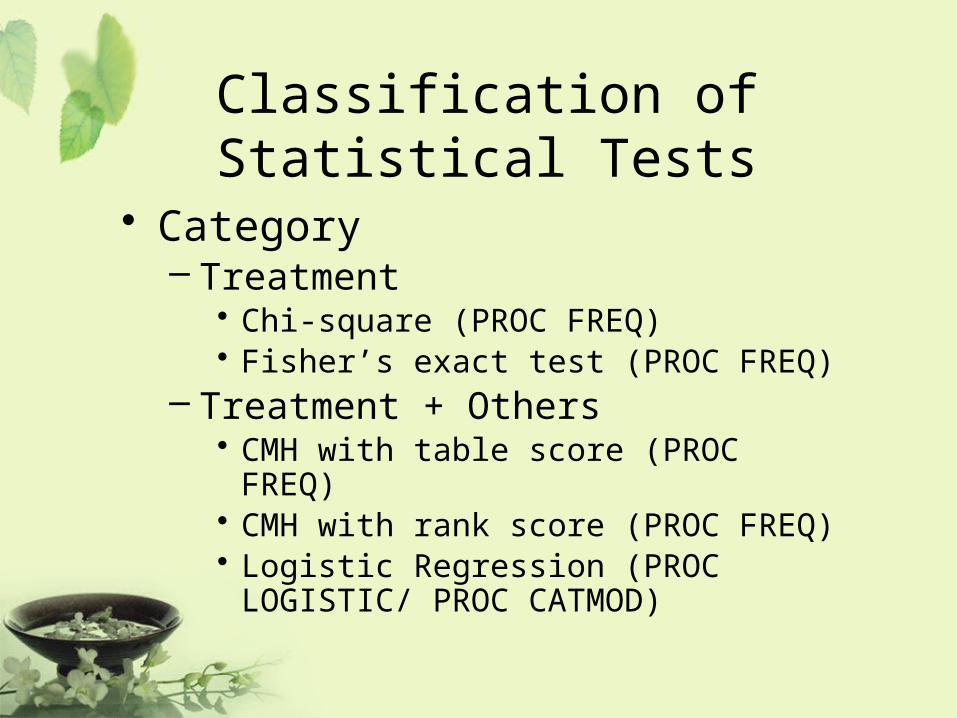
Classification of Statistical Tests
• Category– Treatment
• Chi-square (PROC FREQ)• Fisher’s exact test (PROC FREQ)
– Treatment + Others• CMH with table score (PROC FREQ)• CMH with rank score (PROC FREQ)• Logistic Regression (PROC LOGISTIC/ PROC
CATMOD)
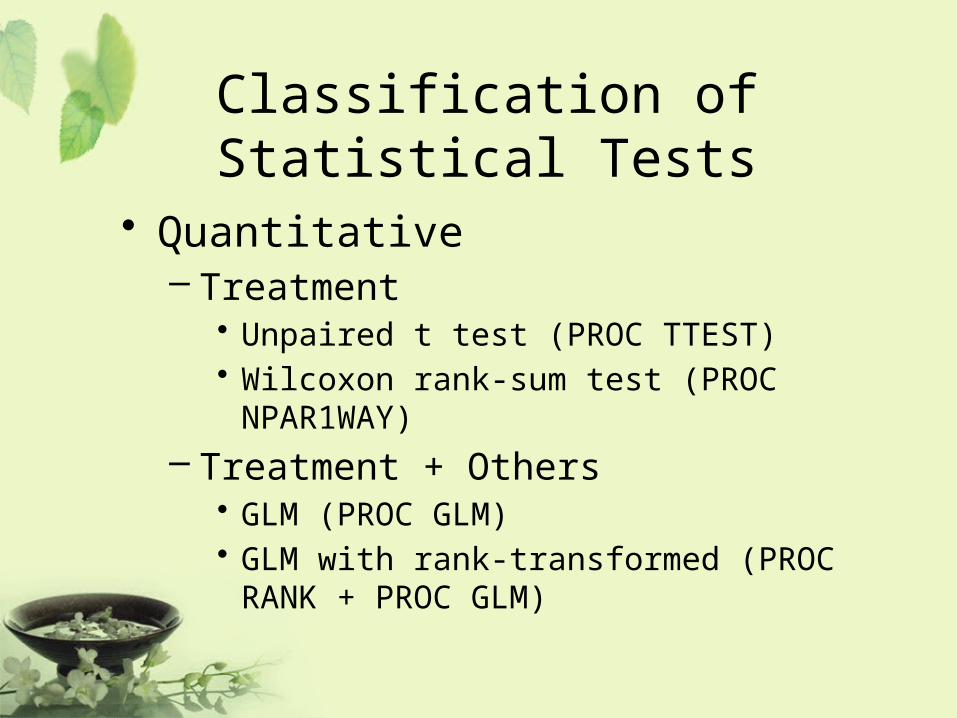
Classification of Statistical Tests
• Quantitative– Treatment
• Unpaired t test (PROC TTEST)• Wilcoxon rank-sum test (PROC NPAR1WAY)
– Treatment + Others• GLM (PROC GLM)• GLM with rank-transformed (PROC RANK +
PROC GLM)
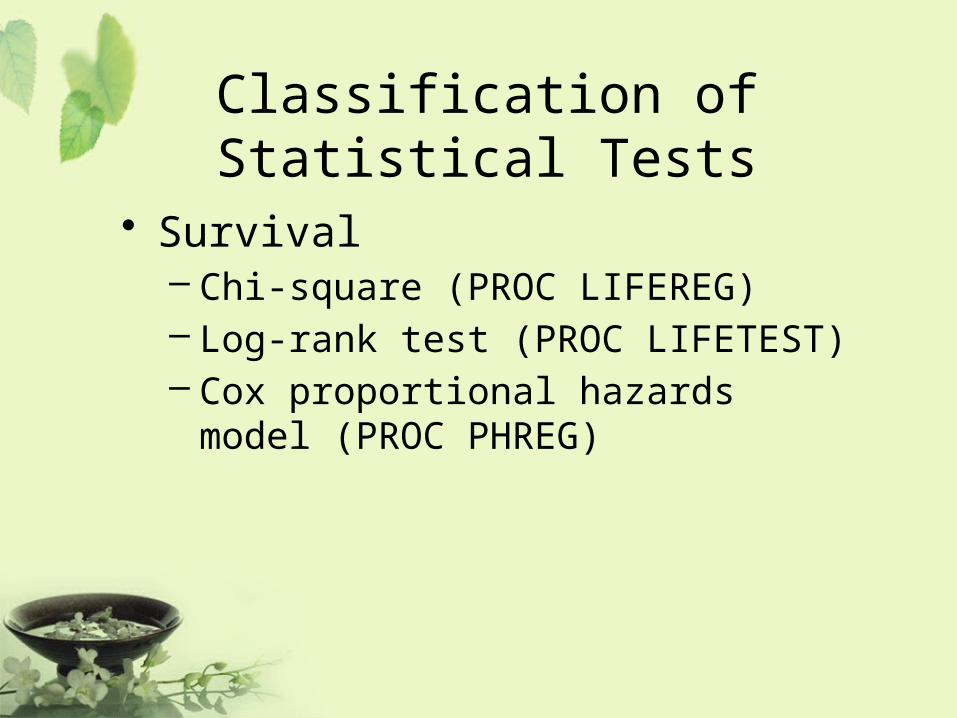
Classification of Statistical Tests
• Survival– Chi-square (PROC LIFEREG)– Log-rank test (PROC LIFETEST)– Cox proportional hazards model (PROC
PHREG)

The t test
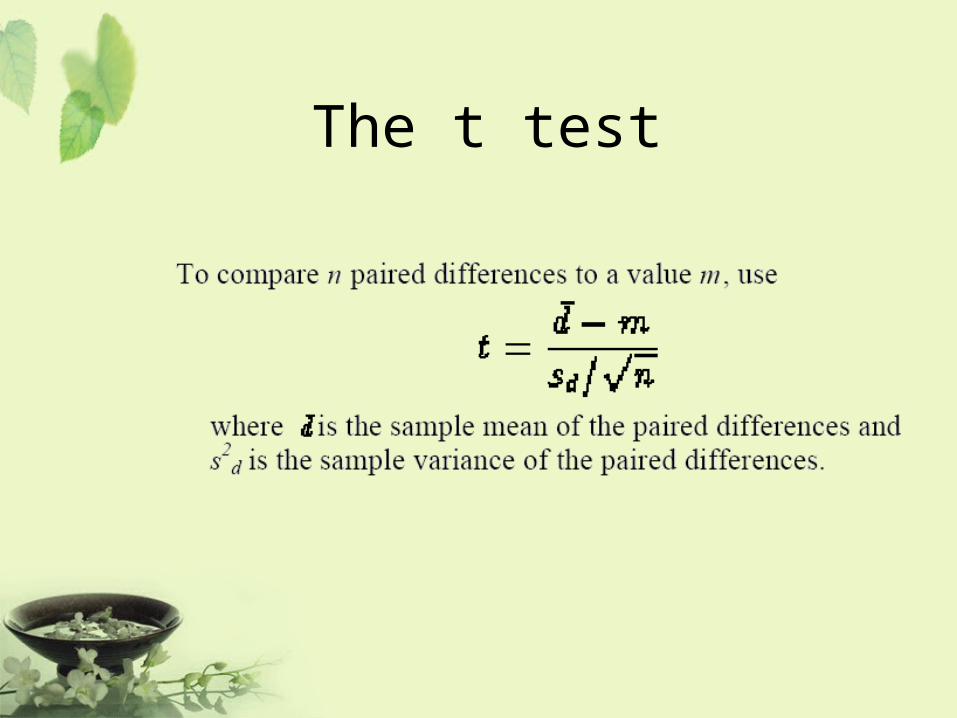
The t test
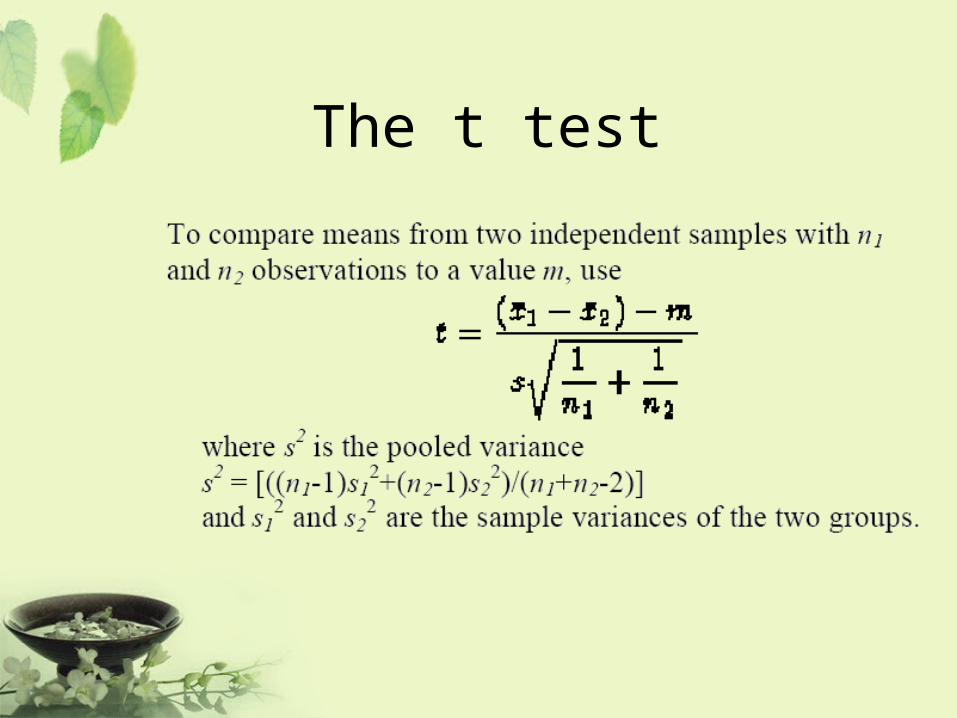
The t test
Example
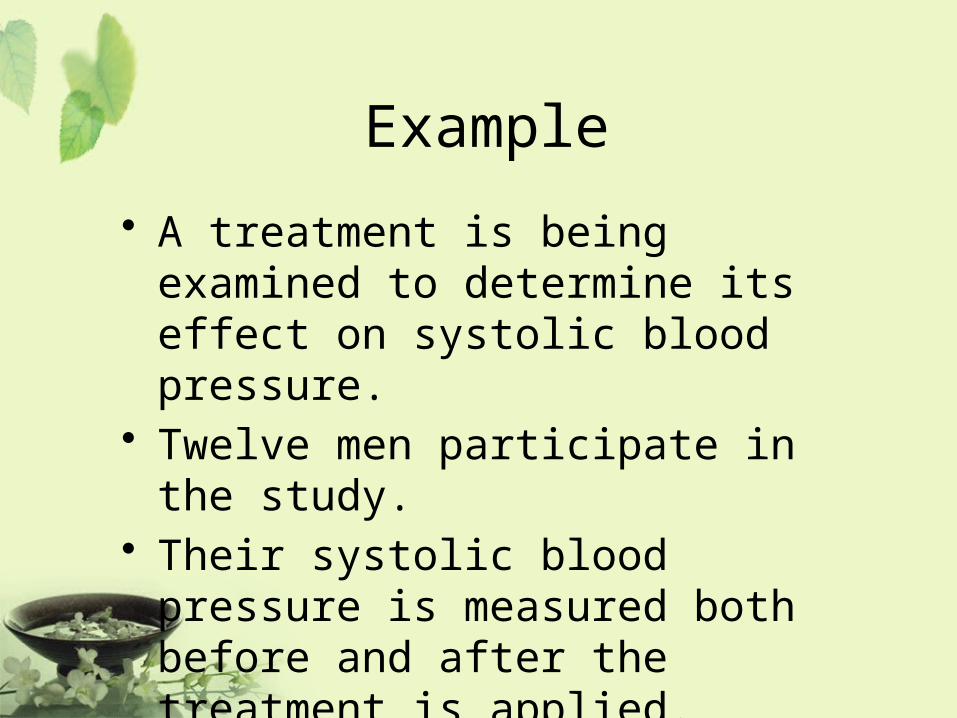
• A treatment is being examined to determine its effect on systolic blood pressure.
• Twelve men participate in the study.• Their systolic blood pressure is
measured both before and after the treatment is applied.
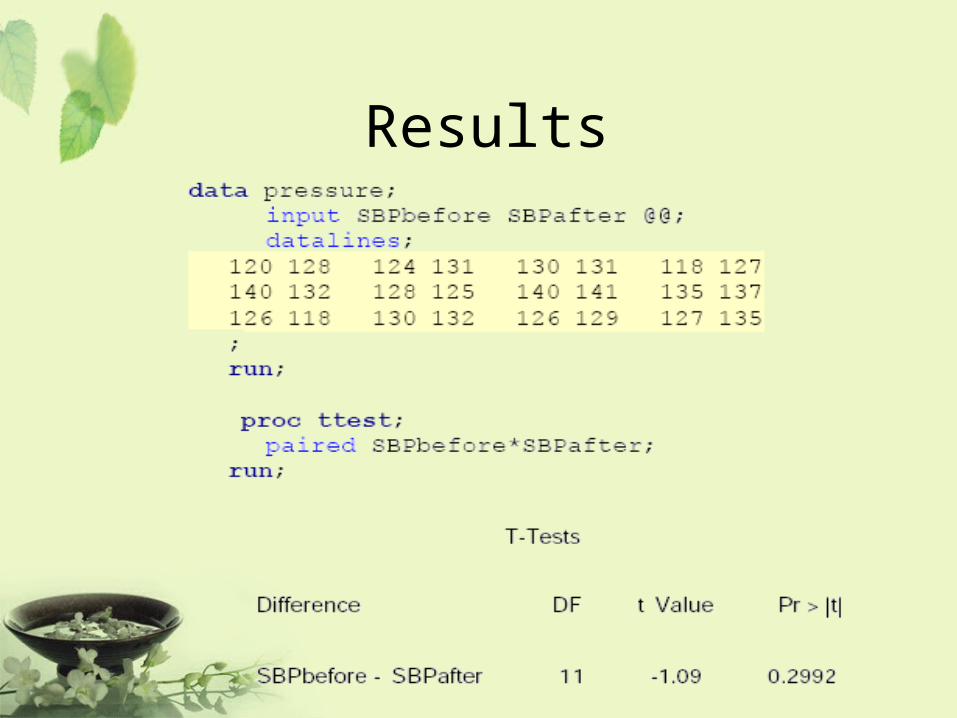
Results

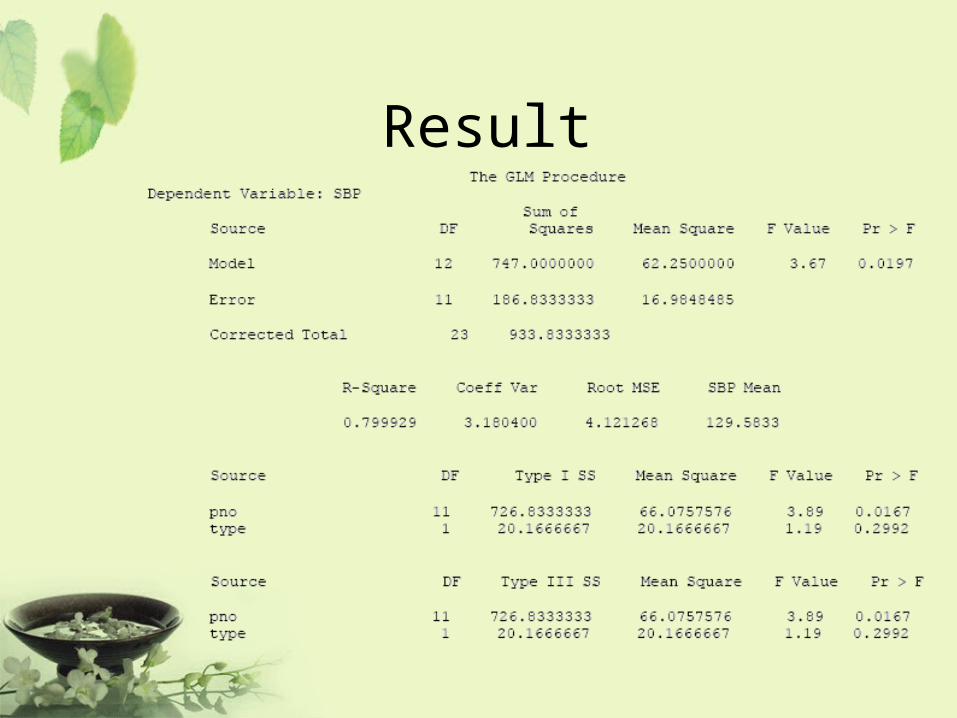
Result

Result
Result

ANCOVA• Analysis of covariance combines some of the features
of both regression and analysis of variance. Typically, a continuous variable (the covariate) is introduced into the model of an analysis-of-variance experiment.
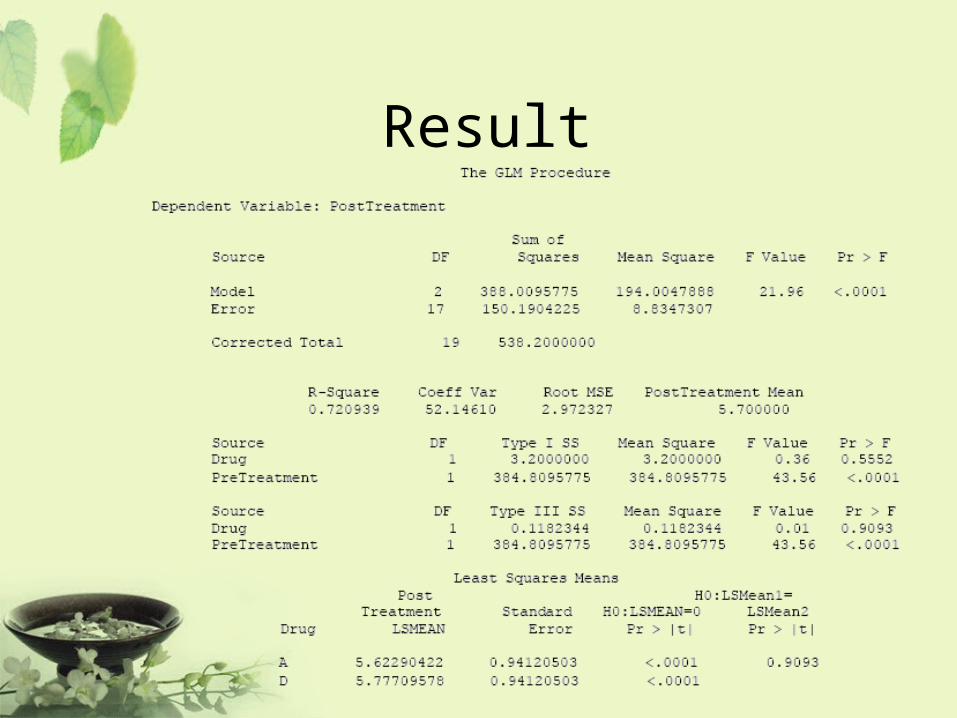
Example• Ten patients are selected for each treatment (Drug A
or D), and six sites on each patient are measured for leprosy bacilli.
• The covariate (a pretreatment score) is included in the model for increased precision in determining the effect of drug treatments on the posttreatment count of bacilli.

Result
Result

Analysis Population
• Intent To Treat (ITT) Set
• Full Analysis Set
• Per Protocol Set (PP)

Superiority
• In superiority trials the full analysis set is used in the primary analysis because it tends to avoid over-optimistic estimates of efficacy resulting from a per protocol analysis, since the non-compliers included in the full analysis set will generally diminish the estimated treatment effect.
Equivalence/Non-inferiority
• In an equivalence or non-inferiority trial use of the full analysis set is generally not conservative and its role should be considered very carefully.
• Subjects who withdraw or dropout of the treatment group or the comparator group will tend to have a lack of response, and hence the results of using the full analysis set may be biased toward demonstrating equivalence.

Concept
• Richard Peto指出 ITT population 分析只能用來找出不同,若找不出差異,並不代表兩種療法的效果一樣。
• Richard Peto所提出之觀念乃應用於癌症或AIDS之臨床試驗, 因該類型試驗在考量病人權益下,假設新療法用 來和標準療法比較,在試驗期間病人 對新療法 無反應,就轉回標準療法,在此試驗 設計下,若以ITT population 評估一定期間 ( 如二年 )之存活率,應屬不適當。

SAS Output Delivery System

What Is the Output Delivery System?
• Prior to Version 7, SAS procedures that produced printed output generated output that was designed for a traditional line-printer.
• Beginning with Version 7, procedure output became much more flexible. The Output Delivery System (ODS) has been designed to overcome the limitations of traditional SAS output and to make it easy to make new formatting options available to users.
• ODS is a method of delivering output in a variety of formats and of making the formatted output easy to access.
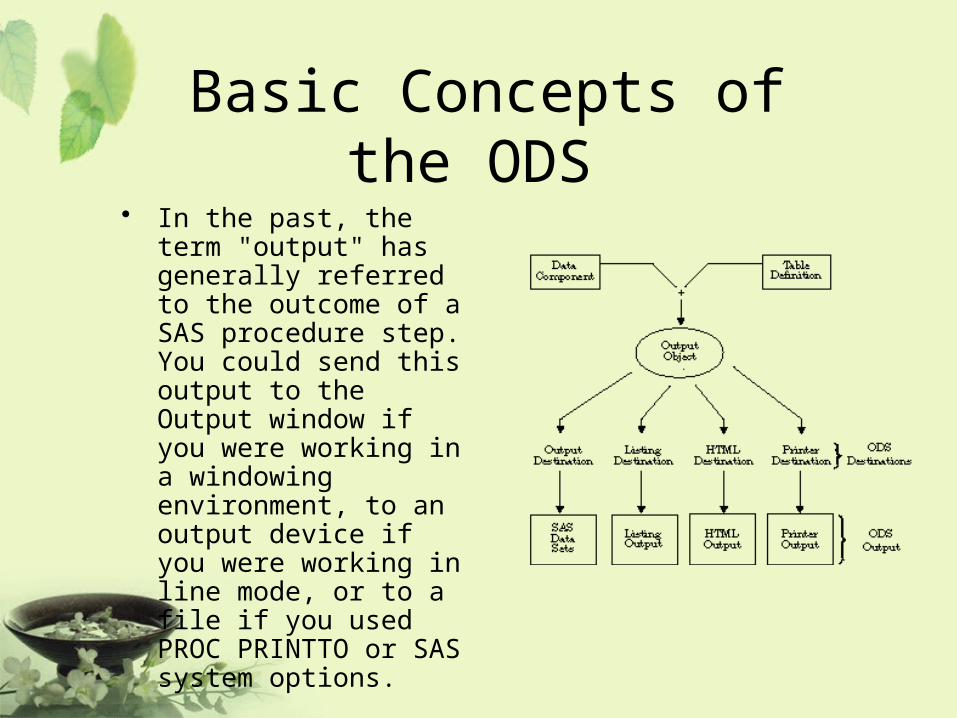
Basic Concepts of the ODS • In the past, the term "output"
has generally referred to the outcome of a SAS procedure step. You could send this output to the Output window if you were working in a windowing environment, to an output device if you were working in line mode, or to a file if you used PROC PRINTTO or SAS system options.
ODS Destinations• ODS currently supports four destinations:
– The Listing destination produces monospace output, which is formatted like traditional SAS procedure output. (ODS LISTING)
– The HTML destination produces output that is formatted in Hypertext Markup Language. (ODS HTML)
– The Printer destination produces output that is formatted for high-resolution printers. (ODS PRINTER)
– The Output destination produces SAS data sets. (ODS OUTPUT)
Example – t test
PROC TTEST DATA=AH01;
VAR LABVALUE CHANGE;
BY VISIT;
RUN;
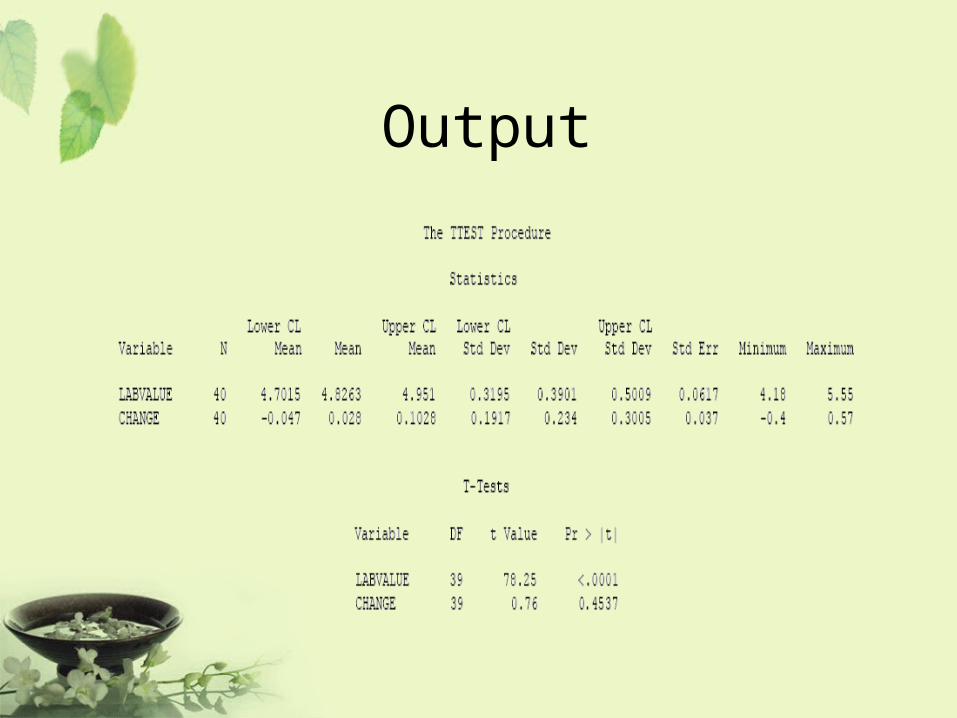
Output

ODS TRACE
ODS TRACE ON;
PROC TTEST DATA=AH01;
VAR LABVALUE CHANGE;
BY VISIT;
RUN;
ODS TRACE OFF;
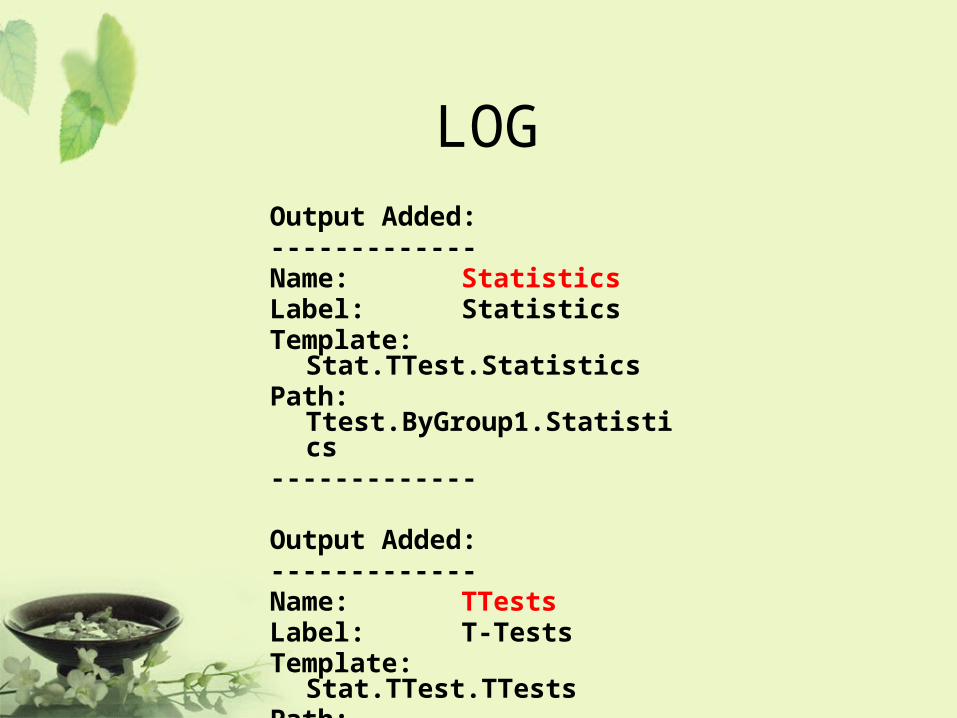
LOGOutput Added:-------------Name: StatisticsLabel: StatisticsTemplate: Stat.TTest.StatisticsPath: Ttest.ByGroup1.Statistics-------------
Output Added:-------------Name: TTestsLabel: T-TestsTemplate: Stat.TTest.TTestsPath: Ttest.ByGroup1.TTests-------------
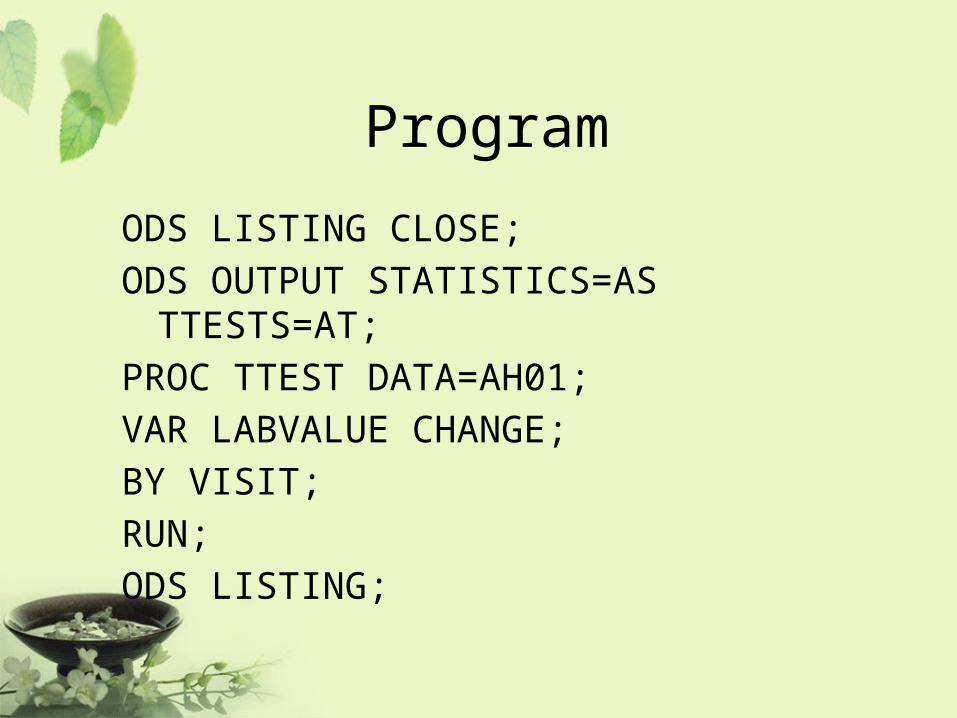
Program
ODS LISTING CLOSE;
ODS OUTPUT STATISTICS=AS TTESTS=AT;
PROC TTEST DATA=AH01;
VAR LABVALUE CHANGE;
BY VISIT;
RUN;
ODS LISTING;
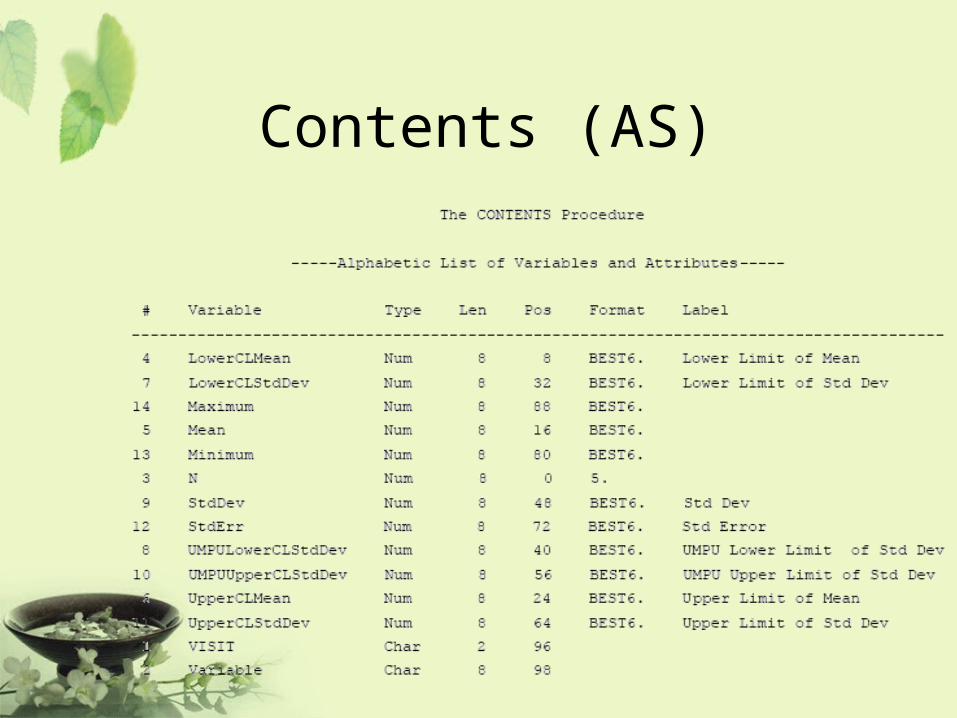
Contents (AS)
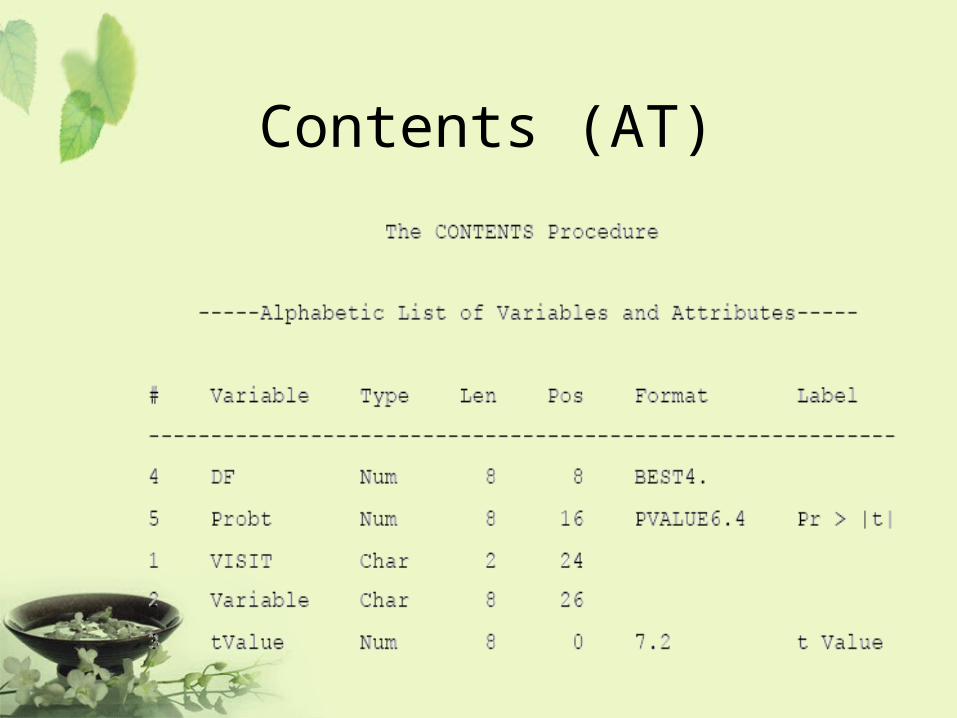
Contents (AT)

http://v8doc.sas.com/sashtml/