wellstarcollege.kennesaw.eduwellstarcollege.kennesaw.edu/about/docs/wchhs-grad... · Web...
24
2013-2014 Graduation Survey Report The Career Services Center 1
Transcript of wellstarcollege.kennesaw.eduwellstarcollege.kennesaw.edu/about/docs/wchhs-grad... · Web...
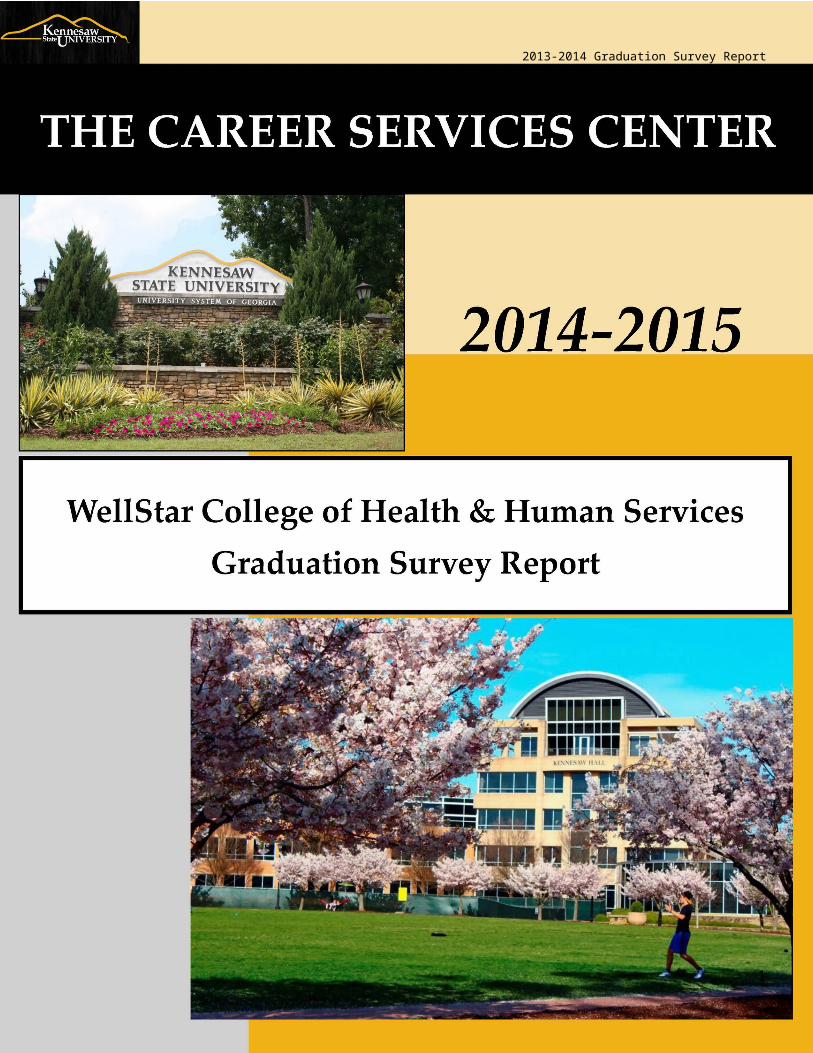
2013-2014 Graduation Survey ReportThe Career Services Center
1
2013-2014 Graduation Survey ReportThe Career Services Center
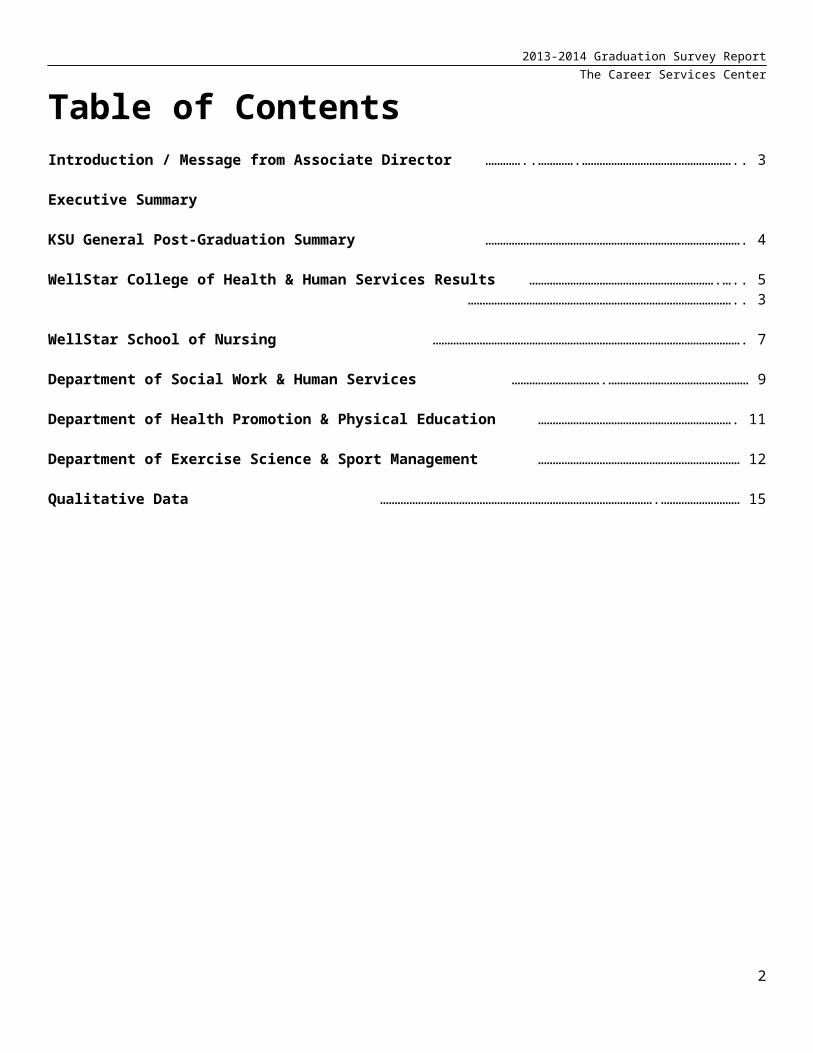
Table of ContentsIntroduction / Message from Associate Director …………..………….…………………………………………….. 3
Executive Summary
KSU General Post-Graduation Summary……………………………………………………………………………. 4
WellStar College of Health & Human Services Results ……………………………………………………….….. 5
……………………………………………………………………………….. 3
WellStar School of Nursing……………………………………………………………………………………………. 7
Department of Social Work & Human Services ………………………….………………………………………… 9
Department of Health Promotion & Physical Education…………………………………………………………. 11
Department of Exercise Science & Sport Management…………………………………………………………… 12
Qualitative Data ………………………………………………………………………………….……………………… 15
2

2013-2014 Graduation Survey ReportThe Career Services Center
IntroductionDear Kennesaw State University Faculty, Staff & Administration: Each semester, the KSU Career Services Center assesses the post-graduation career status of our recent graduates at each graduation ceremony. The purpose of the survey is to provide the KSU community with a glimpse of the career paths of our students at the time of their graduation. We survey each graduating class (Summer, Fall & Spring graduates) and collect information regarding employment status, graduate school attendance, and experiential education participation. The college reports are separated by departments and majors for ease of reading. This year we are also including majors from the Marietta campus. If there was a major offered at both campuses, the major report is being divided into the major report at the Kennesaw campus and the major report at the Marietta campus. We hope this information will encourage the KSU community to continue to support the Career Services Center’s efforts, as well as assist in providing evidence for learning outcomes as designated by the various accrediting bodies. While this data is not a comprehensive First Destination report, it is a snapshot of the graduating class at the time of graduation. Thank you for taking the time to review the attached. Please feel free to contact me with any questions or comments. Sincerely, Lori Trahan, PhDAssociate DirectorCareer Services CenterKennesaw State [email protected]
3

2013-2014 Graduation Survey ReportThe Career Services Center
Executive Summary of Findings At KSU, “success” means that our students are able to follow any path they may
choose, whether that next step is employment, pursuit of further education, or any other goal they may define for themselves. According to this definition, 75.8% of the 2014-2015 survey respondents are successful.
Common reasons students reported “Other” include: Gap Year, Moving to another state/country, and Starting Own Business.
CHHS majors reported a 52.1% “Employed” rate at graduation.
CHHS majors continue to report a high rate of participation in Experiential Education programs (87.2% for 2014-2015)
Within CHHS (excluding graduate programs):
Nursing majors reported the highest “Employed” and “Employed in Field of Choice” rates at graduation.
Exercise and Health Science majors reported the highest “Attending a Graduate Program” rate at graduation.
General Results Summary – Results based on survey respondents
4

2013-2014 Graduation Survey ReportThe Career Services Center
KSU Career Services Post-Graduation Survey (Summer 14, Fall 14, & Spring 15)During the 2014-2015 academic year (Summer 14, Fall 14, & Spring 15 semesters), KSU (both campuses) graduated 5422 students total (including graduate degrees if applicable). 3,750 students completed the Post-Graduation Survey.
Completion Rate: 3750 / 4468 = 69.1%EMPLOYMENT STATUS:
Employed = 58.6% (5.6% increase in the number of students reporting they were employed at graduation)
o Respondents reporting a job within their field of choice – 42.5% (21.4% increase in the number of students reporting they were employed in their field of choice at graduation)
o Respondents reporting other employment – 16.2% Unemployed = 24.2% (2% decrease in the number of students reporting they were
unemployed at graduation) Not Seeking Employment = 3.5% Attending a Graduate Program = 10.3% (31% decrease in the number of
students reporting they will be attending or applying to a graduate program)o Respondents reporting that they have been admitted to a graduate program
– 3.9%o Respondents reporting that they will be applying to a graduate program –
6.4% Other = 3.3%
EXPERIENTIAL EDUCATION PARTICIPATION (practical work experience):
Across all KSU majors = 58.3% *This is an 11.8% decrease in the number of students reporting they participated in Experiential Education.
5
01020304050 42.5
16.224.2
3.5 3.9 6.4 3.3
Employment Status
Perc
enta
ge

2013-2014 Graduation Survey ReportThe Career Services Center
College of Health & Human ServicesGeneral Results Summary – Results based on survey respondentsKSU Career Services Post-Graduation Survey (Summer 14, Fall 14, & Spring 15)During the 2014-2015 academic year, CHHS graduated 587 students (including graduate students). 461 students completed the Post-Graduation Survey.
Completion Rate: 432 / 650 = 73.4%
EMPLOYMENT STATUS: Employed = 52.1% (10.9% increase in the number of CHHS students reporting
employment at graduation)o Respondents reporting a job within their field of choice – 38.4% o Respondents reporting other employment – 13.7%
Unemployed = 28.2% Not Seeking Employment = 4.2% Attending a Graduate Program = 11.8%
o Respondents reporting that they have been admitted to a graduate program – 3.2%
o Respondents reporting that they will be applying to a graduate program – 8.6%
Other = 3.7%
6
01020304050 38.4
13.728.2
4.2 3.28.6
3.7
Employment Status
Perc
enta
ge

2013-2014 Graduation Survey ReportThe Career Services Center
EXPERIENTIAL EDUCATION PARTICIPATION (practical work experience):
Across all CHHS majors = 87.2% (3.1% decrease in the number of CHHS students reporting they participated in Experiential Education)
WellStar School of NursingNURSING (BSN) - Completion Rate: 121 / 210 = 57.6%Employment status:
7
2010-2011 2011-2012 2012-2013 2013-2014 2014-20150
20406080
10071
90 90.8 90 87.2
CHHS Experiential Education Partic-ipation
Perc
enta
ge

2013-2014 Graduation Survey ReportThe Career Services Center
Employed = 55.3% o Respondents reporting a job within their field of choice – 52.9% (36.3% increase
over 2013-2014)o Respondents reporting other employment – 2.5%
Unemployed = 38.8% Not Seeking Employment = 3.3% Attending a Graduate Program = 0.8%
o Respondents reporting that they have been admitted to a graduate program – 0.8%
o Respondents reporting that they will be applying to a graduate program – 0% Other = 1.7%
*Employed = Employed in field of choice & NOT in field of choice*Graduate School = Accepted into a program & planning on applying to a program
Experiential Education Participation (practical work experience): BSN majors (117/121) = 96.7%
MASTER OF NURSING (MSN) - Completion Rate: 26 / 34 = 76.5%Employment status:
Employed = 76.9% (a 53.8% increase over 2013-2014)o Respondents reporting a job within their field of choice – 42.3% o Respondents reporting other employment – 34.6%
Unemployed = 23.1% Not Seeking Employment = 0%
8
2010-2011 2011-2012 2012-2013 2013-2014 2014-20150
20406080
100 93 92 94 100 96.7
BSN Experiential Education Partic-ipation
Perc
enta
ge
2011-2012 2012-2013 2013-2014 2014-20150
102030405060708090
100
42
58.4
4255.351
38.146.6
38.8
6 7.2 4.6 0.82 4.8 6.9 5
Employment Status Trend
Employed UnemployedGraduate School Not Seeking Employment / Other
Perc
enta
ge

2013-2014 Graduation Survey ReportThe Career Services Center
Attending a Graduate Program = 0%o Respondents reporting that they have been admitted to a graduate program – 0%o Respondents reporting that they will be applying to a graduate program – 0%
Other = 0%
*Employed = Employed in field of choice & NOT in field of choice*Graduate School = Accepted into a program & planning on applying to a program
Experiential Education Participation (practical work experience): MSN majors (22/24) = 92% (2% increase over AY12)
DOCTORATE OF NURSING SCIENCE (DNS) - Completion Rate: 1 / 1 = 100%Employment status:
Employed = 100% o Respondents reporting a job within their field of choice – 100% o Respondents reporting other employment – 0%
Unemployed = 0% Not Seeking Employment = 0% Attending a Graduate Program = 0%
o Respondents reporting that they have been admitted to a graduate program – 0%o Respondents reporting that they will be applying to a graduate program – 0%
Other = 0%
9
2011-2012 2012-2013 2013-2014 2014-20150
102030405060708090
100
42.952.4 50
76.9
42.9 42.9 41.7
23.1
3 0 4.2 011
4.8 4.2 0
Employment Status Trend
Employed Unemployed Graduate School Not Seeking Employment / Other
Perc
enta
ge
2010-2011 2011-2012 2012-2013 2013-2014 2014-20150
20406080
10069
85 90.5 92 84.6
MSN Experiential Education Partic-ipation
Perc
enta
ge

2013-2014 Graduation Survey ReportThe Career Services Center
Experiential Education Participation (practical work experience): DNS majors (0/1) = 0%
Department of Social Work & Human ServicesHUMAN SERVICES - Completion Rate: 77 / 92 = 83.7%Employment status:
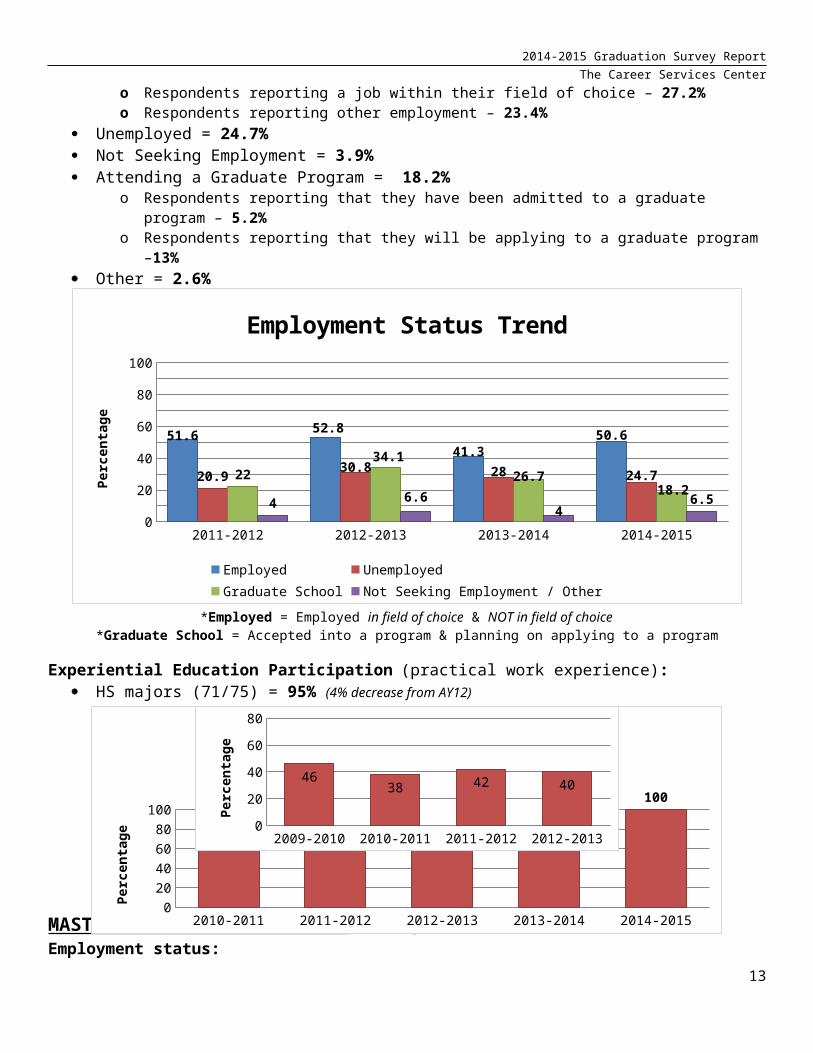
Employed = 50.6% (22.5% increase from 2013-2014)o Respondents reporting a job within their field of choice – 27.2% o Respondents reporting other employment – 23.4%
Unemployed = 24.7% Not Seeking Employment = 3.9% Attending a Graduate Program = 18.2%
o Respondents reporting that they have been admitted to a graduate program – 5.2%
o Respondents reporting that they will be applying to a graduate program –13% Other = 2.6%
10

2013-2014 Graduation Survey ReportThe Career Services Center
*Employed = Employed in field of choice & NOT in field of choice*Graduate School = Accepted into a program & planning on applying to a program
Experiential Education Participation (practical work experience): HS majors (71/75) = 95% (4% decrease from AY12)
MASTER OF SOCIAL WORK (MSW) - Completion Rate: 42 / 48 = 87.5%Employment status:
Employed = 59.5% (50.3% increase over 2013-2014)o Respondents reporting a job within their field of choice – 52.4% o Respondents reporting other employment – 7.1%
Unemployed = 33.3% Not Seeking Employment = 4.8% Attending a Graduate Program = 0%
o Respondents reporting that they have been admitted to a graduate program – 0%o Respondents reporting that they will be applying to a graduate program – 0%
Other = 2.3%
11
2009-2010 2010-2011 2011-2012 2012-20130
20
40
60
80
4638 42 40
Perc
enta
ge
2010-2011 2011-2012 2012-2013 2013-2014 2014-20150
20406080
100 88100 98.9 95 100
HS Experiential Education Partic-ipation
Perc
enta
ge
2011-2012 2012-2013 2013-2014 2014-20150
102030405060708090
100
51.6 52.841.3
50.6
20.930.8 28 24.722
34.126.7
18.24 6.6
46.5
Employment Status Trend
Employed UnemployedGraduate School Not Seeking Employment / Other
Perc
enta
ge

2013-2014 Graduation Survey ReportThe Career Services Center
*Employed = Employed in field of choice & NOT in field of choice*Graduate School = Accepted into a program & planning on applying to a program
Experiential Education Participation (practical work experience): MSW majors (42/42) = 100%
Department of Health Promotion & Physical Education
HEALTH & PHYSICAL EDUCATION (HPE) - Completion Rate: 16 / 16 = 100%Employment status:
Employed = 43.8% (5.2% decrease from 2013-2014)o Respondents reporting a job within their field of choice – 43.8% o Respondents reporting other employment – 0%
Unemployed = 43.8% Not Seeking Employment = 0% Attending a Graduate Program = 12.5%
o Respondents reporting that they have been admitted to a graduate program – 12.5%
o Respondents reporting that they will be applying to a graduate program – 0% Other = 0%
12
2011-2012 2012-2013 2013-2014 2014-20150
102030405060708090
100
55.5
70
39.6
59.5
44.4
25
56.1
33.3
0 0 0 005 4.2 7.1
Employment Status Trend
Employed UnemployedGraduate School Not Seeking Employment / Other
Perc
enta
ge
2010-2011 2011-2012 2012-2013 2013-2014 2014-20150
20406080
100 9685.7
95 98 100
MSW Experiential Education Partic-ipation
Perc
enta
ge
2013-2014 Graduation Survey ReportThe Career Services Center
*Employed = Employed in field of choice & NOT in field of choice*Graduate School = Accepted into a program & planning on applying to a program
Experiential Education Participation (practical work experience): HPE majors (16/16) = 100%
Department of Exercise Science & Sport Management
EXERCISE & HEALTH SCIENCE - Completion Rate: 85 / 118 = 72%Employment status:
Employed = 37.6% (23.1% decrease over 2013-2014)o Respondents reporting a job within their field of choice – 18.8% o Respondents reporting other employment – 18.8%
Unemployed = 18.1% Not Seeking Employment = 4.7% Attending a Graduate Program = 34.1%
o Respondents reporting that they have been admitted to a graduate program – 7.1%
o Respondents reporting that they will be applying to a graduate program – 27.1% Other = 5.9%
13
2011-2012 2012-2013 2013-2014 2014-20150
102030405060708090
100
28
42.8 46.2 43.84047.6
38.5 43.8
20 197.7 12.512 9.5 7.7
0
Employment Status Trend
Employed UnemployedGraduate School Not Seeking Employment / Other
Perc
enta
ge
2010-2011 2011-2012 2012-2013 2013-2014 2014-20150
20406080
10070
96 100 100 100
HPE Experiential Education Partic-ipation
Perc
enta
ge

2013-2014 Graduation Survey ReportThe Career Services Center
*Employed = Employed in field of choice & NOT in field of choice*Graduate School = Accepted into a program & planning on applying to a program
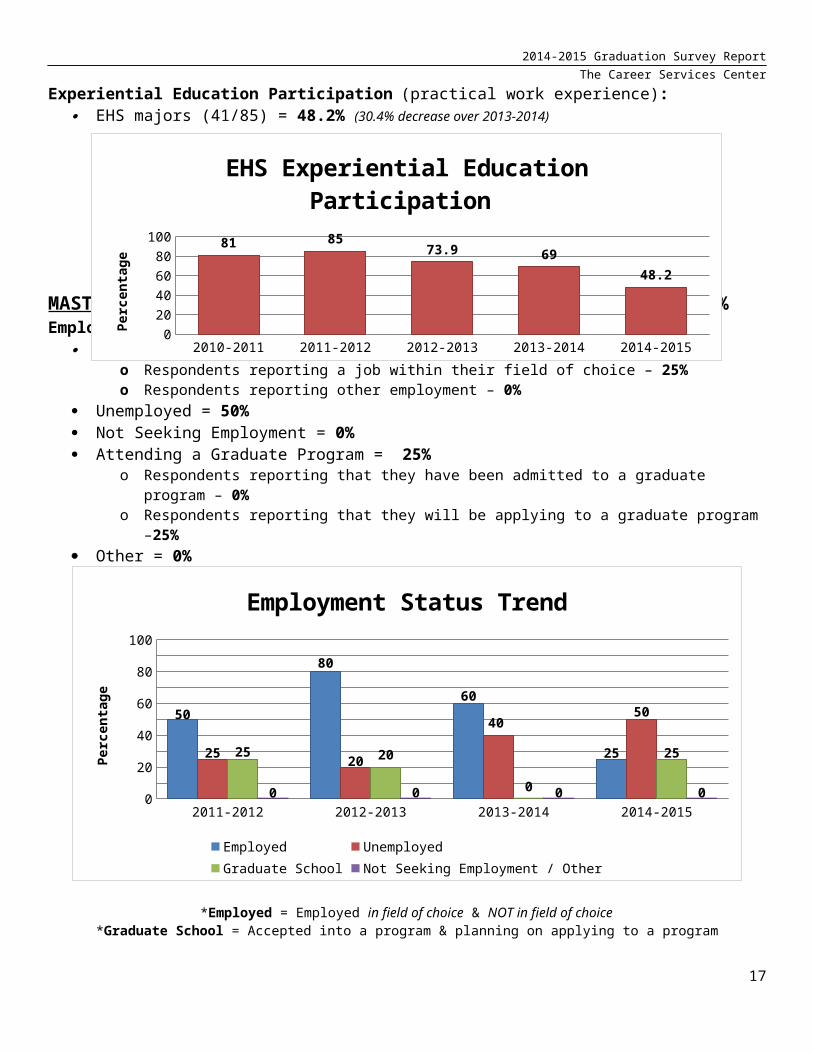
Experiential Education Participation (practical work experience): EHS majors (41/85) = 48.2% (30.4% decrease over 2013-2014)
MASTER OF APPLIED EXERCISE SCIENCE - Completion Rate: 4 / 4 = 100%Employment status:
Employed = 25% (58.3% decrease from 2012)o Respondents reporting a job within their field of choice – 25% o Respondents reporting other employment – 0%
Unemployed = 50% Not Seeking Employment = 0% Attending a Graduate Program = 25%
o Respondents reporting that they have been admitted to a graduate program – 0%o Respondents reporting that they will be applying to a graduate program –25%
Other = 0%
14
2011-2012 2012-2013 2013-2014 2014-20150
102030405060708090
100
32.540.3
47.737.6
22 2518.1 18.1
41.2 42.430.5 34.1
3.8 5.4 3.910.6
Employment Status Trend
Employed UnemployedGraduate School Not Seeking Employment / Other
Perc
enta
ge
2010-2011 2011-2012 2012-2013 2013-2014 2014-20150
20406080
100 81 8573.9 69
48.2
EHS Experiential Education Partic-ipation
Perc
enta
ge

2013-2014 Graduation Survey ReportThe Career Services Center
*Employed = Employed in field of choice & NOT in field of choice*Graduate School = Accepted into a program & planning on applying to a program
Experiential Education Participation (practical work experience): MSAES majors (2/4) = 50%
SPORT MANAGEMENT - Completion Rate: 60 / 64 = 93.8%Employment status:
Employed = 55% (10.9% decrease over 2013-2014)o Respondents reporting a job within their field of choice – 38.3% o Respondents reporting other employment – 16.7%
Unemployed = 20% Not Seeking Employment = 8.3% Attending a Graduate Program = 6.7%
o Respondents reporting that they have been admitted to a graduate program – 1.7%
o Respondents reporting that they will be applying to a graduate program – 10% Other = 0%
15
2011-2012 2012-2013 2013-2014 2014-20150
102030405060708090
100
50
80
60
2525 20
4050
25 20
0
25
0 0 0 0
Employment Status Trend
Employed UnemployedGraduate School Not Seeking Employment / Other
Perc
enta
ge
2010-2011 2011-2012 2012-2013 2013-2014 2014-20150
20406080
100100
8
60 6050
MSAES Experiential Education Participation
Perc
enta
ge

2013-2014 Graduation Survey ReportThe Career Services Center
*Employed = Employed in field of choice & NOT in field of choice*Graduate School = Accepted into a program & planning on applying to a program
Experiential Education Participation (practical work experience): SM majors (60/60) = 100%
QUALITATIVE DATA
Employer Information
Career Services asks students who are employed in the field of choice for the name of the company for whom they will be working. Below are the names of the employers. If an employer name has a number behind their name, that particular employer was mentioned by that number of students as having hired them. Employer names without a number were listed by one (1) student only. Majors not listed had no students reporting data in this category.
Exercise ScienceCentral Gymnastics AcademyFormwell Persona FitnessKennesaw State UniversityNorthpoint Fitness
Orange Theory FitnessPT SolutionsRapid Sports PerformanceThe BlitzUnion General Hospital
16
2011-2012 2012-2013 2013-2014 2014-20150
102030405060708090
100
47.1
63.4 61.755
29.4 26.8 23.3 2011.8
17 15 6.711.74.9 0
18.3
Employment Status Trend
Employed UnemployedGraduate School Not Seeking Employment / Other
Perc
enta
ge
2010-2011 2011-2012 2012-2013 2013-2014 2014-20150
20406080
10073.2
97 92.7 95 100
SM Experiential Education Partic-ipation
Perc
enta
ge
2013-2014 Graduation Survey ReportThe Career Services Center
US Army (2)US Marine CorpsWellStar Health Systems (2)
Health and Physical EducationBarrow County Schools Bartow County SchoolsCalhoun City SchoolsCherokee County SchoolsEmory HealthcarePaulding County SchoolsUniversity of Georgia
Human ServicesA Woman's TouchAppleseeds Learning Center (2)Beloved AtlantaChange Agents Inc.Cherokee FocusCobb County Community Service BoardCorrigan CareDFACSDouglas County DFACSenAble of GeorgiaGA Center for Child AdvocacyGilgal, Inc.Hospice AdvantageJaime & Santos, LLCKennesaw State UniversityPorter AcademyWellStar Health SystemsYWCA
NursingCandler HospitalChildren's Healthcare of Atlanta (8)Emory HealthcareEmory University HospitalFloyd Medical Center (2)Gordon Hospital (2)
Kaiser PermanenteKennestone Hospital (10)Northeast GA Medical Center (2)Northside Hospital (10)Northside Hospital-Cherokee (2)Northside Hospital--ForsythPiedmont Atlanta HospitalPiedmont Healthcare Group (2)US ArmyUT SouthwesternWellStar Health Systems (14)
Sport ManagementAtlanta BravesAtlanta HawksAtlanta SilverbacksAtlanta Sport & Social ClubBridgemill Athletics ClubBrookfield Country ClubCrystal Clear Imaging (2)DeltaDelta Tau Delta FraternityGeorgia SoccerKennesaw State UniversityKSU Softball ProgramLakepoint SportsLNL Agency (2)OSTAScore AtlantaUS LacrosseYMCA
Master of Science, Applied Exercise ScienceLifetime Fitness
Master of Science, NursingDekalb Medical CenterEmory Healthcare (2)Gwinnett Medical Center (2)Lifepoint Physicians Group
17

2013-2014 Graduation Survey ReportThe Career Services Center
Northside HospitalPiedmont Healthcare GroupPiedmont HospitalWellStar Health System (2)
Master of Social WorkAbbey HospiceBair FoundationBehavioral Health LinkBethany Christian ServicesCFVCCHRIS KidsFountain Gate Counseling Center
GA HopeGordon CountyGrady Memorial HospitalHighland RiversNorthside Psychological ServicesRiverwoods Behavioral HealthTalbot Recovery CampusVA Medical CenterWellspring LivingWellStar Health Systems
Doctorate of NursingArmstrong State University
QUALITATIVE DATA CONT.
Graduate School Information
Career Services asks students who have been accepted to a graduate school for the name of the school and program they are going to complete. Below are the names of the graduate schools and programs (if listed). If graduate school name has a number behind their name, that particular graduate school/program was mentioned by that number of students as having accepted them. School/program names without a number were listed by one (1) student only. Majors not listed had no students reporting data in this category.
Exercise ScienceAlabama State U/Occupational TherapyBelmont U/School of Physical TherapyChattanooga State U/PTA ProgramGA Regents U
18

2013-2014 Graduation Survey ReportThe Career Services Center
UTennessee/ Exercise Physiology
Health and Physical EducationGA State/Health & PEFIU/Master of Public Health
Human ServicesGA SouthernKSU/MSW ProgramUniversity of Alabama, BirminghamUtica College, Health Administration
NursingGrand Canyon University
Sport ManagementTroy University, MS-Management
QUALITATIVE DATA CONT.
Other
Career Services asks students to tell us what they will be doing after graduation if none of the provided options match their plans. Below is the list of information students provided in the “Other” category. If an option has a number behind their name, that particular option was mentioned by that number of students as being the option they are pursuing. Options without a number were listed by one (1) student only. Majors not listed had no students reporting data in this category.
Exercise ScienceEnrolling in Nursing SchoolMoving to another statePost Graduate Internship in field
Human ServicesMoving to another state
Nursing19

2013-2014 Graduation Survey ReportThe Career Services Center
Gap YearMoving to another state
Sport ManagementEnrolling in Paralegal ProgramGap YearPost Graduate Internship in field (2)Self-EmployedYear long mission trip
Master of Social WorkGap Year
20