IOOF · Osvaldo Acosta Portfolio Manager, Fixed Interest Ray King Portfolio Manager, Alternatives...
21
June 2018 IOOF MultiSeries IOOF MultiMix IOOF Cash Management IOOF Balanced Investor IOOF INVESTMENTS SNAPSHOT
Transcript of IOOF · Osvaldo Acosta Portfolio Manager, Fixed Interest Ray King Portfolio Manager, Alternatives...

June 2018 IOOF MultiSeries IOOF MultiMix IOOF Cash Management IOOF Balanced Investor
IOOFINVESTMENTS SNAPSHOT

2
IOOF InvestmentsInvestment management team
Our impressive investment capabilities are driven by our investment team and structure. Each asset class has a dedicated portfolio manager who enjoys strong support from a host of support staff including analysts, investment and marketing specialists.
Dan FarmerChief Investment Officer
Stanley YeoDeputy Chief Investment Officer and Portfolio Manager Strategy and International Equities
Paul CrisciPortfolio Manager Australian Equities
Juanita EscobarPortfolio Manager Internal Management Credit and Cash
Osvaldo AcostaPortfolio Manager Fixed Interest
Ray KingPortfolio Manager Alternatives
Simon GrossPortfolio Manager Property
Angus KnapmanSenior Property Manager
Rhodri PaynePortfolio Manager Internal Equity, Currency and Implementation
Tim CooperPerformance Analyst
Charles KnealeInvestments Specialist (VIC, SA, WA and TAS)
Tim CaseyInvestments Specialist (NSW, ACT and QLD)

3
IOOF Investments Snapshot | 30 June 2018
Contents
Market insights
Trade wars and the desynchronisation of global economic growth 4
Strategic tilting update
Cash and fixed interest 6
International shares 6
Currency 6
IOOF MultiSeries
Summary 7
Underlying investment managers 8
IOOF MultiSeries diversified trusts
IOOF MultiSeries 30 9
IOOF MultiSeries 50 9
IOOF MultiSeries 70 10
IOOF MultiSeries 90 10
IOOF MultiMix
Summary 11
Underlying investment managers 12
IOOF MultiMix single sector trusts
IOOF MultiMix Australian Shares 13
IOOF MultiMix International Shares 13
IOOF MultiMix Diversified Fixed Interest 14
IOOF MultiMix Cash Enhanced 14
IOOF Trust
IOOF Cash Management 15
MultiMix wholesale single sector trusts
Property 16
Alternatives and Defensive Equities 17
IOOF MultiMix diversified trusts
IOOF MultiMix Capital Stable 18
IOOF MultiMix Conservative 18
IOOF MultiMix Moderate 19
IOOF MultiMix Balanced Growth 19
IOOF MultiMix Growth 20
MySuper fund
IOOF Balanced Investor 20

4
Trade wars and the desynchronisation of global economic growth Inflation and economic growth continue to be the two main drivers of policymaking for the world’s major central banks. The level of inflation and central bank interest rate decisions will determine the global economy’s performance during the years to come.
It’s evident that the global economy is in better condition than during previous years, however the synchronised global growth that investors were previously expecting could disappoint. This is due to emerging trade barriers and more protectionist policies in the form of higher taxes on imports that may drag on global growth. This has caused the world’s major central banks to take different economic outlooks, in turn causing monetary policy divergence.
Some central banks are reducing ultra-accommodative policies and are stepping back from global bond markets by reducing asset purchases, reducing the size of their balance sheets and normalising interest rates. Other central banks are more cautious and are willing to continue with easy monetary policies, prolonged ultra-low interest rates and Quantitative Easing programmes.
The US Federal Reserve (Fed) has raised interest rates twice this year and it expects two more rate increases, for a total of four rate hikes during 2018. The Fed is expected to continue its gradual interest rate tightening for the next 18 months. This has been influenced by the strong US economy that continues to outperform global growth, accompanied by a persistently falling unemployment rate and fiscal stimulus. Simultaneously, the Fed is continuously reducing the size of its balance sheet. The Fed has recently adjusted its inflation expectations upwards to 2% from the previous forecast of 1.9% for 2018 as there are potential inflationary risks.
Likewise, the Bank of England has a more optimistic outlook for economic growth in the future. BoE hiked its reference rate to 0.75% and indicated more interest hikes to come. The inflation target of 2% is expected to be met later than previously anticipated, by 2020.
In contrast, the European Central Bank (ECB) doesn’t expect to raise its reference interest rate until mid-2019, however, it will reduce its asset purchases by the end of 2018, subject to economic developments. Additionally, the ECB’s economic growth forecast has been revised down. This is mainly due to the introduction by the US of steel and aluminium tariffs against Europe. The ECB has increased its inflation forecast to 1.7% from 1.4% for both 2018 and 2019, which was mainly driven by strong energy prices.
Similarly, the Bank of Japan (BoJ) has not made any changes to monetary policy. Despite a solid economic recovery, inflation remains weak in Japan and below its 2% target. The BoJ maintained its target yield around the 10 year government bond rate of 0%. However, it increased flexibility and explained that the yields may move depending on developments in economic activity and prices. It also maintained asset purchases.
Domestically, the Reserve Bank of Australia (RBA) doesn’t anticipate an interest rate increase anytime soon. Subdued wages growth is keeping inflation low for a prolonged period. The RBA's central scenario is for the Australian economy to grow more strongly this and next year with the unemployment rate trending lower. Future monetary policy decisions will be determined by the speed of increases in the employment rate, income growth and having inflation around the midpoint of the target range of 2% to 3% on a sustained basis. The RBA expects inflation to increase further to be close to 2.25% in 2020. In terms of the financial risks facing the economy, the RBA will continue to keep a close eye on the housing market, housing finance and the impact of changes in dwelling prices on consumption.
While the RBA may have rates on hold, local banks and Authorised Deposit-taking Institutions have been facing increased funding costs internationally since the first quarter of 2018. As a result, banks have been sourcing more of their funding requirements at a premium in Australia, leading to higher bank bill rates for local cash holders.

5
IOOF Investments Snapshot | 30 June 2018
Outlook for investorsIn summary, despite rising energy prices and a trade war that could eventually produce higher inflation, we believe income growth in most economies will continue to be subdued and therefore inflation will continue to be controlled. Conversely, for economies such as the US, where the economy is growing above trend and inflation is already trending higher driven by wage growth, we expect central banks to continue their gradual interest rate hikes. If inflation starts moving faster over central banks’ targets it may eventually trigger faster interest rate hikes. However, inflation is still currently running slightly below the Fed's target, measured by the price index for personal consumption expenditures.
With a trade war threatening the performance of the global economy, the reduction in the size of central bank balance sheets, and cash rate normalisation in some of the main economies, defensiveness, flexibility and diversification provide the best positioning.
In an increasing interest rate environment, there are different ways to protect fixed income portfolios from mark-to-market capital losses caused by interest rate increases. One strategy is to invest in short duration assets, another is to invest in fixed income Floating Rate Notes (FRN). These allow investors to adjust their income stream to receive higher interest, as the coupon payments are variable and indexed to the interest rate market and its movements. FRNs have a very low sensitivity to interest rate changes and have very low duration. Another option is to increase cash holdings. Cash contributes to portfolio construction as it offers flexibility for times when superior risk/reward investment opportunities arise.
IOOF trustsThe IOOF MultiMix Cash Enhanced Trust and the IOOF Cash Management Trust are fully diversified and defensively positioned with high-quality holdings designed to preserve capital. These trusts continue to have exposure to money market holdings and have participated in recent yield enhancements and higher margins paid by banks for short-term funding.
These trusts have outperformed the Bloomberg AusBond Bank Bill Index benchmark and the RBA cash rate over all periods. During the 12 months to 30 June 2018, the IOOF MultiMix Cash Enhanced Trust returned 2.54% and the IOOF Cash Management Trust returned 2.19% before fees, this compares favourably to the benchmark return of 1.78%, with the Trusts outperforming by 76 basis points and 41 basis points respectively.
Juanita EscobarPortfolio Manager Internal Management Credit and Cash

6
Strategic tilting update
Cash and fixed interest
Position
For both MultiMix and MultiSeries, there is an overweight to cash/short duration strategies, underweight to fixed interest.
Rationale
Our view is that Australian and US Government bond yields are very expensive. The US 10 year Government bond yield as at end of June was 2.85%, up from 2.74% at the end of March. We believe this may be the end of the bull market in fixed interest.
Current status
Since inception, the tilt to cash has underperformed as global bonds continue to produce positive returns. The underperformance, however, is somewhat mitigated by strong performance from the underlying cash managers, and strong returns from the IOOF Income Trust.
For MultiMix over the June quarter, the IOOF Income Trust returned 1.10% versus the diversified fixed interest strategic benchmark return of 0.48%.
For MultiSeries over the June quarter, the Metrics Credit Partners Diversified Australian Senior Loan Fund returned 1.32% and the Janus Henderson Income Fund returned 0.87% versus the MultiSeries Fixed Income strategic benchmark return of 0.48%.
International shares
Position
For MultiMix, tilt towards unhedged international shares from Australian shares. Tilt only in place for IOOF MultiMix Growth Trust, and has been reduced for IOOF MultiMix Balanced Growth Trust.
Rationale
While both Australian and international shares looked cheap on various valuation metrics, we believed international shares showed better value, particularly in the US. In addition, the high Australian dollar made investing offshore more attractive. Unhedged international equities also provides for a natural hedge. If equity markets fall, the Australian dollar tends to fall with it (as it is considered a risk asset), thus providing a hedge to investors.
Current status
Since inception, the tilt to unhedged international shares has outperformed due to both the international equities market outperforming the Australian equities market, and a sharp decline in the Australian dollar.
For the June quarter, the unhedged international shares benchmark underperformed the Australian shares benchmark by -4.09% (4.27% versus 8.36%).
Currency
Position
For MultiMix, the hedged benchmark remains at 10% of the developed equities portfolio versus the strategic benchmark of 50%. For MultiSeries, the hedged benchmark is at 35% versus the strategic benchmark of 50%.
Rationale
The key reasons for this continued position are:
• Australian cash rate no longer supportive v USD.
• Australian economy lagging – moderating housing market weighing on consumers, household gearing high, tightening consumer credit availability, wages flat.
• Impact on trade tensions between China and US problematic for Australia.
Current status
For the June quarter, the unhedged developed international shares benchmark outperformed the hedged developed international shares benchmark by 1.91% (5.53% versus 3.62%).

7
IOOF Investments Snapshot | 30 June 2018
IOOF MultiSeries Summary
Full details of the investment strategy, objectives and underlying managers for each Trust are provided in the trust profile which can be downloaded from www.ioof.com.au/investment-central
Trust APIR code Risk/return profile Estimated management costs % pa*1
Growth / Defensive
MultiSeries diversified
IOOF MultiSeries 30 IOF0253AU Low to medium 0.40
Growth 30%Defensive 70%
IOOF MultiSeries 50 IOF0254AU Medium 0.45
Growth 50%Defensive 50%
IOOF MultiSeries 70 IOF0090AU Medium to high 0.50
Defensive 30%Growth 70%
IOOF MultiSeries 90 IOF0255AU High 0.54
Growth 90%Defensive 10%
* The estimated management cost includes the investment management fee and indirect costs. See the latest IOOF MultiSeries PDS for full details on fees and costs. The management costs are based on the management costs incurred for each Trust as at 30 June 2018 and subject to change from time to time.

8
Underlying investment managersOver the last quarter the following changes were made to our underlying investment manager line-up.
New inclusion in the trusts: No changes
Removal from the trusts: No changes
Manager Style
IOO
F M
ultiS
erie
s 30
, 50,
70
and
90
IOOF Investment Management Limited Short-term money market securities
Cash
and
sho
rt-
term
sec
urit
ies
Janus Henderson Investors (Australia) Funds Management Limited
Active Australian fixed interest
Div
ersi
fied
fixed
in
tere
stMetrics Credit Partners Pty Limited Australian corporate loans
Western Asset Management Company Australian bonds
Brandywine Global Investment Management, LLC Top-down, value-driven
Invesco Australia Limited International core fixed income
IOOF Investment Management Limited Core
Prop
erty
Macquarie Investment Management Limited True index (Australian and global property securities)
Acadian Asset Management (Australia) Limited Small companies
Aus
tral
ian
shar
es
Janus Henderson Investors (Australia) Funds Management Limited
Mid cap passive enhanced, growth
Invesco Australia Limited Quantitative 130/30
IOOF QuantPlus Enhanced passive
Platypus Asset Management Pty Limited Quantitative/quality momentum
State Street Global Advisors, Australia, Limited Enhanced passive
UBS Global Asset Management (Australia) Ltd Fundamental high conviction
Goldman Sachs International Multi-factor global equities index
Inte
rnat
iona
l sha
res
Challenger Limited MSCI World ex Australia Net in AUD plus 0.4% per annum
Neuberger Berman Australia Pty Limited Emerging markets
State Street Global Advisors, Australia, Limited Defensive
TT International Emerging and developed markets
Invesco Australia Limited Global targeted return
Alt
erna
tive
s
Macquarie Investment Management Limited True index (global infrastructure)
Metrics Credit Partners Pty Limited Secured Australian private debt

9
IOOF Investments Snapshot | 30 June 2018
IOOF MultiSeries diversified trustsIOOF MultiSeries 30
Performance2
3 mths
%
6 mths
%
1 year
%
2 year
% pa
3 year
% pa
5 year
% pa
7 year
% pa
Distribution 2.51 2.51 3.58 na na na na
Growth -0.42 -0.48 1.52 na na na na
Total 2.09 2.03 5.10 na na na na
Comments
There were no changes over the quarter.
Contributors and Detractors
Contributors to performance
• The bulk of the outperformance was a result of the direct property portfolio significantly outperforming. This resulted from a combination of firming market demand from both purchasers and tenants for well located, modern, high quality properties and favourable uplifts in valuations over the quarter.
Detractors from performance
• The international equities and diversified fixed interest portfolios slightly underperformed their benchmarks.
IOOF MultiSeries 50
Performance2
3 mths
%
6 mths
%
1 year
%
2 year
% pa
3 year
% pa
5 year
% pa
7 year
% pa
Distribution 3.49 3.47 4.82 na na na na
Growth -0.34 -0.78 2.65 na na na na
Total 3.15 2.69 7.47 na na na na
Comments
There were no changes over the quarter.
Contributors and Detractors
Contributors to performance
• The bulk of the outperformance was a result of the direct property portfolio significantly outperforming. This resulted from a combination of firming market demand from both purchasers and tenants for well located, modern, high quality properties and favourable uplifts in valuations over the quarter.
Detractors from performance
• The international equities and diversified fixed interest portfolios slightly underperformed their benchmarks.
Actual allocation Target allocation
AustralianShares
Internationalshares
Property Alternatives Diversi�ed�xed
interest
Cash andshort-termsecurities
0
10
20
30
40
50
Actual allocation Target allocation
0
5
10
15
20
25
30
35
40
AustralianShares
Internationalshares
Property Alternatives Diversi�ed�xed
interest
Cash andshort-termsecurities
Actual versus target allocation Actual versus target allocation

10
IOOF MultiSeries 70
Performance2
3 mths
%
6 mths
%
1 year
%
2 year
% pa
3 year
% pa
5 year
% pa
7 year
% pa
Distribution 4.58 4.54 6.20 6.79 9.82 8.52 7.11
Growth -0.40 -1.28 3.41 2.38 -2.80 0.66 1.43
Total 4.17 3.26 9.61 9.17 7.02 9.17 8.55
Comments
There were no changes over the quarter.
Contributors and Detractors
Contributors to performance
• The bulk of the outperformance was a result of the direct property portfolio significantly outperforming. This resulted from a combination of firming market demand from both purchasers and tenants for well located, modern, high quality properties and favourable uplifts in valuations over the quarter.
Detractors from performance
• An underweight allocation to Australian equities detracted value as Australian equities was a strong performer for the quarter.
• The international equities portfolio underperformed its benchmark, detracting from performance.
IOOF MultiSeries 90
Performance2
3 mths
%
6 mths
%
1 year
%
2 year
% pa
3 year
% pa
5 year
% pa
7 year
% pa
Distribution 5.29 5.22 6.98 na na na na
Growth -0.04 -1.35 4.55 na na na na
Total 5.26 3.87 11.53 na na na na
Comments
There were no changes over the quarter.
Contributors and Detractors
Contributors to performance
• The bulk of the outperformance was a result of the direct property portfolio significantly outperforming. This resulted from a combination of firming market demand from both purchasers and tenants for well located, modern, high quality properties and favourable uplifts in valuations over the quarter.
• The Australian dollar depreciated over the quarter, so being less hedged versus benchmark contributed positively.
Detractors from performance
• The international equities portfolio underperformed its benchmark, detracting from performance.
Actual allocation Target allocation
0
5
10
15
20
25
30
AustralianShares
Internationalshares
Property Alternatives Diversi�ed�xed
interest
Cash andshort-termsecurities
Actual allocation Target allocation
0
5
10
15
20
25
30
35
40
AustralianShares
Internationalshares
Property Alternatives Diversi�ed�xed
interest
Cash andshort-termsecurities
Actual versus target allocation Actual versus target allocation

11
IOOF Investments Snapshot | 30 June 2018
IOOF MultiMix Summary
Full details of the investment strategy, objectives and underlying managers for each Trust is provided in the trust profile which can be download from www.ioof.com.au/investment-central
Trust APIR code Risk/return profile
Estimated management fees
%pa
Estimated performance-related fees
%pa^
Total estimated management costs (including performance-related fees) % pa*1
IOOF MultiMix single sector
IOOF MultiMix Cash Enhanced
IOF0091AU Low 0.36 Nil 0.36
IOOF MultiMix Diversified Fixed Interest
IOF0096AU Low/Medium 0.50 0.04 0.54
IOOF MultiMix Australian Shares
IOF0092AU High 0.82 0.28 1.10
IOOF MultiMix International Shares
IOF0098AU High 0.90 0.03 0.93
IOOF MultiMix diversified
IOOF MultiMix Capital Stable
IOF0094AU Low 0.52 0.01 0.53
IOOF MultiMix Conservative
IOF0095AU Low/Medium 0.73 0.08 0.81
IOOF MultiMix Moderate
UFM0051AU Medium 0.79 0.13 0.92
IOOF MultiMix Balanced Growth
IOF0093AU Medium/High 0.92 0.22 1.14
IOOF MultiMix Growth
IOF0097AU High 0.96 0.20 1.16
IOOF Cash Management and Balanced Investor
IOOF Cash Management (Class A)
PIM0002AU Low 0.30 N/A 0.30
IOOF Balanced Investor
IOF0232AU Medium/High 0.50 N/A 0.50
* Total estimated management costs include the management fee and any applicable performance-related fees. Refer to the applicable PDS for full details on fees and
costs. The total management costs are based on the management costs incurred for each Trust as at 30 June 2018 and are subject to change from time to time.
^ Performance-related fees may be charged by underlying investment managers of the IOOF MultiMix Trusts from time to time and may vary.

12
Underlying investment managersOver the last quarter the following changes were made to our underlying investment manager line-up.
New inclusion in the trusts: Metrics Credit Partners Real Estate Debt Fund and Metrics Credit Partners Secured Private Debt Fund II (both in Alternative Defensive).
Removal from the trusts: No changes
Manager Style
IOO
F M
ulti
Mix
Gro
wth
Tru
st
IOO
F M
ulti
Mix
Bal
ance
d G
row
th T
rust
IOO
F M
ulti
Mix
Mod
erat
e Tr
ust
IOO
F M
ulti
Mix
Con
serv
ativ
e Tr
ust
IOO
F M
ulti
Mix
Cap
ital
Sta
ble
Trus
t
IOO
F M
ultiM
ix D
iver
sifie
d Fi
xed
Inte
rest
Tru
st
IOO
F
Mul
tiMix
Cas
h En
hanc
ed T
rust
Janus Henderson Investors (Australia) Funds Management Limited
Active
Cash
and
shor
t-ter
m
secu
ritie
s
IOOF Investment Management Limited Short-term money market securities
Janus Henderson Investors (Australia) Funds Management Limited
Active Australian fixed interest
Div
ersi
fied
fixed
inte
rest
IOOF Investment Management Limited Income focusMetrics Credit Partners Pty Limited Australian corporate loansBrandywine Global Investment Management, LLC
Top-down, value-driven
Macquarie Investment Management Limited Active short-duration creditPIMCO Australia Pty Ltd Global bondsT. Rowe Price International Ltd International core fixed incomeLegg Mason Western Asset Management Company
Global total return
Western Asset Management Company US bank loans, Australian bonds and Global Total Returns
Fidante Partners Limited Broad cap core
Prop
erty
IOOF Investment Management Limited CoreLegg Mason Martin Currie Australia Limited Small capPendal Institutional Limited Active, value-driven, risk-controlledCohen & Steers Capital Management, Inc. Active, core, bottom-upResolution Capital Limited High conviction,
benchmark-unaware
IOO
F M
ultiM
ix A
ustr
alia
n Sh
ares
Tr
ust
AllianceBernstein Investment Management Australia Limited
Managed volatility
Aus
tral
ian
Shar
es
Acorn Capital Limited Micro-caps, active long onlyVinva Investment Management Limited QuantitativeJanus Henderson Investors (Australia) Funds Management Limited
Active, bottom-up, growth
Legg Mason Martin Currie Australia Limited Dynamic valueOC Funds Management Limited Small cap and micro-cap
DNR Capital Growth/qualityBoutique Manager Portfolio Diversified Australian sharesDefensive Equities Trust Defensive equities
IOO
F M
ultiM
ix In
tern
atio
nal
Sha
res T
rust
EAM Global Investors LLC Emerging markets small caps
Inte
rnat
iona
l Sha
resState Street Global Advisors, Australia,
LimitedDefensive
Wellington International Management Company Pte Ltd
Growth
Antipodes Partners Pragmatic value, absolute returnLSV Asset Management Quantitative valueTT International Growth at reasonable price and
concentrated quality
We have a large number of underlying managers for our exposure to alternative assets. These managers are not listed separately due to the size of the list and the fact that the allocation to each manager is small.
Alte
rnat
ives

13
IOOF Investments Snapshot | 30 June 2018
IOOF MultiMix single sector trustsIOOF MultiMix Australian Shares
Performance2
3 mths
%
6 mths
%
1 year
%
2 year
% pa
3 year
% pa
5 year
% pa
7 year
% pa
Distribution 11.24 11.12 13.57 10.15 7.78 6.13 5.30
Growth -4.52 -5.51 2.74 4.06 2.76 4.80 3.73
Total 6.72 5.61 16.31 14.21 10.54 10.93 9.03
Benchmark 8.36 4.27 13.24 13.53 9.14 9.99 8.97
Comments
An enhancement to the mandate with Selector was implemented over the quarter, which involved broadening the opportunity set in order to augment the excess return potential.
Contributors and Detractors
Contributors to performance
• Janus Henderson outperformed due to positive stock selection in consumer staples, financials and healthcare sectors.
• Selector Funds Management (part of the Boutique Manager Portfolio) outperformed due to positive stock selection in the industrials and consumer staples sectors.
Detractors from performance
• Overweight to niche segments hurt the portfolio as they underperformed the broader market.
• OC Funds Management, underperformed due to challenging stock selection in financials and an underweight to the energy sector.
IOOF MultiMix International Shares
Performance2
3 mths
%
6 mths
%
1 year
%
2 year
% pa
3 year
% pa
5 year
% pa
7 year
% pa
Distribution 22.80 23.23 26.02 26.42 23.81 16.01 11.71
Growth -20.49 -18.99 -12.08 -11.13 -13.12 -1.34 1.81
Total 2.31 4.24 13.94 15.29 10.69 14.67 13.52
Benchmark 4.27 5.42 15.00 15.16 9.64 14.32 14.13
Comments
There were no changes over the quarter.
Contributors and Detractors
Contributors to performance
• Despite emerging markets underperforming developed markets, emerging markets small caps manager EAM Investors significantly outperformed its benchmark.
• Wellington, TT International and Antipodes Asian Equities strategy outperformed their respective benchmarks.
Detractors from performance
• An overweight to emerging markets detracted the bulk of performance as emerging markets underperformed developed markets by 10.0% over the quarter.
• Antipodes Global, TT International emerging markets, SSgA defensive equities and LSV underperformed their respective benchmarks.
DNR Capital 11.79%
Legg Mason Martin Currie Australia Limited 13.93%
OC Funds Management
Limited 16.02%
Boutique Manager Portfolio 17.51%
IOOF Investment Management Limited 0.11%
AllianceBernstein Investment Management Australia Limited 4.23%
Acorn Capital Limited 6.93%
Vinva Investment Management Limited 17.91%
Janus Henderson Investors (Australia) Funds Management Limited 11.56%
IOOF Investment Management Limited 0.75%
State Street Global Advisors, Australia, Limited 15.39%
Wellington International Management Company Pte Ltd 16.68%
Antipodes Partners 19.91%
LSV Asset Management 15.14%
TT International 25.91%
EAM Global Investors LLC 6.21%
Investment manager allocation3 Investment manager allocation3

14
IOOF MultiMix Diversified Fixed Interest
Performance2
3 mths
%
6 mths
%
1 year
%
2 year
% pa
3 year
% pa
5 year
% pa
7 year
% pa
Distribution 0.57 1.15 2.98 3.60 5.58 5.43 5.71
Growth -0.36 -0.79 -0.86 -0.56 -1.81 -0.98 -0.33
Total 0.22 0.36 2.12 3.05 3.77 4.45 5.38
Benchmark 0.48 0.87 2.47 1.41 3.62 4.67 5.54
Comments
US investment grade credit had negative returns and US high yield and Australian credit both had positive returns. 10yr treasury yields increased from 2.74% to 2.86%, but Australian 10yr government bond yields marginally increased from 2.60% to 2.63% with curve flattening mainly at front end between 2-8 yrs.
Contributors and Detractors
Contributors to performance
• Our short duration and spread sectors were positive contributors.
Detractors from performance
• Currencies allocation via the global managers were the main detractors to performance.
• Western Asset GTR and Brandywine underperformed as US$ strengthened and EM currencies weakened.
IOOF MultiMix Cash Enhanced
Performance2
3 mths
%
6 mths
%
1 year
%
2 year
% pa
3 year
% pa
5 year
% pa
7 year
% pa
Distribution 1.28 1.76 2.31 2.24 2.52 2.77 3.41
Growth -0.74 -0.78 -0.13 0.09 -0.17 -0.06 0.00
Total 0.55 0.99 2.18 2.34 2.35 2.71 3.41
Benchmark 0.49 0.92 1.78 1.80 1.94 2.22 2.72
Comments
Outperformance was driven by the fund’s overweight allocation to high quality corporate floating rate notes and issuer selection in money market securities, providing a yield above bank bills.
Contributors and Detractors
Contributors to performance
• Overweight allocation to high quality corporate floating rate notes.
• Issuer selection in money market securities added value.
• Allocation to Term Deposits, NCDs and cash notice accounts has contributed positively to the performance over the quarter.
Detractors from performance
• There were no significant detractors from performance.
Janus HendersonInvestors (Australia)
Funds ManagementLimited 34.24%
T.Rowe PriceInternational Ltd 8.95%
PIMCO Australia Pty Ltd 11.34%
IOOF Investment Management Limited 10.38%
Western Asset Management Company 12.33%
Brandywine Global Investment Management, LCC 17.40%
Legg Mason Western Asset Management Company 5.36%
Janus Henderson Investors (Australia) Funds Management
Limited 78.59%
IOOF Investment Management Limited 21.41%
Investment manager allocation3 Investment manager allocation3

15
IOOF Investments Snapshot | 30 June 2018
IOOF TrustIOOF Cash Management
Performance2
3 mths
%
6 mths
%
1 year
%
2 year
% pa
3 year
% pa
5 year
% pa
7 year
% pa
Total 0.50 0.95 1.89 1.95 2.08 2.38 2.88
Benchmark 0.49 0.92 1.78 1.80 1.94 2.22 2.72
Comments
IOOF Cash Management Trust continues having exposure to money market holdings. The trust has participated in the recent yield enhancements and higher margins paid by banks for short-term funding.
Contributors and Detractors
Contributors to performance
• Allocation to Term Deposits, NCDs and cash notice accounts has contributed to the performance over the quarter.
• Recent yield enhancements and higher margins paid by banks for short-term funding has added value for the trust.
Detractors from performance
• There were no significant detractors from performance.
Allocation by Standards & Poors ratings3
TOTAL "A-1+" 50.1%
TOTAL "A-1" 26.5%
TOTAL "A-2" 23.5%
16
MultiMix wholesale single sector trustsProperty
Property – Australian
CommentsThe portfolio and sector generated very strong returns after having been heavily discounted in late 2017 and early 2018, broadly due to volatility in the bond markets.
Contributors to performance • Overweight allocations to Lendlease.• Underweight allocation to Dexus.• Position with the Westfield–Unibail merger.
Detractors from performance • Underweight position in Goodman industrial detracted.• Overweight allocation to Stockland and its residential
exposure.• Underweight allocation to Scentre which benefited from
the Westfield merger.
Investment manager allocation3
Fidante Partners Limited 63.2%
IOOF Investment Management Limited 0.4%
Legg Mason Martin Currie Australia Limited 36.4%
^ Exposure via the IOOF MIM Property Plus Fund
Property – International
CommentsThe portfolio generated strong returns having been discounted last calendar year due to concerns of inflation and accelerated US interest rate hikes.
Contributors to performance • Allocations to the Simon Retail property group in USA
added value.• Industrial stocks outperformed due to strong demand.• Hong Kong retail and healthcare allocations outperformed.
Detractors from performance • Lack of allocations to strongly performing self-storage.• European allocations detracted due to poor returns
compared to USA.
Investment manager allocation3
BT Investment Management (RE) Limited 20.2%
Cohen & Steers Capital Management, Inc. 26.9%
IOOF Investment Management Limited 0.4%
Resolution Capital Limited 52.4%
Property – Direct^
CommentsThe Australian direct property portfolio performed very well during the quarter due to increasing rental returns and rising market valuations.
Contributors to performance • Four external valuations were undertaken in June,
generating an increase in market value of $29.1m.
Detractors from performance • Minor vacancies and capital expenditure detracted value.
Allocation by property type3
VIC Industrial 18.8%
VIC Commercial 39.0%
NSW Commercial 33.6%
NSW Industrial 8.6%
17
IOOF Investments Snapshot | 30 June 2018
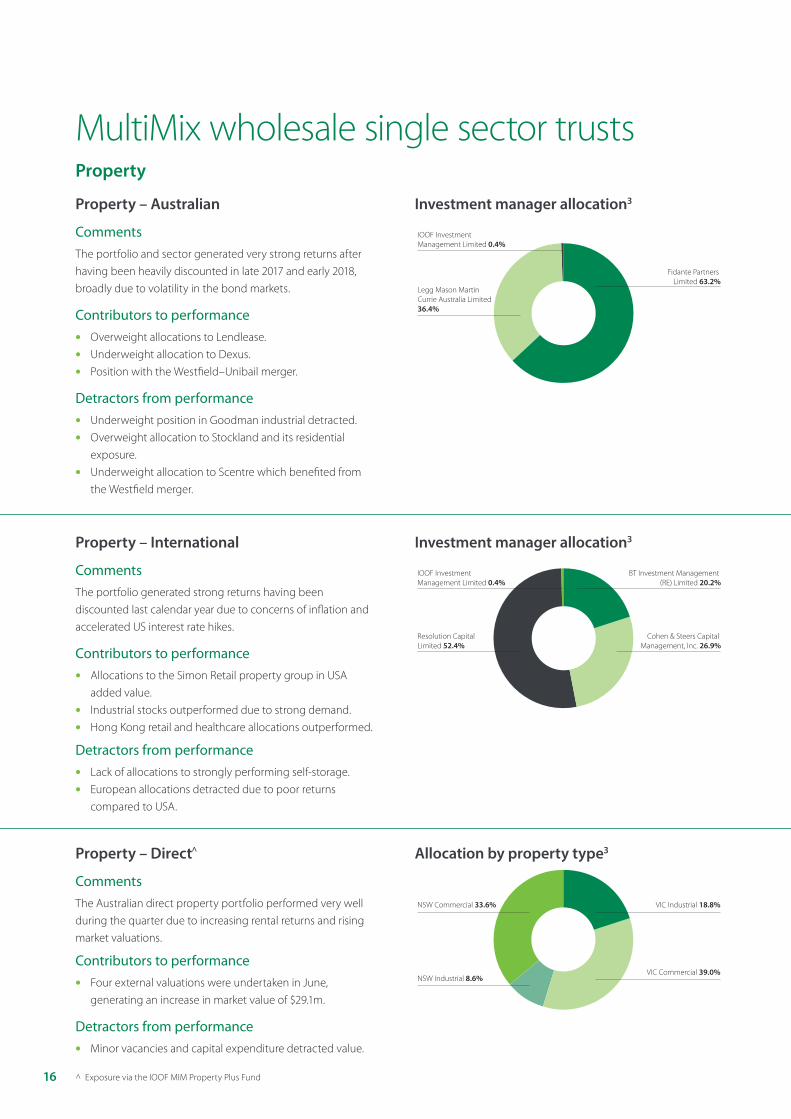
MultiMix wholesale single sector trustsAlternatives and Defensive Equities
Alternative – Growth
CommentsPerformance has been strong in the June quarter 2018 and for the financial year 2017-18, albeit strong returns from listed global equities makes relative performance seem mediocre.
Contributors to performance • Reduced allocation to hedge funds.• Strong private equity manager performance.
Detractors from performance • Remaining hedge funds performed poorly.• Cash in the portfolio had low return.
Investment manager allocation3
Private equity 56.6%
Cash and short-term securities 14.4%
Discretionary hedge 27.8%
Special situations 1.2%
Alternative – Defensive
CommentsPerformance was solid for the financial year and in the June quarter 2018.
Contributors to performance • Good relative performance from energy and infrastructure
managers.
Detractors from performance • Private debt manager outperformed the benchmark
but was slightly behind target outperformance.• Cash in the portfolio had a low return.
Investment manager allocation3
Infrastructure 12.3%
Subordinated debt 29.1%
Cash and short-term securities 12.9%
Private debt 37.4%
Discretionary hedge 3.0%
Credit opportunities (hedge fund) 5.3%
Defensive Equities
CommentsThere were no changes to the portfolio over the quarter.
Contributors to performance • Low volatility manager, AB, outperformed both the blended
equity and bond benchmark and broader equity market due to an overweight to healthcare, an underweight to financials and positive stock selection in telcos.
Detractors from performance • Low volatility manager, SSgA, underperformed the equity
index but outperformed the blended bond index.
Investment manager allocation3
AllianceBernstein Investment Management
Australia Limited 41.25%
Cash and short-term securities 1.66%
State Street Global Advisors, Australia, Limited 28.74%
Plato Investment Management Limited 28.35%

18
IOOF MultiMix diversified trustsIOOF MultiMix Capital Stable
Performance2
3 mths
%
6 mths
%
1 year
%
2 year
% pa
3 year
% pa
5 year
% pa
7 year
% pa
Distribution 1.98 1.98 3.48 3.74 4.78 5.02 5.19
Growth -0.07 -0.21 0.64 0.82 -0.11 0.08 0.35
Total 1.91 1.77 4.11 4.56 4.67 5.11 5.54
Benchmark 1.49 1.39 3.69 3.13 4.00 4.73 5.25
Comments
There were no changes over the quarter.
Contributors and Detractors
Contributors to performance
• The bulk of the outperformance was a result of the direct property portfolio significantly outperforming. This resulted from a combination of firming market demand from both purchasers and tenants for well located, modern, high quality properties and favourable uplifts in valuations over the quarter.
• An overweight to Australian equities (via the Defensive Equities portfolio) contributed to performance.
Detractors from performance
• There were no significant detractors.
IOOF MultiMix Conservative
Performance2
3 mths
%
6 mths
%
1 year
%
2 year
% pa
3 year
% pa
5 year
% pa
7 year
% pa
Distribution 3.85 3.85 5.53 5.80 6.92 6.88 6.30
Growth -1.45 -1.46 -0.08 -0.01 -1.65 -0.74 0.15
Total 2.40 2.39 5.44 5.79 5.27 6.14 6.45
Benchmark 2.07 1.79 5.26 4.84 5.20 6.22 6.63
Comments
During the quarter, two new investments were made in the Alternative Defensive portfolio: Metrics Credit Partners Real Estate Debt Fund, and Metrics Credit Partners Secured Private Debt Fund II.
Contributors and Detractors
Contributors to performance• Outperformance was mostly due to the direct property
portfolio significantly outperforming.
• Alternative Defensive outperformed with EIG Energy Fund performing particularly well.
• An underweight to diversified fixed interest contributed to performance as the asset class underperformed other asset classes.
Detractors from performance• The international equities portfolio underperformed.
• An overweight to the Income Trust detracted, partly offset by good performance from the underlying managers in the Income Trust.
Actual versus target allocation Actual versus target allocation
Actual allocation Target allocation
Alternative - defensive
Internationalshares
Australian shares
Property Cash andshort-termsecurities
Diversi�ed �xed
interest
0
10
20
30
40
50
60
Defensive Actual allocation Target allocation
Alternative - defensive
International shares
Australian shares
Property Diversi�ed�xed
interest
Cash andshort-termsecurities
0
10
20
30
40
50
Defensive

19
IOOF Investments Snapshot | 30 June 2018
Actual versus target allocation Actual versus target allocation
IOOF MultiMix diversified trustsIOOF MultiMix Moderate
Performance2
3 mths
%
6 mths
%
1 year
%
2 year
% pa
3 year
% pa
5 year
% pa
7 year
% pa
Distribution 5.36 5.37 7.28 7.52 8.48 6.55 5.91
Growth -1.88 -1.86 0.96 0.62 -1.75 1.36 1.67
Total 3.49 3.51 8.24 8.14 6.73 7.91 7.58
Benchmark 3.39 2.61 8.18 8.06 7.01 8.58 8.61
Comments
During the quarter, two new investments were made in the Alternative Defensive portfolio: Metrics Credit Partners Real Estate Debt Fund, and Metrics Credit Partners Secured Private Debt Fund II.
Contributors and Detractors
Contributors to performance
• Direct property portfolio significantly outperformed.
• Alternative Defensive outperformed.
• An underweight to diversified fixed interest contributed as the asset class underperformed other asset classes.
• The AUD depreciated over the quarter, so being less hedged versus benchmark added value.
Detractors from performance
• The international equities portfolio underperformed.
• An overweight to the Income Trust detracted, partly offset by good performance from the underlying managers in the Income Trust.
IOOF MultiMix Balanced Growth
Performance2
3 mths
%
6 mths
%
1 year
%
2 year
% pa
3 year
% pa
5 year
% pa
7 year
% pa
Distribution 10.49 10.53 12.62 12.59 14.32 10.25 8.26
Growth -6.83 -6.41 -1.65 -2.20 -6.17 -0.44 0.98
Total 3.66 4.13 10.97 10.39 8.15 9.81 9.24
Benchmark 4.30 3.14 10.10 10.32 8.04 9.88 9.74
Comments
During the quarter, two new investments were made in the Alternative Defensive portfolio: Metrics Credit Partners Real Estate Debt Fund, and Metrics Credit Partners Secured Private Debt Fund II.
Contributors and Detractors
Contributors to performance
• Direct property portfolio significantly outperformed.
• An underweight to diversified fixed interest contributed as the asset class underperformed other asset classes.
• The AUD depreciated over the quarter, so being less hedged versus benchmark added value.
• Alternative Defensive outperformed.
Detractors from performance
• The international equities portfolio underperformed.
• Australian equities portfolio underperformed due to an overweight to small cap stocks.
• An overweight to the Income Trust detracted from performance.
Actual allocation Target allocation
Alternative - growth
International shares
Australian shares
Property Diversi�ed�xed
interest
Cash andshort-termsecurities
0
5
10
15
20
25
30
35
40
Alternative - defensive
Defensive Actual allocation Target allocation
Alternative - growth
International shares
Australian shares
Property Diversi�ed�xed
interest
Cash andshort-termsecurities
0
5
10
15
20
25
30
Alternative - defensive

20
Actual versus target allocation Actual versus target allocation
Actual allocation Target allocation
Alternative - growth
International shares
Australian shares
Property Diversi�ed�xed
interest
Cash andshort-termsecurities
0
5
10
15
20
25
30
35
40
Alternative - defensive
Actual allocation Target allocation
Cash and short-term securities
Diversi�ed �xed
interest
Property Australian shares
AlternativesInternational shares
0
5
10
15
20
25
30
IOOF MultiMix Growth
Performance2
3 mths
%
6 mths
%
1 year
%
2 year
% pa
3 year
% pa
5 year
% pa
7 year
% pa
Distribution 12.65 12.69 14.86 14.93 15.40 11.45 8.95
Growth -8.38 -8.08 -1.86 -2.64 -5.97 0.01 1.32
Total 4.26 4.60 13.00 12.29 9.42 11.46 10.27
Benchmark 5.30 3.70 12.15 12.74 9.11 11.24 10.81
Comments
During the quarter, two new investments were made in the Alternative Defensive portfolio: Metrics Credit Partners Real Estate Debt Fund, and Metrics Credit Partners Secured Private Debt Fund
Contributors and Detractors
Contributors to performance• Direct property portfolio significantly outperformed.
• The AUD depreciated over the quarter, so being less hedged versus benchmark added value.
• An underweight to diversified fixed interest contributed to performance as the asset class underperformed other asset classes.
Detractors from performance
• The international equities portfolio underperformed due to its overweight to emerging markets.
• The Australian equities portfolio underperformed due to an overweight to small cap stocks.
• Overweight to cash detracted from performance.
MySuper fundIOOF Balanced Investor
Performance2
3 mths
%
6 mths
%
1 year
%
2 year
% pa
3 year
% pa
5 year
% pa
7 year
% pa
Distribution 0.00 0.00 0.00 2.98 2.90 na na
Growth 4.13 3.49 9.90 6.40 4.91 na na
Total 4.13 3.49 9.90 9.38 7.81 na na
Benchmark 4.18 3.01 9.34 9.41 7.68 na na
Comments
During the quarter, two new investments were made in the Alternatives portfolio: Metrics Credit Partners Real Estate Debt Fund, and Metrics Credit Partners Secured Private Debt Fund II.
Contributors and Detractors
Contributors to performance
• The bulk of the outperformance was a result of the direct property portfolio significantly outperforming.
• The AUD depreciated over the quarter, so being less hedged versus benchmark added value.
Detractors from performance
• The international equities portfolio underperformed.
• An underweight allocation to Australian equities detracted value as Australian equities was a strong performer for the quarter.

Notes to the Snapshot
1. The actual management costs (and total management costs) are subject to change from time to time and may vary from the estimated management costs detailed in the applicable PDS’ depending on changes to the Trusts’ underlying assets, changes to underlying investment managers and their fees, if any performance-related fees are incurred (where applicable) and where any unusual or non-recurrent expenses are incurred or changes to other related expenses.
2. Performance is net of management costs and expenses. Performance is based on exit price to exit price for the period and assumes that all distributions are reinvested. Management costs and other expenses are accounted for in the exit price. Past performance is not a reliable indicator of future performance. Full details of the benchmarks used are provided in the relevant Trusts’ PDS.
3 Allocations may not sum to 100% due to rounding.
Important Note
Issued by IOOF Investment Management Limited (IIML) ABN 53 006 695 021, AFS Licence No. 230524, as Responsible Entity for IOOF MultiMix, IOOF Balanced Investor Trust, IOOF MultiSeries and the IOOF Cash Management Trust. IIML is a company within the IOOF group of companies which consists of IOOF Holdings Ltd ABN 49 100 103 722 and its related bodies corporate. IIML’s contact details can be found on www.ioof.com.au. This is general advice only and does not take into account your financial circumstances, needs and objectives. Before making any decision based on this document, you should assess your own circumstances or seek advice from a financial adviser. You should obtain and consider a copy of the Product Disclosure Statement available from us or your financial adviser, before you acquire a financial product. Past performance is not a reliable indicator of future performance. Information has been prepared in good faith and with reasonable care, with information believed to be accurate and reliable at the time of publication. However, IIML and their respective officers, employees, agents and associated entities disclaim and exclude all liability for any loss or damage suffered by any person acting on any information provided in, or omitted from this document. This document has been based on information believed to be accurate and reliable at the time of publication. W
MA-
2142
7